
Submitted:
16 July 2023
Posted:
17 July 2023
You are already at the latest version
Abstract
Strong convective storms can be a serious threat to modern society, influencing both the economy and human life. Thunderstorms can bring much-needed rain after a dry spell, but the nature of thunderstorm mostly causes damage due to high wind associated with it and heavy intensity rain that mostly causes quick overlandflow and flashfloods. The paper focused on the 2011 Pukkelpop event in Belgium where due to heavy thunderstorm a lot of financial damage occurred, and five casualties. In this paper we look into the basic elements that enforces the creation of a thunderstorm like CAPE and windshear. A representative grid has been taken from the Alaro-0 model of 12.5 km resolution for the analysis of the thunderstorm over Belgium which is detailed out in the methodology. The model runs of Alaro-0 from Royal Meteorological Institute of Belgium (RMI) is used for historical and future years for CAPE and Shear. We look into STEnv which is a composite number that can provide some insight on occurrence of thunderstorm, and STEnv is when CAPE*Shear exceeds certain threshold. In this study the threshold has been chosen as 97%. Only summer months have been taken into account into this study as summer(s) has the most thunderstorm in Belgium. The analysis of CAPE and STEnv over historical period (1977-2005), near future (2041-2069) and far future (2071-2099) shows significant increase in occurrence of thunderstorm in the 2071-2099s, specially in extreme cases such as 97% and 99% quantile. CAPE (J/Kg) increases in all future scenarios compared to the historical period. In 2071-2099s, CAPE increases from 2100 J/Kg to 2300 J/Kg (90% quantile) and from 3500 J/Kg to 3900 J/Kg (99% quantile) compared to the historical period. The number of STEnv increases from 300 to 378 in top 10% storm case (90% quantile), 158 to 218 in top 5% storm (95% quantile), 97 to 153 in top 3% storm (97% quantile) and 33 to 66 in top 1% storm (99% quantile) with a 90% confidence interval overall. Shear mostly remains unchanged. The study also shows spatial variation of CAPE, shear and STEnv over Belgium for present and future scenarios in different extremities (90%, 95%, 97% and 99% quantiles). There is a good indication that increase in CAPE translates to increase in STEnv, which is an accepted measure to predict occurrence of thunderstorm. Future climate change also amplifies the occurrence of thunderstorm, which is coherent with relevant studies. The uncertainty related to the study can be reduced with more detailed dataset and involvement of numerical weather prediction models beyond data statistics.
Keywords:
thunderstorms
; convective available potential energy (CAPE)
; climate change
; alaro model
; numerical weather prediction models
; stenvs
; shear
; Belgium
1. Introduction
Severe convective storms can have a significant impact on modern day society. The economy can be significantly impacted by severe weather conditions, such as thunderstorms, and human life is at risk [1,2,3,4,5]. While thunderstorms can bring much-needed rain, they can also produce an abundance of precipitation, which can generate floods that harm infrastructure and property [6,7,8,9,10,11,12,13]. Thunderstorms can also produce tornadoes, downbursts, and hail, all of which have the potential to cause significant damage and even fatalities. In August 2011, a strong thunderstorm devastated Belgium's Pukkelpop music festival, providing one illustration of the devastation that can result from thunderstorms [14]. It is therefore important to try to understand how these severe thunderstorms will behave in a changing climate. Stage scaffolding collapsed as a result of the storm's powerful winds and hail, tragically killing numerous people.
In order to effectively anticipate thunderstorms and give the public early warnings so they can take the appropriate preparations and lessen the impact of major weather events on both the economy and human life, it is critical to invest in modern technologies and model weather forecasting technologies like Numerical Weather Prediction [15,16,17,18,19]. Given the potential risks associated with thunderstorms, it is essential to monitor weather trends and take the necessary precautions to lessen their impacts, this entails putting policies in place like evacuation plans and construction regulations made to resist extreme weather [20,21]. Forecasting of climatic and hydrological variables normally require time series analysis, use of physically intensive models that requires calibration and validation with observed dataset of different physically important parameters; or data intensive model that require machine learning and artificial neural network analysis [22,23,24,25,26,27,28,29,30].
In this research paper, we shall focus on statistical methods to understand the relationship between thunderstorm and meteorological parameters such as: CAPE and Shear- that are driven by temperature, wind speed and environmental instability [31]. To understand how thunderstorm starts, we need to first know the enabling parameters or ingredients. For the creation of severe thunderstorms, there are three key ingredients [31]. The first ingredient is enough moisture availability in the planetary boundary layer of the atmosphere. Planetary boundary layer (PBL) is characterized by its convective mixing, wind shear and dynamic height due to changing temperatures of air parcels over the day and in different seasons- causing PBL to shrink in cooler seasons or night and expand in daytime or warmer seasons [32]. Secondly, there should be enough atmospheric instability within PBL. Air is unstable when the environmental lapse rate (rate at which temperature changes with altitude) is greater than the dry adiabatic rate of a rising (or falling) air parcel. The rate at which the temperature of an air parcel changes due to change in atmospheric pressure with altitude without any heat exchange in its unsaturated condition is called the adiabatic rate of change in temperature. This basically means if a rising unsaturated air parcel is warmer and less dense than the surrounding air then environmental instability occurs. There are different classes of instabilities. Moisture is an important component in this case as the rate at which the air parcel will cool or warm depends on the moisture status of the surrounding air. An environmental instability is a pre-condition for formation of a vertical convective cloud that initiates a thunderstorm [33,34]. Finally, there should be some lift (vertical push) available for an air parcel to reach the level of free convection. Level of free convection is the distance an air parcel travels in free acceleration till it reaches the Equilibrium Level (EL), where it finally is cooler than the surrounding environment, and hence it stops its upward movement or buoyancy and becomes stable. This is basically where the anvil of the cloud is formed [33,34,35]. A schematic diagram is shown in Figure 1.
Lifting Condensation Level (LCL) is the level at which an air parcel becomes saturated. It is a reasonable estimate of cloud base formation height. The height difference between this parameter and the LFC is CIN (convective inhibition). In a skew T log P diagram (the left side of Figure 1) this area is the shaded area [36,37]. From LFC to EL (Equilibrium level), also called LOC (Limit of Convection) is the free lift area, where we can identify CAPE from a Skew T- log P graph. It is the shaded area in Figure 2 bounded by the environmental lapse rate and moist adiabatic lapse rate of an air parcel. By definition, CAPE is Convective Available Potential Energy inside a cloud convection that can generate the potential of a thunderstorm [36,37].
CAPE is a useful measure for estimating the strength of an updraft in a thunderstorm and for characterizing the instability of the atmosphere. A higher CAPE value suggests a more unstable atmosphere and a stronger updraft [38]. Studies have tried to find connection with vertical wind shear (DLS) with updraft velocities as well [39]. A number of studies have already shown that high CAPE and Deep Layer Wind Shear (DLS) has a significant correlation with the severity of thunderstorms in the USA and in Europe, which means that an environment with high CAPE and DLS is preferable to the initiation of severe convective storms [40,41,42,43]. Some recent studies though have tried to bridge this gap by doing hybrid data processing ensemble-empirical model decomposition with artificial neural network and support vector machine [44]. The statistics and trends of thunderstorm has been analyzed in few studies [45].
Some studies have been conducted where the change in CAPE and DLS in the future is addressed [46,47]. They found that most models show an increase in the occurrence of severe thunderstorms mainly due to increases in CAPE in future. As CAPE is a function of temperature, and temperature increases in the near future in all RCP scenarios and climate change predictions [48,49,50,51,52,53,54], increase of CAPE in future is expected. Despite a pretty good knowledge of thunderstorms, there is still a lot of uncertainty on how they will respond to the warming global climate induced by enhanced greenhouse forcing [55,56].
2. Data and Methods
The data used in this study is from the Alaro-0 model of the Royal Meteorological Institute of Belgium (RMI). It is a limited area model specifically designed for Belgium. The resolution is 12.5 km, following Coordinated Regional Climate Downscaling Experiment (CORDEX) guidelines [57]. Three time periods are studied: a historical period (1977-2005) and two future periods (2041-2069 and 2071-2099) based on the RCP8.5 scenario of the Intergovernmental Panel on Climate Change (IPCC) [55]. As described before, only two variables are considered: CAPE and Shear. The evolution of these two variables was studied in this research and connected with thunderstorm occurrence. The model results were downloaded as NetCDF files from Alaro-0 and then further analyzed with RStudio for data statistics and visualization.
Besides analyzing the evolution of CAPE and shear separately, the evolution of the quantity (CAPE*shear) is also found to be useful to study. When this quantity exceeds a threshold at a given time and place, it can be considered to be a Severe Thunderstorm Environment (STEnv). The value of this threshold is 97% quantile of CAPE*shear (historical period, only summer). However, to have a clearer view on whether there will be a difference in the change of the amount of STEnvs regarding less extreme cases and more extreme cases, the %90, %95, %97 and %99 quantiles are used as threshold value in the present study. Hence, the study is limited to only the extreme cases as those are capable of producing the environment suitable for severe thunderstorms.
The analysis has been kept limited to summer months (June-July-August). According to reviews of relevant papers, the highest number of thunderstorm occurrences is observed in the seasons of Spring (March, April and May) and Summer [58,59]. But for simplicity purposes- one season (summer) is chosen in this analysis. Gridpoint 12X11 of the Alaro-0 model has been chosen as a representative grid for the entire study area for some analyses (like extreme value plots with error bars), as it has been found to produce a very similar output as the entire grid (Table 1, Figure 3). Another assumption in this case study is that the relation between CAPE and shear and the potential strength of thunderstorms remains the same in the future as it is now. The influence of the relative weight given to shear in comparison to CAPE is also studied [CAPE*(Shear)γ > β] and it becomes clear quickly that this weight given to shear does not have a significant influence on the change in the frequency of severe thunderstorms. Hence finally γ=1 has been used for this analysis which means shear is given the same importance as CAPE in assessing suitable environments in generation of severe thunderstorms.
The analysis is done for daily maximum values- so the hourly data collected from RMI is first converted to daily maximum data and then analyzed. The reason for doing this is to avoid the expected correlations in the hourly data. Long-lived environments of high CAPE and shear might trigger only one event.
3. Results and Discussion
3.1. Shear
From the collected wind shear data of historical and future period, a density plot (Figure 4) has been developed where the evolution of shear over the present and future time slots is visible. Not a lot of differences can be seen in the probability distribution of this variable. To examine how extreme wind shear has evolved in the past, a historical plot is shown in Figure 5. A slight decrease over the years can be seen from the linear trend. Monthly analysis of shear is shown in Figure 6, Figure 7 and Figure 8.
Monthly analysis shows how there is a sharp deep in shear during the summer period compared to the annual distribution. Though summer months have more convective cloud formation, and consequently T-storms leading to significant rainfall, wind shear itself is lower than average yearly values.
When looking into the extreme values in Figure 9, it is seen that the extreme quantiles (90%, 95%, 97% and 99%) in the future period almost remain the same as (or slightly decrease from) the historical period. The confidence intervals of the extreme values are shown by error bars (90 percentile), and found by bootstrapping method (1000 times bootstrapping). The red lines indicate the confidence intervals (%90).
The data is shown in Table 2 as well.
By examining historical and future time periods, the density plot reveals a consistent probability distribution of wind shear, indicating minimal variations. Additionally, a historical plot demonstrates a slight decreasing trend in wind shear over the years. To further explore extreme wind shear events, the study examines the quantiles in both the historical and future periods. The extreme quantiles in the future period show a steady decrease compared to historical data which is in sync with findings of Seeley 2015 [43]. The study employs bootstrapping techniques to estimate confidence intervals for extreme values, Further research is warranted to understand the complex dynamics between wind shear, severe thunderstorms, and potential implications for climate change, specially why the reduction in shear happens , since it is is an important parameter for predicting thunderstorm.
3.2. Convective Available Potential Energy (CAPE)
Similarly, like wind shear, the CAPE density for different time periods is shown here in Figure 10. And it can be seen that higher values (maximum) are reached in the years 2070 to 2099, and years 2040 to 2069 show a decrease in CAPE with respect to the historical period. The evolution by year of historical cape is also shown (Figure 11). An increasing trend can be observed.
Figure 12, Figure 13 and Figure 14 shows monthly analysis of CAPE in long term periods (over the historical years).
As it can be seen in Figure 15, there is a significant increase in CAPE in the future period from 2071 to 2099. The future period in the middle (2040 to 2069) shows a slight decrease with respect to the historical period, from the point of view of extreme values. The confidence interval (of %90) ranges become smaller and smaller as the values get more extreme (higher quantiles). The increase in CAPE in future (2070 to 2099) could be mostly a consequence of the increase in the boundary layer humidity, but it cannot be said with certainty. Some correlation between the CAPE data and boundary layer humidity data has been found (not shown in the report), but the significance of such correlation has not been tested.
3.3. Severe Thunderstorm Environment (STEnv)
Figure 16 shows the change in occurrence of environments with possibility for the formation of severe thunderstorms. 2070s show a significant increase in number of severe thunderstorm occurrence from the historical period, specially in more severe cases like 97% and 99% quantile values.
The values are given in Table 4. The number of STEnv increases from 300 to 378 in top 10% storm case (90% quantile), 158 to 218 in top 5% storm (95% quantile), 97 to 153 in top 3% storm (97% quantile) and 33 to 66 in top 1% storm (99% quantile) with a 90% confidence interval overall.
Spatial distribution of CAPE and shear for historical period is shown in Figure 17a and 17b (median and 97% quantile respectively). It can be seen that inland (South East) has higher CAPE and shear than coastal area (North West). CAPE clearly is more dominant in extremity (97%) than shear even spatially.
The historical STEnv value- median and extreme both has similar spatial pattern all-over Belgium. Here the median STEnv distribution is shown in Figure 18. As both CAPE and shear are more prominent in the inland area (South East), so is STEnv.
Figure 19 shows the change in STEnv (in both median and extreme value) over the near future (2040s) and far future (2090s) spatially.
With respect to more extreme values of Stenv, there seems to be a clear increase during the 2070s-2099s.
Figure 20 shows the occurrences where the combined parameter (STEnv being a combination of shear and CAPE) exceeds a threshold. This threshold is fixed as the 97% quantile value of the historical period.
Figure 21 shows the change of occurrence of STEnv from historical period to 2070-2099s, which shows an increase all over Belgium, specially inland (South East) close to France and the Ardennes forest.
The results achieved in this study are coherent with the results achieved in Seeley’s 2015 research [43] where higher change is observed in CAPE than shear in future. Shear also decreases in the summer season (seasonal decrease) and is higher in winter, which is opposite for CAPE. As for the changes in occurrence of STEnvs, this study shows a big increase in STEnvs during the 2099s or the late part of 21st century. CAPE and shear is less dominant in the coast (North West- The North sea) , possibly due to more coastal wind like trade wind dominance and front formation than convective cloud formation; but inland (South East, border with France and the great Ardennes forest) has more evapotranspiration- more hot air pocket creation at lower level and more vertical instability- causing uplift-wind shear and CAPE formation- causing more thunderstorm prone environment and higher STEnv.
3.4. Limitations
A limitation of the study is that there is only one climate model in use, so not much comparison can be made from that point of view or as done in previous state of the art research by Seeley on thunderstorm [43]. Several studies concerning severe thunderstorms have already shown that models tend to show big differences in CAPE and shear, both in time and space [58].
4. Conclusions
The question addressed in this study is: how severe thunderstorms in Belgium will respond to global warming, as projected by the RCP8.5 scenario of the IPCC. To address this question, an in-depth analysis of the evolution in CAPE, Shear and STEnv is performed. A lot of studies have already shown that CAPE and shear have a significant positive correlation with the severity of possible thunderstorms (STEnv). The results of this analysis showed the same. In our study the analysis of CAPE and STEnv over historical period (1977-2005), near future (2041-2069) and far future (2071-2099) shows significant increase in occurrence of thunderstorm in the 2071-2099s, specially in extreme cases such as 97% and 99% quantile. The study also shows spatial variation of CAPE, shear and STEnv over Belgium for present and future scenarios in different extremities (90%, 95%, 97% and 99% quantiles) which shows the inland being more prone to thunderstorm activity (South East) than coastal region (North West). For the analysis- Alaro-0 model results of RMI, Belgium has been used. Further study in other parts of the world and with more recent modelling capacity of Numerical Weather Prediction (NWP) can help understand the relation of CAPE and Shear with thunderstorm occurrence. As this is a more data based analysis (data being extracted from model), more direct physical simulation of thunderstorm in NWP in different climate scenarios can help deduct further interrelation of thunderstorm with different atmospheric elements.
Author Contributions
Conceptualization, B.M. Duti and J.V. Gysegem; methodology, B.M. Duti and J.V. Gysegem ; formal analysis, J.V. Gysegem; investigation, M. Khosravi; writing—original draft preparation B.M. Duti and J.V. Gysegem; writing—review and editing M.M.S. Yazdan ; visualization J.V. Gysegem and M. Khosravi,; All authors have read and agreed to the published version of the manuscript.
Funding
This research received no external funding.
Data Availability Statement
Data was collected from RMI, Royal Meteorological Institute of Belgium and shared with the authors in collaboration with Post graduate program of Weather and Climate Modelling, University of Ghent. The model used to generate the data is Alaro-0 of 2016. Presently the data is available at this repository: https://opendata.meteo.be/geonetwork/srv/eng/catalog.search;jsessionid=0D3ABB796FCC6931B725C303C288ABE9#/metadata/RMI_DATASET_CLIMATE_MODEL_ALARO.
Acknowledgments
The authors express their sincere thanks to Lesley De Cruz and Bert Van Schaeybroeck of Department of Meteorological and Climatological Research, Royal Meteorological Institute, Uccle, Belgium who provided the data and their active guidance throughout the study. The authors also sincerely express gratitude to Dr. Pieter De Meutter, Researcher- Dept. of Physics and Astronomy, UGent and Dr. Steven Caluwaerts, Program Coordinator of the Postgraduate degree in Weather and Climate Modelling, Department of Physics and Astronomy, UGent for their continuous support and guidance in the program and collaboration with RMI, Belgium.
Conflicts of Interest
The authors declare no conflict of interest.
References
- Kron, W.; Löw, P.; Kundzewicz, Z.W. Changes in Risk of Extreme Weather Events in Europe. Environ. Sci. Policy 2019, 100, 74–83. [Google Scholar] [CrossRef]
- Raihan, M.L.; Onitsuka, K.; Basu, M.; Shimizu, N.; Hoshino, S. Rapid Emergence and Increasing Risks of Hailstorms: A Potential Threat to Sustainable Agriculture in Northern Bangladesh. Sustainability 2020, 12, 5011. [Google Scholar] [CrossRef]
- Rana, V.S.; Sharma, S.; Rana, N.; Sharma, U.; Patiyal, V.; Banita; Prasad, H. Management of hailstorms under a changing climate in agriculture: a review. Environmental Chemistry Letters 2022, 20(6), 3971–3991. [Google Scholar] [CrossRef]
- Božiček, A.; Franc, B.; Filipović-Grčić, B. Early Warning Weather Hazard System for Power System Control. Energies 2022, 15, 2085. [Google Scholar] [CrossRef]
- Al-Fugara, A.; Mabdeh, A.N.; Alayyash, S.; Khasawneh, A. Hydrological and Hydrodynamic Modeling for Flash Flood and Embankment Dam Break Scenario: Hazard Mapping of Extreme Storm Events. Sustainability 2023, 15, 1758. [Google Scholar] [CrossRef]
- Krvavica, N.; Rubinić, J. Evaluation of Design Storms and Critical Rainfall Durations for Flood Prediction in Partially Urbanized Catchments. Water 2020, 12, 2044. [Google Scholar] [CrossRef]
- Breugem, A.J.; Wesseling, J.G.; Oostindie, K.; Ritsema, C.J. Meteorological Aspects of Heavy Precipitation in Relation to Floods – An Overview. Earth-Sci. Rev. 2020, 204, 103171. [Google Scholar] [CrossRef]
- Mehedi, M.A.A.; Yazdan, M.M.S.; Ahad, M.T.; Akatu, W.; Kumar, R.; Rahman, A. Quantifying Small-Scale Hyporheic Streamlines and Resident Time under Gravel-Sand Streambed Using a Coupled HEC-RAS and MIN3P Model. Eng 2022, 3, 276–300. [Google Scholar] [CrossRef]
- Mehedi, M.A.A.; Yazdan, M.M.S. Automated Particle Tracing & Sensitivity Analysis for Residence Time in a Saturated Subsurface Media. Liquids 2022, 2(3), 72–84. [Google Scholar]
- Raihan, M.L.; Onitsuka, K.; Basu, M.; Shimizu, N.; Hoshino, S. Rapid emergence and increasing risks of hailstorms: A potential threat to sustainable agriculture in Northern Bangladesh. Sustainability 2020, 12(12), 5011. [Google Scholar] [CrossRef]
- Pan, C.; Wang, X.; Liu, L.; Huang, H.; Wang, D. Improvement to the Huff Curve for Design Storms and Urban Flooding Simulations in Guangzhou, China. Water 2017, 9, 411. [Google Scholar] [CrossRef]
- Yazdan, M.M.S.; Ahad, M.T.; Kumar, R.; Mehedi, M.A.A. Estimating Flooding at River Spree Floodplain Using HEC-RAS Simulation. J 2022, 5, 410–426. [Google Scholar] [CrossRef]
- Vorobevskii, I.; Al Janabi, F.; Schneebeck, F.; Bellera, J.; Krebs, P. Urban Floods: Linking the Overloading of a Storm Water Sewer System to Precipitation Parameters. Hydrology 2020, 7, 35. [Google Scholar] [CrossRef]
- The Guardian, 2011. Killer StormStorm at Belgium's Pukkelpop music festival kills five after stage collapses. Link: https://www.theguardian.com/world/2011/aug/18/pukkelpop-belgium-festival-killerstorm.
- Alimonti, G.; Mariani, L.; Prodi, F.; Ricci, R.A. A Critical Assessment of Extreme Events Trends in Times of Global Warming. Eur. Phys. J. Plus 2022, 137, 112. [Google Scholar] [CrossRef]
- Aryee, J.N.A.; Ahiataku, M.A.; Quagraine, K.T.; Davies, P.; Agbenor-Efunam, N.; Agyapong, G.; Agyekum, J.; Donkor, M.K.E.; Osei, M.A.; Poku, L.P.; et al. C: High-Impact Weather (HIW) Forecasting In Ghana: Challenges And Prospects Of The Nowcasting Satellite Facility (NWCSAF) For Improved Early Warning And Decision-Making; Preprints, 2022.
- Jiang, Z.; Johnson, F. A New Method for Postprocessing Numerical Weather Predictions Using Quantile Mapping in the Frequency Domain. Mon. Weather Rev. 2023, 1. [Google Scholar] [CrossRef]
- Das, S. Challenges in Predicting Extreme Weather Events Over the South Asian Region. In Extreme Natural Events: Sustainable Solutions for Developing Countries; Unnikrishnan, A.S., Tangang, F., Durrheim, R.J., Eds.; Springer Nature: Singapore, 2022; pp. 51–106. ISBN 978-981-19251-1-5. [Google Scholar]
- Kumari, S.; Mahalakshmi, P. A Wide Scale Survey on Weather Prediction Using Machine Learning Techniques, 2022, Journal of Information and Knowledge Management. [CrossRef]
- Azadi, H.; Barati, A.A.; Nazari Nooghabi, S.; Scheffran, J. Climate-Related Disasters and Agricultural Land Conversion: Towards Prevention Policies. Clim. Dev. 2022, 14, 814–828. [Google Scholar] [CrossRef]
- Johns, R.H.; Doswell, C.A. Severe Local Storms Forecasting. Weather Forecast. 1992, 7, 588–612. [Google Scholar] [CrossRef]
- Mehedi, M.A.A.; Khosravi, M.; Yazdan, M.M.S.; Shabanian, H. Exploring Temporal Dynamics of River Discharge Using Univariate Long Short-Term Memory (LSTM) Recurrent Neural Network at East Branch of Delaware River. Hydrology 2022, 9, 202. [Google Scholar] [CrossRef]
- Ahmad, M.; Al Mehedi, M.A.; Yazdan, M.M.S.; Kumar, R. Development of Machine Learning Flood Model Using Artificial Neural Network (ANN) at Var River. Liquids 2022, 2, 147–160. [Google Scholar] [CrossRef]
- Yazdan, M. M. S. , Khosravia, M., Saki, S., & Al Mehedi, M. A. Forecasting Energy Consumption Time Series Using Recurrent Neural Network in Tensorflow, 2022. link: Forecasting Energy Consumption Time Series Using Recurrent Neural Network in Tensorflow. Preprints. 2022, 2022090404. [CrossRef]
- Khosravi, M.; Ghoochani, S.; Nazemi, N. Deep Learning-Based Modeling of Daily Suspended Sediment Concentration and Discharge in Esopus Creek 2023.
- Khosravi, M.; Duti, B.M.; Yazdan, M.M.S.; Ghoochani, S.; Nazemi, N.; Shabanian, H. Simultaneous Prediction of Stream-Water Variables Using Multivariate Multi-Step Long Short-Term Memory Neural Network. Preprints.org 2023, 2023020086. [Google Scholar] [CrossRef]
- Khosravi, M.; Mehedi, M.A.A.; Baghalian, S.; Burns, M.; Welker, A.L.; Golub, M. Using Machine Learning to Improve Performance of a Low-Cost Real-Time Stormwater Control Measure. Preprints 2022, 2022110519. [Google Scholar] [CrossRef]
- Khosravi, M.; Ghoochani, S.; Nazemi, N. Deep Learning-Based Modeling of Daily Suspended Sediment Concentration and Discharge in Esopus Creek. Preprints. 2023, 2023051167. [Google Scholar] [CrossRef]
- Khosravi, M.; Tabasi, S.; Hossam Eldien, H.; Motahari, M.R.; Alizadeh, S.M. Evaluation and Prediction of the Rock Static and Dynamic Parameters. J. Appl. Geophys. 2022, 199, 104581. [Google Scholar] [CrossRef]
- Mehedi, M.A.A., Reichert, N., & Molkenthin, F. (2020, May). Sensitivity Analysis of Hyporheic Exchange to Small Scale Changes in Gravel-Sand Flumebed Using a Coupled Groundwater-Surface Water Model. In EGU General Assembly Conference Abstracts (p. 20319).
- Stull, R. B.; An Introduction to Boundary Layer Meteorology. 1988, Springer Book series: Atmospheric and Oceanographic Sciences Library. [CrossRef]
- Stull, R.B. Practical Meteorology: An Algebra based Survey of Atmospheric Science. 2017. -version 1.02b. Univ. of British Columbia. 940 pages. ISBN: 978-0-88865-283-6.
- Nugent, A.; DeCou, D.; Russell, S.; and Karamperidou, C. Atmospheric Science, 2019. Open text book for Course Atmo 200, Atmospheric Processes and Phenomenon at the University of Hawai’i at Mānoa link: Atmospheric Processes and Phenomena – Open Textbook (hawaii.edu).
- Brooks, H.E. Proximity Soundings for Severe Convection for Europe and the United States from Reanalysis Data. Atmospheric Res. 2009, 93, 546–553. [Google Scholar] [CrossRef]
- Stull, R.B. Course Material: Atmospheric Science 201, 2002, Department of Earth, Ocean and Atmospheric Sciences, University of British Columbia, Vancouver, Canada. Link: UBC ATSC 201 - Atmospheric Soundings & Stability - Tutorial A.
- AWS- Air Weather Service; The Use of Skew T-Log P diagram in analysis and forecasting, Technical Report- 79/006, 1990, Scott Airforce Base, Illinois, 62225-5008. Link: SkewTDocumentation.pdf (arizona.edu).
- Taszarek, M.; Brooks, H.E.; Czernecki, B. Sounding-Derived Parameters Associated with Convective Hazards in Europe. Mon. Weather Rev. 2017, 145, 1511–1528. [Google Scholar] [CrossRef]
- Lin, Y.; Kumjian, M.R. Influences of CAPE on Hail Production in Simulated Supercell Storms, Journal of Atmospheric Sciences, American Meteorological Society, 2022, volume 79, issue 1, 179-204. [CrossRef]
- Peters, J.M.; Nowotarski, C.J.; Morrison, H. The Role of Vertical Wind Shear in Modulating Maximum Supercell Updraft Velocities, Journal of Atmospheric Sciences, American Meteorological Society, 2019, volume 76, issue 10, 3169. [CrossRef]
- Púčik; Groenemeijer, P.; Rýva, D.; Kolář, M. Proximity Soundings of Severe and Nonsevere Thunderstorms in Central Europe. Mon. Weather Rev. 2015, 143, 4805–4821. [Google Scholar] [CrossRef]
- Kunkel, E.; Karl, R.; Brooks, H.; Kossin, J.; Lawrimore, H.; Arndt, D.; Bosart, L.; Changnon, D.; Cutter, L.; Doesken, N.; et al. Monitoring and Understanding Trends in Extreme Storms: State of Knowledge. Bull. Am. Meteorol. Soc. 2013, 499–514. [Google Scholar] [CrossRef]
- Sobel, A.H.; Camargo, S.J. Projected Future Seasonal Changes in Tropical Summer Climate. 2011; 24, 473–487. [Google Scholar] [CrossRef]
- Seeley, J.T.; Romps, D.M. The Effect of Global Warming on Severe Thunderstorms in the United States. J. Clim. 2015, 28, 2443–2458. [Google Scholar] [CrossRef]
- Azad, M.A.K.; Islam, A.R.M.T.; Rahman, M.S.; Ayen, K. Development of novel hybrid machine learning models for monthly thunderstorm frequency prediction over Bangladesh. Natural Hazards 2021, 108, 1109–1135. [Google Scholar] [CrossRef]
- Wahiduzzaman, M.; Islam, A.R.M.T.; Luo, J.; Shahid, S.; Uddin, M.J.; Shimul, S.M.; Sattar, M.A. Trends and Variabilities of Thunderstorm Days over Bangladesh on the ENSO and IOD Timescales. Atmosphere 2020, 11, 1176. [Google Scholar] [CrossRef]
- Diffenbaugh, N.S.; Scherer, M.; Trapp, R.J. Robust Increases in Severe Thunderstorm Environments in Response to Greenhouse Forcing. Proc. Natl. Acad. Sci. 2013, 110, 16361–16366. [Google Scholar] [CrossRef] [PubMed]
- Trapp, R.J.; Diffenbaugh, N.S.; Gluhovsky, A. Transient Response of Severe Thunderstorm Forcing to Elevated Greenhouse Gas Concentrations. Geophys. Res. Lett. 2009, 36. [Google Scholar] [CrossRef]
- Duti, B.M. , Alam R.Q., Hossain M. M. Changing Climate and Surface & GroundWater Related Issues in Dhaka”, Journal of Engineering Science (JES) 2012, ISSN: 2075-4914, Published by the Faculty of Civil Engineering,Khulna University of Engineering and Technology (KUET), Bangladesh.
- Duti B.M., Willems P. Impact of Climate Change on Water Availability and Extreme flows of Jamuneshwari River Basin in Bangladesh, International Conference on Research into Action in Bangladesh, Gobeshona6, 20-24 January 2020, organized by International Centre for Climate Change and Development (ICCCAD).
- Belayneh, A.; Duti, B.M.; Mekuanent, F.; Biniyam, S.; Gebrehiwot, T.; Buruk, W. Effect of Different HRU Definition on Catchment Runoff Prediction and Climate Change Impact Investigation Using the SWAT Model in the Kleine Nete Basin, Belgium. 3rd Open Water symposium 2015, Addis Ababa, Ethiopia. [Google Scholar]
- Duti, B.M.; Khan, M.F.A.; Tamanna, T.; Mukherjee, N.; Rashid, M.A. Vulnerability Assessment and Adaptation Technique for Climate Change Induced Drought in Bangladesh. 5th International Conference on Water & Flood Management, ICWFM- 2015, Organized by Institute of Water and Flood Management (IWFM), Bangladesh University of Engineering and Technology, Dhaka-1000, Bangladesh.
- Aktar, M.N.; Ahmed, F.; Duti, B.M.; Khan, M.F.A.; Saniruzzaman; Akand, M.K. Assessing WATSAN Vulnerability due to Climate Change in Bangladesh and Formulating Adaptation Strategies. 5th International Conference on Water & Flood Management ICWFM 2015, Dhaka-1000, Bangladesh.
- Alam ,R.Q.; Duti , B.M.; Monowar, M.M. Climate Change Impacts on Water Related Sectors of Dhaka City and Assessing the Plausible Adaptation Options Proceedings of the 2nd International Conference on Environmental Technology & Construction Engineering for Sustainable Development ICETCESD 2012, Shahjalal University of Science and Technology, Sylhet, Bangladesh.
- Duti, B.M.; Aurin, F.H.; Rahman, M.D.M. Changes Observed in The Historical Trend Of Local Rainfall As A Climatic Factor And Its Effect On The Streamflow Of The Turag And Buriganga River System, 1st International Conference on Environmental Technology & Construction Engineering for Sustainable Development ICETCESD 2011, Shahjalal University of Science and Technology, Sylhet, Bangladesh.
- Intergovernmental Panel on Climate Change (IPCC). Managing the Risks of Extreme Events and Disasters to Advance Climate Change Adaptation. A Special Report of Working Groups I and II of the Intergovernmental Panel on Climate Change [Field, C.B., V. Barros, T.F. Stocker, D. Qin, D.J. Dokken, K.L. Ebi, M.D. Mastrandrea, K.J. Mach, G.-K. Plattner, S.K. Allen, M. Tignor, and P.M. Midgley (eds.)] 2012, Cambridge University Press, Cambridge, UK, and New York, NY, USA, 582 pp.
- Intergovernmental Panel on Climate Change (IPCC). Climate Change: The Physical Science Basis: Working Group I Contribution to the Fifth Assessment Report 2013; Cambridge University Press: Cambridge, 2014; ISBN 978-1-107-05799-9. [Google Scholar]
- Georgi, F.; Jones, C.; Asrar, G. Addressing Climate Information Needs at the Regional Level: The CORDEX Framework. WMO Bull 2008, 53. [Google Scholar]
- Seneviratne, S.I.; Nicholls, N.; Easterling, D.; Goodess, C.M.; Kanae, S.; Kossin, J.; Luo, Y.; J. Marengo, J.; McInnes, K.; Rahimi, M.; Reichstein, M.; Sorteberg, A.; Vera, C.; Zhang, X. Changes in climate extremes and their impacts on the natural physical environment. In: Managing the Risks of Extreme Events and Disasters to Advance Climate Change Adaptation [Field, C.B., V. Barros, T.F. Stocker, D. Qin, D.J. Dokken, K.L. Ebi, M.D. Mastrandrea, K.J. Mach, G.-K. Plattner, S.K. Allen, M. Tignor, and P.M. Midgley (eds.)]. A Special Report of Working Groups I and II of the Intergovernmental Panel on Climate Change (IPCC). 2012. Cambridge University Press, Cambridge, UK, and New York, NY, USA, pp. 109-230.
- Lepore, C.; Abernathey, R.; Henderson, N.; Allen, J.T.; Tippett, M.K. Future Global Convective Environments in CMIP6 Models, Earth’s Future, volume 9, issue 12, AGU (American Geological Union), 2021. [CrossRef]
Figure 1.
LFC and LCL in schematic diagram [36].
Figure 1.
LFC and LCL in schematic diagram [36].
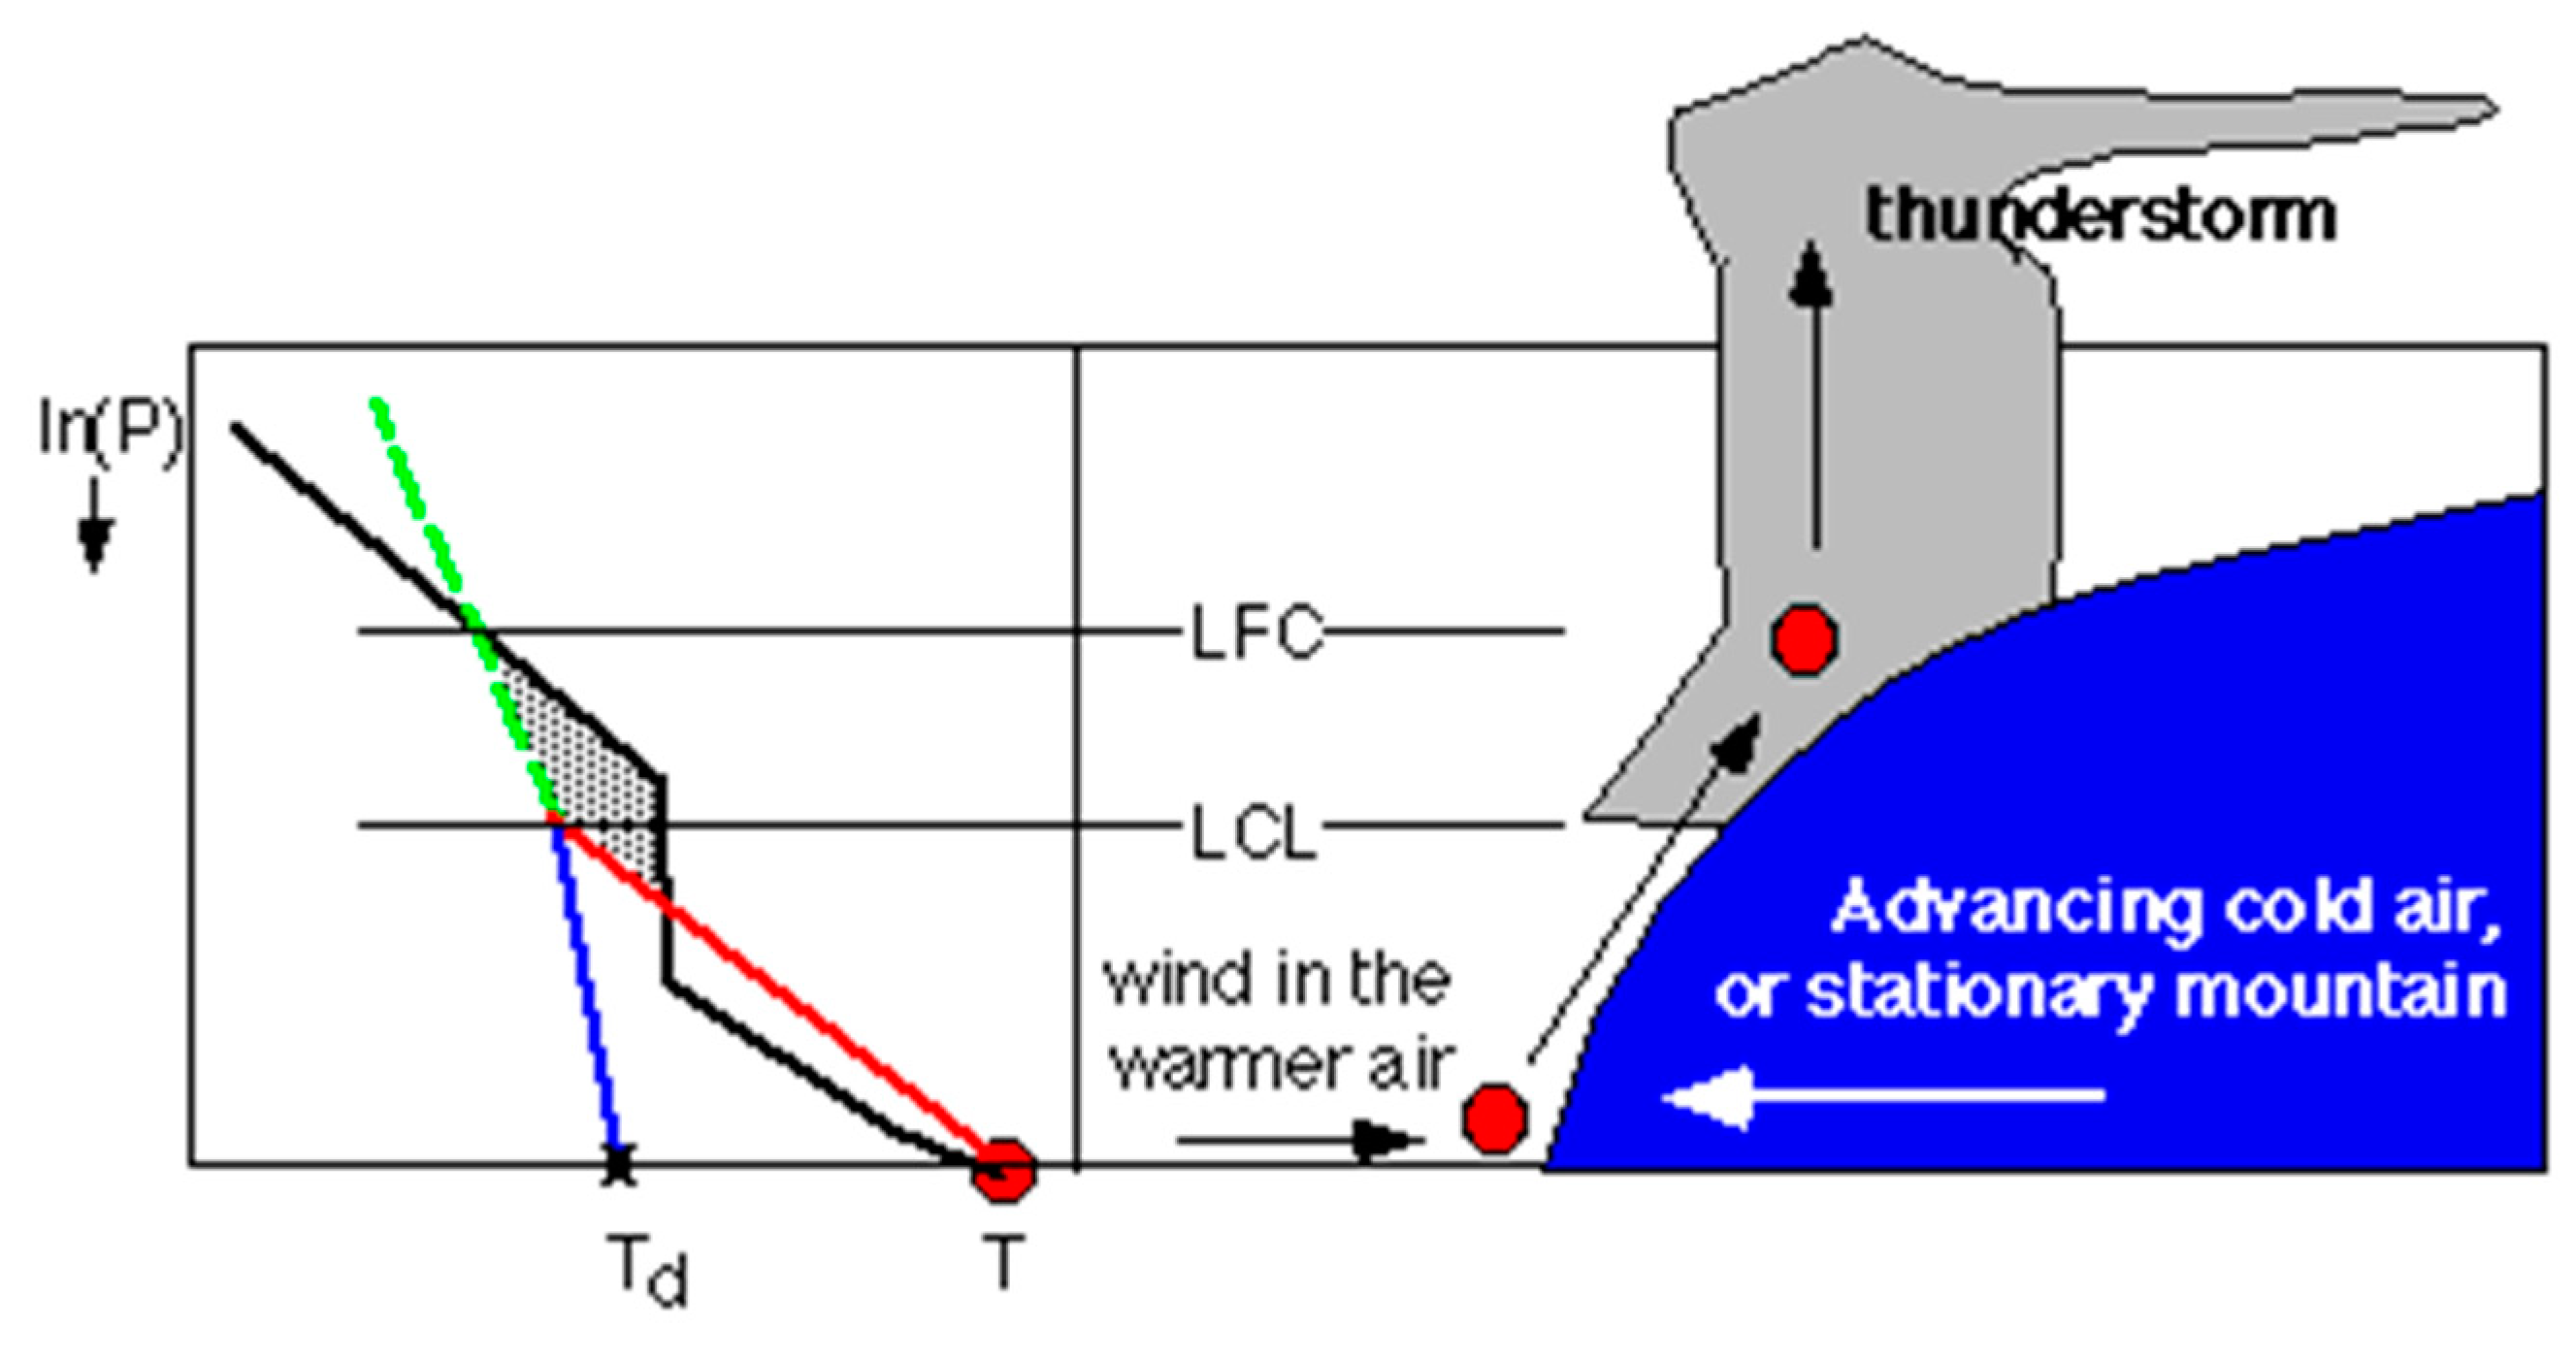
Figure 2.
CAPE in a schematic diagram in relation with LOC and other meteorological components [36].
Figure 2.
CAPE in a schematic diagram in relation with LOC and other meteorological components [36].
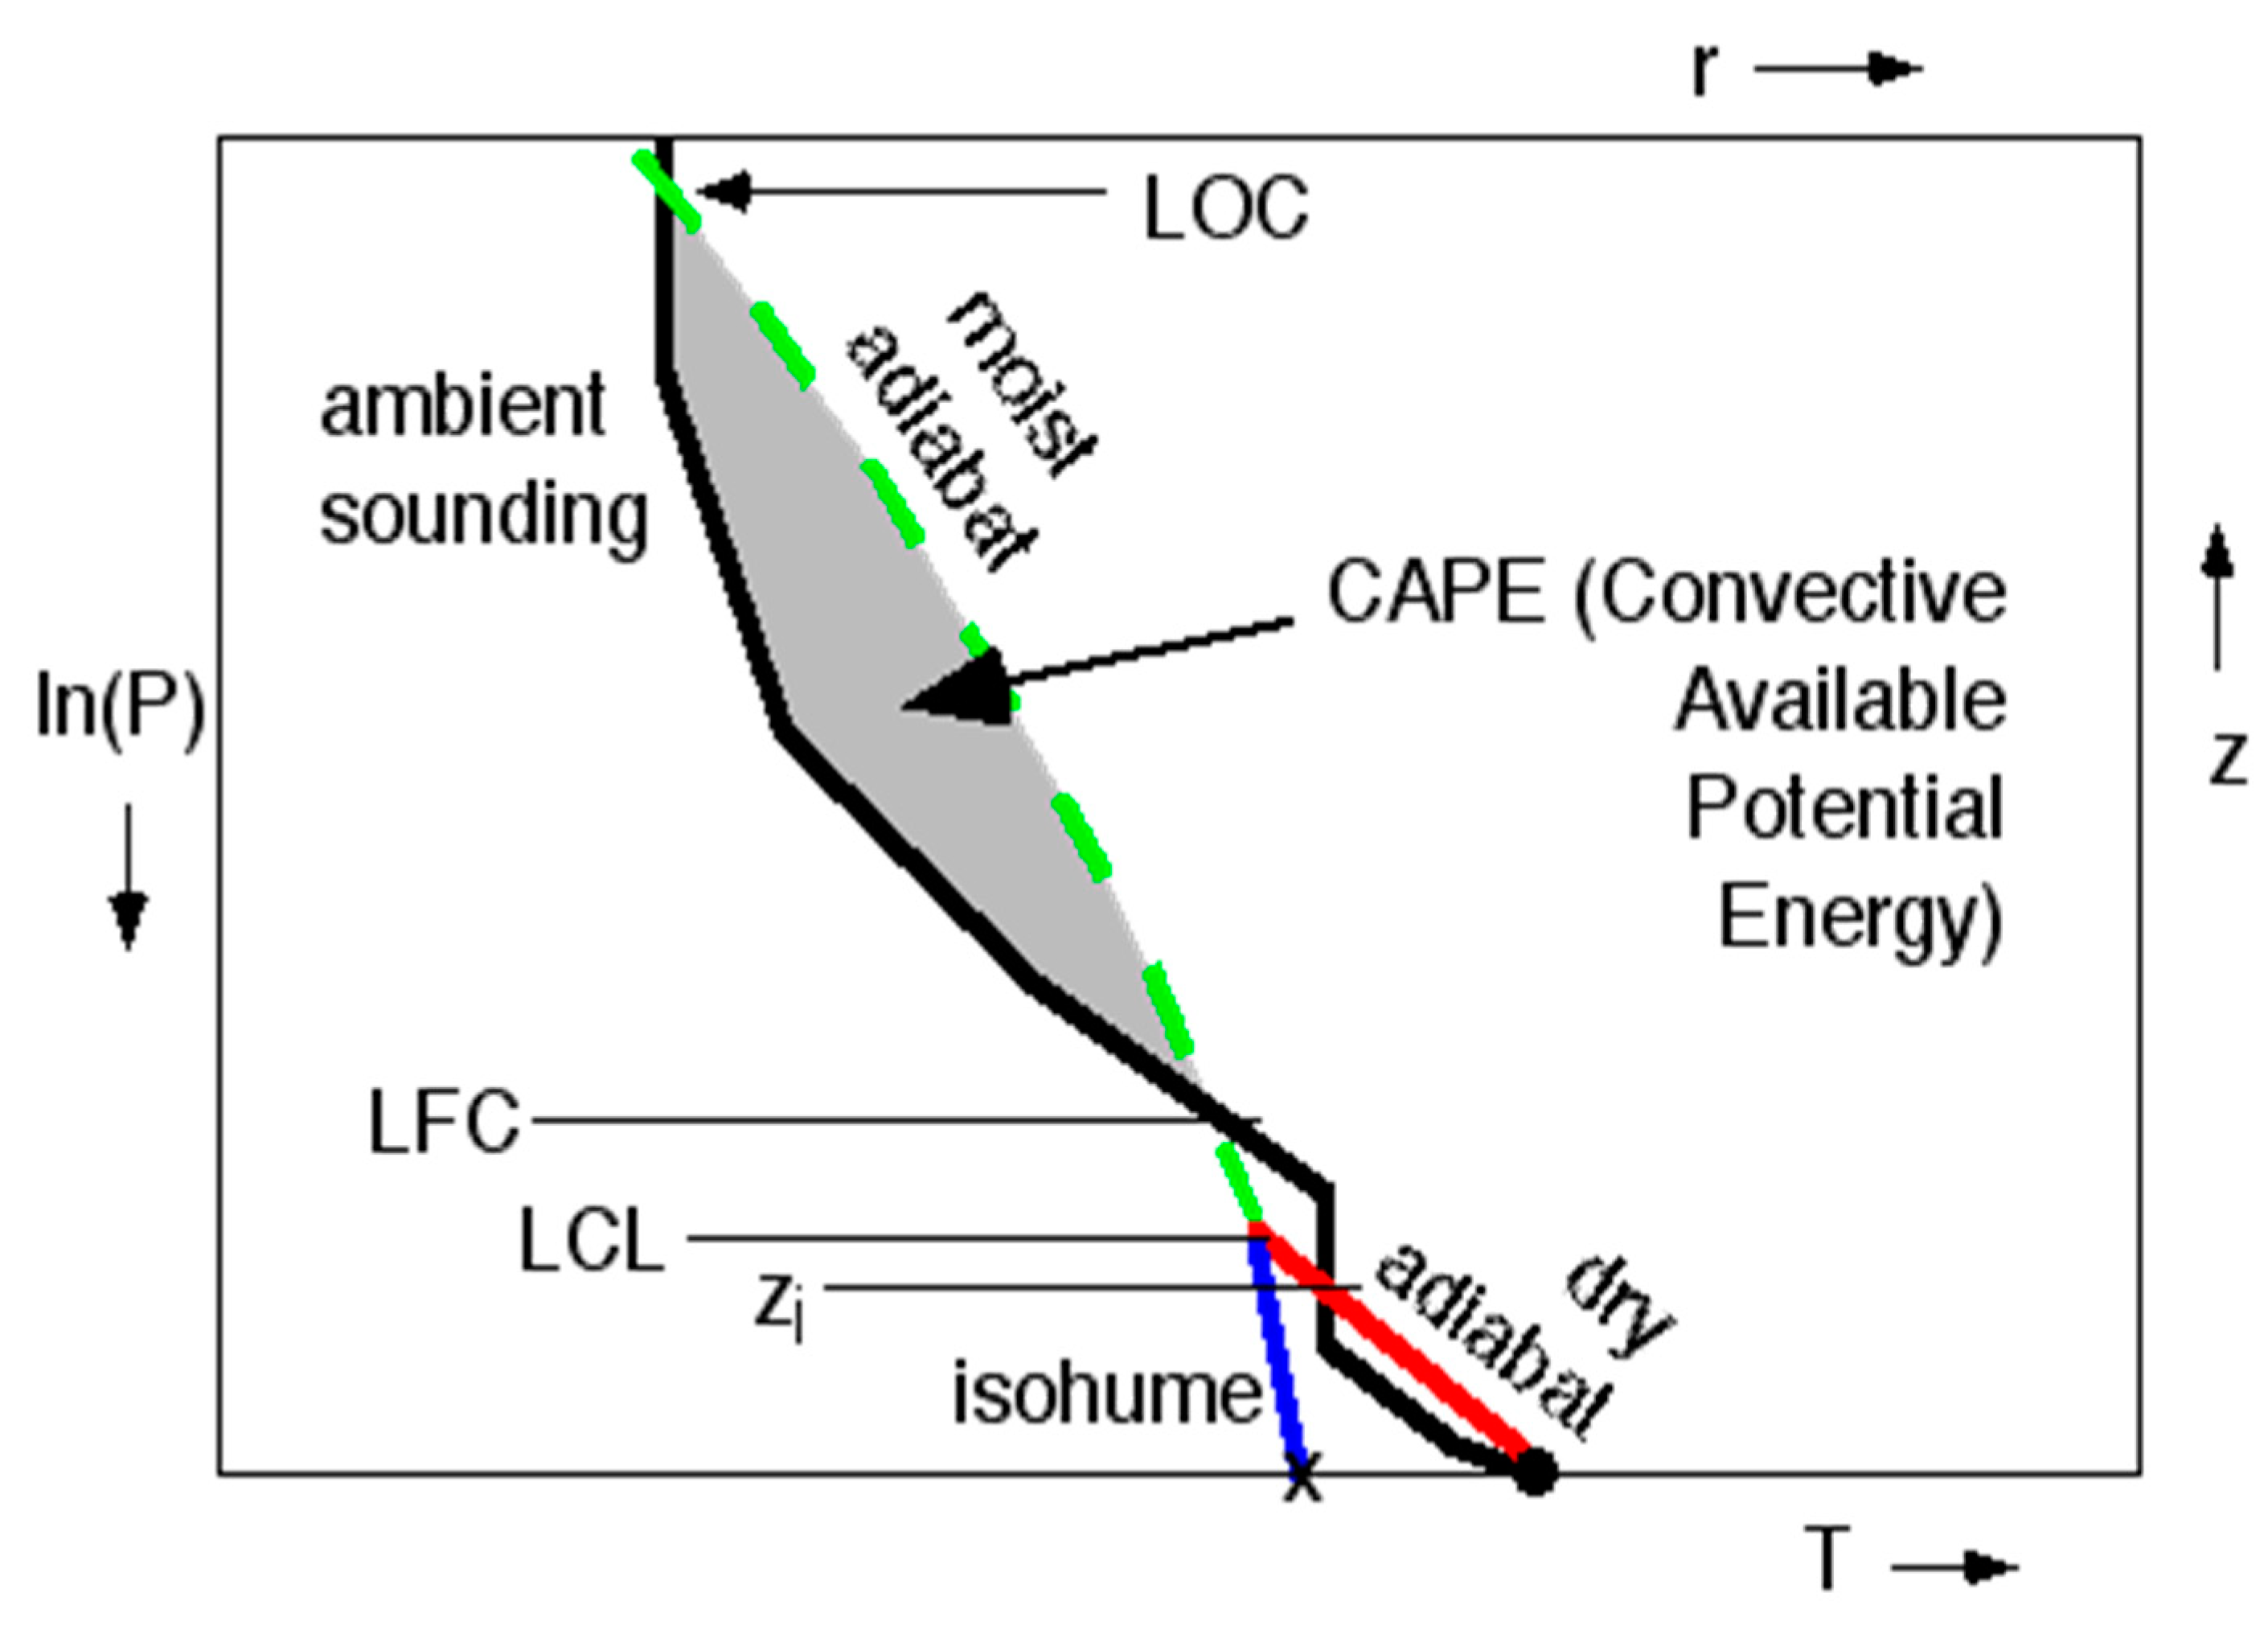
Figure 3.
Representativeness of selected grid for the study area.
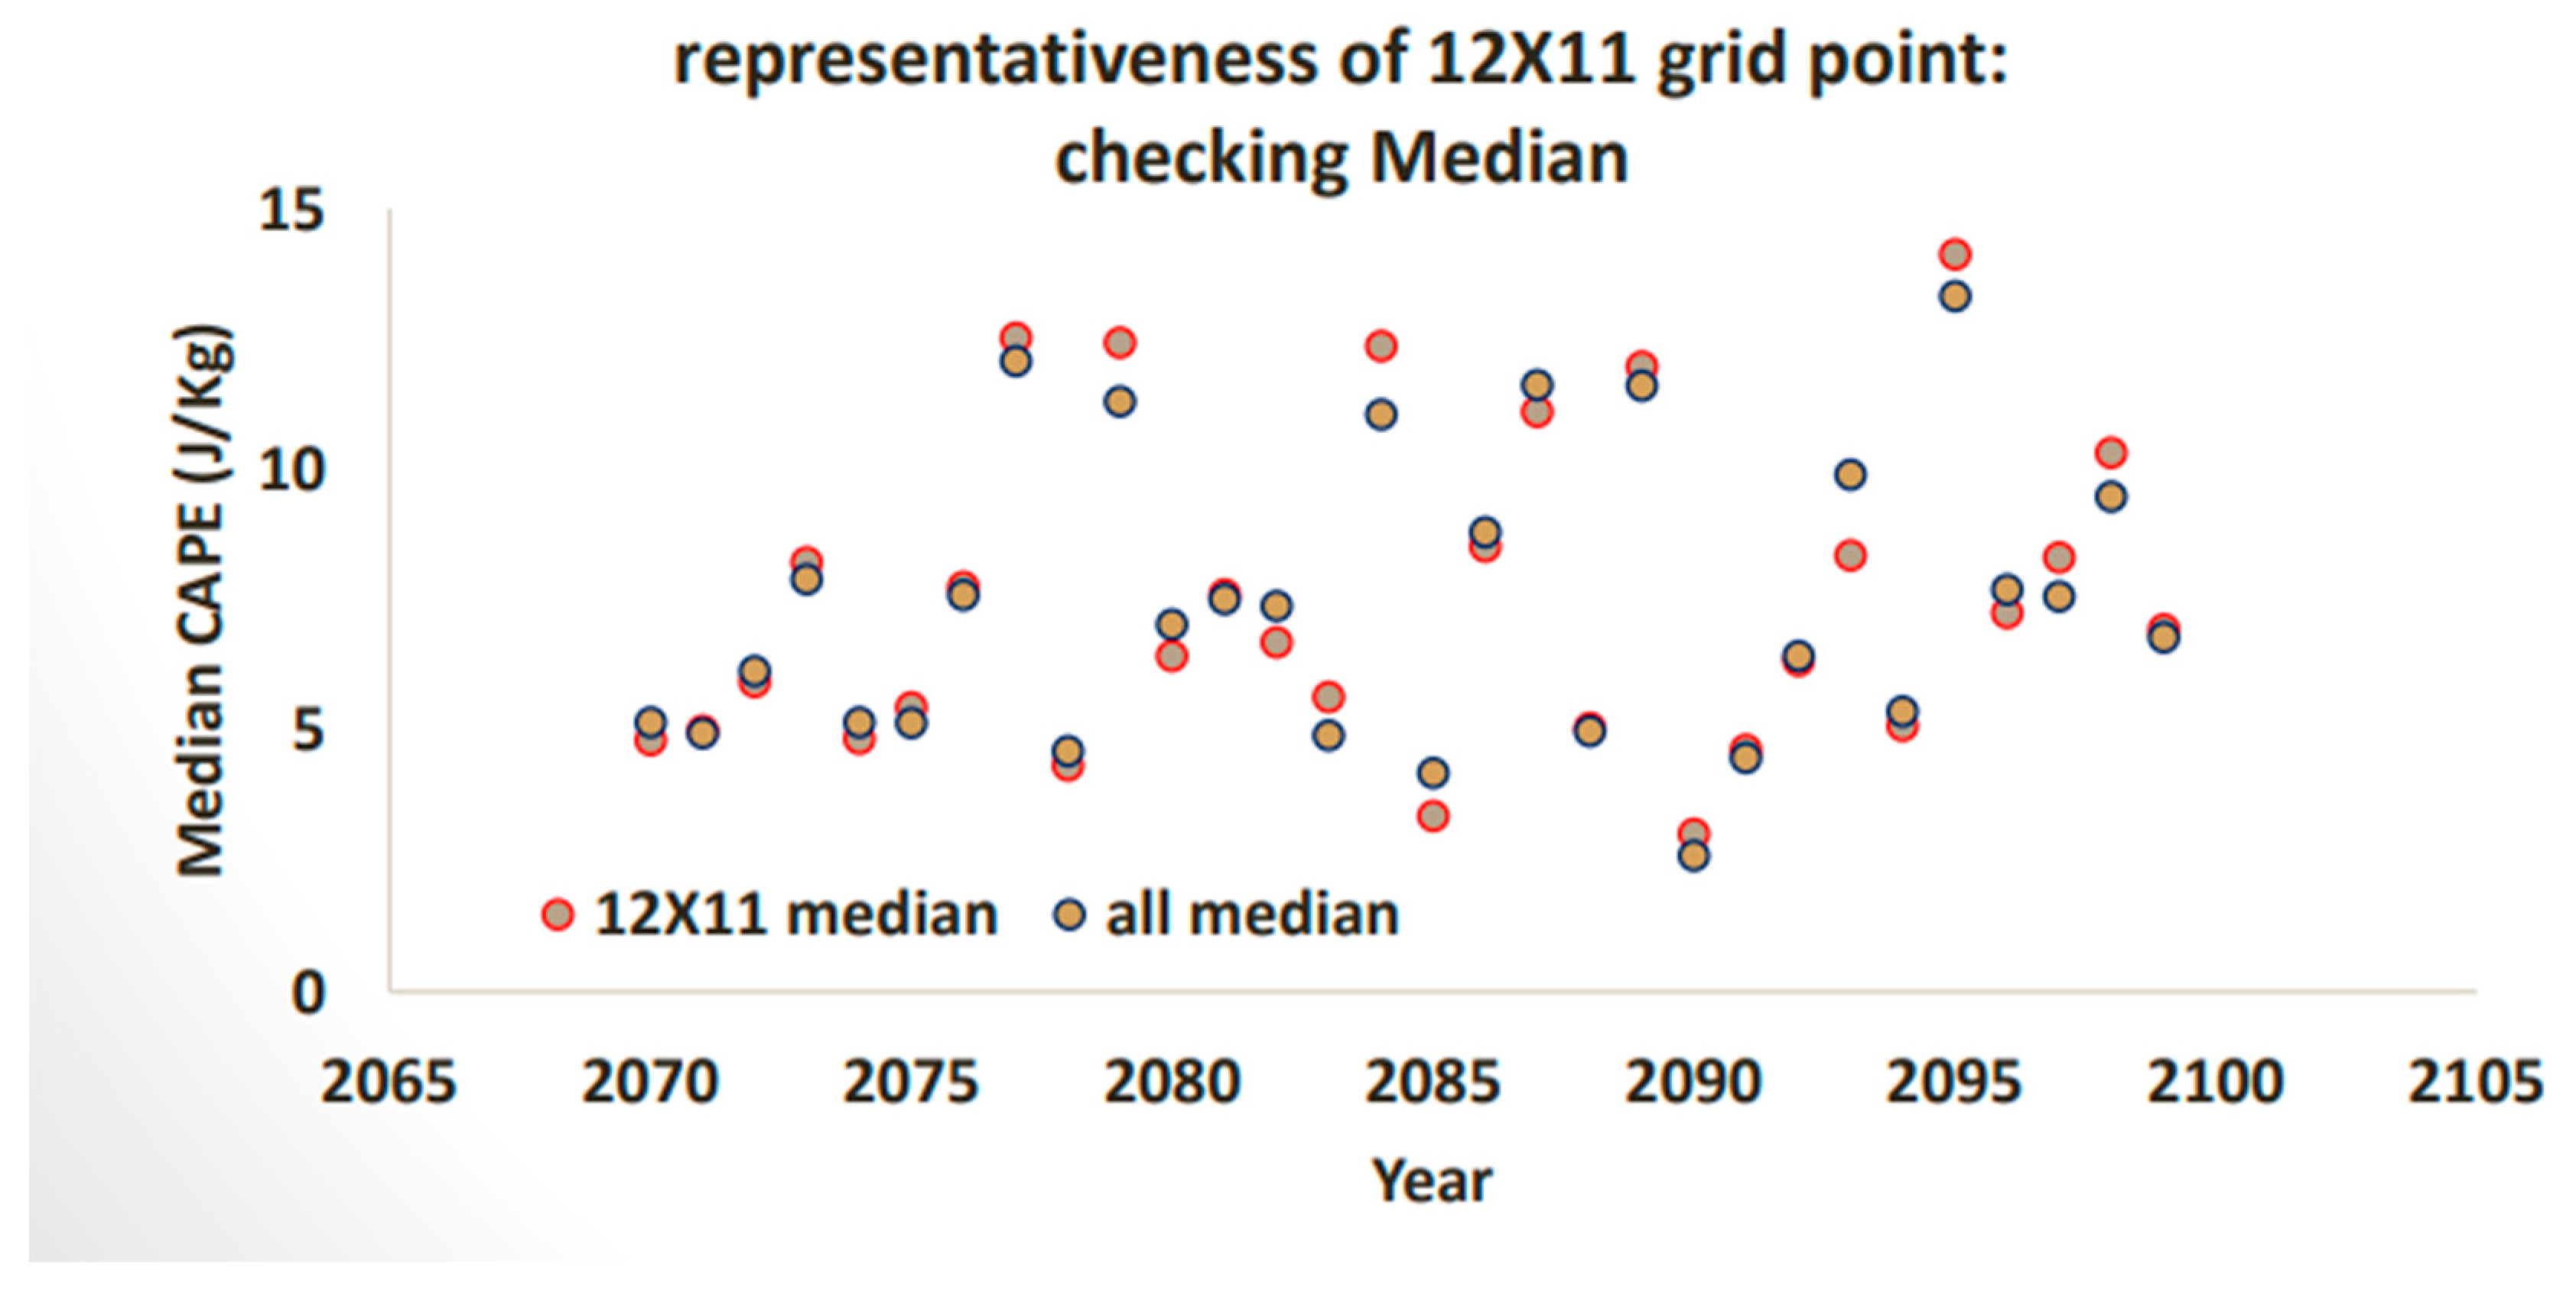
Figure 4.
Density plot of wind shear for present and future.
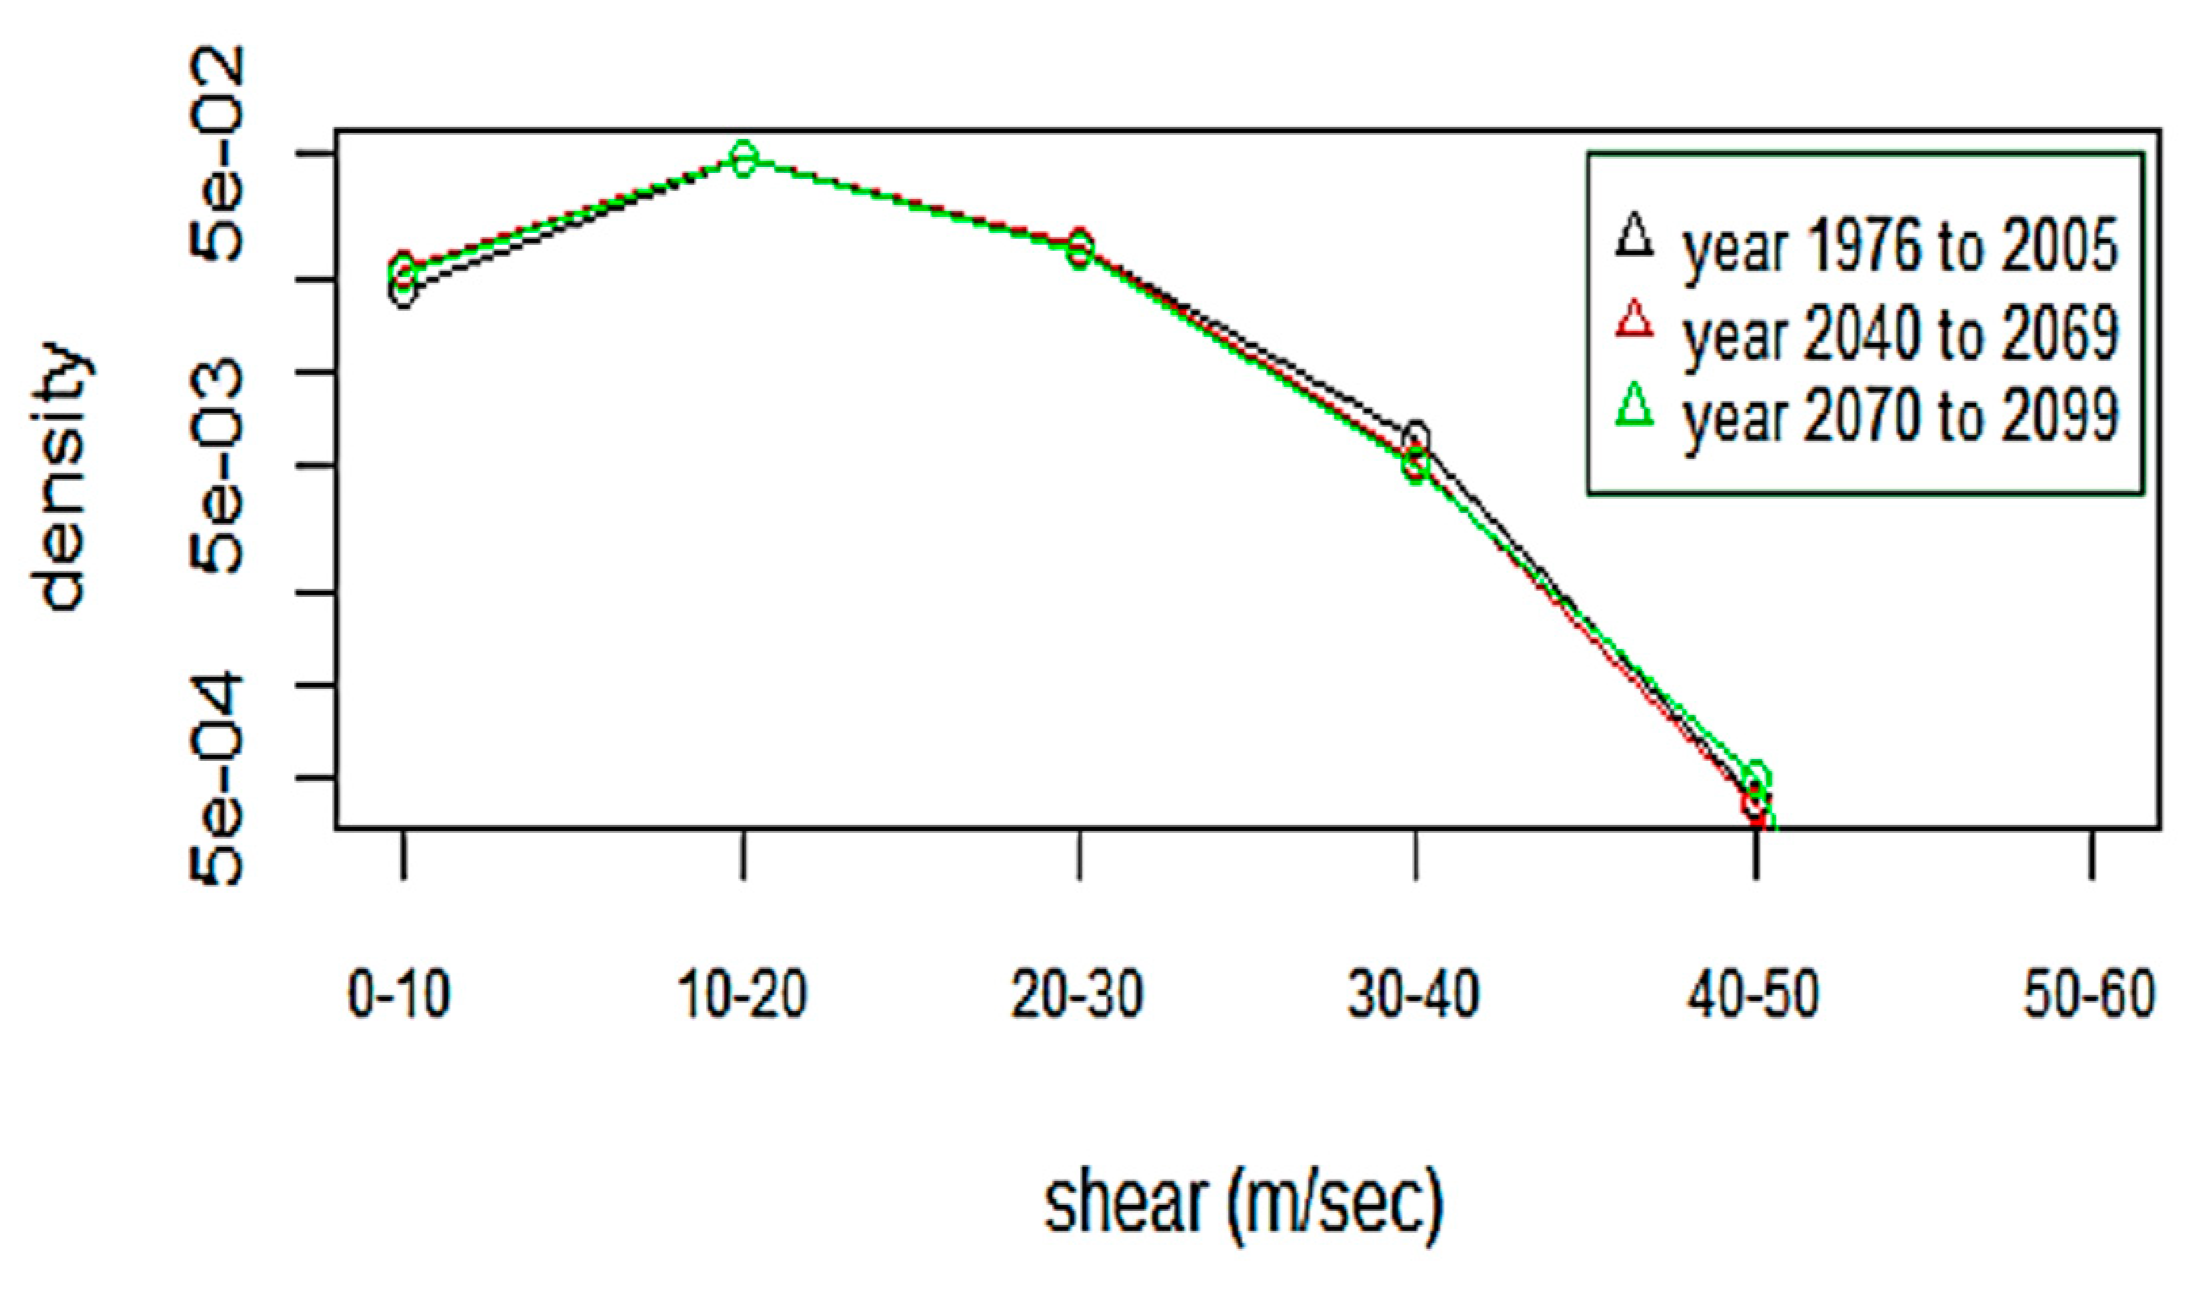
Figure 5.
A yearly trend plot for historical extreme wind shear.
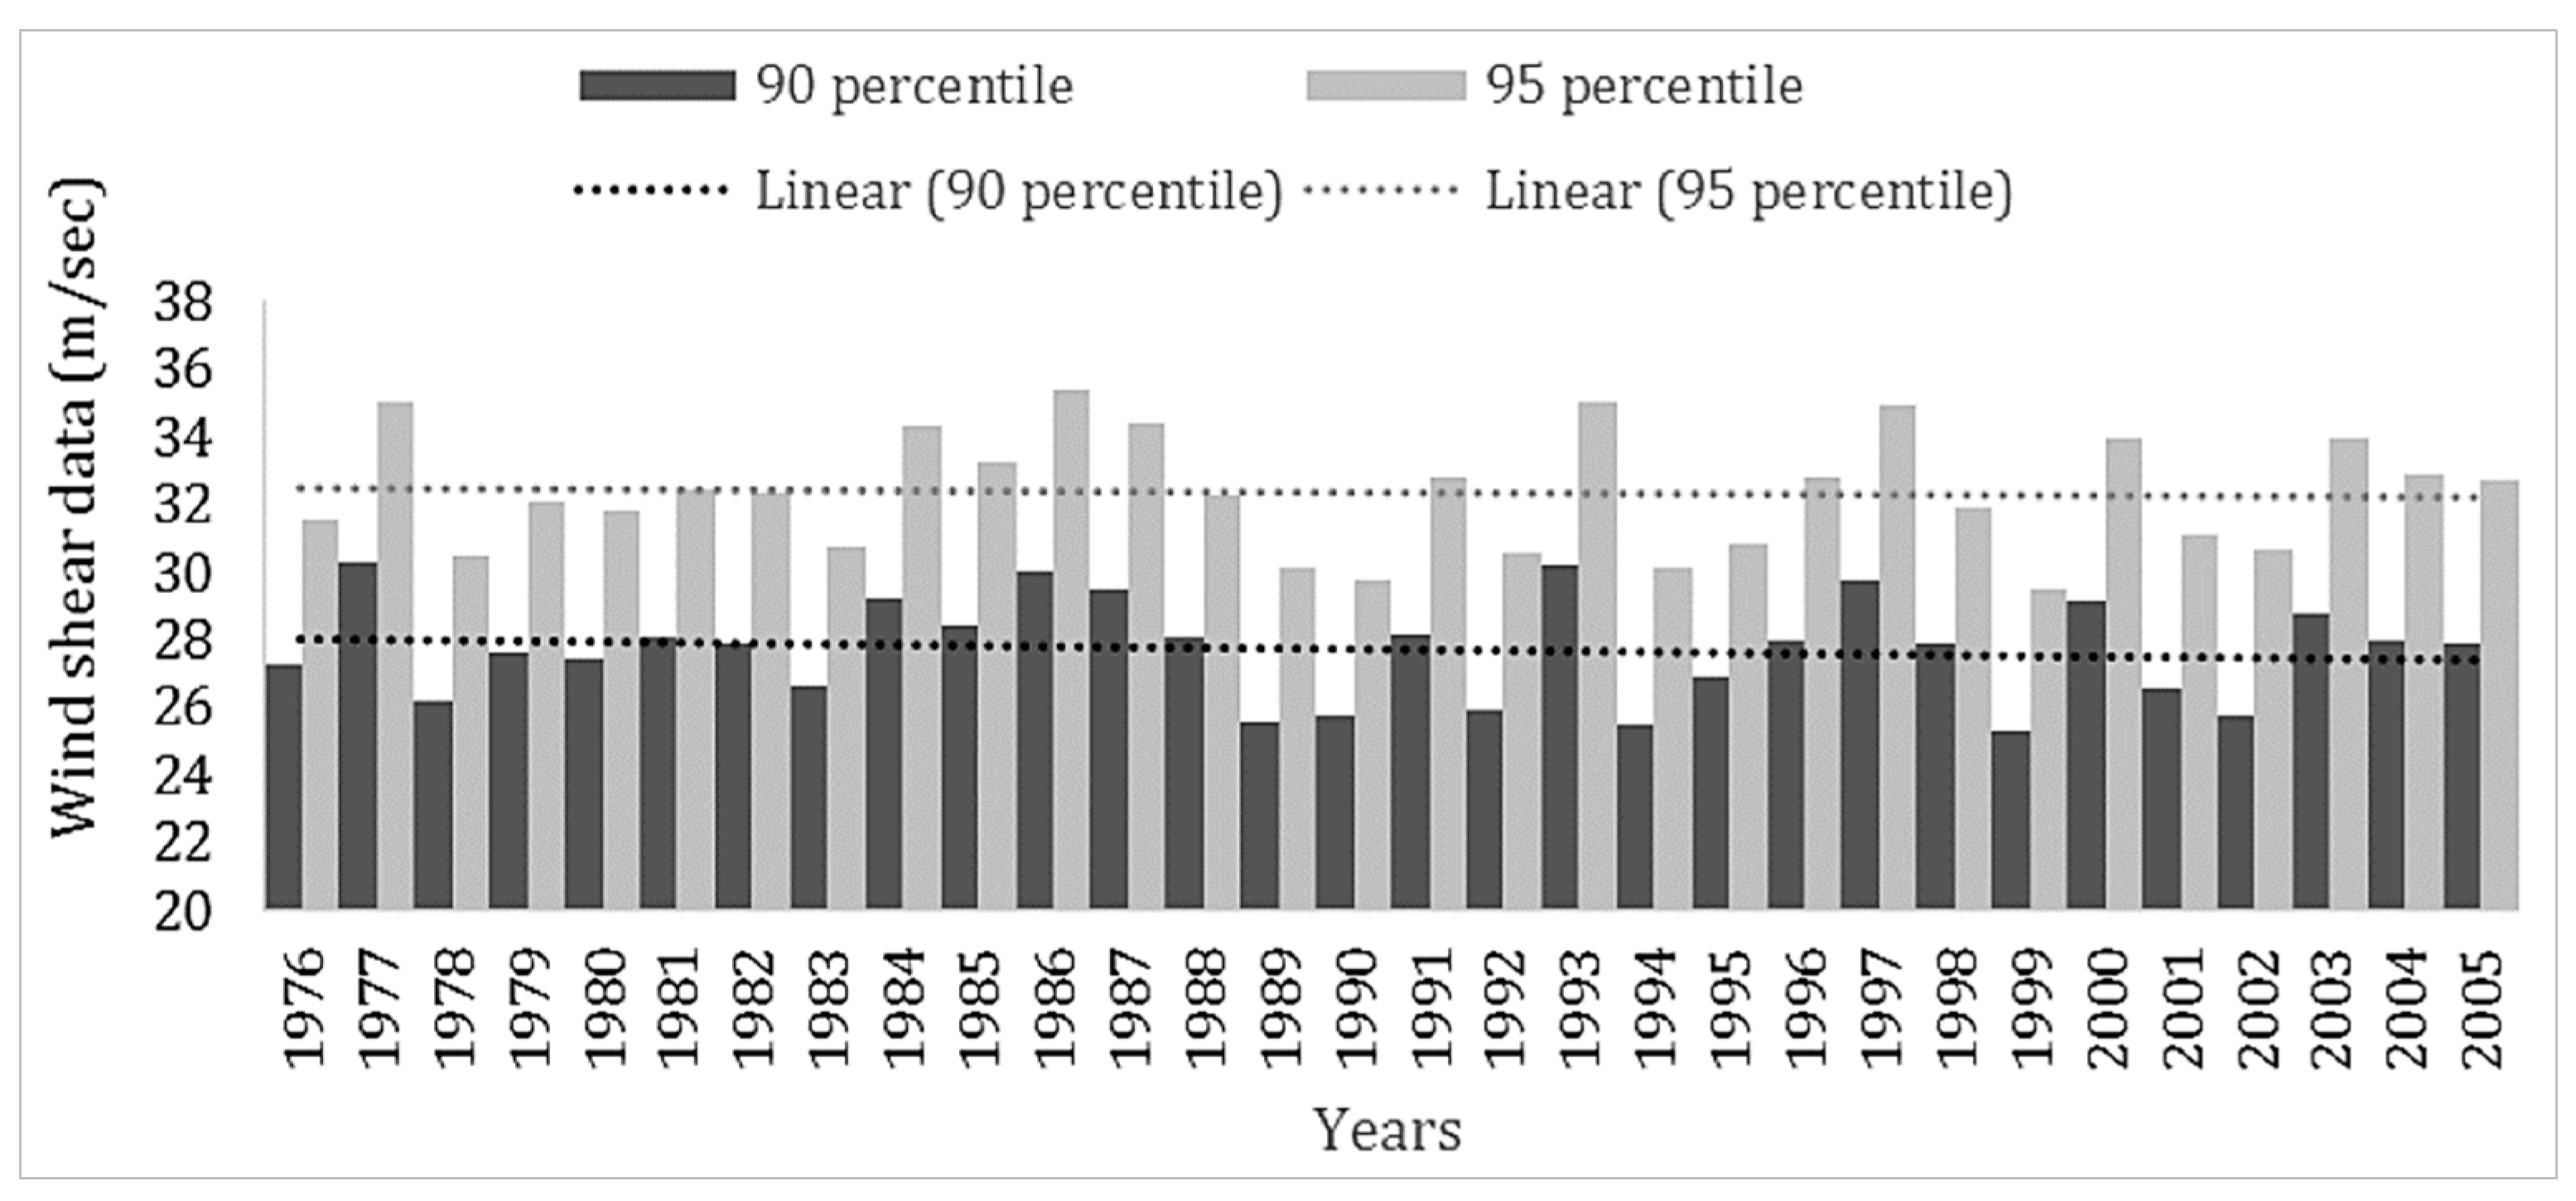
Figure 6.
Historical wind shear value plotted over the months (long term average) [grid 12X11].
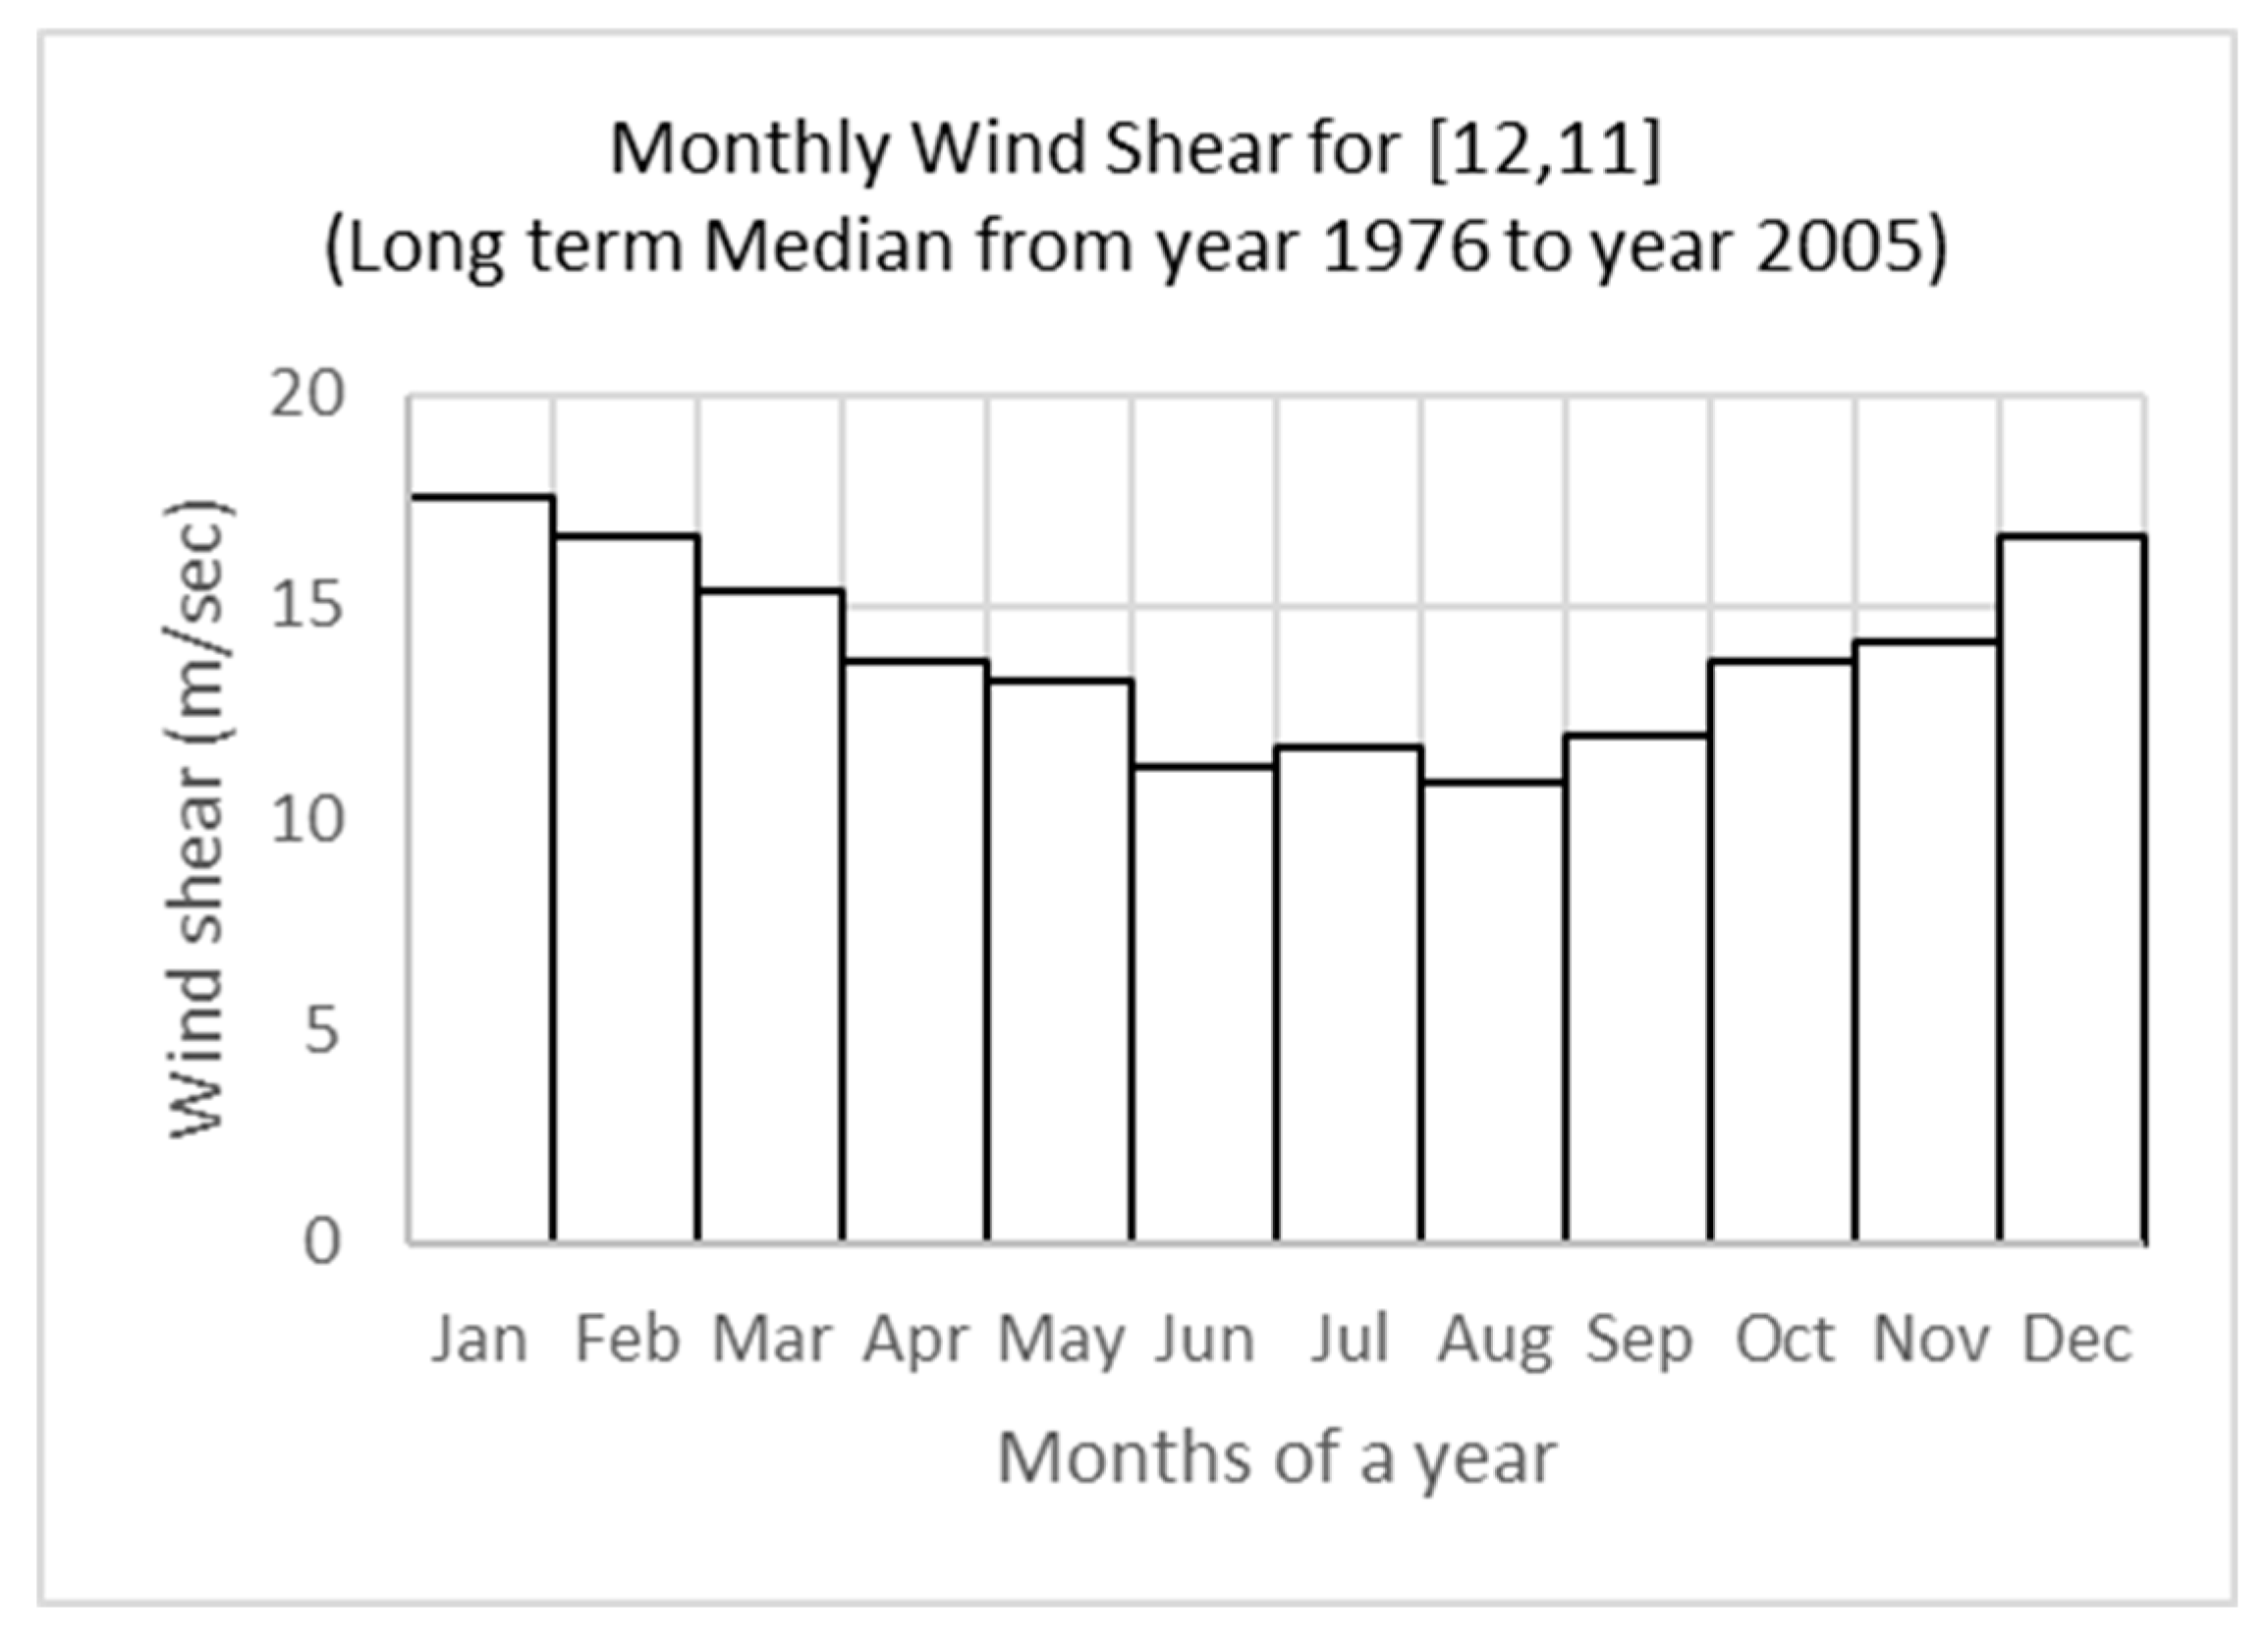
Figure 7.
Boxplot for wind shear (monthwise).
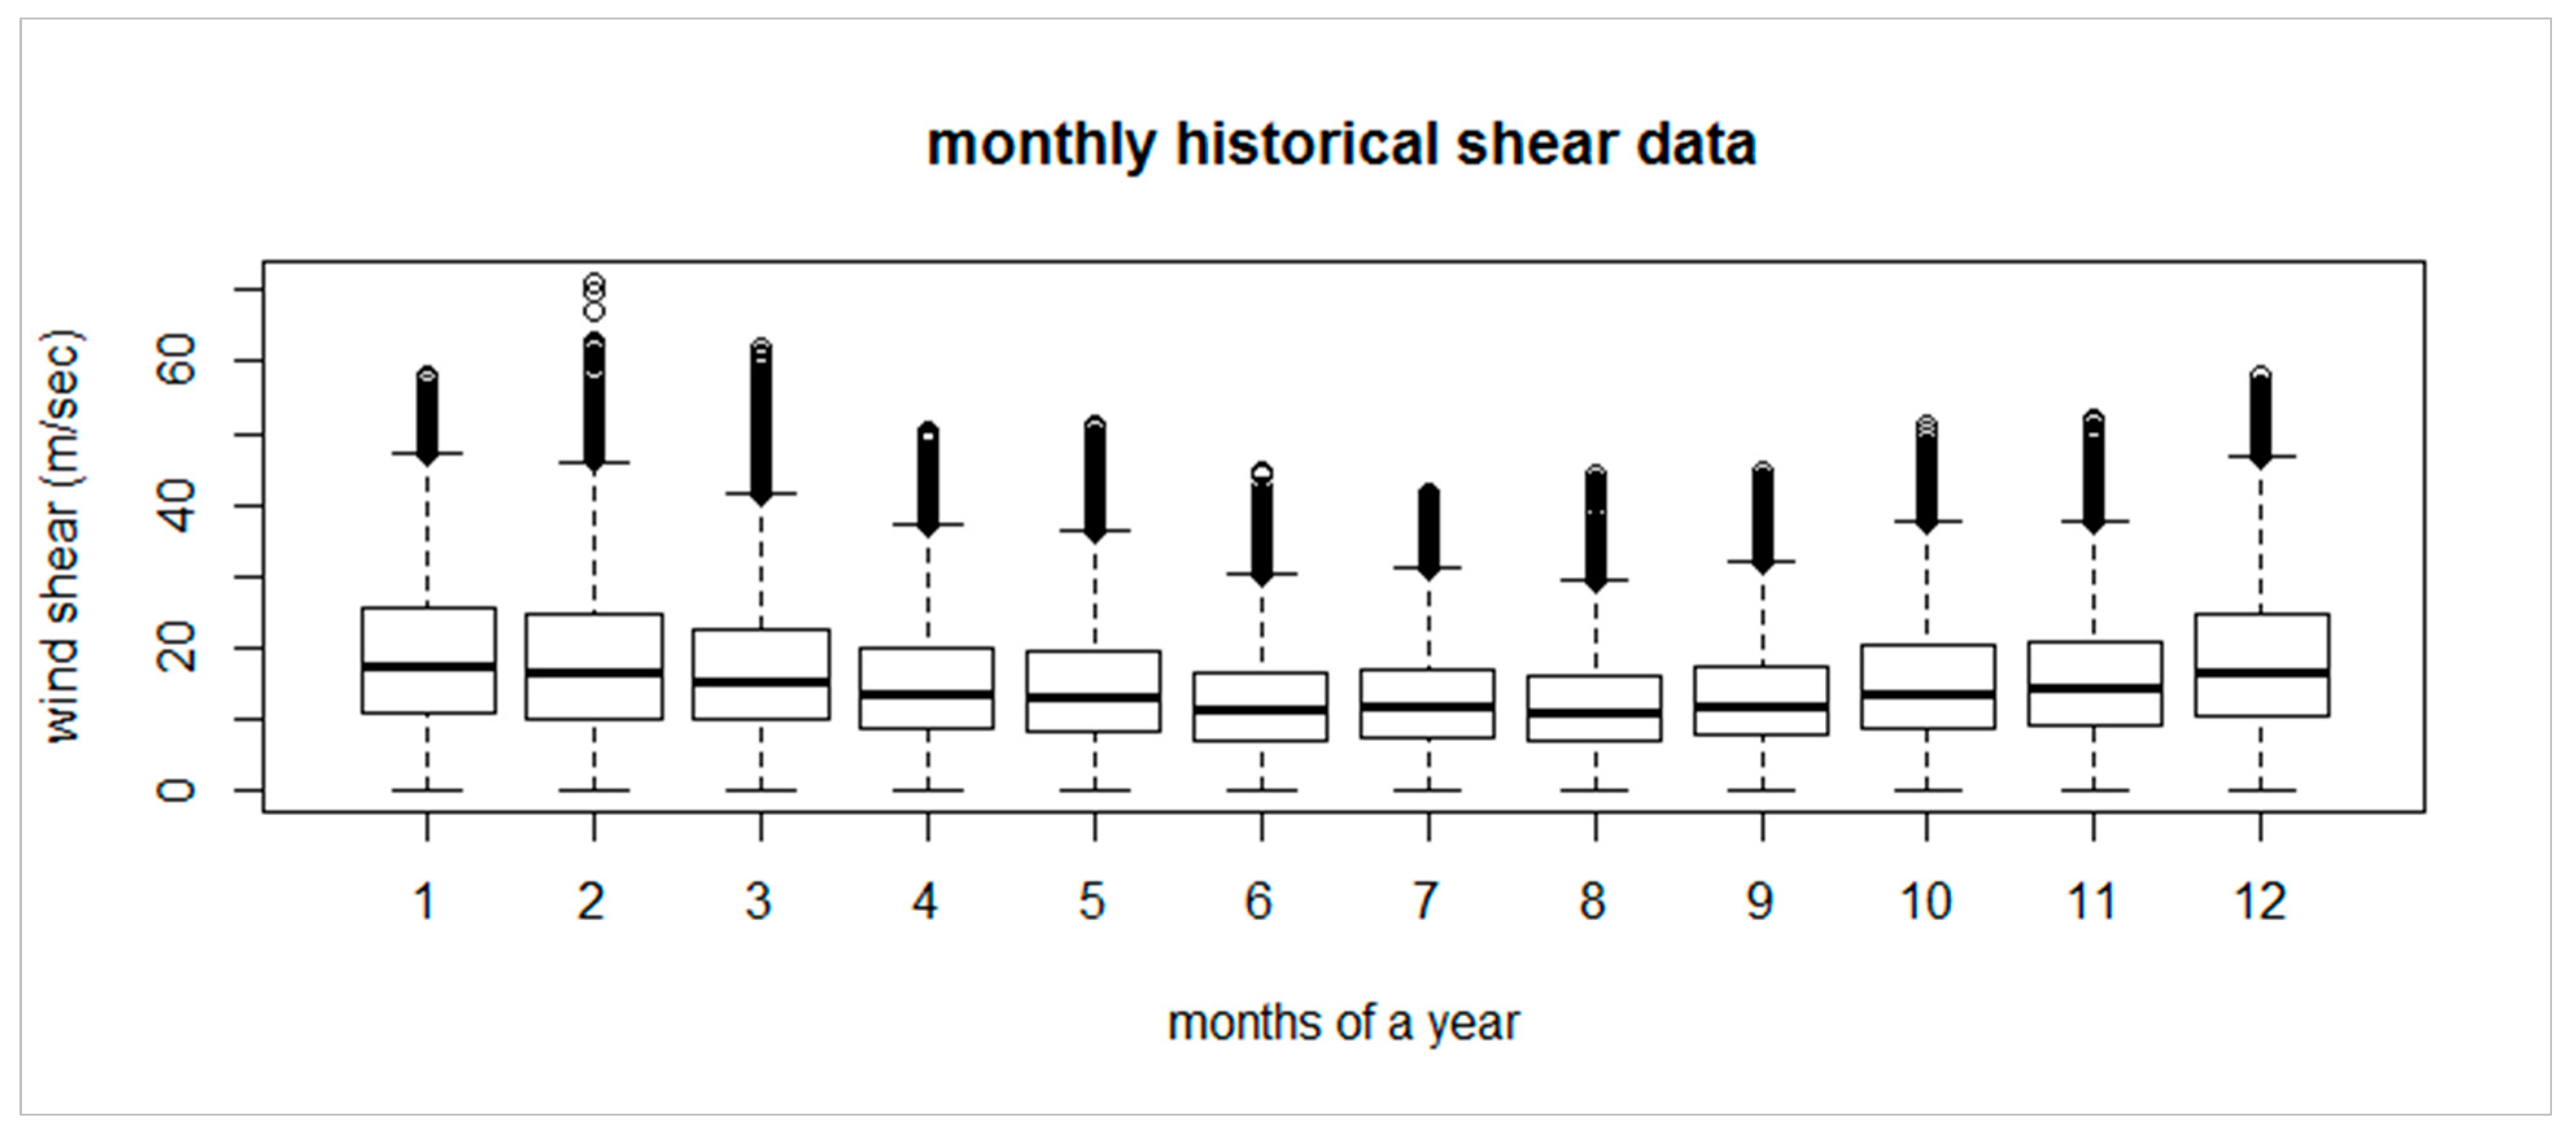
Figure 8.
Historical wind shear value plotted over the months (90 and 95 percentile).
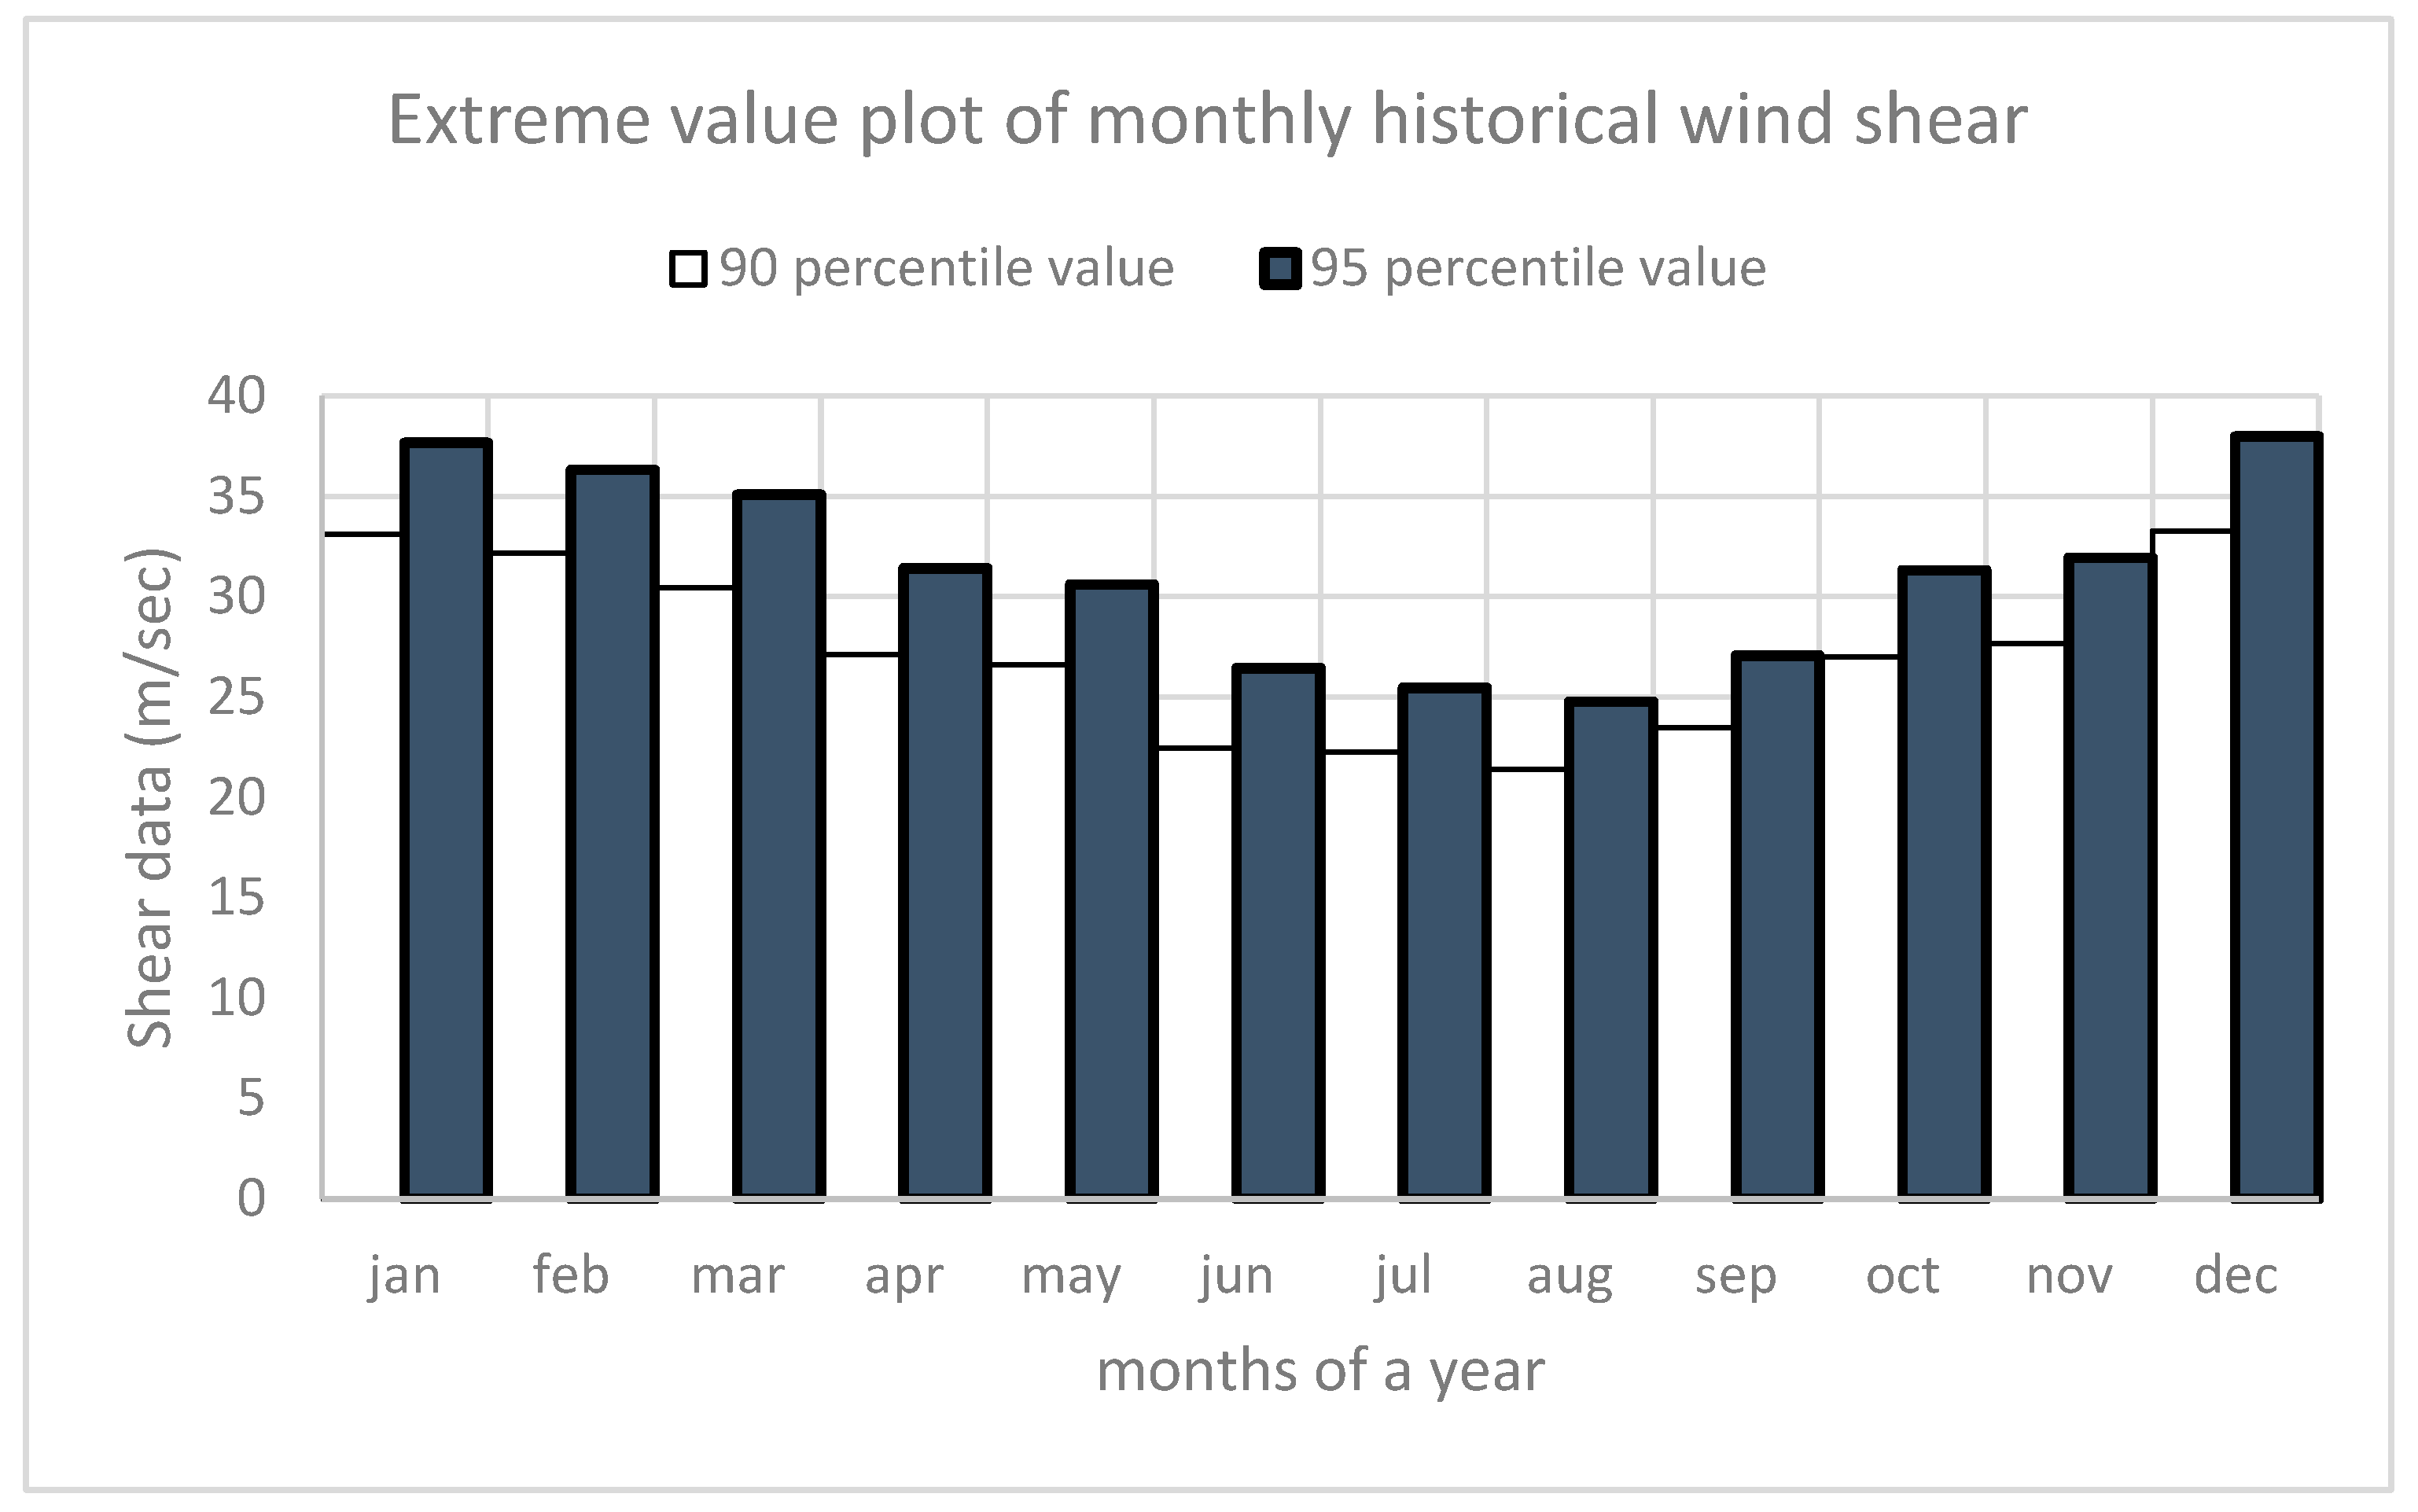
Figure 9.
Extreme wind shear evolution in future.
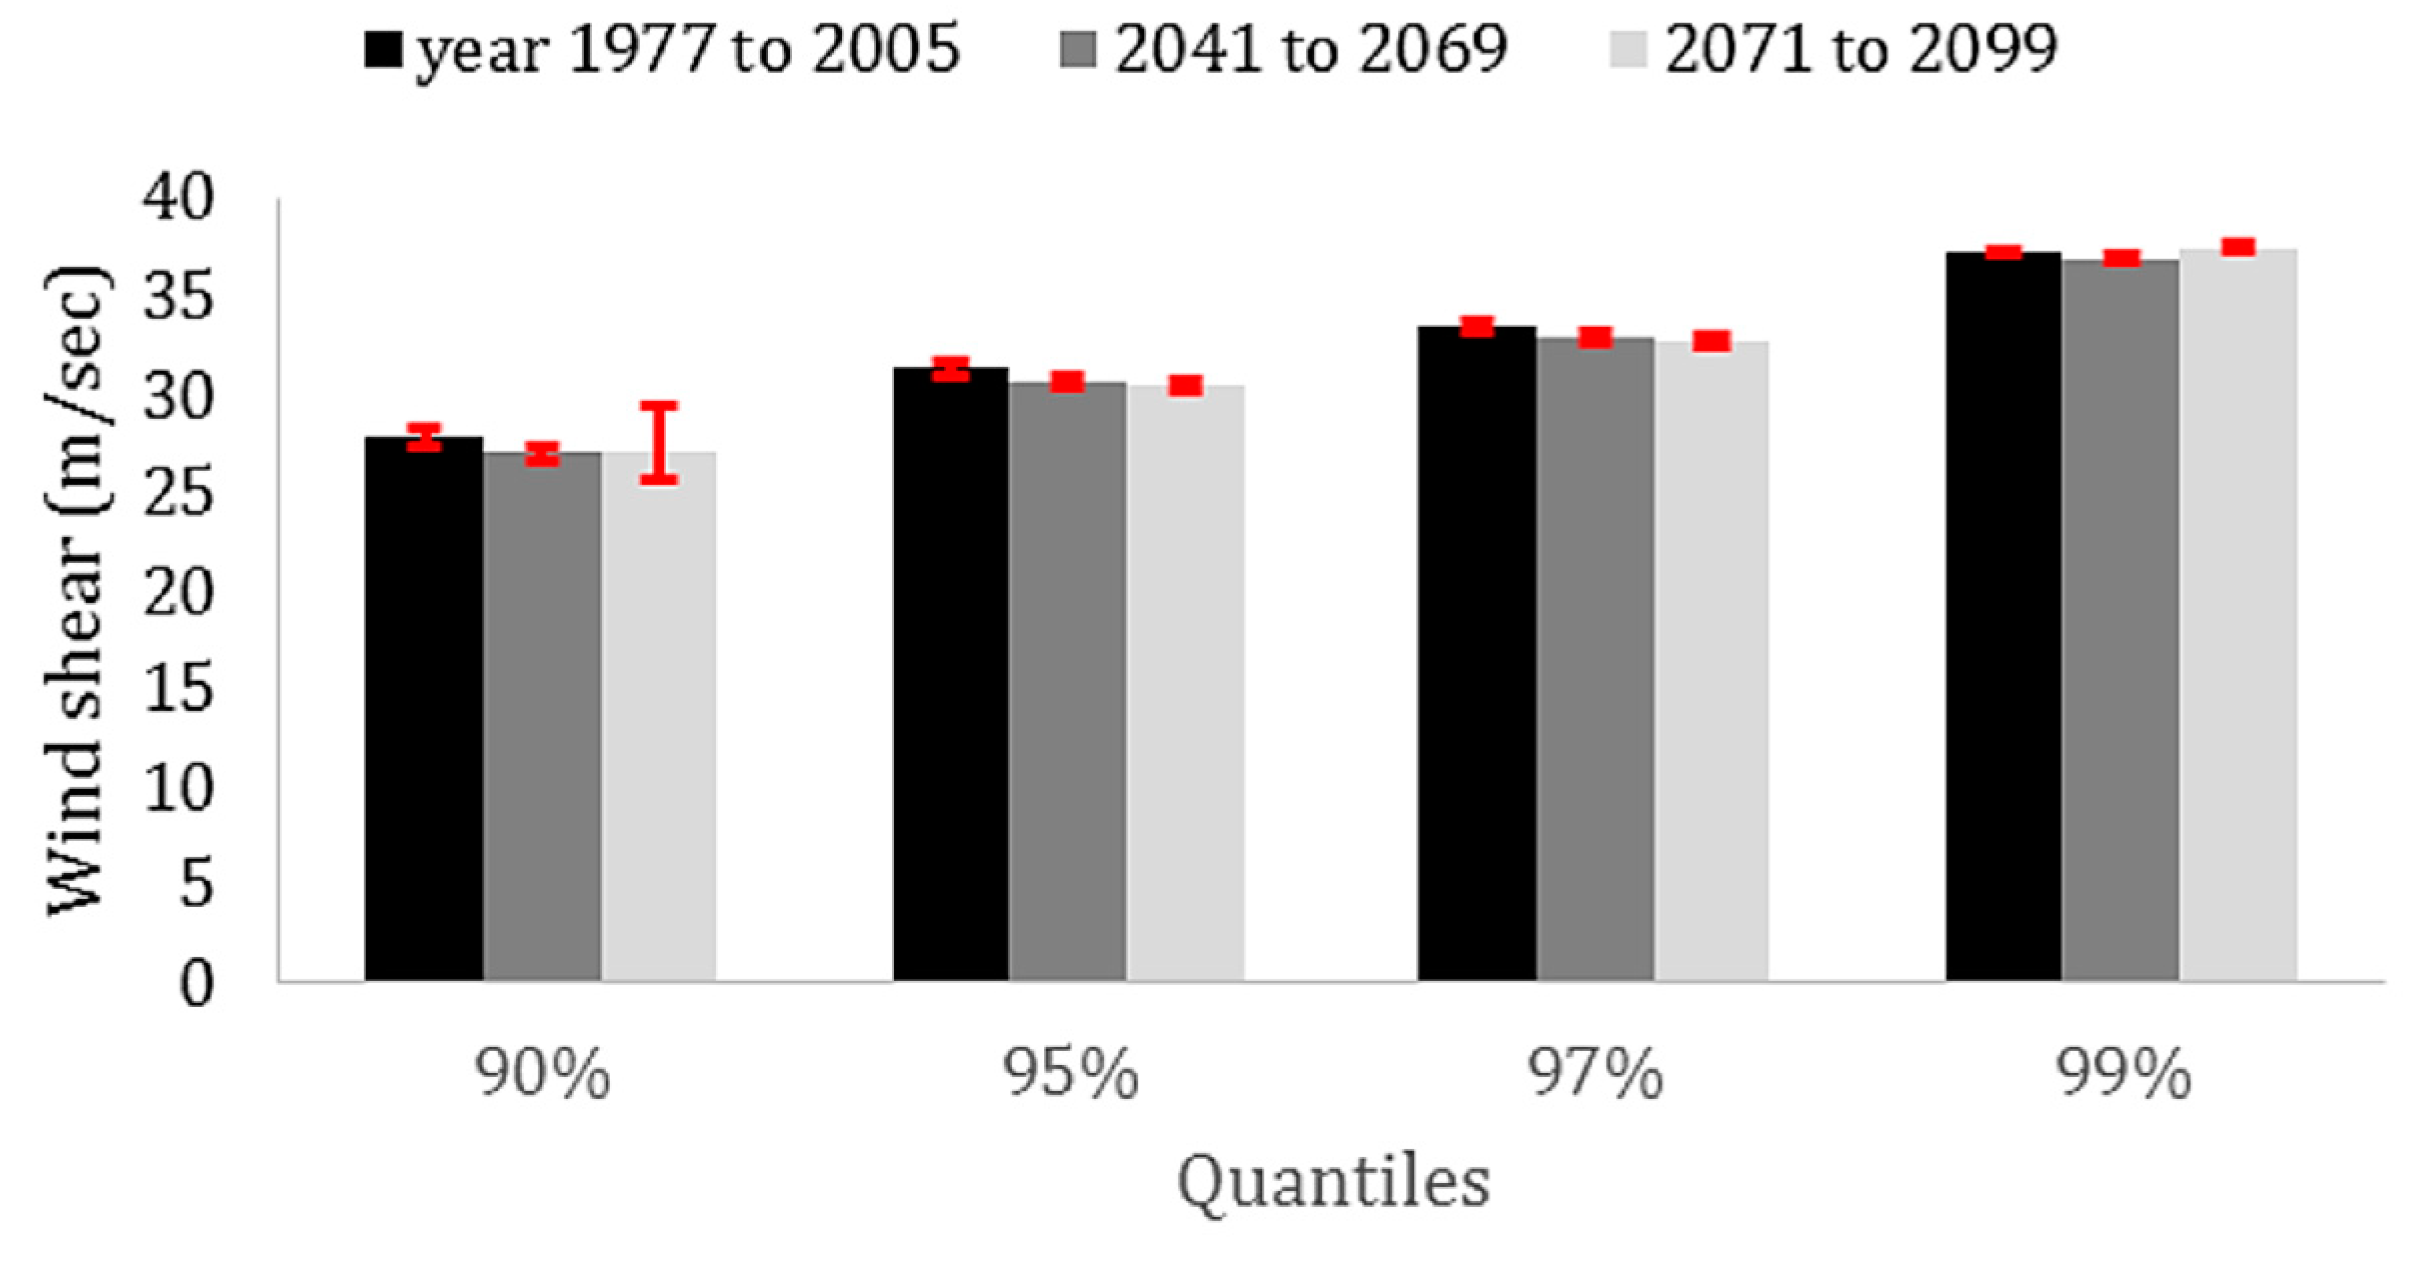
Figure 10.
Density plot of CAPE in different periods.
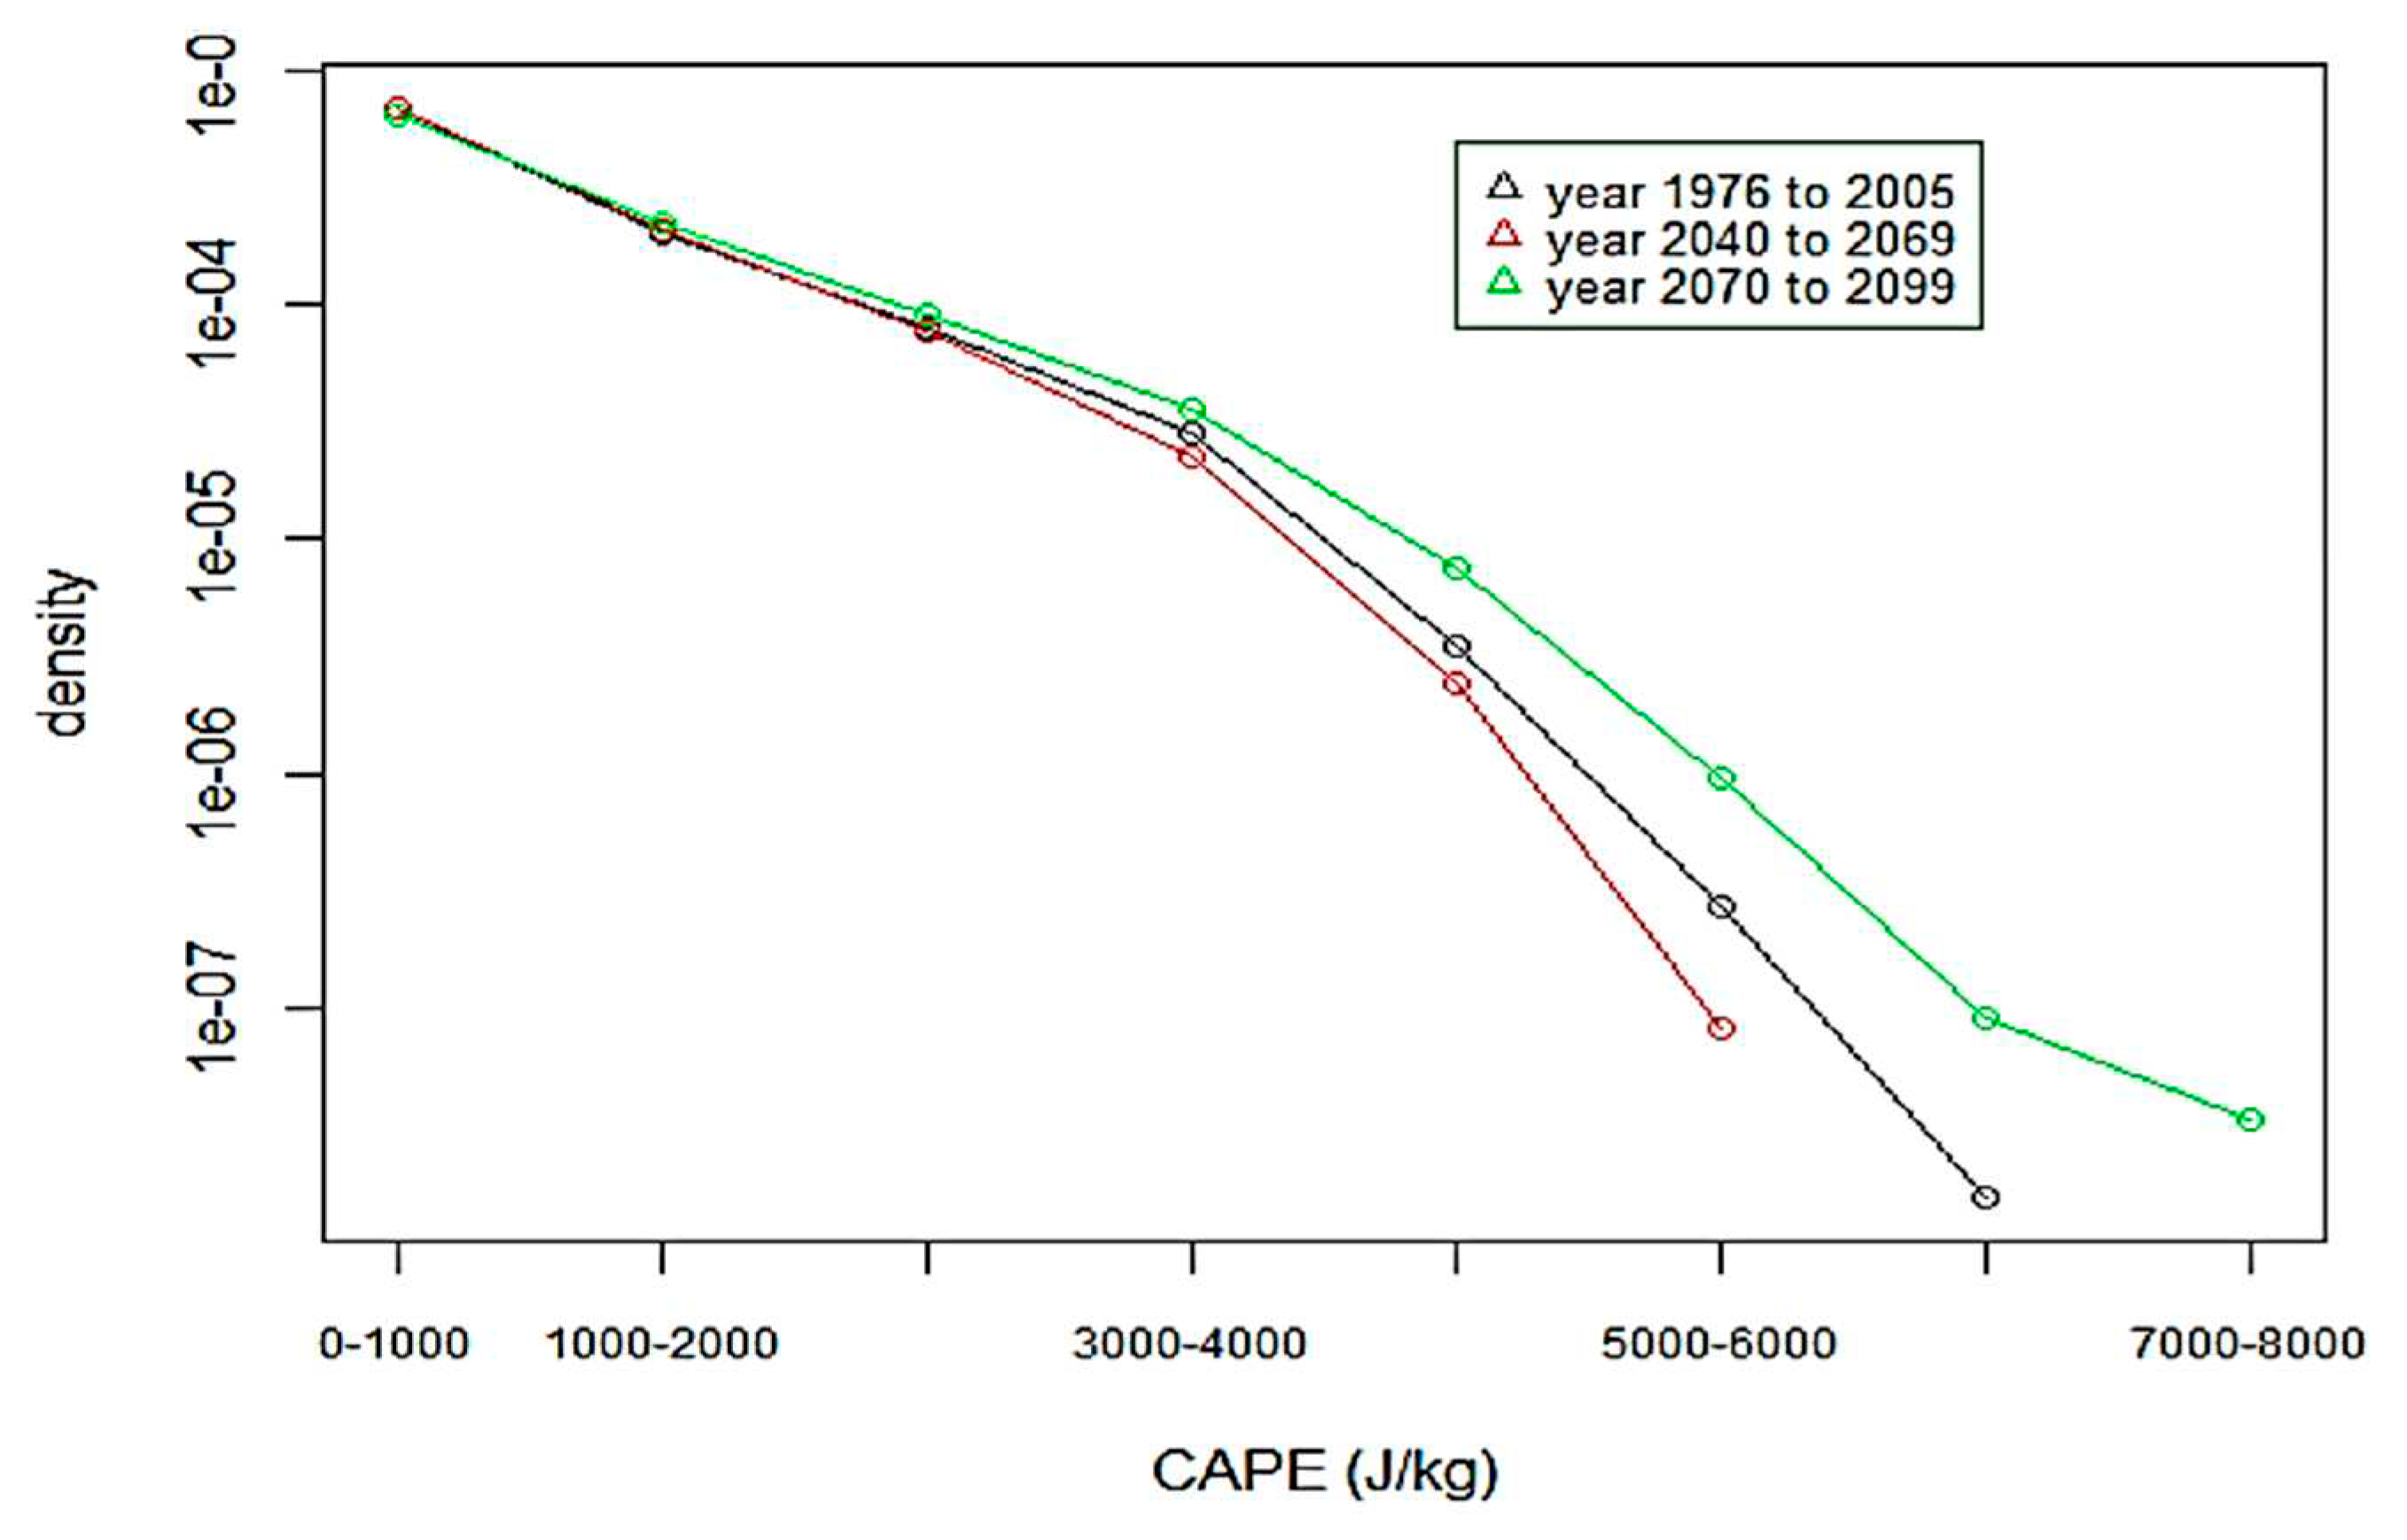
Figure 11.
Yearly trend of CAPE in the historical period.
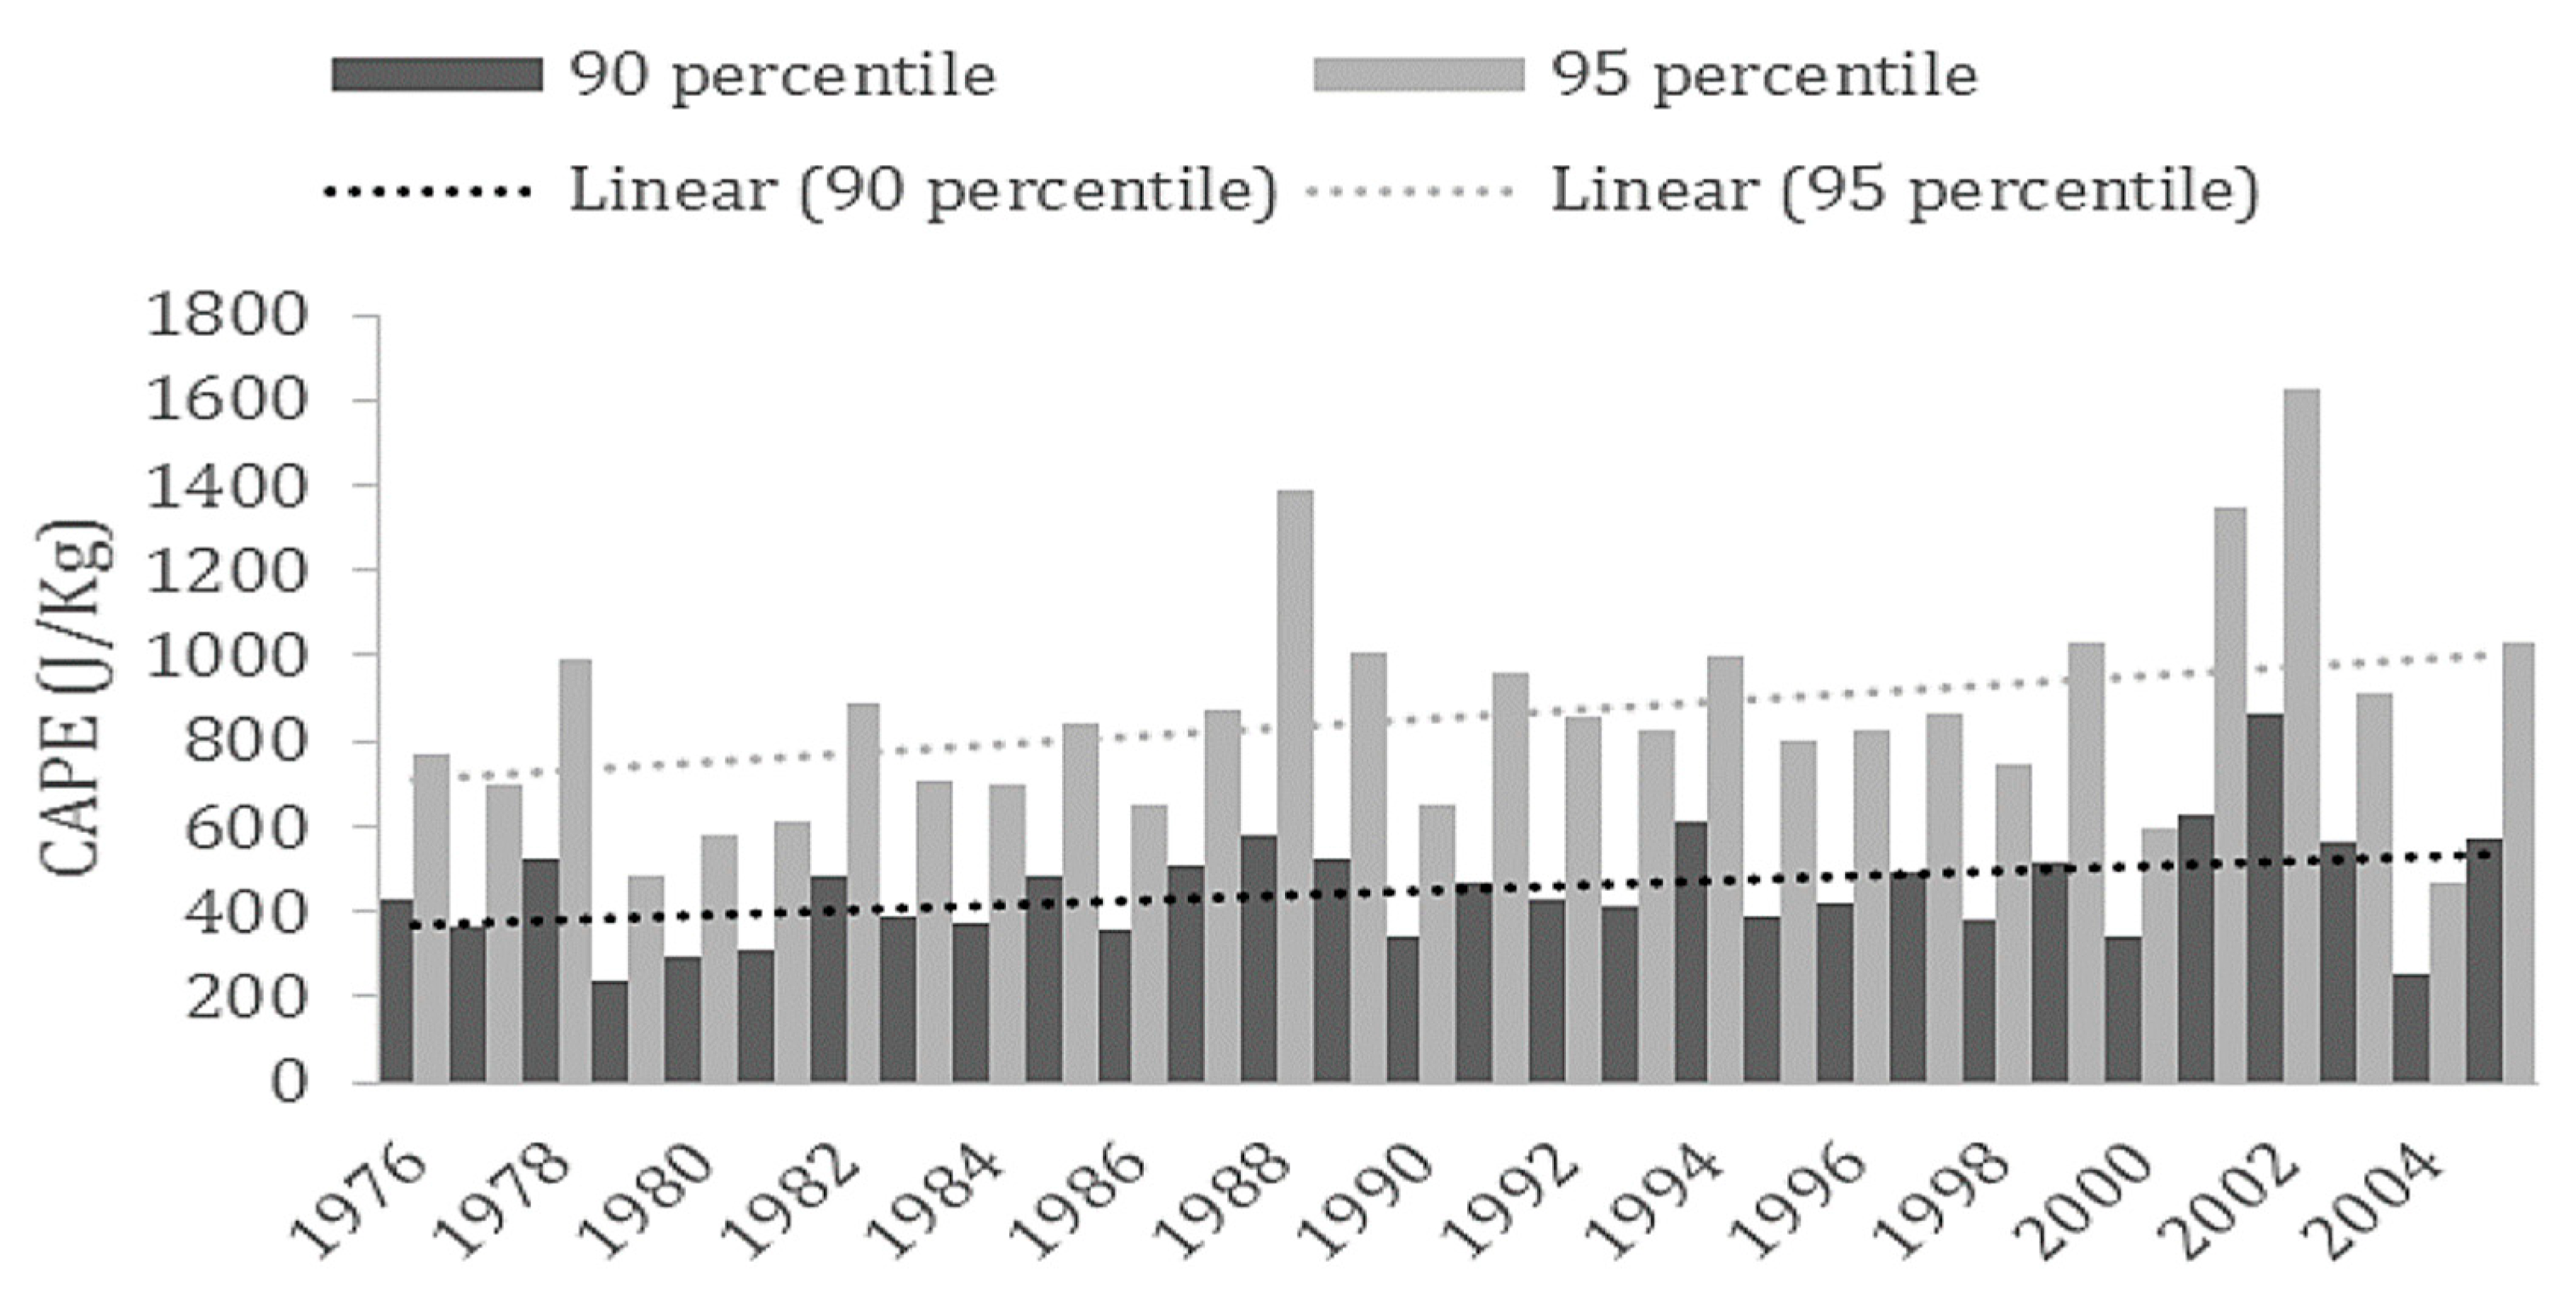
Figure 12.
Boxplot of monthly historical CAPE data.
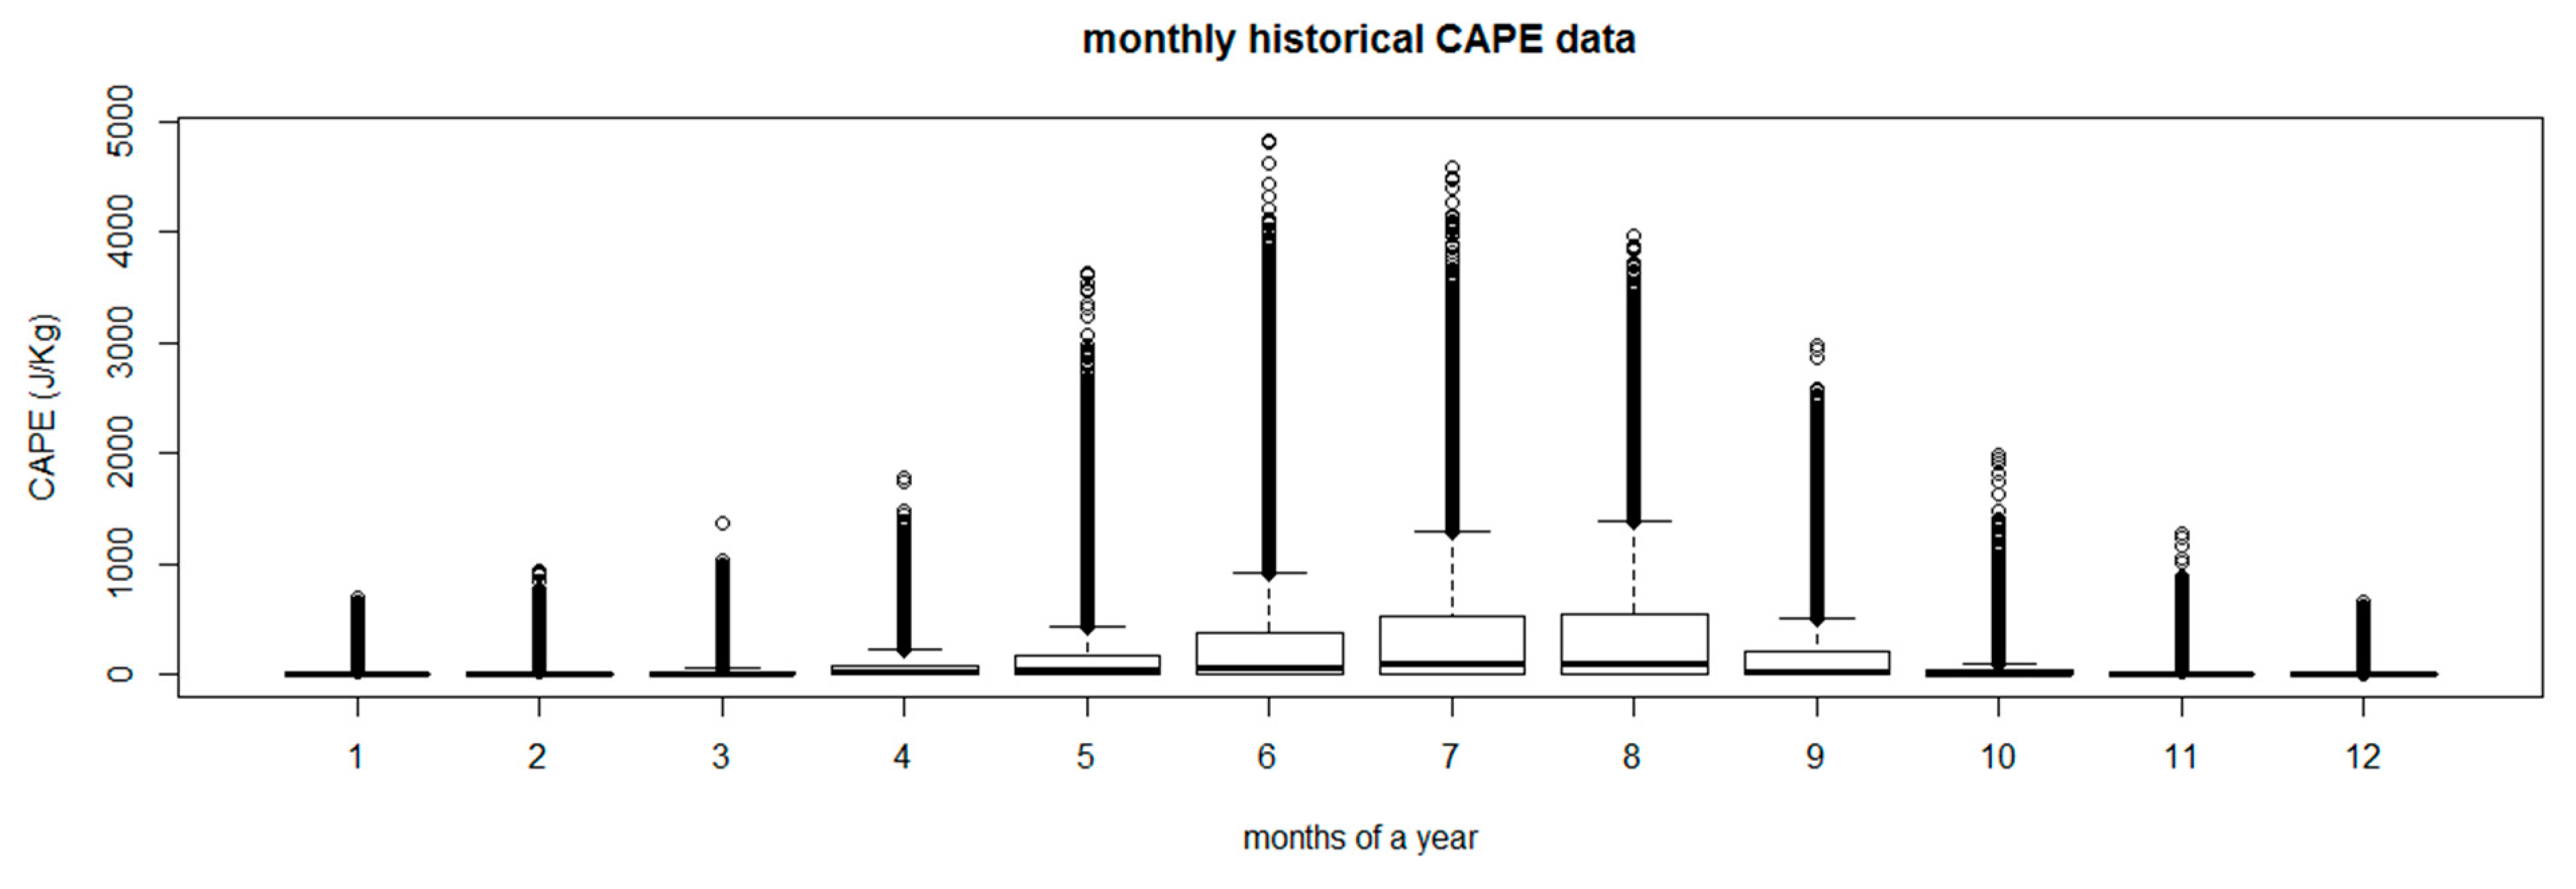
Figure 13.
Historical CAPE value plotted over the months (only median value for the representative grid 12X11).
Figure 13.
Historical CAPE value plotted over the months (only median value for the representative grid 12X11).
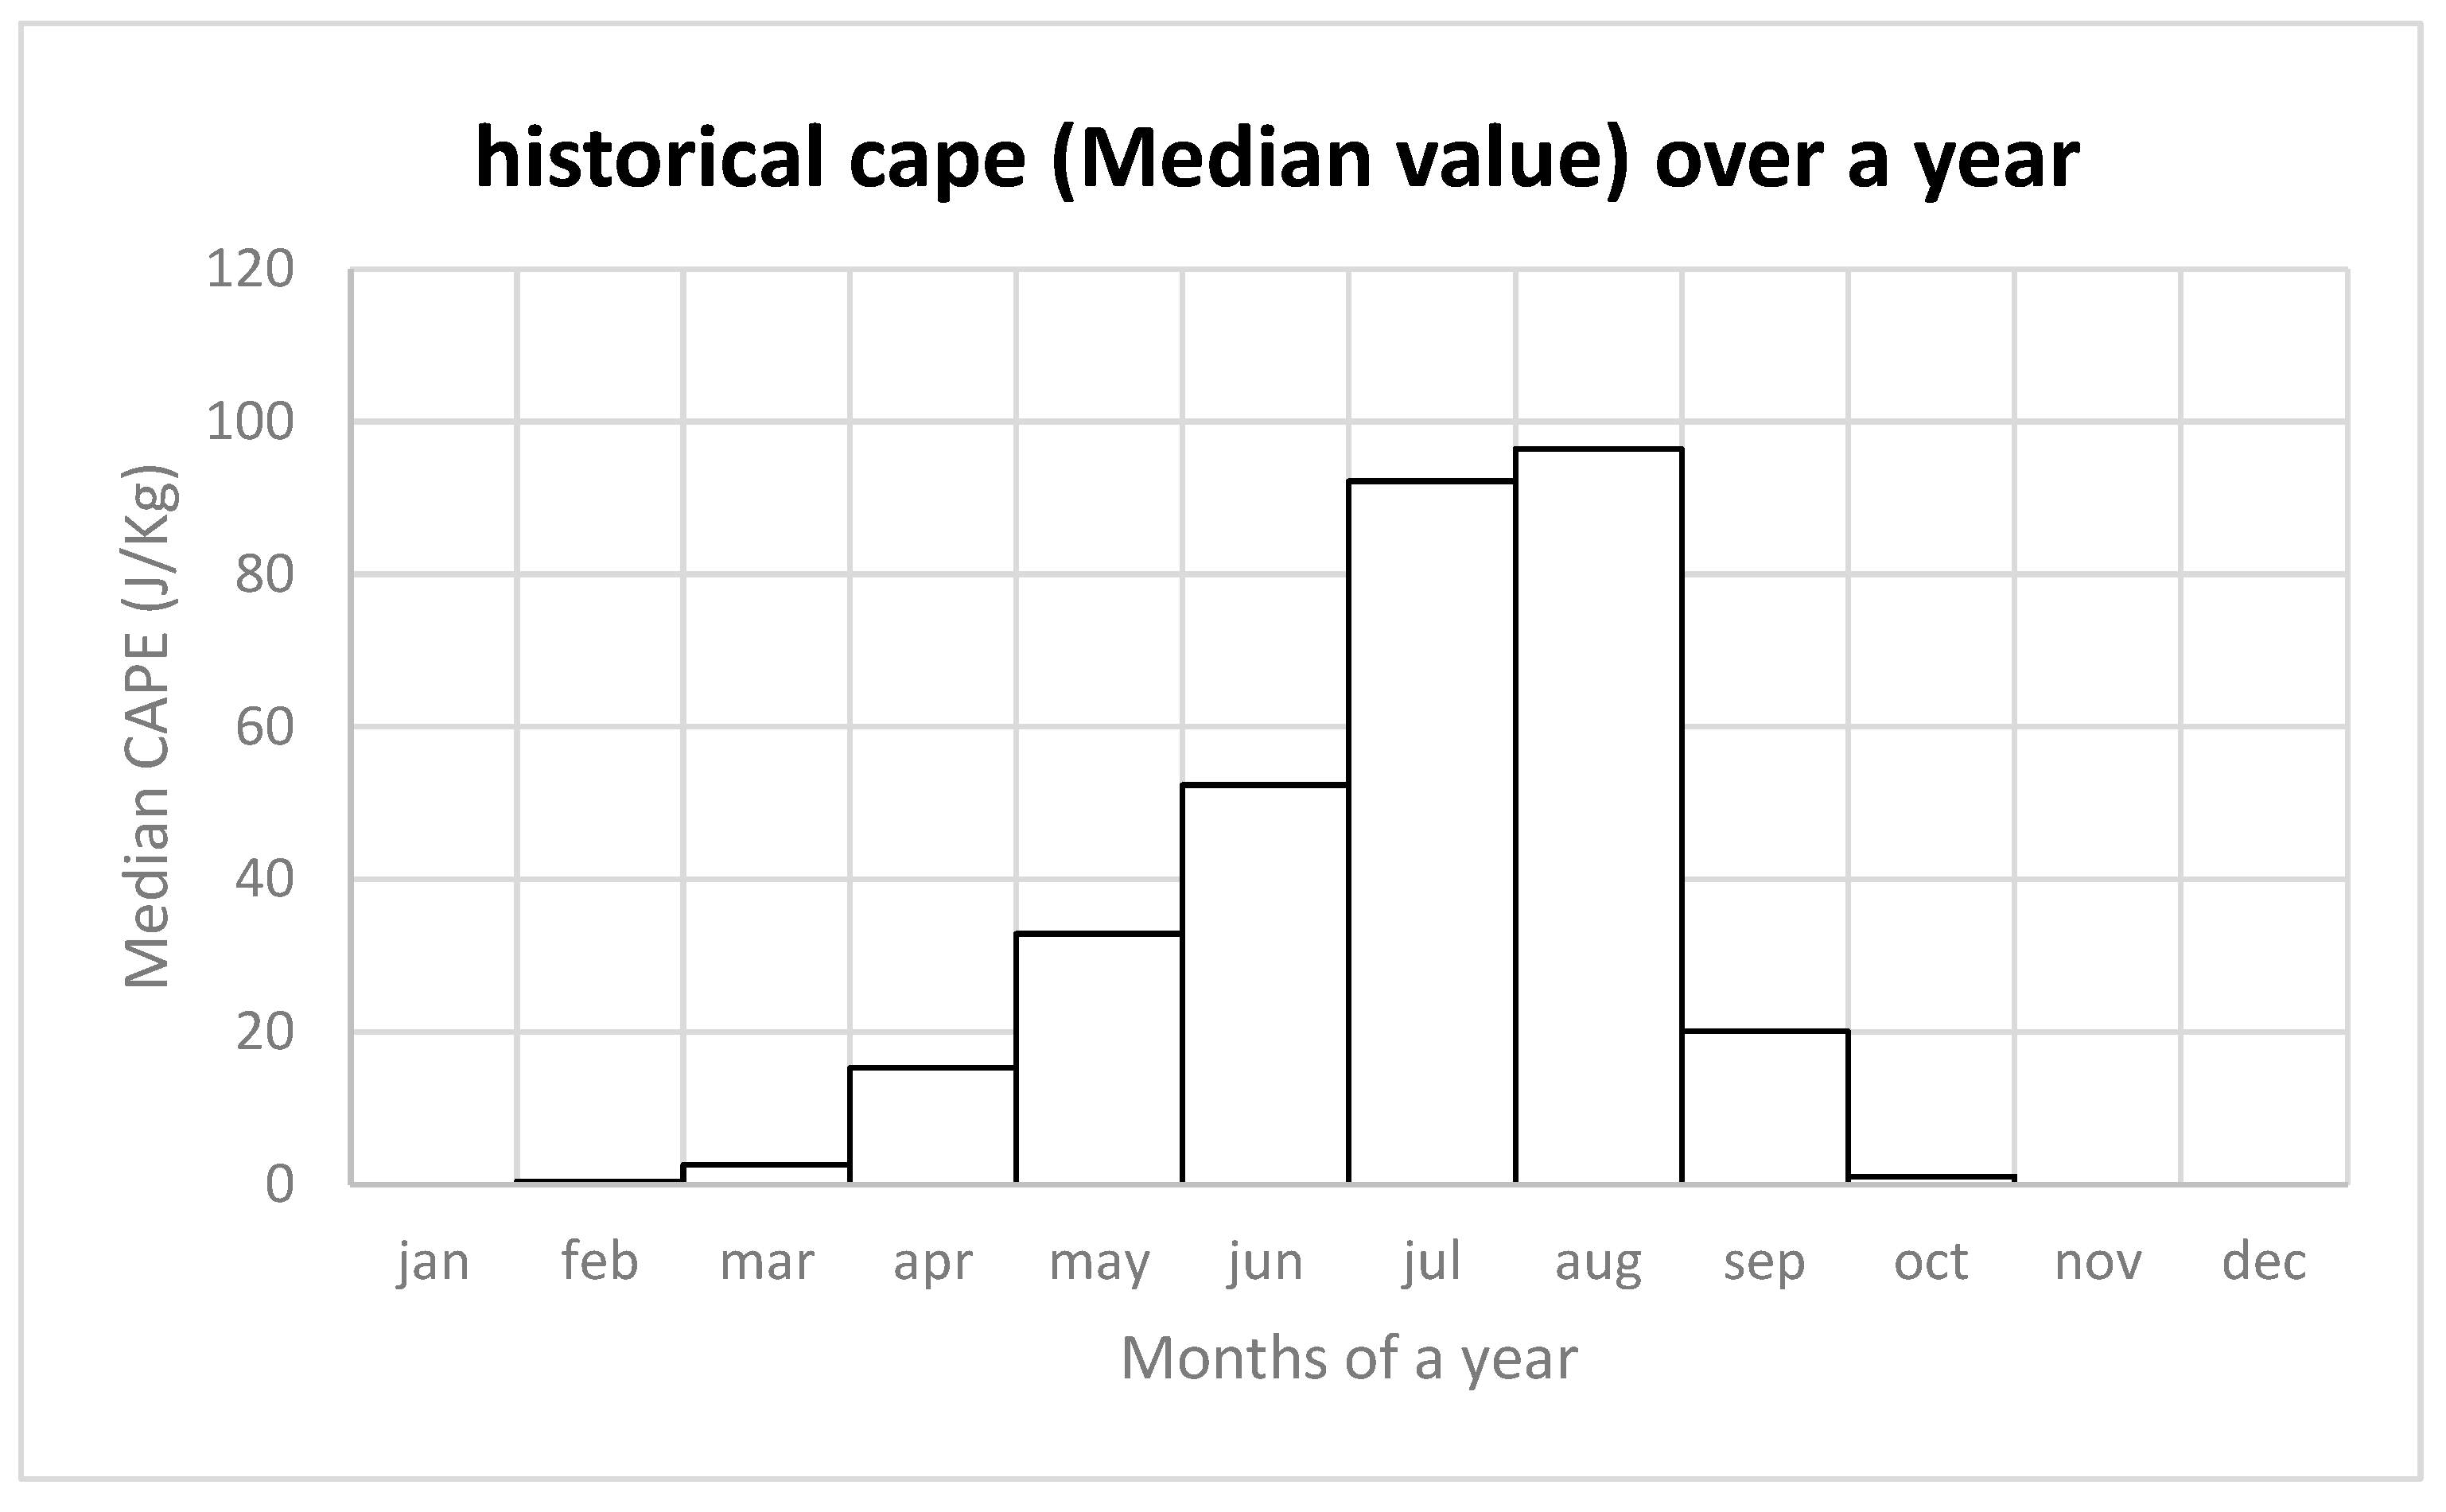
Figure 14.
Historical CAPE value plotted over the months (90 and 95 percentile for all the grids).
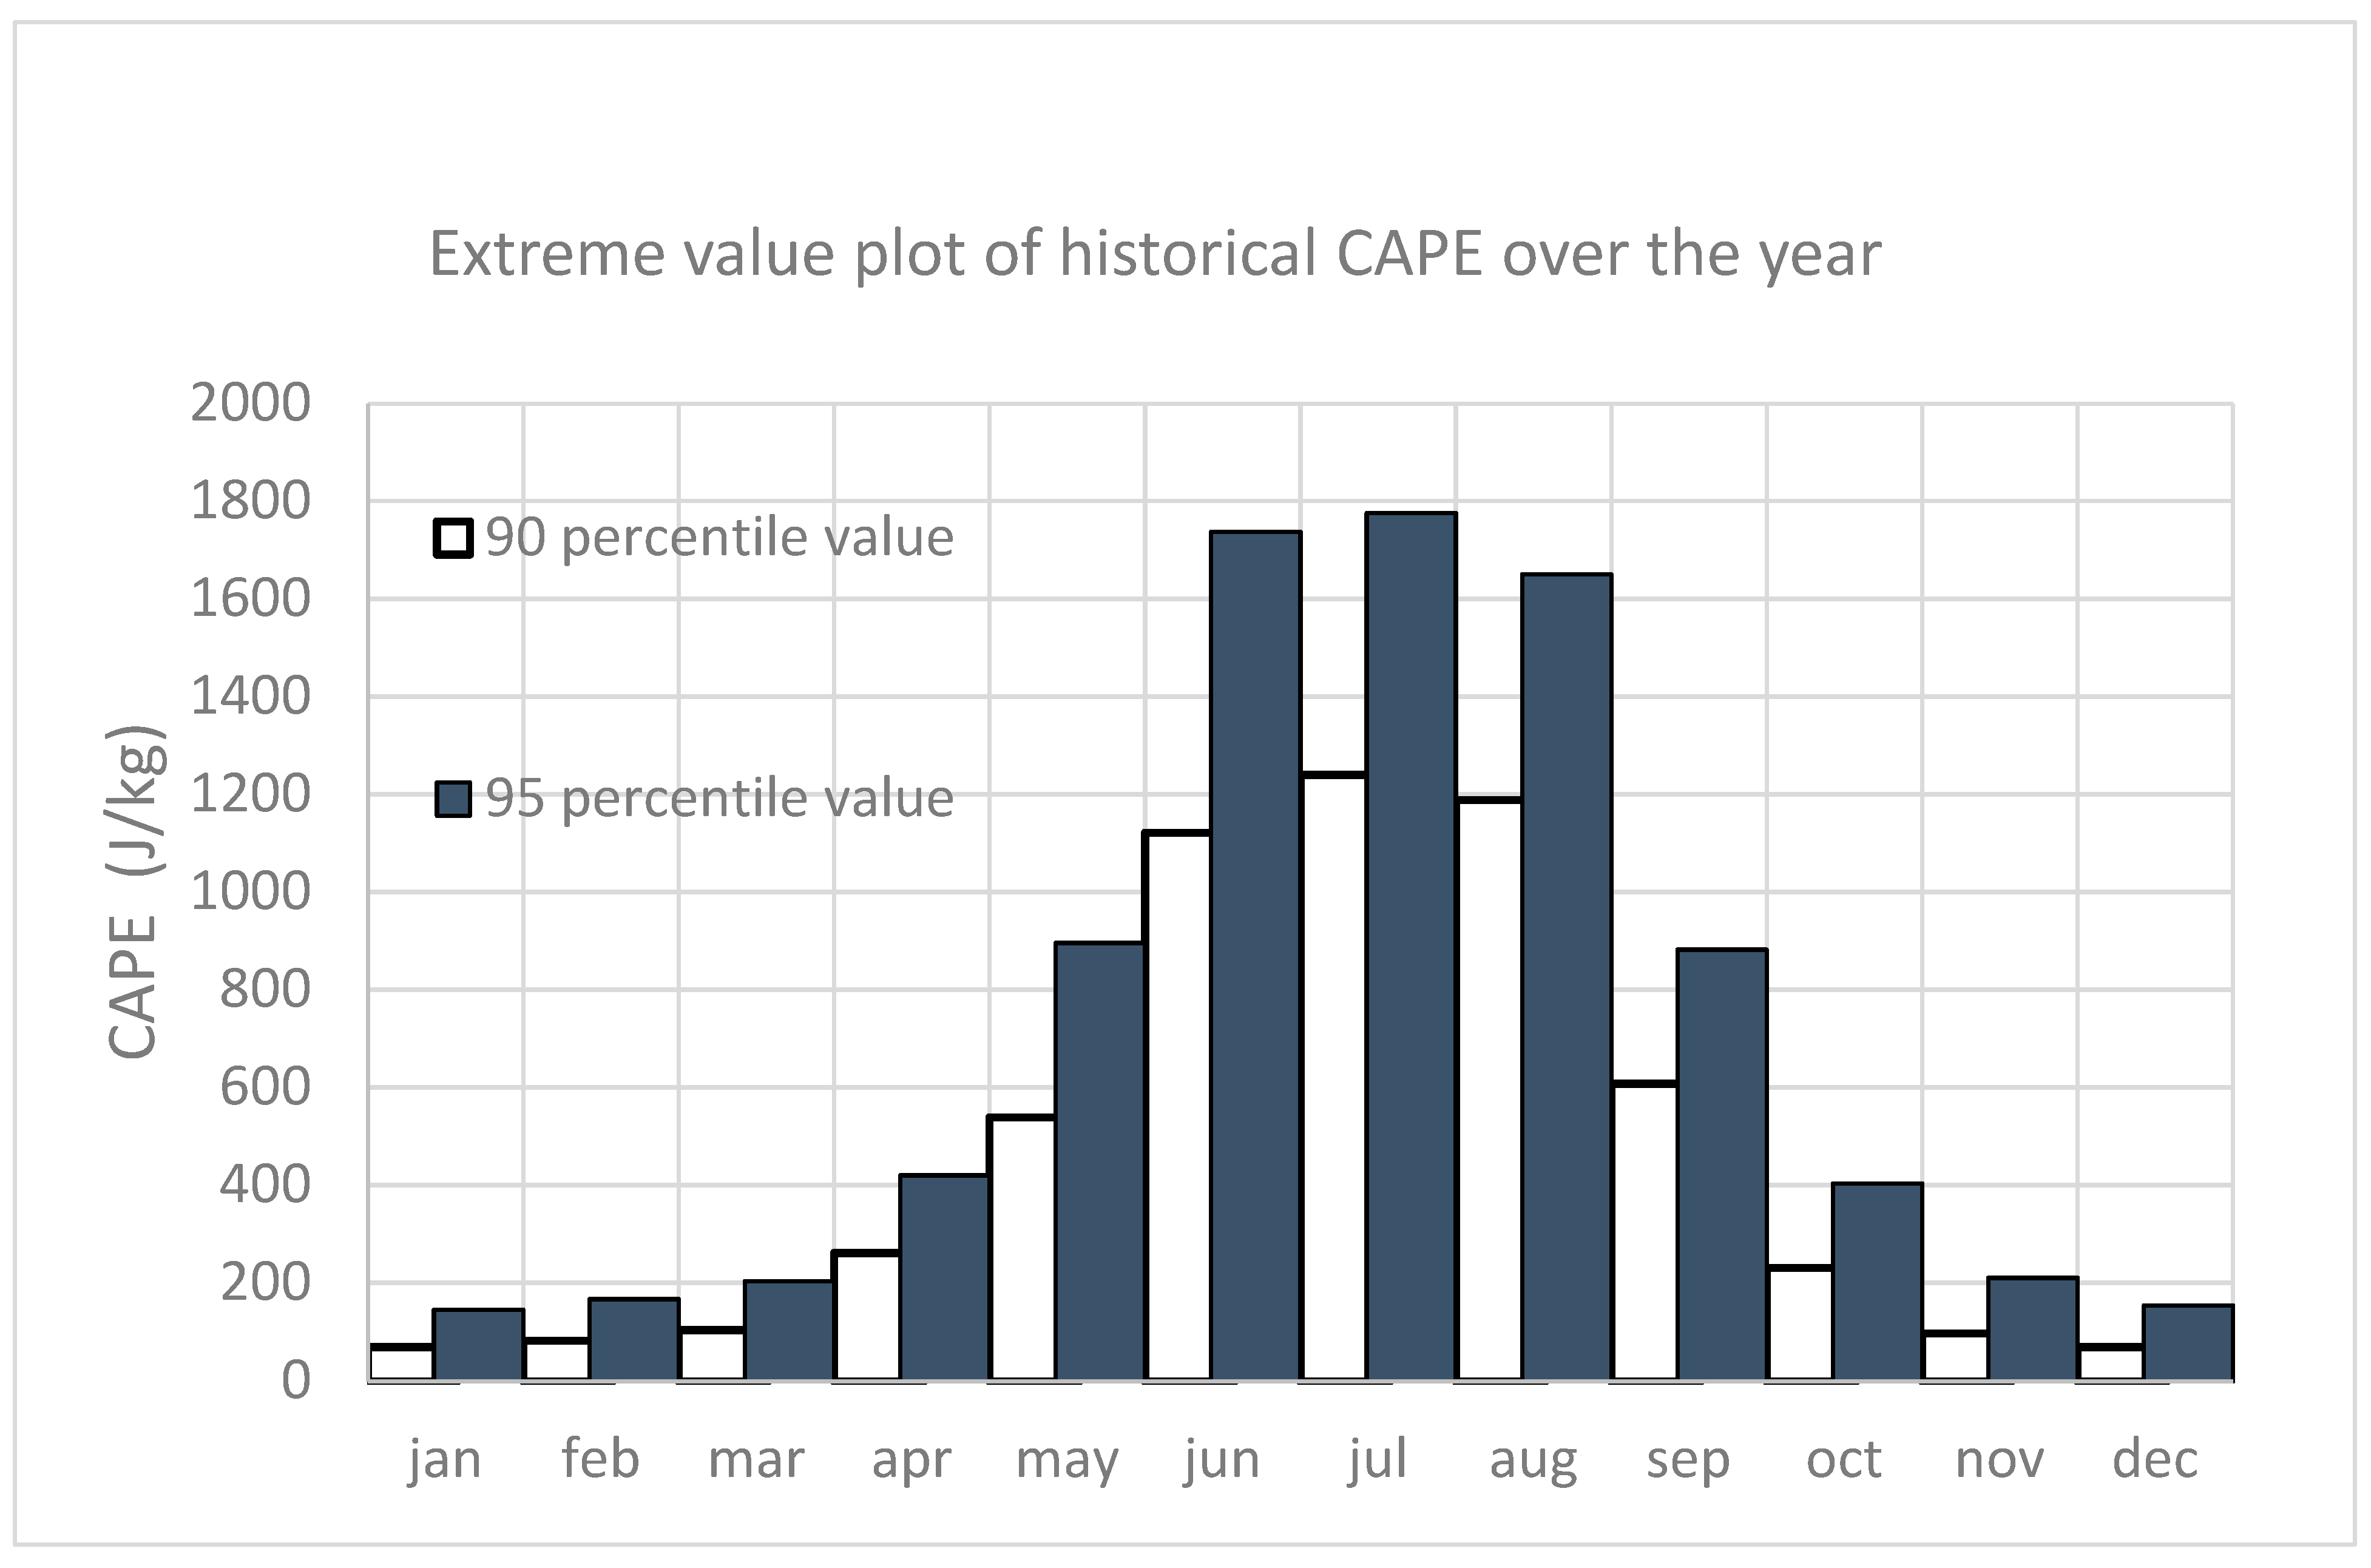
Figure 15.
The evolution of CAPE extremes in future period.
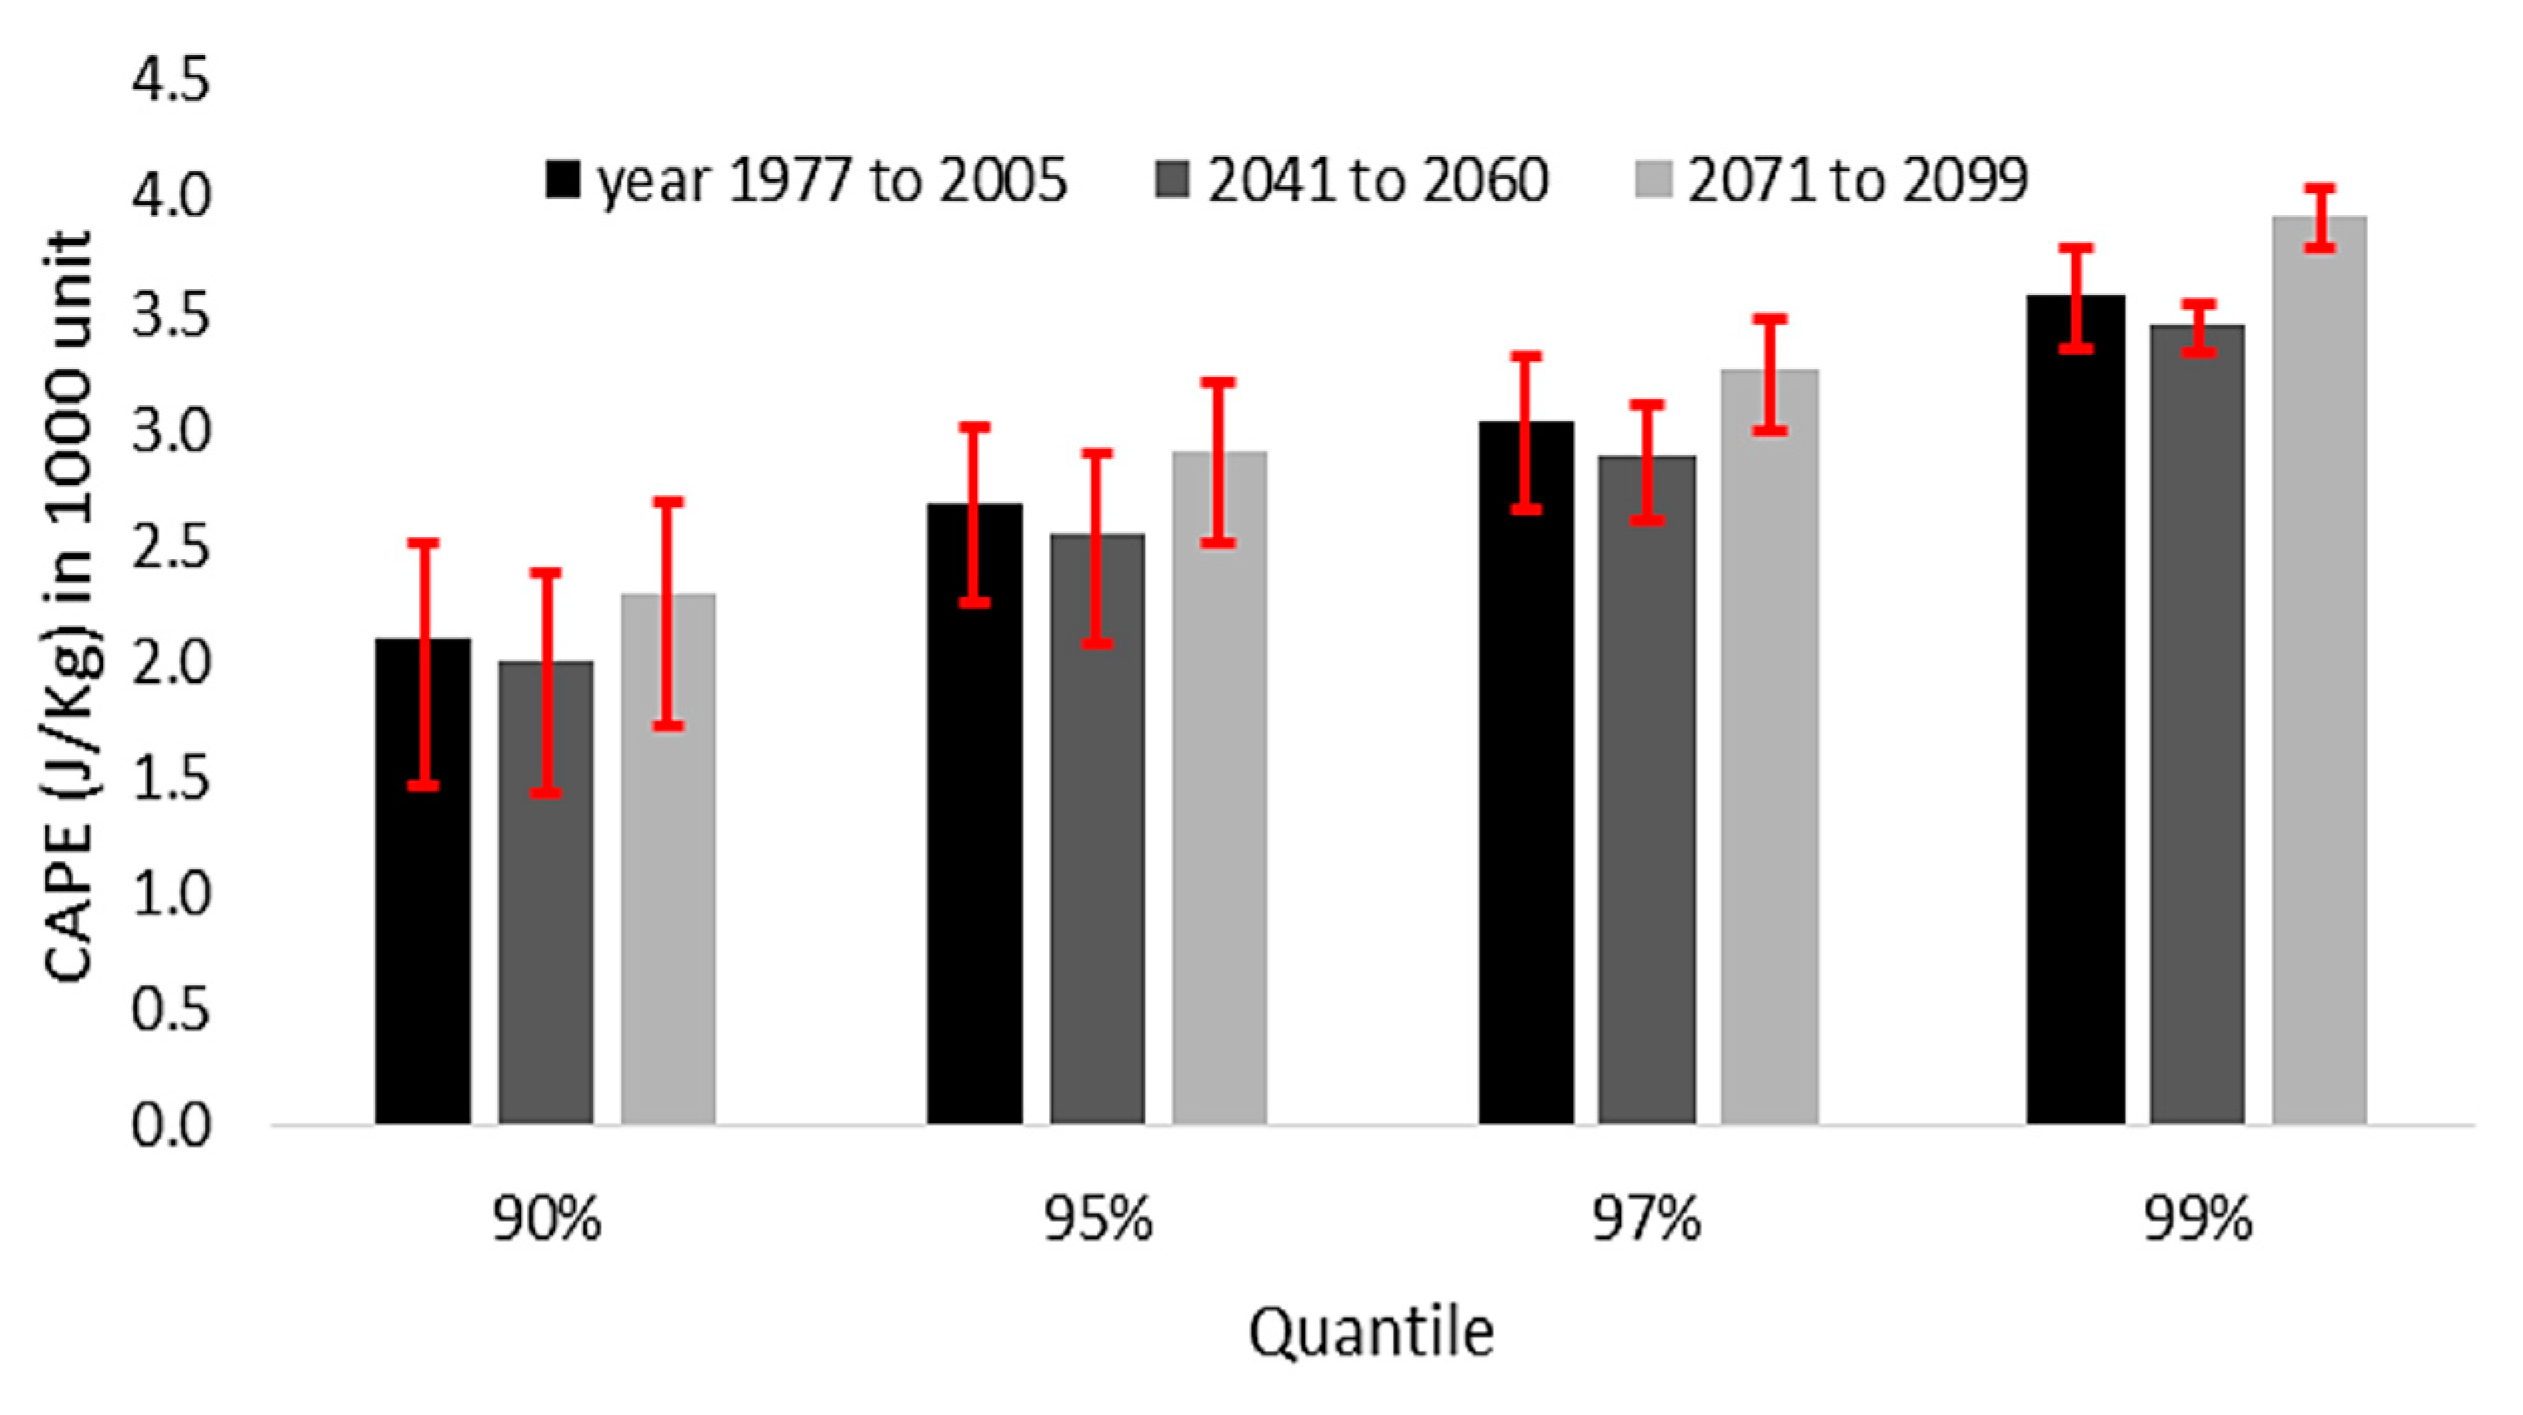
Figure 16.
The STEnvs occur considering the number of days with possibility of severe thunderstorms with %90 confidence interval.
Figure 16.
The STEnvs occur considering the number of days with possibility of severe thunderstorms with %90 confidence interval.
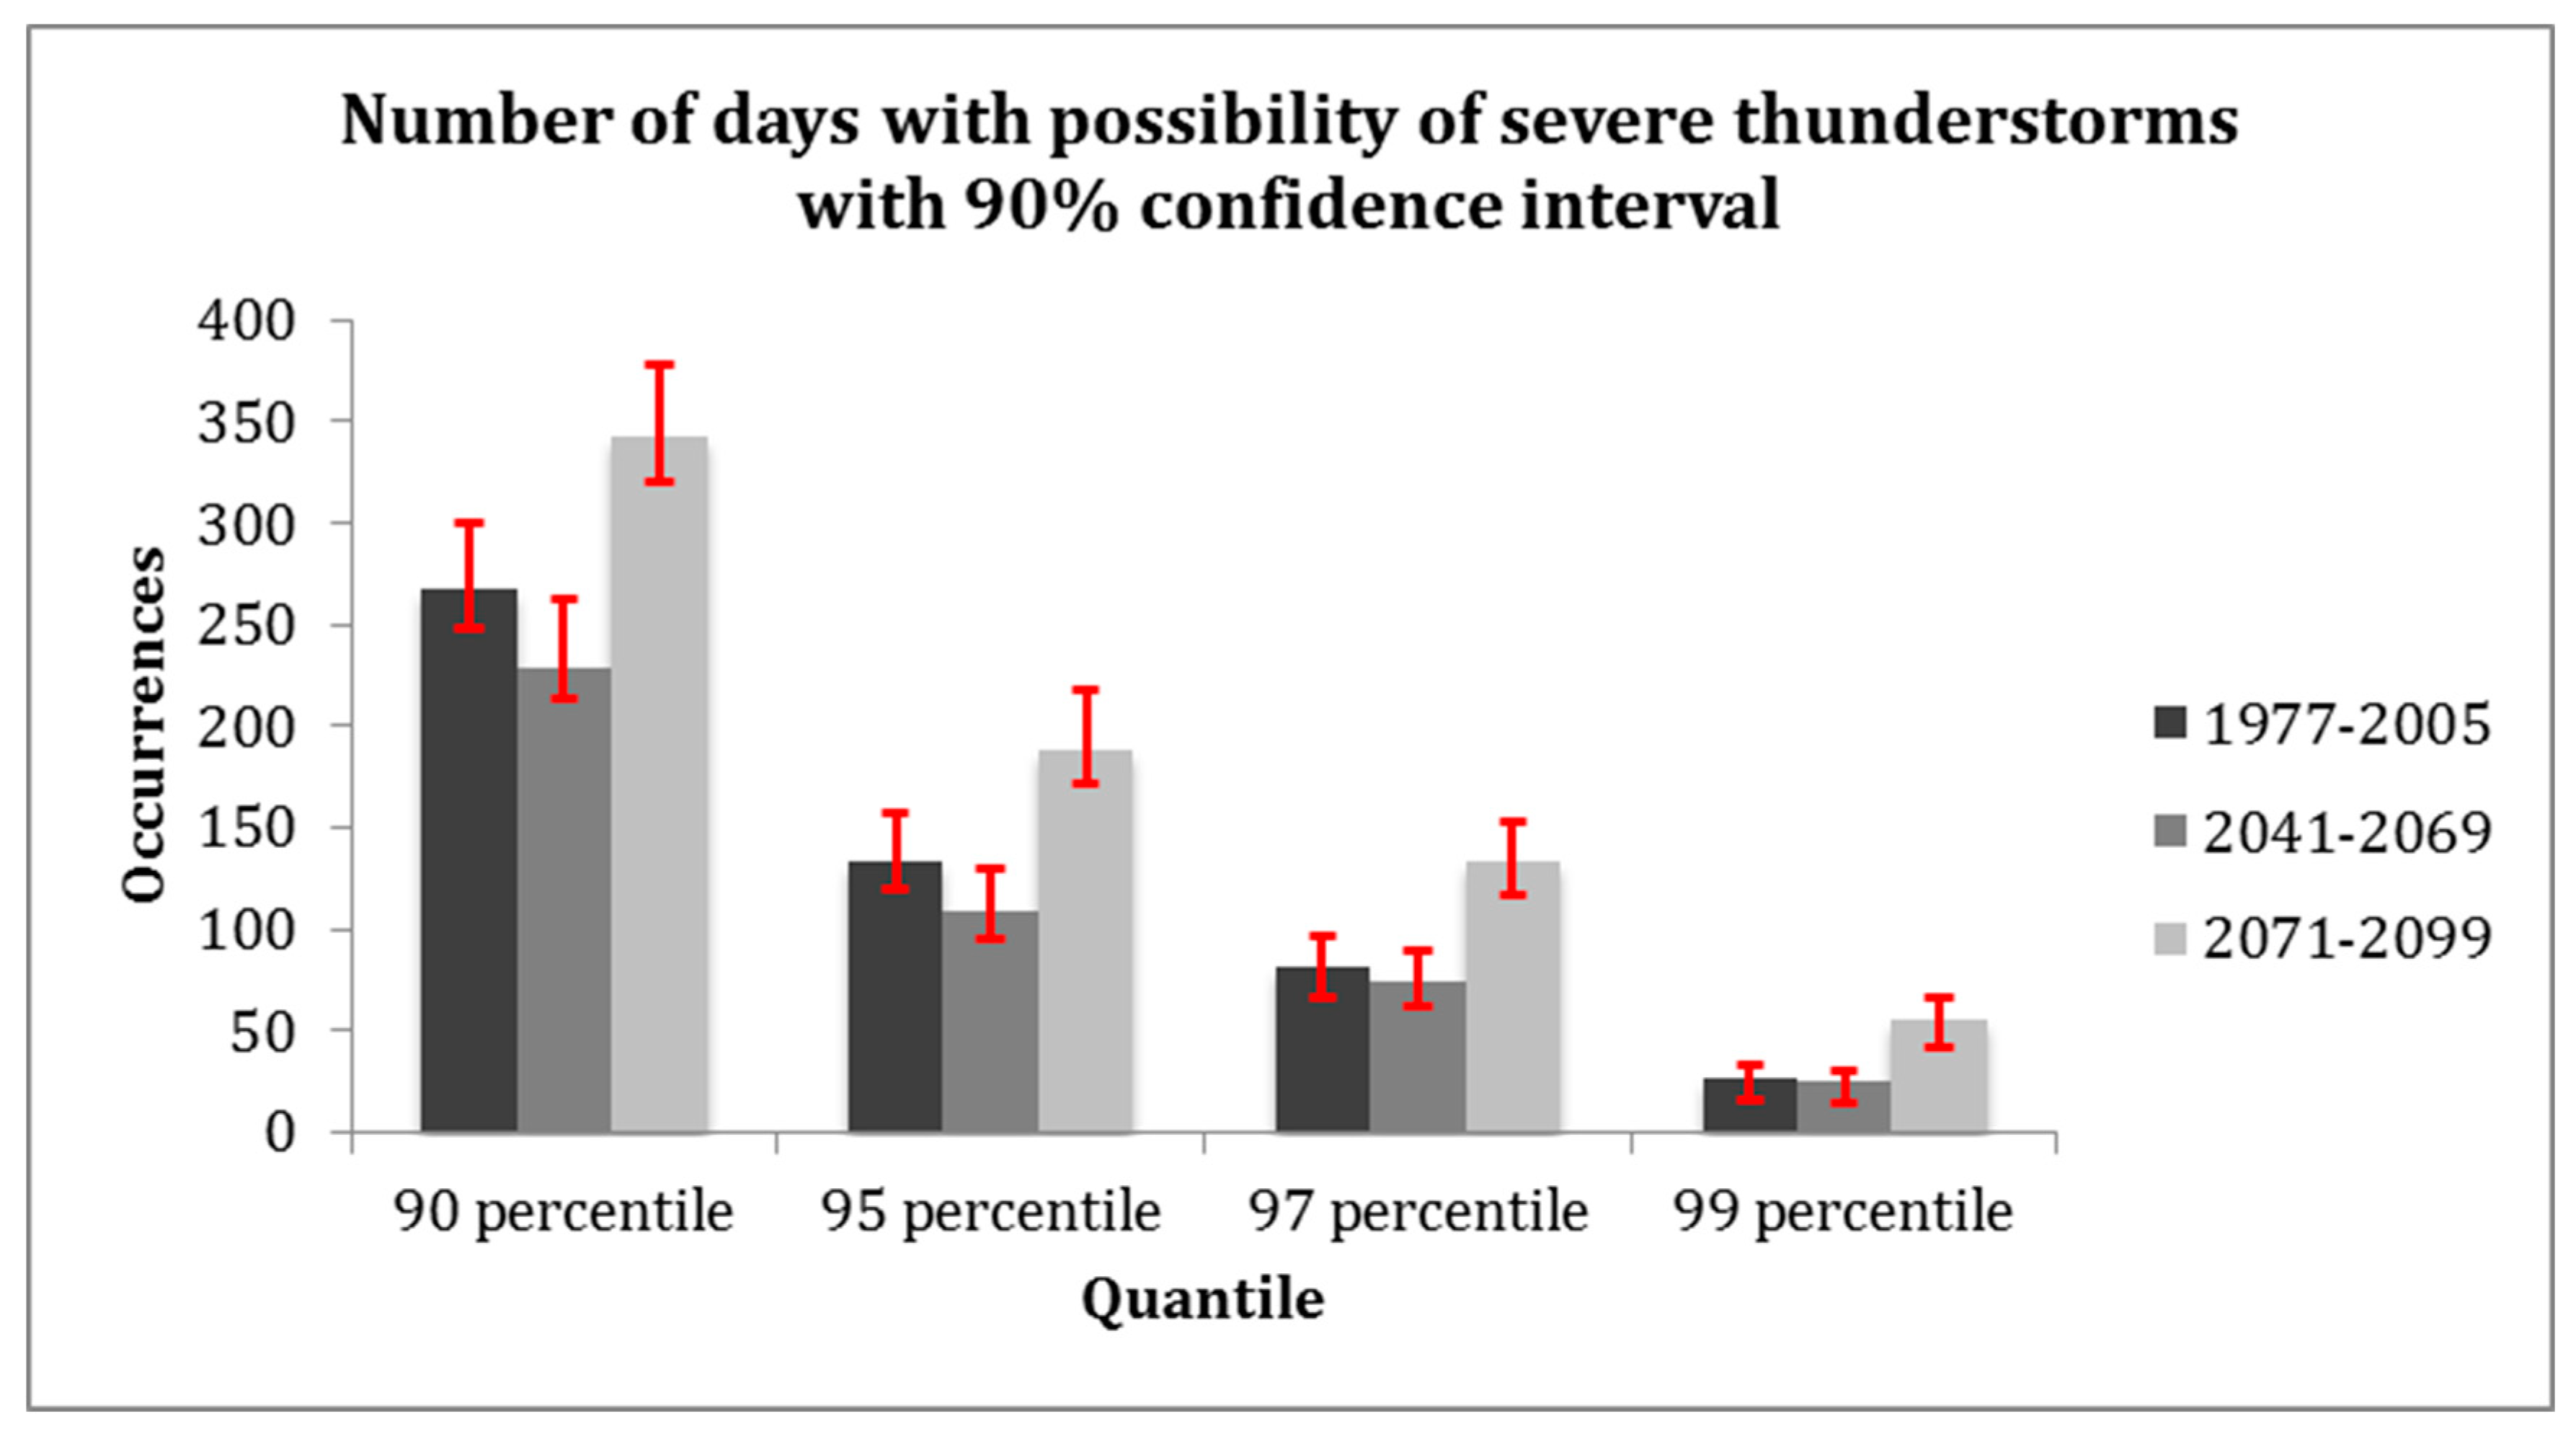
Figure 17.
(a) spatial distribution of CAPE and shear in the historical period (median value). (b) spatial distribution of CAPE and shear in the historical period (97% quantile- extreme value).
Figure 17.
(a) spatial distribution of CAPE and shear in the historical period (median value). (b) spatial distribution of CAPE and shear in the historical period (97% quantile- extreme value).
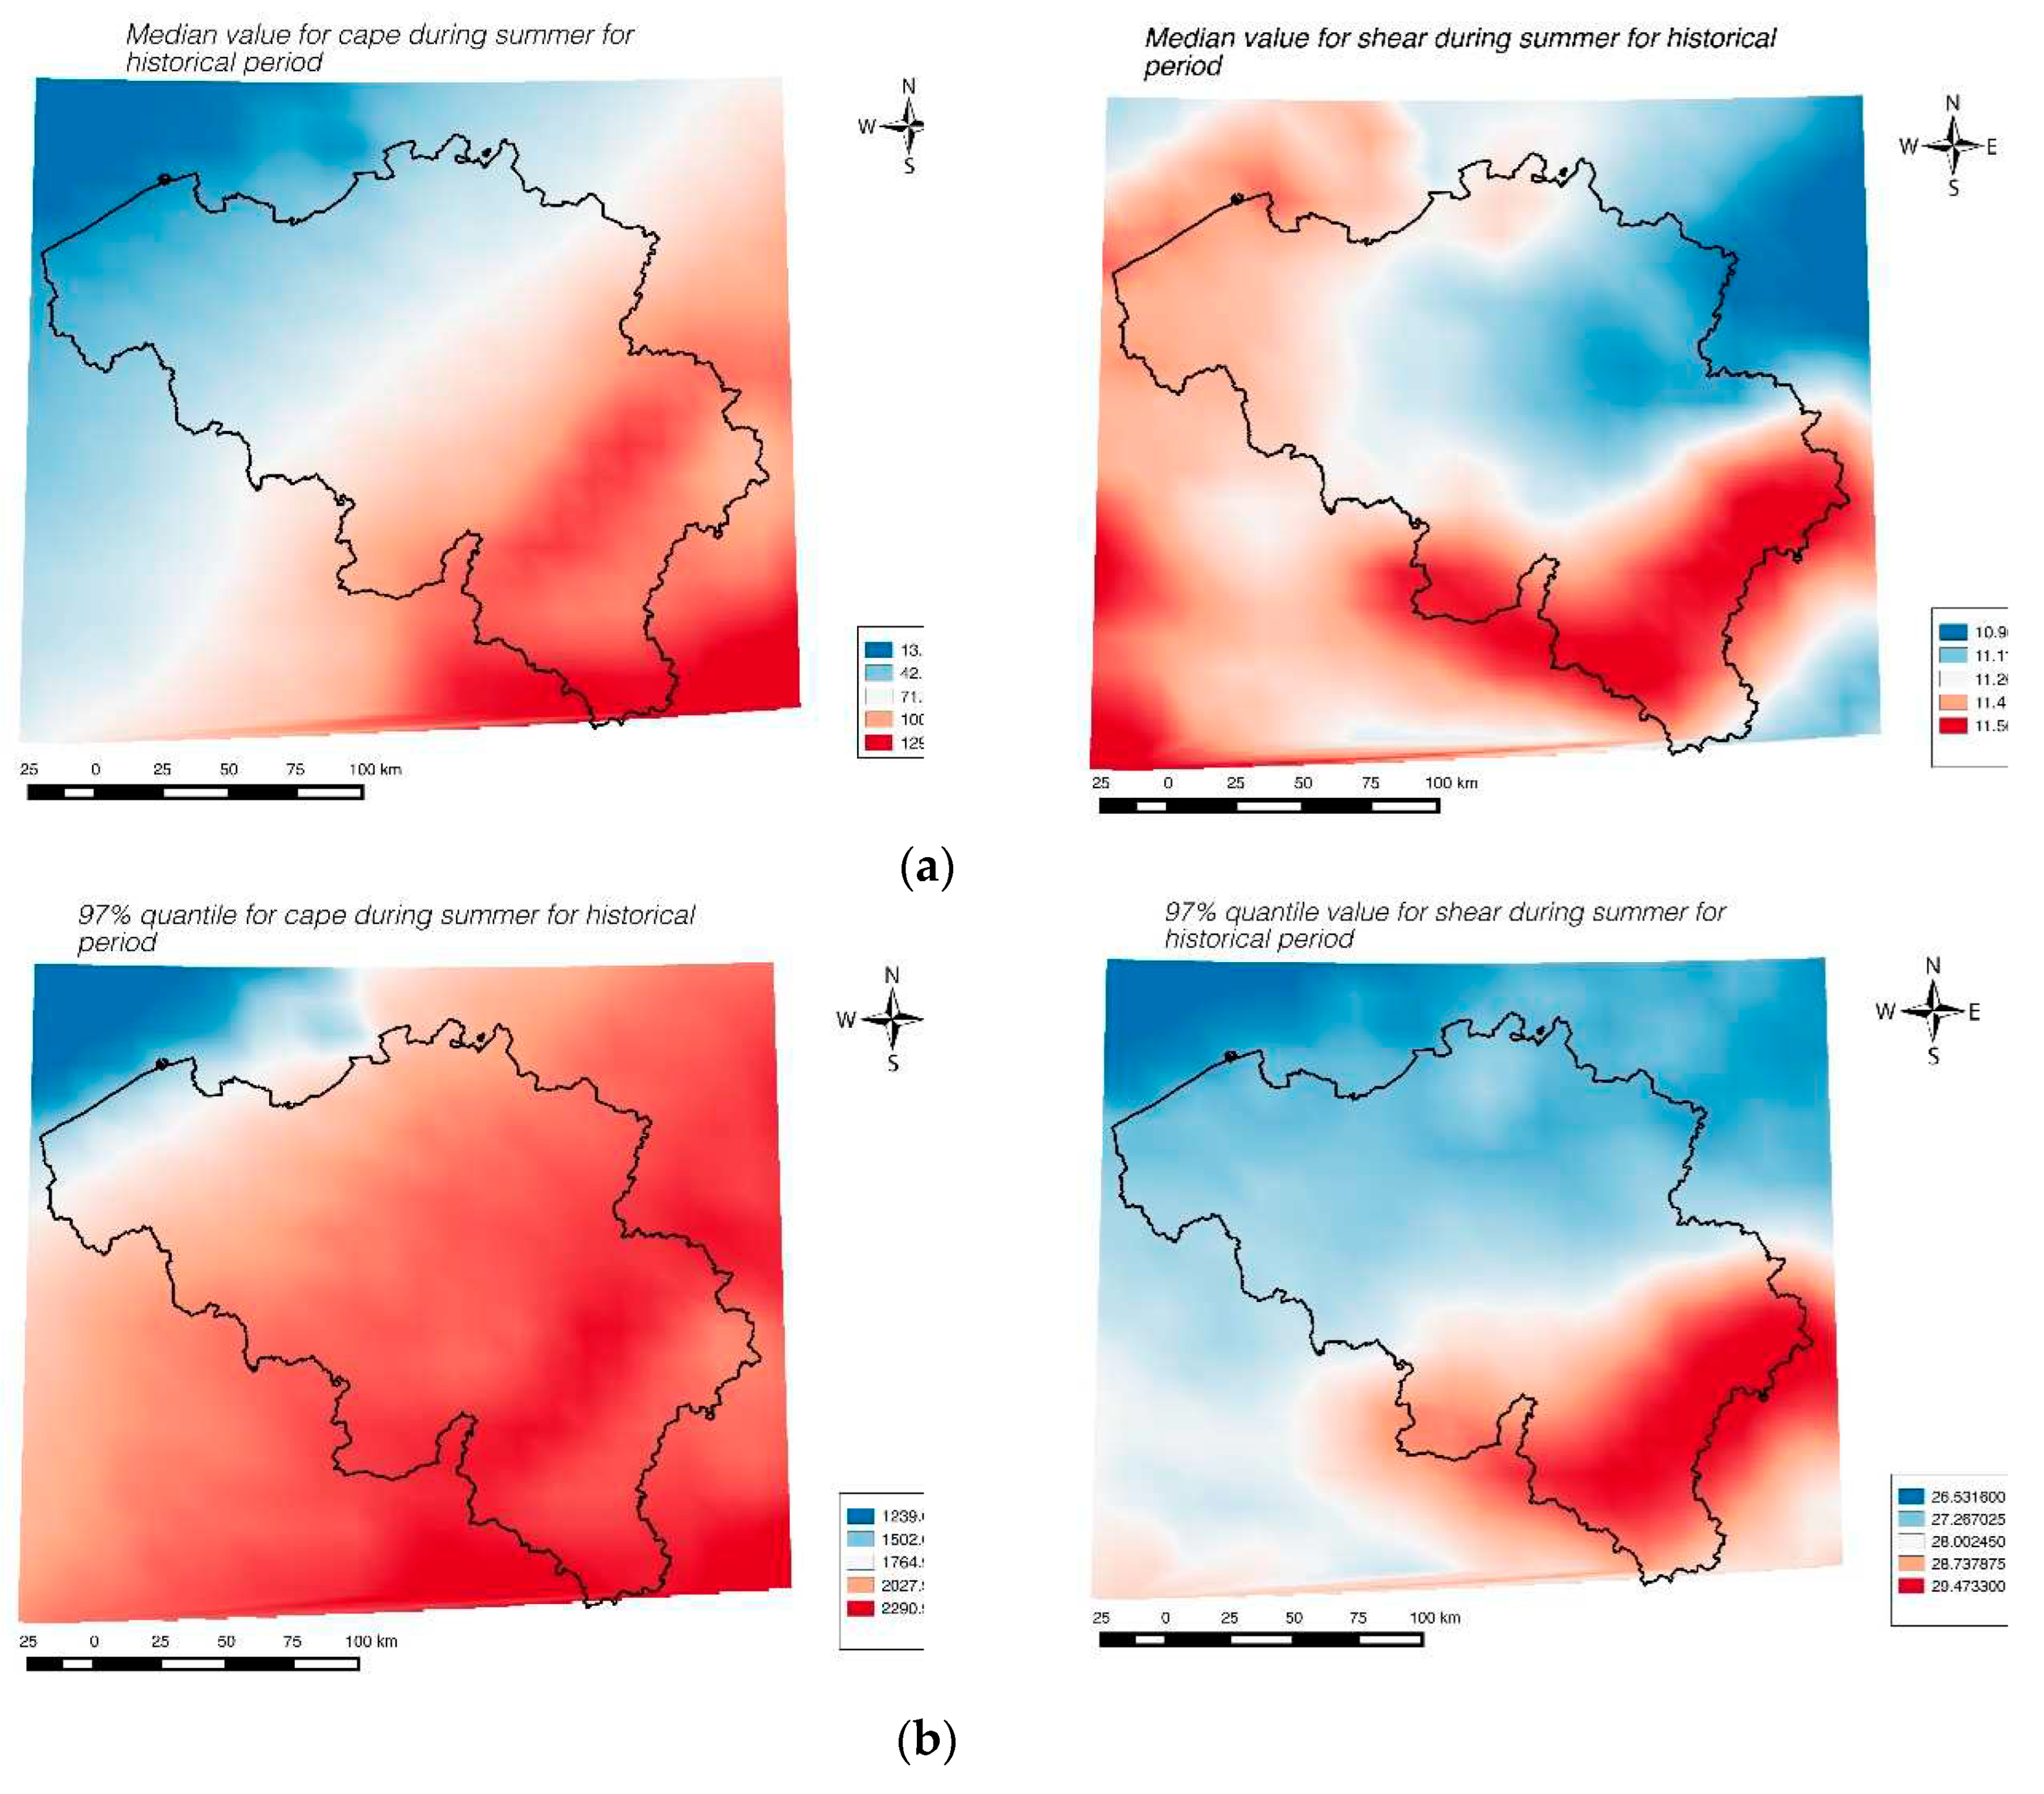
Figure 18.
spatial distribution of STEnv over Belgium (Median value).
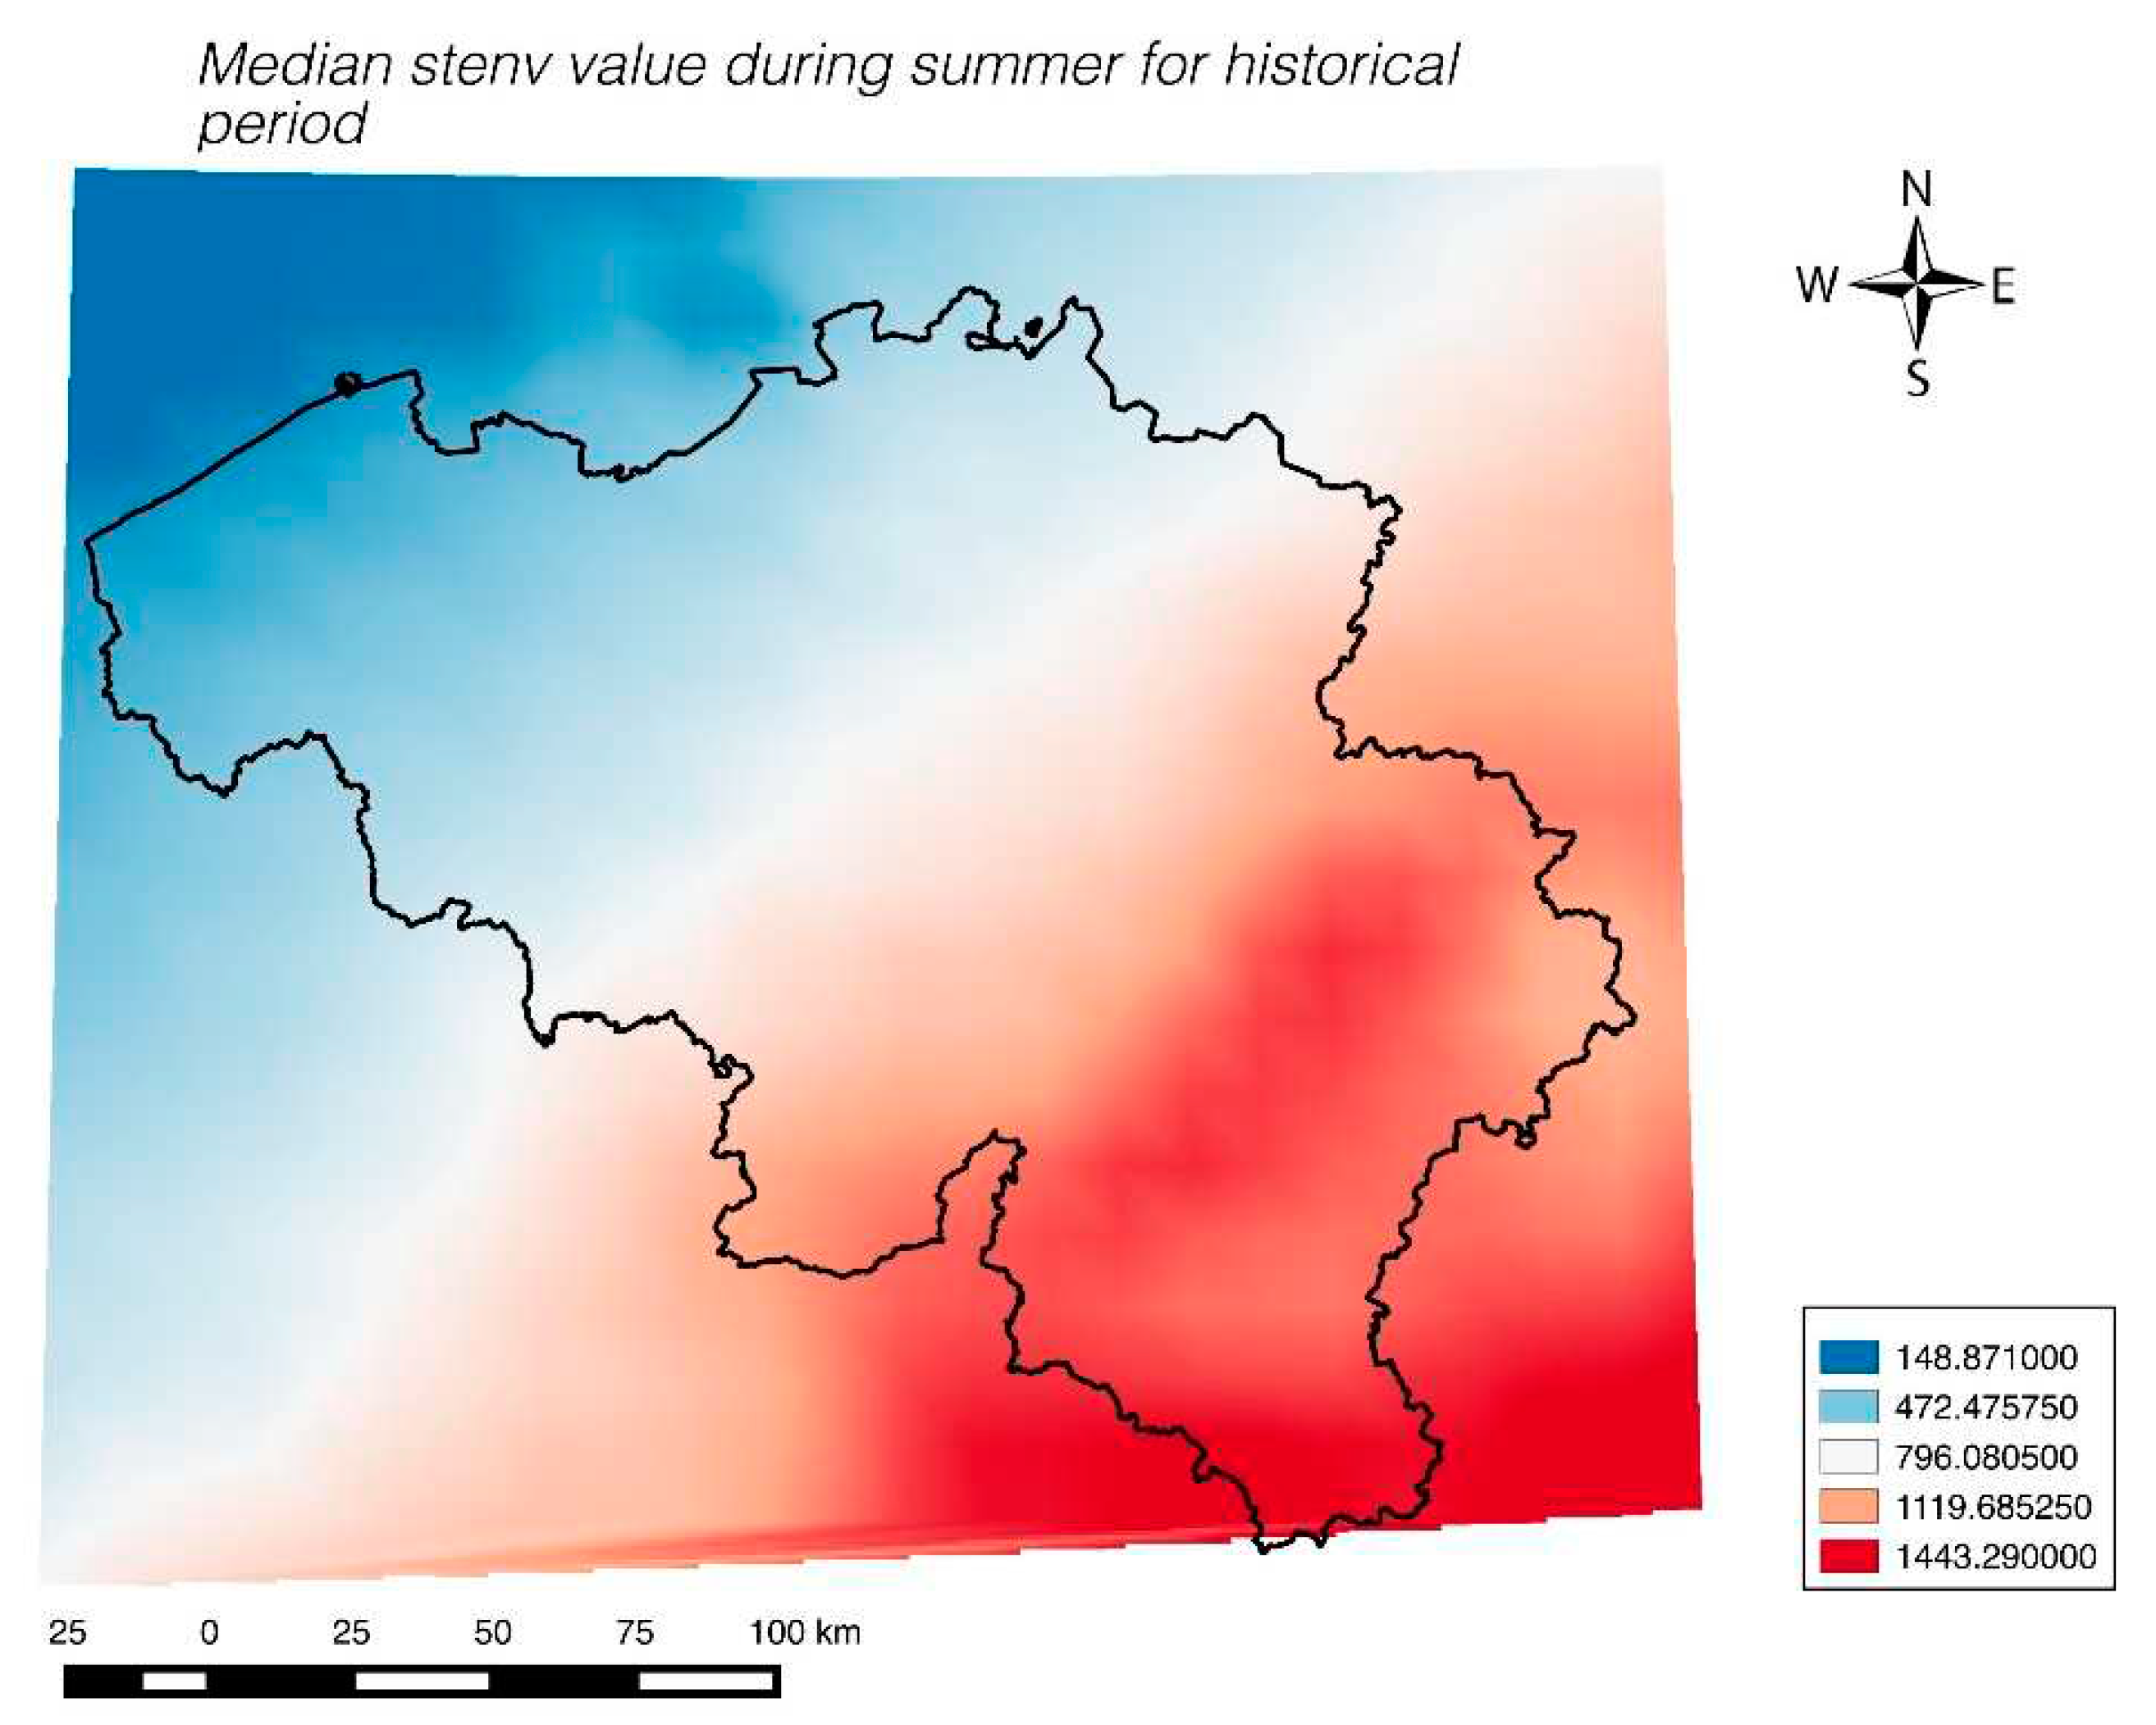
Figure 19.
(a). Spatial distribution of STEnv (median) in 2040-2069 (top) and 2070-2099 (bottom). (b). Spatial distribution of STEnv (97% quantile) in 2040-2069 (top) and 2070-2099 (bottom).
Figure 19.
(a). Spatial distribution of STEnv (median) in 2040-2069 (top) and 2070-2099 (bottom). (b). Spatial distribution of STEnv (97% quantile) in 2040-2069 (top) and 2070-2099 (bottom).
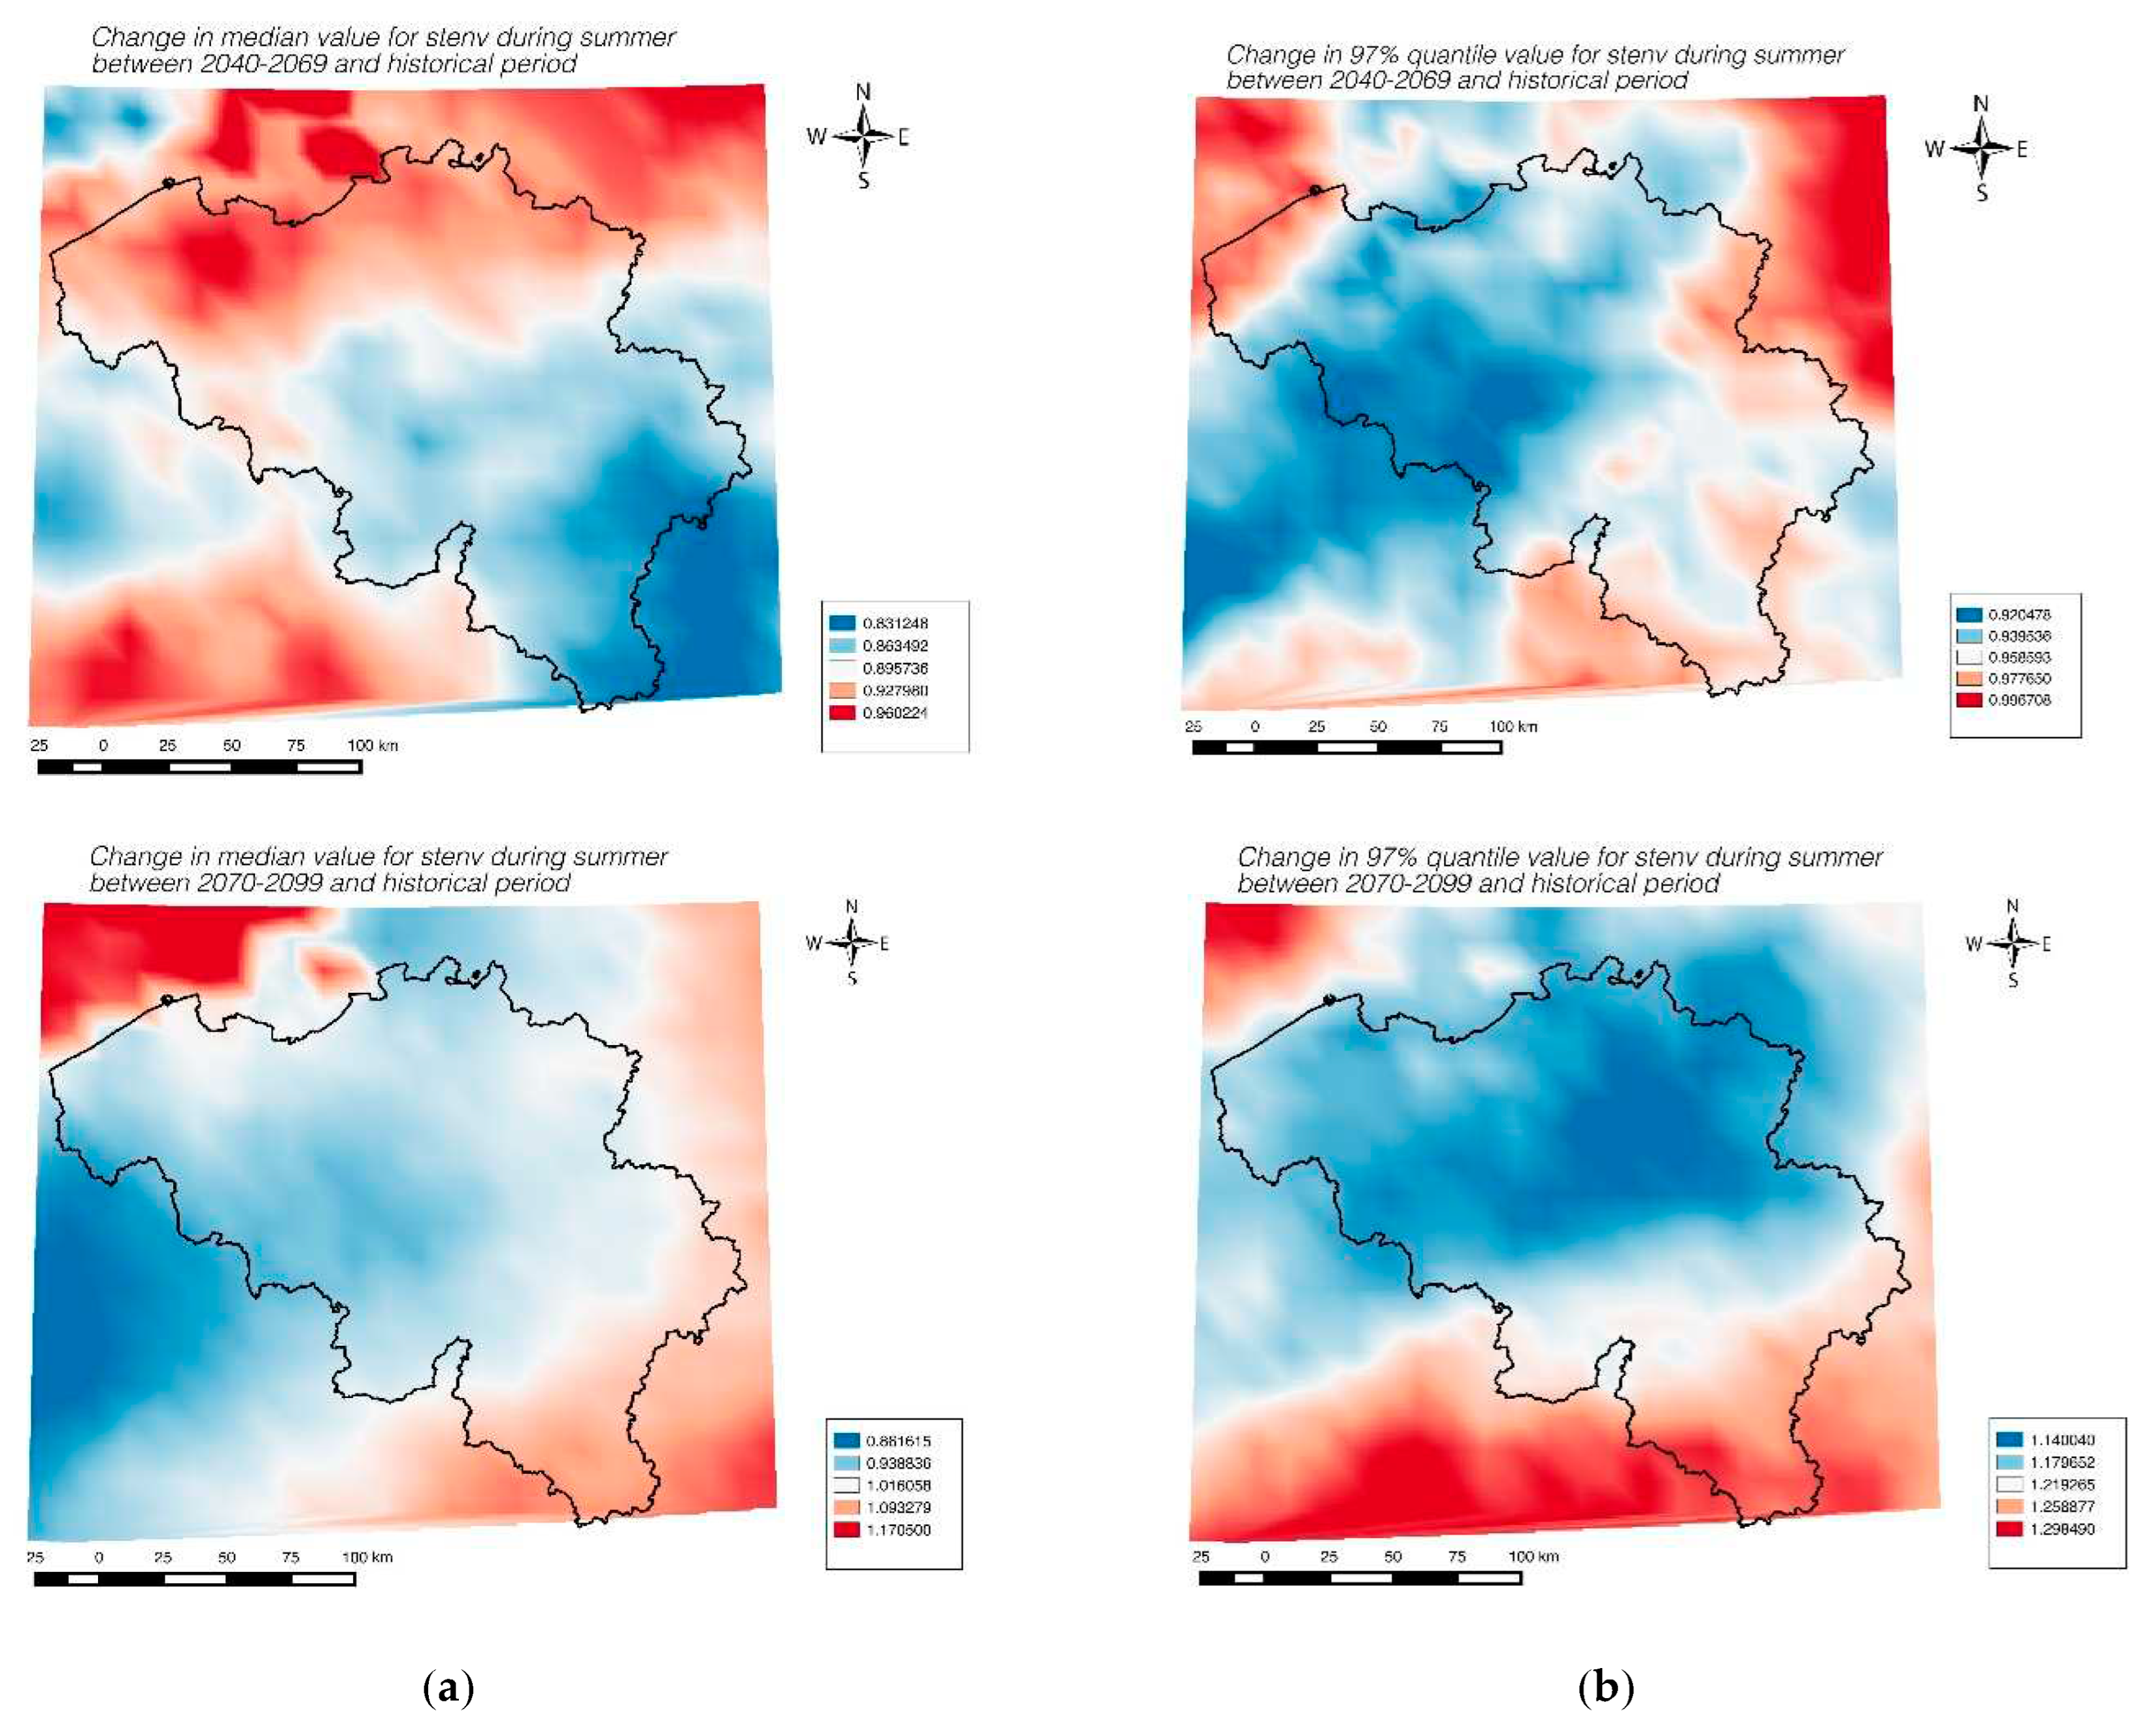
Figure 20.
Occurrence of STEnv over selected 97% extreme threshold in present (top left), near future (top right) and far future (below).
Figure 20.
Occurrence of STEnv over selected 97% extreme threshold in present (top left), near future (top right) and far future (below).
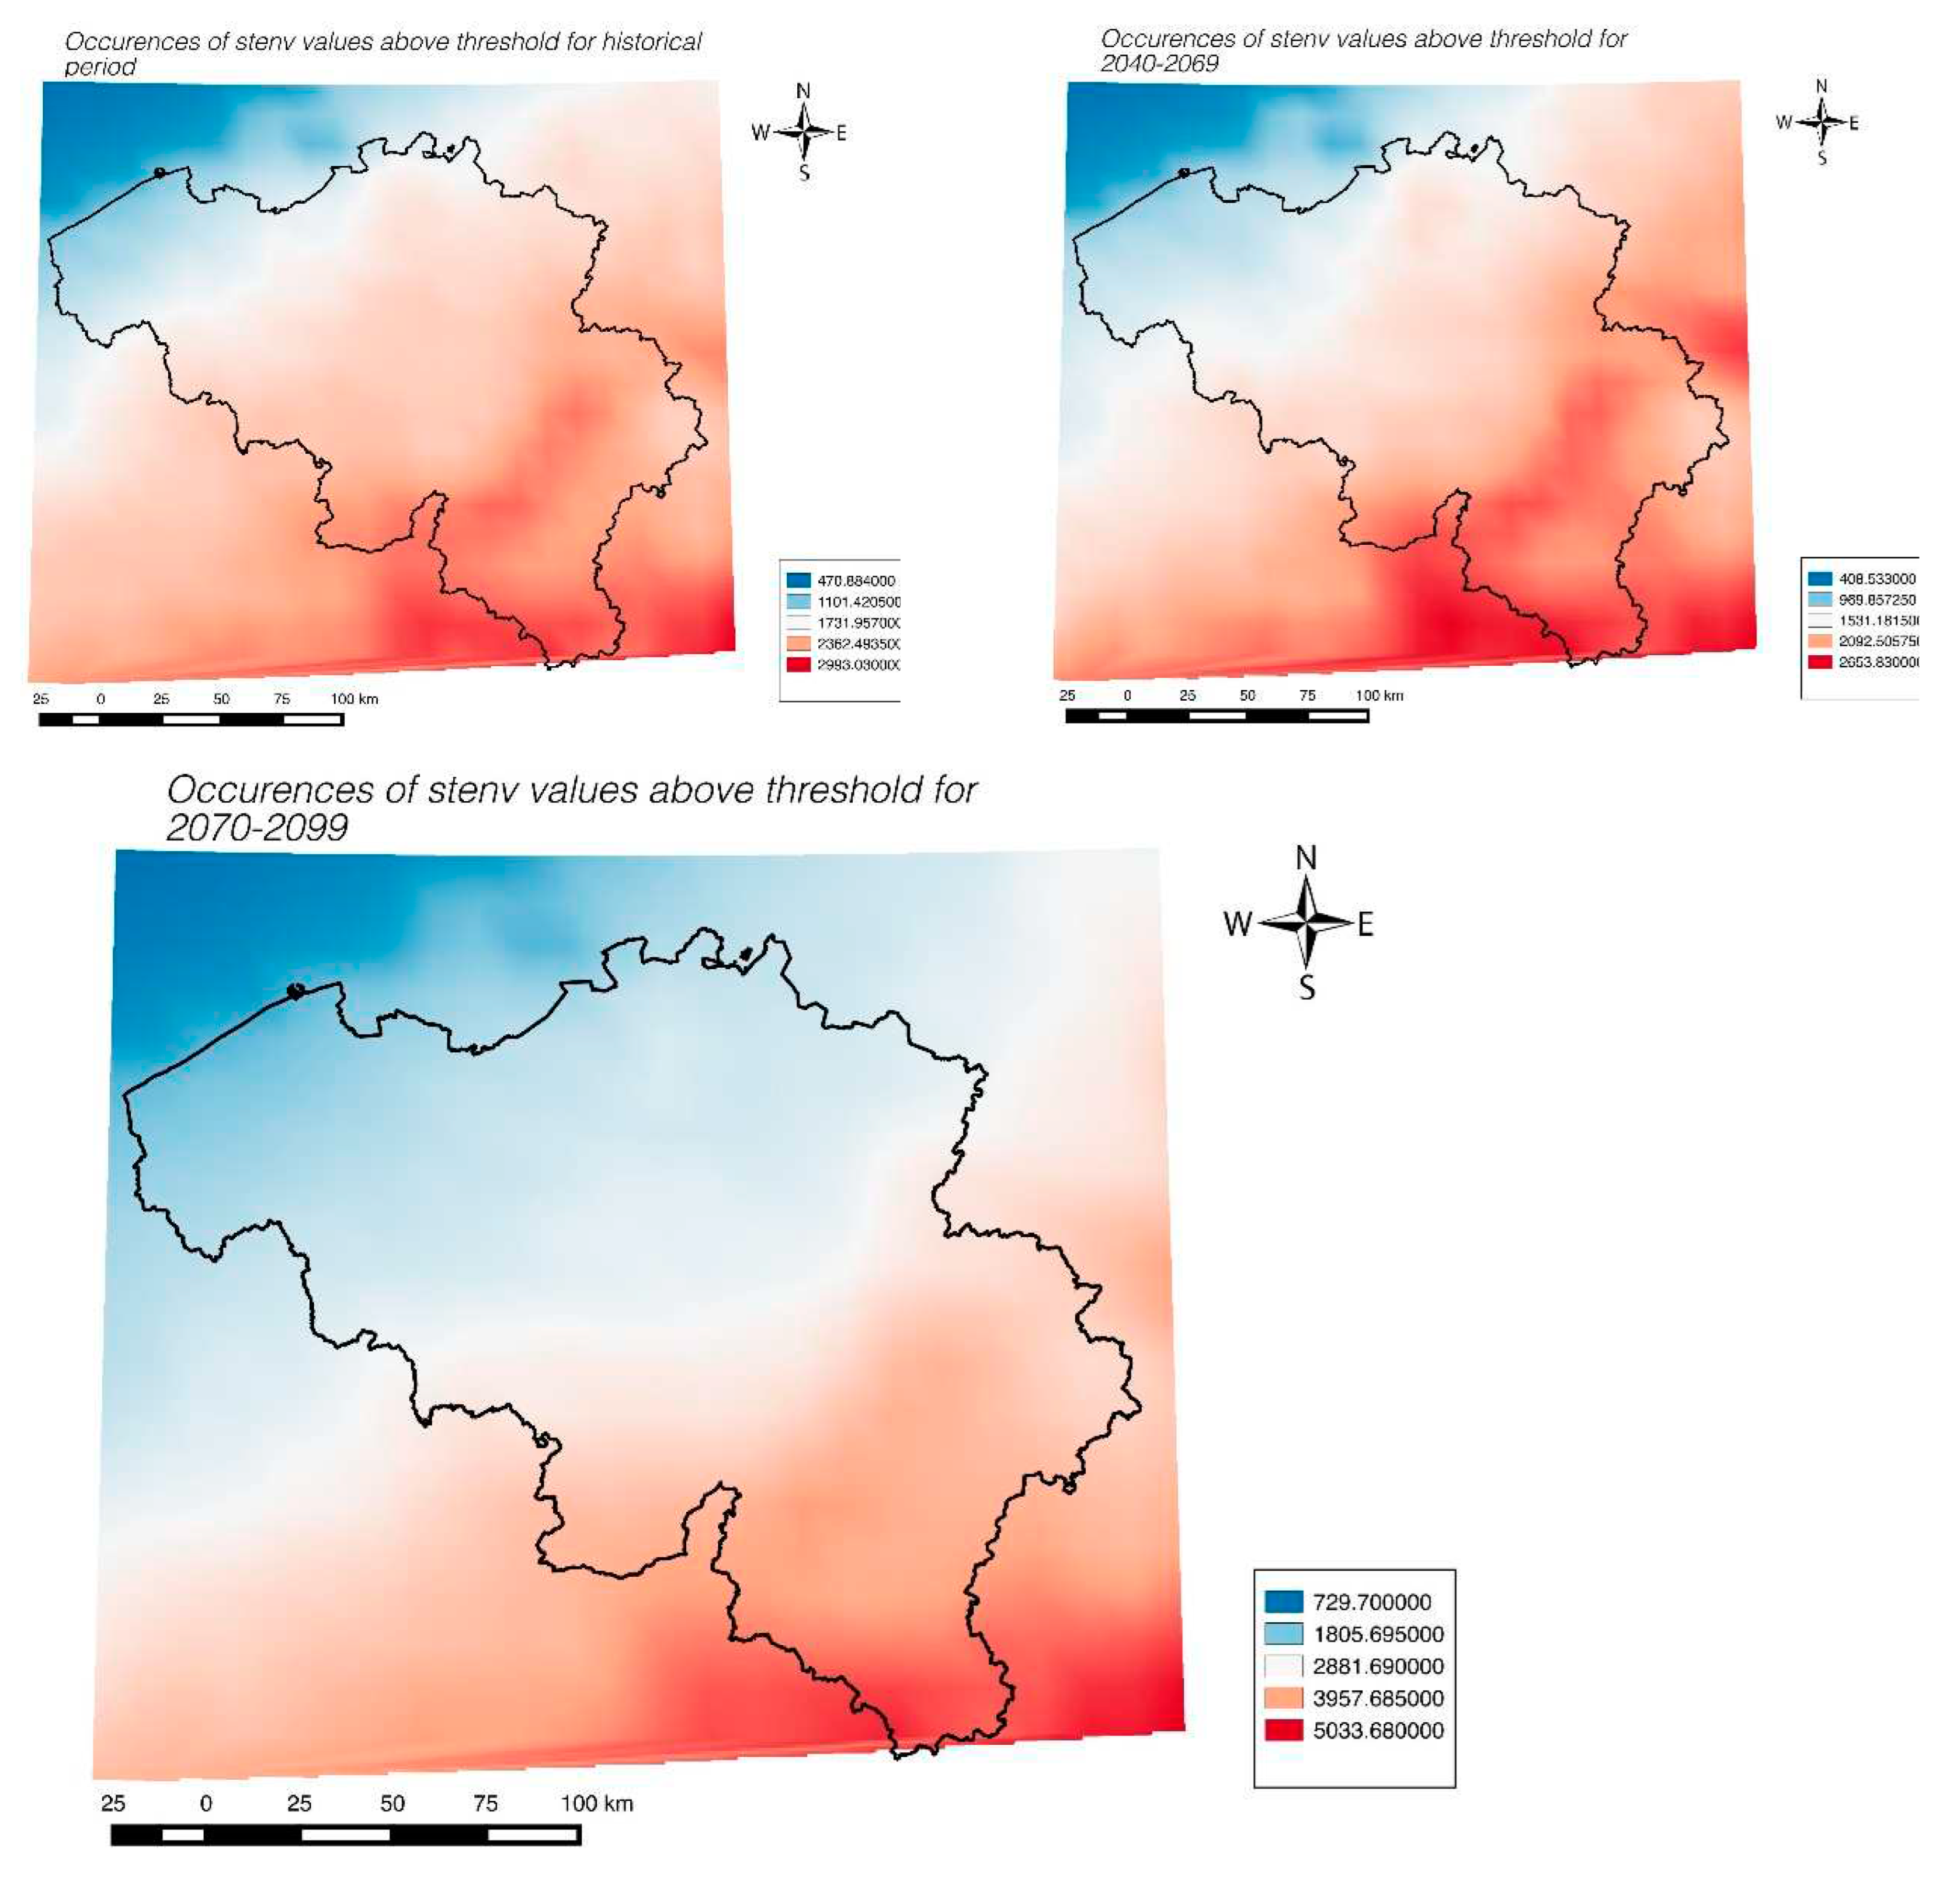
Figure 21.
The evolution in the occurrence of most severe thunderstorms between (1977-2005) and (2071-2099): (a) 5% most extreme cases (b) 3% most extreme cases
Figure 21.
The evolution in the occurrence of most severe thunderstorms between (1977-2005) and (2071-2099): (a) 5% most extreme cases (b) 3% most extreme cases
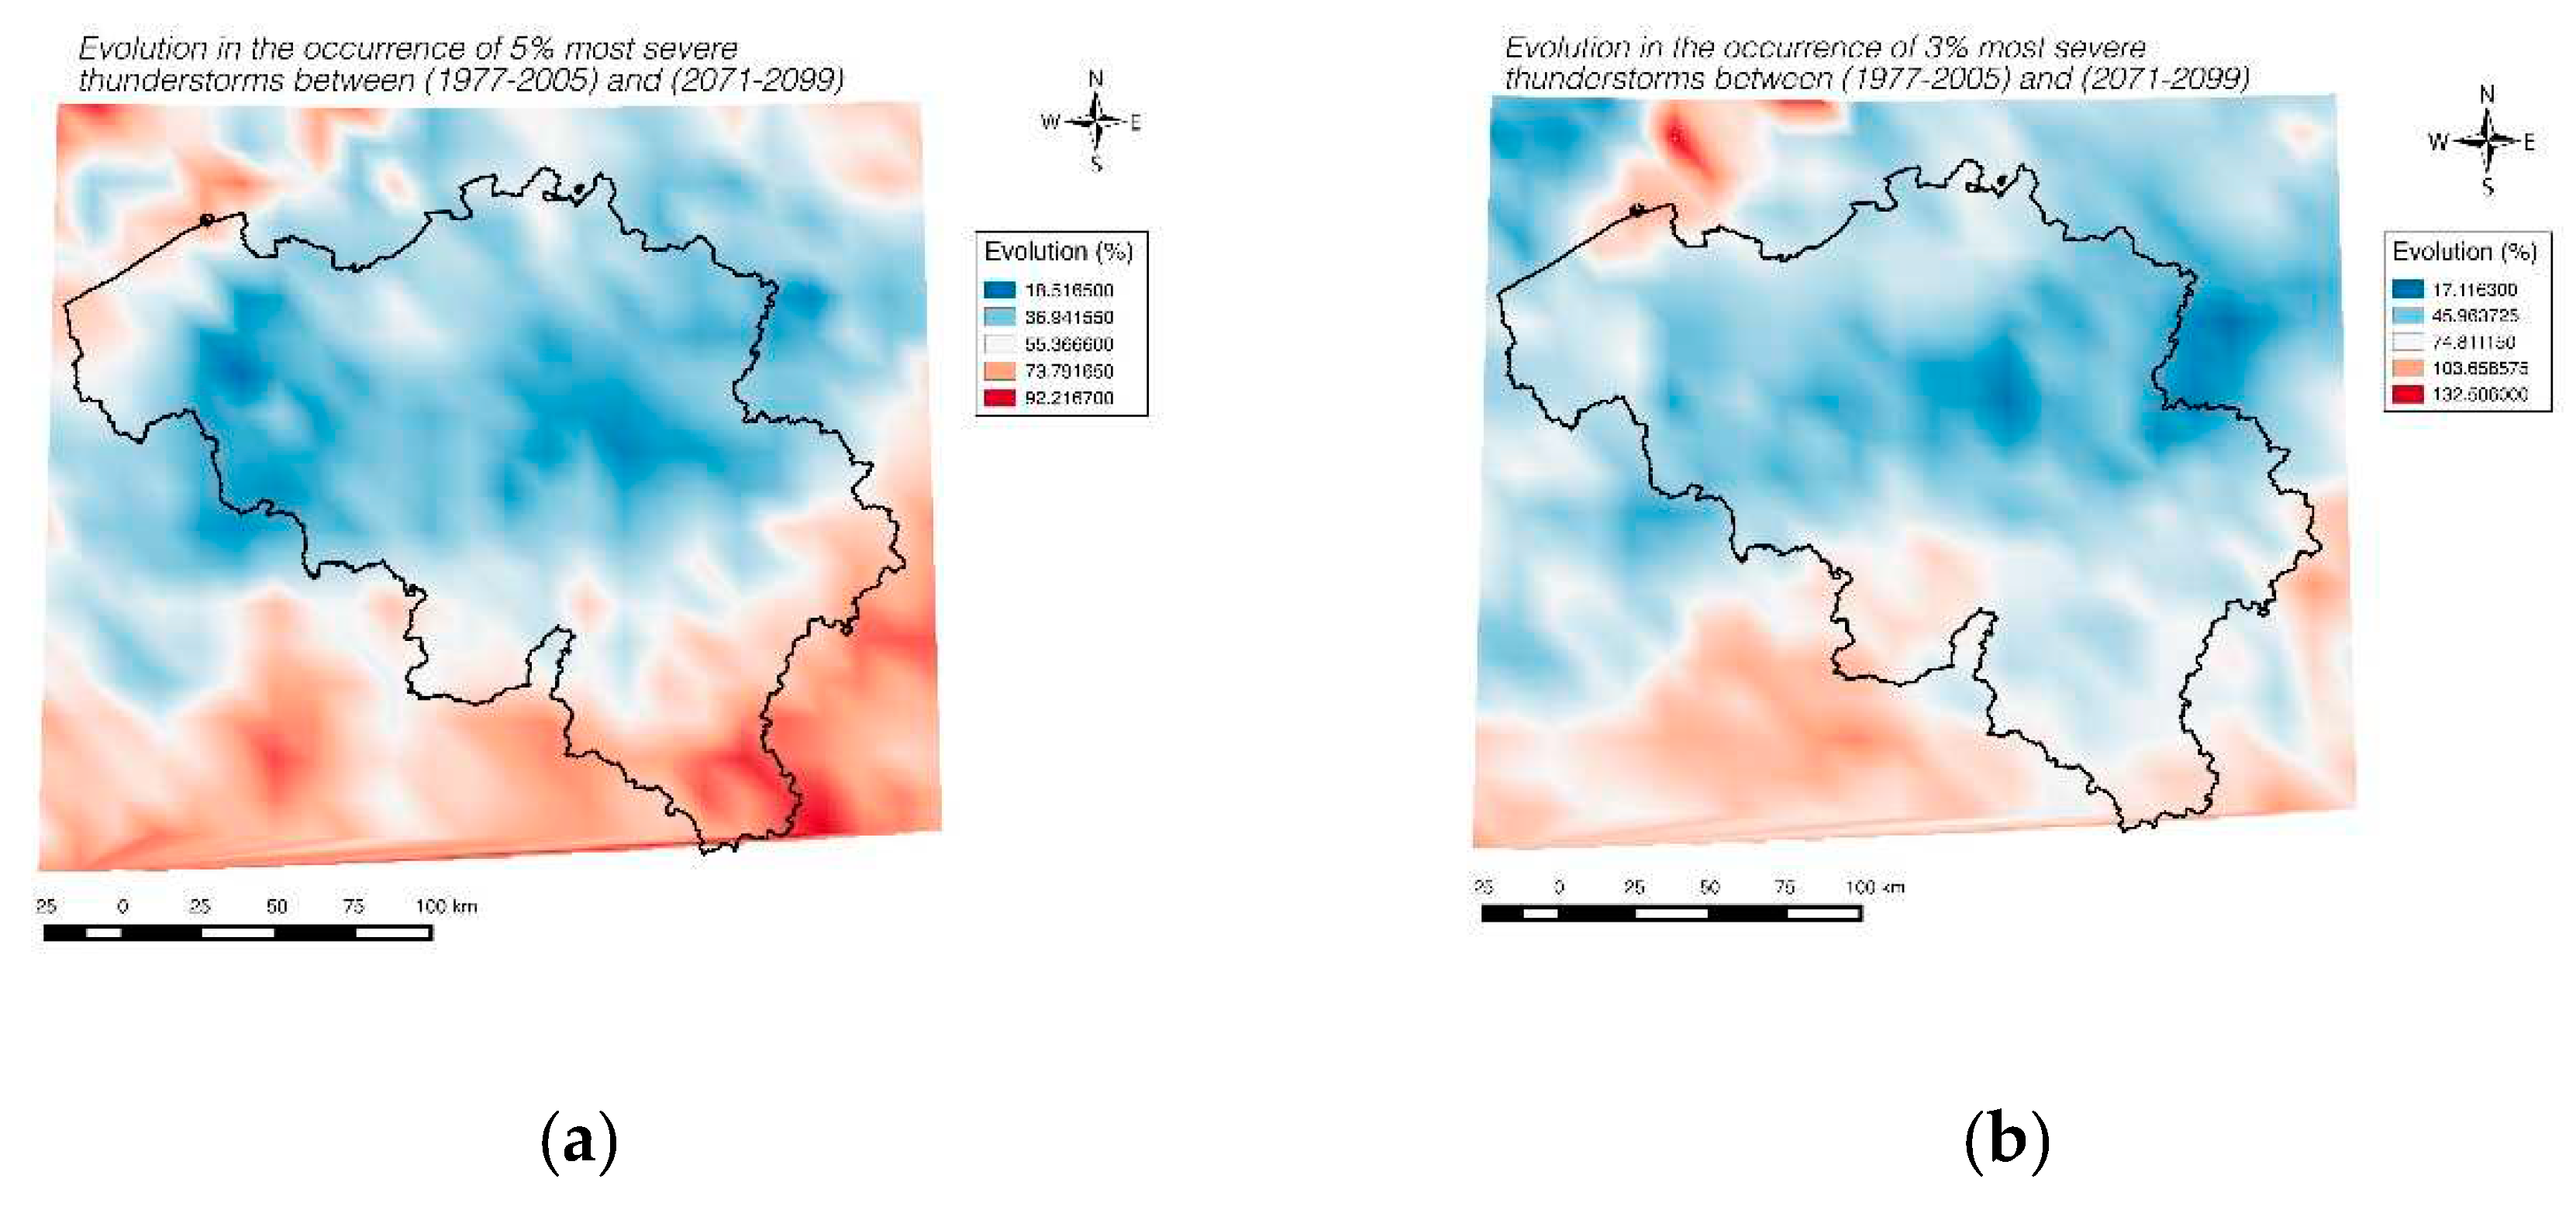

Table 1.
Selection of 12x11 grid as representative grid.
| Statistics | Entire grid Shear (historical) | 12x11 grid shear (historical) |
Entire grid CAPE (historical) | 12x11 grid CAPE (historical) |
|---|---|---|---|---|
| 90% quantile (summer) | 27.83 | 28.07 | 2105.8 | 2154.5 |
| Median (summer) | 16.13 | 16.17 | 519.25 | 538.92 |
Table 2.
Analysis of extreme wind shear in historical and future climate.
| Time Period | Maximum Shear value range in 90% quantile with mean value (--) in m/sec | Maximum Shear value range in 95% quantile with mean value (--) in m/sec | Maximum Shear value range in 97% quantile with mean value (--) in m/sec | Maximum Shear value range in 99% quantile with mean value (--) in m/sec |
| 1977 to 2005 | 27.2- 28.2 (27.8) | 31-31.7 (31.4) | 33.2-33.8 (33.5) | 37.1-37.3 (37.2) |
| 2041 to 2069 | 26.5- 27.5 (27.1) | 30.3-31 (30.7) | 32.7-33.3 (33) | 36.8-37 (36.9) |
| 2071 to 2099 | 26.4-27.4 (27) | 30.1-30.8 (30.5) | 32.5-33.1 (32.8) | 37.4-37.6 (37.5) |
Table 3.
Analysis of extreme CAPE in historical and future climate.
| Time Period | Maximum CAPE value range in 90% quantile with mean value (--) in J/kg | Maximum CAPE value range in 95% quantile with mean value (--) in J/kg | Maximum CAPE value range in 97% quantile with mean value (--) in J/kg | Maximum CAPE value range in 99% quantile with mean value (--) in J/kg |
| 1977 to 2005 | 1466- 2516 (2106) | 2258-3008 (2688) | 2652-3322 (3032) | 3353-3783 (3583) |
| 2041 to 2069 | 1360-2410 (2000) | 2125-2875 (2555) | 2504-3174 (2884) | 3217-3647 (3447) |
| 2071 to 2099 | 1659-2709 (2299) | 2472-3222 (2902) | 2880-3550 (3260) | 3684-4114 (3914) |
Table 4.
Occurrence of STEnv with potential thunderstorm (90% confidence interval) over the years.
| Quantiles | 1977-2005 (range given with mean) | 2041-2069(range given with mean) | 2071-2099 (range given with mean) |
| 90% | 248.5-300.5 (267) | 214.1-262.1 (229) | 320.6-378.6 (342) |
| 95% | 120.2-157.7 (134) | 95-129.5 (109) | 172.4-218 (188) |
| 97% | 66.99-96.95 (81) | 61.44-90.22 (75) | 117-153.6 (134) |
| 99% | 16.32-33.11 (27) | 14.48-30.08 (25) | 42.33-65.86 (55) |
Disclaimer/Publisher’s Note: The statements, opinions and data contained in all publications are solely those of the individual author(s) and contributor(s) and not of MDPI and/or the editor(s). MDPI and/or the editor(s) disclaim responsibility for any injury to people or property resulting from any ideas, methods, instructions or products referred to in the content. |
© 2023 by the authors. Licensee MDPI, Basel, Switzerland. This article is an open access article distributed under the terms and conditions of the Creative Commons Attribution (CC BY) license (http://creativecommons.org/licenses/by/4.0/).
Copyright: This open access article is published under a Creative Commons CC BY 4.0 license, which permit the free download, distribution, and reuse, provided that the author and preprint are cited in any reuse.


