Submitted:
02 May 2023
Posted:
04 May 2023
You are already at the latest version
Abstract
: This study investigates the use of various thunderstorm indices in predicting severe thunderstorms events during the monsoon season in four different regions in India. The research evaluates the performance of the prediction model using a model skill score and utilizes the Weather Research and Forecasting (WRF) model with the double moment microphysics scheme to simulate model cases. It also compares fifteen thunderstorm indices derived from the ERA5 dataset to identify the most effective index for predicting severe thunderstorms events. The results of this study show that in-corporating thunderstorm indices with model skill scores improves severe thunderstorms fore-casting in the monsoon season in India. The result revealed that determining the optimal threshold for each index is crucial in achieving accurate predictions. The study also highlights the importance of considering multiple indices rather than relying on a single index to predict severe thunderstorms events. The advance indices such as Energy Helicity Index (EHI), Supercell Composite Parameter (SCP), mainly works well with extreme severe thunderstorms. The simplistic indices can predict the weak or severe thunderstorm easily. The use of multiple thunderstorm indices can also help mete-orologists to make more accurate predictions, which can further enhance public safety. In conclu-sion, this study demonstrates the potential of incorporating thunderstorm indices with model skill scores like HSS and TSS and combinations of different skill scores in severe thunderstorms fore-casting during the monsoon season in India. Future research can build upon the findings of this study to develop more accurate and reliable severe weather forecasting models.
Keywords:
Thunderstorm Indices
; WRF-ARW
; Lightning
; Optimal Threshold
; Model Skill Score
1. Introduction
Thunderstorms are the natural hazard which causes heavy loss of life and property due to its aftereffects such as intense lightning, hails, and extreme rainfall [1,2]. The vertically produced cumulonimbus clouds are the primary source of thunderstorm cells, with moisture, a lifting mechanism, and atmospheric instability serving as fundamental conditions for their creation [3]. The destructive effects of thunderstorms, which are mesoscale convective systems, include lightning, heavy precipitation, hail, and wind gusts [4]. The typical life duration of a thunderstorm is 1-12 hr, and its spatial reach is only a few kilometres [5] which cover very less geographic and temporal region and make it difficult to forecast and to predict [6,7]. As per the record around nine percent of the death due to natural hazard is caused by the lightning in India [8,9]. The highest number of thunderstorms occur in the pre-monsoon months of (March, April, May, and early June) [4,10,11,12]. The intensity of the thunderstorms are severe [13] over India due to the topography [14,15]. The basic criterion required for the formation of thunderstorms were outlined by many researchers [16,17]. For decades, thermodynamic and kinematic parameters have been designed to quantify the thunderstorms formation [5,18,19,20] over worldwide and India [21,22,23,24,25]. The air mass's convective characteristics and indices indicate thunderstorm potential [26]. Many research examined the effectiveness of indices generated from observed vertical profiles for thunderstorm prediction, [27,28,29,30,31].
The prediction and forecasting of thunderstorms are one of the most challenging task because of their spatial and temporal size [32] and also due to their physical and inherently nonlinear behaviour. [29,33]. The Weather Research Forecasting (WRF) model is dynamical in nature [34] which provide user the flexibility to change the horizontal and vertical resolution and domain selection. The modeling approach to forecast a thunderstorm required some appropriate physical parameterization schemes and variables [35]. Forecasts of thunderstorms are increasingly in demand [36]. Forecasts that are accurate of the most likely locations for the thunderstorms to form, and their potential significance, and time of dissipation. The numerical modeling is one of the methods that have used widely all across the world. Currently, the majority of meteorological forecasts are made using data from the NWP model combined with accessible observations [37,38,39]. Thunderstorm indices are often used for forecasting of convection from many decades. The ability of a model to forecast thunderstorm events needs to be assessed and improved by employing thunderstorm indices de-rived from model and observational datasets [24,40,41].
Thunderstorm formation is dependent on the thermodynamic and the instability of the atmosphere. The indices developed to assess atmospheric static stability were based on the vertical displacement of a hypothetical air "parcel" of very small dimension, and an entire atmospheric layer of some prescribed isobaric thickness [42,43]. Up until the deployment of high resolution non-hydrostatic mesoscale models starting in 2000, all forecast techniques were dependent on the estimation of stability in terms of indices. In order to prepare an overview of the potential thunderstorm spectrum and a synopsis across broader regions, thermodynamic and kinematic vertical information in the troposphere is frequently brought together using parameters generated from radiosonde and numerical weather prediction model data [19]. Over the past 40 years, numerous "indices" for quantitatively evaluating tropospheric static stability have been suggested in the literature or used in weather forecasting schemes as tools for identifying or predicting convective weather. Some of these indices are [44], Shear-CAPE and storm-relative helicity, [45], Significant Tornado Parameter, [46], low level shear, K index [47], Total-Total (TT) index (Miller 1972), Convective Available Potential Energy (CAPE) [48], [49], Energy–Helicity index have been used in this study. When evaluating the likelihood of thunderstorms, meteorologists immediately evaluate stability indices and competence scores [23,38]. Numerous academics have made substantial efforts to predict thunderstorms using stability indices and to evaluate their success using skill scores [50]. The bene-fits and drawbacks of the Critical Success Index, a frequently used skill score, were thoroughly examined by [51] while evaluating forecasting abilities for thunderstorms. In a related study, [52] investigated the effectiveness of various skill scores in rare event (tornadoes, flash floods) forecasting based on contingency tables. [5,18,23,24] shows the use of skill score to find the optimal threshold and test the thunderstorm in-dices.
The current study intends to assess the abilities and effectiveness of various thunderstorm indices in predicting thunderstorms of varying intensity. This also provide some helpful understanding of the proper-ties of the pre convective settings that are essential for the development of thunderstorms. Despite the existence of several current, com-plex dynamical and statistical models [5]. There is still a need for precise thunderstorm predictions that are time and location specific. Thermodynamic indices vary greatly from one location to another. Thermodynamic indices differ significantly between different loca-tions. It's possible that an index and its threshold that are determined for one site won't be applicable to another. In addition, forecasters are undecided whether to issue a thunderstorm warning even after obtaining the indices. The study focused on the thunderstorm indices time series analysis derived from the model and observation dataset, and different model skill score has been tested for all the indices over all the case studies. The Paper is organized as follows. In section 2, Data and methodology has been described including the brief discussion of study domain. Section 3 are presented the results and discussion of the study. Some concluding remarks are introduced in the section 4.
2. Materials and Methods
2.1. Study Domain
The four thunderstorms case have been chosen from different region of India during the pre-monsoon season for this study. Figure 1 and Figure 2 shows the model domain resolution with topography feature of the region and synoptic condition during the event occurrences respectively. (Table 1) provide the details of the thunderstorm’s cases. The cases have been chosen based on the India Meteorological Department re-port and synoptic condition checked by using INSAT-3D and ISS-LIS satellite imageries. The INSAT-3D provides the cloud top temperature (K) and ISS-LIS provides the lightning flash count during the event.
2.2. WRF Model
The numerical weather prediction model Weather Research Forecasting (WRF) model version (4.0.3) has been used for this study [34]. The WRF model is mesoscale weather prediction model. The microphysics scheme that has been used for this study is NSSL-17. (Table 2) provides the model configuration and (Table 3) provides the microphysical scheme.
2.3. Data Used
NCEP-FNL
The WRF model has used NCEP-FNL data with 0.25 º of resolution as a initial and boundary condition. This data prepared by using Global Data Assimilation System (GDAS) and Global Telecommunications System (GTS) for every six hours. The NCEP-FNL is final product after using Global Forecast System (GFS) data [53].
ERA5
ERA5 gives hourly estimates of many atmospheric, land, and oceanic climate variables. The data cover the Earth on a 30km grid and resolve the atmosphere utilising 137 levels from the surface to 80km. Two different level of reanalysis datasets downloaded from the ECMWF; ERA5 hourly data on single levels and ERA5 hourly data on pressure levels with 0.25 degree of resolution respectively. The datasets available in GRIB and NetCDF-4 format [54]. This data has been used to evaluate the model output.
2.3.1. Satellite Datasets
INSAT-3D
India launched INSAT-3D in 2013. Imager and atmospheric sounder. Multispectral imaging systems produce six-wavelength earth images (optical radiometer). The Meteorological and Oceanographic Satellite Data Archival Centre (MOSDAC) (www.mosdac.gov.in) provides datasets and blended images of thermal infrared and visible channels to evaluate lightning case cloud coverage over research locations. Deep, mixed-phased convection cloud complexes can be tracked by a meteorological satellite. Based on cloud-top brightness temperatures, storms in the simulation domain were tracked using half-hourly data from the INSAT-3D satellite's visible (VIS) channel (0.65 m) and thermal infrared (TIR) channel (10.8 m).
ISS-LIS
The ISS-LIS lightning datasets has been used in this study to find the thunderstorm events with lightning. With a high detection efficiency, the ISS LIS instrument captures the moment when lightning strikes, analyses the radiant energy, and calculates the location both during the day and at night. The lightning datasets are provided by the NASA Global Hydrometeorology Resource Center (GHRC) DAAC, managed by the NASA Earth Science Data and Information System (ESDIS) project.
The Lightning Imaging Sensor (LIS) on board the International Space Station (ISS) makes estimates of the variability and distribution of total lightning (intra-cloud and cloud-to-ground lightning) in tropical and mid-latitude regions. The ISS LIS sensor tracks the amount of radiant optical radiation, logs the times of lightning strikes, and locates locations day and night with an average 24-hour detection effective-ness of 70%. LIS data can be used for severe storm identification and analysis as well as studies on how lightning interacts with the atmosphere [12,55]. With a temporal range of 1 minute to 1 hour and a geo-graphic resolution of 4-8 kilometres, these lightning products are accessible to the general public.
2.4. Methodology
The indices namely used in this study has been followed: K Index (KI), Cross Totals (CT Index), Totals Total Index (TTI), Convective Available Potential Energy (CAPE), Vertical Totals (VT Index), Energy Helicity Index (EHI), Potential Instability (POT), Supercell Composite Parameter (SCP), Storm Relative Humidity (SRH) 3Km, Pressure Low Condensation Level (PLCL), Deep Layer Shear (DLS), Low Layer Shear (LLS), Significant Tornado Parameter (STP) and Dew Point. The indices have been calculated by using the vertical profiles of the model simulated variable and the result have been evaluated using the ERA5 reanalysis datasets. The indices have been computed over the thunderstorm location which have been identified by using the ISS-LIS dataset and have been confirmed through INSAT-3DR cloud brightness temperature for the synoptic condition confirmation. The definitions and mathematical equations have been included in Appendix-A for reference.
2.4.1. REGRID
The model has been optimized for the double nested domain with 9 and 3 Km resolution respectively for all the case studies. The inner domain of the model has been taken into consideration for the thunderstorm indices studies. The reanalysis datasets which has been taken from the ECMWF, ERA5 is with 0.25 degree of resolution. The model dataset has been subjected to extrapolation in order to conform to the format of the reanalysis dataset. To get the accurate results the re-gridding of the datasets has been done according to the ERA5 for that the model data has been regrid to 0.25 degree of resolution for all the case studies by using CDO remapcon which avoid weird values if your variables is heterogeneous.
2.4.2. BOX SELECTION
The thunderstorm is a mesoscale model which is less in spatial and temporal size. The Box has been chosen of 2 by 2 degree where the thunderstorm has been developed inside the inner domain of the model which has 3 Km horizontal resolution. The box has been selected based on ISS-LIS lightning datasets. The (Figure 2) shows the box on ISS-LIS image in pink colour. The (Table) provide the details of the box selection.
2.4.3. TIME SERIES
The time series analysis has been done on selected box after the regridding of both the datasets: Model and ERA5. The thunderstorm indices have been calculated from the model and ERA 5 datasets respectively. The model has undergone a 30-hour integration process, during which a 6-hour period was designated as a spin-up time for the model.
2.4.4. MODEL SKILL SCORE
There are number of model skill scores (ACC, CSI, ETS, FAR, HSS, POD, TSS) have been used to check the model accuracy against the observational datasets. The model skill scores measure the performance of the forecast [56]. The previous studies done on the thunderstorm in-dices all over the world have been taken into consideration for choosing the model skill scores. The detailed version of the model skill scores, and contingency table have been provided in the Appendix-B of the manuscript. Table 4 and Table 5 provides the model skill score and contingency table used in this research.
2.4.5. THUNDERSTORM INDICES
The indices designed to measure the level of static stability/instability of the atmosphere. The K Index is used for the non- severe thunderstorm. For severe CT, VT, and Total Totals Index and other indices have been selected. The EHI, STP, SCP and SRH are more advanced form of indices to predict the probability of the convective storms. The PLCL show the estimated height of the cloud base. The details of thunderstorm indices have been provided in the Appendix.
2.4.6. OPTIMAL THRESHOLD
The optimal threshold for the different thunderstorm indices has been calculated using the model skill scores values. The model skill score method which has been already used in the past research [5,18,23,31] has been followed in this study. Some indices with low values indicate increased thunderstorm probabilities, while the opposite is also possible. The optimal threshold has been calculated for all the indices for 0000 UTC, 1200 UTC and during the event of occurrence. Figure 3 shows the example of choosing the optimal threshold for the thunderstorm indices. CT index for the Surendranagar, Gujarat case has been considered to explain the process. In order to calculate the optimal threshold of the indices, ranges and their significant increasing interval shows has an important factor. It has been decided based on maximum, minimum and standard deviation values of the model and Era5 datasets. For Surendranagar, Gujarat case CT index ranges lie between -5 to 25 ºC and the increasing interval is 1 to verify the performance or to get the optimal threshold. The graph shows the spike at 18 and we also check the model skill score values for more precision. The model skill scores on value 18 are: 0.73 ACC, 0.64 POD, 0.01 FAR, 0.32 ETS, 0.63 CSI, 0.61 TSS and 0.49 HSS which is highest among all the other values. The threshold value was determined by taking into account the improved values of all skill scores (Sahu et al. 2020). The TSS and Heidke are both often cited in literature as indica-tors of forecast skill, however, there appears to be a significant variation between their traits. It appears that the TSS seeks a somewhat high POD, but the Heidke Skill Score seeks to bring the FAR down to acceptable levels [18].
3. Results and Discussions
Weather circumstances that are prone to create severe thunder-storms are identified using various parameters. All follow simple conceptual models of convection circumstances. Thresholds to change warning levels for most parameters. However, false alarm rates are high and detection rates low. Most parameters are convection de-pendent. These parameters can be categorized based on their underlying physical processes or variables. Temperature-only indices, such as the Vertical Total Index, provide insights into the temperature profile of the atmosphere. Humidity-related indices, such as the Cross Total, K Index, Total Totals, and Dew Point, are used to assess moisture levels in the atmosphere. Wind-related indices, including Deep Level Shear, Low Level Shear, and Storm Relative Helicity, are used to characterize the wind patterns and their potential to produce severe weather. There are also advanced indices that incorporate themes related to hail, downdrafts, and lightning, such as the Supercell Composite Parameters and Significant Tornado Parameter. By categorizing these parameters, researchers and forecasters can better understand the physical processes that govern atmospheric phenomena and use this knowledge to improve their predictions and assessments of weather and cli-mate-related risks. The model skill scores have been computed based on optimal threshold for 0000 UTC, 1200 UTC, and the time of event occurrence. Since it would not provide an overall outcome about the skill scores, graphs for the entire time period have been drawn to pro-vide a better understanding of the skill score for the thunderstorm in-dices.
3.1. Verification of model simulated thunderstorm indices with ERA-5
The thunderstorm indices have been calculated and plotted in time series graph for all the case studies to understand the difference in the model simulated datasets and reanalysis datasets. The time series graphs enable us to understand where the model worked well in accordance with the observed datasets and where it did not. The thunderstorm indices were chosen on the basis of different studies that has been done all over the world and also in India and also testify some new indices for the case study. The time series have been plotted for the 24 hours carrying hourly output of both the datasets. Based on the analysis of Fig. 4, 5, 6, and 7, it is apparent that the indices simulated by the model exhibit a high degree of agreement with the indices calculated from reanalysis data. However, it should be noted that some of the model-calculated indices did not perform as well as the reanalysis indices in certain case studies. The optimal threshold also has been calculated for all the thunderstorm indices for 0000UTC, 1200 UTC and during the occurrence of event over the region. This will give us better understanding of the threshold value of the indices at different time periods.
The VT index is the difference between the temperature at 850 hPa and 500 hPa level. The strong vertical temperature gradient the more likely are the thunderstorms. The CT, TTI and K index also included the humidity for better prediction because if humidity is low at higher level, it will decrease the chance of thunderstorm occurrences. The PLCL is important factor to discriminate between tornadic and non-tornadic supercells. It indicates the cloud base height, lower the height increases the chances of supercells and tornadic thunderstorms. This is because the height of the cloud base is an indication of the amount of energy and moisture available in the atmosphere. Lower cloud base height indicates the presence of warm and humid air near the surface, which can lead to the development of stronger updrafts and increase the chances of supercells and tornadic thunderstorms. As the increase in relative humidity at lower level may increases the buoyancy in downdraft and increased probability of tornadoes. When the LCL is comparatively low compared, tornadoes are more likely to occur. Severe weather can be predicted by an extremely high dew point. A high dew point indicates unstable air because a high dew point indicates a high level of moisture in the air, which makes the air lighter and less dense, resulting in instability. Raising the dew-point temperature near the surface by evaporation and forcibly lifting the atmosphere on large scales can both make the atmosphere unstable and increase the likelihood of thunderstorm formation. Some of the in-dices directly depends on the latent instability such as CAPE which is very sensitive to vertical profiles of air parcel. The CAPE is the most important indices in predicting the thunderstorm and it shows good correlation with thunderstorm and lightning. The potential for instability (POT) metric indicates how unstable an area is by how much its value is negative. It is said that vector shear nearly around 15-20 m/s is needed to support a supercells. The DLS exceeding 15 m/s increases the likelihood that the supercell will be originated there. The LLS should be 2.5- 5 m/s for significant tornado supercells. It is important to take into consideration both the DLS and LLS for predicting the thunderstorms. The SRH provides a calculation of the change in wind with respect to the magnitude and direction in relation to the storm movement. The EHI is more specific because it combines both the CAPE and SRH at 3 Km. EHI estimated the tornado risk as EHI less than 1 shows the po-tential of supercell occurrence, where if the value greater than 1 to 5 it considered as F3 and F5 tornadoes respectively. The SCP also used to predict the supercells. The value of SCP greater than 1 it favours the supercells. If it is less than 1 it shows non supercell storm. The STP also provides the tool to differentiate between tornadic and non-tornadic supercells. It combines the CAPE, SRH at 3Km and 1 Km, PLCL for calculation.
3.1.1. Assessment of thunderstorm indices over Udaipur, Rajasthan
On 11 July 2021, a thunderstorm event occurred in Udaipur, Rajasthan, which resulted in the unfortunate loss of 11 lives due to lightning strikes. The incident took place in the late afternoon, between 1600 and 1900 UTC. Figure 4 depicts the calculated model simulated thunderstorm indices over the reanalysis ERA-5 indices in a time series graph. The maximum, minimum, mean, and standard deviation of all the thunderstorm indices for both the model simulated indices and the ERA-5 derived indices are provided in Table 7 and Table 11. The event occurrence time, as determined by the study of the graph and datasets, is 1900 UTC, which is consistent with the report, observational datasets, and synoptic imageries.

Table 6.
Maximum, minimum, mean, and standard deviation computed for all thunderstorm indices over Surendranagar, Gujarat (Max = Maximum, Min = Minimum, Mean = mean, Std = Standard Deviation).
Table 6.
Maximum, minimum, mean, and standard deviation computed for all thunderstorm indices over Surendranagar, Gujarat (Max = Maximum, Min = Minimum, Mean = mean, Std = Standard Deviation).
| WRF | ERA-5 | |||||||
|---|---|---|---|---|---|---|---|---|
| Index | Max | Min | Mean | Std | Max | Min | Mean | Std |
| CAPE | 3761.99 | 1.56 | 1544.88 | 601.74 | 4070.24 | 0 | 1297.55 | 631.77 |
| KI | 45.91 | -6.34 | 22.14 | 12.19 | 42.67 | 2.09 | 23.82 | 9.03 |
| CT | 25.92 | -5.43 | 16.08 | 6.21 | 26.33 | 12.55 | 20.05 | 2.94 |
| VT | 36 | 22.27 | 29.99 | 2.3 | 34.62 | 23.57 | 29.12 | 1.91 |
| TTI | 58.35 | 27.03 | 46.07 | 5.33 | 55.18 | 32.44 | 47.33 | 4.54 |
| DEW | 27.25 | 9.56 | 22.85 | 3.19 | 28.91 | 13.64 | 22.57 | 2.3 |
| POT | -36.71 | -72.93 | -52.55 | 7.2 | -34.89 | -71.82 | -54 | 7.29 |
| EHI | 5.27 | -1.48 | 0.56 | 0.61 | 4.09 | -0.81 | 0.38 | 0.45 |
| SCP | 17.66 | -3.84 | 1.1 | 1.49 | 8.98 | -2.37 | 0.92 | 1.31 |
| STP | 1.53 | -1.37 | 0 | 0.16 | 1.57 | -1.31 | 0 | 0.14 |
| SRH | 287.88 | -96.78 | 56.02 | 51.41 | 2.38 | -72.67 | 46.85 | 43.64 |
| DLS | 29.96 | 0.54 | 13.52 | 6.18 | 25.71 | 0.02 | 11.59 | 6.29 |
| LLS | 13.38 | 0.14 | 2.86 | 1.8 | 9.77 | 0 | 2.35 | 1.8 |
| PLCL | 996.32 | 660.25 | 895.29 | 82.5 | 979.23 | 687.37 | 885.61 | 61.45 |
Table 7.
Maximum, minimum, mean, and standard deviation computed for all thunderstorm indices over Udaipur, Rajasthan (Max = Maximum, Min = Minimum, Mean = mean, Std = Standard Deviation).
Table 7.
Maximum, minimum, mean, and standard deviation computed for all thunderstorm indices over Udaipur, Rajasthan (Max = Maximum, Min = Minimum, Mean = mean, Std = Standard Deviation).
| WRF | ERA-5 | |||||||
|---|---|---|---|---|---|---|---|---|
| Index | Max | Min | Mean | Std | Max | Min | Mean | Std |
| CAPE | 2561.5 | 0 | 847.39 | 441.71 | 3879.77 | 0 | 617.91 | 527.89 |
| KI | 45.84 | 27.51 | 39.77 | 2.13 | 45.47 | 2.29 | 37.15 | 1.75 |
| CT | 22.05 | 11.38 | 18.75 | 1.6 | 24.8 | 12.36 | 19.85 | 1.01 |
| VT | 36.78 | 18.95 | 24.19 | 35.49 | 18.35 | 23.69 | 2.36 | |
| TTI | 51.96 | 35.43 | 42.94 | 2.17 | 50.35 | 22.28 | 42.35 | 2.45 |
| DEW | 27.32 | -1.97 | 22.37 | 2.86 | 33.85 | 16.61 | 25.06 | 2.05 |
| POT | -35.72 | -63.31 | -52.75 | 4.24 | -28.96 | -70.35 | -51.74 | 4.64 |
| EHI | 3.18 | -0.46 | 0.32 | 0.32 | 3.46 | -0.22 | 0.2 | 0.24 |
| SCP | 5.37 | -0.43 | 0.39 | 0.49 | 4.97 | -0.4 | 0.31 | 0.45 |
| STP | 0.5 | -0.25 | 0 | 0.04 | 0.74 | -0.28 | 0.01 | 0.04 |
| SRH 3 | 321.4 | -59.87 | 62.01 | 50.41 | 269.58 | -42.74 | 52.44 | 41.35 |
| DLS | 22.68 | 0.2 | 8.59 | 4.44 | 23.64 | 0.02 | 8.17 | 4.17 |
| LLS | 15.39 | 0.03 | 3.22 | 2.64 | 12.42 | 0 | 3.35 | 2.52 |
| PLCL | 992.95 | 531.74 | 843.04 | 84.7 | 992.62 | 515.65 | 85.05 | 67.48 |
Table 8.
Maximum, minimum, mean, and standard deviation computed for all thunderstorm indices over Hooghly, West Bengal (Max = Maximum, Min = Minimum, Mean = mean, Std = Standard Deviation).
Table 8.
Maximum, minimum, mean, and standard deviation computed for all thunderstorm indices over Hooghly, West Bengal (Max = Maximum, Min = Minimum, Mean = mean, Std = Standard Deviation).
| WRF | ERA-5 | |||||||
|---|---|---|---|---|---|---|---|---|
| Index | Max | Min | Mean | Std | Max | Min | Mean | Std |
| CAPE | 5624.77 | 0 | 1680.3 | 1572.65 | 6995.75 | 0 | 1359.22 | 1185.97 |
| KI | 44.03 | 19.81 | 37.62 | 3.62 | 43.49 | -20.29 | 34.5 | 5.68 |
| CT | 23.27 | 10.94 | 18.04 | 1.89 | 24.09 | 12.88 | 19.31 | 1.48 |
| VT | 33.18 | 19.44 | 26.67 | 2.59 | 31.09 | 18.51 | 24.99 | 1.99 |
| TTI | 50.78 | 36.67 | 44.71 | 2.32 | 50.32 | 14.69 | 43.86 | 3.26 |
| DEW | 29.01 | 0.47 | 22.56 | 4.6 | 30.04 | 16.81 | 24.9 | 1.64 |
| POT | -38.8 | -61.51 | -49.77 | 3.46 | -28.89 | -66.6 | -49.44 | 5.28 |
| EHI | 9.38 | -0.85 | 1.41 | 1.48 | 6.69 | -0.79 | 0.83 | 0.96 |
| SCP | 26.17 | -0.44 | 1.89 | 2.37 | 19.05 | -0.35 | 1.36 | 1.78 |
| STP | 2.94 | -0.31 | 0.17 | 0.26 | 2.56 | -0.15 | 0.15 | 0.23 |
| SRH 3 | 615 | -82.77 | 100.78 | 73.24 | 419.23 | -45.71 | 93.08 | 63.64 |
| DLS | 22.578 | 0.59 | 9.77 | 4.02 | 20.01 | 0 | 8.77 | 3.49 |
| LLS | 18.62 | 0.02 | 4.86 | 3.09 | 16.19 | 0 | 4.75 | 3.08 |
| PLCL | 998.4 | 592.98 | 872.07 | 98.18 | 998.43 | 523.44 | 905.6 | 72.07 |
Table 9.
Maximum, minimum, mean, and standard deviation computed for all thunderstorm indices over Raygada, Odisha (Max = Maximum, Min = Minimum, Mean = mean, Std = Standard Deviation).
Table 9.
Maximum, minimum, mean, and standard deviation computed for all thunderstorm indices over Raygada, Odisha (Max = Maximum, Min = Minimum, Mean = mean, Std = Standard Deviation).
| WRF | ERA-5 | |||||||
|---|---|---|---|---|---|---|---|---|
| Index | Max | Min | Mean | Std | Max | Min | Mean | Std |
| CAPE | 3939.28 | 0 | 1659.65 | 730.49 | 4169.33 | 0 | 1215.75 | 612.81 |
| KI | 43 | 23.88 | 34.37 | 3.94 | 41.99 | 23 | 34.08 | 2.96 |
| CT | 22.7 | 13.92 | 19.22 | 1.38 | 23.1 | 14.88 | 19.08 | 1.36 |
| VT | 26.9 | 20 | 23.36 | 1.01 | 25.8 | 19.84 | 23.18 | 0.96 |
| TTI | 46.94 | 37.46 | 42.59 | 1.63 | 46.62 | 37.02 | 42.04 | 1.52 |
| DEW | 27.58 | 18.18 | 24.85 | 1.89 | 30.19 | 18.65 | 25.48 | 1.16 |
| POT | -40.25 | -62.36 | -50.77 | 4.81 | -36.69 | -60.33 | -49.47 | 4.22 |
| EHI | 3.18 | -0.82 | 0.33 | 0.39 | 2.71 | -0.86 | 0.18 | 0.28 |
| SCP | 4.51 | -0.57 | 0.23 | 0.33 | 3.43 | -0.72 | -0.21 | 0.35 |
| STP | 0.8 | -0.36 | 0 | 0.04 | 0.39 | -0.2 | 0 | 0.03 |
| SRH 3 | 213.51 | -63.58 | 27.98 | 32.21 | 217.41 | -58.32 | 21.92 | 30.82 |
| DLS | 24.69 | 0.26 | 6.31 | 2.98 | 16.2 | 0.03 | 6.07 | 2.85 |
| LLS | 13.59 | 0.08 | 2.8 | 2.13 | 13.74 | 0 | 2.87 | 2.28 |
| PLCL | 1033.27 | 755.43 | 924.45 | 57.5 | 996.68 | 759.67 | 936.87 | 36.02 |
Table 10.
Threshold values and skill scores of thunderstorm indices for event time, 0000 UTC and 1200 UTC over Surendranagar, Gujarat.
Table 10.
Threshold values and skill scores of thunderstorm indices for event time, 0000 UTC and 1200 UTC over Surendranagar, Gujarat.
| 17 UTC | 00 UTC | 12 UTC | ||||||||||||||||||||||
| Index | Threshold | ACC | POD | FAR | ETS | CSI | TSS | HSS | Threshold | ACC | POD | FAR | ETS | CSI | TSS | HSS | Threshold | ACC | POD | FAR | ETS | CSI | TSS | HSS |
| CAPE | ≥1700 | 0.72 | 0.79 | 0.4 | 0.28 | 0.51 | 0.47 | 0.44 | ≥1730 | 0.71 | 0.96 | 0.59 | 0.25 | 0.39 | 0.62 | 0.4 | ≥1900 | 0.77 | 0.97 | 0.67 | 0.23 | 0.32 | 0.72 | 0.38 |
| KI | ≥26 | 0.83 | 0.74 | 0.02 | 0.51 | 0.73 | 0.71 | 0.38 | ≥27 | 0.71 | 0.46 | 0.25 | 0.23 | 0.41 | 0.35 | 0.37 | ≥29 | 0.77 | 0.63 | 0.23 | 0.34 | 0.53 | 0.5 | 0.51 |
| CT | ≥18 | 0.73 | 0.64 | 0.01 | 0.32 | 0.63 | 0.61 | 0.49 | ≥18 | 0.74 | 0.64 | 0.05 | 0.34 | 0.62 | 0.58 | 0.5 | ≥17 | 0.79 | 0.75 | 0.009 | 0.35 | 0.74 | 0.72 | 0.52 |
| VT | ≥27 | 0.88 | 0.89 | 0.02 | 0.46 | 0.87 | 0.75 | 0.63 | ≥31 | 0.78 | 0.82 | 0.35 | 0.37 | 0.57 | 0.58 | 0.54 | ≥31 | 0.7 | 0.8 | 0.65 | 0.18 | 0.31 | 0.48 | 0.31 |
| TTI | ≥46 | 0.75 | 0.69 | 0.07 | 0.32 | 0.65 | 0.56 | 0.49 | ≥48 | 0.76 | 0.69 | 0.11 | 0.36 | 0.64 | 0.56 | 0.53 | ≥44 | 0.84 | 0.82 | 0.03 | 0.43 | 0.8 | 0.71 | 0.6 |
| DEW | ≥23 | 0.74 | 0.77 | 0.13 | 0.24 | 0.69 | 0.24 | 0.38 | ≥23 | 0.71 | 0.75 | 0.13 | 0.13 | 0.67 | 0.28 | 0.23 | ≥23 | 0.83 | 0.79 | 0.2 | 0.49 | 0.65 | 0.66 | 0.66 |
| POT | ≤-50 | 0.8 | 0.83 | 0.4 | 0.38 | 0.53 | 0.62 | 0.55 | ≤-46 | 0.84 | 0.67 | 0.21 | 0.44 | 0.57 | 0.59 | 0.61 | ≤-48 | 0.91 | 0.84 | 0.21 | 0.6 | 0.68 | 0.77 | 0.75 |
| EHI | ≥1 | 0.81 | 0.67 | 0.44 | 0.31 | 0.43 | 0.52 | 0.48 | ≥0.5 | 0.72 | 0.7 | 0.55 | 0.21 | 0.37 | 0.42 | 0.35 | ≥0.5 | 0.76 | 0.4 | 0.47 | 0.34 | 0.5 | 0.35 | 0.51 |
| SCP | ≥4 | 0.94 | 0.65 | 0.09 | 0.57 | 0.6 | 0.65 | 0.72 | ≥0.5 | 0.77 | 0.74 | 0.22 | 0.37 | 0.61 | 0.54 | 0.54 | ≥2 | 0.85 | 0.89 | 0.48 | 0.39 | 0.49 | 0.74 | 0.57 |
| STP | ≥-0.1 | 0.69 | 0.77 | 0.14 | 0.03 | 0.67 | 0.07 | 0.06 | ≥-0.2 | 0.84 | 0.02 | 0.05 | 0.04 | 0.83 | 0.24 | 0.09 | ≥-0.1 | 0.77 | 0.83 | 0.08 | -0.02 | 0.77 | -0.07 | -0.05 |
| SRH | ≥140 | 0.87 | 0.53 | 0.72 | 0.18 | 0.22 | 0.43 | 0.3 | ≥80 | 0.82 | 0.57 | 0.81 | 0.11 | 0.16 | 0.41 | 0.2 | ≥100 | 0.85 | 0.89 | 0.55 | 0.35 | 0.42 | 0.74 | 0.52 |
| DLS | ≥17 | 0.9 | 0.19 | 0.16 | 0.66 | 0.77 | 0.81 | 0.8 | ≥12 | 0.85 | 0.96 | 0.21 | 0.54 | 0.75 | 0.7 | 0.7 | ≥14 | 0.83 | 0.93 | 0.22 | 0.5 | 0.73 | 0.65 | 0.67 |
| LLS | ≥7.5 | 0.94 | 0.25 | 0.95 | 0.03 | 0.04 | 0.2 | 0.06 | ≥6.5 | 0.94 | 0.56 | 0.59 | 0.28 | 0.3 | 0.52 | 0.44 | ≥5.5 | 0.94 | 0.5 | 0.97 | 0.01 | 0.02 | 0.44 | 0.03 |
| PLCL | ≥920 | 0.83 | 0.99 | 0.25 | 0.5 | 0.73 | 0.68 | 0.67 | ≥860 | 0.9 | 0.89 | 0 | 0.29 | 0.89 | 0.89 | 0.45 | ≥920 | 0.94 | 0.95 | 0.13 | 0.77 | 0.83 | 0.9 | 0.87 |
Table 11.
Threshold values and skill scores of thunderstorm indices for event time, 0000 UTC and 1200 UTC over Udaipur, Rajasthan.
Table 11.
Threshold values and skill scores of thunderstorm indices for event time, 0000 UTC and 1200 UTC over Udaipur, Rajasthan.
| 19 UTC | 00 UTC | 12 UTC | ||||||||||||||||||||||
|---|---|---|---|---|---|---|---|---|---|---|---|---|---|---|---|---|---|---|---|---|---|---|---|---|
| Index | Threshold | ACC | POD | FAR | ETS | CSI | TSS | HSS | Threshold | ACC | POD | FAR | ETS | CSI | TSS | HSS | Threshold | ACC | POD | FAR | ETS | CSI | TSS | HSS |
| CAPE | ≥1300 | 0.71 | 0.26 | 0.85 | 0.01 | 0.1 | 0.04 | 0.03 | ≥800 | 0.8 | 0.42 | 0.6 | 0.17 | 0.25 | 0.3 | 0.29 | ≥1100 | 0.63 | 0.61 | 0.66 | 0.11 | 0.27 | 0.25 | 0.19 |
| KI | ≥30 | 0.93 | 0.94 | 0.01 | 0.18 | 0.93 | 0.47 | 0.3 | ≥35 | 0.84 | 0.92 | 0.1 | 0.21 | 0.83 | 0.32 | 0.35 | ≥31 | 0.93 | 0.94 | 0.01 | 0.19 | 0.93 | 0.5 | 0.32 |
| CT | ≥19 | 0.62 | 0.63 | 0.13 | 0.08 | 0.57 | 0.22 | 0.16 | ≥19 | 0.66 | 0.58 | 0.09 | 0.21 | 0.54 | 0.44 | 0.35 | ≥19 | 0.49 | 0.42 | 0.11 | 0.06 | 0.4 | 0.2 | 0.11 |
| VT | ≥24 | 0.91 | 0.93 | 0.15 | 0.7 | 0.79 | 0.84 | 0.82 | ≥25 | 0.91 | 0.93 | 0.25 | 0.63 | 0.71 | 0.84 | 0.77 | ≥24 | 0.89 | 0.94 | 0.19 | 0.65 | 0.77 | 0.81 | 0.78 |
| TTI | ≥44 | 0.82 | 0.83 | 0.44 | 0.38 | 0.49 | 0.66 | 0.55 | ≥44 | 0.83 | 0.78 | 0.57 | 0.29 | 0.37 | 0.62 | 0.46 | ≥44 | 0.79 | 0.84 | 0.52 | 0.31 | 0.43 | 0.62 | 0.47 |
| DEW | ≥21 | 0.77 | 0.76 | 0 | 0.12 | 0.76 | 0.76 | 0.22 | ≥23 | 0.37 | 0.35 | 0 | 0.01 | 0.35 | 0.35 | 0.03 | ≥21 | 0.75 | 0.72 | 0.01 | 0.24 | 0.71 | 0.66 | 0.39 |
| POT | ≤-56 | 0.76 | 0.75 | 0.03 | 0.24 | 0.73 | 0.61 | 0.39 | ≤-48 | 0.83 | 0.59 | 0.15 | 0.42 | 0.53 | 0.54 | 0.59 | ≤-58 | 0.8 | 0.85 | 0.07 | 0.17 | 0.79 | 0.36 | 0.3 |
| EHI | ≥0.5 | 0.81 | 0.64 | 0.57 | 0.25 | 0.34 | 0.41 | 0.4 | ≥0.5 | 0.88 | 0.31 | 0.79 | 0.1 | 0.14 | 0.23 | 0.18 | ≥0.5 | 0.85 | 0.45 | 0.74 | 0.14 | 0.19 | 0.34 | 0.45 |
| SCP | ≥1 | 0.88 | 0.55 | 0.49 | 0.3 | 0.36 | 0.48 | 0.46 | ≥0.5 | 0.84 | 0.44 | 0.61 | 0.19 | 0.25 | 0.34 | 0.32 | ≥0.5 | 0.81 | 0.49 | 0.5 | 0.24 | 0.33 | 0.38 | 0.38 |
| STP | ≥-0.1 | 0.82 | 0.83 | 0.01 | 0.04 | 0.82 | 0.38 | 0.08 | ≥-0.1 | 0.84 | 0.84 | 0 | 0 | 0.84 | NA | NA | ≥-0.1 | 0.81 | 0.81 | 0.006 | 0 | 0.81 | -0.18 | -0.01 |
| SRH | ≥60 | 0.79 | 0.75 | 0.27 | 0.39 | 0.58 | 0.57 | 0.56 | ≥70 | 0.75 | 0.61 | 0.29 | 0.3 | 0.49 | 0.46 | 0.47 | ≥70 | 0.82 | 0.6 | 0.5 | 0.28 | 0.37 | 0.48 | 0.44 |
| DLS | ≥15 | 0.9 | 0.84 | 0.61 | 0.31 | 0.35 | 0.74 | 0.48 | ≥16 | 0.97 | 0.92 | 0.6 | 0.36 | 0.38 | 0.89 | 0.53 | ≥15 | 0.94 | 0.87 | 0.49 | 0.44 | 0.47 | 0.82 | 0.61 |
| LLS | ≥7 | 0.87 | 0.59 | 0.34 | 0.38 | 0.45 | 0.53 | 0.55 | ≥7.5 | 0.88 | 0.42 | 0.78 | 0.13 | 0.16 | 0.33 | 0.23 | ≥7 | 0.97 | 0.24 | 0.73 | 0.13 | 0.14 | 0.23 | 0.24 |
| PLCL | ≥860 | 0.75 | 0.68 | 0.01 | 0.32 | 0.67 | 0.65 | 0.49 | ≥920 | 0.83 | 0.63 | 0.04 | 0.47 | 0.61 | 0.6 | 0.64 | ≥940 | 0.95 | 0.52 | 0.12 | 0.46 | 0.48 | 0.51 | 0.63 |
Figure 4 demonstrates that all the indices have an optimal threshold, where the K, VT, CT, and TTI index thresholds are 30°C, 24°C, 19°C, and 44°C, respectively. These values, in conjunction with the literature review, significantly indicate the probability of a thunderstorm. The dew point temperature during the event was also high, around 21°C. The PLCL during the time of the event was around 860 hPa, which is high enough to suggest a non-tornadic thunderstorm. The POT value of -56 K shows an unstable region that is favorable for the thunderstorm. The CAPE value lies around 1300 J/Kg, which indicates the probability of convection. The DLS and LLS values of 15m/s and 7 m/s, respectively, provide a positive wind updraft for the air parcel to move up. The EHI value of 0.5 predicts the potential for a supercell, but it did not indicate any kind of convective activity, and there was no helicity during the event. The SCP and STP values of 1 and -0.1, respectively, prove that it was not a tornadic supercell. The SRH value of around 60 m2/s2 was quite low for strong storm movement.
The time series graph and table for all the thunderstorm indices provide results indicating that the thunderstorm in Udaipur, Rajasthan was in the low or weak category. The table provides the maxi-mum and minimum of all the thunderstorm indices for the entire time, derived from the model simulated and reanalysis datasets. These values indicate that convective storm activity occurred. WRF simulated a drastic increase (800-2100 J/Kg) in CAPE when the event was record-ed, although the ERA5 CAPE increased comparatively slowly (800-850 J/Kg). All indices showed relatively similar trends between the model and ERA5 except for the TT-Index, which is showing a decreasing trend in ERA5 and an increasing trend in WRF. WRF also overestimated several indices, including the CT-Index, Dew Point, EHI, and SRH indices, with significant numbers.
3.1.2. Assessment of thunderstorm indices over Surendranagar, Gujarat
On June 04, 2021, a thunderstorm hit Surendranagar, Gujarat between 1600 to 2000 UTC. Figure 5 compares the model-simulated thunderstorm indices with ERA-5 indices, while Table 6 and Table 10 provide the maximum, minimum, mean, and standard deviation of thunderstorm indices derived from both sources. The report, observational datasets, and synoptic images align with the 1700 UTC event time indicated by the graph and datasets.
The CAPE's optimal threshold of 1700 J/kg suggests the occurrence of a thunderstorm. The CT, VT, TTI, and K index during the event were 18°C, 27°C, 46°C, and 26°C, respectively, indicating favor-able conditions for convection. The time series graph shows an in-crease in values during and after the event, followed by a sudden de-crease indicating the dissipation of the convective storm. The dew point temperature is around 23°C. The DLS and LLS values are 13 m/s and 5 m/s, respectively, indicating the availability of ample wind up-drafts for the formation of a thunderstorm. The optimal PLCL thresh-old is around 920 hPa, while before the event, it was around 750 hPa. The EHI is negligible, indicating the absence of helicity during the event. The SCP is low, but the graph reaches 1, suggesting a 15% possibility of a thunderstorm occurring. The STP values are low or negative, indicating the absence of a tornado during the event. The SRH at 3 km is around 60 m2/s2, which is inadequate for an extremely severe thunderstorm.
The table provides optimal thresholds for all indices, indicating that advanced indices such as STP, SCP, and EHI are only useful during extremely severe thunderstorm events. The threshold values of thunderstorm indices and graph analysis suggest that the thunder-storm that occurred was weak and not an extremely severe thunder-storm. The indices gradually increased before the event and decreased after the event. Both WRF and Era5 data showed the same pattern during the event. However, the WRF overestimated the CT-Index, while the DLS was underestimated.
3.1.3. Assessment of thunderstorm indices over Hooghly, West Bengal
On June 7th, 2021, a severe convective storm occurred in Hooghly, West Bengal, resulting in the unfortunate deaths of 27 individuals. This event comprised two back-to-back thunderstorm occurrences, with the first taking place during the morning hours between 0800 to 1000 UTC. Synoptic images and observational datasets indicate the event time to be around 0900 UTC.
An analysis of time series graphs produced by model simulations and ERA5 revealed that the morning thunderstorm was severe, with CAPE values ranging from 3900 J/Kg to 4300 J/Kg in the afternoon thunderstorm. Figure 6 shows a graph analysis of various indices, including the K-Index value at 31°C, CT-Index at 17°C, VT-Index at 25°C, and TTI at 44°C, all of which indicated a strong severe thunderstorm during the morning hours. Table 8 and Table 12 provide comprehensive statistics regarding the event.
The EHI during this event rose to 4.5, signifying the severity of the thunderstorm. The SCP varied from 4 to 6 throughout the day, indicating an extreme severe weather event of category third. The OT of SRH at 3 km peaked at 615 m2/s2 in model simulation and 429 m2/s2 in ERA5, which is quite high. The STP was low as no tornadoes occurred. The DLS at 11 m/s and LLS at 7 m/s were adequate updraft winds for the thunderstorm. Overall, the Hooghly, West Bengal convective storm was an extreme severe weather event, and all thunder-storm indices indicated its severity.
The Hooghly, West Bengal case was observed at 09 UTC, and it was noted that WRF recorded sharp increases and decreases in various indices such as CAPE, CT-Index, VT-Index, Dew Point, POT, EHI, SCP, and STP just before or after 09 UTC. In contrast, ERA5 exhibited smooth changes. Additionally, WRF and ERA5 represented indices such as K-Index, Dew Point, LLS, and DLS. Of all cases, the Hooghly, West Bengal case recorded the highest CAPE threshold, reaching 4300 J/Kg at 12 UTC, indicating the severity of the event.
3.1.4. Assessment of thunderstorm indices over Odisha
According to the INSAT-3D and ISS-LIS datasets, the thunder-storm occurred on June 24, 2020, at around 1300 UTC during the mid-day. Because the optimal threshold of CAPE is currently around 1300 J/kg, it is rather evident that a thunderstorm is beginning to develop. At the time that the occurrence took place, the relevant values for the CT, VT, TTI, and K index OT were 18°C, 23°C, 42°C, and 34°C. The maximum and minimum values for all the thunderstorm indices show the formation of convective storm. For example, CAPE reaches to 3900 J/Kg, TTI around 46°C, K Index around 43°C, CT around °C and TTI around 47°C respectively. Figure 7 figures suggest that there is a possibility for convection to take place given the conditions. The time series graph also shows a spike in values during the occurrence, which depicts the dissipation of the convective storm, and then a steep drop in values after the incident. Table 9 and Table 13 provides the computed scores for the event. The dew point is often found somewhere around 23 degrees Celsius. The examination of graphs indicates that there is enough wind updraft available for the generation of thunderstorms with a DLS of approximately 6 m/s and an LLS of approximately 3.5 m/s. A little over 940 hPa was the OT of PLCL just before the disaster occurred. Due to the exceptionally low EHI, there is no evidence of helicity during the event. The SCP is quite low, the graph hits 0.5, which implies that there is no probability of a supercell but there is a 15% chance of a thunderstorm occurring. The readings of the STP, which are similarly low or headed toward zero, indicate that there was no tornado activity throughout the event. The SRH at 3 km is only 70 m2/s2, which is a very substantial amount lower than what one would anticipate for a truly powerful thunderstorm. The interpretation of the optimal threshold of thunderstorm indices and graph analysis that was just described suggests that the thunderstorm that occurred in this instance was a moderate one and not an exceedingly severe one. The Raygada, Odisha case has represented better the agreement between the Era5 and WRF, among all cases. It showed that given model con-figuration in the present study has simulated comparatively better thunderstorms.
3.2. Model Skill Score Analysis
The categorical verification provides a methodical way to assess the accuracy of different indices and select appropriate thresholds. The data sets are used to generate a 2x2 contingency table, and the four elements are based on whether an event was observed (YES/NO) and predicted (YES/NO) in the data sets. The index values are also subdivided into two sections by defining an optimal threshold. Some thunderstorm indices which associated with higher values of optimal threshold such as CAPE and vice versa such as potential instability (POT).
The optimal threshold can only be considered when the correct event forecasts is maximum whereas, false alarm and surprised events were minimum. To evaluate the optimal threshold different skill score have been tested. The Probability of detection (POD) lies from 0 to 1 as 1 is perfect score increases with over forecasting events as it does not include false event shown in Figure 13, whereas False Alarm Rate (FAR) increases with under forecasting events shown in Figure 11. Figure 8 demonstrates the Accuracy (ACC) score defines the fraction of the forecasts were in the correct. The Critical Success Index (CSI) shown in Figure 9 scale runs from 0 to 1, with 1 denoting the most accurate forecast; the CSI includes both false alarms and unexpected events; however, events with different frequencies cannot be compared. Figure 10 shows the Equitable Threat Score (ETS) removed the contribution from hits by chance. Figure 12 depicts the Heidke Skill Score (HSS) which has a range of -∞ to 1, where 1 represents a perfect forecast. As well as the impact of a reference forecast, surprise events and false alarms are also considered. Similar to the HSS in formulation, the True Skill Score (TSS) shown in Figure 14 uses random forecasts with unbiased constraints as the reference hit rate in the denominator. TSS and HSS score 1 for prefect forecast, 0 for random forecast.
The ACC model skill score (Figure 8) forecast for all the thunderstorm indices for every case study is above 70 percent that shows the correct fraction of the forecast. The CSI demonstrates (Figure 9) accurately fore-cast for K index, CT index, VT index and Dew Point respectively. The ETS (Figure 10) all the indices are showing positive values except SCP of Surenranagar, Gujarat showing no skill score till first nine hours of the simulation. The dew point of Raygada, Odisha showing no skill after twelve hours. The FAR (Figure 11) showing the falsehood in the model skill score and indicates that the SCP of Surendranagar, Gujarat no skill for first nine hours of the starting. The HSS and TSS (Figure 12 & Figure 14) also pointing the no skill forecast for the Dew point of Raygada, Odisha and SCP of Surendranagar, Gujarat. All the indices have been chosen for the check the sensitivity of the model skill score forecasting capability. The optimal threshold has been chosen on the basis of skill score, but it will work precisely only during the convection happen, but the optimal threshold has been checked for the whole duration the model has been simulated. By taking the constant optimal threshold will also hinder the model skill score forecasting. This is the limitation of the skill score.
4. Conclusions
The Weather Research Forecasting (WRF) model, in conjunction with the 0.25 Global Data Assimilation System (GDAS) Final dataset, has been utilized to simulate four distinct thunderstorm events. The model was implemented using a double nested domain with horizontal resolutions of 9 and 3 kilometres and was integrated over a period of 24 hours with an additional 6-hour spin-up time. To assess the accuracy of the model, thunderstorm indices were computed and compared to data from the ERA5 reanalysis dataset. The results of this comparison were then analyzed and formalized. The link between these many indices and numerical weather prediction models might vary. Severe thunderstorm potential is measured using a number of different indices. Overall, there is the potential for relatively substantial association between these indices and numerical weather prediction models. Forecasting severe thunderstorms is a difficult endeavour even with the greatest models and indices since there are numerous variables that might influence how a thunderstorm develops.
Energy Helicity Index (EHI) an indicator can be used to predict the rotating thunderstorms. It is frequently used to pinpoint locations where supercells, a sort of spinning thunderstorm might form. An additional statistic used to pinpoint potential tornado hotspots is the Significant Tornado Parameter (STP). It is frequently used in conjunction with other indices like the EHI and is derived using data on wind shear and instability. EHI measures potential for storm development by considering thermodynamic and dynamic factors. STP, the Significant Tornado Parameter, evaluates the damage potential of a tornado by considering its strength and path. SCP, the Supercell Composite Parameter, evaluates the potential for supercell development by considering storm-relative helicity, low-level wind shear, and instability. High CAPE values suggest that there is a lot of energy available for thunderstorm development, which raises the possibility of severe weather including tornadoes, powerful winds, and big hail. To completely assess the likelihood for severe weather, meteorological factors such wind shear, humidity, instability, and temperature gradients should also be taken into account. TTI is a meteorological measure that predicts thunderstorms. The lower atmosphere's stability is measured by combining the Virtual Temperature index (VT) and the Cross Totals index (CT). Based on temperature, dew point, and pressure, TTI indicates atmospheric instability. TTI used for short-term thunderstorm prediction. Deep layer shear and low-level shear are key meteorological factors in thunderstorm development and organization, including supercell and tornado formation. Deep layer shear is the wind difference between lower and upper atmosphere levels, typically measured up to 6 km above ground. It can create a favourable environment for storm development by tilting and elongating updrafts and promoting mesocyclone formation. Low-level shear, on the other hand, is the wind difference near the surface, typically measured within the first 1-2 km above ground. It can enhance the storm's intensity, stretch its clouds horizontally, and act as a visual cue for approaching severe weather. High values of both deep layer and low-level shear are re-quired for severe weather formation. EHI, STP and SCP are meteorological indices that evaluate the potential for severe weather, particularly thunderstorms and tornadoes. All these indices are inter-related, they are used together to identify the likelihood of severe weather con-ditions, forecast the potential of severe thunderstorms, tornadoes and other severe weather conditions. High values indicate a high potential for the development of thunderstorms. Thunderstorm indices should be used in conjunction with other forecasting tools, such as radar and satellite imagery, to help predict severe weather events. The simplistic indices such as VT, CT, TTI works well with the weak and non-supercell thunderstorms such as for Udaipur, Rajasthan, Surendranagar, Gujarat, and Raygada, Odisha cases. The supercell thunder-storm happens at Hooghly, West Bengal predicted well by EHI, SCP, STP and SRH (advance indicators). The DLS, LLS and PLCL also indicated the supercell or non-supercell thunderstorm category. The CAPE is the most potent indices for predicting the thunderstorm either weak or strong, but the limitation is it cannot predict the supercell or other categories alone. But combining with EHI, SRH and SCP it can predict the thunderstorms.
The skill score is a numerical metric that may be used to evaluate a prediction model's performance over time as well as to compare the performance of several forecast models. A model with a higher skill score will perform better, whereas one with a lower score will be less skilled. In meteorology and other domains, skill scores are frequently used to assess and enhance forecasting techniques. The performance of a forecast model can be assessed using a contingency table using the True Skill Statistic (TSS), Probability of Detection (POD), False Alarm Ratio (FAR), Heidke Skill Score (HSS), and Accuracy. The percentage of correct forecasts, the percentage of predicted events that occurred, the percentage of predicted events that didn't happen, the improvement in forecasting skill compared to a reference forecast, and the percentage of correct forecasts relative to the total number of forecasts are all measured by these scores. These scores measure the forecast's performance and are computed using the items of the contingency table. The CSI, TSS and HSS can be used for the forecasting skill score they are more complicated and need more useful verification parameters.
This study aims to determine the capability of the model to track real-time events and its validity can be checked through the thunder-storm indices. The model's skill score was used to validate its perfor-mance, and the simulated thunderstorm indices produced by the mod-el were compared with the ERA5 dataset. The model-generated indices showed good performance, except for an underestimation in the Raygada, Orissa case. To further analyze the data, weightage was given to the True Skill Statistics (TSS) and Heidke Skill Score (HSS), which consider only the correct forecasts, and not merely those made by chance. The optimal threshold of the indices obtained from both the model-simulated and reanalysis datasets demonstrated a positive correlation in almost all events and cases. The model's overestimation and underestimation were minimal, and no time lag or lead was observed. These findings suggest that the model can be used to predict the re-al-time occurrence of thunderstorms, regardless of their strength. The various indices, coupled with the implementation of skill scores, can effectively predict thunderstorms.
Author Contributions
Unashish Mondal and S. K. Panda developed the idea of manuscript and methodology, provided the model development and calculations, and experimental data, Anish Kumar and Unashish Mondal processed the data and plotting. Unashish Mondal, Anish Kumar, Someshwar Das and S. K. Panda contributed to the draft preparation and Someshwar Das, Devesh Sharma and S. K. Panda contributed to analysis and final correction of the manuscript.
Funding
This research received no external funding.
Institutional Review Board Statement
Not applicable.
Informed Consent Statement
Not applicable.
Data Availability Statement
Data are available upon request to the corresponding author.
Acknowledgments
We are gratefully to thank the Earth Observatory System and Science Programme (NASA/GHRC) for providing the TRMM/LIS data and ECMWF for ERA5 datasets. We also thank to MOSDAC for providing cloud brightness temperature images. This work is supported by the MoES project (MoES/16/09/2018-RDEAS/THUMP-4) sponsored by the Ministry of Earth Science (MoES), Government of India.
Conflicts of Interest
No conflict of Interest.
Appendix A
Calculation of Thunderstorm Indices
1. Convective Available Potential Energy (CAPE)
Convective Available Potential Energy (CAPE) is a unit used to describe how much energy is available for convection in the atmosphere. It is determined by dividing the temperature of an ascending parcel of air by the temperature of the surrounding area. The energy available for convection increases with the magnitude of the temperature difference between the two temperatures. Convection, a natural mechanism that releases energy, can result in the formation of thunderstorms and other types of severe weather. The development of violent thunderstorms and other types of weather is greatly influenced by CAPE, which is commonly expressed in joules per kilogramme (J/kg).
CAPE = ∫_(Z_LFC)^(Z_LNB)▒〖g (T_(ve- T_vp )/T_vp ) 〗 dz
Whereas;
ZLNB = Equilibrium height
ZLFC = Level of free convection
Tve = Environmental virtual temperature
Tvp = Parcel virtual temperature
g = Gravity
2. K Index (KI)
The K Index is a measure of thunderstorm potential in a given area. It is calculated using a combination of temperature, humidity, and wind data from a number of different levels in the atmosphere (George 1960). A high K Index value indicates that the atmosphere is likely to be unstable and that thunderstorms are more likely to develop. A low K Index value, on the other hand, indicates that the atmosphere is stable, and that thunderstorm activity is less likely.
K = (T850 – T500) + Td 850 – (T700 – Td 700)
Whereas;
T850 = Temperature at 850 hPa
T500 = Temperature at 500 hPa
T700 = Temperature at 700 hPa
Td700 = Dew point Temperature at 700 hPa
Td850 = Dew point Temperature at 850 hPa
3. Cross Totals Index (CT Index)
The Cross Totals Index (CTI) is a measure of atmospheric stability. It is calculated using temperature and dew point temperature data from a number of different levels in the atmosphere (Miller 1967). High CT Index values suggest unstable weather and thunderstorms. However, a low CT Index indicates a stable environment and less thunderstorm activity.
CT = Td 850 – T500
Whereas;
T500 = Temperature at 500 hPa
Td850 = Dew point Temperature at 850 hPa
4. Vertical Totals Index (VT Index)
The Vertical Totals index is the difference between the temperature at different levels. The temperature between the 850 hPa and 500 hPa has been considered (Miller 1972). A high VT value suggests an unstable atmosphere and more thunderstorms.
VT = T850 – T500
Whereas.
T850 = Temperature at 850 hPa
T500 = Temperature at 500 hPa
5. Total Totals Index (TTI)
The Total Totals index is the arithmetic combination of VT index and CT index. The TTI considered as most important predictor for short term thunderstorm prediction (Miller 1967).
TTI = VT + CT
TTI = T850 + Td 850 – 2T 500
Whereas.
T850 = Temperature at 850 hPa
T500 = Temperature at 500 hPa
Td850 = Dew point Temperature at 850 hPa
6. Dew Point
The dew point is often used in meteorology to predict the likelihood of fog and other forms of moisture in the atmosphere. It is also used to assess the stability of the atmosphere and to predict the likelihood of thunderstorm activity. The dew point here is taken at 850 hPa.
7. Potential Instability (POT)
Potential instability means the atmosphere could become unstable and cause convective weather events like thunderstorms (Haklander and Valden 2003). The calculation has been done by taking difference between 850 hPa and 500 hPa equivalent potential temperature. The main cause for the potential instability is: Temperature differences, Wind shear, Humidity, and Topography.
POT = (θ_(e_850 )-θ_e500 )
Whereas;
θ_(e_850 =Equivalent Potential Temperature at 850 hPa )
θ_(e_500 =Equivalent Potential Temperature at 500 hPa )
8. Storm Relative Helicity (SRH)
A measure of streamwise vorticity within the storm inflow layer, storm-relative helicity (SRH) is proportionate to the area swept out between the hodograph and the storm motion. The first SRH tornado forecasting test was conducted by Davies-Jones et al. in 1990. The effectiveness of SRH in distinguishing between tornadic and non-tornadic supercells has been demonstrated in studies by Rasmussen and Blanchard (1998), Thompson et al. (2003), and Thompson et al. (2007). The 0-3 km layer was emphasised in the early versions of SRH as a representation of the low-level air mass that fuels a thunderstorm updraft.
SRH = -∫_0^h▒〖k ̂⋅(v ⃗-v ⃗ storm)* (ⅆv ⃗)/ⅆz〗 ⅆz
where v⃗ − v⃗ storm is the storm relative wind, dv⃗ ⁄ dz is the vertical wind shear and k is the unit vector in the upward direction.
9. Energy Helicity Index (EHI)
The energy helicity index is calculated by combination of the two indexes: Product of CAPE and Storm Relative Helicity (SRH) at 0-3 Km level divided by 160000 (Davis 1993). As a parcel of air rises from the lower PBL, the CAPE measures how much instability is there. The combination of storm input into the streamwise vorticity and low-level shearing, sometimes results in helicity.
EHI = (CAPE x SRH) / 160,000.
10. Supercell Composite Parameter (SCP)
The SCP, or Supercell Composite Parameter, was developed by Thompson et al. (2003) and is calculated as a result of various factors. SCP initially computed using CAPE, 0-6 km bulk shear, and 0-3 km SRH. To avoid exceeding any predetermined threshold for supercells or tornadoes, SCP and STP should only be used to highlight areas with the best mix of components.
SCP = (muCAPE/(1000 J/Kg))* (ESRH/(50 m^2 s^2 ))* (EBWD/(20 m/s))*((-40J/Kg)/muCIN)
ESRH, based on Bunkers right supercell motion), most unstable parcel CAPE (muCAPE) and convective inhibition (muCIN), and effective bulk wind difference (EBWD
11. Significant Tornado Parameter (STP)
STP was developed by Thompson et al. 2003 and it required CAPE, 0-6 Km bulk shear, 0-1 Km SRH and Lifted Condensation Level (LCL).
STP = (mlCAPE/(1500 J/Kg))*(ESRH/(150m^2 s^2 ))*(EBWD/(12 m/s))*((2000-mlLCL)/(1500 m))*(200 J/Kg+mlCIN)/(150 J/Kg)
where "ml" denotes the lowest 100 mb mean parcel, ESRH = the effective storm-relative helicity, EBWD = the effective bulk wind difference over the lower half of the storm depth (effective inflow base to EL height
12. Pressure Lifting Condensation Level (PLCL)
The pressure lifting condensation level has been calculated using the dew point temperature at 2 meter above the ground, temperature 2 meter above the ground and surface pressure. The lifted condensation level, also known as the lifting condensation level (LCL), is the height or pressure at which an air parcel's relative humidity (RH) will achieve 100% with respect to liquid water after being cooled by dry adiabatic raising. It can be used as an acceptable approximation of cloud base height (Saucier 1955).
13. Deep Layer Shear (DLS)
Wind shear is an important aspect of the thunderstorm. The deep layer shear is calculated using the U and V component of wind at 500 hPa and 10 meter above the ground. The DLS when greater than 10m/s 5 percent chance of thunderstorm occurrence and if it is more than 25 m/s than 15 percent chance of extremely severe thunderstorm.
14. Low Layer Shear (LLS)
The low layer shear is calculated using the U and V component of wind at 900 hPa and 10 meter above the ground. The LLS when greater than 10m/s 5 percent chance of thunderstorm occurrence and if it is more than 20 m/s than 15 percent chance of extremely severe thunderstorm.
Appendix B
Model Skill Score
Total Seven model skill score have been calculated in this study, calculation has been done based on contingency table, given in table.
a = number of times a "yes" forecast was followed by a "yes" occurrence = "hits"
b = number of times a "yes" forecast was followed by a "no" occurrence = "false alarms"
c = number of times a "no" forecast was followed by a "yes" occurrence = "misses"
d = number of times a "no" forecast was followed by a "no" occurrence = "correct non-events"
1. ACC (Accuracy)
ACC=(a+b)/(a+b+c+d)
ACC explains what fraction of the forecasts were correct, 0 – 1, range is there with 1 being a perfect score.
2. CSI (Critical Skill Score)
CSI=a/(a+b+c)
The CSI range is 0 -1, and 1 is the perfect score; CSI includes both false alarms and surprise events, however, events with different frequencies cannot be compared.
3. ETS (Equitable Threat Score)
ETS=(a-a_random)/(a+b+c-a_random )
a_random=((a+b)×(a+c))/(a+b+c+d)
ETS explains how well the forecast did “Yes” events correspond to the observed “yes” events (accounting for hits that would be expected by chance). -1/3 – 1, with 1 being a perfect score and 0 indicates no skill, a_random is the number of hits for random forecasts.
4. FAR (False Alarm Rate)
FAR=b/(a+b)
The range of FAR is 0 – 1, as 0 is the perfect score; FAR increases with underestimating the events.
5. HSS (Heidke Skill Score)
HSS=(a+d-R)/(a+b+c+d-r)
R=((a+b)×(a+c)+(c+d)×(b+d))/(a+b+c+d)
HSS measures the fraction of correct forecast after eliminating those forecasts which would be correct due purely to random chance. Range of HSS is -1 – 1, and 1 indicates the perfect score.
6. POD (Probability of Detection)
POD=a/(a+c)
POD range is 0 – 1, and 1 is the perfect score; POD increases with overestimated events; it includes no false alarms.
7. TSS (True Skill Statistic)
TSS=(a ×d-b ×c)/((a+c)×(b+d))
TSS explains how well the forecast separated the “yes” events from the “no” events; range of the TSS is -1 – 1, as 0 indicates no skill; and 1 indicates the perfect score.
References
- Yair, Y.; Lynn, B.; Price, C.; Kotroni, V.; Lagouvardos, K.; Morin, E.; Mugnai, A.; Llasat, M.d.C. Predicting the potential for lightning activity in Mediterranean storms based on the Weather Research and Forecasting (WRF) model dynamic and microphysical fields. Journal of Geophysical Research 2010, 115. [Google Scholar] [CrossRef]
- Yair, Y.; Lynn, B.; Ziv, B.; Yaffe, M. Lightning super-bolts in Eastern Mediterranean winter thunderstorms. In Proceedings of the EGU General Assembly Conference Abstracts; 2020; p. 1788. [Google Scholar]
- Doswell, C.A. The distinction between large-scale and mesoscale contribution to severe convection: A case study example. Weather and Forecasting 1987, 2, 3–16. [Google Scholar] [CrossRef]
- Das, S. Severe thunderstorm observation and modeling—a review. Vayu Mandal 2017, 43, 1–29. [Google Scholar]
- Kunz, M. The skill of convective parameters and indices to predict isolated and severe thunderstorms. Natural Hazards and Earth System Sciences 2007, 7, 327–342. [Google Scholar] [CrossRef]
- Anquetin, S.; Yates, E.; Ducrocq, V.; Samouillan, S.; Chancibault, K.; Davolio, S.; Accadia, C.; Casaioli, M.; Mariani, S.; Ficca, G. The 8 and 9 September 2002 flash flood event in France: a model intercomparison. Natural Hazards and Earth System Sciences 2005, 5, 741–754. [Google Scholar] [CrossRef]
- Das, Y. Some aspects of thunderstorm over India during pre-monsoon season: a preliminary report-I. Journal of Geosciences and Geomatics 2015, 3, 68–78. [Google Scholar]
- Yadava, P.K.; Soni, M.; Verma, S.; Kumar, H.; Sharma, A.; Payra, S. The major lightning regions and associated casualties over India. Natural Hazards 2020, 101, 217–229. [Google Scholar] [CrossRef]
- Siingh, D.; Buchunde, P.; Singh, R.; Nath, A.; Kumar, S.; Ghodpage, R. Lightning and convective rain study in different parts of India. J Atmospheric research 2014, 137, 35–48. [Google Scholar] [CrossRef]
- Mondal, U.; Panda, S.K.; Das, S.; Sharma, D. Spatio-temporal variability of lightning climatology and its association with thunderstorm indices over India. Theoretical and Applied Climatology 2022, 1–17. [Google Scholar] [CrossRef]
- Saha, U.; Siingh, D.; Kamra, A.K.; Galanaki, E.; Maitra, A.; Singh, R.P.; Singh, A.K.; Chakraborty, S.; Singh, R. On the association of lightning activity and projected change in climate over the Indian sub-continent. Atmospheric Research 2017, 183, 173–190. [Google Scholar] [CrossRef]
- Albrecht, R.I.; Goodman, S.J.; Buechler, D.E.; Blakeslee, R.J.; Christian, H.J. Where are the lightning hotspots on Earth? J Bulletin of the American Meteorological Society 2016, 97, 2051–2068. [Google Scholar] [CrossRef]
- Hoddinott, M. THUNDERSTORM OBSERVATIONS IN WEST BENGAL 1945–46. Weather 1986, 41, 2–5. [Google Scholar] [CrossRef]
- Mushtaq, F.; Lala, M.G.N.; Anand, A.J.J.o.A.; Physics, S.-T. Spatio-temporal variability of lightning activity over J&K region and its relationship with topography, vegetation cover, and absorbing aerosol index (AAI). 2018, 179, 281–292. [Google Scholar]
- Barthlott, C.; Corsmeier, U.; Meißner, C.; Braun, F.; Kottmeier, C. The influence of mesoscale circulation systems on triggering convective cells over complex terrain. Atmospheric research 2006, 81, 150–175. [Google Scholar] [CrossRef]
- Orville, H.D. A photogrammetric study of the initiation of cumulus clouds over mountainous terrain. Journal of Atmospheric Sciences 1965, 22, 700–709. [Google Scholar] [CrossRef]
- Mapes, B.; Houze Jr, R.A. An integrated view of the 1987 Australin monsoon and its mesoscale convective systems. II: Vertical structure. Quarterly Journal of the Royal Meteorological Society 1993, 119, 733–754. [Google Scholar] [CrossRef]
- Haklander, A.J.; Van Delden, A. Thunderstorm predictors and their forecast skill for the Netherlands. Atmospheric Research 2003, 67, 273–299. [Google Scholar] [CrossRef]
- Kaltenböck, R.; Diendorfer, G.; Dotzek, N. Evaluation of thunderstorm indices from ECMWF analyses, lightning data and severe storm reports. Atmospheric Research 2009, 93, 381–396. [Google Scholar] [CrossRef]
- Guerova, G.; Dimitrova, T.; Georgiev, S. Thunderstorm classification functions based on instability indices and GNSS IWV for the Sofia Plain. Remote Sensing 2019, 11, 2988. [Google Scholar] [CrossRef]
- Bondyopadhyay, S.; Mohapatra, M. Determination of suitable thermodynamic indices and prediction of thunderstorm events for Eastern India. Meteorology and Atmospheric Physics 2023, 135, 1–13. [Google Scholar] [CrossRef]
- Bondyopadhyay, S.; Mohapatra, M.; Sen Roy, S. Determination of suitable thermodynamic indices and prediction of thunderstorm events for Kolkata, India. Meteorology and Atmospheric Physics 2021, 133, 1367–1377. [Google Scholar] [CrossRef]
- Sahu, R.K.; Dadich, J.; Tyagi, B.; Vissa, N.K.; Singh, J. Evaluating the impact of climate change in threshold values of thermodynamic indices during pre-monsoon thunderstorm season over Eastern India. Natural Hazards 2020, 102, 1541–1569. [Google Scholar] [CrossRef]
- Mukhopadhyay, P.; Sanjay, J.; Singh, S. Objective forecast of thundery/nonthundery days using conventional indices over three northeast Indian stations. Mausam 2003, 54, 867–880. [Google Scholar] [CrossRef]
- Umakanth, N.; Satyanarayana, G.C.; Simon, B.; Rao, M.; Babu, N.R. Long-term analysis of thunderstorm-related parameters over Visakhapatnam and Machilipatnam, India. Acta Geophysica 2020, 68, 921–932. [Google Scholar] [CrossRef]
- Stone, H.M. A comparison among various thermodynamic parameters for the prediction of convective activity. 1985.
- Johns, R.H.; Doswell III, C.A. Severe local storms forecasting. Wea. Forecasting 1992, 7, 588–612. [Google Scholar] [CrossRef]
- Wilson, J.W.; Mueller, C.K. Nowcasts of thunderstorm initiation and evolution. Weather and Forecasting 1993, 8, 113–131. [Google Scholar] [CrossRef]
- Schultz, P. Relationships of several stability indices to convective weather events in northeast Colorado. Weather and Forecasting 1989, 4, 73–80. [Google Scholar] [CrossRef]
- Fuelberg, H.E.; Biggar, D.G. The preconvective environment of summer thunderstorms over the Florida panhandle. Weather and Forecasting 1994, 9, 316–326. [Google Scholar] [CrossRef]
- Huntrieser, H.; Schiesser, H.; Schmid, W.; Waldvogel, A. Comparison of traditional and newly developed thunderstorm indices for Switzerland. Weather and Forecasting 1997, 12, 108–125. [Google Scholar] [CrossRef]
- Brooks, H.; Wilhelmson, R. Numerical simulation of a low-precipitation supercell thunderstorm. Meteorology and Atmospheric Physics 1992, 49, 3–17. [Google Scholar] [CrossRef]
- Litta, A.; Mohanty, U. Simulation of a severe thunderstorm event during the field experiment of STORM programme 2006, using WRF–NMM model. Current Science 2008, 204–215. [Google Scholar]
- Skamarock, W.C.; Klemp, J.B. A time-split nonhydrostatic atmospheric model for weather research and forecasting applications. Journal of Computational Physics 2008, 227, 3465–3485. [Google Scholar] [CrossRef]
- Rajasekhar, M.; Sreeshna, T.; Rajeevan, M.; Ramakrishna, S. Prediction of severe thunderstorms over Sriharikota Island by using the WRF-ARW operational model. In Proceedings of the Remote sensing and modeling of the atmosphere, oceans, and interactions VI; 2016; pp. 147–164. [Google Scholar]
- Huang, H.; Lin, C.; Chen, Y. Sensitivity Analysis of Weather Research and Forecasting (WRF) Model Output Variables to The Thunderstorm Lifecycle and Its Application. 2022.
- Dhawan, V.; Tyagi, A.; Bansal, M. Forecasting of thunderstorms in pre-monsoon season over northwest India. Mausam 2008, 59, 433–444. [Google Scholar] [CrossRef]
- Tyagi, B.; Naresh Krishna, V.; Satyanarayana, A. Study of thermodynamic indices in forecasting pre-monsoon thunderstorms over Kolkata during STORM pilot phase 2006–2008. Natural hazards 2011, 56, 681–698. [Google Scholar] [CrossRef]
- Robinson, E.D.; Trapp, R.J.; Baldwin, M.E. The geospatial and temporal distributions of severe thunderstorms from high-resolution dynamical downscaling. Journal of Applied Meteorology and Climatology 2013, 52, 2147–2161. [Google Scholar] [CrossRef]
- Tajbakhsh, S.; Ghafarian, P.; Sahraian, F. Instability indices and forecasting thunderstorms: the case of 30 April 2009. Natural Hazards and Earth System Sciences 2012, 12, 403–413. [Google Scholar] [CrossRef]
- Gubenko, I.M.; Rubinshtein, K.G. Thunderstorm activity forecasting based on the model of cumulonimbus cloud electrification. Russian Meteorology and Hydrology 2017, 42, 77–87. [Google Scholar] [CrossRef]
- Peppler, R.A. A review of static stability indices and related thermodynamic parameters. ISWS Miscellaneous Publication MP-104 1988.
- LAMB, P.; PEPPLER, R. Tropospheric static stability and central North American rainfall during 1979. In Proceedings of the NOAA Proc. of the 9 th Ann. Climate Diagnostics Workshop p 274-283(SEE N 86-11763 02-47); 1985. [Google Scholar]
- Markowski, P.M.; Straka, J.M.; Rasmussen, E.N.; Blanchard, D.O. Variability of storm-relative helicity during VORTEX. Monthly weather review 1998, 126, 2959–2971. [Google Scholar] [CrossRef]
- Thompson, R.L.; Edwards, R.; Mead, C.M. An update to the supercell composite and significant tornado parameters. In Proceedings of the Preprints, 22nd Conf. on Severe Local Storms, Hyannis, MA, Amer. Meteor. Soc. P; 2004. [Google Scholar]
- Rasmussen, E.N. Refined supercell and tornado forecast parameters. Weather and Forecasting 2003, 18, 530–535. [Google Scholar] [CrossRef]
- George, J.J. Weather forecasting for aeronautics; Academic press, 2014. [Google Scholar]
- Moncrieff, M.W.; Miller, M.J. The dynamics and simulation of tropical cumulonimbus and squall lines. Quarterly Journal of the Royal Meteorological Society 1976, 102, 373–394. [Google Scholar] [CrossRef]
- Johns, R.H.; Davies, J.M.; Leftwich, P.W. Some wind and instability parameters associated with strong and violent tornadoes, 2, Variations in the combinations of wind and instability parameters. GEOPHYSICAL MONOGRAPH-AMERICAN GEOPHYSICAL UNION 1993, 79, 583–583. [Google Scholar]
- Kulikov, M.Y.; Belikovich, M.V.; Skalyga, N.K.; Shatalina, M.V.; Dementyeva, S.O.; Ryskin, V.G.; Shvetsov, A.A.; Krasil’nikov, A.A.; Serov, E.A.; Feigin, A.M. Skills of thunderstorm prediction by convective indices over a metropolitan area: comparison of microwave and radiosonde data. Remote Sensing 2020, 12, 604. [Google Scholar] [CrossRef]
- Schaefer, J.T. The critical success index as an indicator of warning skill. Weather and forecasting 1990, 5, 570–575. [Google Scholar] [CrossRef]
- DOSWELL, C.; Davies-Jones, R.; Keller, D.L. On summary measures of skill in rare event forecasting based on contingency tables. Weather and forecasting 1990, 5, 576–585. [Google Scholar] [CrossRef]
- NCEP GDAS/FNL 0. 25 Degree Global Tropospheric Analyses and Forecast Grids. 2015. [CrossRef]
- Hersbach, H.; Bell, B.; Berrisford, P.; Biavati, G.; Dee, D.; Horányi, A.; Nicolas, J.; Peubey, C.; Radu, R.; Rozum, I. The ERA5 Global Atmospheric Reanalysis at ECMWF as a comprehensive dataset for climate data homogenization, climate variability, trends and extremes. In Proceedings of the Geophysical Research Abstracts; 2019. [Google Scholar]
- Blakeslee, R.J.; Lang, T.J.; Koshak, W.J.; Buechler, D.; Gatlin, P.; Mach, D.M.; Stano, G.T.; Virts, K.S.; Walker, T.D.; Cecil, D.J.J.J.o.G.R.A. Three years of the lightning imaging sensor onboard the international space station: Expanded global coverage and enhanced applications. 2020, 125, e2020JD032918. [Google Scholar] [CrossRef]
- Wheatcroft, E. Interpreting the skill score form of forecast performance metrics. International Journal of Forecasting 2019, 35, 573–579. [Google Scholar] [CrossRef]
- Miller, R. C (1967) Notes on analysis and severe storm forecasting procedures of the Military Weather Warning Center Tech. Rep. 200, AWS, US Air Force 94 [Headquarters, AWS, Scott AFB, IL 62225].
- Miller, R.C. Notes on analysis and severe-storm forecasting procedures of the Air Force Global Weather Central (No. AWS-TR-200-REV). Air Weather Service Scott Afb Il. 1972. [Google Scholar]
Figure 1.
WRF model double nested domain and topography (m), horizontal resolution are D01-9 Km and D02-3 km resolution over (a) Udaipur, Rajasthan (11 July 2021), (b) Surendranagar, Gujarat (04 June 2021), (c) Hooghly, West Bengal (07 June 2021), & (d) Raygada, Odisha (24 June 2020.
Figure 1.
WRF model double nested domain and topography (m), horizontal resolution are D01-9 Km and D02-3 km resolution over (a) Udaipur, Rajasthan (11 July 2021), (b) Surendranagar, Gujarat (04 June 2021), (c) Hooghly, West Bengal (07 June 2021), & (d) Raygada, Odisha (24 June 2020.
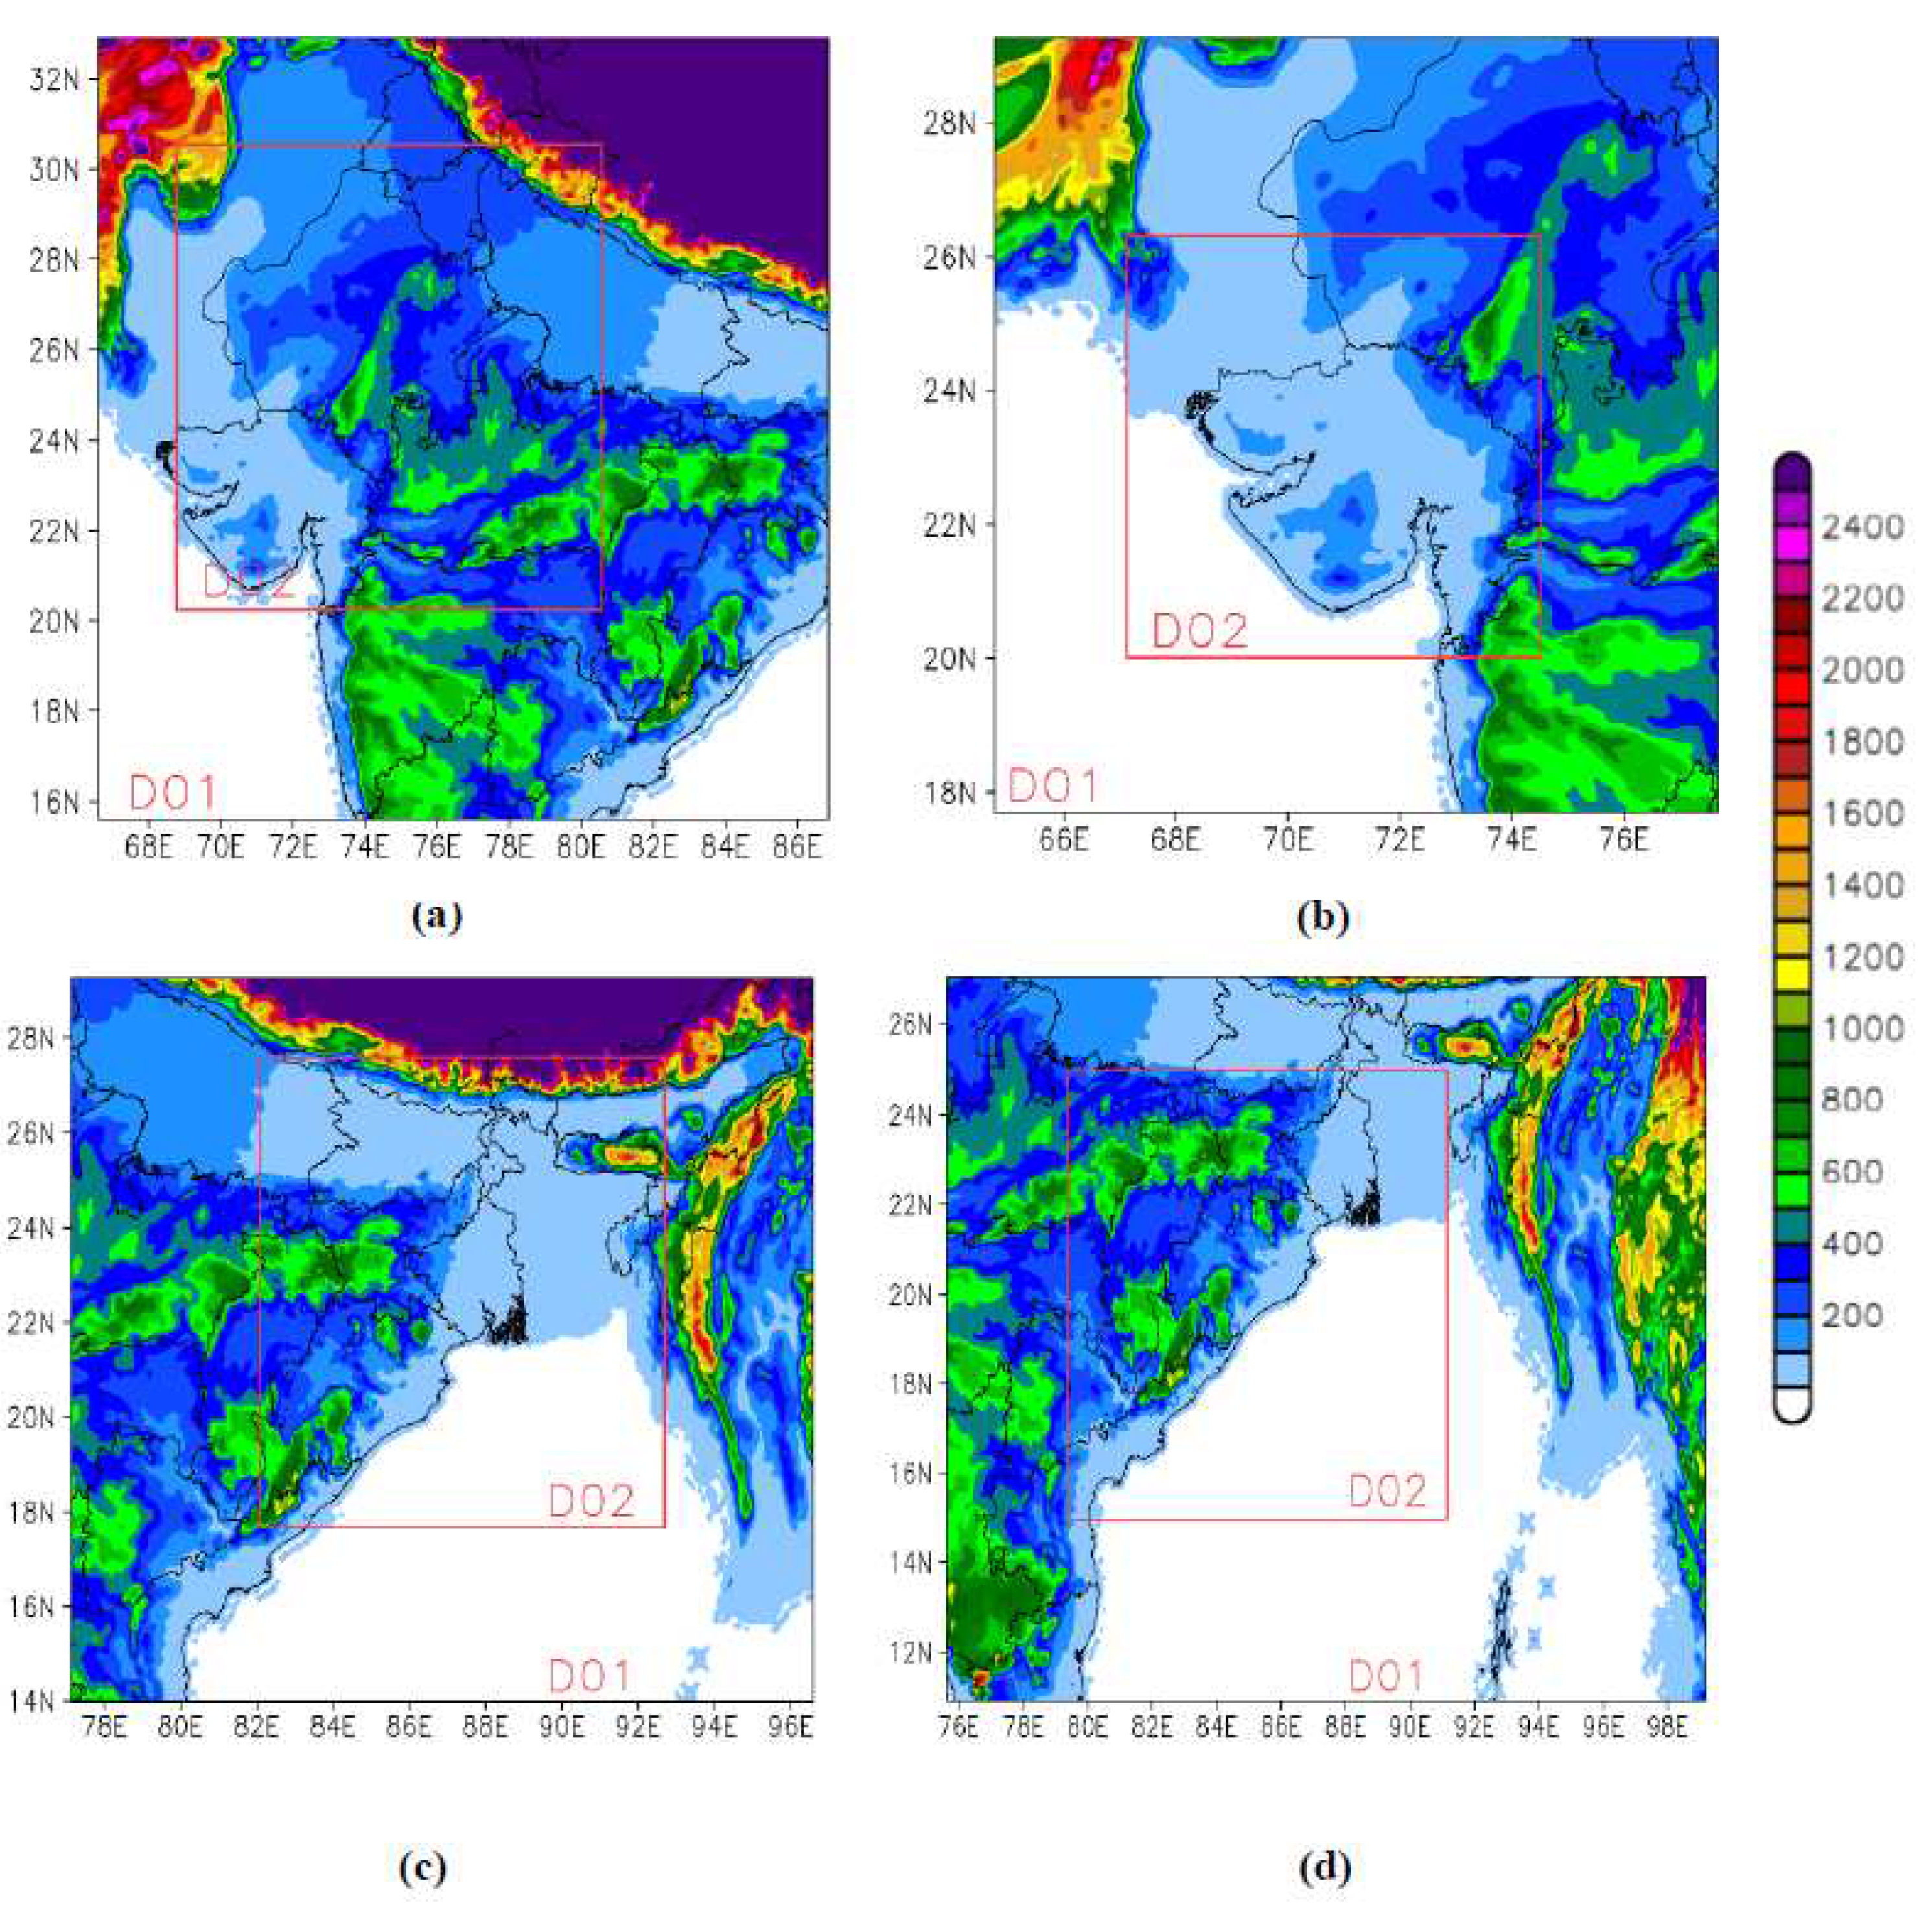
Figure 2.
cloud brightness temperature (K) over the domains, 0000 UTC, 1200 UTC using INSAT-3DR and lightning flash counts using ISS-LIS.
Figure 2.
cloud brightness temperature (K) over the domains, 0000 UTC, 1200 UTC using INSAT-3DR and lightning flash counts using ISS-LIS.
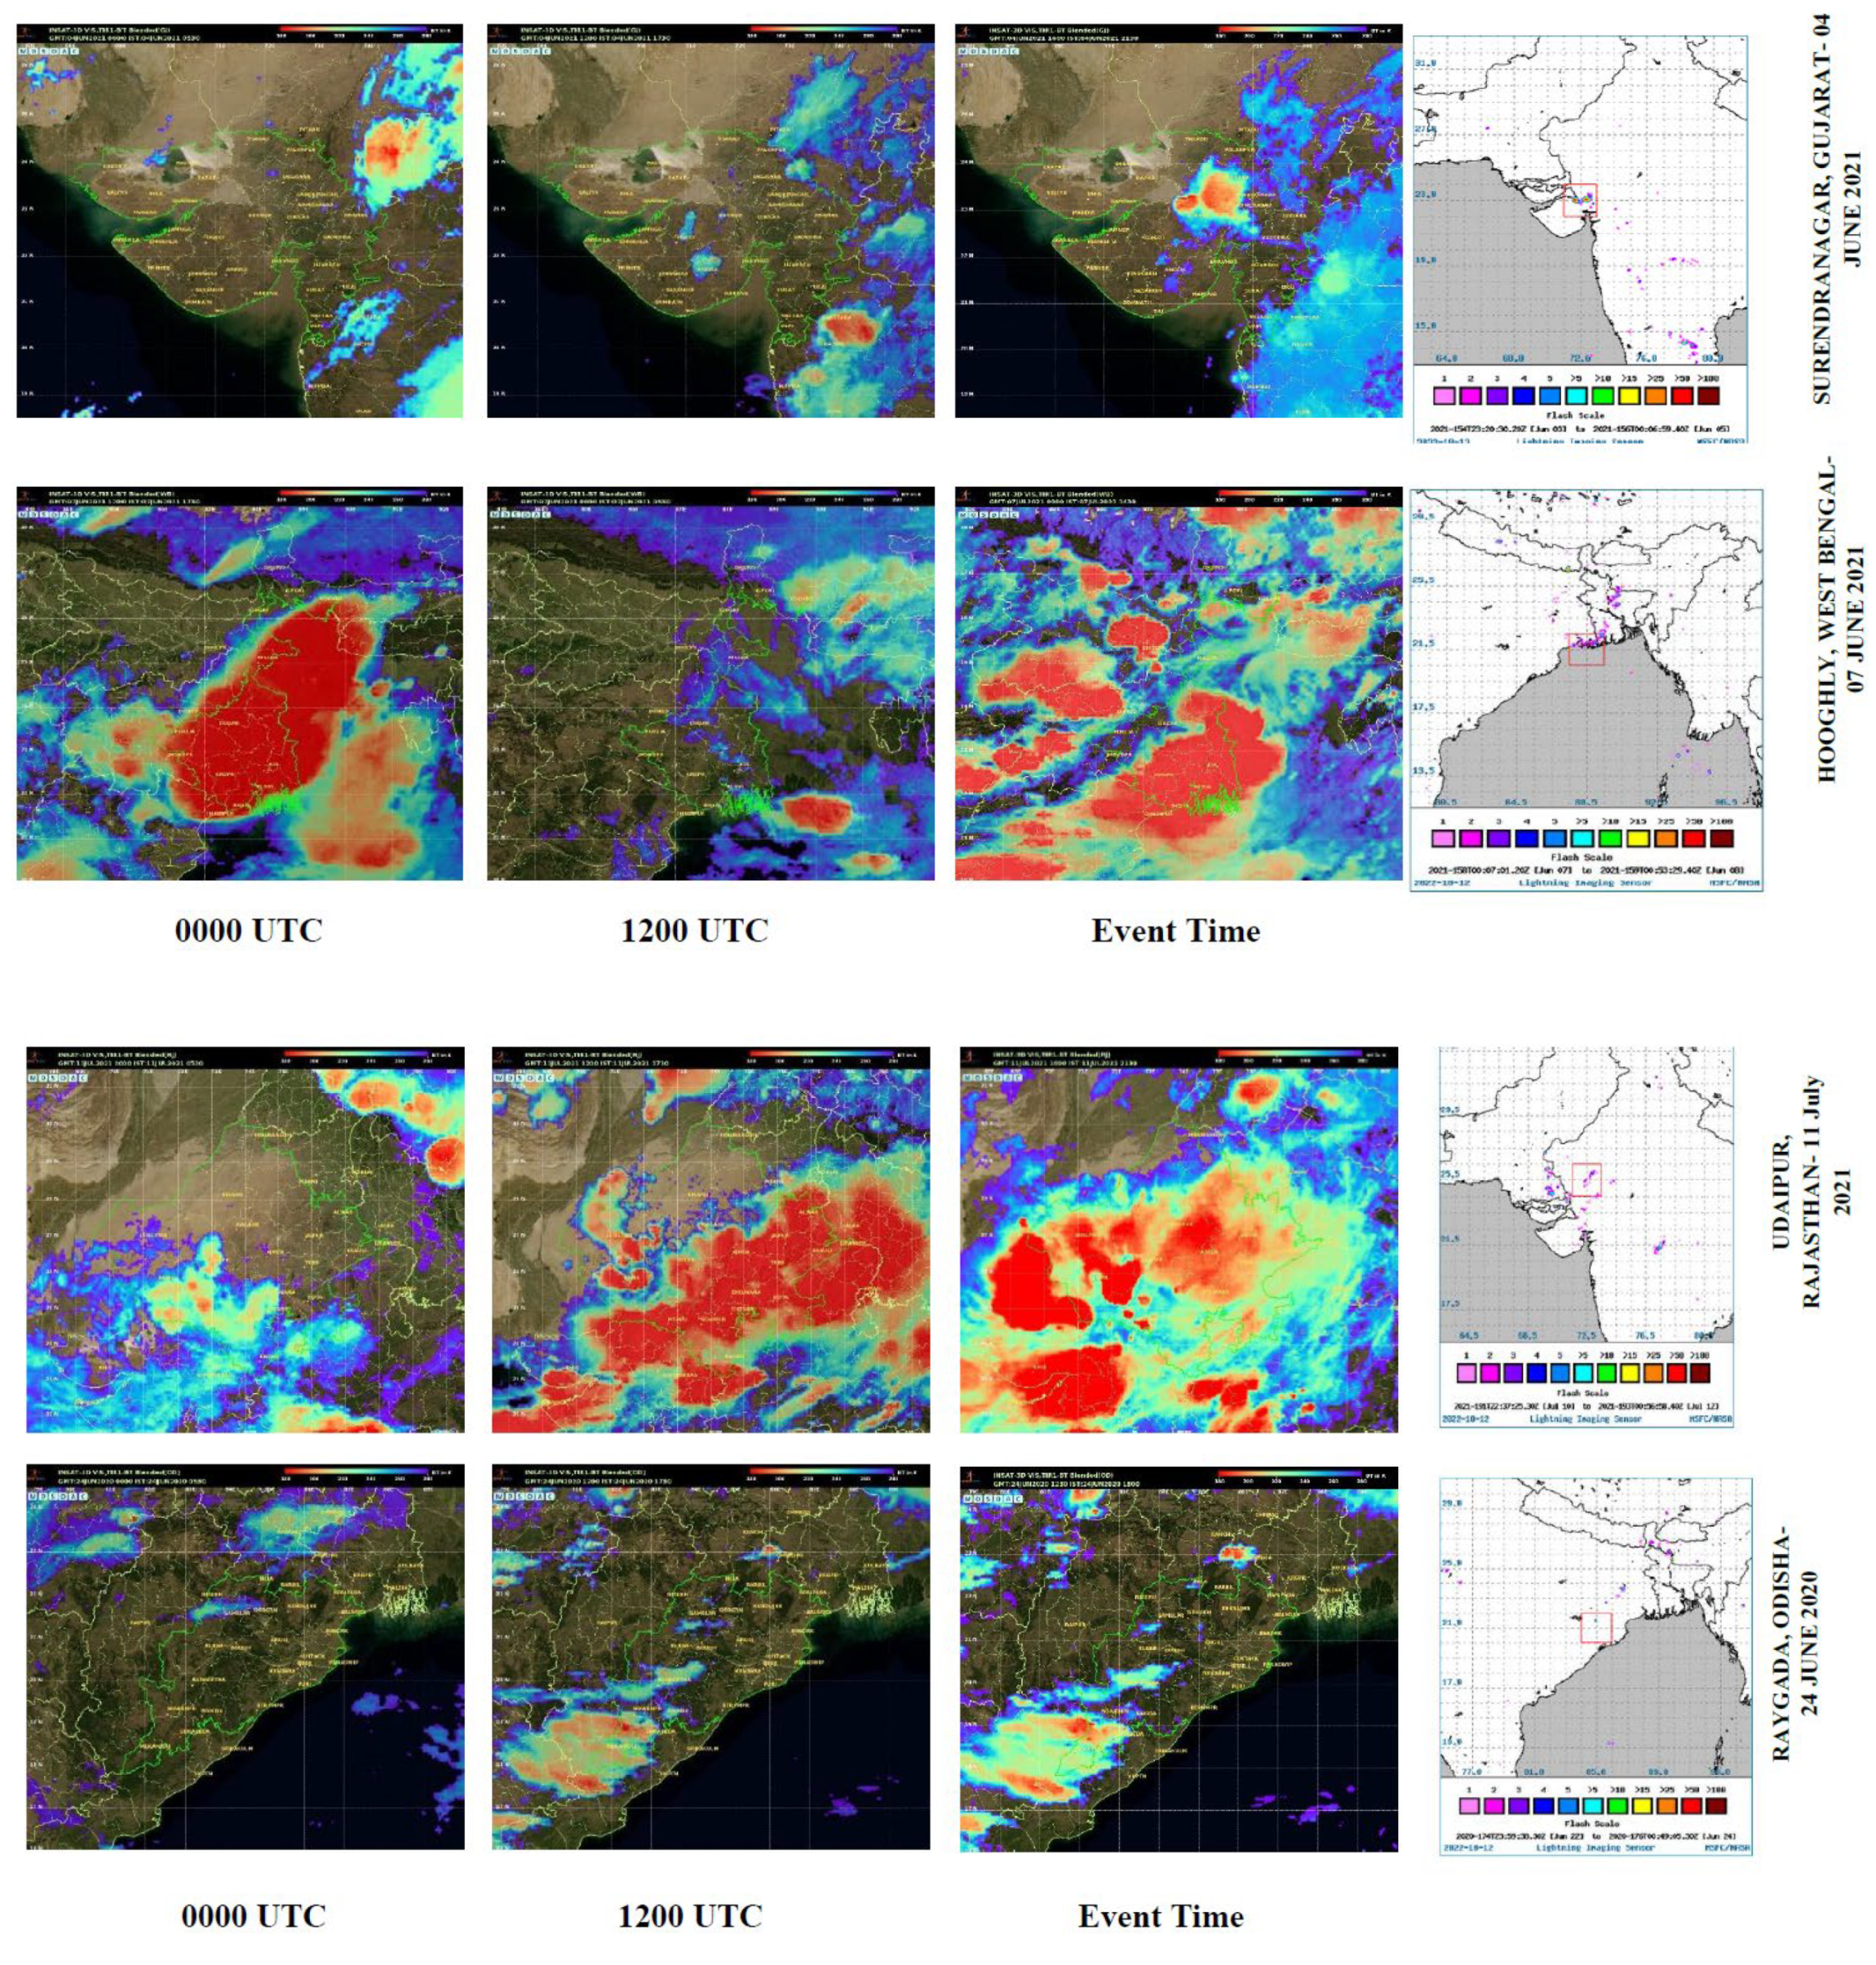
Figure 3.
Assessment of optimal threshold using several model skill score parameters for the Cross Totals (CT index) over Surendranagar, Gujarat.
Figure 3.
Assessment of optimal threshold using several model skill score parameters for the Cross Totals (CT index) over Surendranagar, Gujarat.
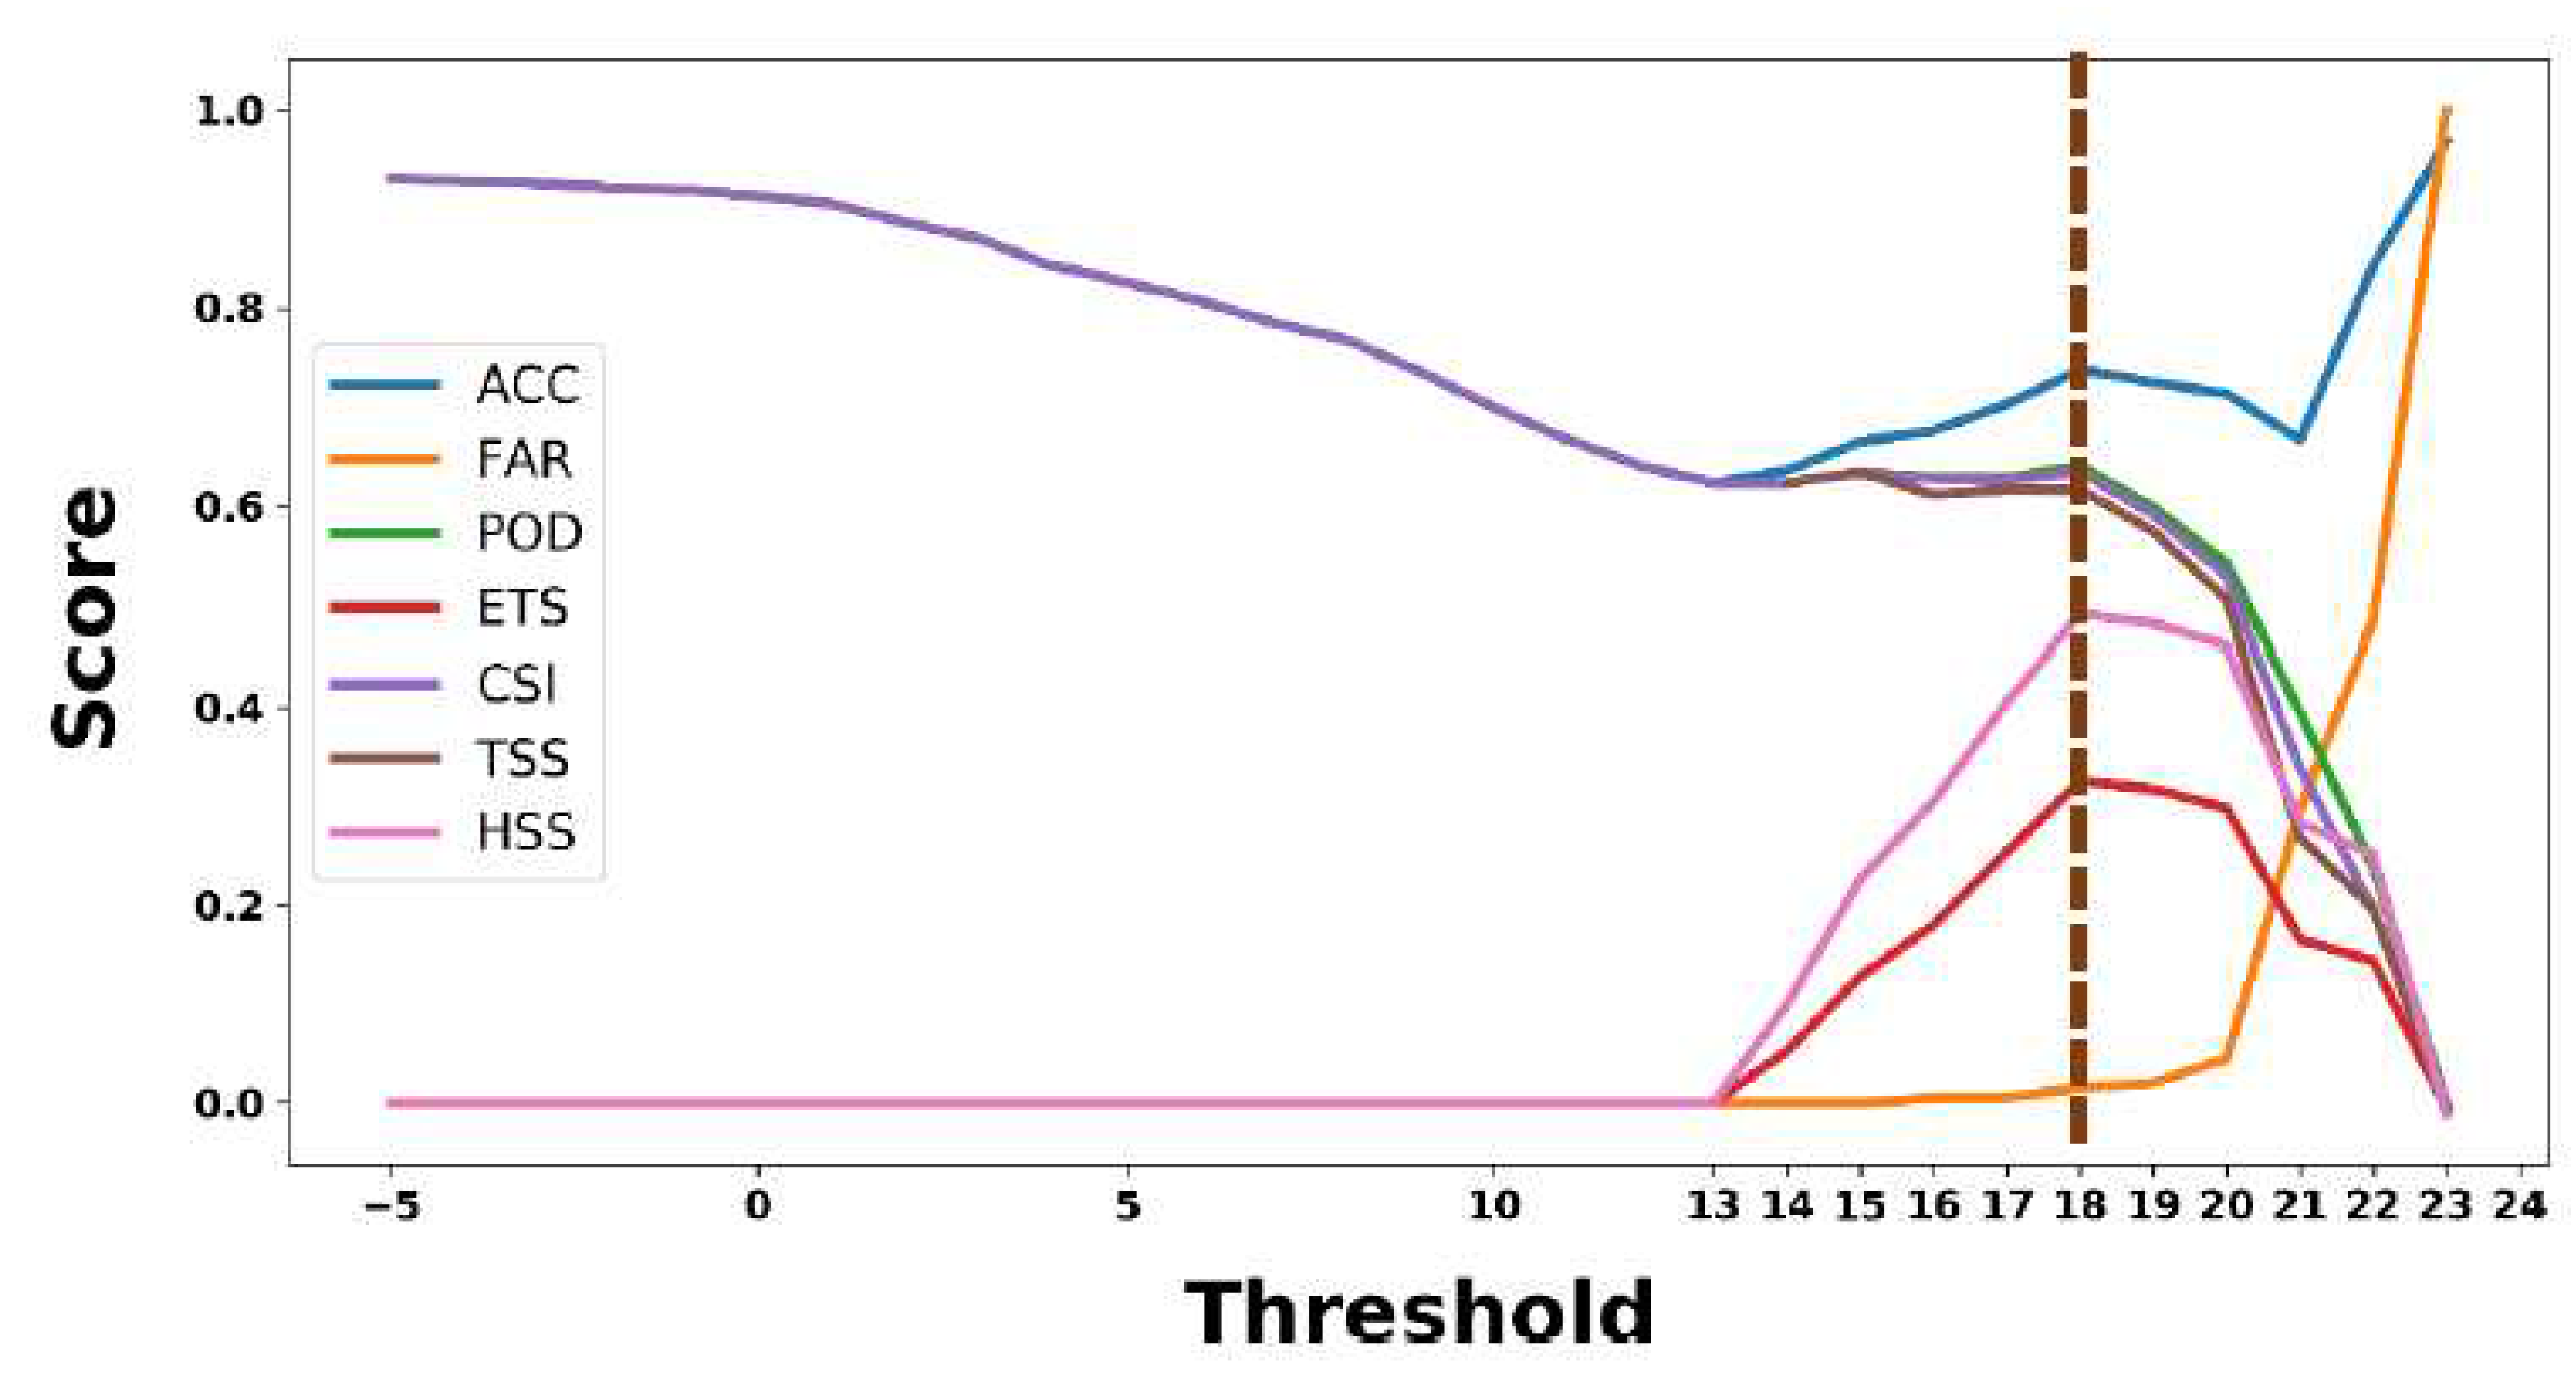
Figure 4.
Time series comparison of calculated thunderstorm indices using WRF model and ERA5 datasets over domain [24.5N 26.5N 71.5E 73.5E], the vertical box in red showing the time of event occurrence, at Udaipur, Rajasthan on 11 July 2021.
Figure 4.
Time series comparison of calculated thunderstorm indices using WRF model and ERA5 datasets over domain [24.5N 26.5N 71.5E 73.5E], the vertical box in red showing the time of event occurrence, at Udaipur, Rajasthan on 11 July 2021.
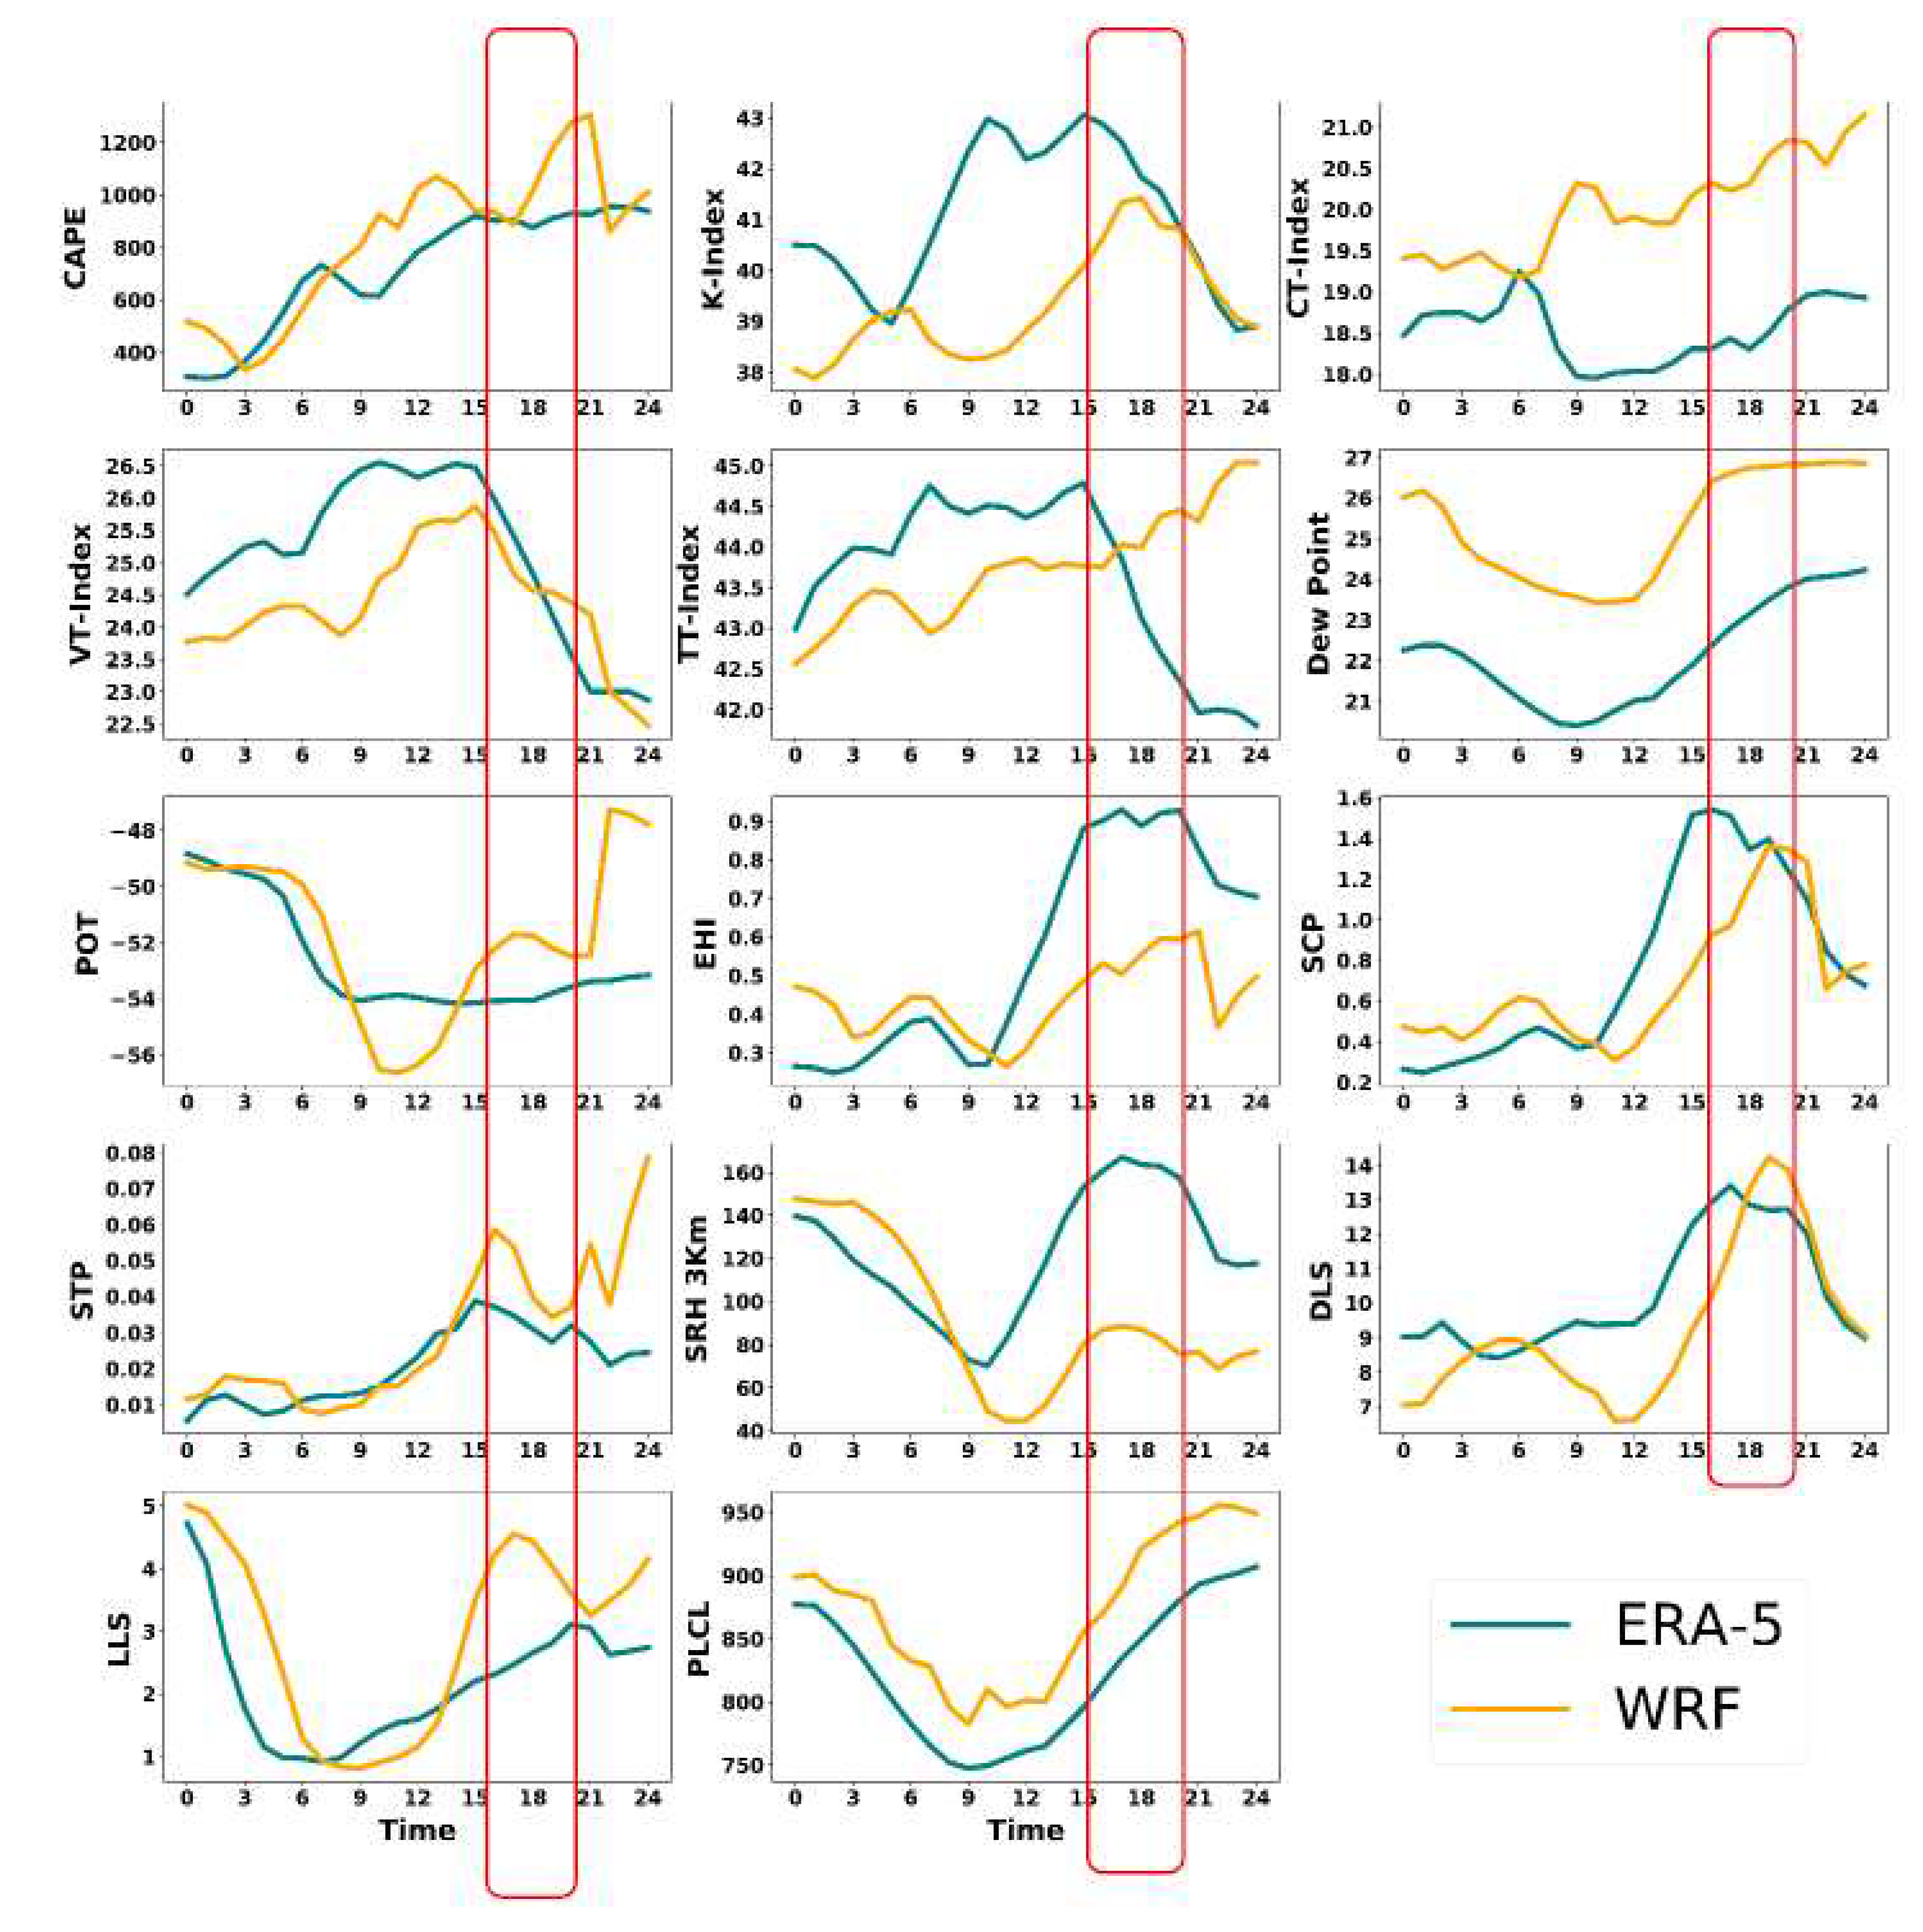
Figure 5.
Time series comparison of calculated thunderstorm indices using WRF model and ERA5 datasets over domain [22N 24N 71E 73E] the vertical box in red showing the time of event occurrence, at Surendranagar, Gujarat on 04 June 2021.
Figure 5.
Time series comparison of calculated thunderstorm indices using WRF model and ERA5 datasets over domain [22N 24N 71E 73E] the vertical box in red showing the time of event occurrence, at Surendranagar, Gujarat on 04 June 2021.
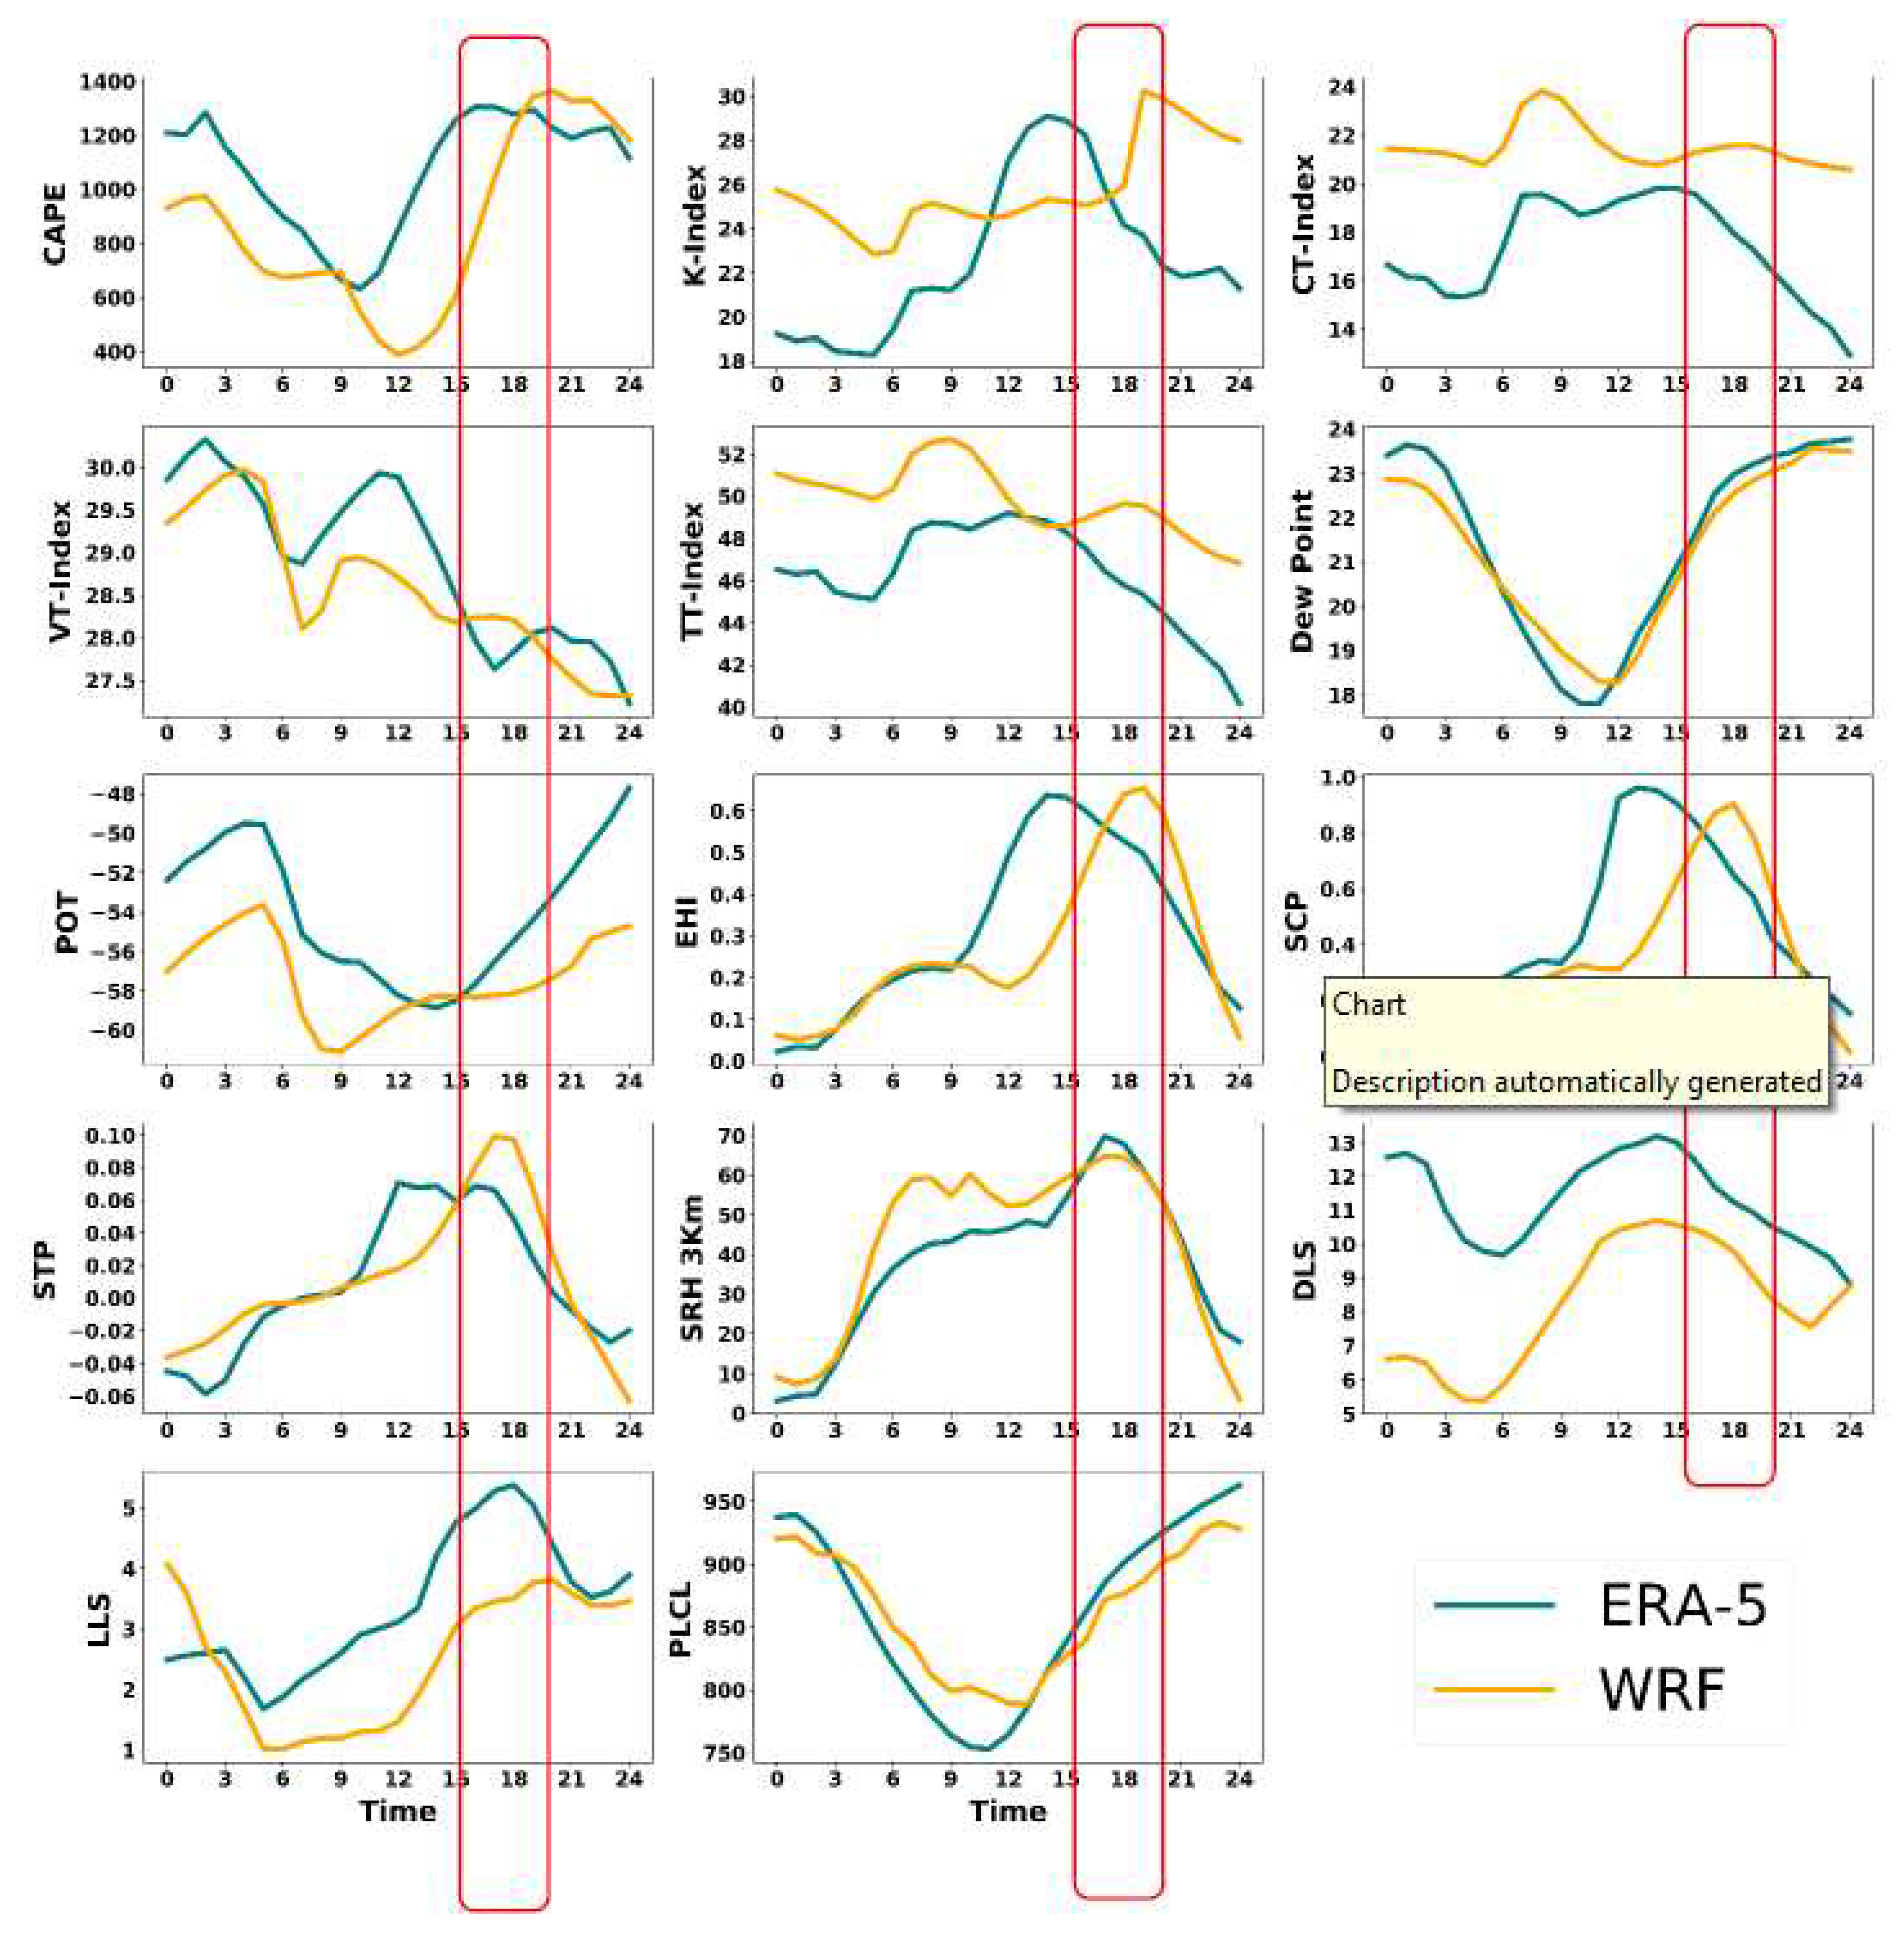
Figure 6.
Time series comparison of calculated thunderstorm indices using WRF model and ERA5 datasets over domain [20.5N 22.5N 87.5E 89.5E] the vertical box in red showing the time of event occurrence, at Hooghly, West Bengal on 07 June 2021.
Figure 6.
Time series comparison of calculated thunderstorm indices using WRF model and ERA5 datasets over domain [20.5N 22.5N 87.5E 89.5E] the vertical box in red showing the time of event occurrence, at Hooghly, West Bengal on 07 June 2021.
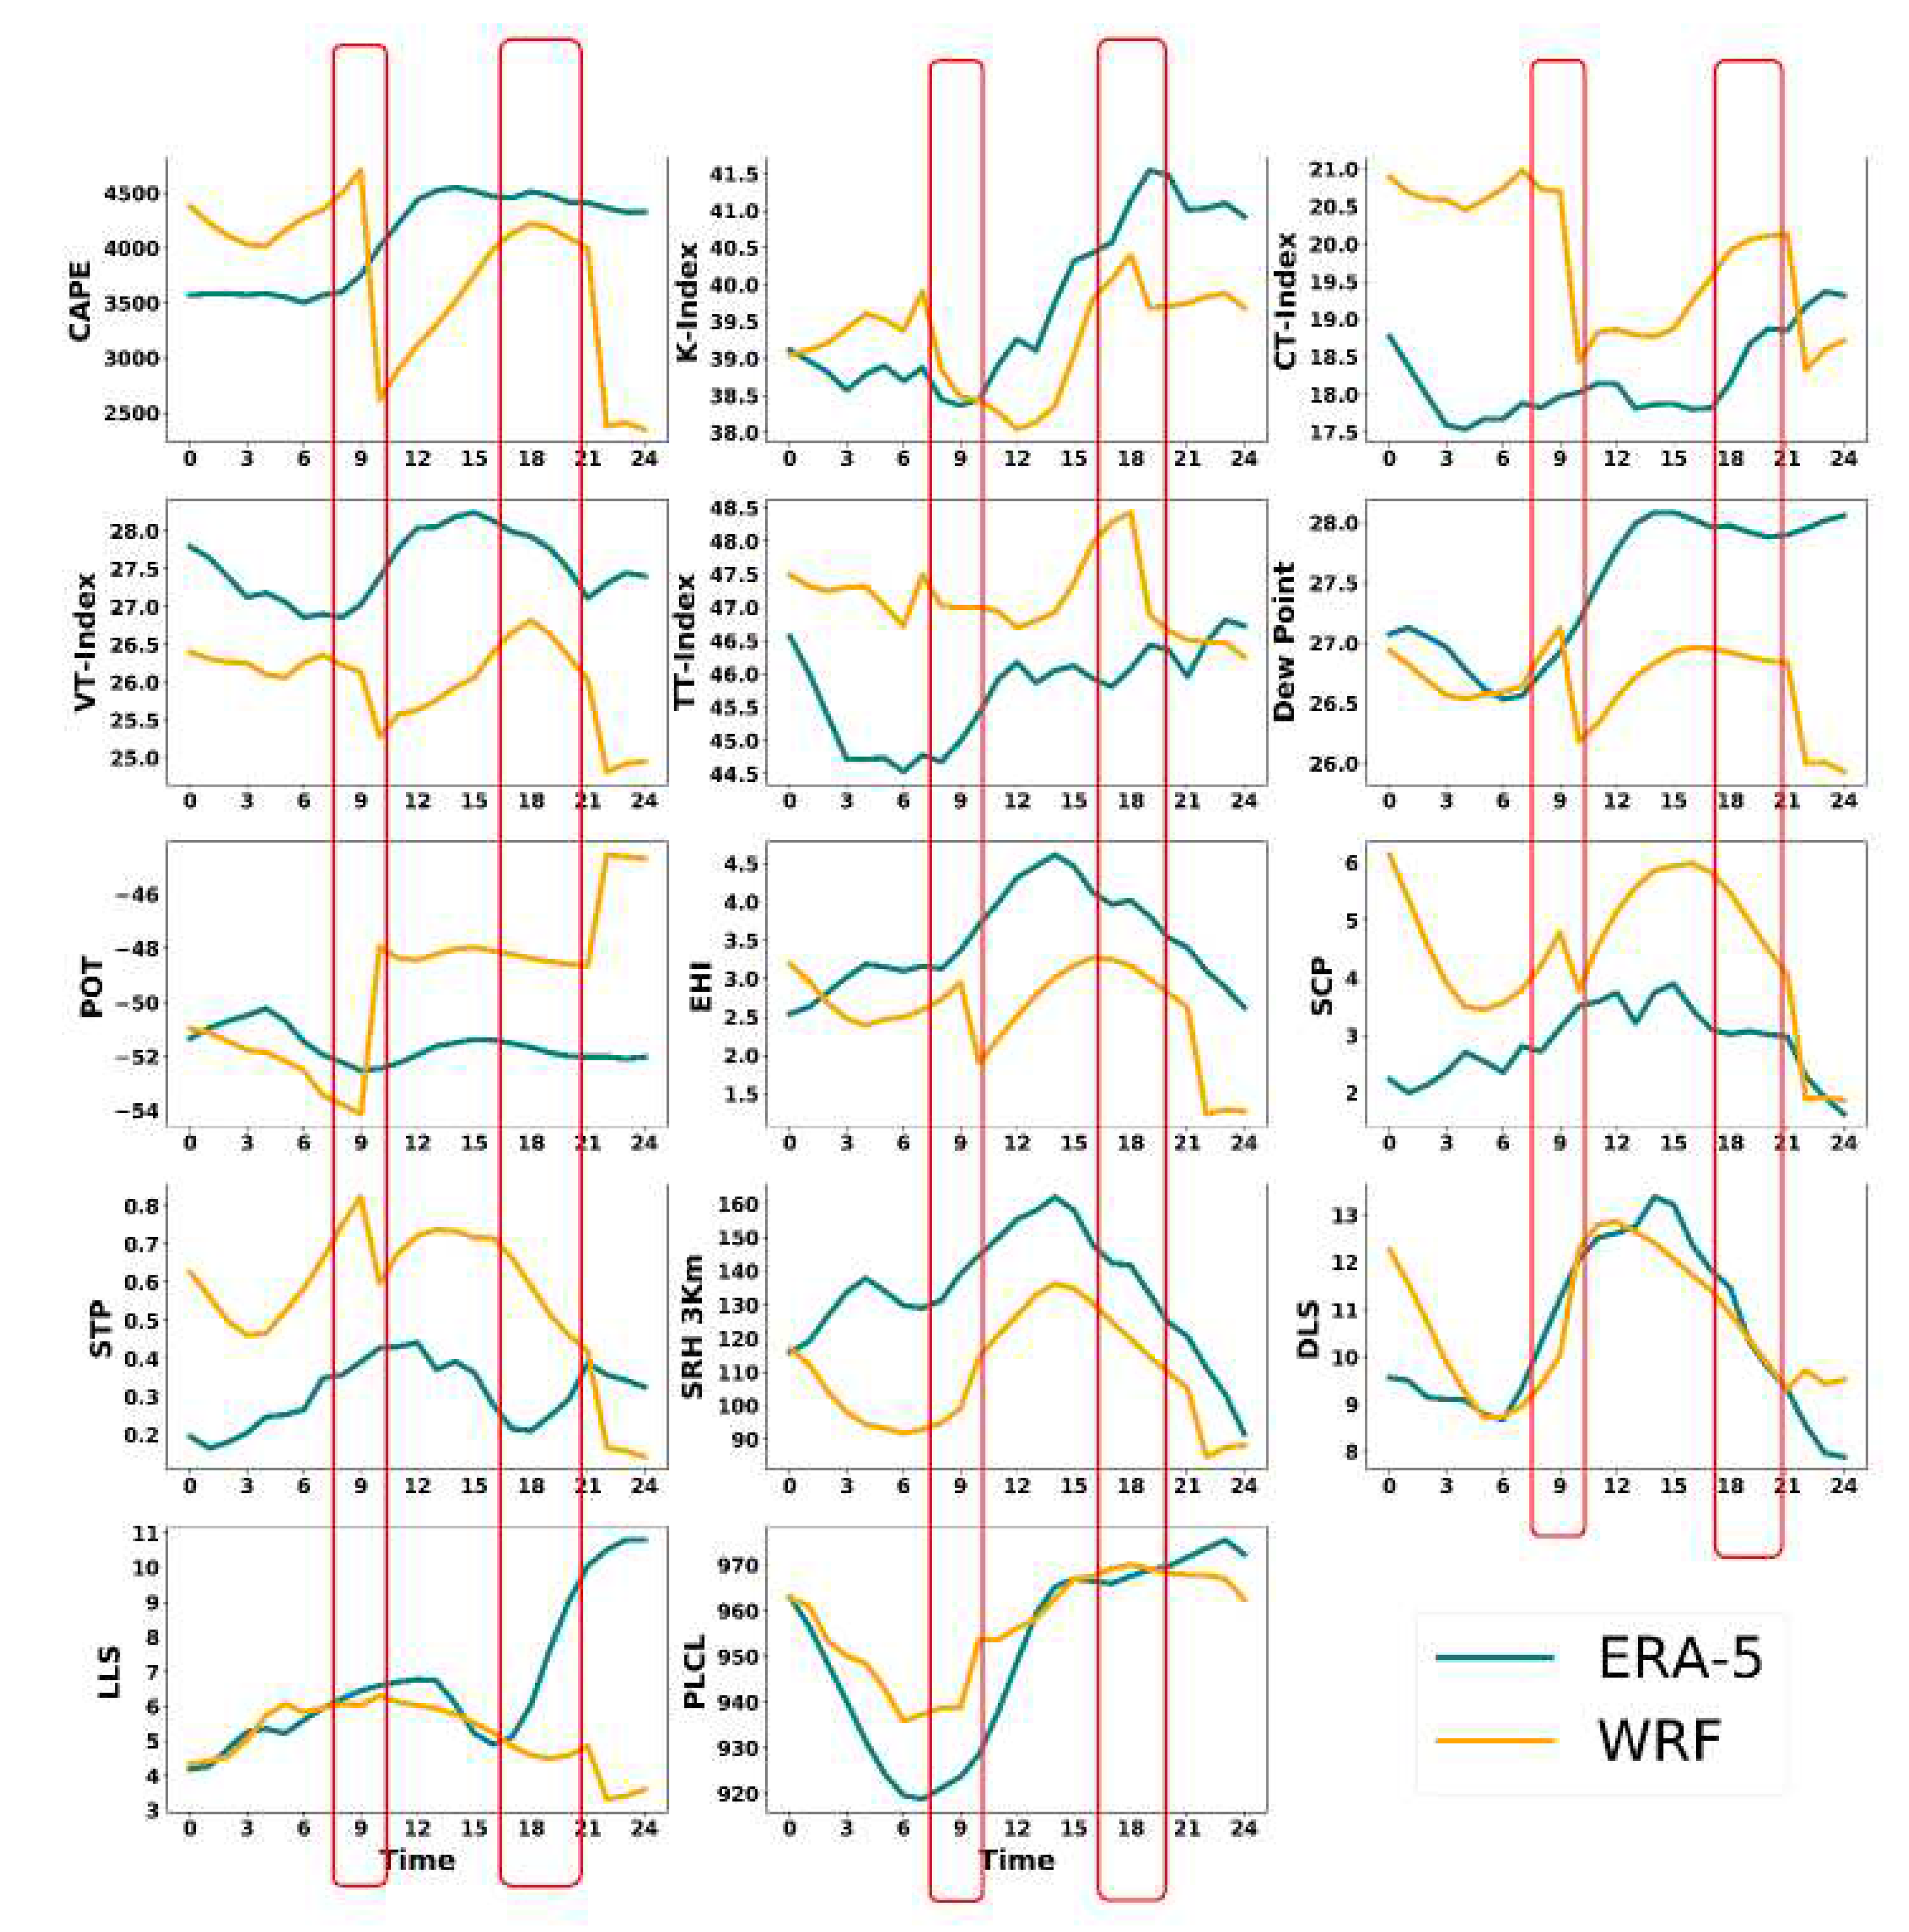
Figure 7.
Time series comparison of calculated thunderstorm indices using WRF model and ERA5 datasets over domain [20.0N 22.0N 84.0E 86.0E] the vertical box in red showing the time of event occurrence, at Raygada, Odisha on 24 June 2020.
Figure 7.
Time series comparison of calculated thunderstorm indices using WRF model and ERA5 datasets over domain [20.0N 22.0N 84.0E 86.0E] the vertical box in red showing the time of event occurrence, at Raygada, Odisha on 24 June 2020.
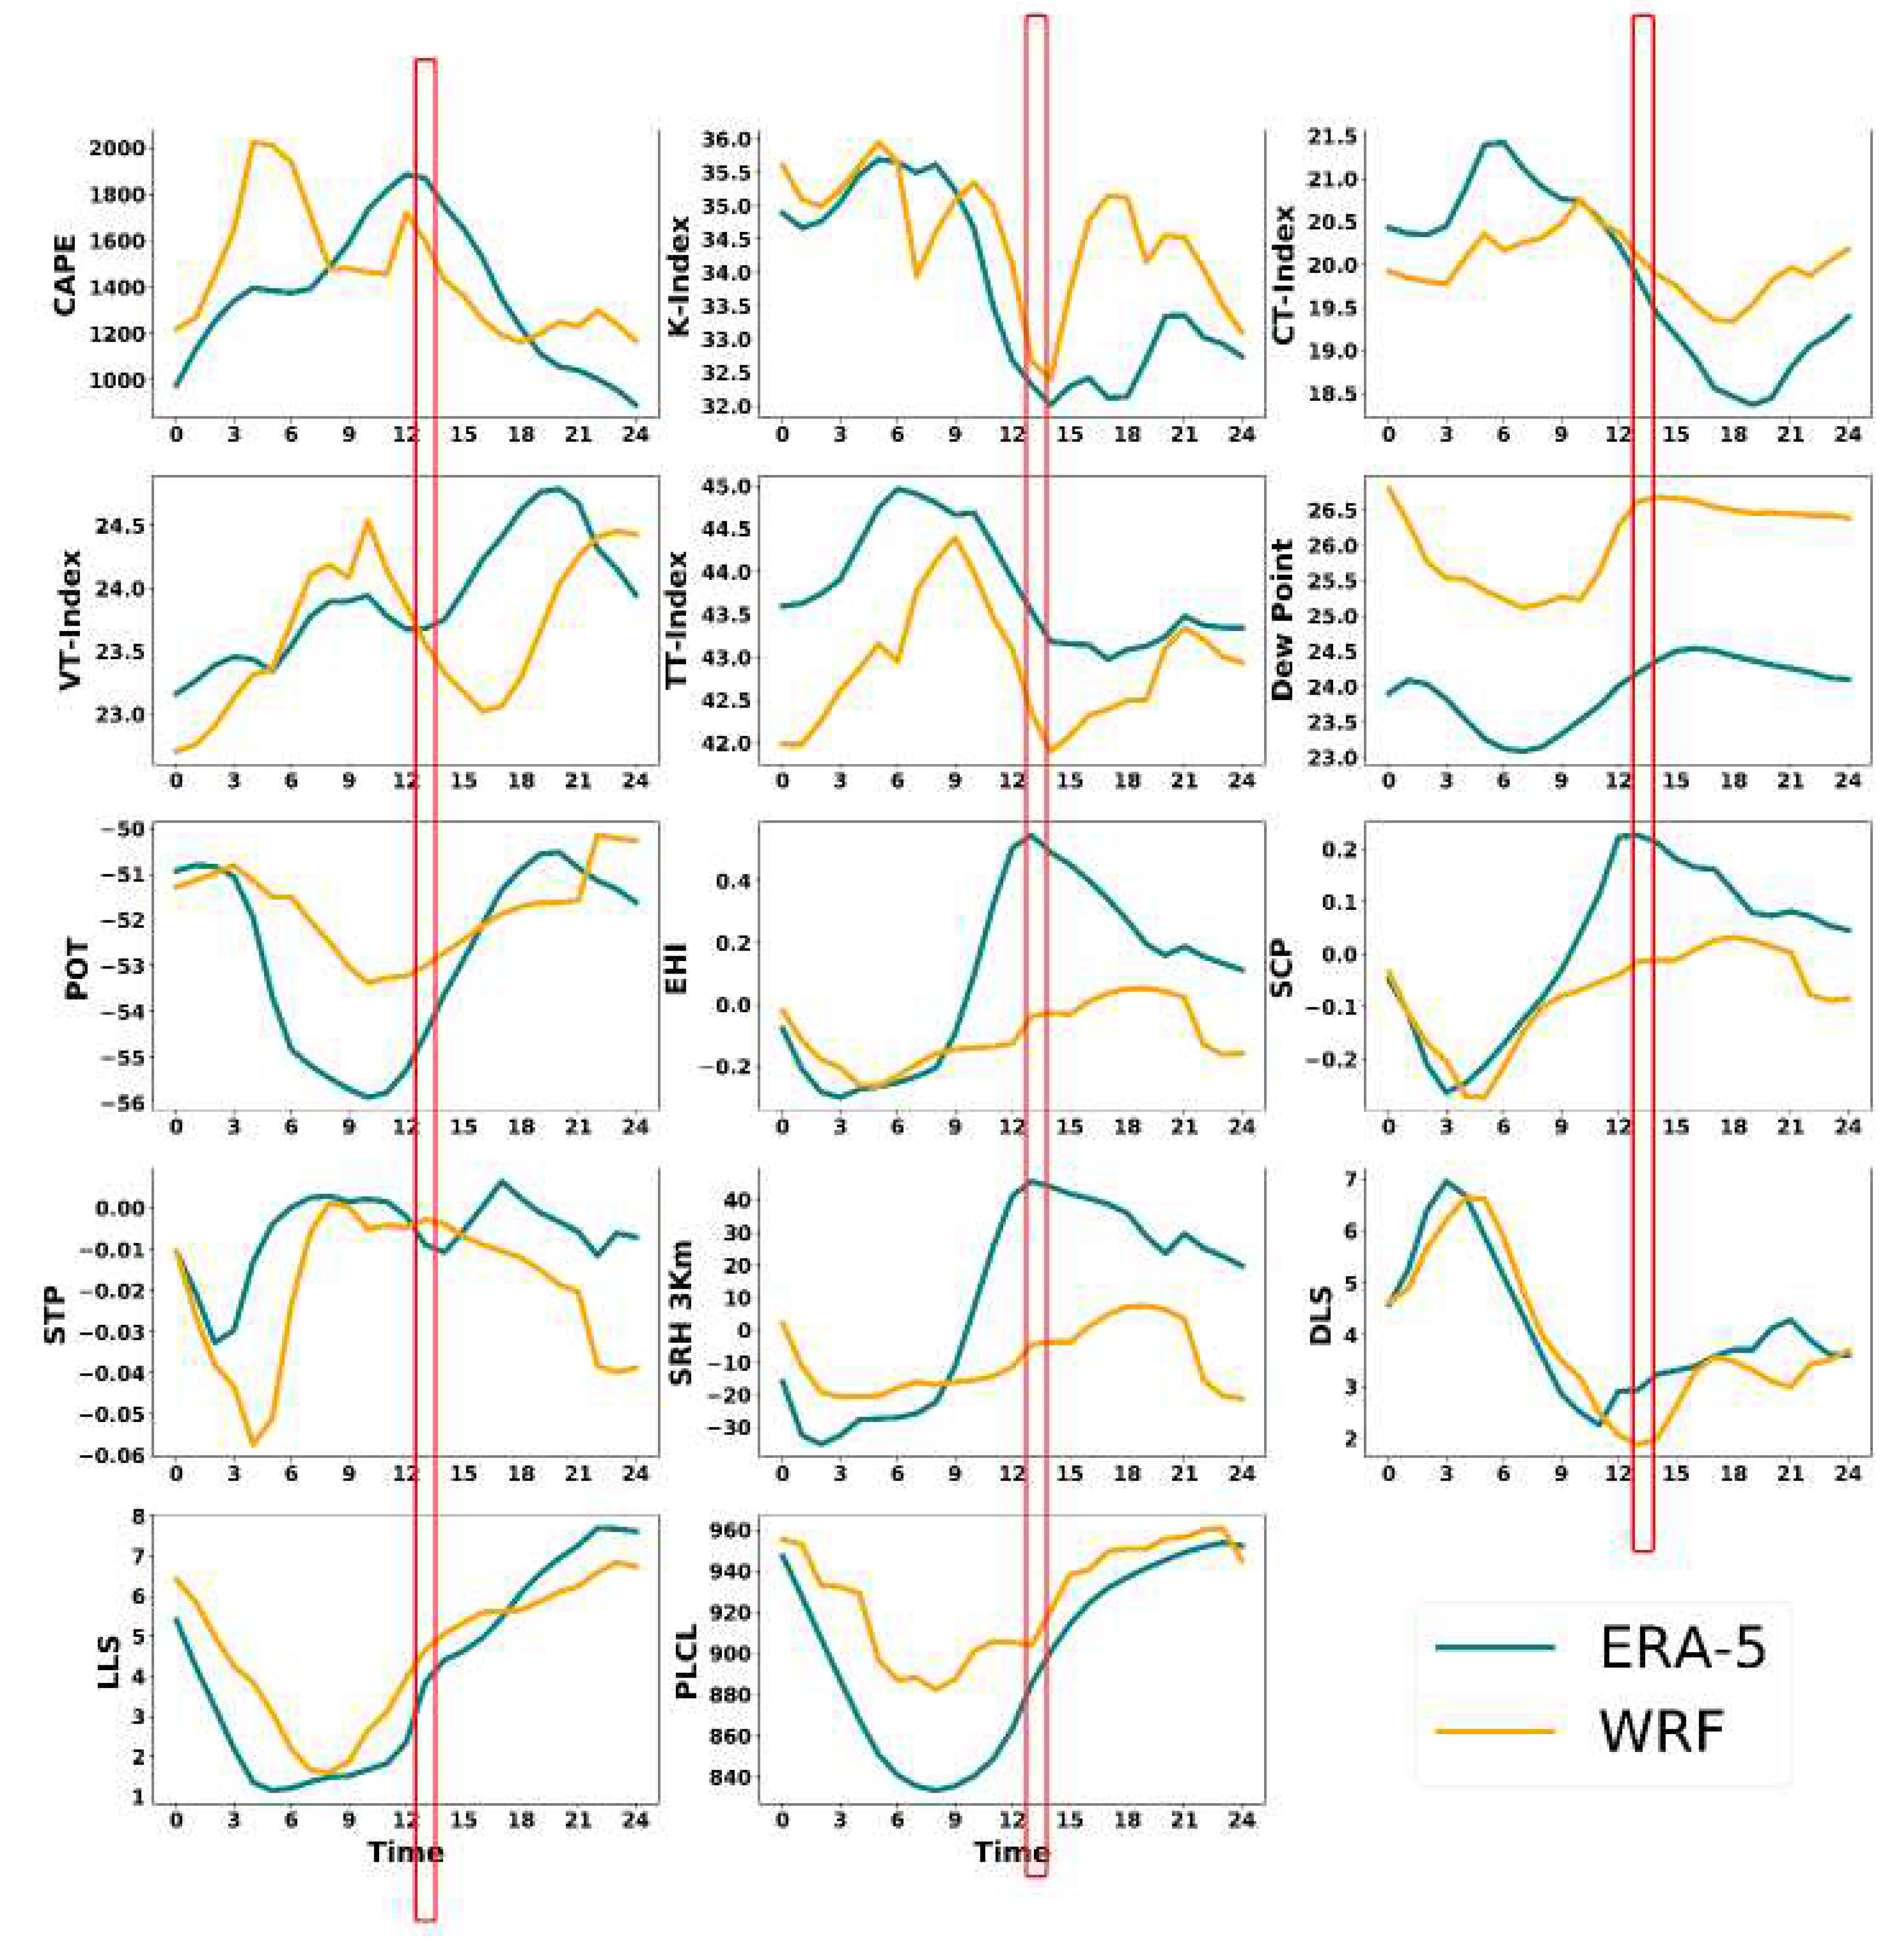
Figure 8.
Model skill score comparison of Accuracy (ACC) for different thunderstorm indices over all the case study domains.
Figure 8.
Model skill score comparison of Accuracy (ACC) for different thunderstorm indices over all the case study domains.
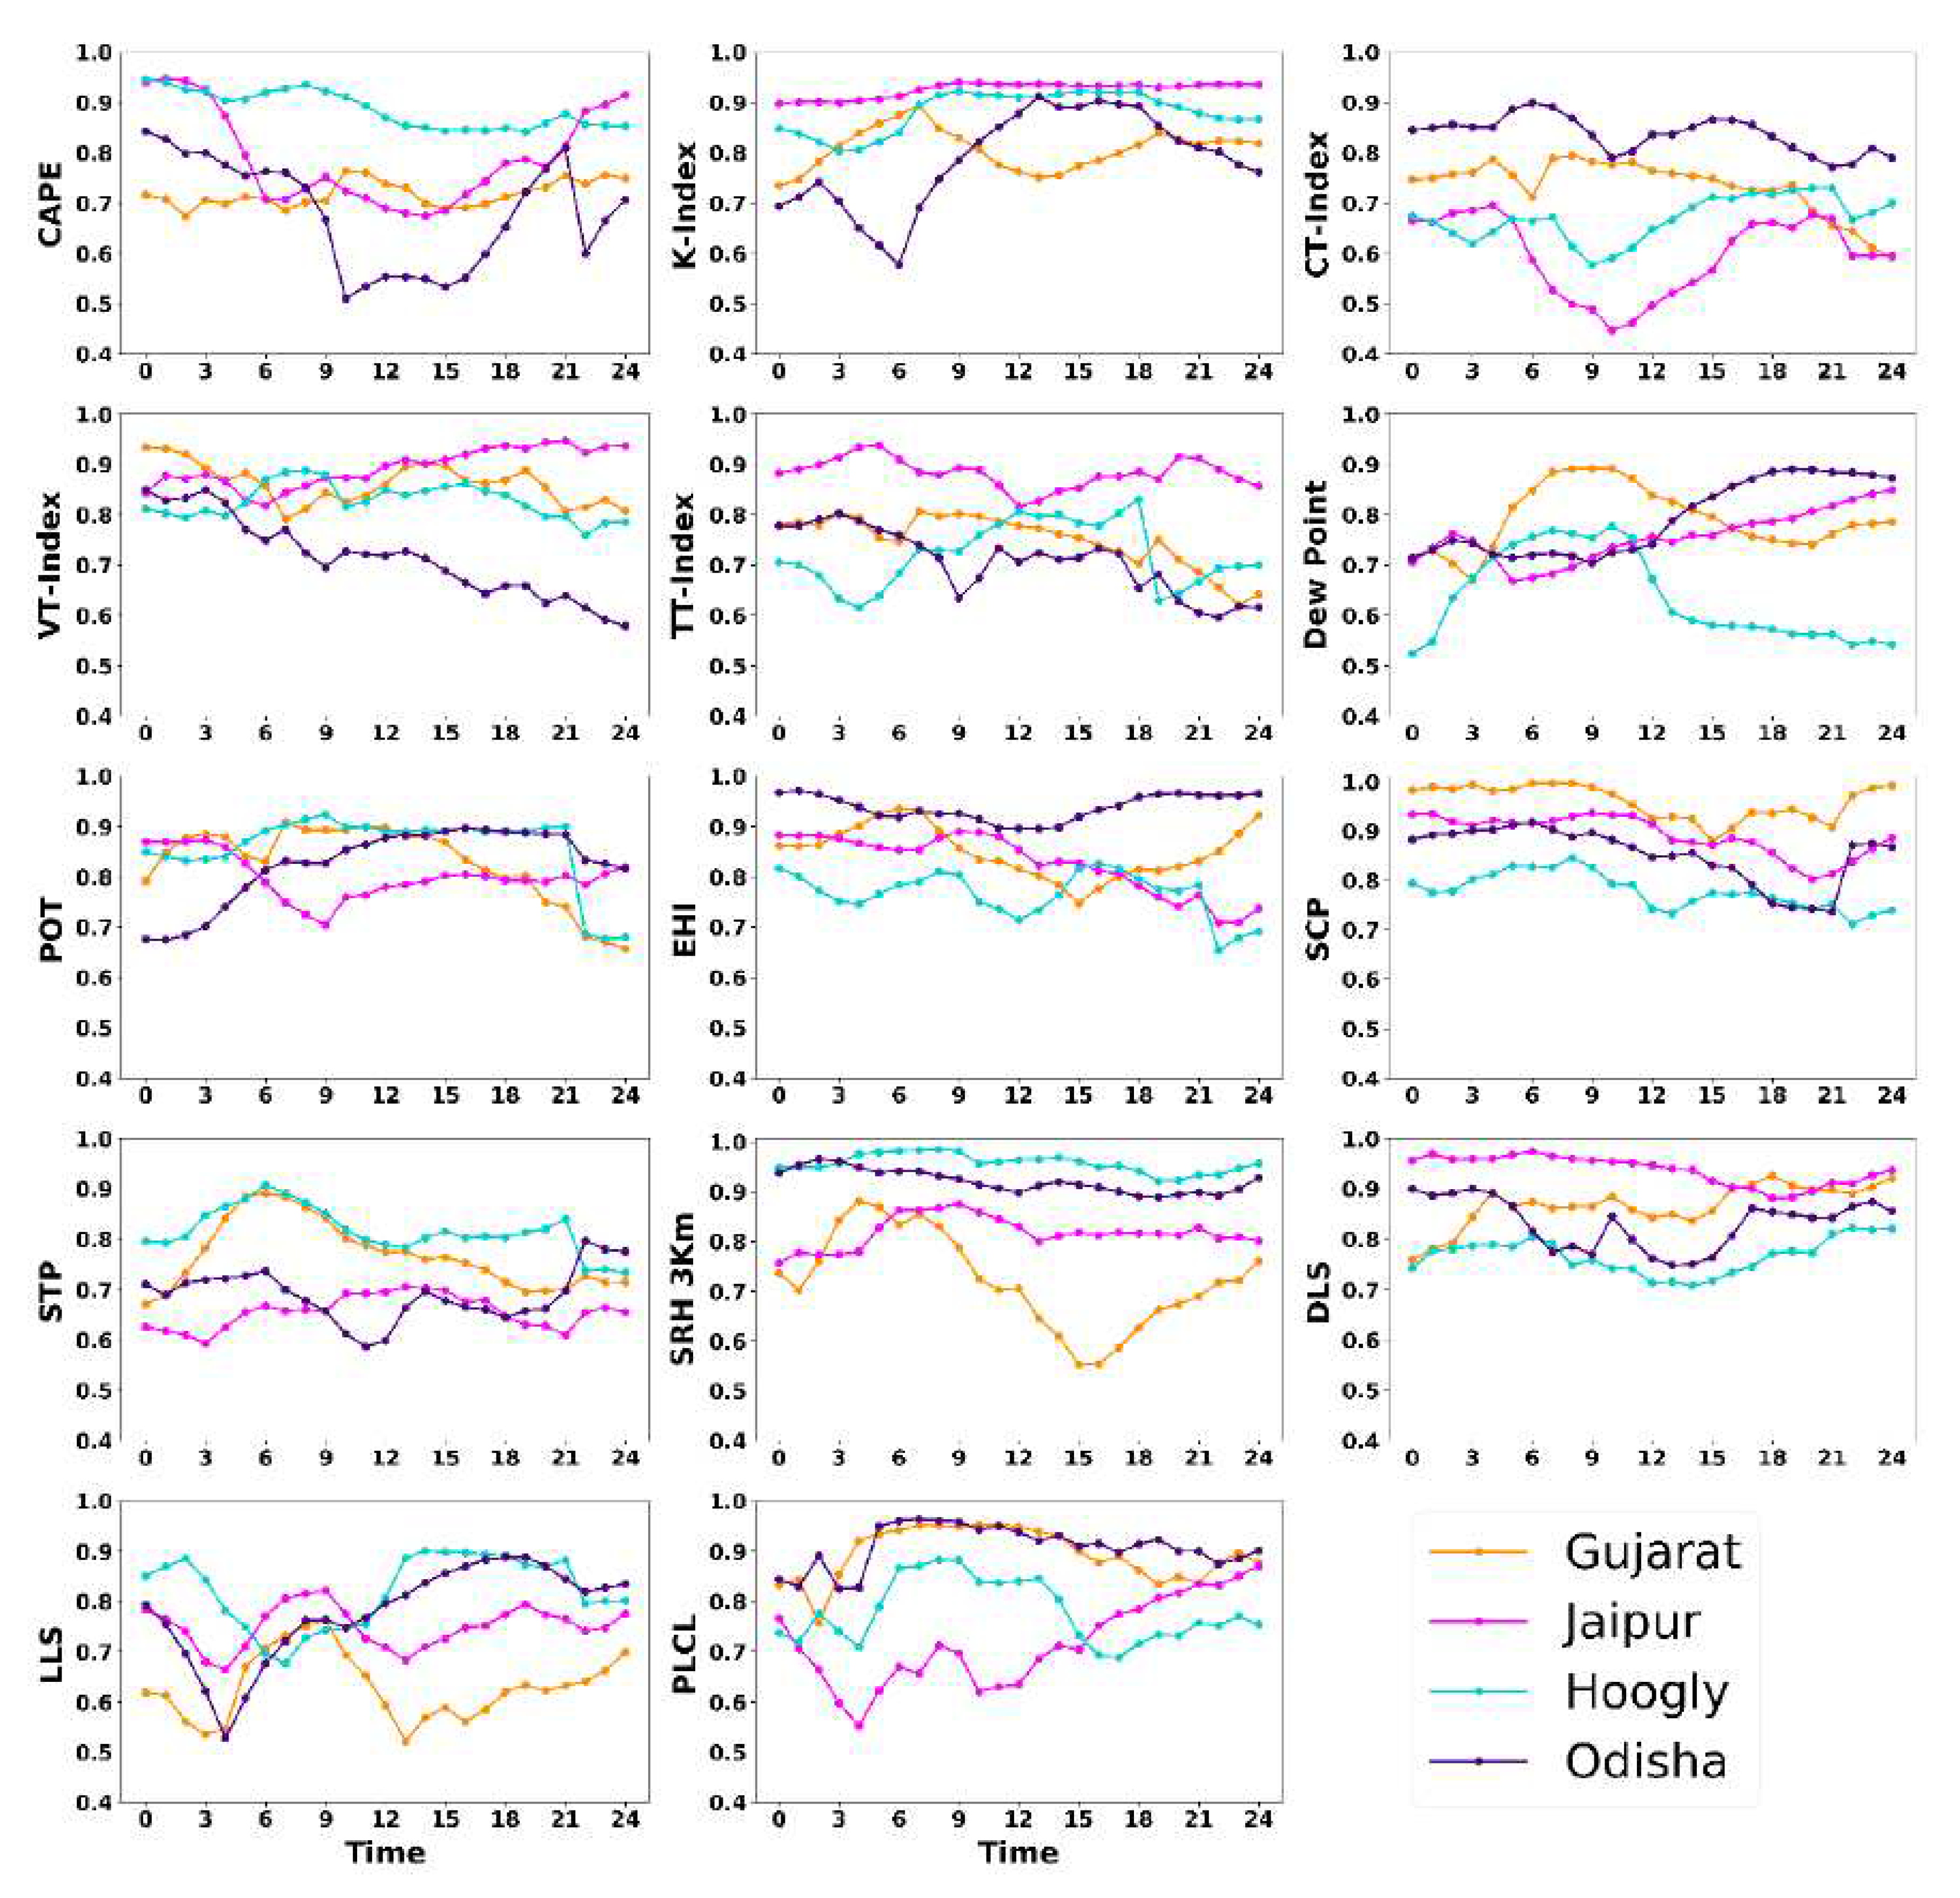
Figure 9.
Model skill score comparison of Critical Success Index (CSI) for different thunderstorm indices over all the case study domains.
Figure 9.
Model skill score comparison of Critical Success Index (CSI) for different thunderstorm indices over all the case study domains.
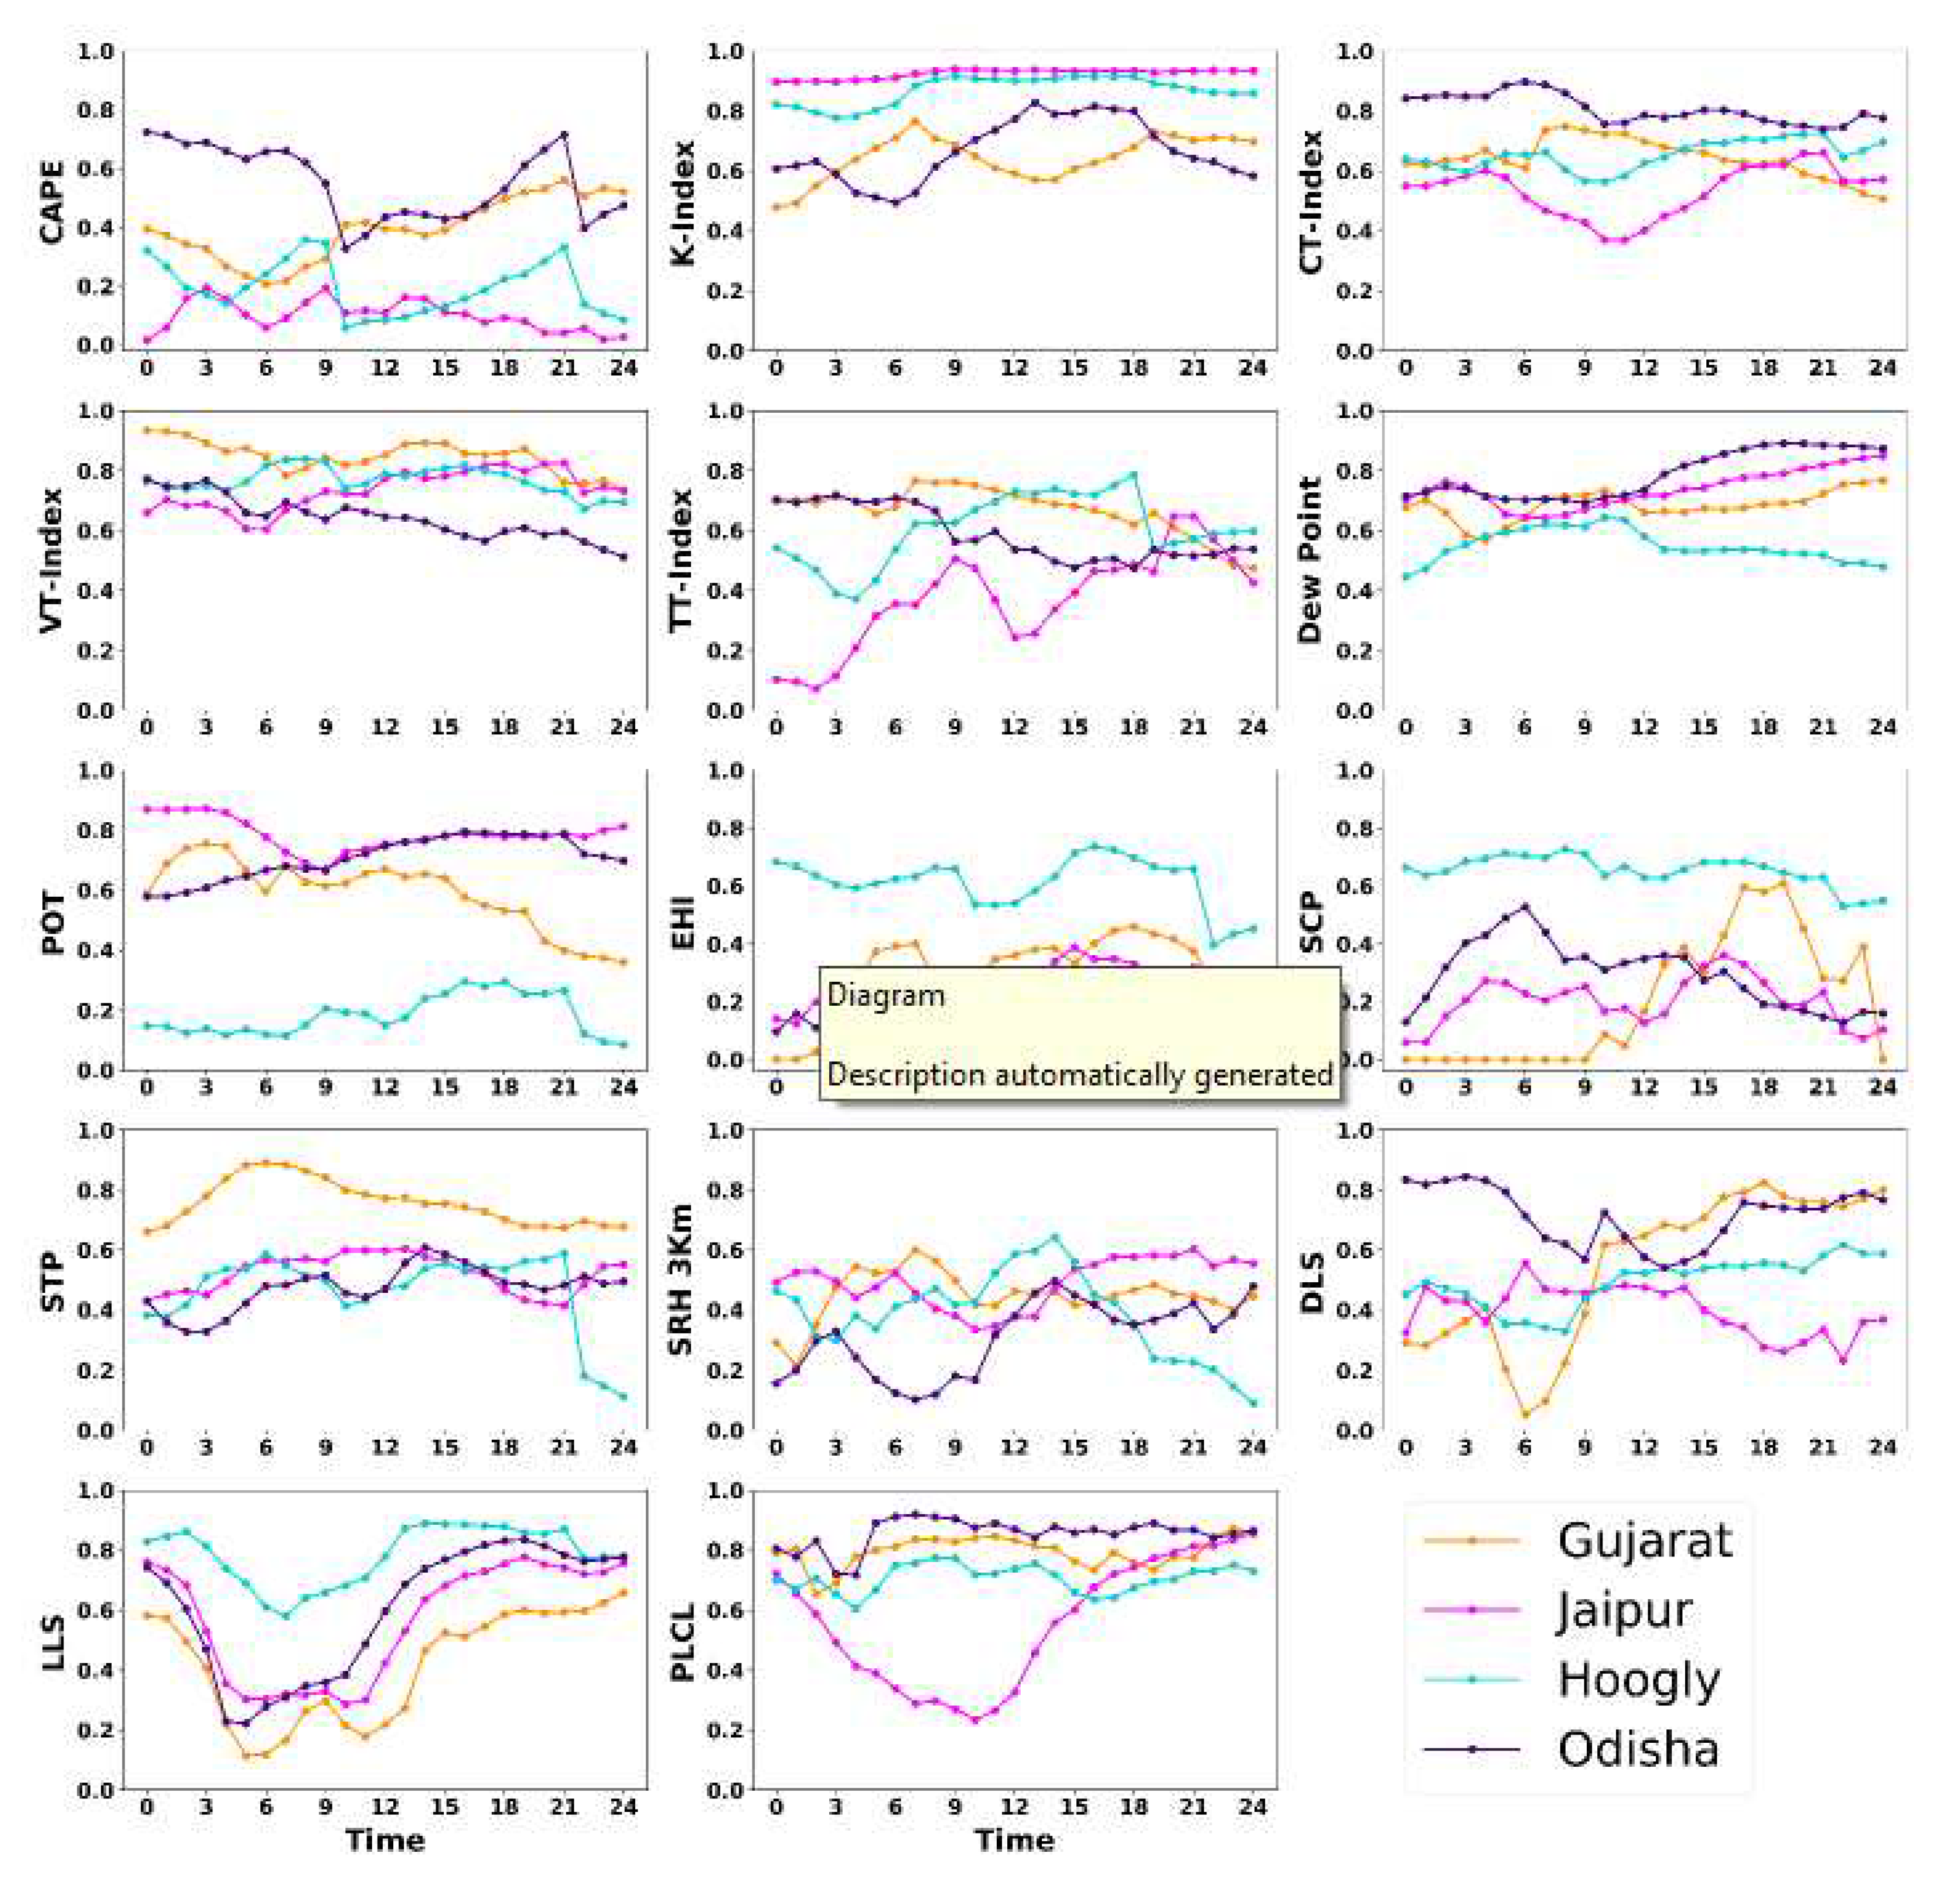
Figure 10.
Model skill score comparison of Equitable Threat Score (ETS) for different thunderstorm indices over all the case study domains.
Figure 10.
Model skill score comparison of Equitable Threat Score (ETS) for different thunderstorm indices over all the case study domains.
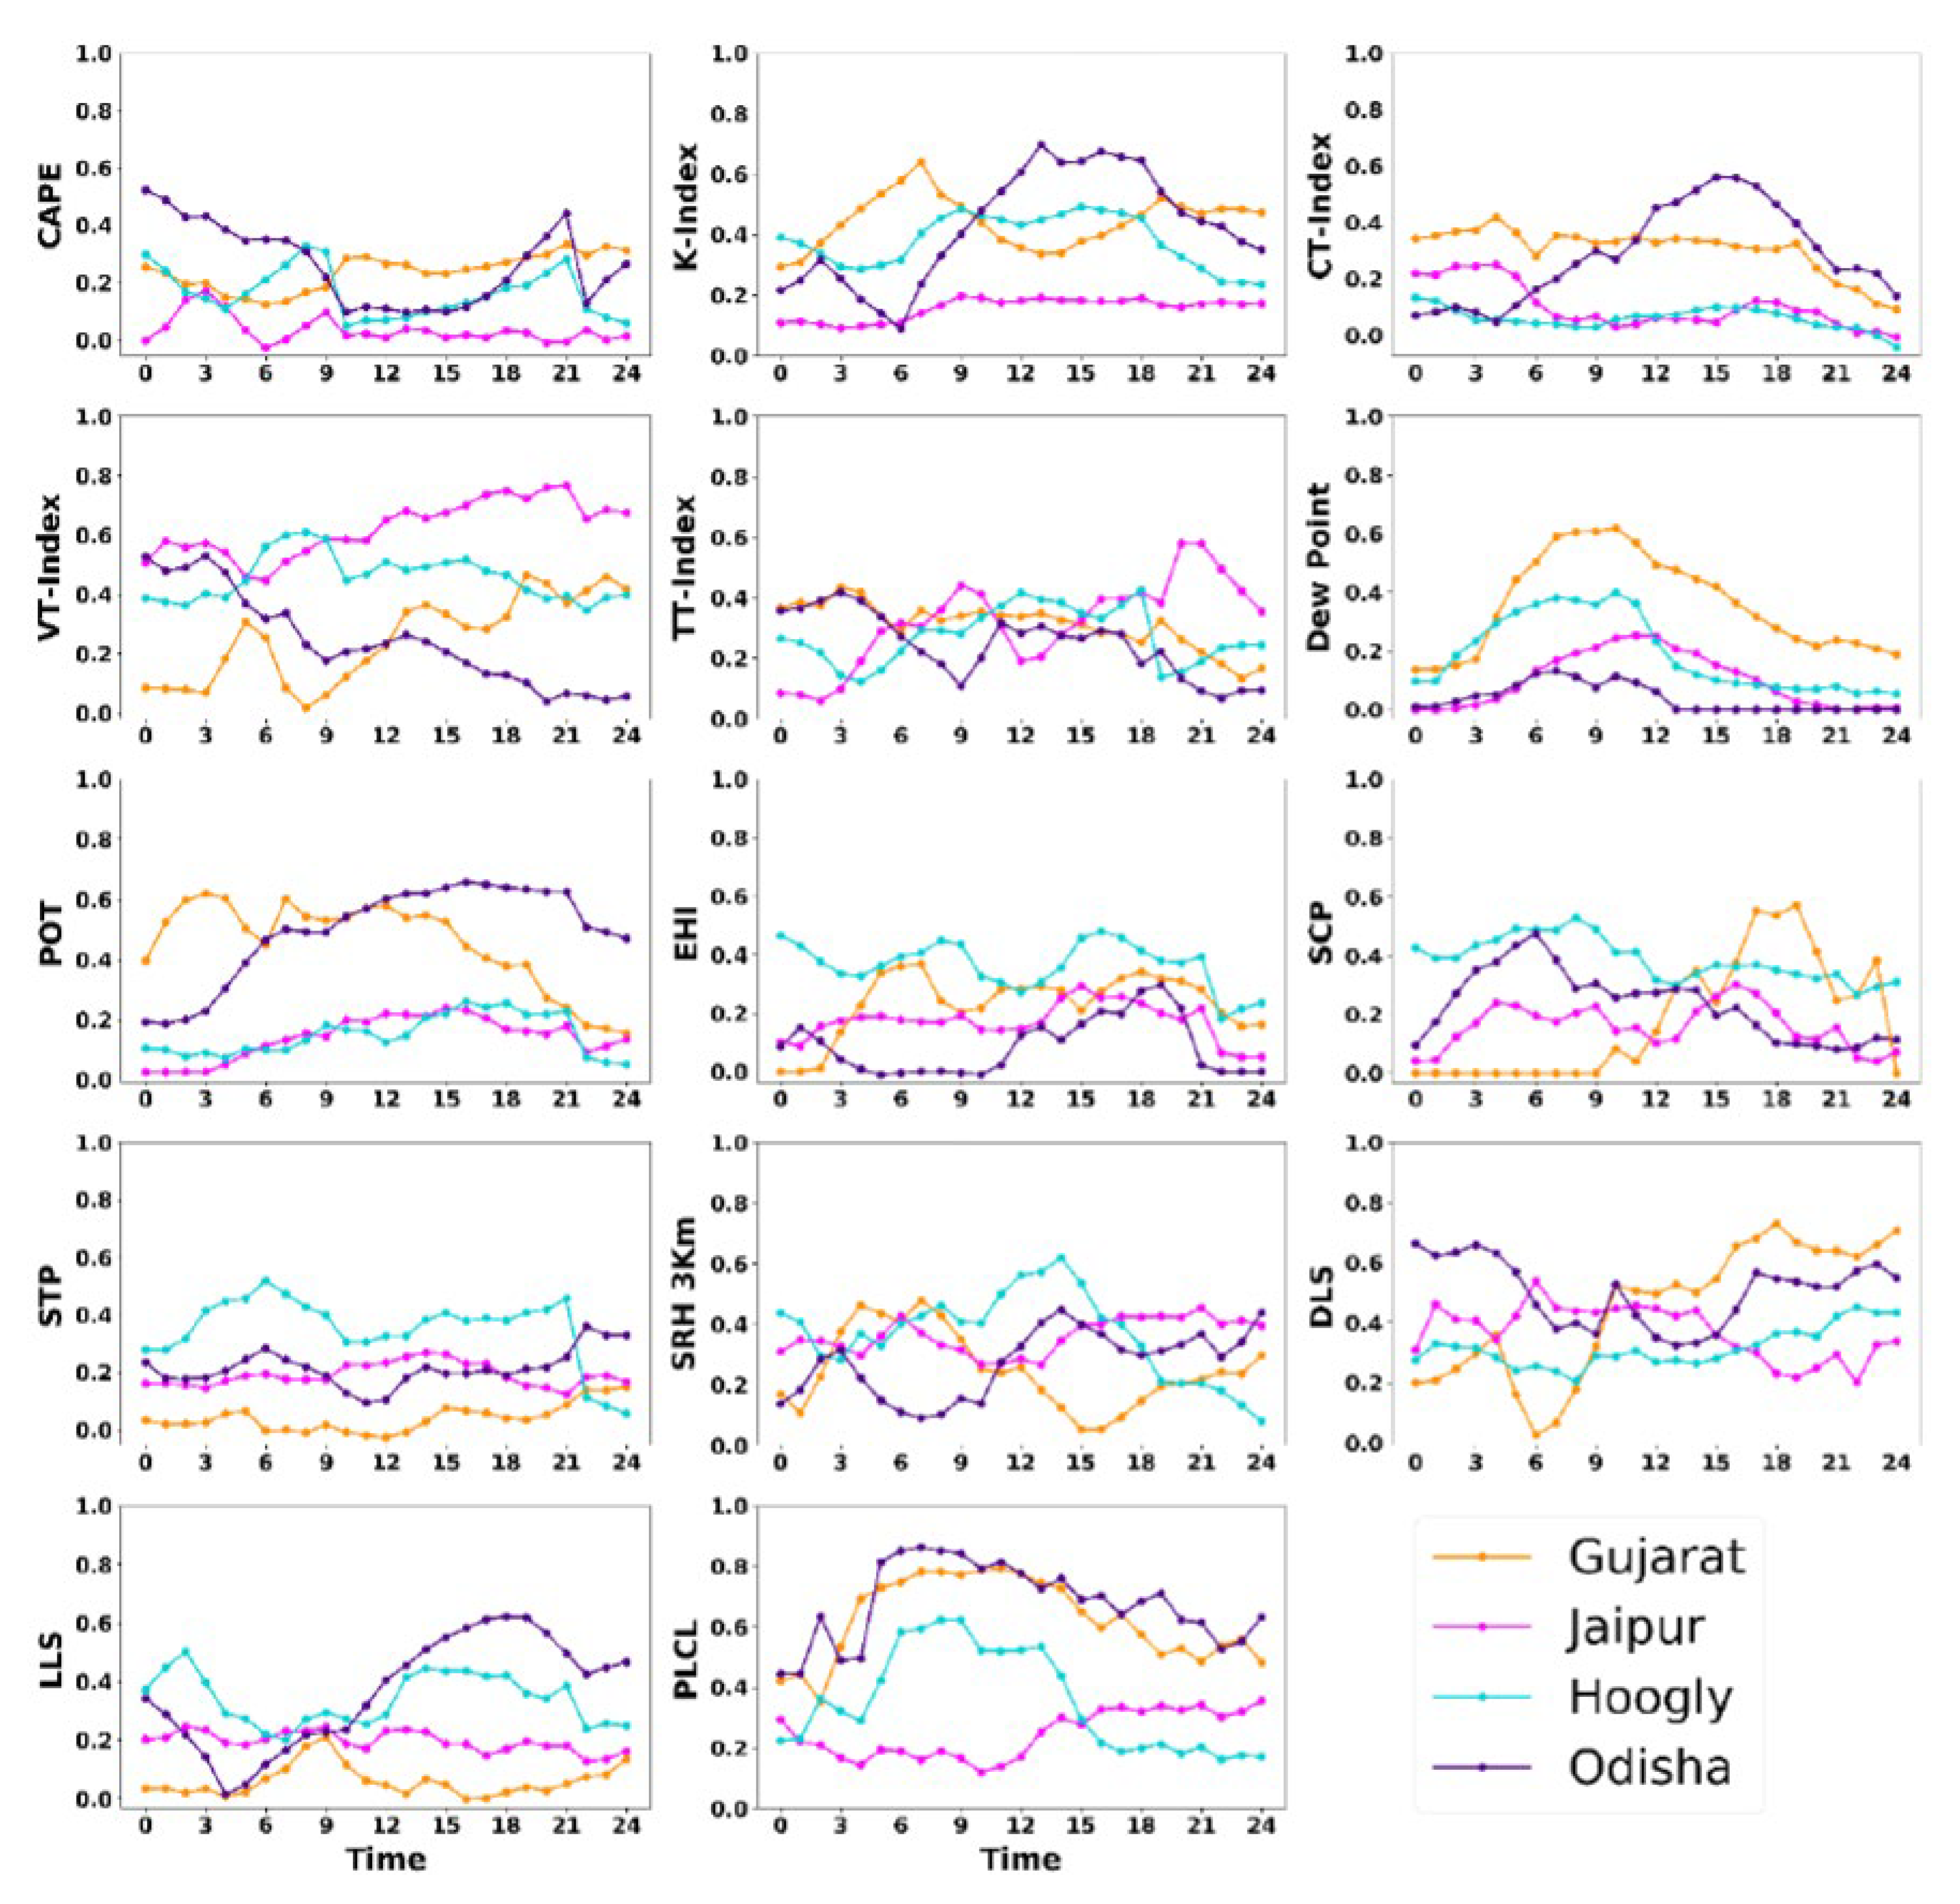
Figure 11.
Model skill score comparison of False Alarm Ratio (FAR) for different thunderstorm indices over all the case study domains.
Figure 11.
Model skill score comparison of False Alarm Ratio (FAR) for different thunderstorm indices over all the case study domains.
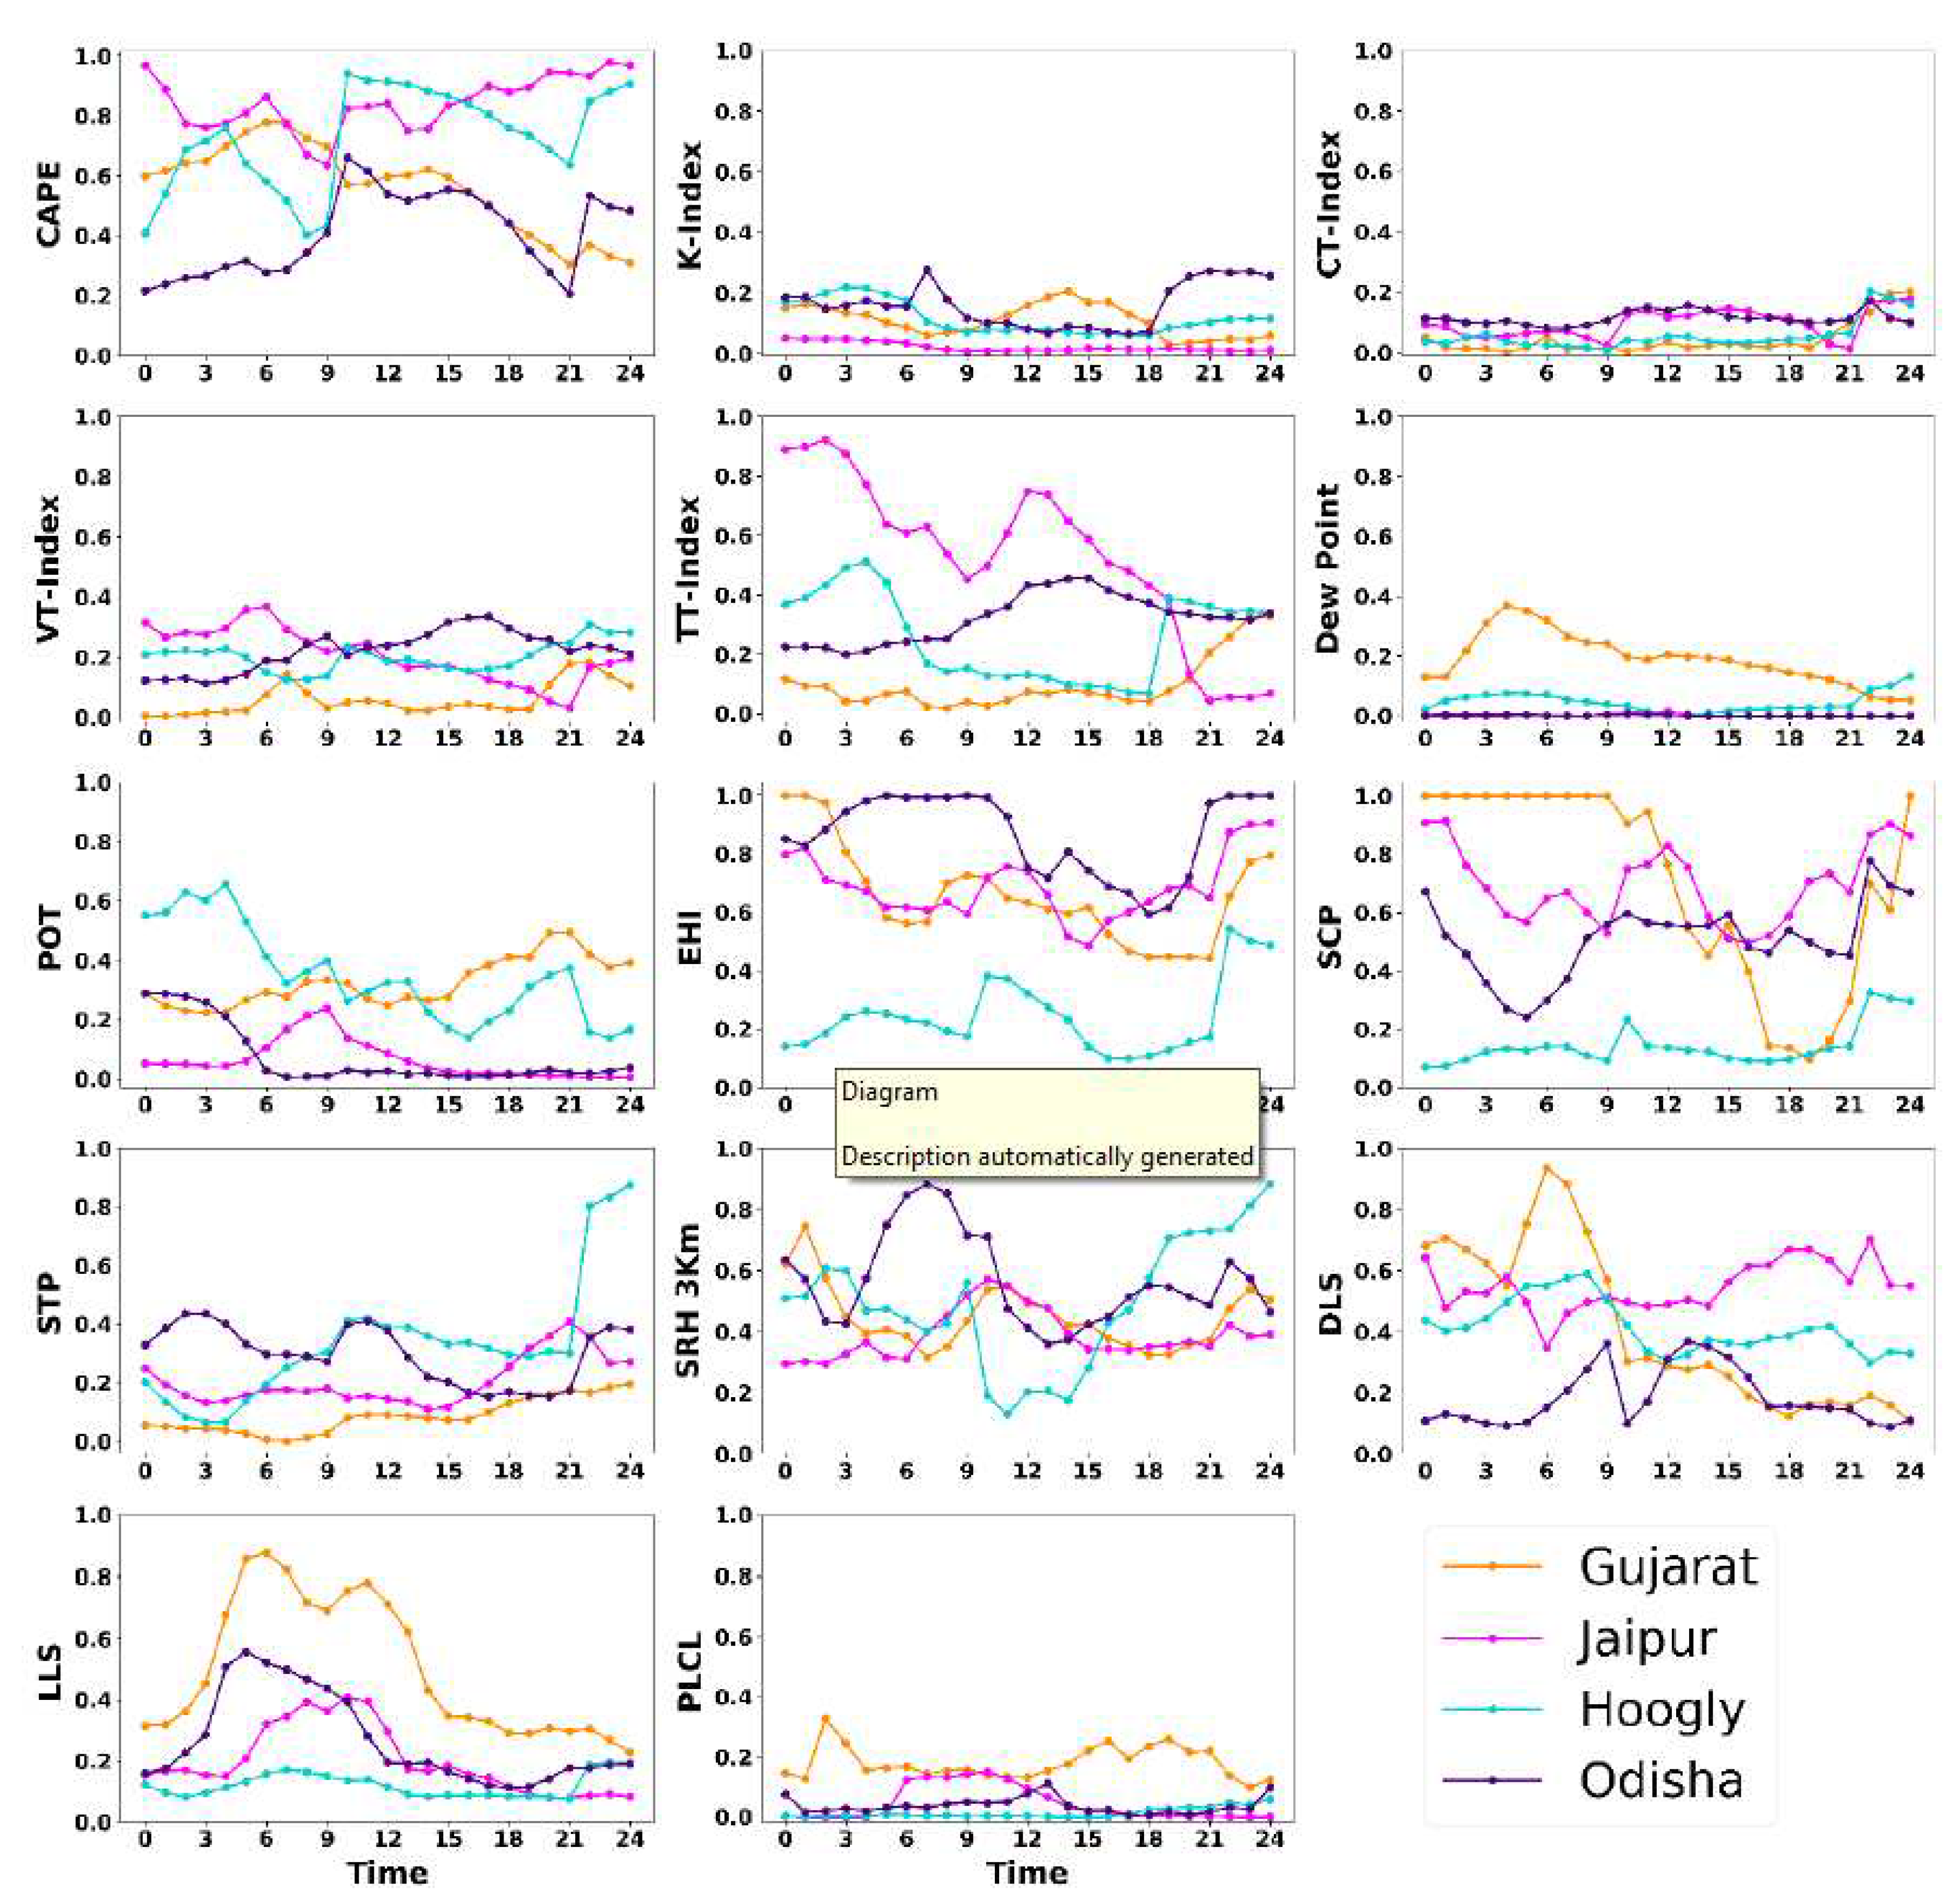
Figure 12.
Model skill score comparison of Heidke Skill Score (HSS) for different thunderstorm indices over all the case study domains.
Figure 12.
Model skill score comparison of Heidke Skill Score (HSS) for different thunderstorm indices over all the case study domains.
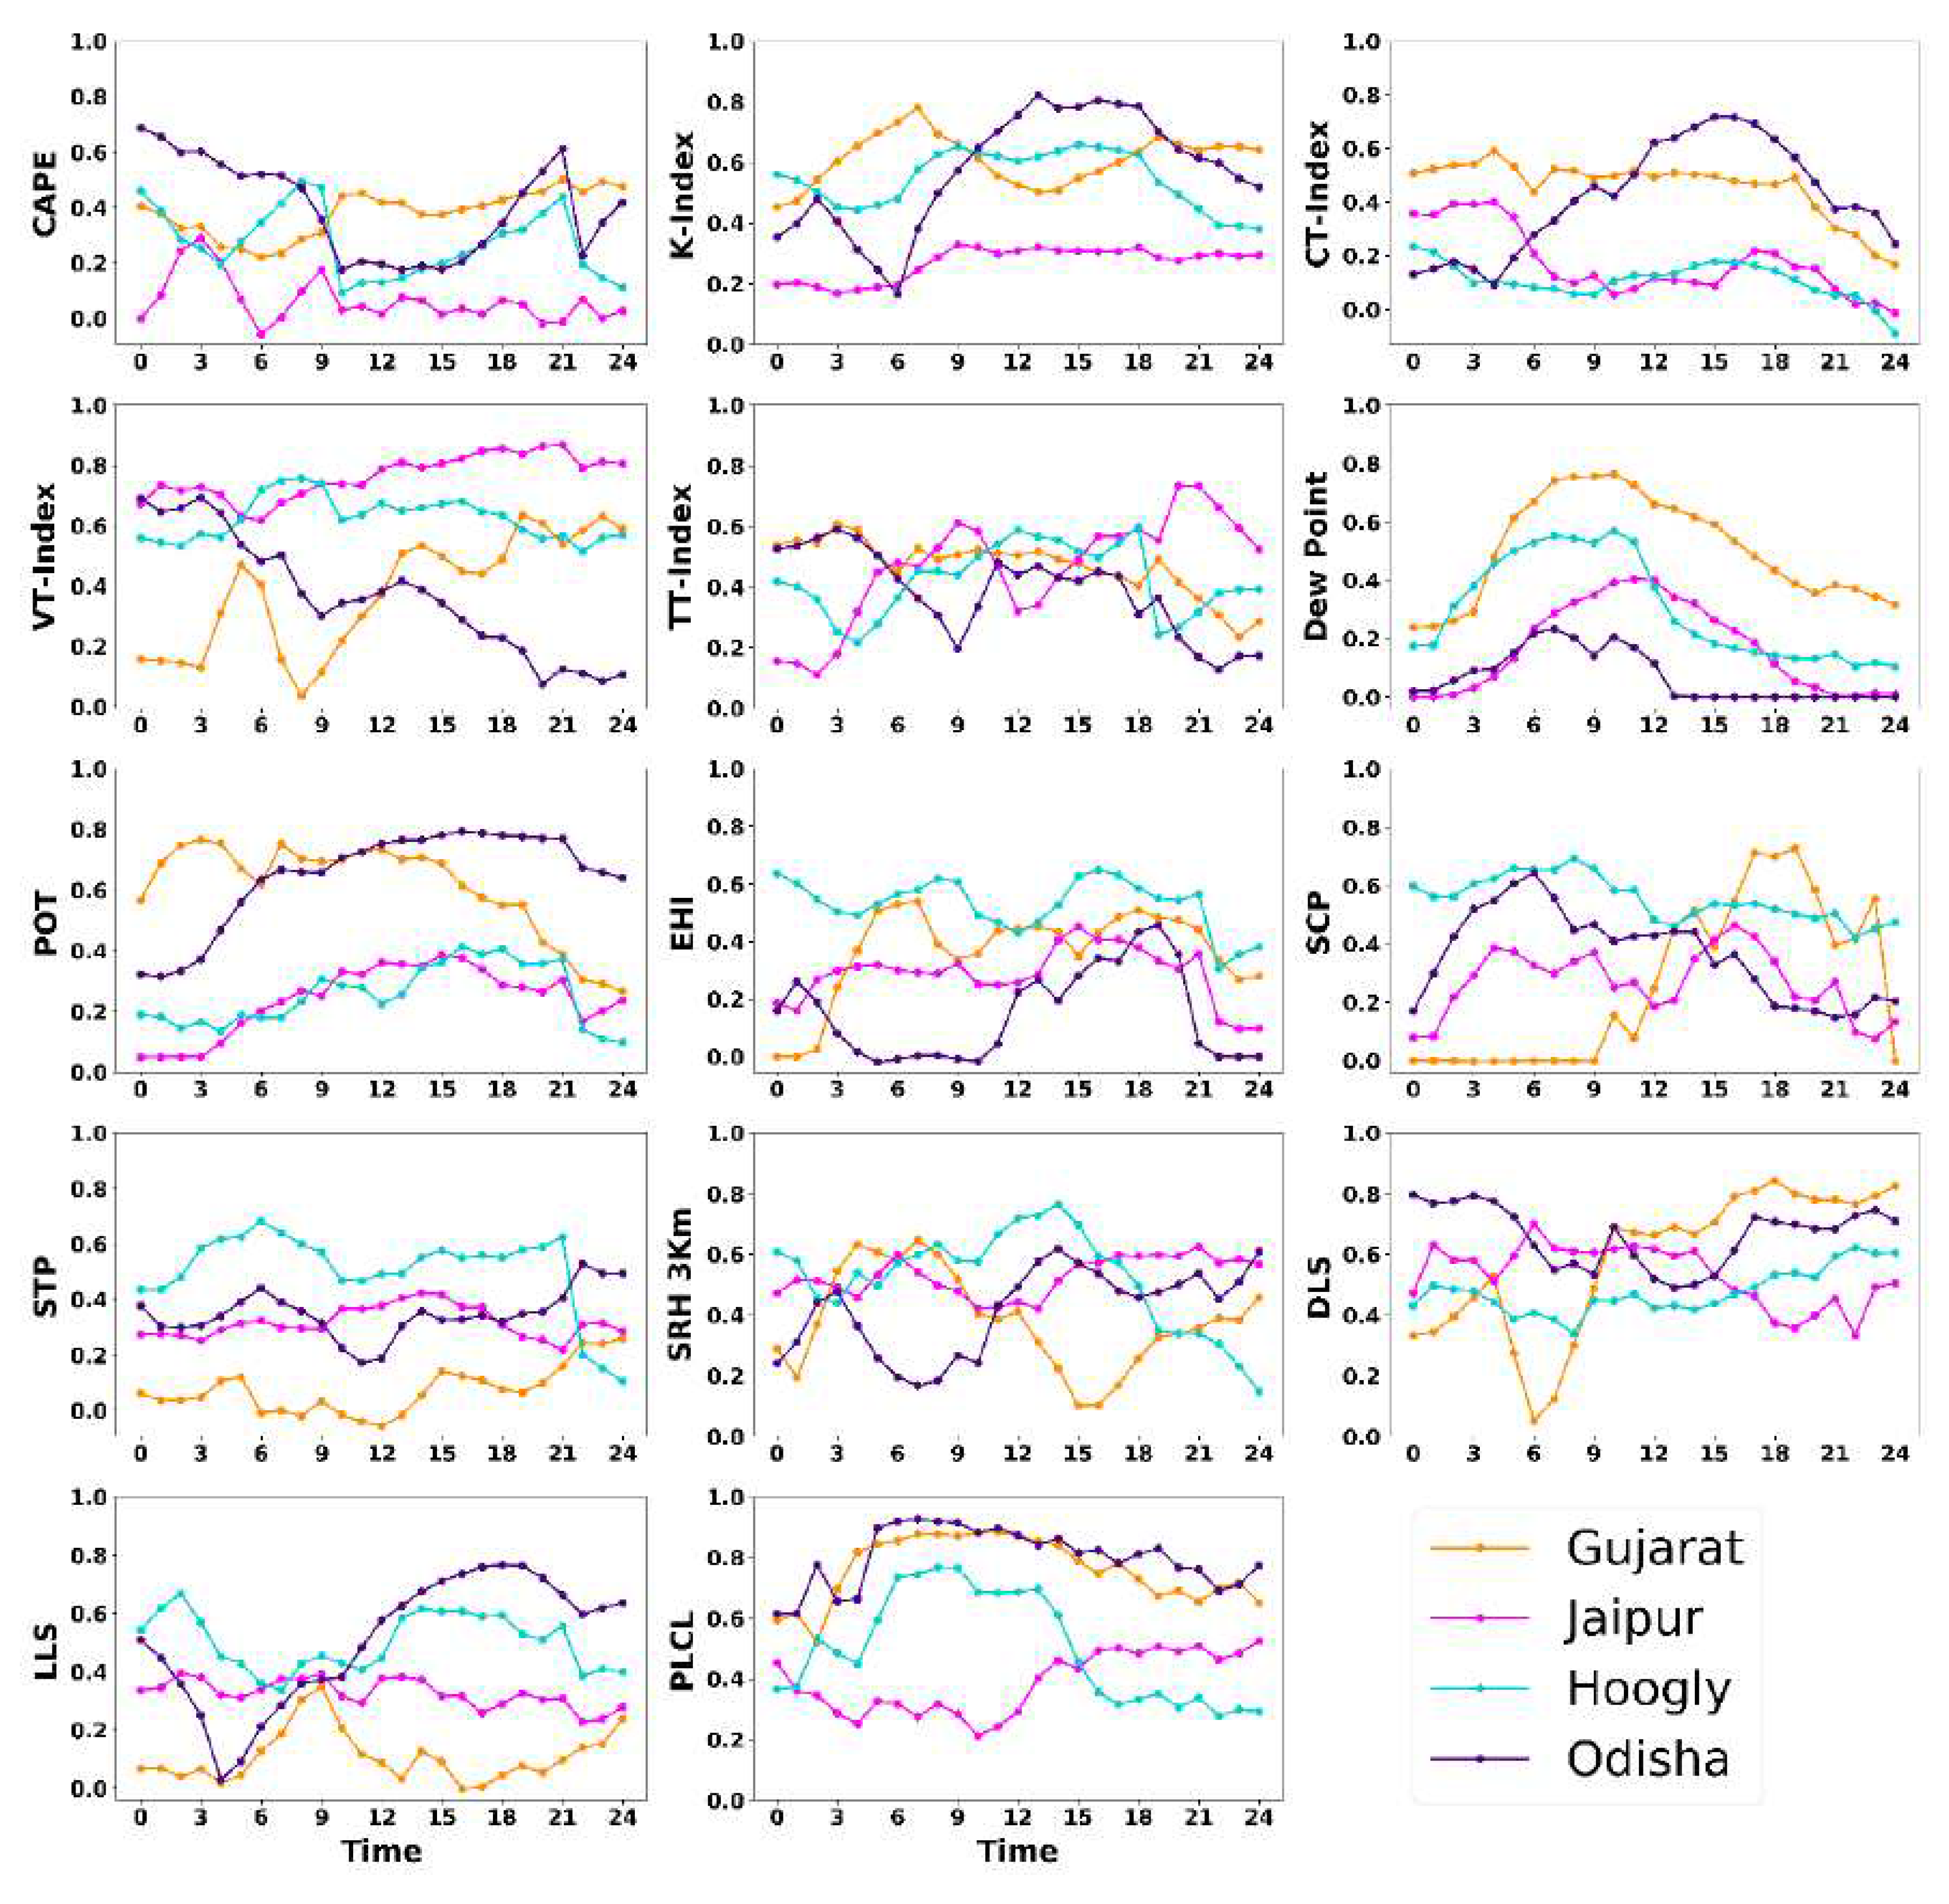
Figure 13.
Model skill score comparison of Probability of Detection (POD) for different thunderstorm indices over all the case study domains.
Figure 13.
Model skill score comparison of Probability of Detection (POD) for different thunderstorm indices over all the case study domains.
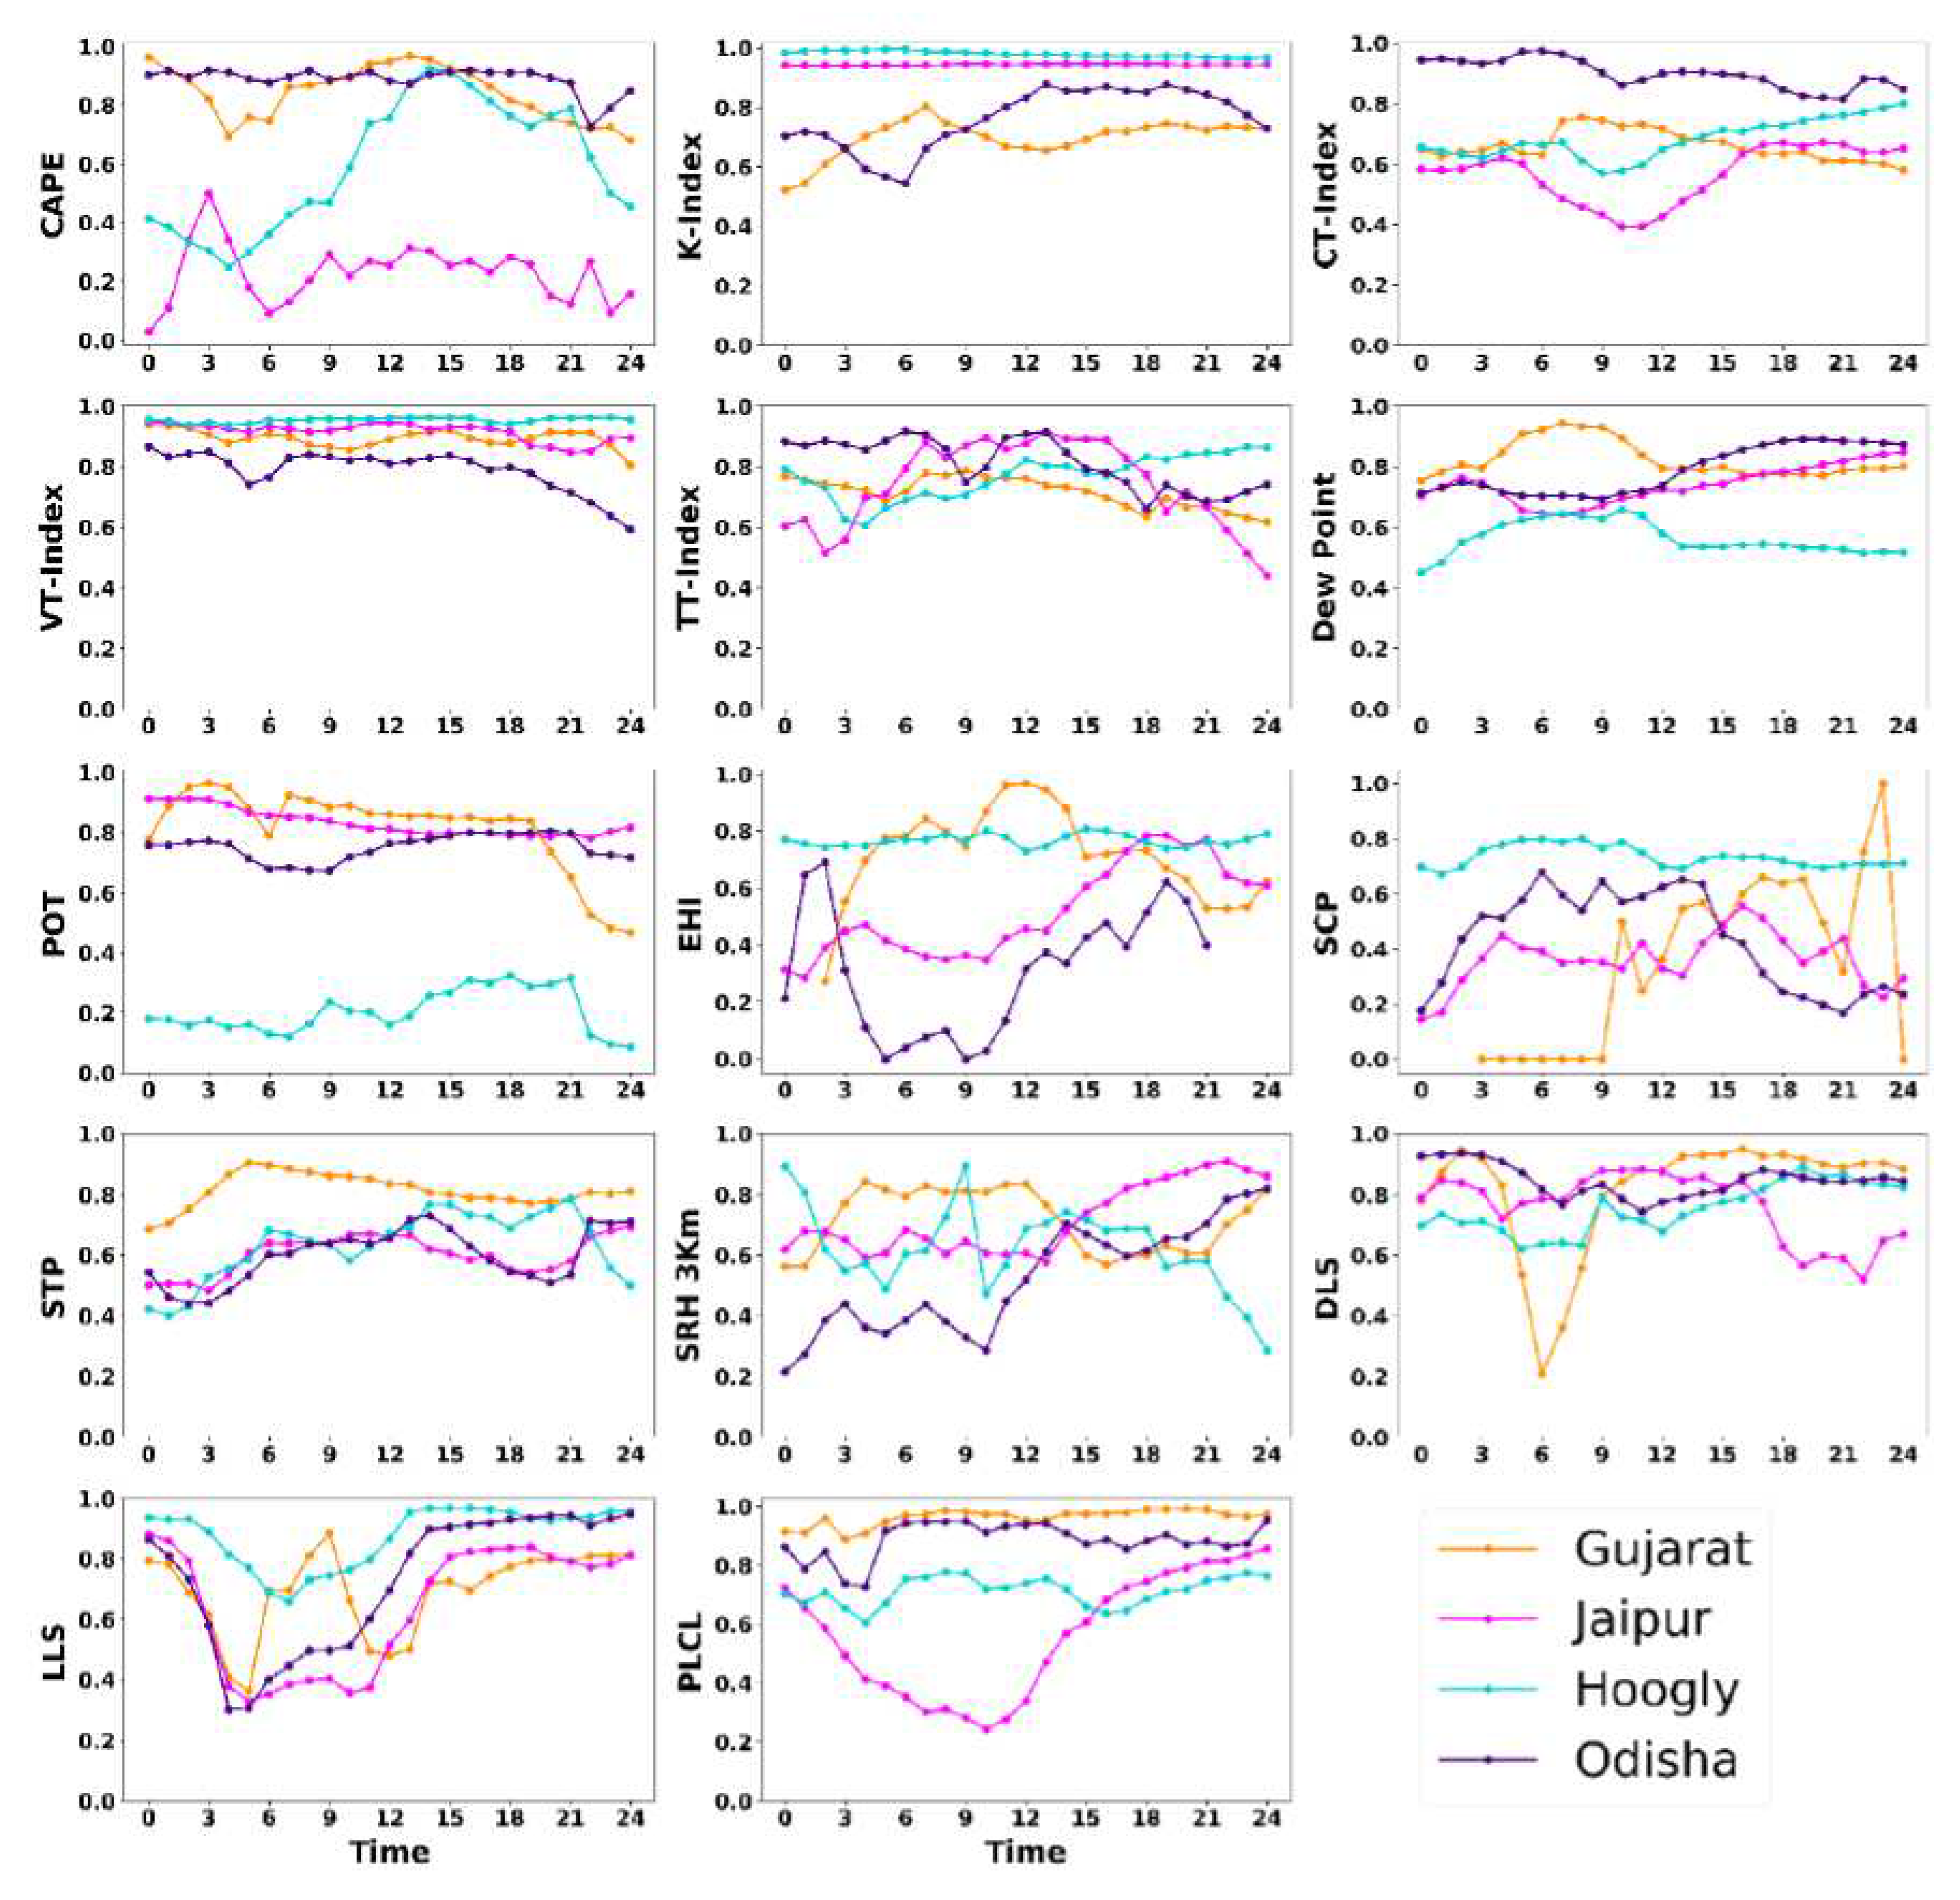
Figure 14.
Model skill score comparison of True Skill Statistic (TSS) for different thunderstorm indices over all the case study domains.
Figure 14.
Model skill score comparison of True Skill Statistic (TSS) for different thunderstorm indices over all the case study domains.
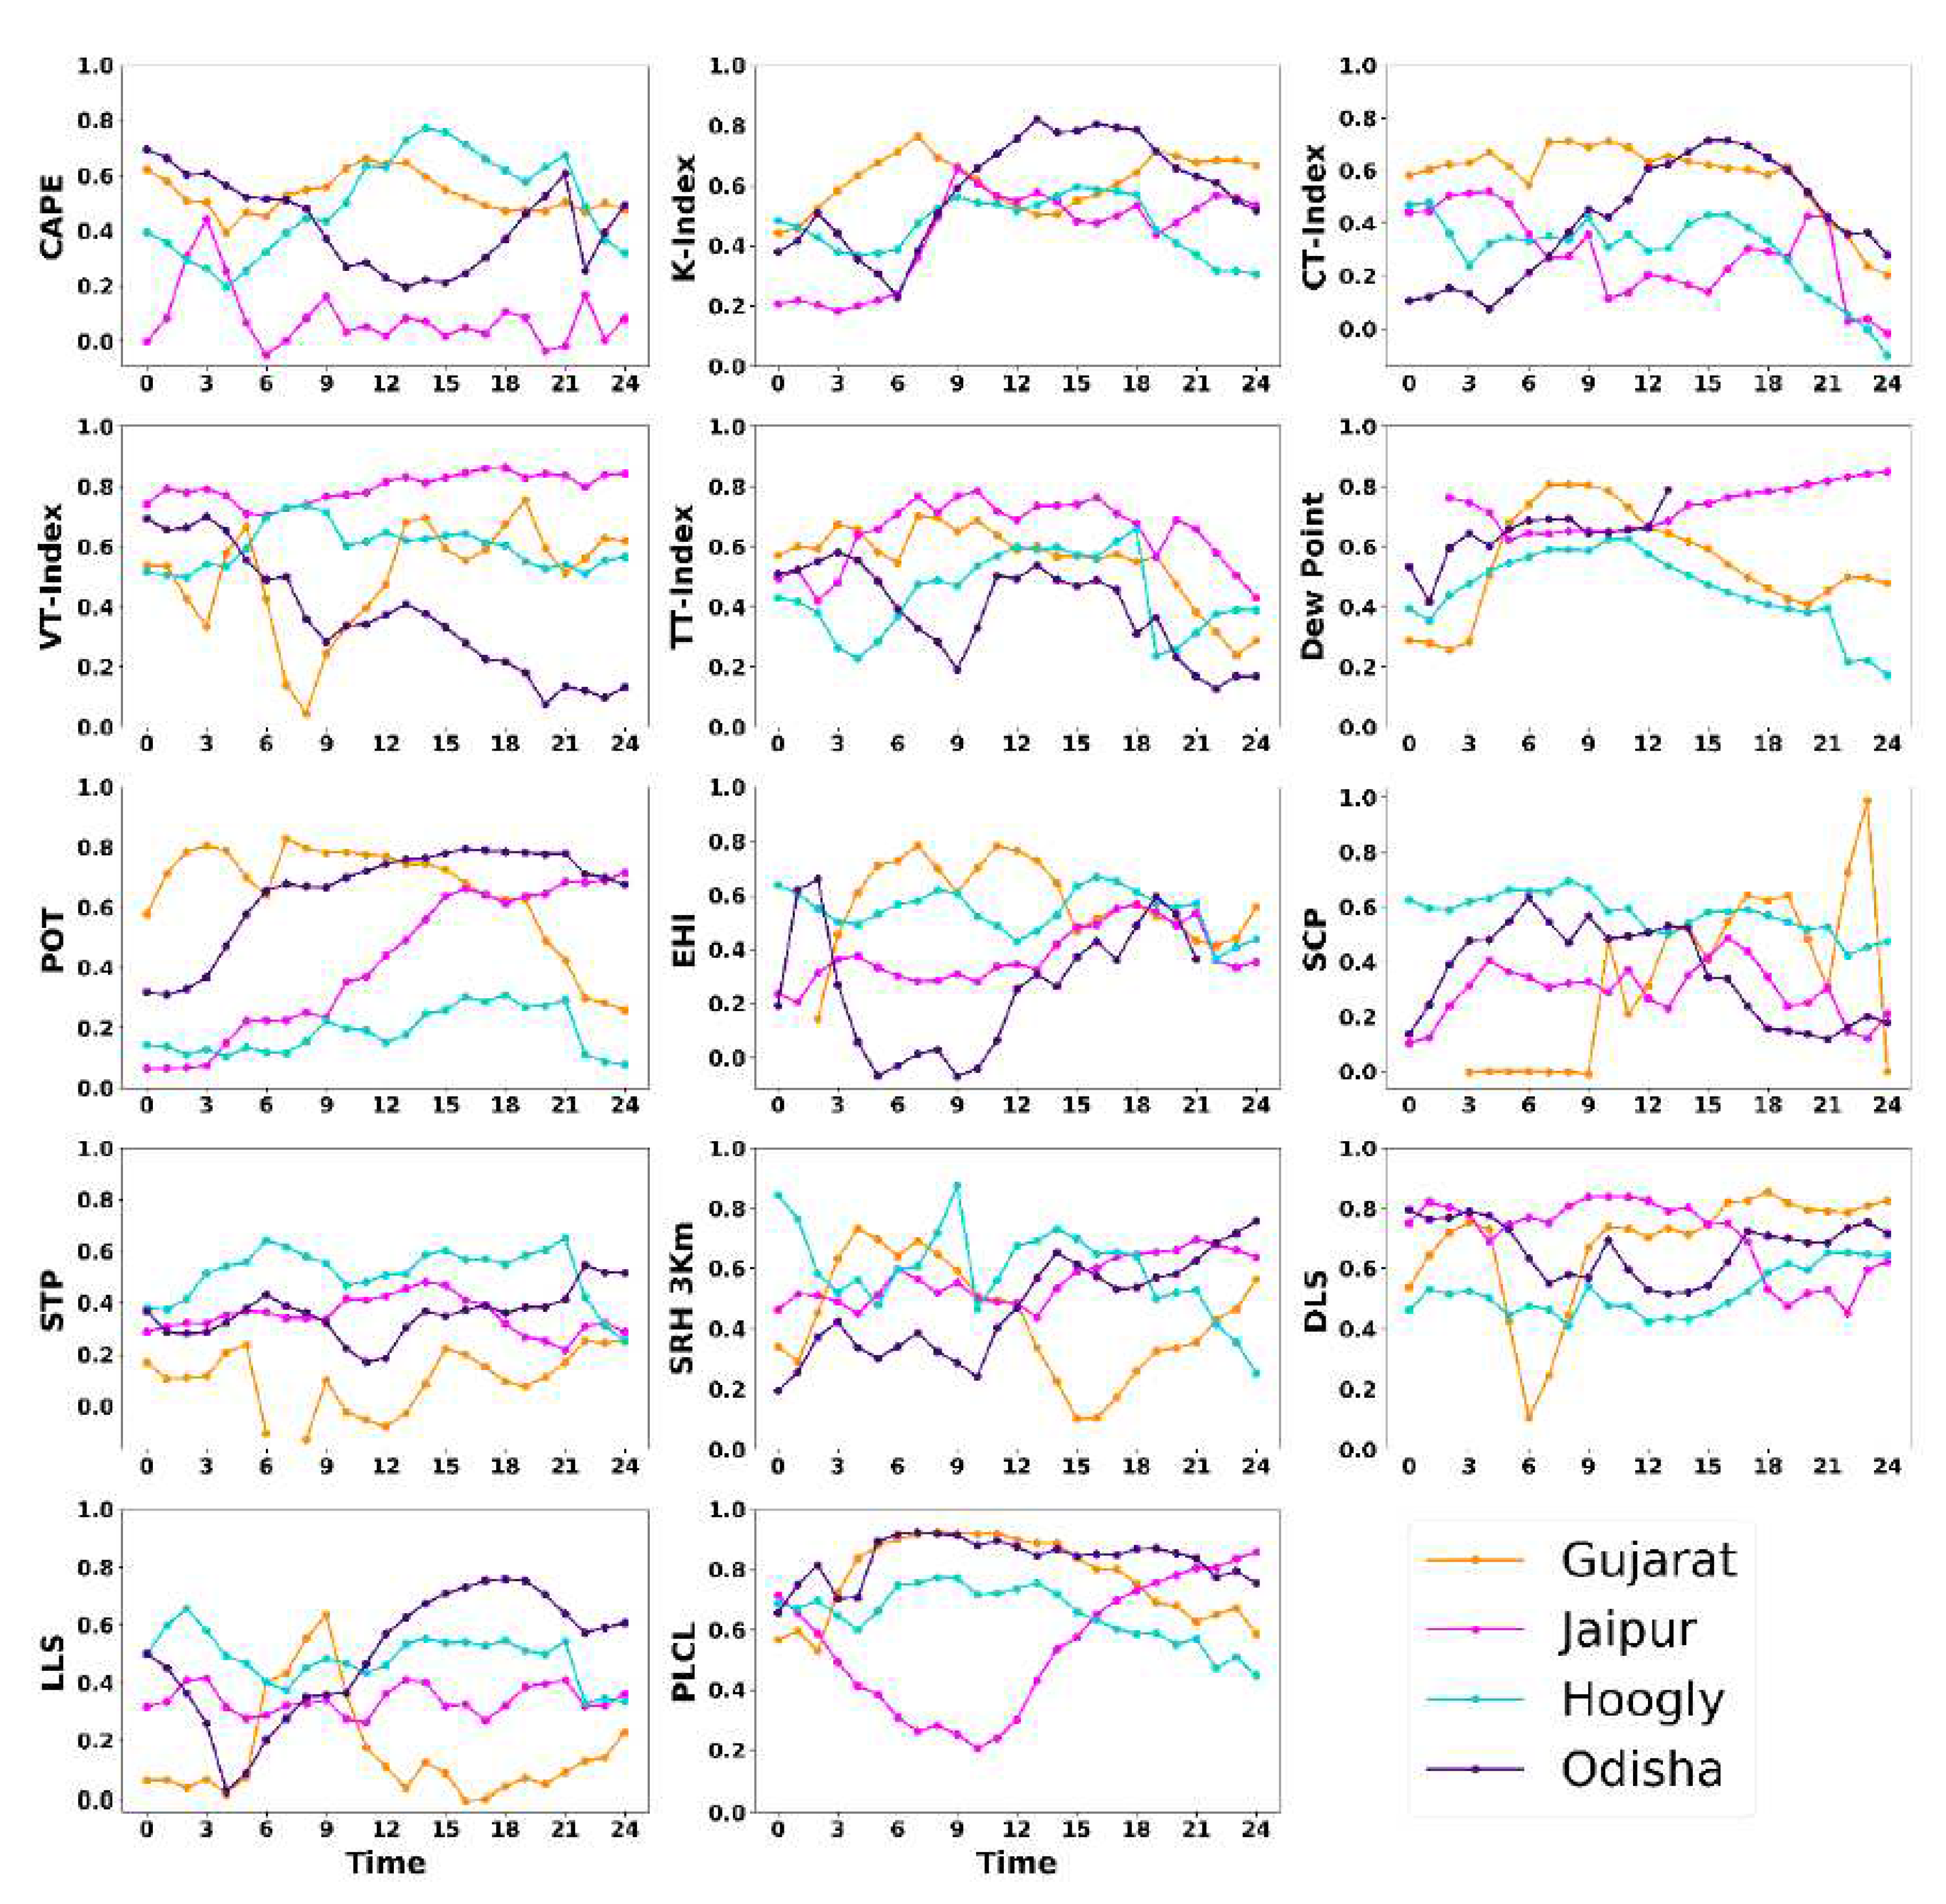
Table 1.
Study of thunderstorm events with total number of lightning flash count over the inner domain using ISS-LIS.
Table 1.
Study of thunderstorm events with total number of lightning flash count over the inner domain using ISS-LIS.
| Events | Date | Datasets | Flash Counts (Number) |
|---|---|---|---|
| Surendranagar, Gujarat | 04 June 2021 | ISS-LIS | 333 in 16 orbits |
| Raygada, Odisha | 24 June 2020 | ISS-LIS | 16 in 16 orbits |
| Udaipur, Rajasthan | 11 July 2021 | ISS-LIS | 244 in 16 orbits |
| Hooghly, West Bengal | 07 June 2021 | ISS-LIS | 293 in 16 orbits |
Table 2.
Summary of WRF model configuration.
| Parameter | Details |
| WRF version | 4.0.3 version |
| Spatial resolution | 9 and 3 Km |
| Model integration time | 24 Hr |
| Time Step | 54 Sec |
| Vertical Resolution | 34 Level |
| Lightning option | 3 (Yair et al., 2010) |
Table 3.
Physical configuration of designed experiments.
| Physics options | Exp -1 | Exp -2 | Exp -3 | Exp -4 |
|---|---|---|---|---|
| Microphysics | WSM-6 | NSSL-2 | MORR | WSM-6 |
| Longwave radiation | RRTM | RRTM | RRTM | RRTM |
| Shortwave radiation | DUDHIA | RRTMG | RRTMG | DUDHIA |
| Land cover classification | MYNN | MM5 | MM5 | MM5 |
| Surface layer | NOAH | NOAH | NOAH | NOAH |
| Planet boundary layer | MYNN | YSU | YSU | YSU |
| Cumulus convection | GRELL-D | GRELL-D | GRELL-D | GRELL-D |
Table 4.
Contingency table.
| Observation (Yes) | Observation (No) | Total | |
| Forecast (Yes) | Hits (YY) | False Alarm (YN) | YY+YN |
| Forecast (No) | Misses (NY) | Correct (NN) | NY+NN |
| Total | YY+NN | YN+NN | T=YY+YN+NY+NN |
Table 5.
Model skill scores descriptions.
| Statistics | Formula | Definition | Range |
|---|---|---|---|
| Accuracy (ACC) | What fraction of the forecasts were correct | 0 to 1 | |
| Probability of Detection (POD) | POD = YY/YY+NY | What fraction of the observed “yes” events were correctly forecast | 0 to 1 |
| Equitable Threat Score (ETS) |
|
How well did the forecast “Yes” events correspond to the observed “yes” events (accounting for hits that would be expected by chance | -1 to 1 |
| False Alarm Ration (FAR) | FAR = YN/YY+YN | What fraction of the predicted “yes” events actually did not occur | 0 to 1 |
Table 12.
Threshold values and skill scores of thunderstorm indices for event time, 0000 UTC and 1200 UTC over Hooghly, West Bengal.
Table 12.
Threshold values and skill scores of thunderstorm indices for event time, 0000 UTC and 1200 UTC over Hooghly, West Bengal.
| 09 UTC | 00 UTC | 12 UTC | ||||||||||||||||||||||
|---|---|---|---|---|---|---|---|---|---|---|---|---|---|---|---|---|---|---|---|---|---|---|---|---|
| Index | Threshold | ACC | POD | FAR | ETS | CSI | TSS | HSS | Threshold | ACC | POD | FAR | ETS | CSI | TSS | HSS | Threshold | ACC | POD | FAR | ETS | CSI | TSS | HSS |
| CAPE | ≥3800 | 0.92 | 0.46 | 0.43 | 0.3 | 0.34 | 0.43 | 0.47 | ≥3900 | 0.95 | 0.31 | 0.3 | 0.25 | 0.27 | 0.3 | 0.41 | ≥4300 | 0.95 | 0.92 | 0.86 | 0.12 | 0.13 | 0.88 | 0.22 |
| KI | ≥31 | 0.92 | 0.98 | 0.07 | 0.48 | 0.91 | 0.56 | 0.65 | ≥26 | 0.91 | 0.96 | 0.05 | 0.41 | 0.91 | 0.58 | 0.62 | ≥31 | 0.9 | 0.97 | 0.08 | 0.43 | 0.9 | 0.51 | 0.6 |
| CT | ≥17 | 0.57 | 0.56 | 0.007 | 0.02 | 0.56 | 0.42 | 0.05 | ≥17 | 0.67 | 0.65 | 0.03 | 0.13 | 0.63 | 0.47 | 0.23 | ≥16 | 0.79 | 0.8 | 0.02 | 0.1 | 0.78 | 0.42 | 0.19 |
| VT | ≥25 | 0.87 | 0.95 | 0.13 | 0.58 | 0.82 | 0.71 | 0.73 | ≥26 | 0.76 | 0.92 | 0.29 | 0.34 | 0.66 | 0.51 | 0.51 | ≥25 | 0.84 | 0.96 | 0.18 | 0.5 | 0.78 | 0.64 | 0.67 |
| TTI | ≥44 | 0.72 | 0.7 | 0.15 | 0.28 | 0.62 | 0.46 | 0.43 | ≥42 | 0.82 | 0.9 | 0.12 | 0.3 | 0.79 | 0.44 | 0.46 | ≥44 | 0.8 | 0.82 | 0.13 | 0.41 | 0.73 | 0.59 | 0.58 |
| DEW | ≥24 | 0.75 | 0.62 | 0.03 | 0.35 | 0.61 | 0.58 | 0.52 | ≥24 | 0.52 | 0.45 | 0.02 | 0.09 | 0.44 | 0.39 | 0.17 | ≥24 | 0.67 | 0.57 | 0.002 | 0.23 | 0.57 | 0.57 | 0.37 |
| POT | ≤-44 | 0.92 | 0.23 | 0.4 | 0.18 | 0.2 | 0.22 | 0.3 | ≤-44 | 0.84 | 0.17 | 0.55 | 0.1 | 0.14 | 0.14 | 0.18 | ≤-52 | 0.74 | 0.72 | 0.08 | 0.26 | 0.67 | 0.5 | 0.41 |
| EHI | ≥0.5 | 0.8 | 0.76 | 0.17 | 0.43 | 0.65 | 0.6 | 0.6 | ≥0.5 | 0.81 | 0.77 | 0.14 | 0.46 | 0.68 | 0.63 | 0.63 | ≥0.5 | 0.71 | 0.72 | 0.32 | 0.27 | 0.54 | 0.43 | 0.42 |
| SCP | ≥0.5 | 0.82 | 0.76 | 0.09 | 0.48 | 0.7 | 0.66 | 0.65 | ≥0.5 | 0.79 | 0.69 | 0.06 | 0.42 | 0.66 | 0.62 | 0.59 | ≥0.5 | 0.74 | 0.69 | 0.13 | 0.31 | 0.62 | 0.51 | 0.48 |
| STP | ≥0.2 | 0.85 | 0.63 | 0.3 | 0.38 | 0.49 | 0.55 | 0.56 | ≥0.2 | 0.79 | 0.42 | 0.2 | 0.27 | 0.38 | 0.37 | 0.43 | ≥0.2 | 0.78 | 0.67 | 0.38 | 0.32 | 0.47 | 0.5 | 0.49 |
| SRH | ≥220 | 0.98 | 0.89 | 0.56 | 0.4 | 0.41 | 0.87 | 0.57 | ≥190 | 0.95 | 0.92 | 0.31 | 0.61 | 0.64 | 0.88 | 0.76 | ≥230 | 0.96 | 0.69 | 0.19 | 0.57 | 0.59 | 0.68 | 0.72 |
| DLS | ≥11 | 0.77 | 0.88 | 0.4 | 0.36 | 0.55 | 0.61 | 0.53 | ≥10 | 0.78 | 0.84 | 0.3 | 0.4 | 0.61 | 0.59 | 0.57 | ≥9 | 0.75 | 0.78 | 0.15 | 0.3 | 0.68 | 0.48 | 0.46 |
| LLS | ≥7 | 0.93 | 0.54 | 0.52 | 0.3 | 0.33 | 0.5 | 0.47 | ≥4 | 0.93 | 0.92 | 0.04 | 0.74 | 0.89 | 0.86 | 0.85 | ≥5 | 0.61 | 0.29 | 0.33 | 0.09 | 0.25 | 0.17 | 0.18 |
| PLCL | ≥880 | 0.88 | 0.77 | 0.001 | 0.63 | 0.77 | 0.77 | 0.77 | ≥940 | 0.88 | 0.81 | 0.005 | 0.63 | 0.8 | 0.8 | 0.77 | ≥900 | 0.86 | 0.75 | 0.007 | 0.58 | 0.75 | 0.74 | 0.73 |
Table 13.
Threshold values and skill scores of thunderstorm indices for event time, 0000 UTC and 1200 UTC over Raygada, Odisha.
Table 13.
Threshold values and skill scores of thunderstorm indices for event time, 0000 UTC and 1200 UTC over Raygada, Odisha.
| 13 UTC | 00 UTC | 12 UTC | ||||||||||||||||||||||
|---|---|---|---|---|---|---|---|---|---|---|---|---|---|---|---|---|---|---|---|---|---|---|---|---|
| Index | Threshold | ACC | POD | FAR | ETS | CSI | TSS | HSS | Threshold | ACC | POD | FAR | ETS | CSI | TSS | HSS | Threshold | ACC | POD | FAR | ETS | CSI | TSS | HSS |
| CAPE | ≥1300 | 0.55 | 0.87 | 0.51 | 0.09 | 0.45 | 0.19 | 0.17 | ≥1400 | 0.82 | 0.89 | 0.25 | 0.48 | 0.68 | 0.67 | 0.65 | ≥1200 | 0.6 | 0.9 | 0.45 | 0.13 | 0.51 | 0.24 | 0.23 |
| KI | ≥34 | 0.91 | 0.87 | 0.06 | 0.69 | 0.82 | 0.82 | 0.82 | ≥35 | 0.79 | 0.7 | 0.11 | 0.42 | 0.64 | 0.6 | 0.6 | ≥34 | 0.87 | 0.83 | 0.08 | 0.6 | 0.77 | 0.75 | 0.75 |
| CT | ≥18 | 0.83 | 0.9 | 0.15 | 0.47 | 0.77 | 0.62 | 0.63 | ≥20 | 0.69 | 0.46 | 0.49 | 0.15 | 0.31 | 0.26 | 0.26 | ≥18 | 0.83 | 0.89 | 0.13 | 0.45 | 0.78 | 0.6 | 0.62 |
| VT | ≥23 | 0.72 | 0.81 | 0.24 | 0.26 | 0.64 | 0.4 | 0.41 | ≥24 | 0.87 | 0.86 | 0.22 | 0.56 | 0.69 | 0.73 | 0.72 | ≥24 | 0.75 | 0.7 | 0.63 | 0.2 | 0.31 | 0.46 | 0.33 |
| TTI | ≥42 | 0.72 | 0.91 | 0.43 | 0.3 | 0.53 | 0.53 | 0.46 | ≥42 | 0.77 | 0.88 | 0.22 | 0.35 | 0.7 | 0.5 | 0.52 | ≥42 | 0.7 | 0.9 | 0.43 | 0.28 | 0.53 | 0.49 | 0.44 |
| DEW | ≥23 | 0.78 | 0.78 | 0 | 0.001 | 0.78 | 0.78 | 0.003 | ≥23 | 0.71 | 0.71 | 0.001 | 0.009 | 0.71 | 0.53 | 0.01 | ≥24 | 0.69 | 0.67 | 0.001 | 0.1 | 0.67 | 0.65 | 0.18 |
| POT | ≤-50 | 0.88 | 0.77 | 0.01 | 0.61 | 0.76 | 0.75 | 0.76 | ≤-48 | 0.74 | 0.67 | 0.33 | 0.29 | 0.5 | 0.46 | 0.46 | ≤-50 | 0.87 | 0.76 | 0.02 | 0.6 | 0.74 | 0.74 | 0.75 |
| EHI | ≥1 | 0.89 | 0.37 | 0.71 | 0.15 | 0.19 | 0.3 | 0.26 | ≥0.5 | 0.89 | 0.55 | 0.58 | 0.26 | 0.13 | 0.48 | 0.42 | ≥0.5 | 0.65 | 0.76 | 0.76 | 0.11 | 0.22 | 0.4 | 0.2 |
| SCP | ≥0.5 | 0.84 | 0.65 | 0.55 | 0.28 | 0.36 | 0.53 | 0.44 | ≥0 | 0.74 | 0.76 | 0.15 | 0.29 | 0.67 | 0.47 | 0.45 | ≥0.5 | 0.84 | 0.62 | 0.55 | 0.27 | 0.34 | 0.5 | 0.42 |
| STP | ≥-0.1 | 0.92 | 0.92 | 0 | 0 | 0.92 | 0 | 0 | ≥-0.1 | 0.92 | 0.93 | 0.006 | -0.01 | 0.92 | -0.06 | -0.01 | ≥-0.1 | 0.92 | 0.92 | 0.001 | -0.01 | 0.92 | -0.7 | -0 |
| SRH | ≥70 | 0.91 | 0.61 | 0.35 | 0.4 | 0.45 | 0.56 | 0.57 | ≥50 | 0.89 | 0.47 | 0.32 | 0.33 | 0.38 | 0.43 | 0.49 | ≥70 | 0.89 | 0.51 | 0.41 | 0.32 | 0.37 | 0.46 | 0.49 |
| DLS | ≥6 | 0.74 | 0.78 | 0.36 | 0.32 | 0.54 | 0.51 | 0.48 | ≥6 | 0.89 | 0.92 | 0.1 | 0.66 | 0.83 | 0.79 | 0.79 | ≥6 | 0.76 | 0.77 | 0.31 | 0.35 | 0.54 | 0.52 | 0.51 |
| LLS | ≥3.5 | 0.87 | 0.67 | 0.14 | 0.5 | 0.6 | 0.62 | 0.66 | ≥2.5 | 0.79 | 0.81 | 0.16 | 0.39 | 0.7 | 0.56 | 0.56 | ≥2 | 0.79 | 0.69 | 0.19 | 0.4 | 0.59 | 0.56 | 0.57 |
| PLCL | ≥940 | 0.92 | 0.94 | 0.11 | 0.72 | 0.84 | 0.84 | 0.84 | ≥960 | 0.88 | 0.88 | 0.09 | 0.6 | 0.8 | 0.76 | 0.75 | ≥940 | 0.93 | 0.93 | 0.07 | 0.77 | 0.86 | 0.87 | 0.87 |
Disclaimer/Publisher’s Note: The statements, opinions and data contained in all publications are solely those of the individual author(s) and contributor(s) and not of MDPI and/or the editor(s). MDPI and/or the editor(s) disclaim responsibility for any injury to people or property resulting from any ideas, methods, instructions or products referred to in the content. |
© 2023 by the authors. Licensee MDPI, Basel, Switzerland. This article is an open access article distributed under the terms and conditions of the Creative Commons Attribution (CC BY) license (http://creativecommons.org/licenses/by/4.0/).
Copyright: This open access article is published under a Creative Commons CC BY 4.0 license, which permit the free download, distribution, and reuse, provided that the author and preprint are cited in any reuse.


