
Submitted:
20 February 2025
Posted:
21 February 2025
You are already at the latest version
Abstract
Smart greenhouses offer crucial solutions for reducing atmospheric impact and resource waste. However, two fundamental challenges persist in their implementation: massive energy consumption and a high level of human intervention, particularly for sensor battery replacement or recharging. Unfortunately, sensors are indispensable in greenhouses and agriculture, such as for monitoring environmental parameters for air quality assessment. Therefore, while sensors cannot be eliminated, it is essential to optimize their energy consumption. This work introduces an energy-efficient monitoring system for smart greenhouses, aiming to reduce the energy consumption of individual sensors and enhance system sustainability. The study focuses on optimizing the sampling intervals of commonly monitored environmental parameters to minimize sensor energy usage while maintaining data acquisition accuracy adequate for the intended purpose. Additionally, to further reduce battery energy draw, an energy harvesting system using solar panels has been implemented. In conclusion, adopting an optimal sampling strategy for each parameter significantly reduces energy consumption compared to fixed, inefficient sampling intervals commonly used in commercial weather stations. Furthermore, by employing an energy harvesting system for each sensor, leveraging the light emitted by greenhouse lamps and external sources ensures the autonomy of sensors within the greenhouse, thereby minimizing the need for human intervention for battery replacement and recharging.
Keywords:
Spectrum Analysis
; Energy Harvesting
; Smart Agriculture
; Internet of Things
; Sampling time
1. Introduction
The pressing issue of our time is climate change and its impact on people’s lives, marked by increasingly frequent extreme events such as torrential rainstorms and prolonged droughts. One particularly affected sector is agriculture, where climate change has a significant impact, sometimes forcing farmers to switch crop types in the same area as the environment becomes unsuitable for previously cultivated species, leading to a migration of crops.
The adoption of smart greenhouses could be a viable solution to mitigate the effects of climate change and rising temperatures on populations. Smart greenhouses, equipped with intelligent monitoring systems, can reduce environmental impact and resource waste, eliminating the need for crop migration and even reducing reliance on food imports from other countries. This is achieved by adapting and controlling the greenhouse’s internal microclimate to suit the specific needs of the crops being cultivated.
However, two major challenges arise with these implementations: excessive energy consumption and the high frequency of human intervention, particularly for recharging or replacing batteries in devices installed inside and outside the system. Monitoring both internal [1] and external [2] parameters is essential for air quality assessment [3], including factors such as temperature, humidity, , , and [4]. This monitoring is also crucial for resource management, particularly water usage [5]. These parameters are monitored at varying sampling frequencies, ranging from seconds [6] to hours [7], depending on the monitoring system used and, less frequently, on the parameters being measured. As observed in the agricultural market, companies offering environmental monitoring systems provide products with highly variable sampling intervals, as summarized in Table 1, often without a specific criterion.
Regarding the energy efficiency of devices installed in greenhouses, the literature proposes various methodologies. One approach involves adapting the data rate based on the distance between the end-node and the gateway to minimize energy consumption [18]. Another method adjusts the transmission power by considering the signal-to-noise ratio [19]. Additionally, transmission frequency adaptation is explored as a strategy [20]. For instance, the work [21] plans and optimizes the placement of cluster heads to balance data traffic using priority queuing with fuzzy logic. This demonstrates that it is possible to minimize and distribute energy consumption across the network. Another approach focuses on managing the sleep and active periods of both end-nodes and gateways to reduce overall energy consumption [22].
Today, any well-equipped greenhouse integrates artificial lighting alongside natural sunlight. Therefore, a system capable of harvesting luminous flux and converting it into electrical power to supply the underlying devices via solar panels can significantly enhance the greenhouse’s efficiency by potentially reusing wasted energy [23]. Another example of reusing energy emitted by lamps is employing two different communication methods for downlink and uplink. The study [24] leverages and optimizes light emissions from lamps using the Light Fidelity (Li-Fi) technology to send commands to the end nodes. For data transmission, it employs Chirp Spread Spectrum (CSS) modulation, thereby optimizing energy usage for both illumination and command reception.
This paper investigates and analyzes the optimal sampling times for monitoring environmental parameters critical to plant growth. Additionally, it seeks to better understand how this sampling interval varies across parameters and seasons. To achieve this, the analysis employs frequency-domain techniques for time series data, a commonly used approach in telecommunications and signal processing, which is equally valuable in agriculture. The second part of the study focuses on outlining the key steps for designing and implementing an energy harvesting system, emphasizing the reuse of energy emitted by lamps and sunlight. The last goal is to extend the sensor’s lifespan, making it independent of battery life and significantly reducing the need for human intervention in battery management.
The paper is organized as follows. Section 2 outlines the proposed methodology, divided into two main areas: the analysis of time series for environmental parameters, and the design of an energy harvesting system to improve the energy efficiency of the smart greenhouse. Section 3 presents and discusses the results obtained, and Section 4 concludes the work.
2. Methods and Materials
The following section describes and presents the steps to achieve the results, which are subsequently discussed in Section 3. As previously mentioned, the study is divided into two main parts:
- 2.1: Analysis of environmental parameters to determine the optimal sampling interval and its variations, aiming to reduce energy consumption by managing the sleep and active phases of individual sensors.
- 2.2: Design and implementation of an energy harvesting system to utilize energy from solar radiation and, more importantly, reuse the artificial light emitted by lamps. This approach seeks to improve energy efficiency and reduce the sensor’s reliance on battery power.
2.1. Optimizing Sampling Intervals for Energy-Efficient Sensor Operation
To optimize the energy consumption of sensors installed in greenhouses, first of all, we determine the optimal sampling time for the environmental parameters that we aim to monitor. In this study, we have analyzed and monitored temperature and humidity, both external and internal, across four different greenhouses located in the same area. Figure 1 illustrates the workflow followed for the sampling time analysis.
We began by monitoring and collecting temperature and humidity data provided by the greenhouse sensors with a sampling interval of 5 minutes, which we assume to be much smaller than the optimal sampling interval. After collecting the data, we cleaned any errors or missing entries encountered during transmission, creating a dataset that serves as the reference for this study.
During the data analysis process, we first divided the data into daily subsets and then processed them by applying the Discrete Fourier Transform (DFT), as described in Equation (1). The DFT is the most important discrete transform used for Fourier analysis in many practical applications. In digital signal processing, a function represents any quantity or signal that varies over time (e.g., the pressure of a sound wave, a radio signal, or daily temperature readings) sampled over a finite time interval. The DFT transforms a sequence of N complex numbers into another sequence of complex numbers .
where is the signal represented in the frequency domain. After computing the signal spectrum, it is passed through a low-pass filter, retaining only the portion of the spectrum where the majority of the signal’s energy resides. At this stage, the maximum spectral frequency () and the optimal sampling time () for the day can be extracted using Equation (2), considering the Nyquist theorem. The theorem states that the sampling frequency must be at least twice the maximum frequency component of the signal being sampled to accurately reconstruct the original signal.
Once is calculated on a day-by-day basis, the next step involves performing an energy analysis of the individual MCU board to which the sensor is connected, in order to optimize its energy consumption. The steps followed for this analysis are outlined in Figure 2. Upon completing the energy consumption analysis, the Average Current Consumption (ACC) can be calculated by measuring the current consumption of the MCU board in its various states and then applying Equation (3).
Here, represents the current consumed in transmission mode, in receiver mode, and in deep sleep mode. Meanwhile, is the time taken to transmit the message, and is the sampling period of the environmental parameter.
At the end, based on the duration of sunlight () and nighttime () hours in the greenhouse, Equation (4) can be used to calculate the minimum battery capacity () required to provide sufficient energy for the MCU board to operate throughout the night, assuming that sufficient energy is harvested during the day to power the board, as is the case in our work.
2.2. Design of the Energy Harvesting System
We assumed the presence of high-power LEDs in a smart greenhouse to provide artificial illumination even when sunlight is low or absent [25]. To make the duration of the MCU board independent from battery life, we have proposed the workflow, as shown in Figure 3. The goal is to convert and reuse the energy emitted by the lamps and external sources, such as sunlight, using small solar panels directly attached to the individual MCU boards. The aim is to fully power the boards during the day and recharge the mini battery to supply energy during the night, when both lamps and sunlight are absent. Given the size of the area to be illuminated () and the optimal lighting power () required for plant growth (provided by both sunlight and artificial lamps), the Estimated Luminous Flux () can be calculated using Equation (5).
Then, we convert them from lux to W/m2 () using Equation (6).
To estimate the current provided by the solar panel () with a certain area (), efficiency (), and provided voltage (), Equation (7) is used.
2.3. Materials
To collect environmental data both inside and outside the greenhouses, we utilized a central weather station, the Davis Vantage Pro 2 [26]. This weather station is capable of measuring wind direction and speed, air temperature with an accuracy of ±0.3°C, air humidity with an accuracy of ±2%, atmospheric pressure, and rainfall. The data collection system consists of the central station, from which we collect external temperature and humidity data, and four distributed units, each located within a greenhouse, with the same measurement accuracy. The four greenhouses are located in the same area in Pisa, Italy. The data collected from the five stations constitute the dataset under study in this work.
Assuming the same network architecture as in our previous work [25], the test MCU board used was the Heltec WiFi LoRa [27], which supports communication via both Wi-Fi and LoRa at 868 MHz. Literature demonstrates that LoRa modulation is more energy-efficient compared to Wi-Fi; therefore, in this study, the boards communicate using LoRa modulation. The sensor used to collect air temperature and humidity data was the DHT11 [28]. The Heltec board was powered by a polycrystalline solar panel from Star Solar, model CNC85x115-18 [29], with dimensions of 85mm x 115mm. The panel delivers a maximum power of 1.5W, a maximum voltage of 18V, and a maximum current of 83mA before being connected to the energy harvesting module EH302 [30]. To power the board during the night, a Li-Po battery [31] with a nominal voltage of 3.7V and a capacity of 1350mAh was used.
Finally, to analyze the power consumption of the Heltec board, the Otii Arc PRO device [32] was used. This device serves as a two-quadrant source measure unit with constant voltage or constant current sourcing and sinking capabilities. It also features a high-precision multichannel multimeter and a linear power supply (0.5-5V). The Otii Arc PRO functions as a power analyzer or profiler, enabling real-time recording and display of currents, voltages, and/or UART logs. It provides current measurements with nanoampere resolution and supports a sampling rate of up to 4 ksps.
3. Results
In this section, we present the results obtained from determining the optimal sampling times using frequency domain analysis (see Section 3.1). Subsequently, we analyze the energy consumption of the MCU board under test for implementing an optimized energy harvesting system aimed at reducing the board’s reliance on battery power (see Section 3.2).
3.1. Determination of the Optimal Sampling Times
To determine the optimal sampling time, it is first necessary to analyze historical data. In our case, we monitored and saved temperature and humidity values, both external and internal, from four different greenhouses located in the same area in Pisa, Italy. The data were collected every 5 minutes, used as the reference time (), throughout the entire year 2023. To calculate the optimal sampling time (), we performed frequency domain analysis on a day-by-day basis using the Discrete Fourier Transform (DFT) implemented in MATLAB R2023b [33], as described in Section 2.1. To better understand the error introduced in reconstructing the trend sampled with compared to , we employed various interpolation methods to reconstruct the missing samples resulting from the less frequent optimal sampling. Several interpolation methods were tested, including linear, polynomial, rational, and spline interpolation. Among these, the linear interpolation method was selected as it produced a reconstructed signal with lower Mean Squared Error (MSE), Root Mean Squared Error (RMSE), and Mean Absolute Percentage Error (MAPE) in our case. The MSE quantifies how much the interpolated signal () deviates from the real signal (s) on average, emphasizing larger errors due to squaring, as in Equation (8).
where n is the total number of observation and i is the puntual observation.
The RMSE is the square root of the MSE. It provides an interpretable error metric in the same unit as the original data. The Equation is:
The MAPE evaluates the average percentage error between the real and interpolated signals, offering a normalized measure of accuracy, as Equation (10).
Additionally, the Average Variation between Adjacent Samples ( and in Equation (11))
where represents the value of the i-th sample and N is the total number of samples, the average error of the daily minimum ( in Equation (12))
and the average error of the daily maximum ( in Equation (13))
where is the set of daily reference samples for day j, is the set of optimal daily samples for day j and D is the total number of days, were calculated for the entire year as well as across the four seasons: Winter (January 1, 2023 - March 19, 2023, and December 22, 2023 - December 31, 2023), Spring (March 20, 2023 - June 20, 2023), Summer (June 21, 2023 - September 22, 2023), and Autumn (September 23, 2023 - December 21, 2023). This analysis was conducted to assess whether the potential errors introduced are negligible for our purposes.
Table 2 presents all the aforementioned indices computed as annual averages, while Table 3, Table 4, Table 5 and Table 6 display the seasonal averages for Winter, Spring, Summer, and Autumn, respectively.
In the Table 2, Table 3, Table 4, Table 5 and Table 6, it can be observed that the optimal sampling time is significantly longer than the reference time of 5 minutes, both across seasons and for the parameters monitored inside and outside the greenhouses. As expected, less frequent sampling introduces reconstruction errors in the signal, which can be considered negligible. Typically, the primary indicators used in weather stations or environmental parameter trends are the daily minimum and maximum values.
In this work, the annual and seasonal average errors for internal and external parameters are reported in the tables. It can be seen that the committed error for the daily minimum ranges from 0.0159 °C to 0.1126 °C for temperature and from 0.2243% to 1.3474% for humidity. For the daily maximum, the error ranges from 0.0955 °C to 0.2452 °C for temperature and from 0.0511% to 0.4868% for humidity. It is important to note that in our case, the sensitivity of the sensors used is ± 0.3 °C and ± 2%. Thus, the errors in detecting the daily minimum and maximum for both temperature and humidity always remain below the sensitivity threshold, making them negligible. With this conclusion, it is possible to adopt the new sampling times () to optimize the power consumption of the MCU boards.
3.2. Energy Consumption Reduction
To better understand the benefits of determining the optimal sampling time, following the frequency domain analysis, we analyzed the current consumption of the MCU used in our system through the Otii Arc PRO device to compute and , as described in Section 2.1. Since our MCU transmits messages using LoRa modulation at 868 MHz, we measured the current consumption in three different operational modes: Transmission Mode, Receiver Mode, and Deep Sleep Mode.
Figure 4 illustrates the current consumed in Transmission Mode () as a function of transmission power.
In Receiver Mode, the current consumption () is 58 mA, while in Deep Sleep Mode (), it is 1.75 mA. To calculate , it is necessary to understand the time required by the MCU to send a typical LoRa message ().
Table 7 displays the time required to transmit a 200 bytes LoRa message assumed to be the typical size for IoT sensor messages at different bandwidths of 125, 250, and 500 kHz (, , and , respectively). The transmission times are also shown relative to the LoRa Spreading Factors ( to ) that can be employed.
As an illustrative example and to demonstrate that the current consumption can be modeled as constant across different MCU operational modes, Figure 5 shows the current consumption over time when the MCU is in Transmission Mode and Deep Sleep Mode during two distinct periods.
To calculate using , (as described in Section 2.1), and (as detailed in Section 2.2), we considered the worst-case scenario, where the MCU operates in Transmission Mode at 15 dBm, with a bandwidth of 125 kHz and SF12. Using the annual average values of presented in Table 2, Table 8 provides the Average Current Consumption, Minimum Battery Capacity, Current Provided by the Solar Panel, and the Percentual Energy Reduction ().
The is defined as the percentage reduction in current consumption when using as the sampling time compared to . It is important to note that the reference sampling time () is 5 minutes, from which , , and are derived. These values are 6.1378 mA, 36.8266 mAh, and 8.1837 mA, respectively, considering as six hours.
As shown in Table 8, when using instead of , the PER ranges from 61.3072% to 63.923%, indicating a significant reduction in current consumption. Considering the worst-case scenario to determine the current that the solar panel must supply to the MCU () as 3.1665 mA, it is possible to calculate backward, as described in Section 2.2, the amount of ELF required in the greenhouse to ensure the solar panel provides sufficient current to make the MCU’s operation independent of the battery.
In this scenario, we consider a solar panel, described in Section 2.3, with an efficiency () of 0.12 and dimensions of 9.775e3 m2, which must supply 3.7 V to the MCU. Using the theoretical formula from Section 2.2, the required ELF is calculated to be 6842 lux to keep the system active. Typically, in greenhouses, as shown in one of our previous studies [25], the ELF is approximately 50000 lux, which is significantly higher than the calculated minimum ELF. Based on this observation, we can conclude that the solar panel considered, when installed in the described environment, is capable of supplying a current greater than the minimum required, adequately powering the MCU board daily.
3.3. Considerations
In the previously described results, we demonstrate how an optimal sampling time can reduce the energy consumption of individual sensors installed in the greenhouse. For the calculation of the current consumption and the design of the energy harvesting system, we considered the annually averaged derived from the mean of the seasonal values.
Overall, the annual current consumption remains unchanged when considering the four seasonal values separately. Table 9, Table 10, Table 11 and Table 12 illustrate how the reconstruction of parameter trends and the identification of daily minima and maxima vary for the four parameters under consideration: outdoor air temperature, outdoor air humidity, greenhouse air temperature, and greenhouse air humidity. The latter two parameters are averaged across the four greenhouses under study.
From the resulting values, it is evident that adopting a dynamic sampling time that varies with the seasons reduces the error in identifying the daily minimum and maximum of each parameter. Additionally, it enhances the overall reconstruction of the trends.
4. Conclusion
In conclusion, this work aims to address two major challenges associated with the implementation of smart greenhouses: excessive energy consumption and the high frequency of human intervention, particularly for recharging or replacing batteries in devices installed both inside and outside the system. Specifically, the study employed a frequency-domain approach to determine the optimal sampling time for commonly monitored parameters, such as indoor and outdoor air temperature and humidity, in the context of greenhouses. Sampling intervals commonly used in these systems and weather stations range between 5 and 15 minutes. However, as demonstrated in this study, these intervals are inefficient and energy-intensive. We propose adapting the sampling time based on the parameter being measured (e.g., temperature sampling time: 41.75 - 48.42 minutes; humidity sampling time: 42.24 - 46.06 minutes) and potentially adjusting it dynamically according to seasonal changes. This approach reconstructs temporal trends with lower errors in terms of MSE, RMSE, and MAPE. Additionally, by optimizing the sampling time and thereby reducing the energy consumption of individual sensors, and with the aid of greenhouse lamps providing consistent light flux, an energy harvesting system was designed and tested using a solar panel. This system enables the use of sensors with smaller battery capacities, making their operation independent of battery life. Consequently, human intervention for battery replacement and recharging is significantly reduced, and the greenhouse’s energy efficiency is enhanced by reusing light flux from lamps or external sources.
Author Contributions
Conceptualization, C.B., D.A. and S.G.; methodology, C.B., D.A. and S.G.; investigation, C.B.; writing—original draft preparation, C.B.; review and editing, S.G. and D.A.; supervision, D.A. and S.G.; project administration, S.G. All authors have read and agreed to the published version of the manuscript.
Funding
This research received no external funding.
Data Availability Statement
Data is contained within the article.
Acknowledgments
This work was partially supported by the Italian Ministry of Research (MUR) in the framework of the CrossLab & Forelab Projects (Departments of Excellence), and by the National Research Centre for Agricultural Technologies" (CN00000022 — program “AGRITECH”)
Conflicts of Interest
The authors declare no conflicts of interest.
References
- Permana, A.F.; Kuncoro, C.B.D. Autonomous Temperature and Humidity Wireless Sensor Node for Indoor Air Quality Monitoring Application. In Proceedings of the 2021 5th International Conference on Informatics and Computational Sciences (ICICoS); 2021; pp. 272–276. [Google Scholar] [CrossRef]
- Rachana, M.; Abhilash, B.; Meghana, P.; Mishra, V.; Rudraswamy, S.B. Design and deployment of sensor system — envirobat 2. In 1, an urban air quality monitoring system. In Proceedings of the 2017 International Conference on Electrical, Electronics, Communication, Computer, 2017, and Optimization Techniques (ICEECCOT); pp. 412–415. [CrossRef]
- Tembhurne, V.K.; Shinde, V.D.; Kumar, S.; Shrimali, M.; Chhabra, G.; Quadri, M.N.; Rajpoot, V. IoT-based Air pollution Monitoring System to Measure Air Quality on Cloud Storage. In Proceedings of the 2023 2nd International Conference on Paradigm Shifts in Communications Embedded Systems, Machine Learning and Signal Processing (PCEMS); 2023; pp. 1–6. [Google Scholar] [CrossRef]
- Magno, M.; Aoudia, F.A.; Gautier, M.; Berder, O.; Benini, L. WULoRa: An energy efficient IoT end-node for energy harvesting and heterogeneous communication. In Proceedings of the Design, Automation & Test in Europe Conference & Exhibition (DATE), 2017, 2017, pp. 1528–1533. [Google Scholar] [CrossRef]
- Pomoni, D.I.; Koukou, M.K.; Vrachopoulos, M.G.; Vasiliadis, L. A Review of Hydroponics and Conventional Agriculture Based on Energy and Water Consumption, Environmental Impact, and Land Use. Energies 2023, 16. [Google Scholar] [CrossRef]
- Udrea, I.; Gheorghe, V.I.; Alionte, C.G.; Dogeanu, A.M.; Cartal, L.A. IoT solution for thermal comfort and air quality monitoring. In Proceedings of the 2023 15th International Conference on Electronics, Computers and Artificial Intelligence (ECAI); 2023; pp. 01–06. [Google Scholar] [CrossRef]
- Ullah, I.; Fayaz, M.; Khan, M.; Kim, D. An optimization scheme for IoT based smart greenhouse climate control with efficient energy consumption. Computing 2022, 104. [Google Scholar] [CrossRef]
- Hashim, H.; Hazwan, M.N.; Saad, P.S.M.; Harun, Z. The Real-Time Monitoring of Air Quality Using IOT-Based Environment System. In Proceedings of the 2023 19th IEEE International Colloquium on Signal Processing &, 2023, Its Applications (CSPA); pp. 54–58. [CrossRef]
- Vantage PRO 2 wired. https://www.zetalab.it/prodotto/stazione-meteo-cablata-vantage-pro2/. Accessed: 17/04/2024.
- Davis Vantage PRO 2 wired. https://shop.meteoproject.it/prodotto/davis-vantage-pro-2-cablata/. Accessed: 17/04/2024.
- ISS Wired. https://shop.meteoproject.it/prodotto/iss-cablato/. Accessed: 17/04/2024.
- Ecowitt GW1001. https://shop.meteoproject.it/prodotto/ecowitt-gw1001-stazione-meteo/. Accessed: 17/04/2024.
- Ecowitt GW1003. https://shop.meteoproject.it/prodotto/ecowitt-gw1003/. Accessed: 17/04/2024.
- MeteoSense 4.0. https://www.netsens.it/prodotti/stazioni-meteo-professionali-20/. Accessed: 17/04/2024.
- Weather Station and Webcam. https://shop.meteoproject.it/prodotto/kit-standard-stazione-meteo-e-webcam/. Accessed: 17/04/2024.
- Ecowitt WH6006E. https://shop.meteoproject.it/prodotto/ecowitt-wh6006e/. Accessed: 17/04/2024.
- AgriSense. https://www.netsens.it/agricoltura-4-0/. Accessed: 17/04/2024.
- Islam, S.; Akhtar, M.J.; Khan, M.N.I.; Islam, S.J. Energy Balanced Clustering using Balancing Nodes for Wireless Sensor Networks. In Proceedings of the 2019 International Conference on Computer Communication and Informatics (ICCCI); 2019; pp. 1–4. [Google Scholar] [CrossRef]
- Chevillat, P.; Jelitto, J.; Truong, H.L. Dynamic data rate and transmit power adjustment in IEEE 802.11 wireless LANs. International Journal of Wireless Information Networks 2005, 12, 123–145. [Google Scholar] [CrossRef]
- González-Palacio, M.; Tobón-Vallejo, D.; Sepúlveda-Cano, L.M.; Rúa, S.; Le, L.B. Machine-Learning-Based Combined Path Loss and Shadowing Model in LoRaWAN for Energy Efficiency Enhancement. IEEE Internet of Things Journal 2023, 10, 10725–10739. [Google Scholar] [CrossRef]
- Rahimi, P.; Chrysostomou, C. Improving the Network Lifetime and Performance of Wireless Sensor Networks for IoT Applications Based on Fuzzy Logic. In Proceedings of the 2019 15th International Conference on Distributed Computing in Sensor Systems (DCOSS); 2019; pp. 667–674. [Google Scholar] [CrossRef]
- Michalik, L.S.; Guegan, L.; Raïs, I.; Anshus, O.; Bjørndalen, J.M. LoRaLitE: LoRa protocol for Energy-Limited environments. In Proceedings of the 2022 30th International Symposium on Modeling, Analysis, 2022, and Simulation of Computer and Telecommunication Systems (MASCOTS); pp. 73–80. [CrossRef]
- Gong, L.; Sharma, A.; Henry, J.; Youssef, M. A Novel Solar Harvesting Modular Wireless Sensor Mote for Green House Applications: Design & Implementation. In Proceedings of the 2021 IEEE Energy Conversion Congress and Exposition (ECCE); 2021; pp. 802–807. [Google Scholar] [CrossRef]
- Guzman, B.G.; Talavante, J.; Fonseca, D.F.; Mir, M.S.; Giustiniano, D.; Obraczka, K.; Loik, M.E.; Childress, S.; Wong, D.G. Toward Sustainable Greenhouses Using Battery-Free LiFi-Enabled Internet of Things. IEEE Communications Magazine 2023, 61, 129–135. [Google Scholar] [CrossRef]
- Bua, C.; Adami, D.; Giordano, S. GymHydro: An Innovative Modular Small-Scale Smart Agriculture System for Hydroponic Greenhouses. Electronics 2024, 13. [Google Scholar] [CrossRef]
- Weather Station. https://www.meteoproject.it/davis-vantage-pro2.php. Accessed: 11/04/2024.
- Heltec WiFi LoRa V3. https://heltec.org/project/wifi-lora-32-v3/. Accessed: 11/04/2024.
- DHT11 datasheet. https://www.mouser.com/datasheet/2/758/DHT11-Technical-Data-Sheet-Translated-Version-1143054.pdf. Accessed: 11/04/2024.
- Siaw, F.L.; Thio, T.H.G.; Lau, W.H. Modeling and simulation of solar photovoltaic array with partial shading conditions for portable solar charger. In Proceedings of the AIP Conference Proceedings. AIP Publishing, Vol. 2847. 2023. [Google Scholar]
- Energy Harvesting module EH302. https://www.mouser.it/datasheet/2/8/EH300-1651600.pdf. Accessed: 11/04/2024.
- Li-Po Battery. https://www.amazon.it/EEMB-ricaricabile-Connettore-conferma-dispositivo-dellacquisto/dp/B09M5VV3MM?th=1. Accessed: 11/04/2024.
- Otii Arc Pro. https://www.qoitech.com/otii-arc-pro/. Accessed: 11/04/2024.
- Isen, F.W. , 2008; pp. 101–205. https://doi.org/10.1007/978-3-031-02529-7_3.DFT. In DSP for MATLAB and LabVIEW: Volume II: Discrete Frequency Transforms; Springer International Publishing: Cham, 2008; pp. 101–205. [Google Scholar] [CrossRef]
Figure 1.
Sampling Time Analysis.
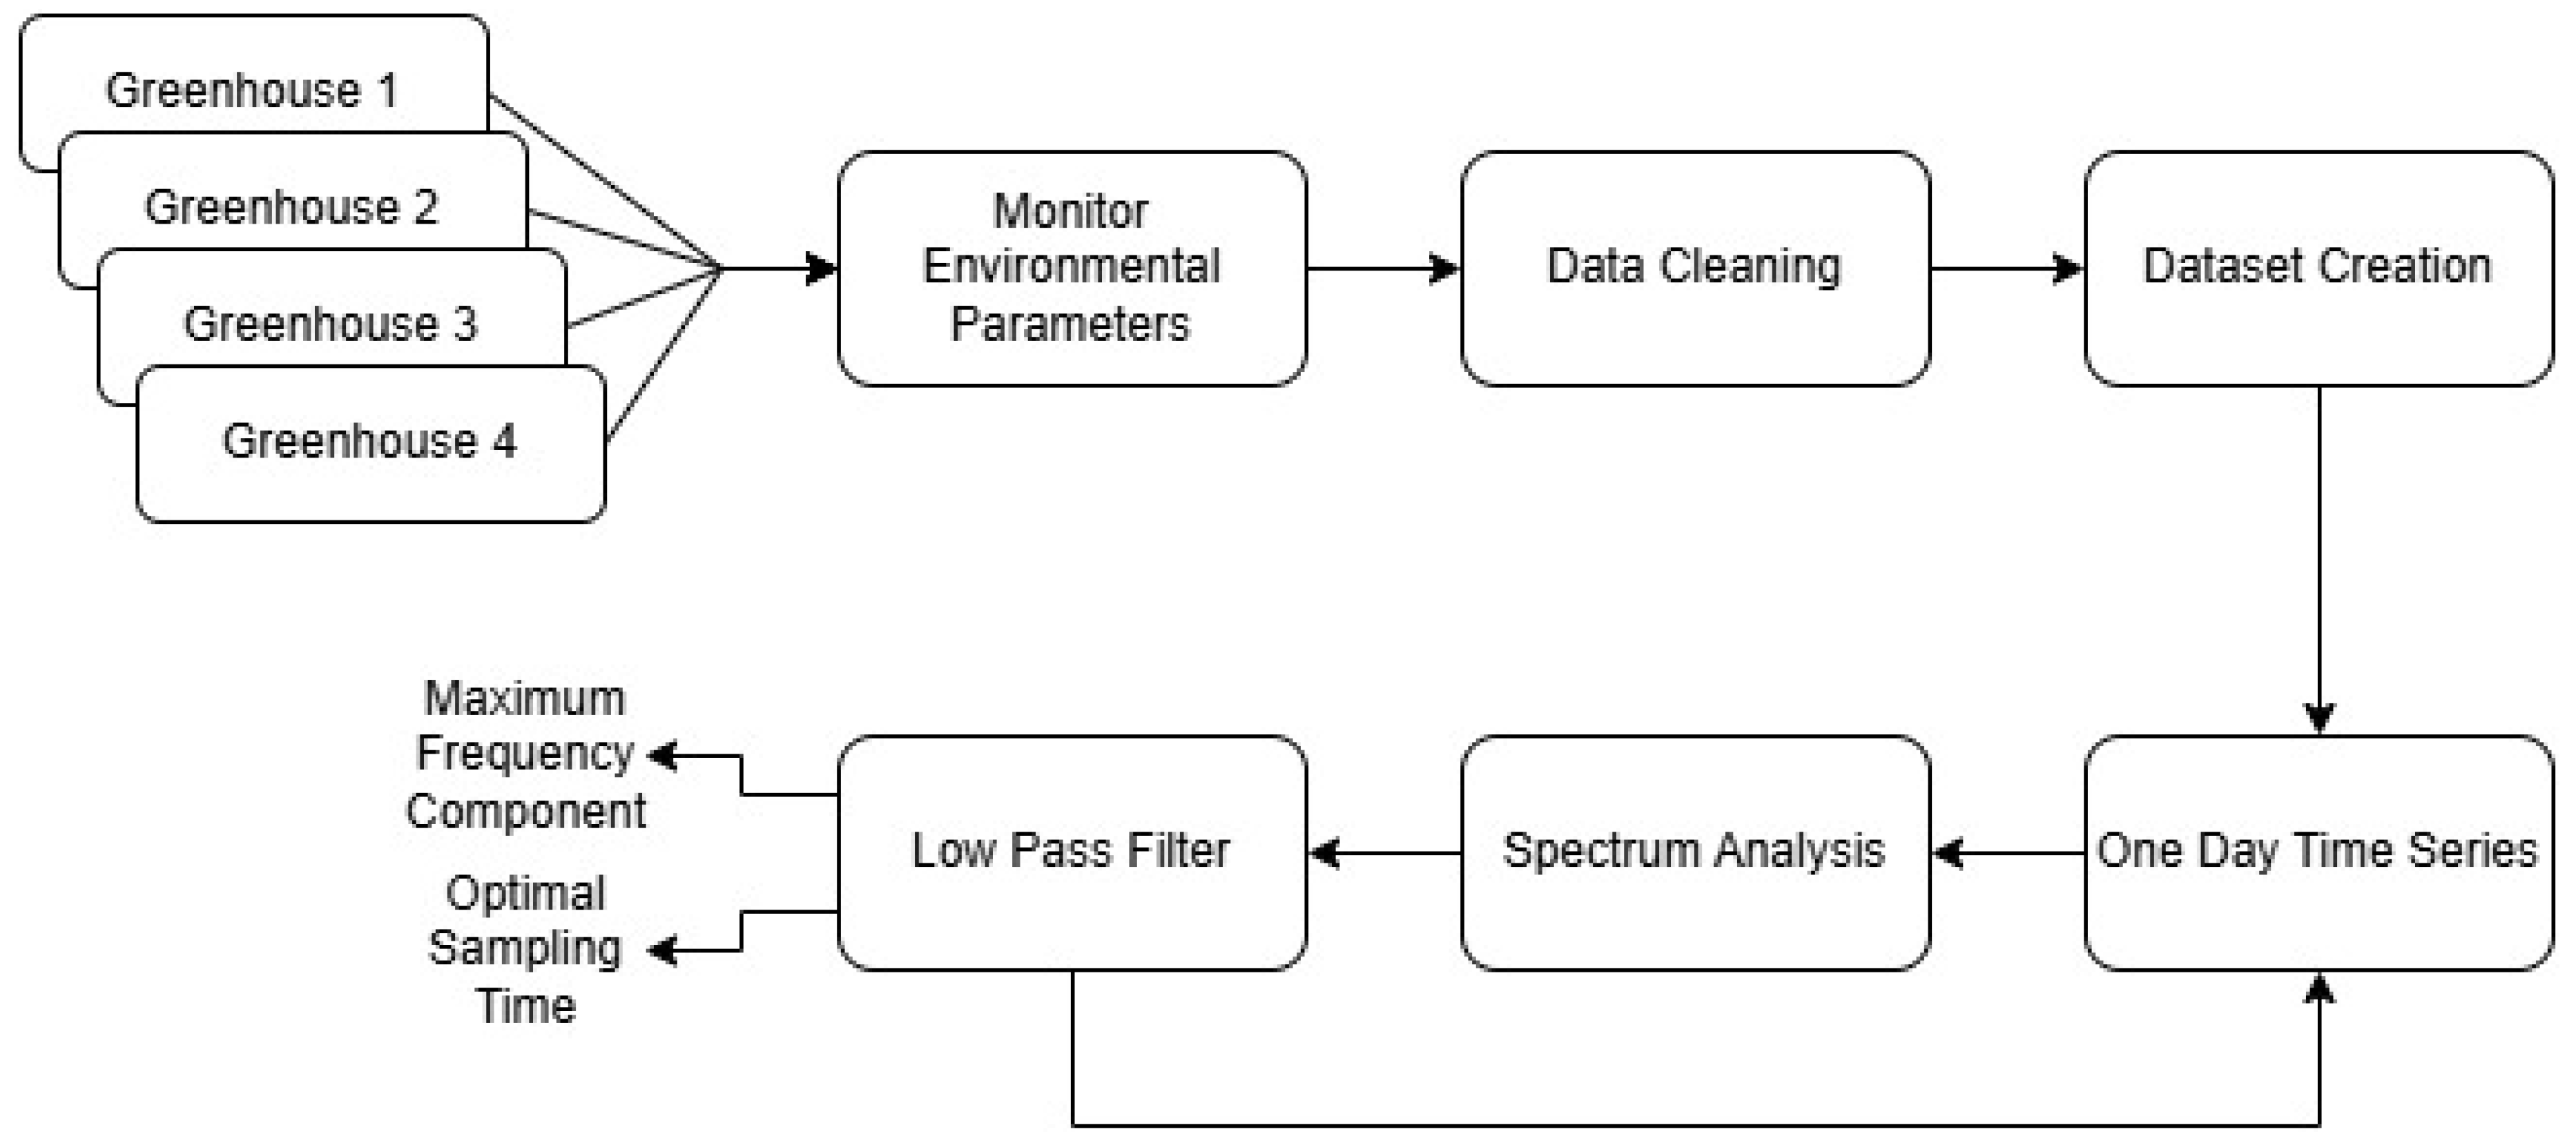
Figure 2.
Energy Consumption Analysis.
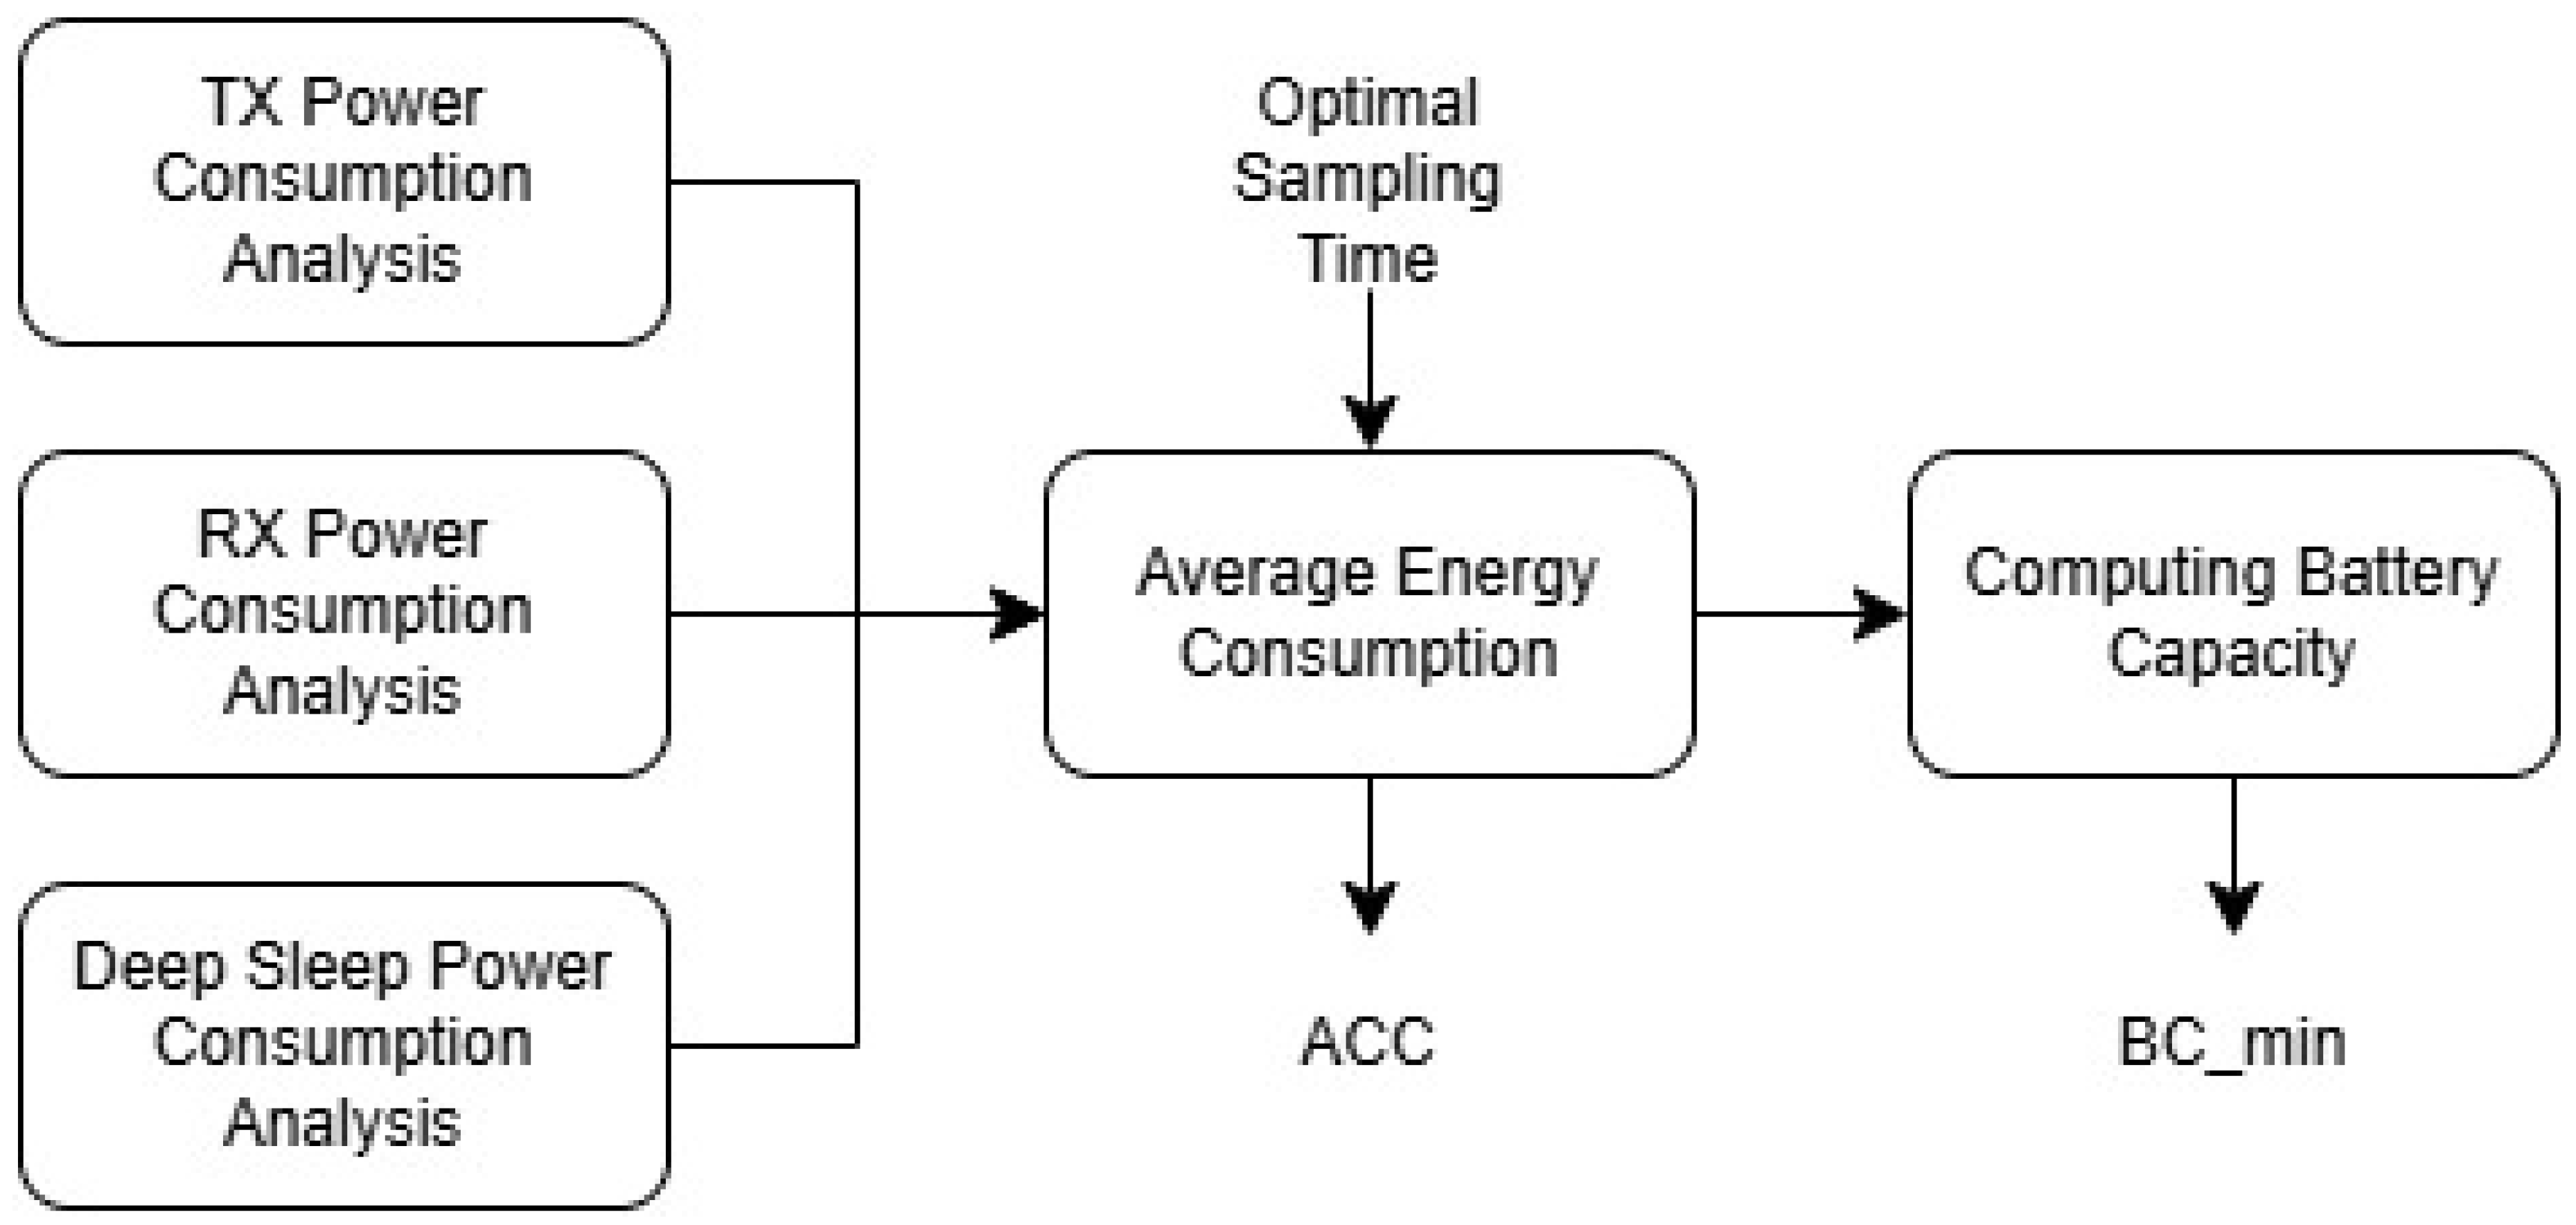
Figure 3.
Estimation dimensions of solar panel.
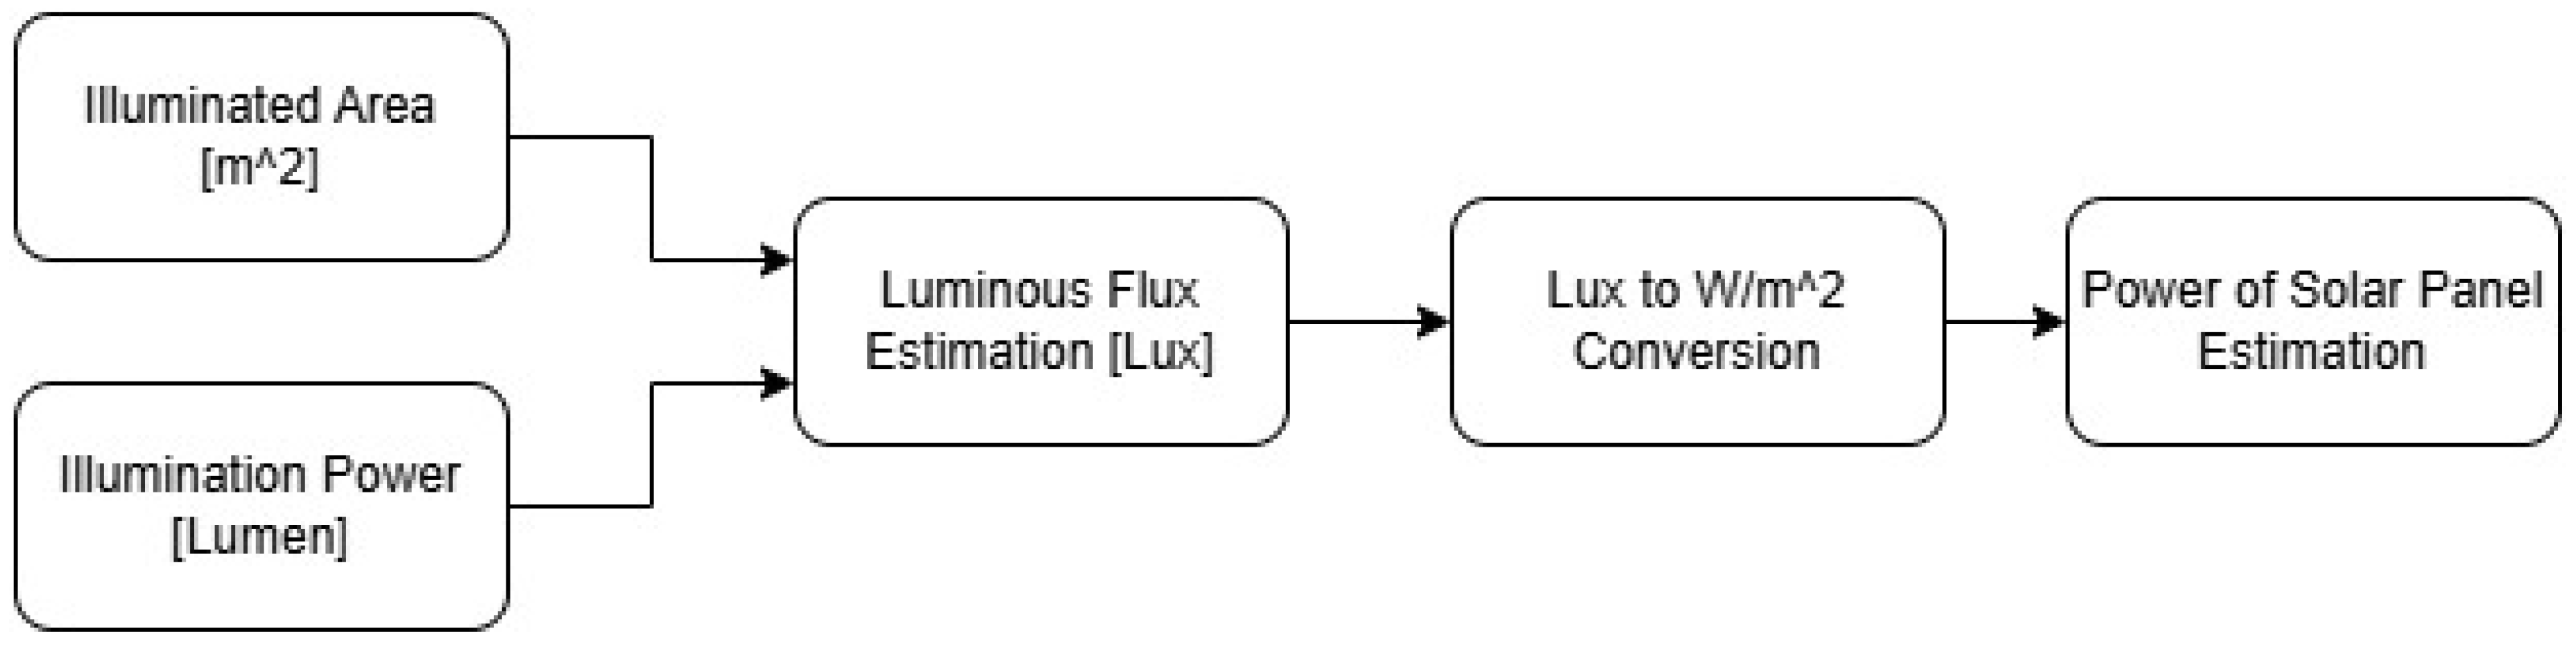
Figure 4.
TX Mode Current Consumption.
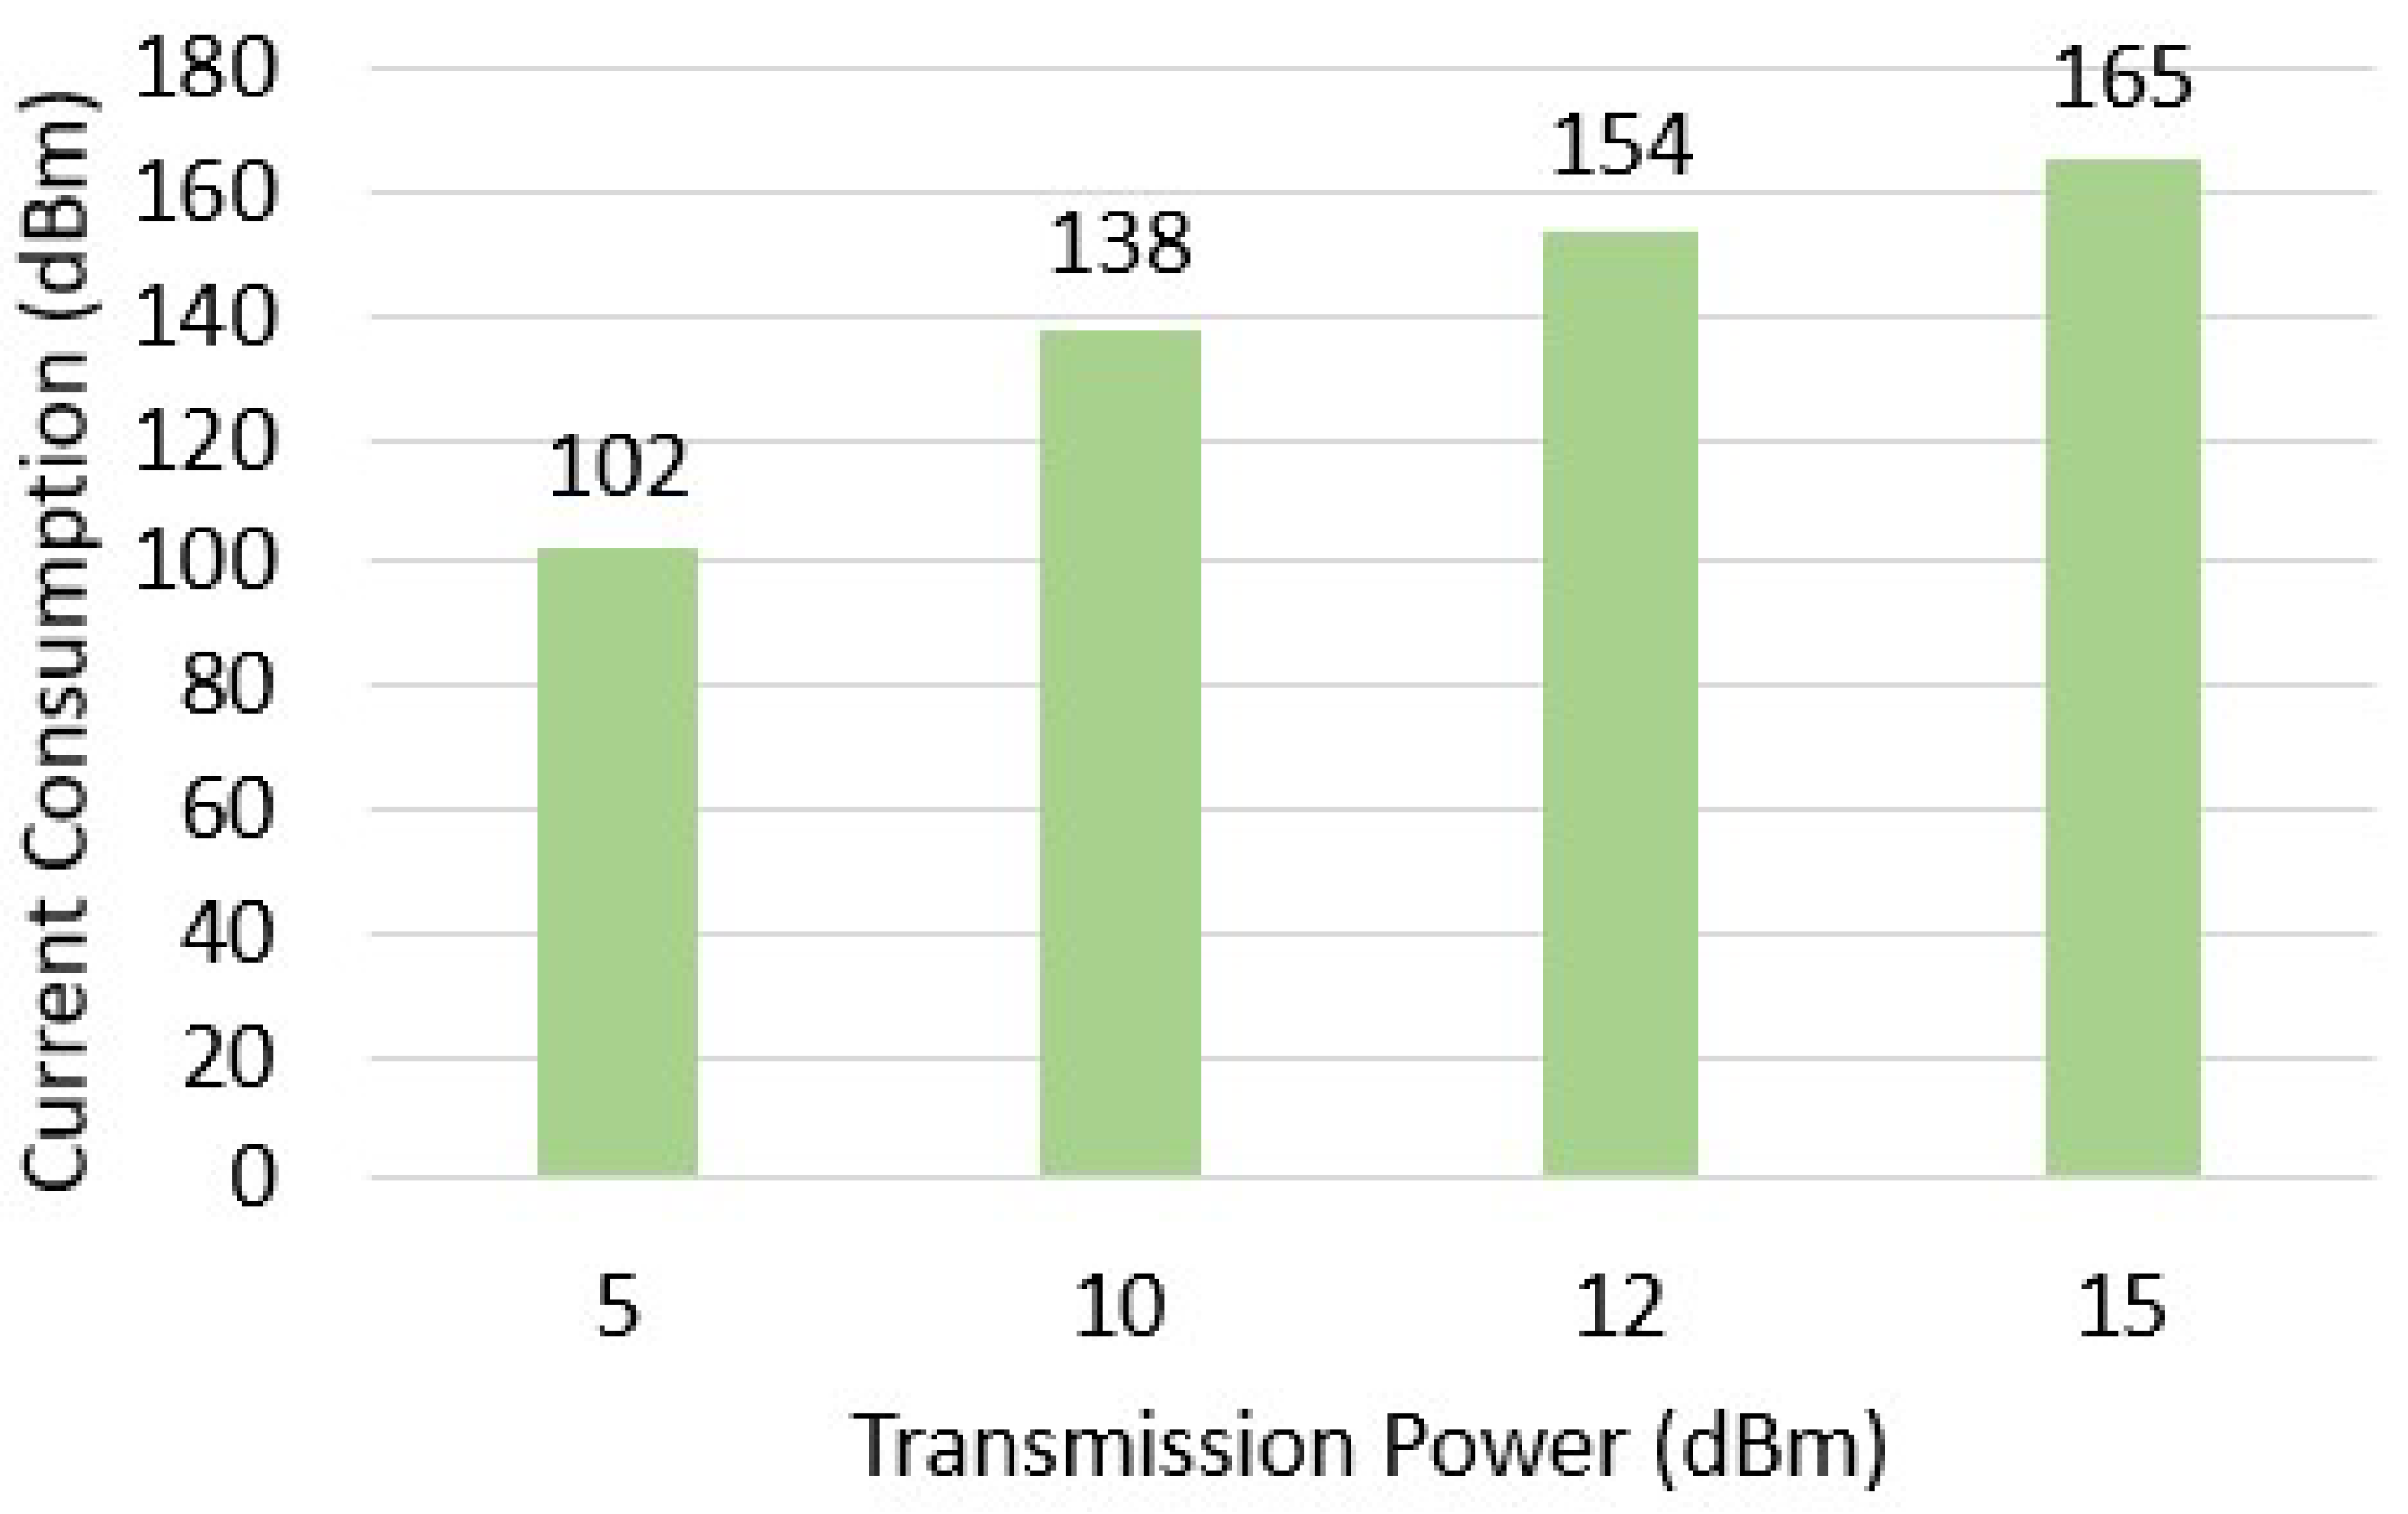
Figure 5.
MCU Current Consumption.
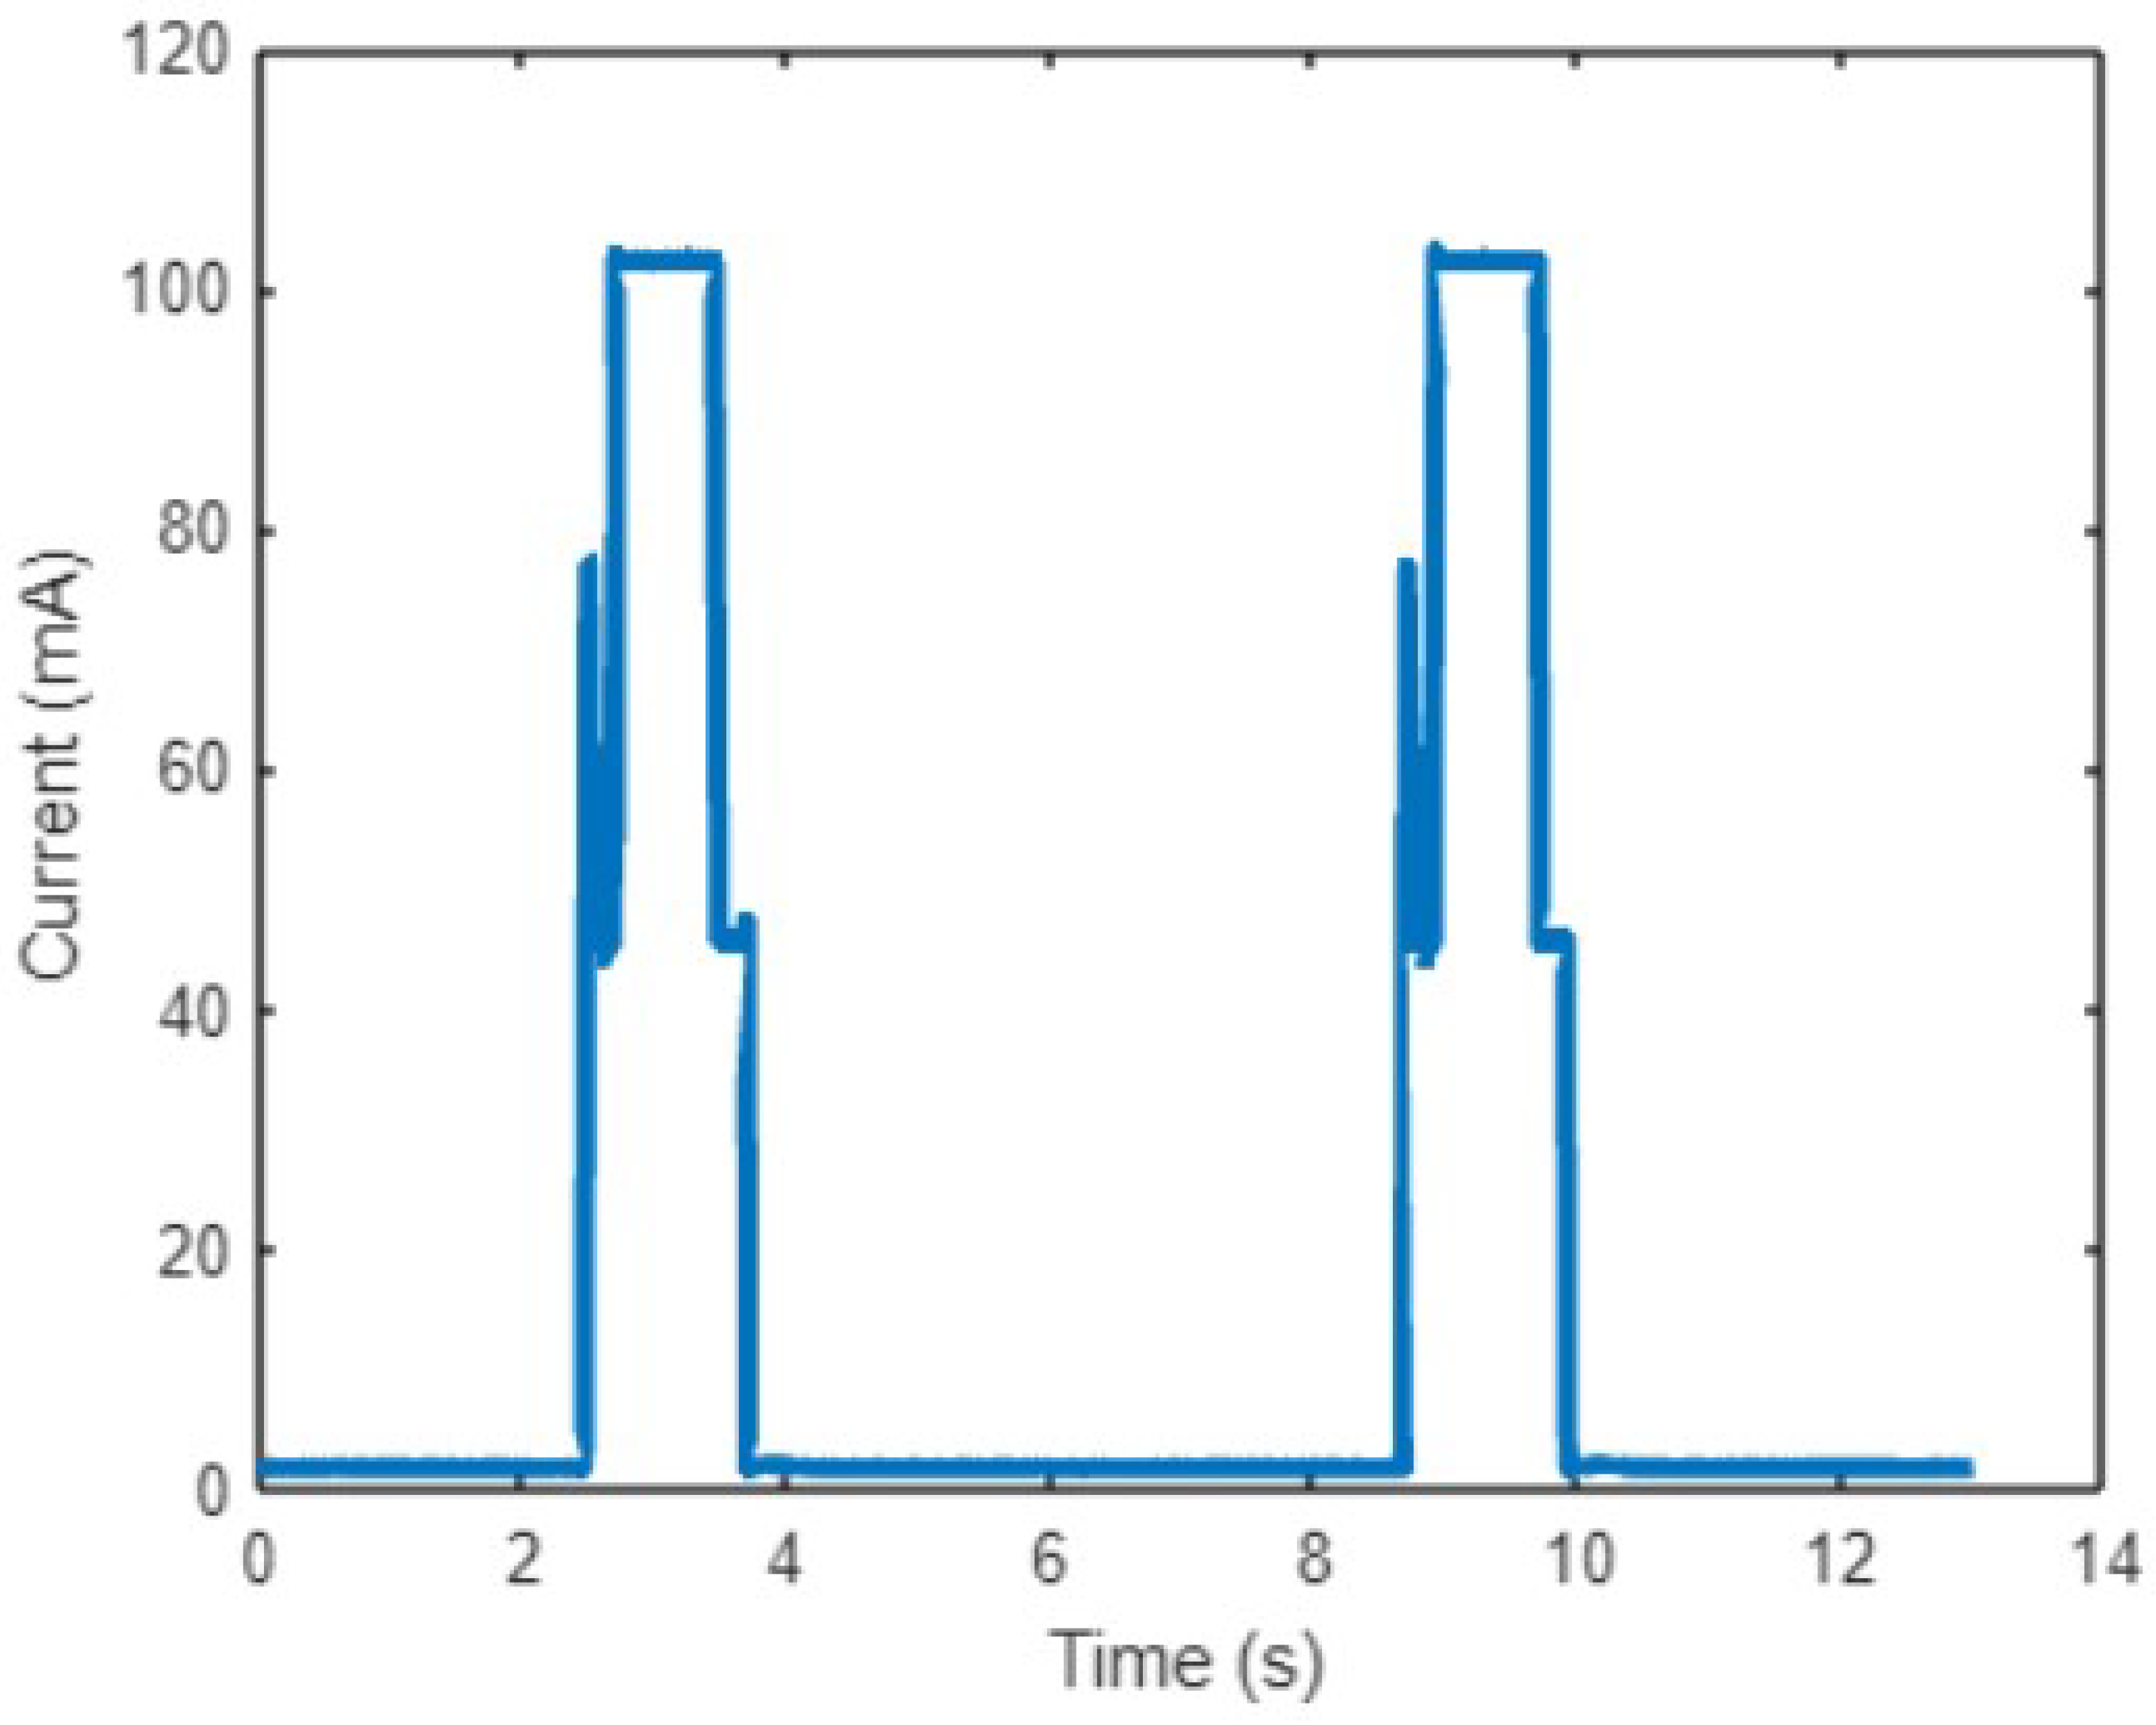

Table 1.
Common Monitoring System’s Sampling Interval.
| 2.5 sec | 16 sec | 16.5 sec | 5 min | 10 min | 15 min | |
|---|---|---|---|---|---|---|
| [8,9,10] | X | |||||
| [11] | X | |||||
| [12] | X | |||||
| [13,14] | X | |||||
| [15,16] | X | |||||
| [17] | X |
Table 2.
Annual Average Indices.
| [min] | MSE | RMSE | MAPE | |||||
| OutTemp | 36.17 | 0.03 | 0.14 | 0.71 | 0.10 | 0.48 | 0.09 | 0.15 |
| OutHum | 35.94 | 0.91 | 0.87 | 0.83 | 0.61 | 2.06 | 1.05 | 0.44 |
| InTemp1 | 43.44 | 0.14 | 0.23 | 0.46 | 0.54 | 1.07 | 0.04 | 0.23 |
| InHum1 | 42.24 | 0.76 | 0.55 | 0.58 | 1.39 | 2.63 | 0.40 | 0.13 |
| InTemp2 | 44.19 | 0.09 | 0.21 | 0.53 | 0.48 | 1.00 | 0.04 | 0.15 |
| InHum2 | 46.06 | 1.02 | 0.64 | 0.72 | 1.42 | 2.85 | 0.52 | 0.16 |
| InTemp3 | 41.75 | 0.05 | 0.15 | 0.32 | 0.47 | 0.89 | 0.03 | 0.10 |
| InHum3 | 45.31 | 0.67 | 0.57 | 0.64 | 1.29 | 2.56 | 0.34 | 0.17 |
| InTemp4 | 48.42 | 0.09 | 0.18 | 0.44 | 0.44 | 0.95 | 0.03 | 0.21 |
| InHum4 | 44.25 | 1.32 | 0.79 | 0.65 | 1.58 | 2.65 | 0.64 | 0.16 |
Table 3.
Winter Average Indices.
| [min] | MSE | RMSE | MAPE | |||||
| OutTemp | 30.53 | 0.02 | 0.12 | 1.25 | 0.10 | 0.37 | 0.09 | 0.11 |
| OutHum | 38.27 | 0.73 | 0.79 | 0.77 | 0.56 | 1.85 | 0.76 | 0.49 |
| InTemp1 | 42.96 | 0.21 | 0.20 | 0.67 | 0.47 | 0.86 | 0.05 | 0.25 |
| InHum1 | 41.57 | 0.81 | 0.51 | 0.45 | 1.23 | 2.18 | 0.47 | 0.12 |
| InTemp2 | 37.62 | 0.05 | 0.14 | 0.76 | 0.35 | 0.55 | 0.04 | 0.18 |
| InHum2 | 43.35 | 0.67 | 0.56 | 0.38 | 1.30 | 2.16 | 0.51 | 0.12 |
| InTemp3 | 41.01 | 0.03 | 0.12 | 0.36 | 0.36 | 0.68 | 0.04 | 0.10 |
| InHum3 | 44.77 | 0.23 | 0.35 | 0.39 | 0.82 | 1.55 | 0.28 | 0.15 |
| InTemp4 | 41.96 | 0.14 | 0.15 | 0.60 | 0.51 | 0.90 | 0.02 | 0.24 |
| InHum4 | 41.98 | 0.57 | 0.40 | 0.33 | 1.27 | 2.19 | 0.39 | 0.08 |
Table 4.
Spring Average Indices.
| [min] | MSE | RMSE | MAPE | |||||
| OutTemp | 32.59 | 0.03 | 0.13 | 0.62 | 0.10 | 0.41 | 0.06 | 0.13 |
| OutHum | 34.22 | 0.98 | 0.89 | 0.88 | 0.65 | 2.06 | 0.97 | 0.43 |
| InTemp1 | 41.96 | 0.16 | 0.28 | 0.47 | 0.65 | 1.21 | 0.02 | 0.22 |
| InHum1 | 39.77 | 0.93 | 0.54 | 0.67 | 1.61 | 2.87 | 0.22 | 0.13 |
| InTemp2 | 42.80 | 0.12 | 0.23 | 0.49 | 0.58 | 1.09 | 0.04 | 0.14 |
| InHum2 | 47.19 | 1.88 | 0.84 | 1.11 | 1.70 | 3.45 | 0.63 | 0.21 |
| InTemp3 | 38.51 | 0.08 | 0.18 | 0.35 | 0.59 | 1.01 | 0.05 | 0.12 |
| InHum3 | 40.92 | 0.92 | 0.66 | 0.79 | 1.58 | 2.88 | 0.31 | 0.16 |
| InTemp4 | 40.71 | 0.07 | 0.18 | 0.32 | 0.52 | 0.94 | 0.02 | 0.20 |
| InHum4 | 40.89 | 2.00 | 0.96 | 0.82 | 1.99 | 3.00 | 0.65 | 0.19 |
Table 5.
Summer Average Indices.
| [min] | MSE | RMSE | MAPE | |||||
| OutTemp | 41.95 | 0.04 | 0.17 | 0.46 | 0.11 | 0.59 | 0.11 | 0.20 |
| OutHum | 35.88 | 1.12 | 0.99 | 0.96 | 0.67 | 2.30 | 1.35 | 0.40 |
| InTemp1 | 48.16 | 0.14 | 0.29 | 0.42 | 0.61 | 1.34 | 0.04 | 0.23 |
| InHum1 | 41.97 | 0.81 | 0.61 | 0.70 | 1.52 | 2.89 | 0.42 | 0.14 |
| InTemp2 | 48.89 | 0.13 | 0.27 | 0.40 | 0.57 | 1.33 | 0.04 | 0.17 |
| InHum2 | 45.96 | 0.89 | 0.61 | 0.81 | 1.47 | 3.12 | 0.37 | 0.21 |
| InTemp3 | 44.56 | 0.05 | 0.16 | 0.26 | 0.48 | 0.99 | 0.02 | 0.10 |
| InHum3 | 48.30 | 0.86 | 0.66 | 0.75 | 1.42 | 3.09 | 0.30 | 0.20 |
| InTemp4 | 59.51 | 0.07 | 0.22 | 0.42 | 0.36 | 1.06 | 0.04 | 0.21 |
| InHum4 | 47.83 | 1.56 | 0.99 | 0.83 | 1.62 | 2.84 | 0.85 | 0.20 |
Table 6.
Autumn Average Indices.
| [min] | MSE | RMSE | MAPE | |||||
| OutTemp | 38.82 | 0.03 | 0.15 | 0.48 | 0.09 | 0.52 | 0.10 | 0.16 |
| OutHum | 35.79 | 0.74 | 0.80 | 0.70 | 0.53 | 1.97 | 1.08 | 0.44 |
| InTemp1 | 39.27 | 0.03 | 0.12 | 0.23 | 0.38 | 0.73 | 0.03 | 0.21 |
| InHum1 | 46.90 | 0.39 | 0.50 | 0.41 | 1.11 | 2.43 | 0.54 | 0.15 |
| InTemp2 | 47.02 | 0.05 | 0.16 | 0.33 | 0.38 | 0.90 | 0.02 | 0.10 |
| InHum2 | 47.73 | 0.43 | 0.50 | 0.43 | 1.12 | 2.44 | 0.62 | 0.05 |
| InTemp3 | 43.92 | 0.03 | 0.13 | 0.29 | 0.38 | 0.79 | 0.02 | 0.10 |
| InHum3 | 49.26 | 0.54 | 0.61 | 0.49 | 1.24 | 2.50 | 0.59 | 0.19 |
| InTemp4 | 52.53 | 0.11 | 0.17 | 0.47 | 0.31 | 0.78 | 0.03 | 0.13 |
| InHum4 | 48.01 | 0.62 | 0.63 | 0.45 | 1.08 | 2.28 | 0.61 | 0.12 |
Table 7.
LoRa Message Transmission Time in Seconds.
| 0.429 | 0.686 | 1.170 | 2.257 | 4.714 | 8.286 | |
| 0.221 | 0.354 | 0.603 | 1.163 | 2.430 | 4.271 | |
| 0.101 | 0.161 | 0.275 | 0.530 | 1.107 | 1.945 |
Table 8.
Percentual Energy Reduction.
| OutTemp | 2.3709 | 14.2256 | 3.1613 | 61.3714 |
| OutHum | 2.3749 | 14.2492 | 3.1665 | 61.3072 |
| InTemp1 | 2.2674 | 13.6041 | 3.0231 | 63.059 |
| InHum1 | 2.2819 | 13.6917 | 3.0426 | 62.8212 |
| InTemp2 | 2.2586 | 13.5513 | 3.0114 | 63.2025 |
| InHum2 | 2.238 | 13.4282 | 2.984 | 63.5367 |
| InTemp3 | 2.2882 | 13.7293 | 3.051 | 62.7191 |
| InHum3 | 2.246 | 13.4763 | 2.9947 | 63.4062 |
| InTemp4 | 2.2143 | 13.2859 | 2.9524 | 63.923 |
| InHum4 | 2.2579 | 13.5476 | 3.0106 | 63.2126 |
Table 9.
Outdoor air temperature Annual vs Seasonal sampling times.
| Annual | 0.02870 | 0.14280 | 0.70890 | 0.08920 | 0.14970 |
| Seasonal | 0.02845 | 0.14170 | 0.70318 | 0.08912 | 0.14785 |
| Percentual Reduction | 0.87108 | 0.77031 | 0.80759 | 0.08969 | 1.23580 |
Table 10.
Outdoor air humidity Annual vs Seasonal sampling times.
| Annual | 0.90670 | 0.87440 | 0.83390 | 1.05230 | 0.43600 |
| Seasonal | 0.89165 | 0.86723 | 0.82558 | 1.03833 | 0.43580 |
| Percentual Reduction | 1.65987 | 0.82056 | 0.99832 | 1.32804 | 0.04587 |
Table 11.
Indoor air temperature Annual vs Seasonal sampling times.
| Annual | 0.09418 | 0.19328 | 0.43670 | 0.03375 | 0.17118 |
| Seasonal | 0.09191 | 0.18726 | 0.42751 | 0.03314 | 0.16770 |
| Percentual Reduction | 2.40908 | 3.11085 | 2.10385 | 1.79630 | 2.03009 |
Table 12.
Indoor air humidity Annual vs Seasonal sampling times.
| Annual | 0.94530 | 0.63698 | 0.64580 | 0.47533 | 0.15600 |
| Seasonal | 0.88167 | 0.62096 | 0.61270 | 0.47511 | 0.15158 |
| Percentual Reduction | 6.73133 | 2.51383 | 5.12543 | 0.04481 | 2.83654 |
Disclaimer/Publisher’s Note: The statements, opinions and data contained in all publications are solely those of the individual author(s) and contributor(s) and not of MDPI and/or the editor(s). MDPI and/or the editor(s) disclaim responsibility for any injury to people or property resulting from any ideas, methods, instructions or products referred to in the content. |
© 2025 by the authors. Licensee MDPI, Basel, Switzerland. This article is an open access article distributed under the terms and conditions of the Creative Commons Attribution (CC BY) license (http://creativecommons.org/licenses/by/4.0/).
Copyright: This open access article is published under a Creative Commons CC BY 4.0 license, which permit the free download, distribution, and reuse, provided that the author and preprint are cited in any reuse.


