Submitted:
20 February 2025
Posted:
21 February 2025
You are already at the latest version
Abstract
Two graphitized thermal soot (GTS6, GTS80) and graphitized soot with a deposited overlayer of organic carboxylic acid (GTS80 impregnated with 1,2,4-benzenetricarboxylic acid (4.88 % (w/w) 1,2,4 BTCA)) have been investigated in a flowing gas experiment under molecular flow conditions in a Knudsen cell reactor. As a comparison commercial soot T900 has a significantly larger coverage of surface functional groups (SFG’s) than both GTS6 and GTS80 probed by NO2, O3, NH2OH, CF3COOH, HCl and N(CH3)3. NO2 (weak oxidizer) and O3 (strong oxidizer) probe oxidizable (or reduced) SFG’s, NH2OH interacts with surface –OH groups whereas CF3COOH, HCl and N(CH3)3 probe basic and acidic SFG’s because of their acidic and basic properties, respectively. The interface of GTS6 and GTS80 still retains a significant coverage of reduced sites probed using O3 to the extent of approximately 10 % of a monolayer (ML) compared to 46 % for T900. Using N(CH3)3 as a probe gas we established that BTCA-doped GTS80 is highly acidic having a -COOH group coverage of 51.7 ± 10.5 % of a ML. The use of NH2OH as a probe gas leads to a substantial increase in uptake upon coating GTS80 with BTCA owing to the weakly basic character of the probe interacting with the acidic monolayer. Less than 10 % of all basic sites are strong on BTCA-doped GTS80. The corresponding initial uptake coefficients or uptake probability of most of probe gases on T900 are significantly larger than both GTS, in line with the trends in coverage after saturating adsorption. For NO2 and O3 the steady-state (ss), that is long-term uptake or loss, is observed indicating a chemical reaction as opposed to mere (reversible) adsorption. The corresponding rate constant is 5·10-3 s-1 for all samples except for GTS6 where it is smaller by a factor of 8 which corresponds to the slowest uptake.
Keywords:
Interface
; amorphous carbon
; reactivity
; heterogeneous reactions
; carbon reference materials
1. Introduction
Amorphous carbon is a material without long-range crystalline order. Short-range order exists, although with deviations of the inter-atomic distances and/or inter-bonding angles with respect to the graphite and diamond lattices. There are two crystalline forms of carbon, diamond and graphite, and a number of amorphous (non-crystalline) forms, such as charcoal, coke, carbon black and soot. Carbon nanotubes, graphenes and fullerenes are additional examples each having a specific structure on a nanometric scale. Soot is of atmospheric importance as it is emitted from fossil and non-fossil fuel combustion as a product of incomplete combustion. Most importantly, amorphous carbon occurs as an atmospheric aerosol that is strongly light-absorbing leading to a significant positive average climate forcing that makes it the most important absorbing and thus climate-warming aerosol despite its relatively short atmospheric lifetime in the troposphere of approximately 6 weeks [1,2,3]. In addition, amorphous carbon has found widespread use in industry as black pigment and as filler, for instance in the rubber industry, improving wear resistance and longevity of automotive vehicle tires.
Particulate matter in the atmosphere produced by incomplete combustion of fossil fuels and biomass play a significant role as a tracer for anthropogenic activity and natural fires. Its major species is soot or combustion aerosol that is a variable mixture of organic carbon (OC) and elemental carbon (EC). Within the concern of global climate change, health and environmental effects, the atmospheric community recognizes the importance of establishing inventories for sources and sinks of light absorbing carbon, namely black carbon (BC) mainly containing EC and OC [4,5].
The detailed pathways of soot formation from combustion of hydrocarbon fuels are still a matter of debate to this day [6]. Briefly, after ignition in a combustion engine most of the hydrogen content of the fuel and short-lived combustion intermediates is oxidized to H2O vapor and oxygen-containing intermediates leaving behind a carbon-rich fuel. From then on carbon starts to burn in the combustion chamber at a much slower rate compared to hydrogen oxidation. The remainder is emitted at the end of the engine cycle as soot and gas phase products such as CO2, CO, H2O, NOx and others into the atmosphere. Spatially and temporally resolved experiments on flame and chamber combustion yield mechanistic schemes of soot formation starting from the fuel hydrocarbon molecule to the fractal aggregates of combustion soot via Polycyclic Aromatic Hydrocarbon (PAH) formation of 200 to 900 Dalton and stack formation leading to primary soot particles [6]. Elemental analysis of soot typically yields a carbon content close to 95 (atom) % with a few % H, O, less N and S depending on the fuel to oxygen equivalence ratio. Soot composition is highly variable ranging from planar rather small semivolatile PAH’s to large or puckered sheets owing to incorporation of five and seven-membered rings into a large network of conjugated rings having aromatic character [7,8]. Freshly emitted BC particles generated from laboratory flames, ship, diesel truck engines and open flames of biomass burning [9,10] have a microstructure of agglomerates of graphene sheets arranged in a turbostratic manner with a majority of carbon atoms being linked by sp2 hybridized C-C bonds [7,8,11]. Marhaba et al. documented the successful production of combustion soot simulating aviation soot using a cold nitrogen-quenched propane diffusion flame in a CAST (Combustion Aerosol Standard) device [11]. The study was guided by the measurement strategy laid out in refs. [7,8] and relates to the introduction of emission controls on soot emitted in the lower stratosphere and upper troposphere by the civil aviation fleet [12].
A new and noteworthy development is the seminal work of Lieske et al. [13] in which he presents “portraits”, that is specific structural molecular data of an impressive array of combustion-generated PAH’s originating from a fuel-rich ethylene flame sampled into a chamber and deposited on a solid support consisting of a bilayer of NaCl on Cu (111) in order to obtain a molecular picture of “early soot formation”. Using AFM and STM imaging techniques led to the discovery of π free radicals that are stabilized by large-scale conjugation in planar and non-planar PAH structures and that provide structural information on “stable” free radicals on soot. These results provide a reliable structural base for the interpretation of EPR spectra of soot, wood smoke, cigarette smoke, tar, biomass burning smoke and other materials by Valavanidis and coworkers [14]. Impressive spin densities in the range 1015 to 1017 spins/cm3 have been observed by these workers that laid the ground for the structural elucidation of environmentally persistent free radicals (EPFR) and their role in atmospheric tropospheric chemistry.
Several studies have been performed to measure the interface properties of soot. In one example hexane soot was generated in a diffusion burner and the deposited soot was “soaked” in hexane to separate the OC from EC fraction [15]. The unexpected reactivity of the EC fraction begs the question as to past efforts to understand the reactivity of combustion aerosol or combustion soot. Most of this work has been performed in solution either by potentiometric methods measuring the pH in aqueous solution or by other methods in the condensed phase. We emphasize the work of Donnet et al. [16,17] and Boehm et al. over the years [18,19,20]. Regarding the latter group we have focused on confirming or infirming the presence of pyrones as weak bases in soot [21].
We have been inspired by these workers and applied this approach to the study of the gas-solid or gas-condensed phase interface using multiphase or heterogeneous chemistry by eliminating the presence of the solvent [22,23]. This, on the one hand, simplifies the reaction system, but on the other hand eliminates possibilities by focusing exclusively on fast reactions as our chosen method precludes the study of slow reactions. The choice of the substrates was guided by the question of the molecular composition of the interface of a Standard Reference Material (SRM) in terms of surface functional groups. Chemical aging reactions under an oxidizing atmosphere owing to environmental exposure of a reduced substrate are of general interest in relation to slow oxidizing reactions that most often start at the molecular gas-condensed interface.
Popovicheva et al. have spent quite some effort at characterizing SRM materials in view of simplifying and/or modifying certification of these materials deemed unstable over time towards oxidation [24,25,26]. The research question posed was to investigate the molecular composition of the interface of virgin material and explore the possibilities of interfacial reaction starting at the surface functional groups. At the end of the discussion we will quantitatively compare the coverages with two other cases centered on (inert) silica gel [27,28] and potentially reactive anthrarobin (1,2,10 - trihydroxyanthracene) that is a potent reducing compound and therefore unstable on atmospheric exposure. We thus clearly define two specific goals of this study, namely, (a) measure the molecular composition of the gas-solid interface in terms of the abundance of surface-functional groups for a potential Standard Reference soot Material (graphitized soot, GTS) in comparison to a typical commercial amorphous carbon sample (T900); (b) examine the interface of a tailor-made functionalized material based on GTS as a carrier in terms of the abundance of newly introduced surface functional groups.
The aim of the present study is directed towards molecular characterization of the interface of (a) two high-temperature processed amorphous (graphitized) carbon materials in view of their application as reference materials for atmospheric studies, and (b) of a custom-made material using a coating of an aromatic carboxylic acid on graphitized carbon as carrier or substrate material. A Knudsen Flow reactor (KFR) is used where a reactive probe gas reacts with functional groups of the substrate interface akin to a titration reaction in order to interrogate the chemical composition of the interface and recording its losses in the presence of a chosen substrate. The interface encompasses one or at most two molecular monolayers that are accessible by the probe gas on a short time scale given by the choice of the gas residence time of the molecular probes. This molecular penetration depth corresponds to the true interface in contrast to “surface sensitive” mid-IR spectroscopic methods whose penetration depth corresponds to approximately 2 μm at 1000 cm-1 corresponding to 100 to 200 monolayers [29]. We have successfully used this method for some time [22,23] and examples of past work using the KFR titration method include substrates of amorphous carbon and soot [21,30,31,32], volcanic ash and glass [33], polymeric materials such as plastics [34,35] and asphalt samples from urban road pavements [36].
2. Methods
2.1. Graphitized Soot
The starting carbon material, referred to herein as EC Reference Material (ECRM), is graphitized soot [26]. The randomly ordered microstructure of technical carbon undergoes “graphitization” (or pyrolysis) at temperatures of 3000° C in an oxygen-free atmosphere [37] and the amorphous carbon microstructure changes to crystallites of graphite platelets. Simultaneously, at this temperature, soot loses any inorganic or organic coverage, volatile oxygen-containing groups or mineral contaminations (ash). In order to obtain a reference material for black carbon, the graphitized soot GTS6 and GTS80 were produced by heating to 3000 °C under N2 the commercial products “thermal soot” T10 and T100 sold by Electrougly Ltd. and Uchta OPP with reported surface areas of 10 and 98 m2/g, respectively [24]. After anaerobic heat treatment, hence graphitization, the measured BET surfaces decreased to 5.6 ± 0.3 and 79 ± 2 m2/g, respectively. High resolution SEM imaging results for thermal soot T10 and graphitized soot GTS6 show a morphological transition from spherical to irregular polygons which led us to believe in the formation of a graphitic microstructure, albeit somewhat perturbed [24]. X-Ray diffraction results would be required to lift any uncertainty on the crystal structure, for instance using the Debye-Scherrer technique for polycrystalline powders. In any case, graphitization of both thermal soot leads to a small decrease of the measured BET surface area. Water absorption studies on GTS6 and GTS80 showed the hydrophobic character of their surface [25,26]. For comparison, thermal soot T900 having the usual amorphous carbon microstructure was purchased from ADL-NRG GmbH (Austria) (product called T900 Gas Thermal Carbon Black) with a reported and measured BET surface of 12-16 (manufacturer information) and 6.5 ± 0.3 m2/g, respectively. The main classes of non-polar organics that have been identified in diesel and aviation soot are alkanes and polycyclic hydrocarbons (PAH’s) as well as aromatic and aliphatic acids [26]. In our work a representative organic compound was selected as 1,2,4-benzenetricarboxylic acid (1,2,4 BTCA). The impregnation of GTS80 with 1,2,4 BTCA involved the dissolution of BTCA in acetone or ethanol and treatment of a soot sample under reflux conditions with follow-up drying at moderate temperature [24]. The weight fraction of 4.88 % (w/w) with respect to GTS80 mass led to sizable coverage detailed below.
2.2. Knudsen Flow Reactor
We use a flowing gas experiment whose probe gas molecules “interrogate” the molecular interface of a bulk material placed inside a sample compartment through heterogeneous, i.e., gas-surface, interaction. The experimental method has been thoroughly presented in several recent publications including a recent review down to its gory details such that we forego a detailed presentation at this point [21,38,39]. Briefly, a two-chamber flow reactor is exposed to a flow of reactive probe gas molecules such as N(CH3)3 (TMA or trimethylamine), CF3COOH (TFA, trifluoroacetic acid), HCl, NO2, O3, NH2OH (HA or hydroxylamine), H2O and more, in order to heterogeneously interact with a condensed phase (low-vapor pressure liquid or solid) substrate of interest at a chosen reactor residence time under molecular flow conditions. Under these low pressures in the range of 10-5 to 10-2 mbar the molecules undergo gas-surface rather than gas-gas collisions thus greatly favoring the interaction with specific surface sites on the substrate.
As an illustration we cite TMA for the interaction with interfacial acidic functional groups resulting in the formation of a trifluoroacetate salt or HA for the measurement of the number of interfacial or surface –OH groups by forming a (bidentate) stable five-membered ring adduct through hydrogen bonding. To be on the safe side we reload a new substrate sample for each new probe gas in order to avoid ambiguities. The total loss of probe gas molecules is established once the uptake of the probe gas is saturated after a while owing to the finite number of reactive surface sites of the substrate such that gas uptake comes to a halt. We use a thermal molecular beam sampling technique using a differentially-pumped quadrupole mass spectrometer operated in electron-impact ionization mode in order to image the loss rate of probe molecules inside the Teflon-coated KFR irrespective of probe gas losses in the vacuum chambers. The quadrupole mass filter is ideally suited to continuously follow the progress of the intensity of the molecular beam of the probe gas molecules in the presence of a reactive substrate as the recorded ion-current is imaging the continuous loss rate of the probe gas inside the KFR. We therefore emphasize that we directly measure rates and not concentrations. The molecular beam leaving the KFR is mechanically chopped using a rotating wheel, and the chopped ion current signal is recorded using a lock-in amplifier whose rectified output is fed into a computer-based acquisition program. The dimensions and characteristic kinetic constants of the KFR are given in Table S1. In the present work we exclusively work with the smallest orifice (1 mm nominal diameter, see Table S1) as we are interested in the limiting uptake of probe gases at saturation.
We have recently used ten different probe gases in order to characterize different interfacial group functionalities on an amorphous carbon material [21]. The focus was placed on the reactivity of acidic, basic, reduced, oxidized, polar-non-polar as well as interfacial sites possibly interacting with Sulfur-containing probe gases (H2S, SO2 and C4H4S, thiophene) of an amorphous carbon or soot. However, by using two acids or two oxidizers of different strength we are able to bracket the basicity or the reducing power of the surface sites in terms of a weak or strong base or reducing functionality. As an example we will compare the strong and weak oxidizer O3 vs. NO2: the strong oxidizer O3 will reduce ALL reducing sites, weak and strong, whereas the weak oxidizer NO2 will only react with the strong reducing agent thus affording the possibility to compare the abundance of the sum of weak and strong reducing sites in a qualitative fashion. The same goes for the detection of weak and strong bases using the strong acid CF3COOH vs. the weak acid HCl (gas phase!). Here the attention of the reader is directed to the fact that HCl is a weak acid in the gas phase in contrast to TFA owing to the negative charge delocalization in the anion of the latter. The solid amorphous carbon samples were spread out in a 10.6 cm2 sample cup made of Pyrex glass and placed in the Teflon-coated sample compartment (SC).
In order to express the experimental titration results of absolute uptake of probe gas molecules (molecule/g) on a transferable basis we use the knowledge on the geometrical surface area per molecule as a normalization factor to obtain relative coverage (molecule/cm2 of surface) of the probe gas on the substrate of interest. As a consistent estimate we use the following expression for coverage in molecule/cm2 : (ρ NA/MW)2/3 with ρ, NA, MW being the mass density (g/cm3), Avogadro’s number (6.0236 1023 molecule/mole) and formal molar mass in g/molecule, respectively. This formula represents an upper limit to the coverage (molecule/cm2) and is based on experimental mass densities and stable crystal structures for the pure crystalline state or measured liquid densities. It has the advantage of easy applicability and convenience where specific surface area measurements have not been performed. In the worst case the discrepancy is just below a factor of two thus representing an upper limiting value when applying the above estimation formalism.
The above approximation for 1,2,4 BTCA with ρ = 1.7 g/cm3 (upper limit: estimated value taken from https://www.chemspider.com) leads to 2.88 1014 molecule/cm2 or to 34.8 Å2 per molecule. This has to be compared with a measurement based on the retention volume of a gas-chromatographic measurement of 65 Å2 corresponding to a surface coverage of 1.54 1014 molecule/cm2 , a discrepancy of a factor of 1.9. A 4.88 % (w/w) of 1,2,4 BTCA on GTS80 therefore leads to a surface coverage of 1.77 1014 molecule/cm2 assuming quantitative adsorption of BTCA that has to be compared to experimental titration results presented below. Another example would be the adsorption of the conjugated aromatic hydrocarbon pyrene of similar molecular weight (202 for pyrene vs. 210 g/molecule for 1,2,4 BTCA). The density-based evaluation of pyrene with ρ = 1.27 g/cm3 results in a coverage of 2.43 1014 molecule/cm2 (41.2 Å2 per molecule) whereas the GC-based measurement of 0.54 mg/m2 corresponding to the minimum in the retention volume for 4 different probe gases resulted in a coverage of 1.55 1014 (64.6 Å2 per molecule), smaller by a factor of 1.6 owing to a larger geometric size [24,26]. The discrepancy of just below a factor of two between the two ways to establish the space requirement of adsorbates reflects the closer packing of molecules in the pure crystalline or condensed phase compared to adsorption measurements on substrates that are controlled by surface structures imposing an added constraint on spatial arrangement of adsorbates. We therefore regard the density-based evaluation of the absolute monolayer coverage in terms of molecules/cm2 as an upper limiting value compared to numerical values derived from BET- or GC-based retention volume measurements that are up to a factor of two lower than the above estimation.
3. Results
The summary Table 1 exhibits the absolute coverage (molecule/cm2) and the fractional monolayer coverage in the upper and lower lines of the data fields, respectively, for the six used probe gases, namely, TMA, HA, HCl, TFA, NO2 and O3 in columns 2 to 5. Except for column 5 (sample 4) the absolute monolayer coverage for the probe gases on the three substrates GTS6 (sample 1), GTS80 (sample 3) and T900 (sample 2) is that for the tightest packing of the adsorbed probe gas. For sample 4 the absolute number of acidic sites presented by adsorbed 1,2,4 BTCA is given by the coverage of the adsorbed acid after having saturated the substrate using a 4.88 % (w/w) solution of BTCA in acetone or ethanol under the assumption that all dissolved BTCA had been adsorbed to GTS80. It turns out that the acidic sites at the used BTCA concentration of the impregnating solution corresponds to a coverage of 1.77 1014 molecule/cm2 that is equivalent to 62 % of monolayer coverage of 2.87 1014 molecule/cm2. However, the coverage of 1.77 1014 molecule/cm2 represents the maximum we may expect for the used dose of BTCA. Except for sample 4 we chose to express the probe gas coverages in terms of fractional monolayers of adsorbed probe gas on the substrate rather than based on the space requirements of individual carbon and oxygen atoms of the amorphous carbon substrate in the absence of detailed structural details of the adsorbates adhering to the amorphous carbon substrates. As an example we take GTS6 resulting in a space requirement of 4.80 Å2 per carbon atom using a mass density of 1.9 g/cm3 (amorphous carbon) which leads to an absolute coverage of 2.1 1015 carbon sites/cm2. Identical results are obtained for GTS80 and T900 assuming the same above-listed mass density. Using the molecular weight of 1,2,4 BTCA of 210 g we arrive at a coverage of 2.87 1014 molecule/cm2, equivalent to 34.8 Å2 per molecule. If we now “synthesize” the space requirement for BTCA (C9O6H6) by ignoring the presence of H and equaling the space requirement for carbon and oxygen atoms we arrive at 15 x 4.8 = 72 Å2 which is too large by a factor of two. This goes to show that one will have to point out where the numbers come from and how these are interrelated.
Figure 1 displays the time-dependent lock-in amplifier MS signal at m/e 33 amu of hydroxylamine (NH2OH) interacting with GTS6 amorphous carbon (experiment s70#1 in Table S2). The red and green horizontal bars displayed on top of the lock-in MS signal indicate the “closed” and “open” positions of the plunger, respectively, that isolates the sample compartment (SC) from the plenum of the KFR. The green horizontal bar between 7’000 (1’750 s) and 9’000 (2’250s) pts indicates the first uptake of HA on 109.5 mg GTS6 (ESI supplement) after which the SC is closed according to the red horizontal bar. The fact that the MS signal remains unchanged upon closing the SC indicates that the HA uptake has come to a halt owing to saturation. The initial absolute uptake determined from the calibrated ordinate of Figure 1 using the measured flow rate of HA given in the legend of Figure 1 corresponds to an absolute HA uptake of 1.4 1013 molecules as indicated in Table 1 and Table S2.
The second opening of the SC at 11’000 pts. (2’750 s) reveals a small secondary uptake that we attribute to mass transport of HA adsorbed at the interface into the bulk phase of GTS6 and subsequent adsorption of additional probe gas to the liberated adsorption sites. Noteworthy are the two periods around 6’000 (1’500 s) and 13’000 pts. (3’250 s) marked by green vertical arrows during which the flow rate of HA was measured by interrupting the connection to the HA reservoir that stored solid HA at 0°C (ice bath). The absolute flow rate in molecule s-1 is routinely measured by observing the pressure decrease in the 50 cm3 inlet volume of the flow system. Owing to the small vapor pressure of HA of approximately 0.7 Torr at 0°C the decrease of the inlet pressure over the time required to measure the flow rate (5 to 8 measurements in a row) is apparently a sufficiently large perturbation to the inlet pressure to be observed on the MS signal level.
Figure 2 displays the lock-in MS signal of NO2 at mass 46 amu interacting with a thermal soot T900 sample of 38.1 mg spread out over the 10.6 cm2 sample cup housed in the SC (experiment S40#2 in Table S2, ESI section). The initial uptake of NO2 at 29’000 pts (7’250 s) saturates after 1000 pts. (250 s), however the steady-state MS signal level is smaller than the level with the SC closed (horizontal red bars on top). This indicates a small, albeit significant, steady-state uptake process of NO2 that is also observed in a more prominent manner with O3 as a probe gas (see below). The initial uptake of NO2 is measured by taking the small steady-state MS signal level into account and amounts to 2.5 1013 molecule (Table 1 and S2). The second uptake at 35’000 pts (8’750 s) displayed under a green horizontal bar (SC open) is much smaller than the initial uptake but shows a small steady-state uptake kinetics as well.
A look at Table S2 for probe gas NO2 reveals three virgin samples with duplicate or triplicate experiments thus offering the opportunity at evaluating the reproducibility of the gas uptake. We will consider experiments s10#2, s40#2, s30#3, s40#3, s603#, S20#4 and s50#4 leading to averages of (2.1 ± 0.19) 1013, (3.30 ± 1.13) 1012 and (11.0 ± 2.0) 1012 molecule, respectively, that leads to average variations of ± 19, ± 34 and ± 18% of the average value of molecular uptake. We therefore take a conservative view or upper limit for the measurement uncertainty of ± 40% on average for all considered cases.
Figure 3 displays the lock-in MS signal of trimethylamine (TMA or N(CH3)3) at mass 58 amu on a thoroughly pumped and therefore recycled sample of GTS80 + 4.88% (wt) BTCA-doped amorphous carbon shown on the left panel (experiment s33#4 in Table S2) together with the uptake after pumping the saturated sample overnight by repeating the TMA exposure on the right panel (experiment s34#4 in Table S2). The sample had been previously exposed to HCl (s30#4), TFA (s31#4) and NO2 (s32#4) but had undergone extensive pumping for a few days at 10-5 Torr background pressure at ambient temperature (Table S2). Both panels show complete saturation of TMA uptake after 1’000 s following the green horizontal bars, however, the extent of uptake has dropped from 5.9 1013 to 2.7 1013 molecule after overnight desorption and renewed TMA uptake the next day essentially at the same experimental conditions. This smaller second uptake reduced by 54% stems from the fact that desorption through pumping overnight only desorbs approximately half of the TMA (acidic) adsorption sites at ambient temperature. A look at Table S2 reveals the fact that the uptake of TMA on a virgin sample is larger by 36 % when comparing 9.2 1013 (average of s10#4 and s51#4, Table S2) with 5.9 1013 molecule (s33#4, Table S2) which means that even long-term rejuvenation by pumping at ambient temperature does not free up all possible acidic adsorption sites on the BTCA-covered sample at ambient temperature. This is to be expected owing to the heterogeneous nature of the BTCA-covered interface of GTS80 (sample #4) where some TMA molecules are more strongly bound than others and therefore desorbing at a much slower rate compared to weaker bound ones.
Table 2 displays the initial probe gas uptake probabilities or uptake coefficients measured in the 1mm diameter orifice KFR for all probe gases except HCl. Owing to partial saturation at high pressures the uptake kinetics represents a lower limit as the uptake rate coefficient usually goes up with increasing orifice diameter or decreasing gas residence times, that is upon lowering the partial pressures. The values are in the 10-5 to 10-3 s-1 range, thus larger than the steady-state first-order rate constants for NO2 and O3 displayed in Table S3. Table 2 primarily shows values for virgin samples as the values decrease with each sequential exposure owing to partial coverage from the previous experiments. A typical example is shown in Figure S1 for experiment s70#3.
The large dynamic range of kinetic measurements such as uptake probabilities of the present KFR notwithstanding we point out that the entries for γ0 of NO2 (s50#1) and NH2OH (s50#3) are to be regarded as upper limits. A practical limit of detection corresponds to an uptake probability of 10-5 for light gases based on the geometric surface area of the sample cup (10.6 cm2) or a rate coefficient for initial uptake of k0 = 10-4 s-1. In this case the competition between reaction of NO2 and escape out of the KFR (ke = 0.038 s-1 at 300 K) is 1/380 corresponding to 0.26 % reaction beyond which there are not sufficient molecules reacting to be detected. This limit depends on the signal to noise (S/N) ratio of the MS instrument as far as molecular beam intensity is concerned as well as on the S/N improvement ratio of the lock-in amplifier.
4. Discussion
A cursory look at Table 1 reveals that the uptake of the six used probe gases on samples #1 (GTS6), #2 (T900) and #3 (GTS80) is rather small in general for amorphous carbon samples compared to previous experiments that used the identical experimental method [22,23,30,31,38]. Graphitization or pyrolysis under anaerobic conditions (under N2) of amorphous carbon is tantamount to removing surface functional groups containing N, O, S and other atoms in order to obtain a close approximation to the properties of pure elemental carbon EC [15]. A closer look comparing GTS6 and GTS80 in Table 1 (columns 2 vs. 4) reveals a larger abundance of interfacial functionalities for GTS6 compared to GTS80, especially for the probe gases HA (NH2OH), NO2 and O3. These probe gases reveal the interfacial abundance of surface OH-groups (HA) on the one hand and reduced or oxidizable functionalities on the other hand through reaction of NO2 and O3. GTS6 is thus a more richly decorated amorphous carbon compared to GTS80 as far as surface composition per cm2 is concerned. Quantitatively speaking, GTS6 has a higher abundance of surface –OH groups by a factor of 15, and a larger abundance of reducing interfacial groups reacting with NO2 and O3 by factors of 5 and 11, respectively when comparing to GTS80.
Comparing a “normal”, that is unprocessed amorphous carbon such as T900 (third column in Table 1) to GTS6 as far as reactivities of HA, NO2 and O3 are concerned we see a similar surface OH-group abundance (within a factor of two) and an amount larger by a factor of two and five for NO2 and O3. This underlines a similarity between the surface composition of GTS6 graphitized amorphous carbon and unprocessed and commercially available thermal carbon T900. However, when performing the same comparison of T900 reactivity vs. GTS80 the paucity of surface OH-groups and reducing capacity becomes apparent for the latter. Among the noteworthy facts is the high reactivity of T900 with pure O3 that is higher by a factor of 50 compared to GTS80 according to data displayed in Table 1. However, this situation is expected on the basis of results on other types of amorphous carbons as far as ozone reactivities are concerned [22,23].
When we compare the reactivity of the strong oxidizer O3 with the weak oxidizer NO2 for T900 and compare it to GTS80 we obtain a factor of 13 and 2.3. This disparity emphasizes the fact that there are only few strong reducing entities reacting with NO2 while O3 reacts with all, both weak and strong, reducing functionalities that are present in higher number. This distribution of strong and weak reducing capacities in amorphous carbons is characteristic for specific samples of amorphous carbons as has been reported before [22,23,30,31,38] and may indicate the molecular entity having specific reducing properties, for instance embodied in conjugated vs. isolated hydroquinone/ether combinations (pyrones) that lead to specific ratios of yields or uptakes of O3 vs. NO2.. Another characteristic ratio is the reactivity of the strong acid TFA probing the sum of amounts of weak and strong bases whereas the weak acid HCl only probes strong bases. This ratio detects the abundance of weak bases such as pyrones that are weak bases consisting only of C, H, and O atoms without the presence of nitrogen heteroatoms. Inspection of Table 1 reveals the complete absence of HCl uptakes in all examined cases which points towards the existence of weak bases exclusively in all cases treated here. In turn, we are not saying that all weak bases are conjugated pyrones, however, we claim that the weak basicity may be interpreted by taking a conjugated pyrone as an example.
Lastly, we compare columns 4 and 5, namely pure GTS80 as the carrier or substrate of 1,2,4 BTCA at a specific doping level leading to 1.77 1014 molecule/cm2 as the amount of a molecular monolayer using the estimated mass-density of BTCA as an example of a tailored soot material. As expected we observe a large coverage of 52% of a monolayer when examined with the strong base TMA. In addition, the coverage of surface OH-groups amounts to 16.4 % of a monolayer which is the highest coverage of HA within the tested samples. A significant abundance of reducing sites seem to be present in both cases at the close to monolayer coverage by BTCA when you compare GTS80 with GTS80 + 4.88% BTCA. Upon comparison between both GTS80 samples probed by both NO2 and O3 the abundance (absolute number) of sites reacting with NO2 is a factor of 4.6 higher for GTS80 + BTCA compared to bare GTS80 whereas it is a factor of only 2.3 larger for O3 uptake. We note in passing that the strongly reducing functional groups at the interface probed by NO2 increase more upon coating than the sum of all reducing groups probed by O3. This increase for both NO2 and O3 uptake upon coating GTS80 reveals a propensity for oxidation of a species absent on bare GTS80. This result is unexpected and leaves room for speculation as to the nature of the reducing properties of BTCA-coated GTS80, especially in view of the gas phase thermodynamic stability of BTCA. It is possible that this may have to do with an interfacial reaction involving 1,2,4 BTCA.
A last remark concerns the strength of the basic interfacial sites of BTCA-coated GTS80 in relation to bare GTS80 considering the uptake of HCl to the extent of 4.4 10-3 compared to the uptake of TFA of 3.28 10-2 monolayers. These numbers may be interpreted that the sum of all basic sites amounts to 3.28 10-2 with 4.4 10-3 monolayers contributing to strong bases because HCl as a weak acid titrates preferentially strong bases owing to its weaker acidity in the gas phase compared to TFA. Therefore, weak bases make up a majority of 2.84 10-2 of a monolayer with strong bases contributing 4.4 10-3 resulting in a ratio of 6.5 weak vs. strong bases or 87% weak vs 13% strong bases. We identify weak bases with (conjugated) pyrones [21] in the absence of basic nitrogen. This case is the only one where reliable results of HCl titration could be obtained compared to the three remaining samples. The comparison of NH2OH uptake probing surface OH functional groups between bare GTS80 and the BTCA-coated substrate begs the question of whether or not NH2OH acts like a weak base in an acid-base reaction or in a complex formation leading to a hydrogen-bonded adduct. We measure a factor of 7 and 32 increase in NH2OH uptake going from sample 3 (bare GTS80) to sample 4 (BTCA-doped) taking the geometric probe gas monolayer coverage based on the liquid density of HA and the BTCA coverage, respectively. In both cases one measures a significant coverage of HA on the BTCA-doped interface where the probe gas interacts with the acidic carboxylic –OH group. We estimate that approximately 16 % (equal to 2.9 1013/1.77 1014 = 16.4% of a monolayer) of the acidic carboxylic OH groups are strong enough to interact with the weak base HA in this case.
In conclusion we may state that the most “inert”, that is the amorphous carbon substrate with the lowest number of functional groups at the interface, is bare GTS80 followed by GTS6. The latter is similar to a “normal” unprocessed and commercially available amorphous carbon when compared to thermal carbon T900 as far as the abundance of surface OH-groups and the interfacial reactivity with NO2 and O3 are concerned. However, another message emerges resulting from these titration experiments: each amorphous carbon has a pattern of probe gas reactivities that is specific owing to its generation and follow-up fate. In view of the similar processing conditions regarding the treatment of GTS6 and GTS80 the significantly different abundance of probe gas uptake is certainly a surprise. However, it must also be stated that in view of the paucity of surface functional groups except for BTCA-doped substrates the experimental results have relatively large uncertainties in this case, also in view of the modest amounts of material that was available for the present study.
A look at Table S2 enables an overview over the whole database obtained in the present study. In order to make good use of the available samples we subjected the samples to multiple probe gas exposures in order to see whether or not different probe gases obtained identical uptakes of reactive gases from previous exposures, either using the same probe gas or a different one. We checked for “memory effects” after sample “regeneration” by pumping/refreshing a spent sample overnight (roughly 10 to 12 hours) at a vacuum of 10-5 mbar within the KFR at the fastest pumping rate available by switching to the 14 mm diameter escape orifice of the KFR (see Table S1 for reactor hardware parameters). The most important question was whether or not it was possible to obtain reliable answers on sequential uptakes of multiple probe gases using the same sample after extensive regenerative pumping all the while considering the fairly weak uptake in most cases. We will not engage in discussing all data to be found in Table S2, but concentrate on four cases as examples as follows:
- -
- Considering the results of thermal amorphous carbon T900 and the HA probe we compare the entries for experiments s60#2 with s51#2 and come to the conclusion that previous ozone exposure increases the abundance of surface OH-groups at the interface by approximately 50%. We conclude that previous exposure to O3 irreversibly modifies the interface of T900.
- -
- For the case of BTCA-covered GTS80 probed by TMA we generally notice a “memory effect“ owing to exposure to NO2, TFA and HCl in that the uptake decreases upon exposure to these gases after probing with TMA. We take the average of runs s10#4 and s51#4 as the baseline for comparison, namely, an uptake of 9.2 1013 molecule.
- -
- Even for bare GTS80 we notice a “memory effect” when comparing run s20#3 with s21#3 owing to previous exposure to TFA.
- -
- Previous HA exposure of GTS6 and thermal carbon T900 samples enables marginal HCl uptake because adsorbed HA may act as a base as HA is a multifunctional molecule as seen in runs s71#1 and s61#2. The level of HCl uptake is larger than the “background level” of HCl uptake observed for bare GTS80, run s31#3 as seen in Table S2.
Except for the first point above on sample #2 (thermal carbon T900) where possible reactive modification of the interface may be the reason for the memory effect of the previous exposure to a reactive gas such as O3, the three other cases may be caused by the fact that regeneration/rejuvenation through long lasting pumping may not restore the interface to its pre-exposure state. This is the reason that the data in Table 1 mainly present first-time uptake experiments using virgin samples with four exceptions deemed to be acceptable. It turns out that certain salts of TFA, HCl and/or TMA with interfacial basicity or acidity may not correspond to thermodynamically stable species and slowly decompose under high-vacuum conditions. Ozone deserves special attention as a probe gas for amorphous carbon as it has been used on numerous occasions with amorphous carbon owing to its suspected heterogeneous (interfacial) reactivity with several types of amorphous carbon [40,41]. This work has shown the saturation of reactive O3 adsorption at typical 300 ppb and the significant increase of O3 uptake kinetics upon UV/Vis irradiation in a coated wall flow tube experiment using propane combustion in a CAST soot generator. Noteworthy is the effect of the increase in relative humidity that leads to even faster sustained O3 uptake kinetics on propane soot rather than the expected and usually observed decrease. Thus this work documents the reproducible regeneration/reactivation of the uptake capability of propane soot upon UV/Vis illumination after exhaustive saturation of O3 uptake in the dark.
Table 2 presents data on the uptake kinetics of certain probe gases that resulted in significant loss signals at the prevailing noise levels at steady-state conditions. Uptake kinetics is expressed as an uptake probability per gas-interface collision leading to loss of species within the gas residence time for assumed first-order loss based on the geometric as opposed to the total internal and external surface as given by the BET surface. As alluded to above, all uptake experiments have been performed in the 1 mm diameter orifice KFR in order to come as close as possible to saturation conditions. Under these conditions some experiments are already partially saturated which means that the initial uptake coefficient or probability may be larger at shorter residence time and thus lower probe gas concentrations. This has recently been shown by Zogka et al. for heterogeneous kinetic studies of glyoxal on different dust samples [42]. Results displayed in Table 2 are therefore to be considered as lower limiting values. On the other hand, certain samples of low mass may not completely cover the entire area of the 10.6 cm2 sample cup such that this effect may partially offset the fact that the uptake is partially saturated. These two effects may counteract each other and the values displayed in Table 2 may therefore give an approximate idea of the magnitude of the initial uptake kinetics
Certain probe gases such as NO2 and O3 lead to chemical reaction or oxidation of the interface with the substrate which may give rise to a chemical loss at steady-state. In Figure 2 such a reaction has been mentioned in the interaction of NO2 with thermal carbon T900. Such data are of importance in the environment as they have effects in the long term because these slow reactions go on long after the surface has been saturated. Table S3 displays such steady-state loss reactions for O3 on three substrates that are based on the BET surface in contrast to the steady-state uptake kinetics based on the geometric surface of Table 2. However, these oxidation reactions occur on specific sites of the bulk phase that are slowly consumed as displayed in Table S3 with a slow decrease of the rate constant with each exposure period of 10-20 minutes. These slow albeit important processes are difficult to measure quantitatively but may have a significant impact on atmospheric chemistry. Oxidation reactions by NO2 are in general slower than with O3 but may lead to the same or similar oxidation products such as surface OH-groups at the interface, partially oxygenated intermediates or even gas phase CO and CO2 observed after spontaneous ambient or higher temperature desorption. Although the gas phase products are known and expected, one does not know anything about their precursors before transformed into gas phase products. As a case in point Figure S1 presents the time-dependent uptake of pure O3 on bare GTS80 (s70#3). It shows three uptake sequences of ozone monitored at m/e 48 amu (O3+) with only the first showing a distinct “irreversible” uptake similar to the behavior shown in Table 1 and S2 followed by a plateau level indicating a steady-state loss or uptake. The following two openings of the SC indicate a quasi steady-state uptake that only slowly saturates at long exposure times owing to the finite number of suitable reduced adsorption sites. Both O3 and NO2 indeed show this steady state loss that may be significant for atmospheric chemistry. As a quality control measure we have indicated the ratio of the lock-in MS signals at masses 32/48 amu at three instants during the experiment (two measurements are shown in Figure S1) and assured its constant value of approximately 0.5 throughout the uptake experiment.
Finally, let us compare the limiting large values for the TMA titration yields on BTCA-doped GTS80 (sample no. 4) of approximately 50% of a monolayer (Table 1) with another chemical system in which NH2OH (HA) heterogeneously interacts with TiO2 powder using the identical experimental method. Table S4 shows high values of large HA saturation values when taking note of the entries for TiO2 except entries two and four that pertain to special situations (see footnotes b and c in Table S4). It is known from the literature [43] that TiO2 (rutile, anatase and mixtures of it) has almost exclusively OH surface functional groups at high coverage on its interface which explains the high value of 50.7 % of a monolayer determined as an average from entries 1, 3, 5 and 6. Please take note that two TiO2 samples having a BET surface differing by a factor of 5.5 gave very consistent coverages of HA, namely comparing entries 1 and 3 vs. 5 and 6. Unlike the TMA titration of sample no. 4 displayed in Table S4 the saturation coverage for HA on TiO2 was derived from a close packing model of HA using the mass density of HA discussed in Section 2.2 (see also footnote b in Table 1) because we do not have reliable information on the surface OH-density on TiO2. Therefore, one cannot a priori compare the numerical values for saturation coverage. We nevertheless take this excellent agreement as a sign for the accuracy and consistency of the present titration method in determining the saturation coverage of both TMA via an acid-base reaction and HA through a hydrogen-bonded stable 5-membered ring arrangement presented in ref. [34].
5. Conclusions
We state at the outset that the purpose of the study of three different carbonaceous materials is twofold: (i) study the molecular composition of the particle interface of two high-temperature processed synthetic amorphous carbon materials in terms of surface reactivity in comparison with a typical commercially available amorphous carbon (soot); (ii) investigate the molecular composition of the interface of a custom-made acid coated material of approximately single molecular monolayer thickness using a high-temperature processed carbon material as substrate and investigate its surface properties.
The main scientific conclusions of the present study are as follows:
- -
- The sequence of abundance of the interfacial functional groups consisting of surface OH, reducing (oxidizable), basic and acidic surface sites is: GTS80 < GTS6 < Thermal Soot T900. High-temperature thermal processing (pyrolysis) under N2 significantly reduces surface functionality measured in sites cm-2 but does not eliminate altogether surface functionalities.
- -
- In going from T900 to bare GTS6 and GS80 through high-temperature processing (pyrolysis) one primarily loses the weakly reducing sites, the strongly reducing sites survive high-T pyrolysis much better than the weakly reducing sites.
- -
- Owing to the absence of HCl compared to TFA uptake we conclude that evidence points towards the exclusive presence of weak bases.
- -
- The comparison of O3/NO2 and HCl/TFA uptakes (the latter only for GTS80 + BTCA) leads to the conclusion that the interfacial reactivity is governed by strongly reducing groups. For the case of BTCA-covered GTS substrate we have in addition evidence for 86% weakly vs. 14% strongly basic surface functionalities.
- -
- The combination of strongly reducing power and weakly basic properties leads to the suggestion of the occurrence of pyrone bases coupled to hydroquinones, perhaps in a single highly conjugated aromatic hydrocarbon as presented in an earlier work making use of surface functionalities. See ESI section of reference [38] for structural formulas.
- -
- In many cases we may have to contend with irreversible memory effects upon exposure to probe gases, even when long-term rejuvenation through fast pumping is carried out. This effectively rules out multiple use of a single sample in the context of experimental investigations using several sequentially applied probe gases on the same sample.
Supplementary Materials
The following supporting information can be downloaded at: Preprints.org.
Funding
OBP acknowledges funding from RSF project 19-77-30004 II for the development of reference materials used in calibration instrumentation. MJR sincerely thanks ETHZ and EPFL for financial support over the years administered by Urs Baltensperger (LAC/PSI) and Christian Ludwig (GR-LUD/EPFL).
References
- IPCC, 2023: Summary for Policymakers. In: Climate Change 2023: Synthesis Report. Contribution of Working Groups I, II and III to the Sixth Assessment Report of the Intergovernmental Panel on Climate Change [Core Writing Team, H. Lee and J. Romero (eds.)]. IPCC, Geneva, Switzerland, pp. 1-34. [CrossRef]
- IPCC, 2023: Climate Change 2023: Synthesis Report. Contribution of Working Groups I, II and III to the Sixth Assessment Report of the Intergovernmental Panel on Climate Change [Core Writing Team, H. Lee and J. Romero (eds.)]. IPCC, Geneva, Switzerland, 184 pp.. [CrossRef]
- IPCC, 2001: Climate Change 2001: Synthesis Report. A Contribution of Working Groups I, II, and III to the Third Assessment Report of the Intergovernmental Panel on Climate Change [Watson, R.T. and the Core Writing Team (eds.)]. Cambridge University Press, Cambridge, United Kingdom, and New York, NY, USA, 398 pp. See pg. 48 and 156 for individual contributions of global average radiative forcing in W/m2.
- Petzold, A; Ogren, J.A.; Fiebig, M.; Laj, P.; Li, S.M.; Baltensperger, U.; Holzer-Popp, T.; Kinne,S.; Pappalardo, G.; Sugimoto N.; Wehrli, C.; Wiedensohler, A.; Zhang, X.Y; Recommendations for reporting“blackcarbon”measurements. Atmos. Chem. Phys. 2013, 13, 8365–8379.
- Bond, T.C. et al. Bounding the role of black carbon in the climate system: A scientific assessment. J. Geophys. Res. Atmos., 2013, 118(11), 5380-5552. [CrossRef]
- Jacobson, R.S.; Korte, A.R.; Vertes, A.; Miller, J.H. The molecular Composition of Soot. Angew. Chem. Int. Ed. 2020, 59, 4484-4490.
- Müller, J.-O.; Su, D.S.; Wild, U.; Schlögl, R. Bulk and surface structural investigations of Diesel engine soot and carbon black. Phys. Chem. Chem. Phys. 2007, 9, 4018-4025.
- Parent, P.; Laffon,C. ; Marhaba, I.; Ferry, D., Regier, T.Z.; Ortega, K.; Chazallon, B.; Carpentier, Y.; Focsa, C. Nanoscale characterization of aircraft soot: A high-resolution transmission electron microscopy, Raman spectroscopy, X-ray photoelectron and near-edge X-ray absorption spectroscopy study. Carbon, 2016, 101, 86-100.
- Kireeva, E.D. et al. Fractionation analysis of transport engine-generated soot particles with respect to hygroscopicity. J Atmos Chem 2009, 64, 129–147. [CrossRef]
- Popovicheva, O.B. et al. Small-Scale Study of Siberian Biomass Burning: I. Smoke Microstructure, Aerosol and Air Quality Research, 2015, 15, 117–128.
- Marhaba, I.; Ferry, D.; Laffon, C.; Regier, T.Z.; Ouf, F.-X ; Parent, P. Aircraft and MiniCAST soot at the nanoscale. Comb. and Flame, 2019, 204, 278-289.
- IPCC, 1999 – J.E. Penner, D.H. Lister, D.J. Griggs, D.J. Dokken, M. McFarland (Eds.) Prepared in collaboration with the Scientific Assessment Panel to the Montreal Protocol on Substances that Deplete the Ozone Layer Cambridge University Press, UK. pp 373 Available from Cambridge University Press, The Edinburgh Building Shaftesbury Road, Cambridge CB2 2RU ENGLAND.
- Lieske, L.-A.; Commodo, M.; Martin, J.W.; Kaiser, K.; Benekou, V.; Minutolo, P.; D’Anna, A.; Gross, L. Portraits of Soot Molecules Reveal Pathways to Large Aromatics, Five-/Seven-Membered Rings, and Inception through π-Radical Localization. ACS Nano 2023, 17, 13563−13574.
- Valavanidis, A.; Fiotakis, K.; Bakeas, E.; Vlahogianni, T. Electron paramagnetic resonance study of the generation of reactive oxygen species catalysed by transition metals and quinoid redox cycling by inhalable ambient particulate matter. Redox Reports, 2005, 10(1), 37-51.
- Li, M.; Bao, F.; Zhang, Y.; Song, W.; Chen, C.; Zhao, J. Role of elemental carbon in the photochemical aging of soot. PNAS (Proceedings of the National Academy of Sciences of the USA) 2018, 115, 7717-7722.
- Donnet, J.B. The Chemical Reactivity of Carbons. Carbon 1968, 6, 161-176.
- Papirer, E.; Li, S.; Donnet, J.-B. Contribution to the Study of Basic Surface Groups on Carbons. Carbon 1987, 25, 243-247.
- Boehm, H.P. Some Aspects of the Surface Chemistry of Carbon Blacks and other Carbons. Carbon, 1994, 32, 759-769.
- Boehm, H.P. Surface Oxides on Carbon and their Analysis: A critical Assessment. Carbon, 2002, 40, 145-149.
- Boehm, H.P. Acidic and Basic Properties of Hydroxylated Metal Oxide Surfaces. Discuss. Faraday Soc. 1971, 52, 264-275.
- Mirghaffary, N.; Iannarelli, R.; Ludwig, C., Rossi, M.J. Coexistence of reactive functional groups at the interface of a powdered activated amorphous carbon: A molecular view. Molecular Physics 2021, e1966110.
- Setyan, A.; Sauvain, J.-J.; Guillemin, M.; Riediker, M.; Demirdjian, B.; Rossi, M.J. Probing Functional Groups at the Gas-Aerosol Interface using Heterogeneous Titration Reactions: A Tool for Predicting Aerosol Health Effects? ChemPhysChem 2010, 11, 3823-3835.
- Setyan, A.; Sauvain, J.-J.; Rossi, M.J. The use of heterogeneous chemistry for the characterization of functional groups at the gas/particle interface of soot and TiO2 nanoparticles. Phys. Chem. Chem. Phys. 2009, 11, 6205-6217.
- Popovicheva, O.B.; Baumgardner, D.; Subramanian, R.; Kok, G.; Cary, R.; Vlasenko, E.; Khokhlova, T.; Shonija, N.; Kireeva, E. Tailored graphitized soot as reference material for EC/OC measurement validation. Atmos. Meas. Tech. 2011, 4, 923-932.
- Popovicheva, O.B.; Persiantseva, N.M.; Shonija, N.K.; DeMott, P.; Koehler, K.; Petters, M.; Kreidenweis, S.; Tishkova, V.; Demirdjian, B.; Suzanne, J. Water interaction with hydrophobic and hydrophilic soot particles. Phys. Chem. Chem. Phys. 2008, 10, 2332-2344.
- Popovicheva, O.B.; Kireeva, E.D.; Shonija, N.K.; Khokhlova, T.D. Water interaction with laboratory-simulated fossil fuel combustion particles. J. Phys. Chem. A 2009, 113, 10503-10511.
- Peri, J.B.; Hensley Jr., A.L. The Surface Structure of Silica Gel. J. Phys. Chem. 1966, 72, 2926-2933.
- Van Der Voort, P.; Gillis-D’Hamers, I.; Vrancken, K.C.; Vansant, E.F. Effect of Porosity on the Distribution and Reactivity of Hydroxy Groups on the Surface of Silica Gel. J. Chem. Soc. Faraday Trans. 1991, 87, 3899-3905.
- Griffith, P.R.; de Haseth, J.A. Fourier Transform Infrared Spectrometry, Vol. 83 in Chemical Analysis. A Series of Monography on Analytical Chemistry and its Applications, John Wiley & Sons, 1986, pg. 194.
- Tabor, K.; Gutzwiller, L.; Rossi, M.J. Heterogeneous Chemical Kinetics of NO2 on Amorphous Carbon at Ambient Temperature. J. Phys. Chem. 1994, 98, 6172-6186.
- Stadler, D.; Rossi, M.J. The reactivity of NO2 and HONO on Flame soot at ambient temperature: The influence of combustion conditions. Phys. Chem. Chem. Phys. 2000, 2, 5420-5429.
- Tapia, A.; Salgado, M.S.; Martin, M.P.; Lapuerta, M.; Rodriquez-Fernandez, J.; Rossi, M.J.; Cabanas, B. Molecular Characterization of the Gas-Particle Interface of Soot Sampled from a Diesel Engine Using a Titration Method. Environ. Sci. Technol. 2016, 50, 2946-2955.
- Maters, E.C.; Delmelle, P.; Rossi, M.J.; Ayris, P.M. Reactive Uptake of Sulfur Dioxide and Ozone on Volcanic Glass and Ash at Ambient Temperature. J. Geophys. Res.: Atmospheres, 2017, 122, 10077-10088.
- Borgmeyer, T.; Zhou, L.; Breider, F.; Rossi, M.J.; Ludwig, C. Natural and simulated weathering of polystyrene: A molecular view. Sci. Tot. Environ. 2024, 947, 174609.
- Borgmeyer, T.; Kupper, Y.; Rossi, M.J.; Luterbacher, J.; Ludwig, C. Characterization of Biobased Polymers at the Gas-Solid Interface – Analysis of Surface and Bulk Properties during Artificial Degradation. Environ. Sci. Technol. submitted (Nov. 2024).
- Rossi, M.J.; Gandolfo, A.; Lostier, A.; Roose, A.; George, C.; Salameh, T.; Thévenet, F.; Chen, H.; Romanias, M.N. Uptake of Atmospheric Pollutants on Road Asphalt Pavements: An Underestimated Sink in Urban Environments. Environ. Sci. Technol. 2024, submitted (Oct. 2024).
- Avgul, N. N; Kiselev, A. V. Physical Adsorption of Gases and Vapours on Graphitized Carbon Blacks, Chemistry and Physics of Carbons, edited by Walker, P. L., 6, Dekker, New York, 1–124, 1970.
- Iannarelli, R.; Ludwig, C.; Rossi, M.J. Flowing Gas Experiments Reveal Mechanistic Details of Interfacial Reactions on a Molecular Level at Knudsen Flow Conditions. Front. Astron. Space Sci. 2022, 9, 891177.
- Iannarelli, R.; Ludwig, C.; Rossi, M.J. The Kinetics of Adsorption and Desorption of Selected Semivolatile Hydrocarbons and H2O vapor on Two Mineral Dust Materials: A Molecular View. J. Phys. Chem. A 2022, 126, 8711-8726.
- Zelenay, V.; Monge, M.E.; D’Anna, B.; George, C.; Styler, S.A.; Huthwelker, T.; Ammann, M. Increased steady-state uptake of ozone on soot due to UV/Vis radiation. J. Geophys. Res. 2011, 116, D1130141.
- George, C.; Ammann, M.; D’Anna, B.; Donaldson. J.; Nizkorodov, S.A. Heterogeneous Photochemistry in the Atmosphere. Chem. Rev. 2015, 115, 4218-4258.
- Zogka, A.G.; Lostier, A.; Papadimitriou, V.C.; Thevenet, F.; Formenti, P.; Rossi, M.J.; Chen, H.; Romanias, M.N. Unraveling the Uptake of Glyoxal on a Diversity of Natural Dusts and Surrogates: Linking Dust Composition to Glyoxal Uptake and Estimation of Atmospheric Lifetimes. ACS Earth Space Chem. 2024, 8, 1165−1178.
- Diebold, U. Structure and properties of TiO2 surfaces: a brief review. Appl. Phys. A 2003, 76, 681–687.
Figure 1.
Lock-in MS Signal (V) of uptake experiment of Hydroxylamine (NH2OH) monitored at 33 amu on 109.7 mg Graphitized Amorphous Carbon GTS6 as a function of time (data accumulation at 4 s-1 acquisition frequency). Flow rate measurements at 5’300 and 13’200 pts. (vertical green arrows) with FiNH2OH = 3.2 1015 and 3.1 1015 molecule s-1, respectively. Red and Green horizontal bars on top indicate the state of the sample compartment (SC) “closed” and “open”, respectively. Note the perturbation of the MS signal during the flow rate measurement of NH2OH owing to the small stagnation pressure in the inlet system caused by the small vapor pressure at 273 K (experiment s70#1).
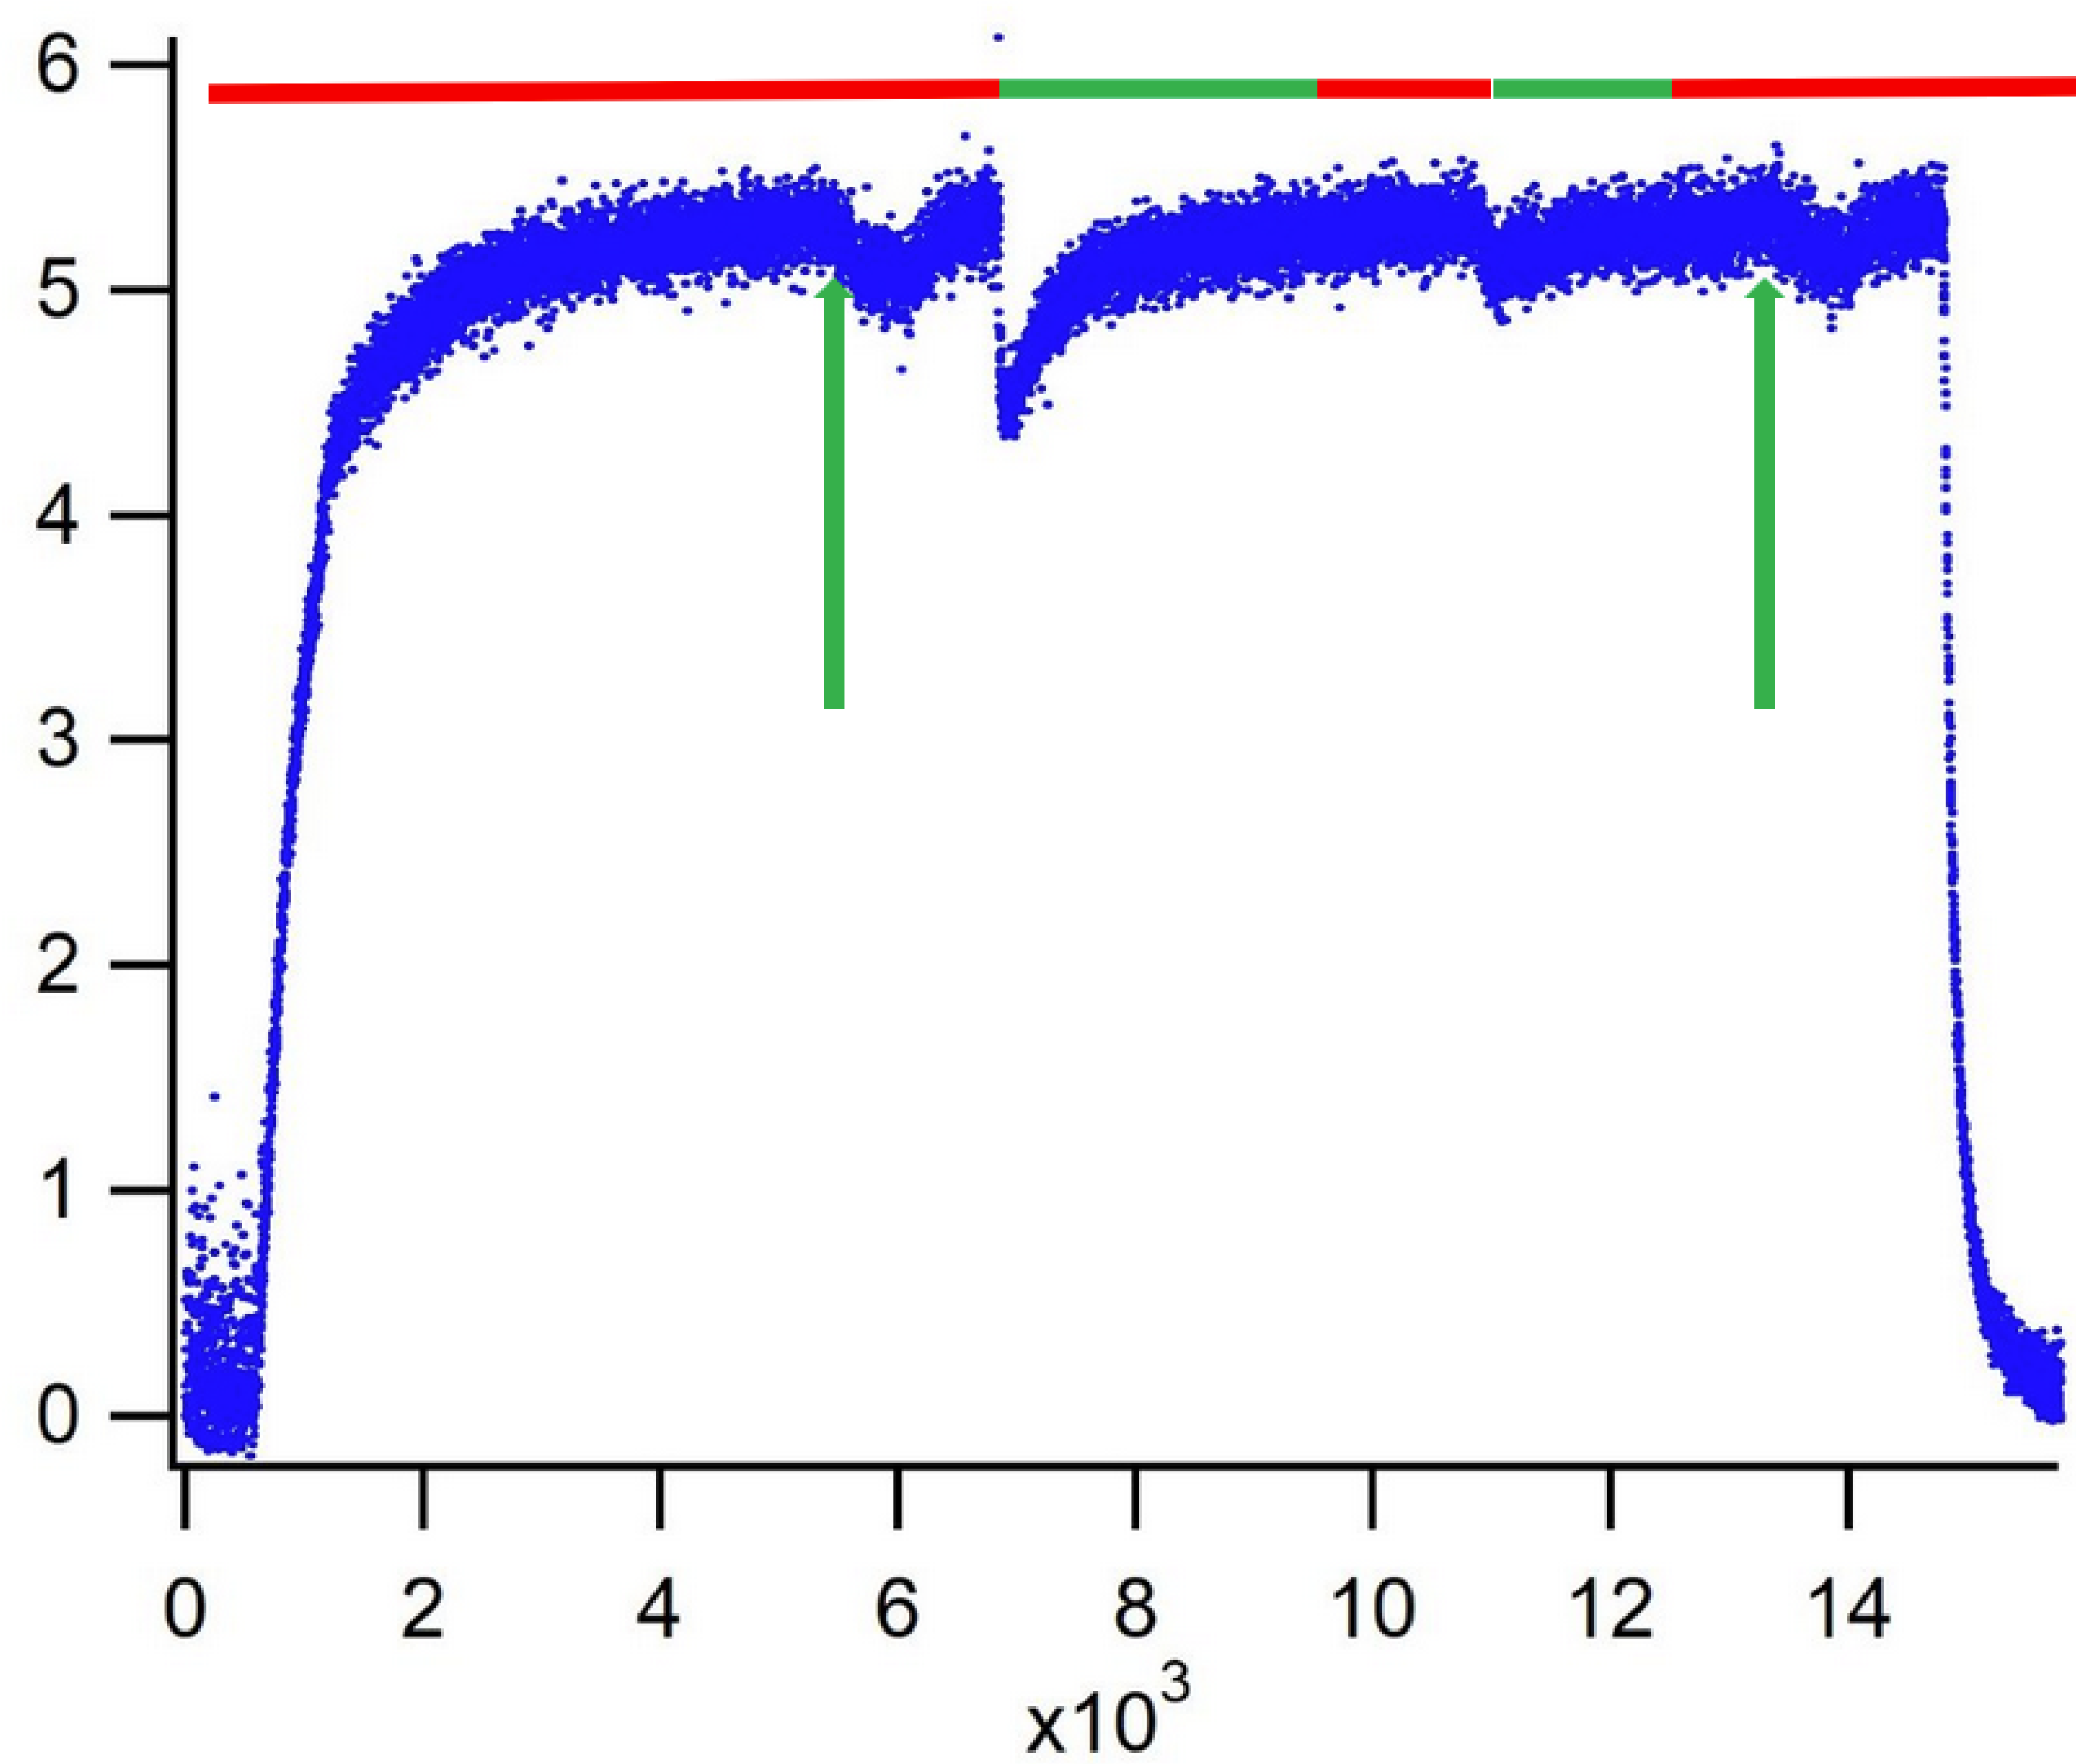
Figure 2.
Lock-in MS Signal (V) of uptake experiment of NO2 monitored at 46 amu on 133.8 mg Thermal Soot T900 as a function of time (data accumulation at 4 s-1 acquisition frequency). Flow rate measurements at 26’000 pts. with FiNO2 = 7.9 1015 molecule s-1 (vertical green arrow). Red and Green horizontal bars indicate the state of the sample compartment (SC) “closed” and “open”, respectively. Baseline of lock-in MS signal located at 900 mV (experiment s10#2).
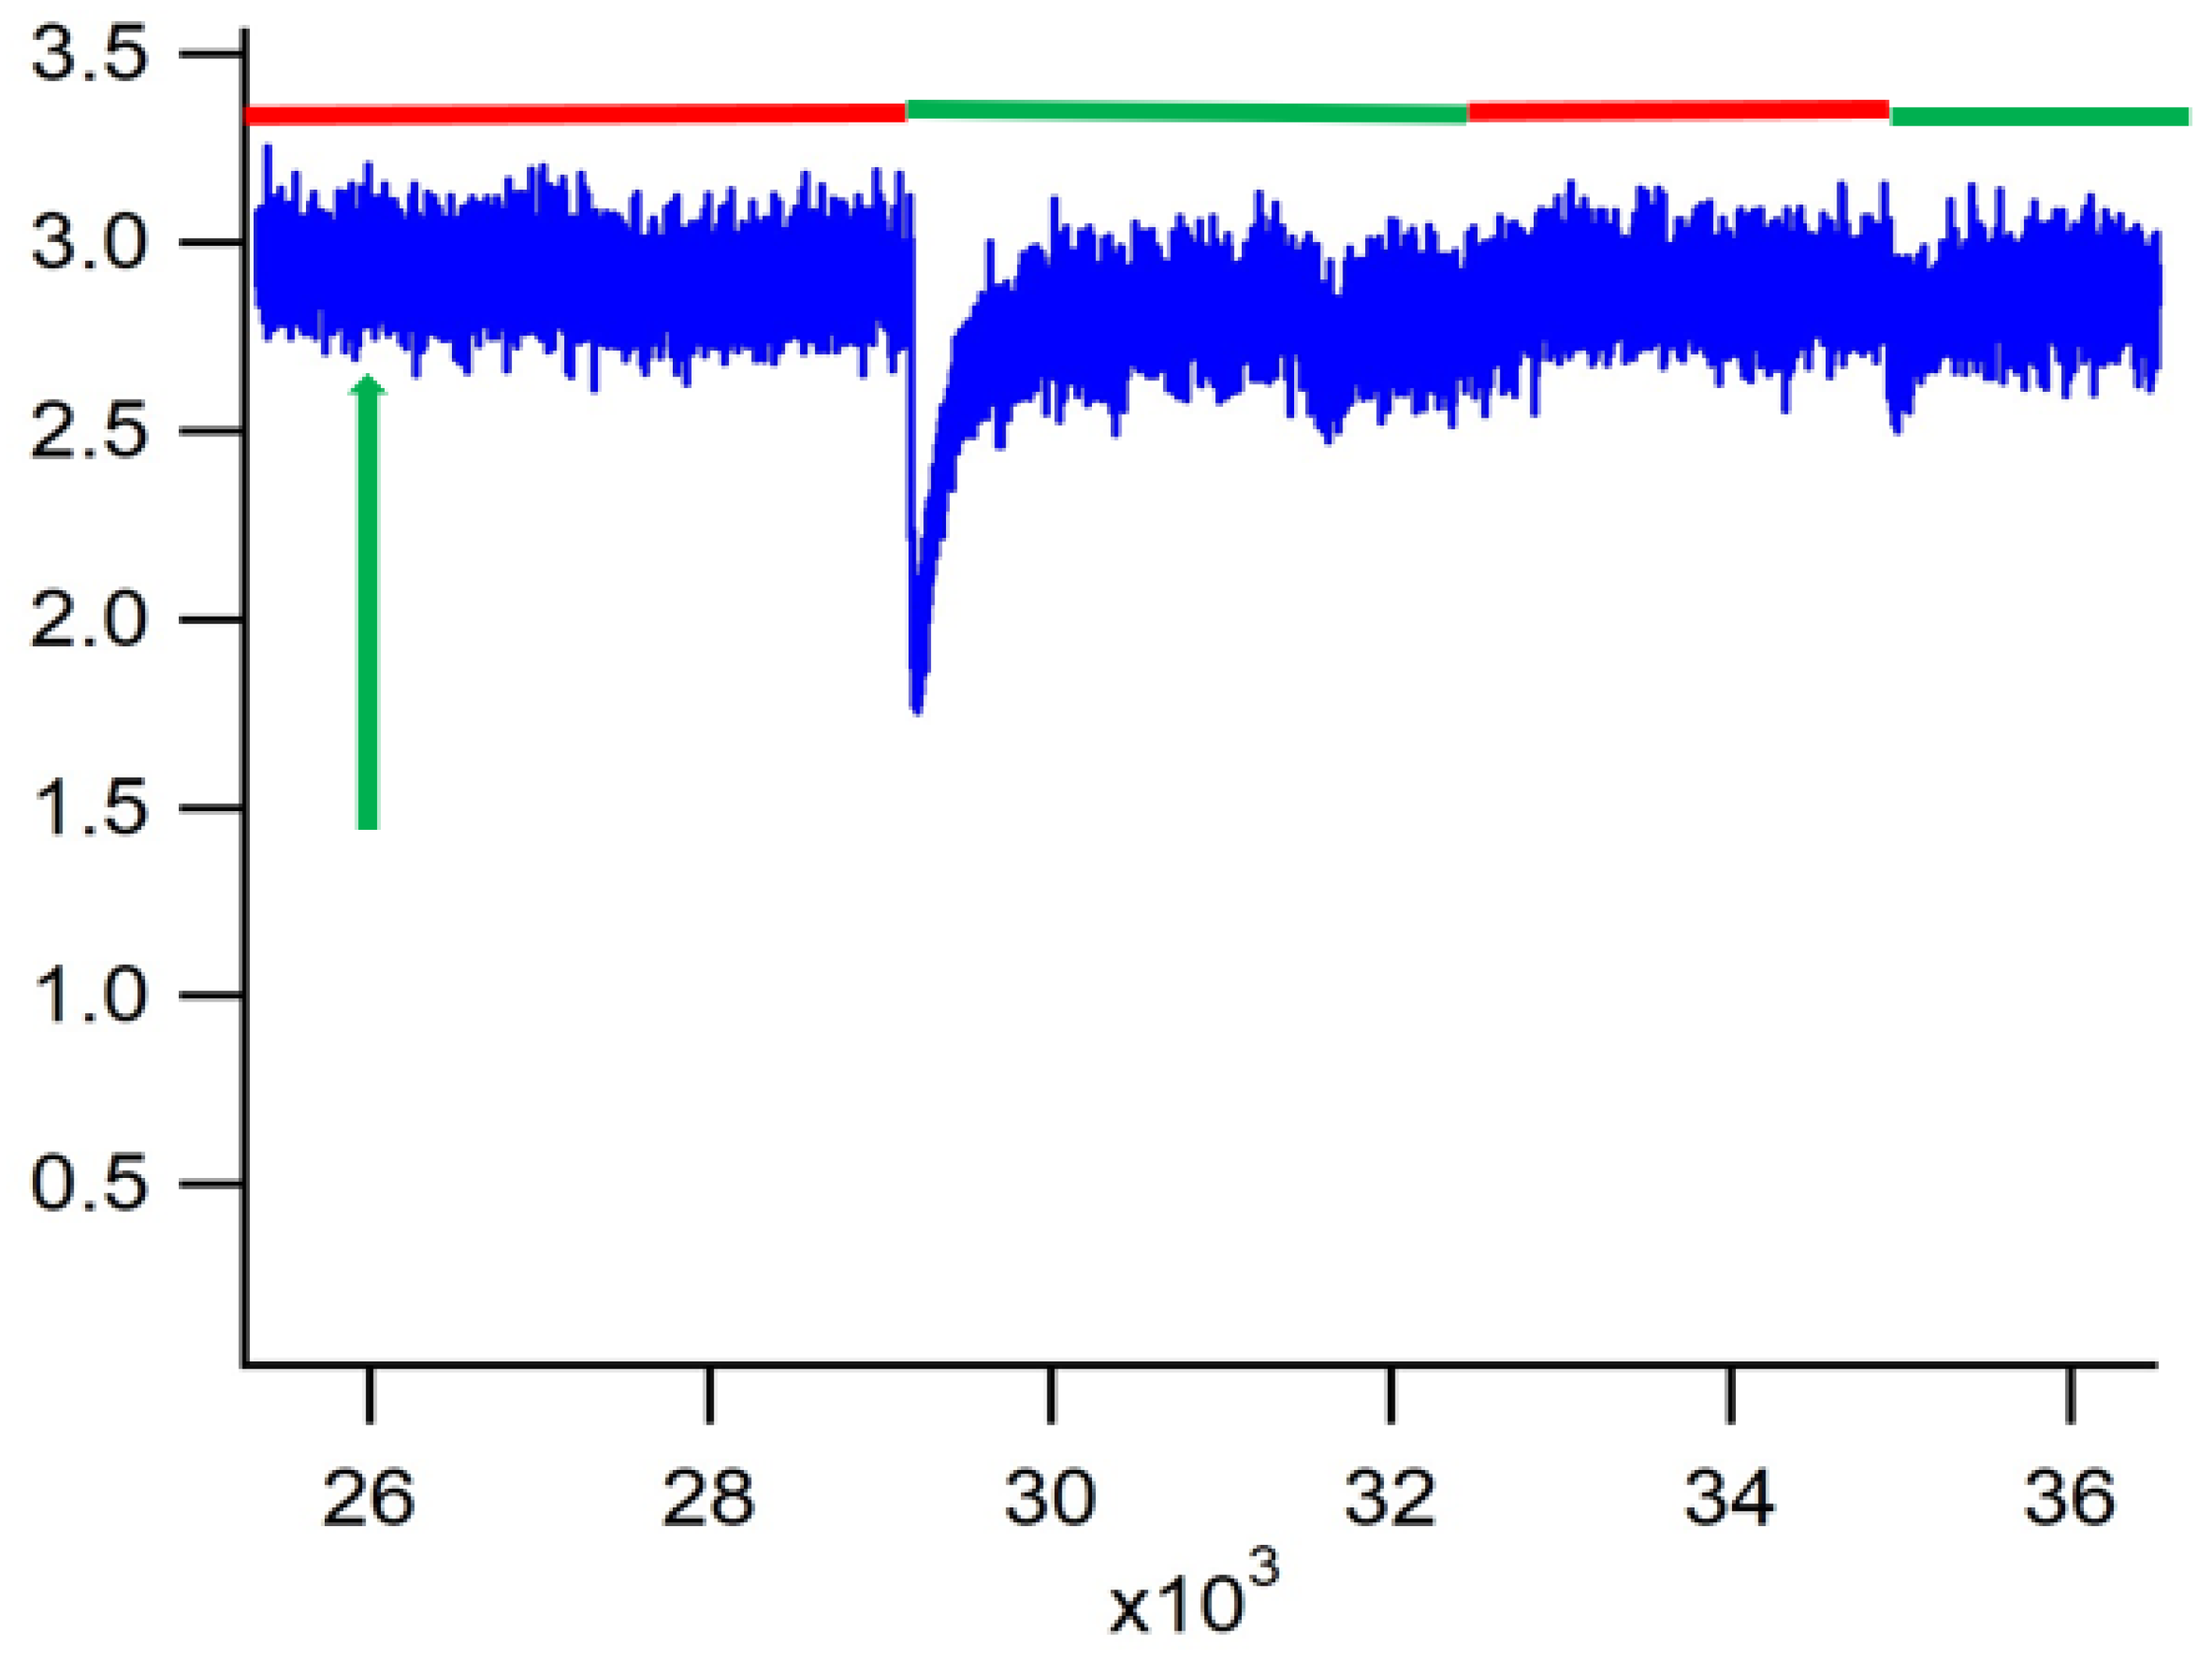
Figure 3.
Lock-in MS Signal (V) of uptake experiments of Trimethylamine (TMA) monitored at 58 amu on 27.6 mg Graphitized Amorphous Carbon GTS80 + 5% BTCA as a function of time (data accumulation at 4 s-1 acquisition frequency). The left panel displays the initial TMA uptake experiments, the right panel the identical sample after pumping (14 h) the sample in the SC overnight using the 14 mm diameter orifice of the KFR. Flow rate measurements FiTMA of TMA of 7.0 1015 (left panel) and 7.2 1015 (right panel) molecule s-1, respectively (vertical green arrow). Red and Green horizontal bars indicate the state of the sample compartment (SC) “closed” and “open”, respectively (experiments s33#4, left, s34#4, right).
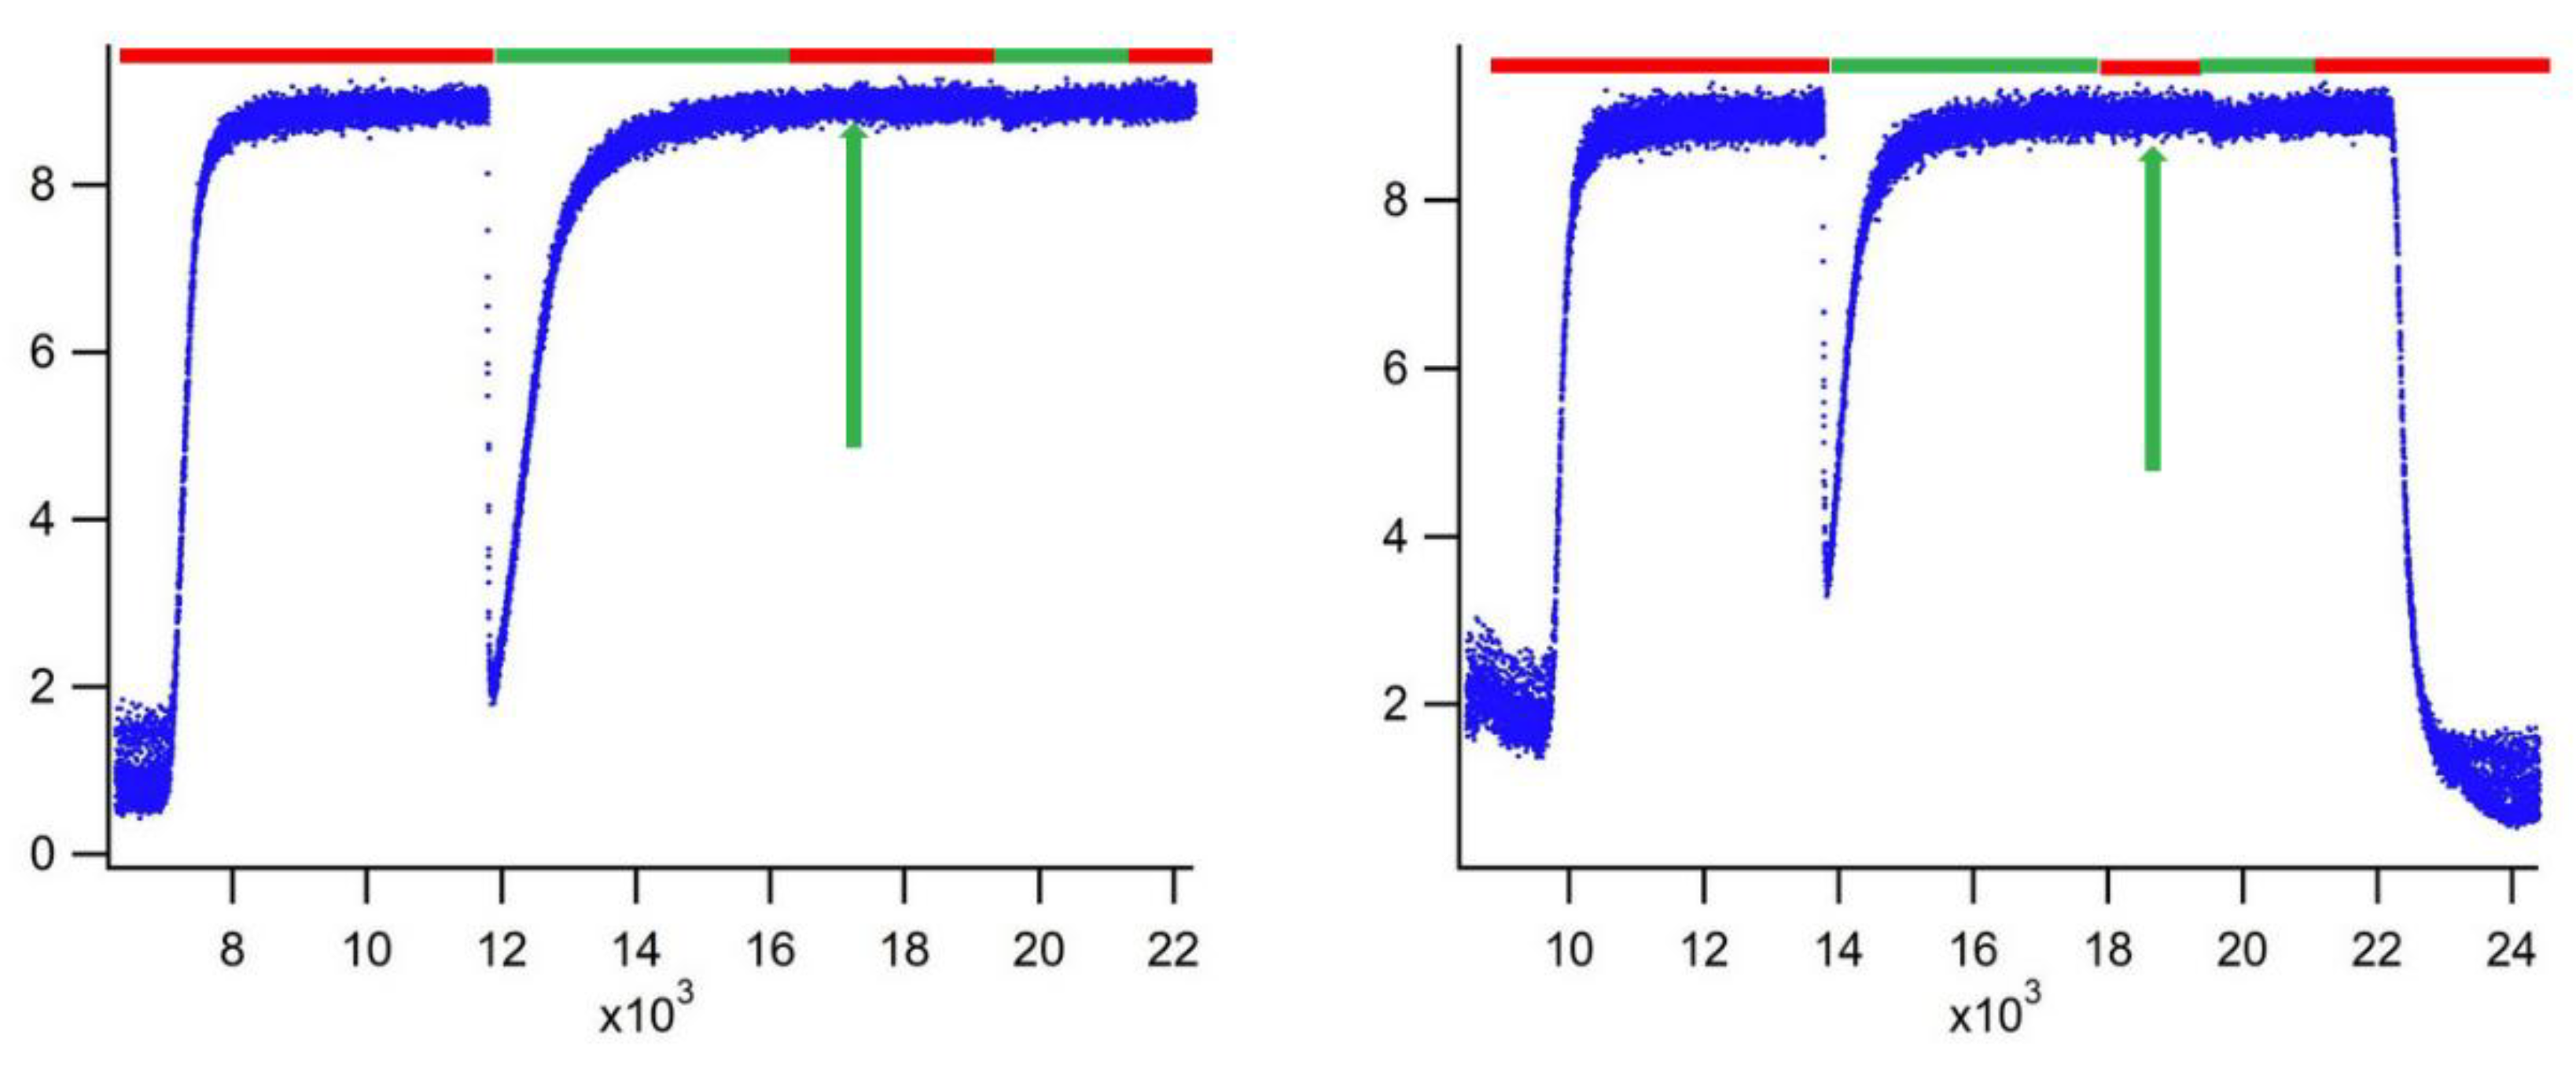

Table 1.
Summary Table of Probe Gas Uptake (first line for each sample, molecule cm-2) and fractional monolayer (second line) on tailored graphitized soot and amorphous carbon material including corrections for empty sample compartment (TMA, HA, TFA) g,i.
Table 1.
Summary Table of Probe Gas Uptake (first line for each sample, molecule cm-2) and fractional monolayer (second line) on tailored graphitized soot and amorphous carbon material including corrections for empty sample compartment (TMA, HA, TFA) g,i.
| SAMPLES → ↓ Probe Gases |
(#1) GTS6 Graphitized Thermal Soot (5.6 ± 0.3 m2/g) |
(#2) T900 Thermal Soot-commercial (6.5 ± 0.3 m2/g) |
(#3) GTS80 Graphitized Thermal Soot (79 ± 2 m2/g) | (#4) GTS80 + 4.88% (wt) BTCAh (79 ± 2 m2/g) |
|---|---|---|---|---|
| N(CH3)3 (TMA) a | 5.5 1011 1.5 10-3 |
None - |
8.8 1011 2.4 10-3 |
9.2 1013 0.52 |
| NH2OH (HA) b | 1.4 1013 7.8 10-2 |
2.9 1013 3.7 10-2 |
4.0 1012 5.1 10-3 |
2.9 1013 16.4 10-2 |
| HCl c | None - |
None - |
None - |
7.7 1011 4.4 10-3 |
| CF3COOH (TFA) d | 3.5 1012 8.9 10-3 |
1.3 1013 3.3 10-2 |
6.5 1012 1.6 10-2 |
5.8 1012 3.3 10-2 |
| NO2 e | 1.4 1013 1.9 10-2 |
2.1 1013 3.0 10-2 |
2.4 1012 4.7 10-3 |
1.1 1013 6.3 10-2 |
| O3 f | 7.3 1013 9.9 10-2 |
3.4 1014 0.46 |
6.6 1012 8.9 10-3 |
1.5 1013 8.5 10-2 |
a 1ML (molecular monolayer) corresponds to 3.6x10¹⁴ molecule cm-2 (probe for acidic sites). However, for sample #4 the 4.88% (wt) BTCA doping led to an (acidic) site density of 1.77 1014 cm-2 adsorbed BTCA molecules rather than 2.87 1014 cm-2 adsorption sites cm-2 for bare GTS80 given by an estimation for BTCA. b 1ML corresponds to 7.9x10¹⁴ molecule cm-2 (probe for surface/interfacial -OH functional groups). c 1ML corresponds to 8.6x10¹⁴ molecule cm-2 (probe for basic sites). d 1ML corresponds to 4.0x10¹⁴ molecule cm-2 (probe for basic sites). e 1ML corresponds to 7.1x10¹⁴ molecule cm-2 (probe for strongly reducing sites, NO2 being a weak oxidizer). f 1ML corresponds to 7.4x10¹⁴ molecule cm-2 (probe for all reducing sites, sum of weakly and strongly reducing sites, O3 being a strong oxidizer). g Uptake less than 1012 molecule cm-2 are not considered significant except for HCl. All values are obtained in the 1 mm diameter orifice of the KFR. First and second line in each data field display the absolute coverage (molecule/cm2) and the fractional coverage in terms of a monolayer of adsorbed probe gas, respectively (see footnotes a-f). h BTCA is Benzene-1,2,4-tricarboxylic acid or trimellitic acid. One ML corresponds to 2.87x10¹⁴ molecule cm-2 (upper limit) or 34.8 Å2 based on ρ = 1.7 ± 0.1 g cm-3 (estimate taken from URL: www.chemspider.com). However, assuming complete adsorption of a 4.88 % (wt) solution on GTS80 leads to a coverage of 1.77 1014 molecule/cm2 that was taken to normalize the absolute numbers of molecules taken up (displayed on the first line of each data field) that was taken to normalize the absolute numbers of molecules taken up (displayed on the first line of each data field).
Table 2.
Summary Table of initial Probe Gas Uptake Probability (Kinetics) γ0 on graphitized soot and amorphous carbon measured in the 1 mm orifice KFRa,e.
Table 2.
Summary Table of initial Probe Gas Uptake Probability (Kinetics) γ0 on graphitized soot and amorphous carbon measured in the 1 mm orifice KFRa,e.
| SAMPLES → ↓ Probe Gases |
(#1) GTS6 Graphitized Thermal Soot (5.6 ± 0.3 m2/g) |
(#2) T900 Thermal Soot Commercial (6.5 ± 0.3 m2/g) |
(#3) GTS80 Graphitized Thermal Soot (79 ± 2 m2/g) | (#4) GTS80 + 4.88% wt BTCA (79 ± 2 m2/g) |
|---|---|---|---|---|
| NO2 | 3.4 10-5 (s50#1) |
2.5 10-4 (s10#2; s40#2) |
- | 1.7 10-4 (s50#4) |
| O3 | 8.7 10-5 (s60#1) |
1.2 10-3 (s50#2) |
6.8 10-4 (s70#3) |
7.4 10-4 (s60#4) |
| NH2OH (HA) | 1.3 10-4 (s70#1) |
1.6 10-4 (s60#2) |
2.1 10-5 b,d (s50#3) |
8.1 10-5 b (s40#4) |
| CF3COOH (TFA) | - | 3.5 10-4 b (s30#2) |
- | - |
| N(CH3)3 (TMA) |
- | - | - | 2.9 10-4 c (s10#4) |
The numbering of the samples is explained in Table S2 as well as the complete inventory of performed uptake and kinetic experiments. a On the basis of a geometric surface area of the sample cup of 10.6 cm2. Small sample masses may lead to lower-limiting values for uptake (probability) coefficients in cases of insufficient sample coverage of sample cup. The number below the uptake probability indicates the experiment listed in Table S2. b Upper limiting value. c Lower limiting value (small sample mass (7.5 mg)). For samples s33#4 and s34#4 (sample mass of 27.6 mg) uptake values of γ0 of 3.7x10⁻³ and 1.5x10⁻³ have been measured, respectively. d Correction owing to NH2OH uptake onto MTSC + MT sample cup often represents approximately 50% of gross uptake. e Sample numbering system (see also in Table S2): type of soot sample is numbered #1 to #4. Original sample of soot #1 starts with a decadal running number (s10, s20, s30, etc.), each successive probe gas exposure of the same sample uses a consecutive running number within the same decade, such as s11, s12, s13, or s41, s42, s43 and so on.
Disclaimer/Publisher’s Note: The statements, opinions and data contained in all publications are solely those of the individual author(s) and contributor(s) and not of MDPI and/or the editor(s). MDPI and/or the editor(s) disclaim responsibility for any injury to people or property resulting from any ideas, methods, instructions or products referred to in the content. |
© 2025 by the authors. Licensee MDPI, Basel, Switzerland. This article is an open access article distributed under the terms and conditions of the Creative Commons Attribution (CC BY) license (http://creativecommons.org/licenses/by/4.0/).
Copyright: This open access article is published under a Creative Commons CC BY 4.0 license, which permit the free download, distribution, and reuse, provided that the author and preprint are cited in any reuse.


