
Submitted:
20 February 2025
Posted:
20 February 2025
You are already at the latest version
Abstract
Currently, the management and maintenance of space target catalogues primarily rely on multi-target survey telescope arrays. However, the matching processing of massive observational data poses significant challenges to traditional prediction methods. To address the issues of low matching success rates and prolonged computation times in traditional methods, this paper proposes a data starting point matching method based on multithreading technology. First, orbital elements from the catalogue library are extracted for two days before and after the observation moment. A set of orbital elements closest to the observation moment is filtered to form the first-level matching catalogue library, and a matching error threshold is set. Second, multithreaded traversal of the first-level catalogue library is performed to calculate observation residuals using an orbit prediction procedure. Orbital elements meeting the triple matching error threshold are selected to form the second-level catalogue library. Finally, the root mean square error (RMSE) of observation residuals for the entire data arc segment is computed point by point. The identification of orbital elements satisfying the matching threshold is identified as matching results based on the principle of optimality. Experimental results demonstrate that with a matching error threshold of 1°, the proposed method achieves an average matching success rate of 97.62% for data arc segments with nearly 10,000 passes per day over 8 consecutive days. In a target catalogue library containing an average of 25,720 targets, the method processes an average of 2,164 data arc segments per minute, improving matching efficiency by 115 times compared to traditional prediction methods.
Keywords:
optical data processing
; orbit prediction
; data matching
; multi-threaded technology
; space targets
1. Introduction
The surge in space activities and the rising incidence of space collisions and disintegrations have resulted in a dramatic increase in the number of space targets. As of October 2024, the National Aeronautics and Space Administration (NASA) catalogues 28,658 space targets, marking an increase of approximately 1,300 compared to the previous year [1]. The orbital parameters of these targets are in constant flux due to gravitational influences and various perturbative factors. Continuous observation is therefore required to accurately monitor their orbital characteristics and enhance space situational awareness. By obtaining precise positional information of space targets, effective management and cataloguing of these objects can be achieved. In recent years, space target patrol observations focused on airspace search have emerged as the primary method for cataloguing [2,3,4]. In the realm of photoelectric detection, users can ascertain information such as the two-dimensional positional coordinates of space targets traversing the telescope’s field of view, along with their luminosity. In the field of radar detection, information on the azimuth, pitch angle and slant range of space targets is obtained. However, when faced with multiple targets, these observational methods fall short in directly obtaining specific attributes such as identification, shape, material, and size of the space targets. To further utilize observational data, it is necessary to perform data matching and correlation operations on them.
The maintenance and establishment of cataloguing libraries hinge on effective matching and correlation of observations. In cataloguing efforts, two primary methods of matching and correlation are employed: first, matching observational data with known entries in the cataloguing library; and second, correlating observational data across different datasets [5]. When a data center collects vast amounts of data from diverse observation platforms (both space-based and ground-based) and various types (optical and radar), the initial step typically involves matching the observational data with catalogued targets to update the cataloguing library’s entries through orbit determination methods. This step is crucial for maintaining the integrity of the cataloguing library. The subsequent correlation step involves linking unsuccessfully matched data to identify segments of data arcs belonging to the same target. This process aims to consolidate these segments for orbital improvement, ultimately determining whether a target is newly discovered based on comprehensive assessment and validation. However, the initial orbit determination used in this second correlation method can significantly affect the accuracy of orbit solutions, often resulting in errors on the order of tens to hundreds of kilometers [6,7,8,9]. Such inaccuracies can lead to erroneous associations of data arc segments, complicating the processing of uncorrelated target data.
Given the variability in the number of orbital elements catalogued daily and the inconsistent update frequencies of each target, the massive data matching process is susceptible to issues such as data leakage and misdetection. These challenges can adversely impact matching success rates and diminish overall efficiency, particularly due to the diverse matching methodologies employed. This paper primarily addresses the success rate and efficiency of matching observational data with established cataloguing library. Wu [5] proposes a method that matches the time differences between observed data and known targets with the orbit surface difference sequence. This method achieves a correlation success rate up to 90%. However, some observed data still require initial orbit determination, and the parameters of two linear error sequences must be derived through robust estimation, complicating the computational process. Ding [10] and Lei [11] utilize observational data alongside Two-Line Element (TLE) data for matching, attaining success rates approximately 85% and 83%, respectively. Nevertheless, their research focus exclusively on low-orbit space targets and lacked comprehensive implementation strategies for cataloguing library extraction and target screening. Song [12] introduces an algorithm for associating targets in real-time geosynchronous orbit (GEO). This algorithm improves association rates in dense trajectory scenarios. However, it is limited by the types of observational data used. In addition, matching efficiency remains unaddressed in the above literature. Pastor [13] explores the generation of simulated radar data for known catalogued target tracks, correlating it with real measurement data, and concludes that this method offers a short computation time and effective correlation. Considering the nearly 30,000 known catalogued targets and the characteristics of extensive observational data, there is a pressing need to optimize the matching methods between observational data and known catalogued targets. This optimization is vital for rapidly enhancing spatial situational awareness capabilities and improving the cataloguing and maintenance of space targets.
In response to these challenges, this paper proposes a data starting point matching method based on multithreading technology to enhance both the success and efficiency of matching massive observational data with cataloguing library orbit elements. Effective extraction of cataloguing library elements is fundamental to achieving successful observational data matching and improving overall efficiency. On the one hand, multithreading technology is used to quickly traverse and process the cataloguing library elements. On the other hand, the number of secondary cataloguing library elements involved in the data arc comparison is controlled by limiting the observation residuals of the data starting point. The root mean square error (RMSE) of the observed residuals is calculated point by point over the entire data arc. Ultimately, the matching result is based on optimality principles. This method demonstrates high matching success rates and efficiency. It can handle large volumes of optical and radar data, facilitating the matching association between observational data and known targets. This makes it suitable for managing and maintaining space target cataloguing libraries.
The structure of this paper is organized as follows: Section 2 outlines the principles of data matching and introduces the multithreaded data starting point matching method, as well as the extraction principles of the orbital cataloguing library; Section 3 presents the experimental results; Section 4 offers an insightful analysis of the findings and outlines potential directions for future development; and Section 5 contains the conclusion of the paper.
2. Materials and Methods
2.1. Data Matching Principles
The publicly available database of the North American Aerospace Defense Command (NORAD) serves as the orbital cataloguing repository, with TLE (Two-Line Element) data released by NORAD being continuously updated on a daily basis via the Space-Track website. The corresponding orbital calculation model, SGP4/SDP4 (Simplified General Perturbation Version 4/Simplified Deep-space Perturbation Version 4) [14], is employed to predict the orbital state, which represents in the True Equator and Mean Equinox of date coordinate system (TEME), denoted as . For optical observations, the state vector derived from astronomical positioning data is referenced in the J2000 calendar year Mean Equator and Mean Equinox of date coordinate system. Accordingly, radar observations produce data in the station-centered coordinate system (East-North-Up, ENU), denoted as . The state vector of the station position is defined in the Earth-Centered Earth-Fixed (ECEF) coordinate system, represented as . When matching the observation data, it is essential to convert the TEME, ECEF and ENU coordinate systems to the J2000 coordinate system. The conversion relationship are expressed as follows [15,16]:
Among them, represents the rotation matrices by an angle counterclockwise about the -axis, which indicates that the nutation in longitude, and accounts for the true obliquity of the ecliptic. represents the polar motion correction matrix. is the earth rotation matrix. is the nutation correction matrix. is the precession correction matrix. is the coordinate system rotation matrix. The superscript indicates that the transpose of the transformation matrix. The parameters are defined as: for right ascension, for declination, for azimuth, for elevation, and for the slant range from the target to the station.
Unless specified otherwise, the following discussion assumes optical data as an example. Assuming that at the time of , the position vector of a space target, as calculated by the orbit prediction model and transformed into the J2000 coordinate system, is denoted as . The position vector of the station in the same coordinate system is represented as . Then, the position vector of the space target in the J2000 coordinate system, centered at the station , is given by:
The theoretical observation value of the space target at this moment is expressed as:
The observation residual for the observation is then calculated as:
The traditional prediction matching method [5] operates as follows: it sets a matching error threshold and traverses the elements of catalogued library by the orbit prediction procedure. This generates a set of orbital elements visible during the observation period from the station. The target’s motion direction is derived from the unit vector of the observation value, which is utilized to filter the set of orbital elements participating in the observation arc segment matching based on the consistency of motion direction. Subsequently, the RMSE of the observation residuals for the data points within the observation arc is computed, and the matching result is determined according to the principle of optimality.
2.2. Multi-threaded Data Starting Point Matching Methods
The primary factors influencing matching efficiency are the speed at which the cataloguing library elements are traversed and the number of matching targets participating in the observation arc segment. To address these factors, this paper proposes a multithreaded data starting point matching method.
Multithreading technology is a programming technique that enables programs to execute multiple threads simultaneously and is widely utilized in modern engineering applications [17]. Its core principles encompass the concepts of concurrency and parallelism. Concurrency refers to the interleaved execution of multiple threads within the same time frame, while parallelism involves the true simultaneous execution of multiple threads across multiple processors. Modern multi-core CPUs support parallel processing, significantly enhancing the efficiency of program execution. In this study, multithreaded parallel programming [18] is implemented under Windows 7 using Visual Studio 2019 with C++. During the traversal of all elements in the cataloguing library, multiple threads share the resources of the orbital elements, which can lead to data output contention and inconsistencies when matching the data starting point and performing point-by-point matching. To mitigate these issues, a synchronization mechanism (mutual exclusion locks) is employed to manage data storage and ensure thread safety.
Assuming that the number of space targets over the station is uniformly distributed across the base surface of the cone at a zenith distance of (see Figure 1). The unit vector of the observed data of the space targets at a given moment is denoted as . The base surface represents the number of matching targets within the observation arc, while is the angle between the cone’s axis and the unit vector of the starting point of the observation arc when the space target intersects the base surface. The angle between the unit vector of the starting point of the observation arc and the direction vector of the space target is used to determine whether the space target enters the base surface, denoted as . After performing a simple calculation, we can derive the relationship between these variables, presented as .
Due to , its size directly impacts the number of participating space targets matched in the observation arc segment, which is proportional to the square of and . To ensure applicability to the matching processing of target observation data with different orbital altitudes without the need to qualify . This paper employs a triple matching error threshold to control . If the number of system threads is , the calculation efficiency in the multithreaded data starting point matching method is proportional to both and . In the traditional prediction matching method, is set to 75°, while in the data starting point matching method, is reduced to 3°.
The proposed method improves on the traditional approach in two ways. First, it uses multithreaded processing to traverse the catalogue. Second, it removes the need to predict visible targets or check motion direction consistency. Instead, it leverages the observed value of the starting point of the data to compare with the theoretical value derived from orbital predictions. This method constrains the number of targets participating in the calculation of the data arc segments through the triple matching error threshold. Consequently, this approach significantly enhances matching efficiency.
2.3. Extraction of Elements for Orbital Cataloguing Library
In the process of matching observation data with the NORAD cataloguing database, the proper extraction of TLE data is crucial, serving as the foundation for enhancing both the matching success rate and efficiency. The extraction principles are as follows: the extracted TLE data should encompass a sufficiently large number of targets while simultaneously minimizing the time span of the data. When multiple sets of TLE data exist for the same target, the set with the release date closest to the observation data timestamp should be selected.
The published TLE data often contain anomalies or outlier values that must be eliminated prior to matching. The criteria for identifying outlier values [19] are based on the following: the product of the changes in the semi-major axis of the neighboring data points is negative, and the sum of these changes is small.
As an example, we utilize the TLE data published on the Space-Track website from September 1 to 30, 2024 [20]. Figure 2 illustrates the relationship between the number of targets included in the TLE data across different time spans, ranging from a single day to six days. The TLE data selection rule involves extracting data for half of the consecutive days both before and after the reference time, while counting the number of unique targets that do not appear repeatedly.
For the TLE data extracted over spans from one to six days, the average total number of targets over a period of 30 consecutive days are calculated. The growth rates of the number of targets are found to be as follows: 6.90%, 2.46%, 1.33%, 0.82%, and 0.59%.
While extracting TLE data over multiple days will undoubtedly increase the total number of included targets, it also leads to excessive computer reading time, thereby reducing matching efficiency. Moreover, once the matching success rate reaches a certain threshold, further increases in the total number of targets will not yield proportional benefits to the success rate. For targets with multiple sets of TLE data, failing to select the data set closest to the observation moment can adversely affect the matching success rate due to the propagation of orbit prediction errors.
Based on the aforementioned principles, Figure 3 presents the flowchart of the data starting point matching method utilizing multithreading techniques.
3. Experimental Results
In order to verify the matching success rate and timeliness of the aforementioned TLE data selection principles and the multithreaded data starting point matching method, we conduct experiments using a set of telescope observation data from the Jilin Astronomical Observation Base. The telescope parameters and specifications are detailed in Table 1. The computer hardware configuration includes an i7-4790 CPU running at 3.6 GHz with 4 cores and 8 threads, along with 24.0 GB of RAM.
Observations are conducted from September 21 to 28, 2024. A cooperative target captured during this period is selected to evaluate the measurement accuracy of the telescope using its CPF (Consolidated Prediction Format) ephemeris, which serves to verify the stability of the telescope's operational conditions, as shown in Table 2.
During the observation period, the measurement accuracy of the telescope for the Jason-3 satellite is assessed. According to Table 2, The RMSE in the direction of right ascension is 2.88″, the RMSE in the direction of declination is 2.84″, and the total RMSE is 4.03″. The results indicate that the telescope’s measurement accuracy is indeed stable. This level of accuracy is essential for conducting precise astronomical observations and demonstrates the telescope's effective performance during the measurement period. Such stability in measurement accuracy is crucial for ensuring successful matching with TLE data and enhances the overall quality of observational data.
Matching experiments are conducted on the TLE data spanning from a single day to six days based on the above observations, respectively, utilizing a multi-threaded data starting point approach with the matching threshold set to 1°. By analyzing the average matching success rate and efficiency of the observed data over an 8-day period, as shown in Figure 4, we establish a clear relationship between the number of days spanned by the TLE data and the effectiveness of the matching process. The calculations reveal that adjusting the time span of the TLE data directly influenced both the matching success rate and the processing time.
Figure 4(a) shows that as the number of days of TLE data span increases, the average matching time consumed and the matching success rate for processing each 10,000 passes of data increase. Figure 4(b) shows the variability of the matching time consumed and the matching success rate. The variability of matching time reaches its minimum when the cataloguing library has 4 days of TLE data. At this time, the variability of the matching success rate is close to zero.
The TLE database with a 4-day span is selected as the cataloguing library for matching. The total number of targets in the cataloguing library per day is presented in Table 3. The 8-day observation data are processed using the multithreaded data starting point method. The matching error threshold is set to 1°. The parameter controlling the number of matched targets in the participating data arcs is set to 1°, 3°, 5°, and 10°, respectively. The average matching success rate over the 8 days is plotted against the average matching time consumed per 10,000 passes of data processing, as shown in Figure 5. Additionally, the matching error threshold is set to 60″, 360″, 1800″, and 3600″, with the parameter set to 3°. The average matching success rate over the 8 days is again plotted against the average matching time consumed per 10,000 passes of data processing, as illustrated in Figure 6.
From Figure 5, it is observed that when the matching error threshold is set to 1°, increasing the value of the parameter leads to an increase in both the matching time consumed and the matching success rate for every 10,000 passes of data processed. Specifically, when the parameter changes from 1° to 3°, the matching time increases by only 0.1 seconds, while the matching success rate improves by 1%. However, as the parameter continues to increase, the matching time increases more significantly, while the improvement in the matching success rate diminishes.
As can be seen in Figure 6, when the parameter is set to 3°, the average matching time consumed for processing each 10,000 passes of data increases only slightly as the matching error threshold rises. However, the matching success rate increases substantially from 40.56% to 97.62%, indicating a significant improvement. This suggests that the parameter is a critical factor influencing the matching time consumed.
In summary, extracting TLE data spanning 4 days for observations with a matching error threshold set to 1° results in a better balance between matching efficiency and success rate when the parameter is set to 3°.
The above parameters are selected, and the 8-day observations are processed using both the traditional prediction method and the multi-threaded data starting point method, respectively. The matching time consumed is summarized in Table 4.
In processing the 8-day observation data, the results show a significant difference in efficiency between the traditional prediction matching method and the multithreaded data starting point matching method. Specifically, for the cataloguing library that contained an average of 25,720 space targets per day, the traditional method takes an average of 31,885.76 seconds to process every 10,000 passes of observation data. In contrast, the multithreaded approach dramatically reduces the processing time to just 277.19 seconds for the same amount of data. This represents an astonishing improvement, with the multithreaded method being 115 times faster than the traditional method. Such a reduction in processing time signifies a two-order of magnitude enhancement in data processing efficiency. This substantial improvement not only accelerates the matching process but also allows for more timely analysis and decision-making in observational astronomy, demonstrating the effectiveness of the multithreaded approach in handling large datasets efficiently.
For TLE data spanning 4 days, various extraction methods are evaluated to confirm the high matching success rate associated with selecting the set of elements closest to the observation moment as the primary matching cataloguing library. The methodology involves extracting the orbit elements at the first appearance of the target, as well as the orbit elements of the nearest release ephemeris relative to the observation moment. The results of this validation process are illustrated in Figure 7, which compares the data matching success rate and time consumed by different extraction methods over the 8-day observation period. The average matching success rate achieved with the orbit elements first appearance extraction method is 77.78%, accompanied by an average processing time of 287.32 seconds. In contrast, the extraction method proposed in this study demonstrates a significantly higher average matching success rate of 97.62%, while maintaining a slightly lower average time consumption of 277.19 seconds. This indicates that the proposed method not only enhances the matching success rate but also improves processing efficiency, thereby providing a more effective approach for TLE data extraction and matching in observational astronomy.
4. Discussion
The proposed multithreaded data starting point matching method demonstrates significant advancements in both efficiency and matching success rate for observation data processing. Compared to traditional prediction method, which rely on the consistency of movement direction and broad error thresholds, our approach achieves a 115-fold efficiency improvement while maintaining a 97.62% matching success rate under a stringent 1° error threshold. This significant improvement in performance can be attributed to two key innovations: (1) By selecting TLE data that is closest in time to the observation data point, the impact of orbit propagation errors is minimized, which enhances the success rate of matching. (2) The use of multi-threaded parallel computing technology increases the efficiency of catalog traversal. Additionally, by constraining the observation residual value at the data’s starting point, the number of targets involved in the full-arc calculation is effectively reduced. Thereby the matching efficiency is improved.
As shown in Table 5, our method outperforms existing approaches in both efficiency and applicability. For instance, Wu’s method [5] has a matching success rate of up to 90%, but it requires computationally intensive robust estimation and is complicated to operate. Ding’s method [10] reports 85% matching success rate for low-orbit targets, but omits the high-orbit targets validation. Lei’s method [11] reaches a matching success rate of 83.64%. In the above literature, there is no mention of how to select the TLE data for the same target. This is crucial for influencing the matching success rate.
The results suggest that a 4-day span of TLE data and provide the best compromise, where the balance between matching efficiency and success rate is achieved. This finding is consistent with the study by Song et al. [12], which reports that approximately 99% of GEO targets have orbital updates within a 4-day interval. By adjusting the parameter , the number of targets involved in the full arc calculation is significantly reduced. The smaller the value of the parameter , the less time the matching process requires. However, this results in a lower matching success rate (Figure 5). Similarly, a greater matching threshold leads to a higher matching success rate. However, once it reaches a certain point, further increases in the parameter will not result in additional increases in the matching success rate (Figure 6). Therefore, we recommend setting the matching threshold to 1° and the parameter to 3° to achieve optimal matching results.
Looking ahead, the exponential growth of space targets necessitates advanced data processing solutions. The multi-threaded data starting point matching method proposed in this study demonstrates strong potential as a pivotal tool for large-scale astronomical data processing. Given its computational efficiency, this method could be implemented as a dynamic-link library (DLL) and integrated into the astronomical positioning processing of the array telescope. Such integration would enable automated embedding of target attribute information (e.g., orbital parameters, identification codes) into observational data streams, significantly streamlining catalog management and cross-mission target recognition. Future research will focus on optimizing the algorithm’s real-time performance and enhancing its adaptability to various data processing scenarios, ensuring it remains effective in an evolving landscape of astronomical data.
5. Conclusions
The paper presents a matching method that utilizes a multi-threading technique based on the starting point of data, showcasing its advantages in large-scale data processing. The experimental results affirm the method’s effectiveness, particularly in achieving a balance between matching success rate and efficiency.
For optimal performance, it is recommended to select TLE data spanning 4 days as the cataloguing library for matching. The matching error threshold is set to 1°, and the parameter controlling the number of participating arc segment matching targets is set to 3°. By choosing a set of orbital elements that are closest to the observational data points, the method effectively mitigates the influence of orbital propagation errors, thereby enhancing the matching success rate. Additionally, by constraining the observation residual value at the data starting point, the method significantly reduces the number of entries that need to be processed in the second-level matching catalogue library. This strategic approach leads to a remarkable improvement in matching efficiency, achieving a performance that is two orders of magnitude greater than that of traditional prediction matching methods.
Author Contributions
Conceptualization, J.S. and C.F.; methodology, J.S.; software, J.S.; validation, J.S., C.F. and Z.L.; resources, Z.K.; data curation, J.S.; writing—original draft preparation, J.S.; writing—review and editing, C.F., and Z.L.; funding acquisition, Z.K. All authors have read and agreed to the published version of the manuscript.
Funding
This research was funded by Jilin Province and Chinese Academy of Sciences Cooperation Program (grant NO. 2023SYHZ0027) and Changchun City and Chinese Academy of Sciences Cooperation Program (grant NO. 23SH04).
Data Availability Statement
Not applicable.
Acknowledgments
We acknowledge and appreciate https://ilrs.gsfc.nasa.gov (accessed on 1 December 2024) for providing the CPF data, which are important accuracy evaluation data in this paper.
Conflicts of Interest
The authors declare no conflicts of interest.
References
- Orbital Debris Quarterly News. Available online: https://orbitaldebris.jsc.nasa.gov/quarterly-news (accessed on 11 December 2024).
- Wang, X. Optimization of strategy of space object of survey with electro-optical telescopes. J. Spacecr. TTC Technol. 2015, 34, 201–206. [Google Scholar]
- Li, M.; Ge, L.; Jiang, X. Research progress on observation scheduling system of telescope. Prog. Astron. 2019, 37, 455–468. [Google Scholar] [CrossRef]
- Tao, J.; Cao, Y.; Ding, M. Progress of space debris detection technology. Laser Optoelectron. Prog. 2022, 59, 1415010. [Google Scholar] [CrossRef]
- Wu, L. Orbit and Detection of Artificial Satellites and Space Debris, 2rd ed.; China Science and Technology Press: Beijing, China, 2011; pp. 250–253. [Google Scholar]
- DeMars, K.J.; Jah, M.K.; Schumacher, P.W. Initial orbit determination using short-arc angle and angle rate data. IEEE Trans. Aerosp. Electron. Syst. 2012, 48, 2628–2637. [Google Scholar] [CrossRef]
- Lei, X.; Li, Z.; Du, J.; et al. Identification of uncatalogued LEO space objects by a ground-based EO array. Adv. Space Res. 2021, 67, 350–359. [Google Scholar] [CrossRef]
- Pastor, A.; Sanjurjo-Rivo, M.; Escobar, D. Initial orbit determination methods for track-to-track association. Adv. Space Res. 2021, 68, 2677–2694. [Google Scholar] [CrossRef]
- Yin, Y.; Li, Z.; Liu, C.; et al. Improved initial orbit determination based on the Gooding method of low earth orbit space debris using space-based observations. Remote Sens. 2023, 15, 5217–5235. [Google Scholar] [CrossRef]
- Ding, Y.; Sun, M.; Li, Z.; et al. Observational data analysis of space objects with space debris photo-electric telescope array. Sci. Technol. Eng. 2019, 19, 25–31. [Google Scholar]
- Lei, X.; Sang, J.; Li, Z. Preliminary analysis of observations obtained from ground-based electro-optical sensor array at Changchun. J. Geomat. 2019, 44, 41–44. [Google Scholar] [CrossRef]
- Song, L.; Chen, D.; Tian, T.; et al. A real-time correlation algorithm for GEO targets based on radar ranging and velocity measurement. J. Beijing Univ. Aeronaut. Astronaut. 2023, 49, 2167–2175. [Google Scholar] [CrossRef]
- Pastor, A.; Escobar, D.; Sanjurjo, M.; et al. Data processing methods for catalogue build-up and maintenance. In Proceedings of the 1st NEO and Debris Detection Conference, ESA Space Safety Programme Office, Darmstadt, Germany; 2019. [Google Scholar]
- Vallado, D.; Crawford, P. SGP4 orbit determination. In Proceedings of the AIAA/AAS Astrodynamics Specialist Conference and Exhibit, Honolulu, HI, USA, 18–21 August 2008. [Google Scholar] [CrossRef]
- Li, J. Satellite Precision Orbit Determination, 1nd ed.; People’s Liberation Army Press: Beijing, China, 1995; pp. 26–36. [Google Scholar]
- Chen, L.; Han, L.; Bai, X.; et al. Orbital Dynamics and Error Analysis of Space Object; National Defense Industry Press: Beijing, China, 2010; pp. 20–25. [Google Scholar]
- Luo, B.; Fei, X. Study and application of multithread technology. J. Comput. Res. Dev. 2000, 37, 407–412. [Google Scholar]
- Josuttis, N.M. The C++ Standard Library: A Tutorial and Reference; Addison-Wesley: New York, NY, USA, 2012. [Google Scholar]
- Wang, R.; Liu, W.; Liu, S.; et al. An orbital anomaly analysis method based on TLE data. Chin. J. Space Sci. 2014, 34, 208–213. [Google Scholar] [CrossRef]
- The published TLE data. Available online: https://www.space-track.org/#resent (accessed on 1 December 2024).
Figure 1.
Schematic of the number of matching targets in the traditional prediction method and the multi-threaded data starting point method
Figure 1.
Schematic of the number of matching targets in the traditional prediction method and the multi-threaded data starting point method
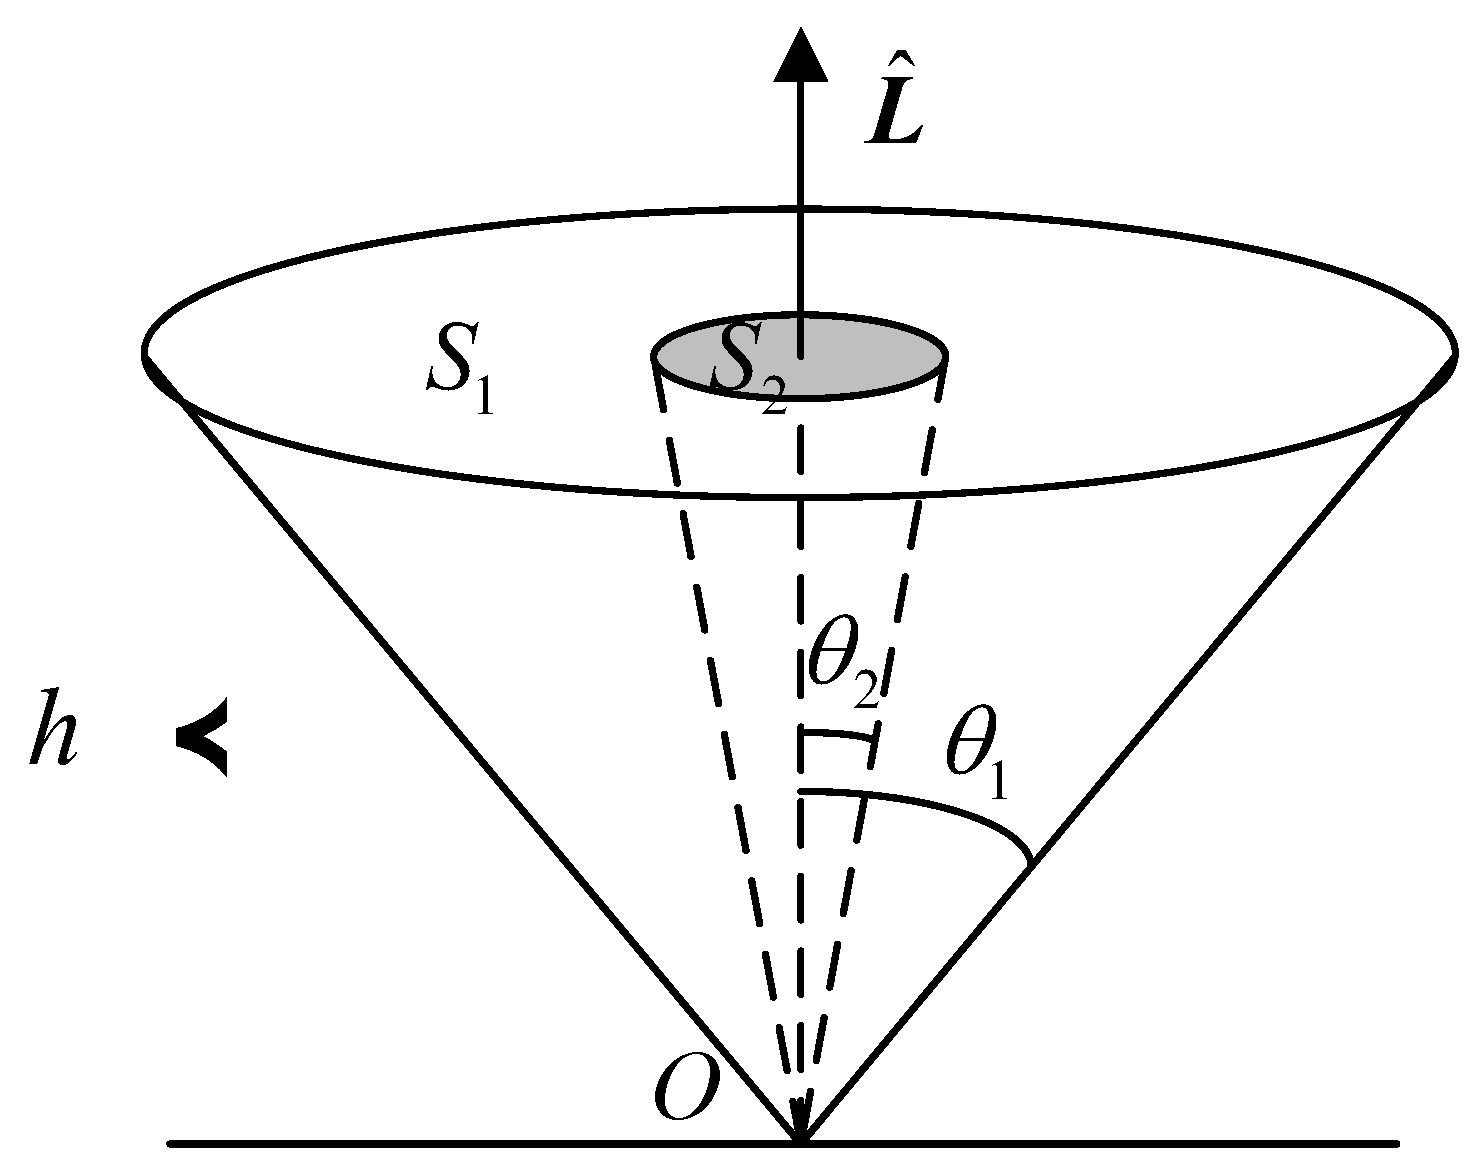
Figure 2.
Number of targets included in TLE data for varying spans of days.
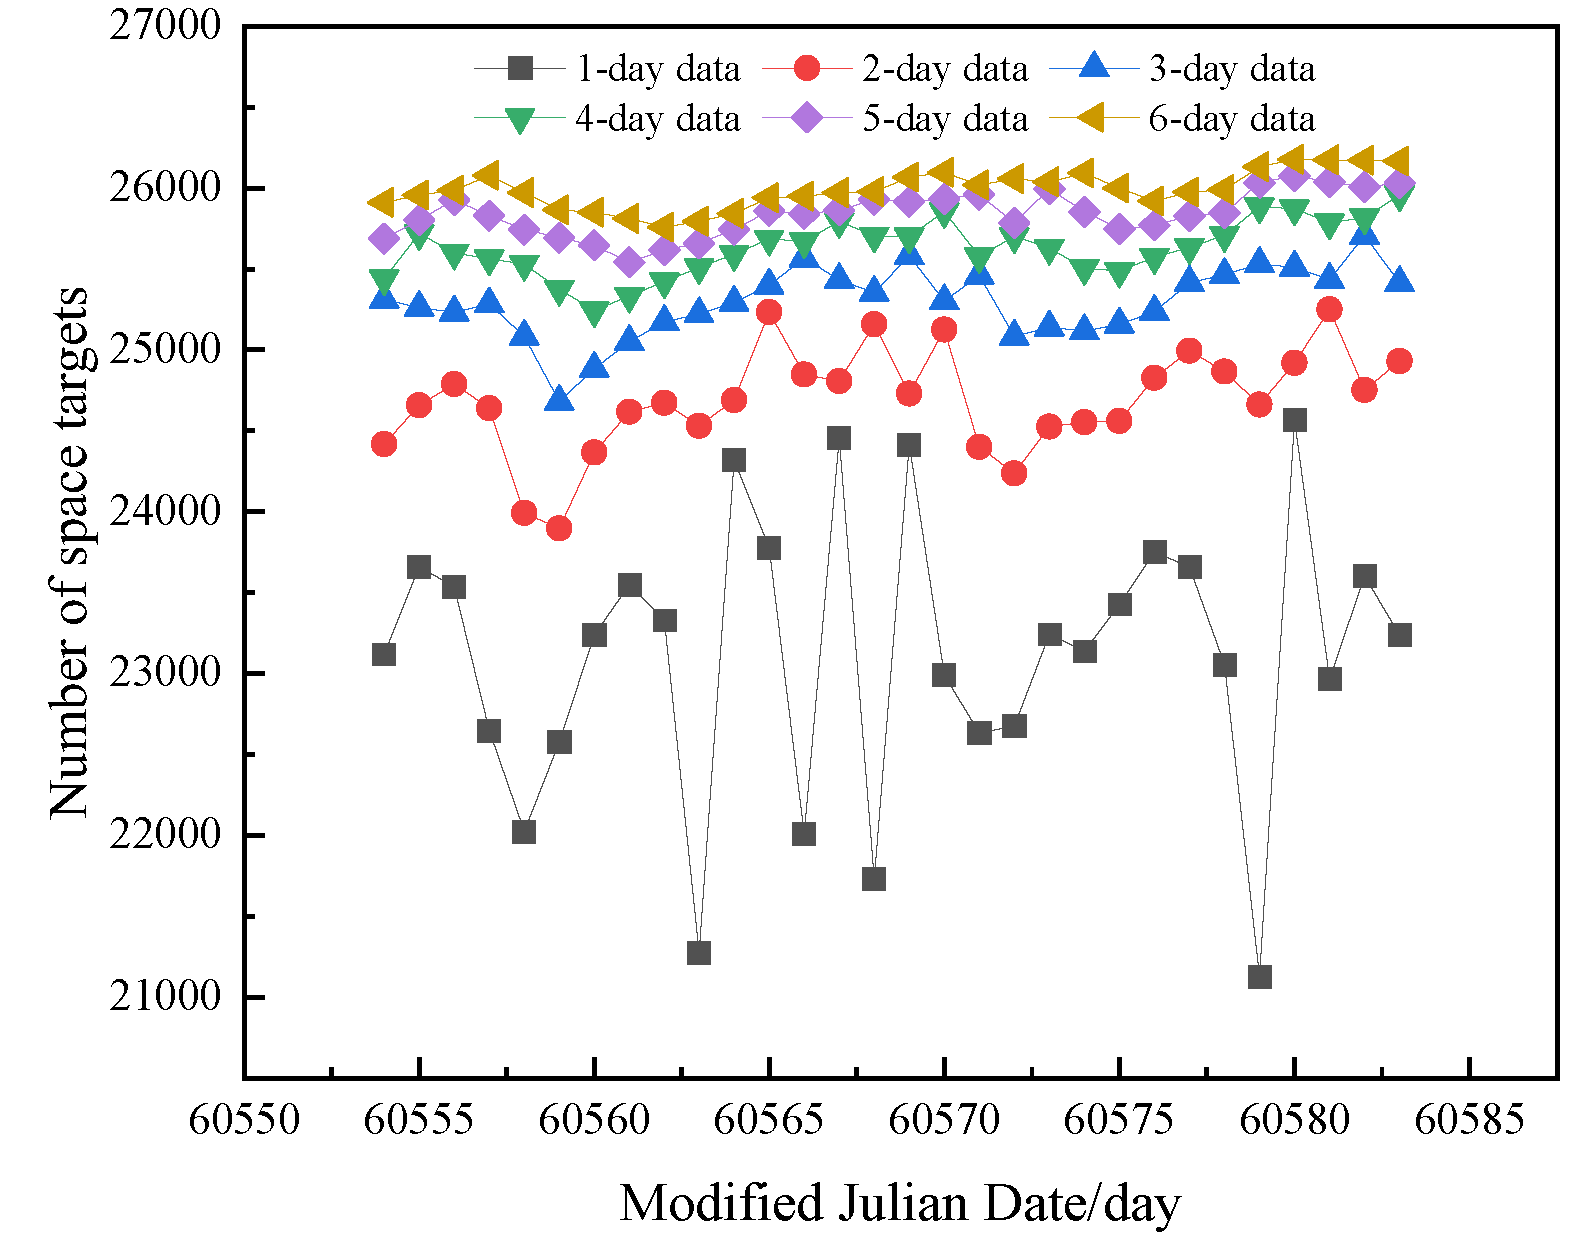
Figure 3.
Flowchart of data starting point matching method with multithreading techniques
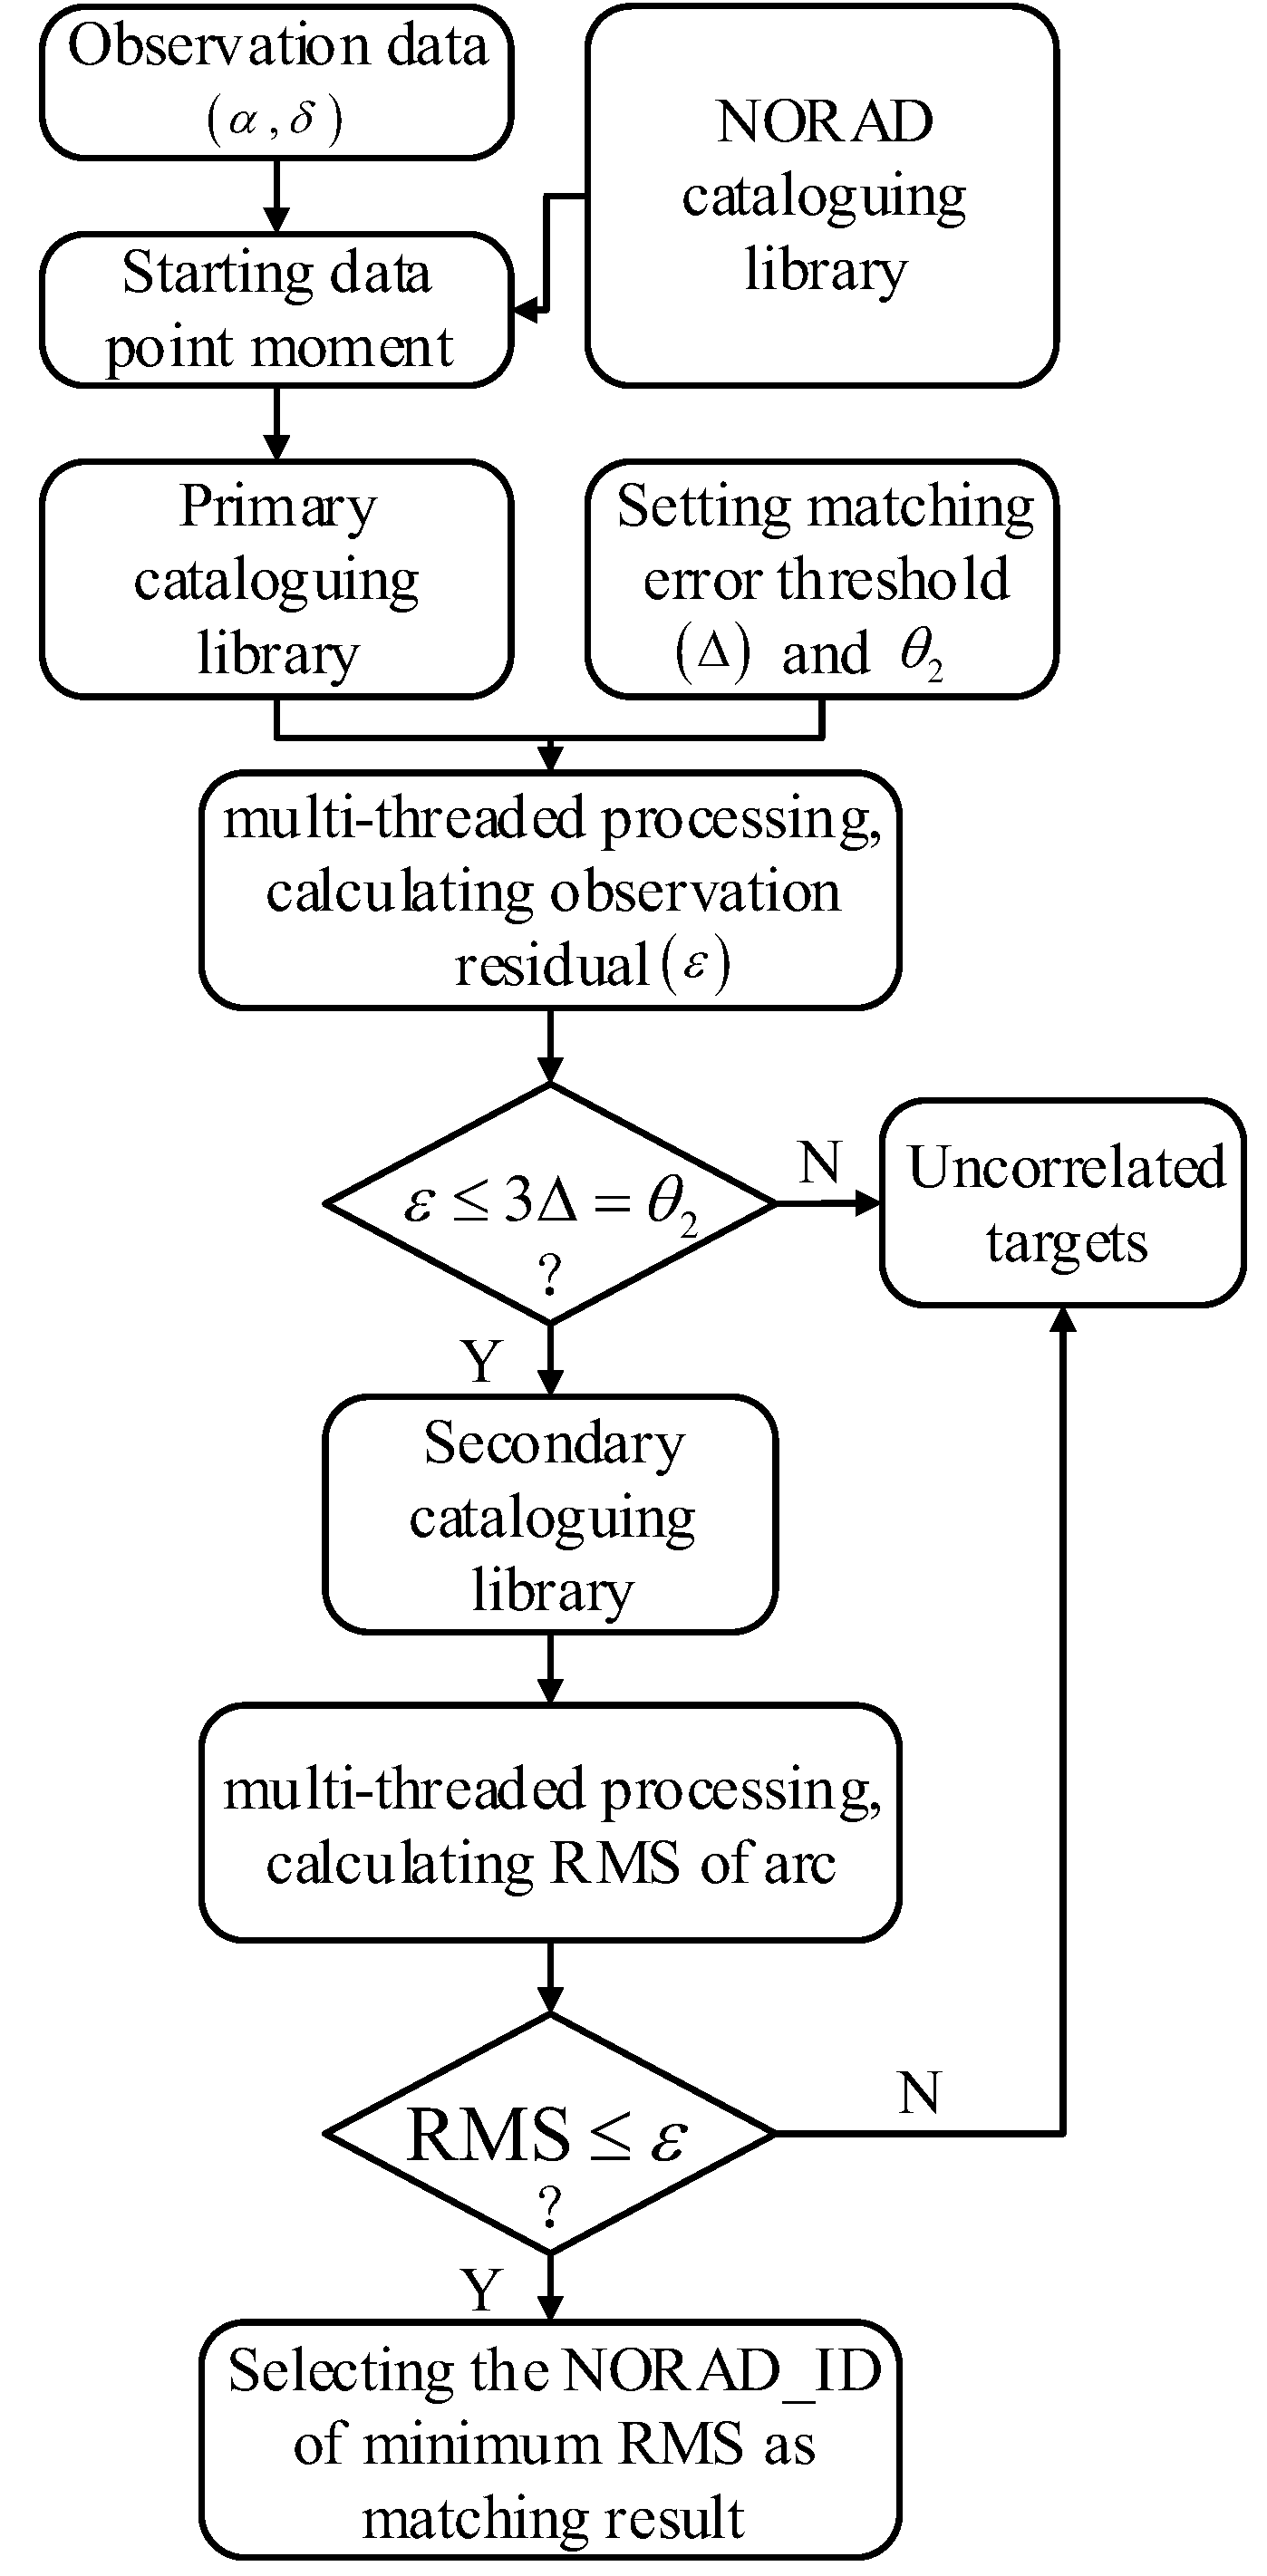
Figure 4.
(a) Time consumed and matching success rate for different TLE data spanning days; (b) Variation rate of time consumed and matching success rate in (a).
Figure 4.
(a) Time consumed and matching success rate for different TLE data spanning days; (b) Variation rate of time consumed and matching success rate in (a).
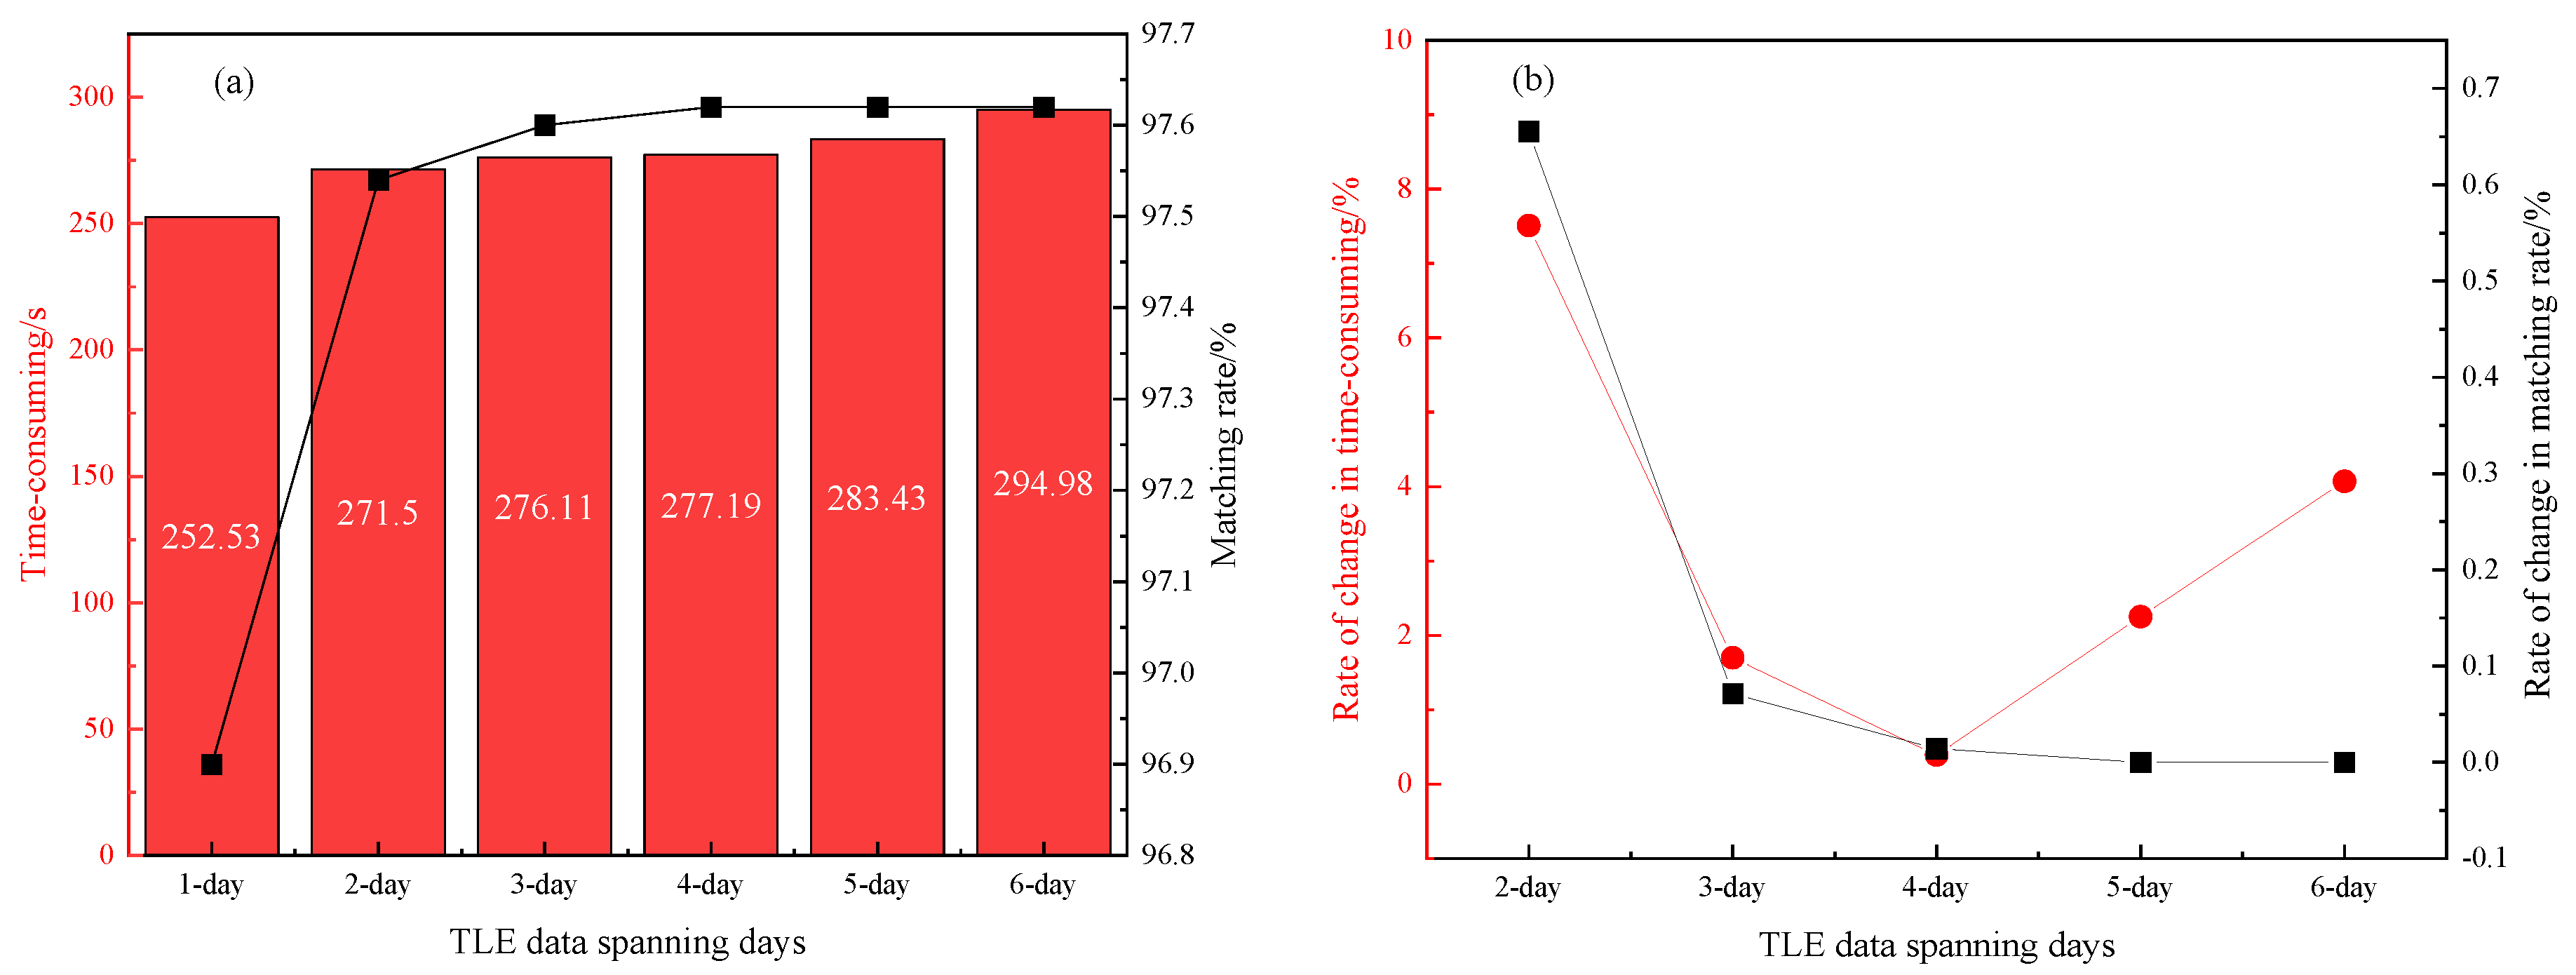
Figure 5.
Time consumed and matching success rate for different .
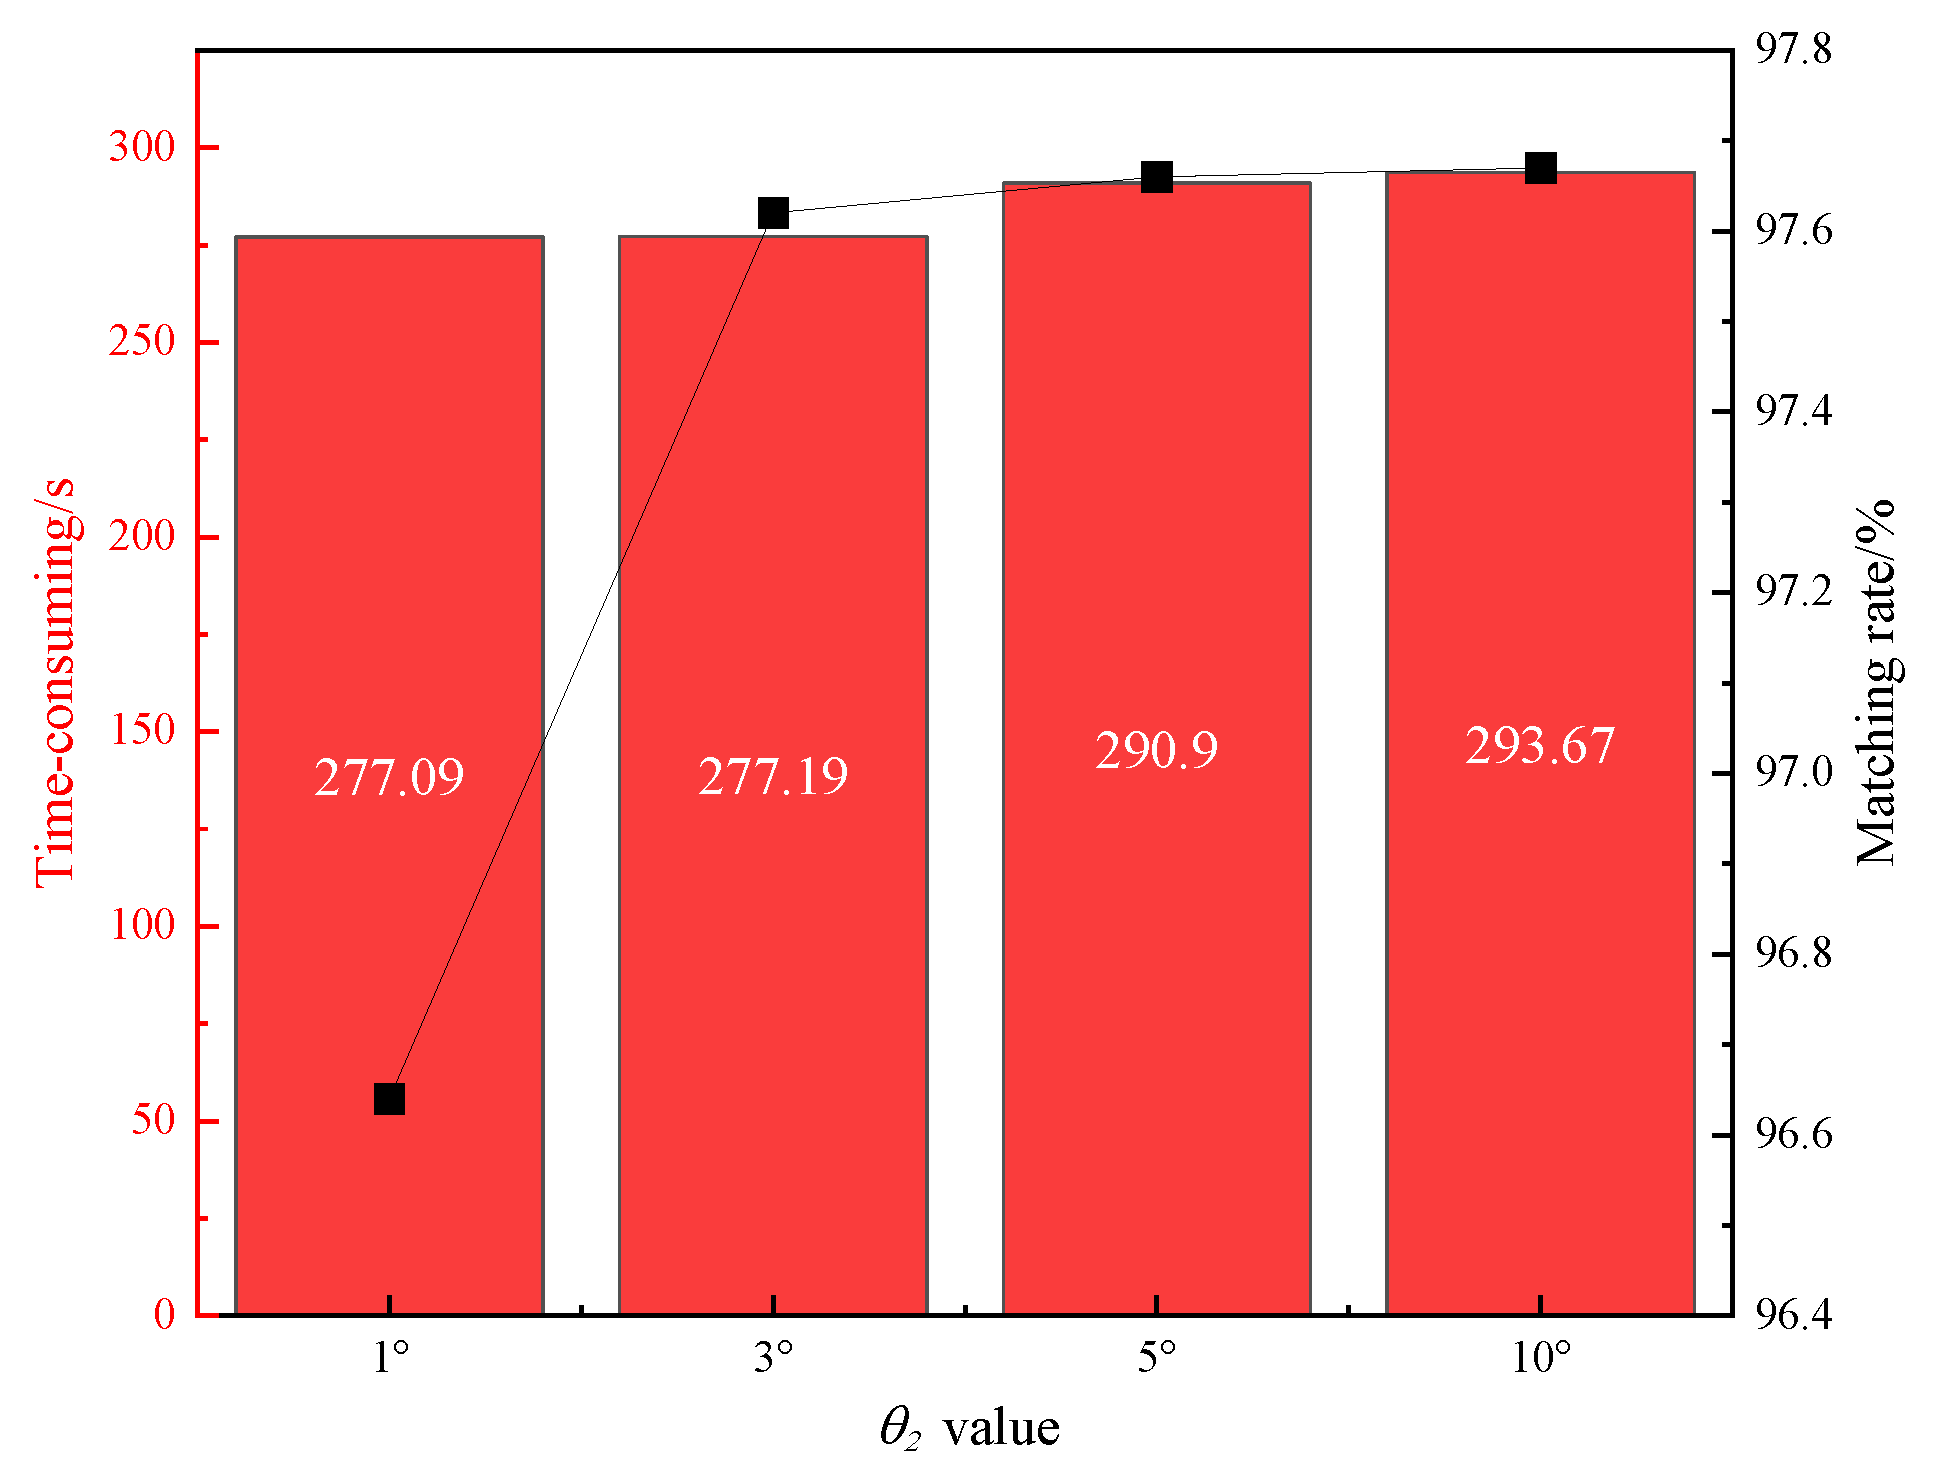
Figure 6.
Time consumed and matching rate for different matching error threshold.
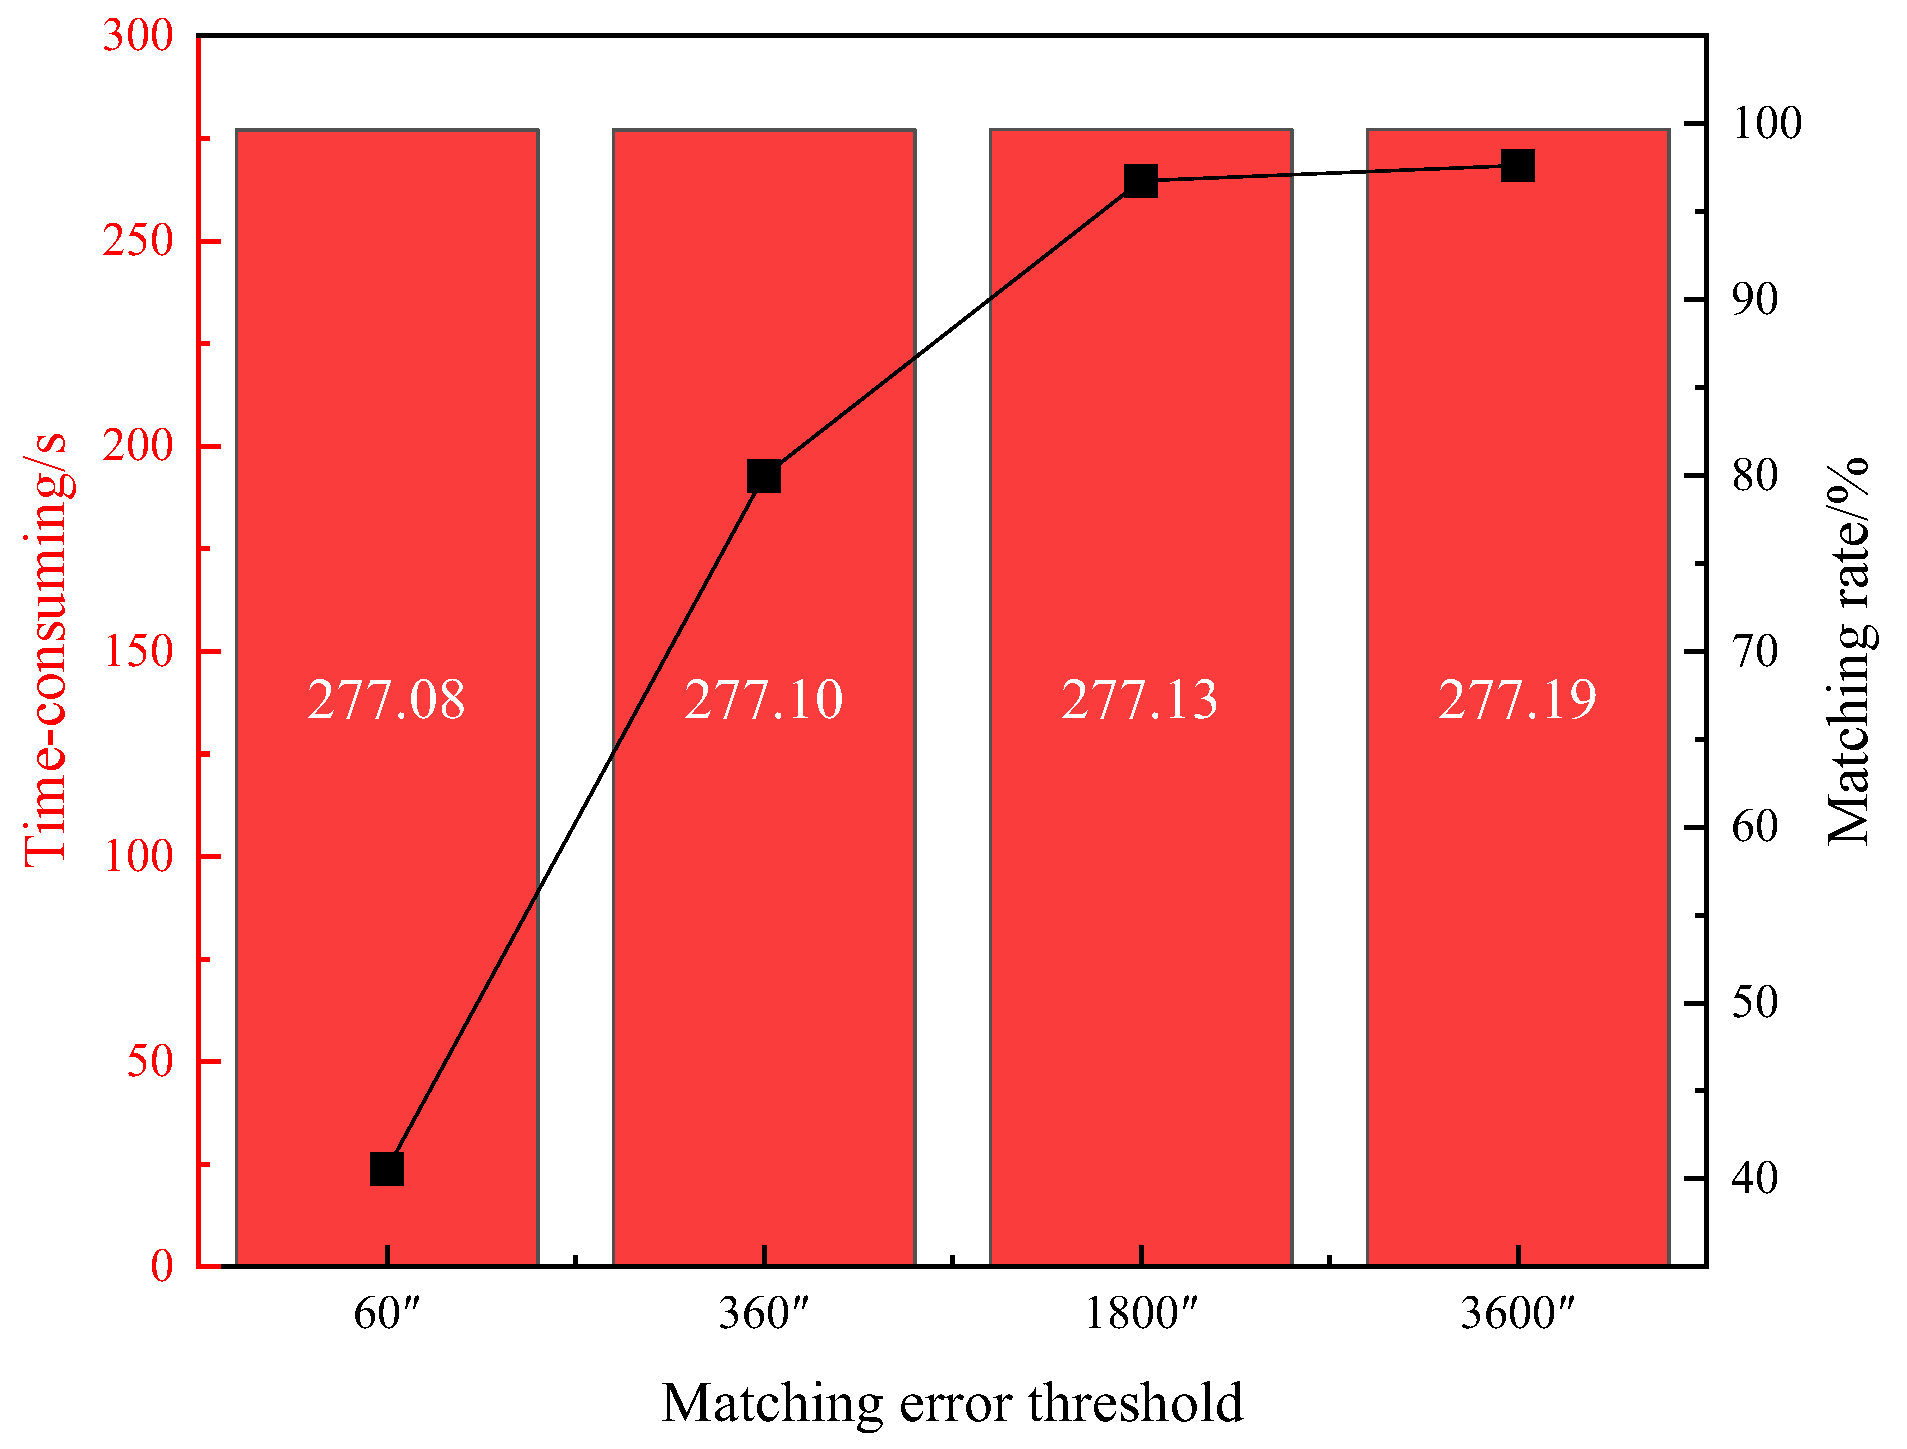
Figure 7.
Time-consuming and matching rate for different TLE data extraction methods.
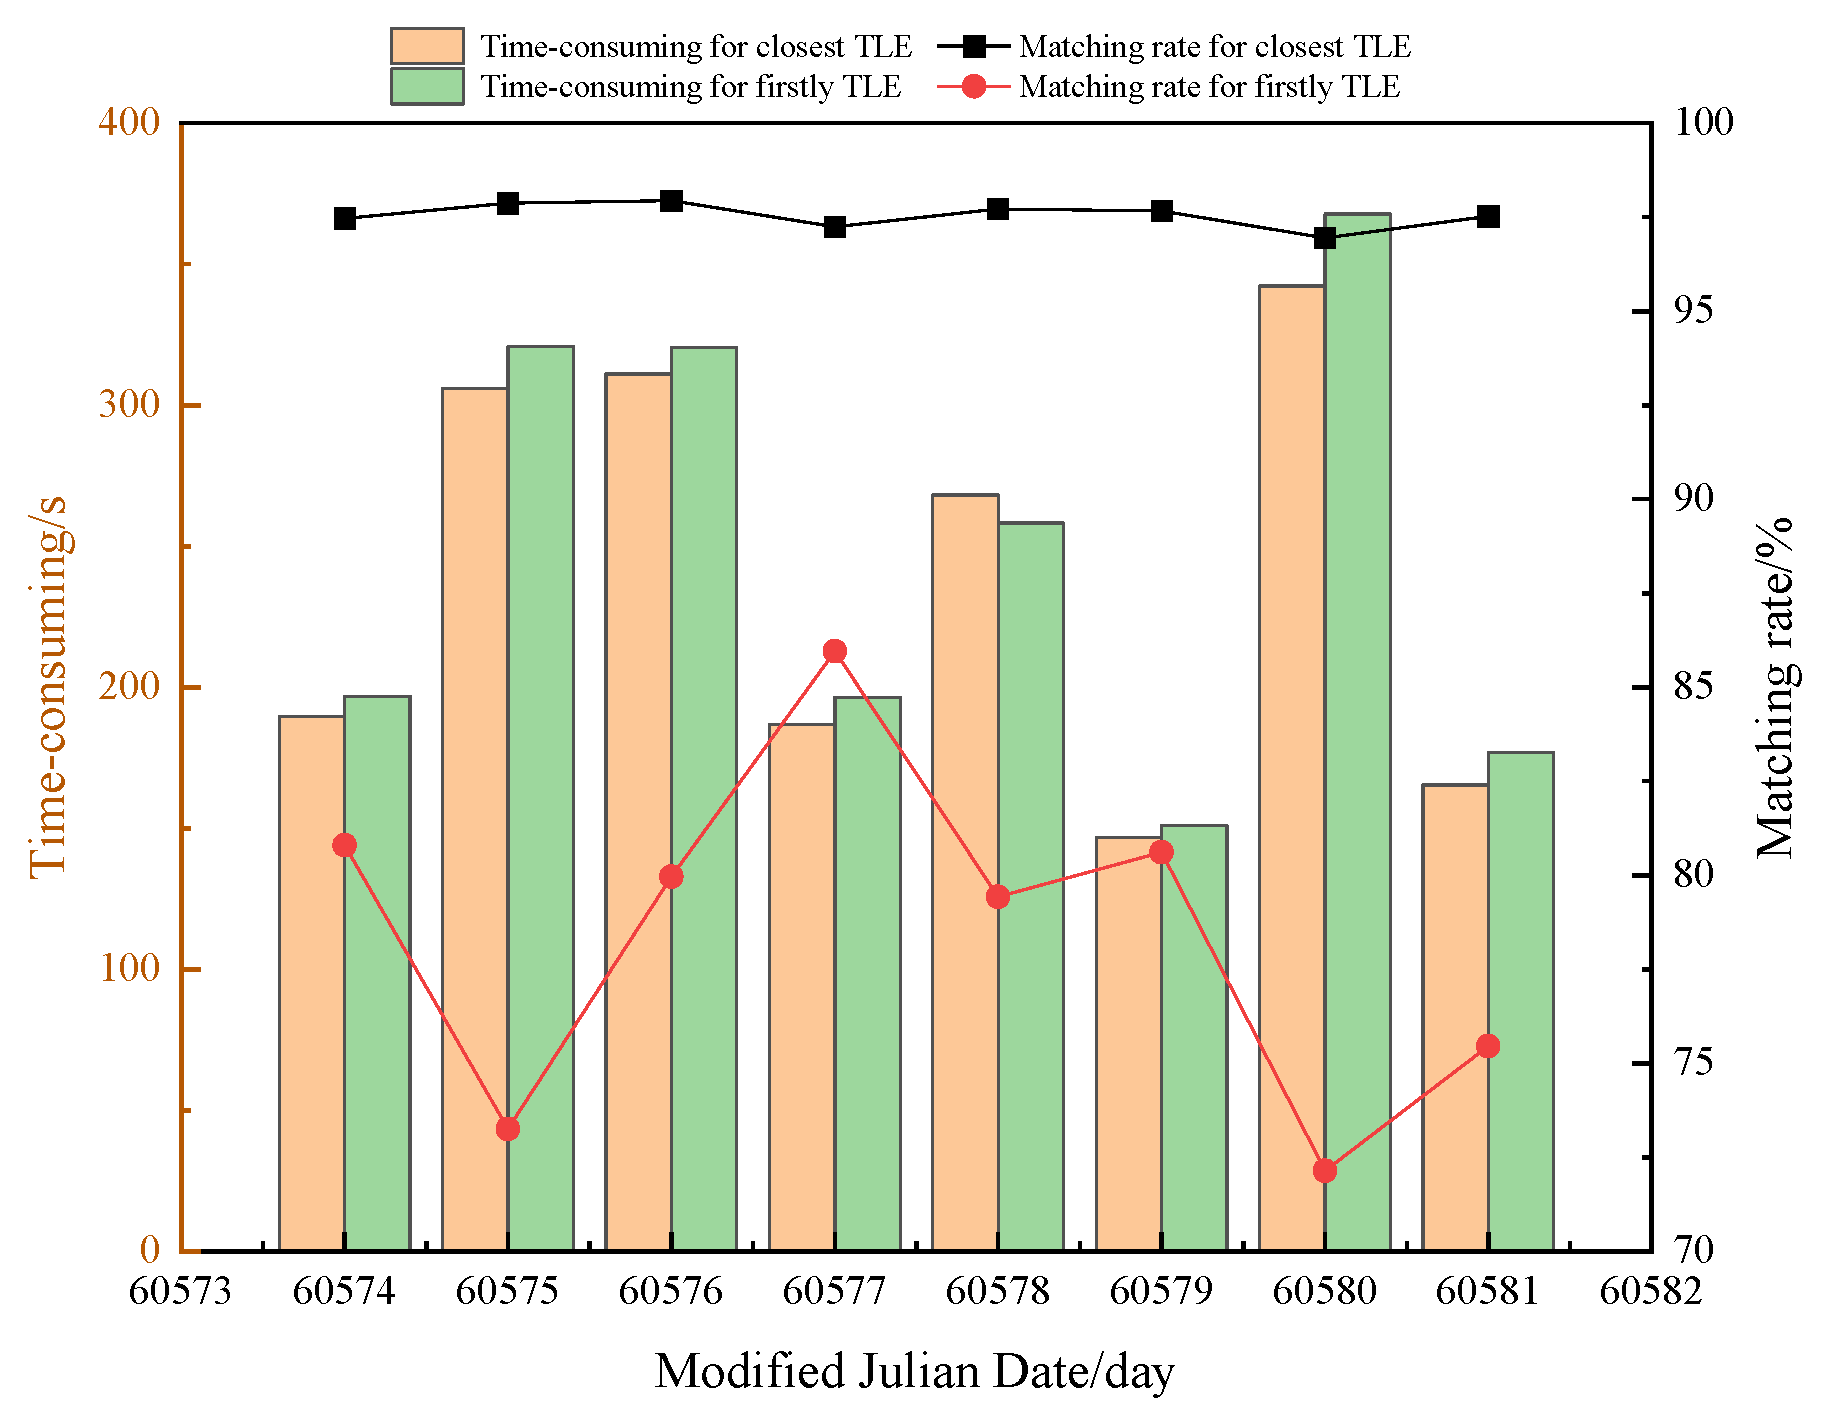

Table 1.
Technical parameters of the telescope.
| Parameters | Value |
|---|---|
| Monitoring region/deg2 | 1590 |
| Resolution of CCD | 3056×3056 |
| Pixel size/μm | 12 |
| Observation accuracy/(″) | Piror to 9 |
| Detection ability/mag | 10.5 |
Table 2.
Measurement accuracy assessment of Jason3 satellite.
| NORAD_ID | Observation Date | Arc Length/s | Altitude/km | RMS_Right Ascension/(″) | RMS_ Declination/(″) | RMS/(″) |
|---|---|---|---|---|---|---|
| 41240 | 2024-09-21 18:48:44.96 | 97.74 | 1336 | 2.59 | 3.01 | 3.97 |
| 41240 | 2024-09-22 17:14:54.97 | 135.54 | 1336 | 2.52 | 1.99 | 3.21 |
| 41240 | 2024-09-23 17:37:42.25 | 128.31 | 1336 | 3.18 | 2.58 | 4.10 |
| 41240 | 2024-09-24 18:00:50.89 | 92.17 | 1336 | 2.47 | 3.56 | 4.33 |
| 41240 | 2024-09-25 16:26:59.23 | 121.08 | 1336 | 2.73 | 2.39 | 3.63 |
| 41240 | 2024-09-27 17:12:17.93 | 126.51 | 1336 | 3.52 | 2.97 | 4.50 |
| 41240 | 2024-09-28 15:40:06.97 | 41.57 | 1336 | 2.97 | 3.12 | 4.31 |
Table 3.
Number of space targets included in TLE data spanning 4 days.
| Date | 09/21 | 09/22 | 09/23 | 09/24 | 09/25 | 09/26 | 09/27 | 09/28 |
| Numbers | 25488 | 25572 | 25634 | 25709 | 25885 | 25873 | 25786 | 25817 |
Table 4.
Comparison of time consumption of two matching methods.
| Date | Number of Observation Data/Pass | Time-Consuming/Second | |
|---|---|---|---|
| Traditional Prediction Matching Method | Multi-Threaded Data Starting Point Matching Method | ||
| 2024-09-21 | 7227 | 23054.69 | 193.27 |
| 2024-09-22 | 11735 | 36997.58 | 320.65 |
| 2024-09-23 | 11788 | 37869.85 | 326.78 |
| 2024-09-24 | 6993 | 22410.69 | 198.01 |
| 2024-09-25 | 9362 | 29662.66 | 260.06 |
| 2024-09-26 | 5488 | 17640.63 | 157.35 |
| 2024-09-27 | 13023 | 41896.62 | 359.78 |
| 2024-09-28 | 6147 | 19289.05 | 173.33 |
| 2024-09-21 | 7227 | 23054.69 | 193.27 |
Disclaimer/Publisher’s Note: The statements, opinions and data contained in all publications are solely those of the individual author(s) and contributor(s) and not of MDPI and/or the editor(s). MDPI and/or the editor(s) disclaim responsibility for any injury to people or property resulting from any ideas, methods, instructions or products referred to in the content. |
© 2025 by the authors. Licensee MDPI, Basel, Switzerland. This article is an open access article distributed under the terms and conditions of the Creative Commons Attribution (CC BY) license (https://creativecommons.org/licenses/by/4.0/).
Copyright: This open access article is published under a Creative Commons CC BY 4.0 license, which permit the free download, distribution, and reuse, provided that the author and preprint are cited in any reuse.


