Preprint
Article

This version is not peer-reviewed.

Epidemiology of West Nile Virus in New York City: Trends and Transmission Dynamics (2000–2019)

A peer-reviewed article of this preprint also exists.

Submitted:

20 February 2025

Posted:

21 February 2025

You are already at the latest version

Abstract

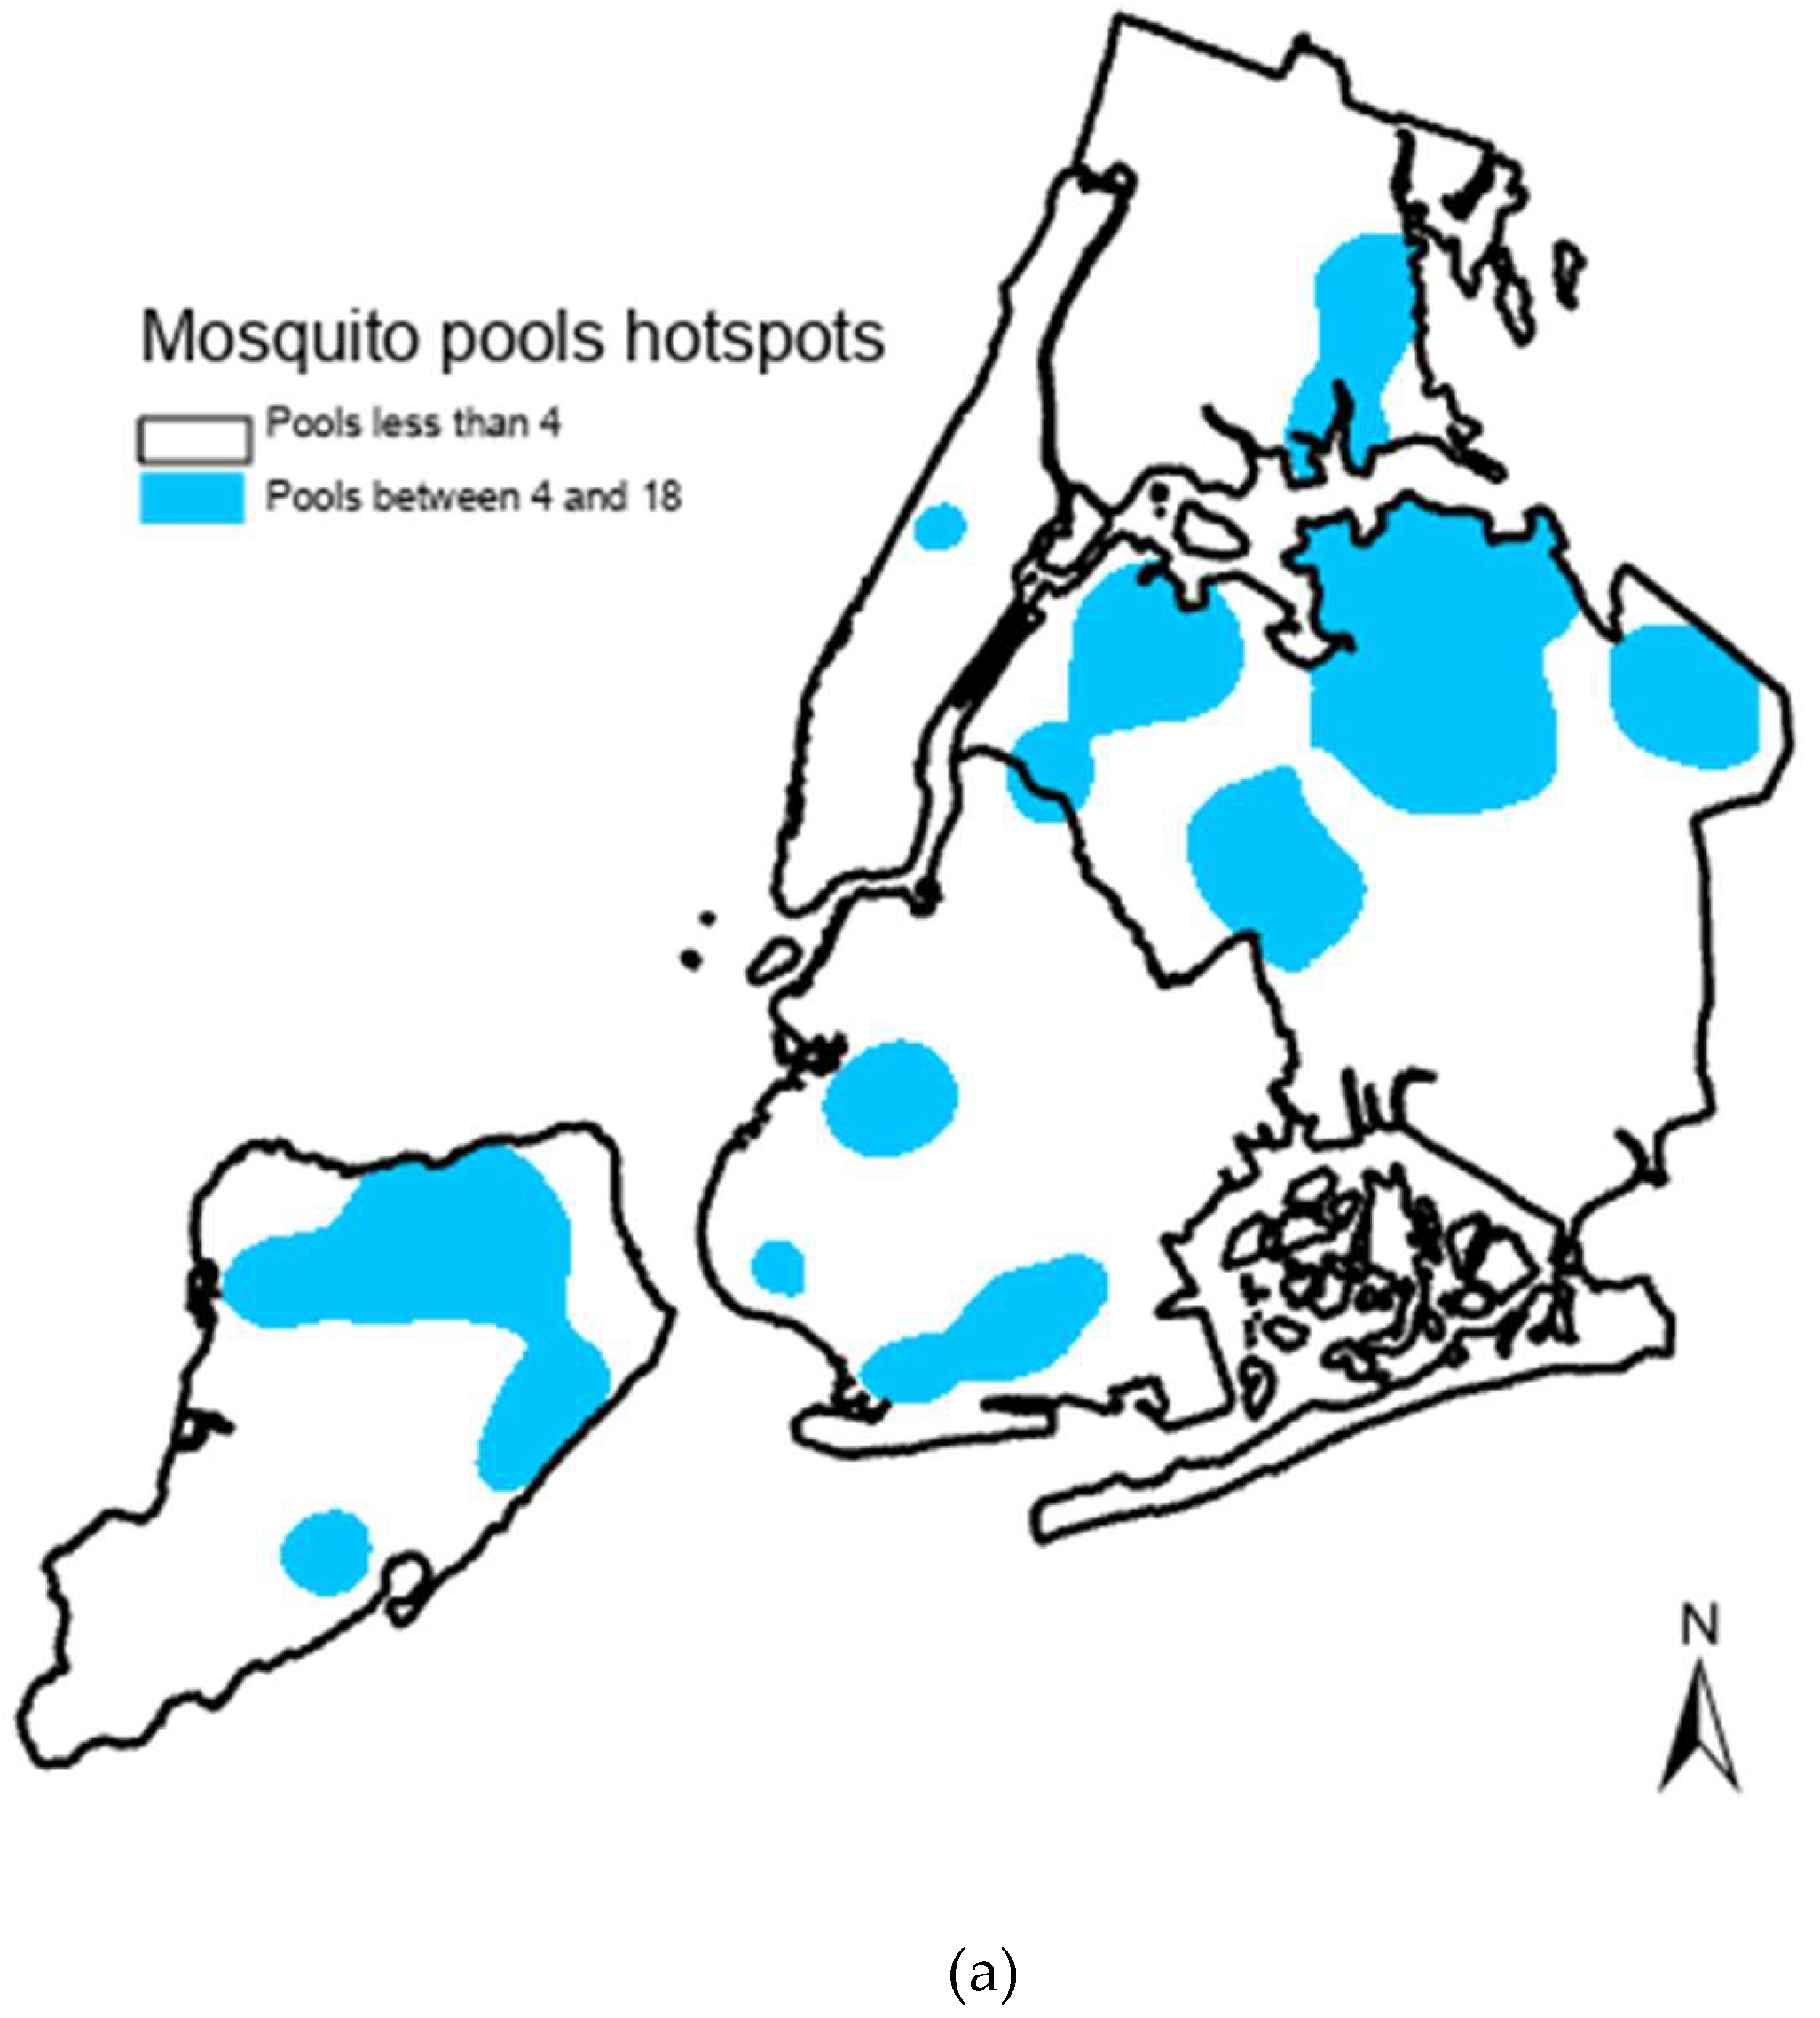
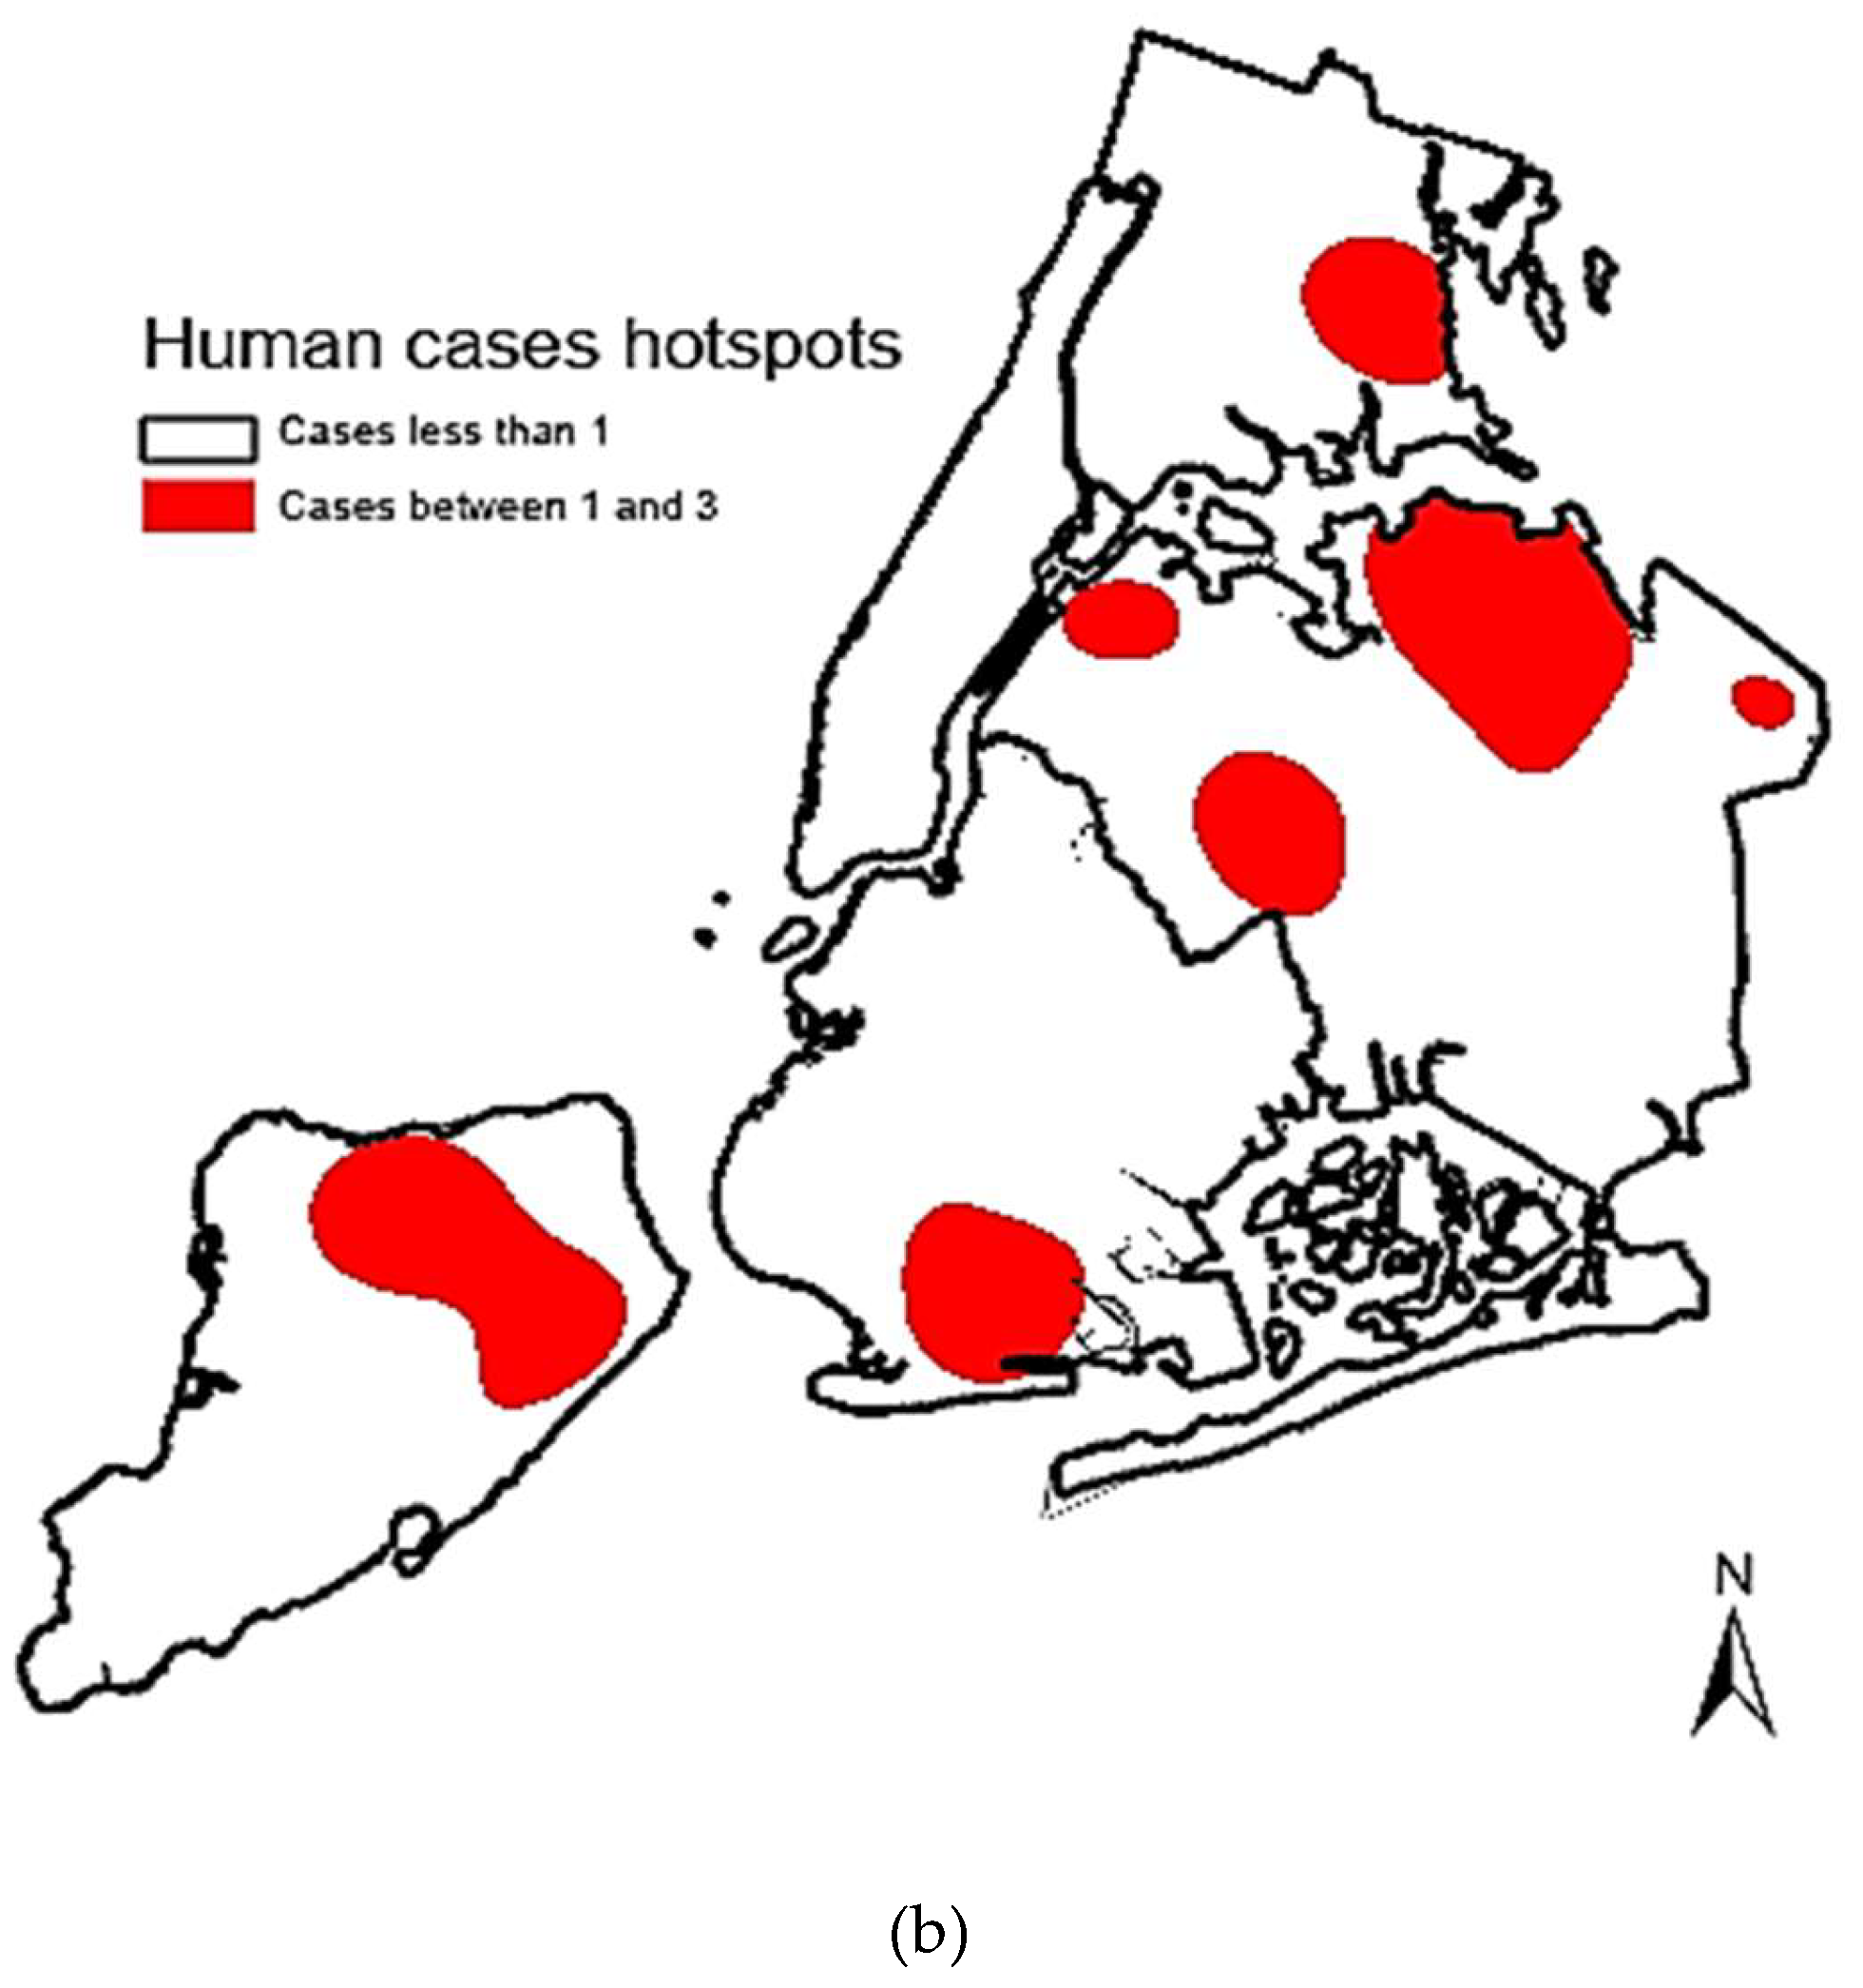
The 1999 West Nile Virus (WNV) outbreak in NYC marked the first introduction of the virus into the Western Hemisphere. This study examines two decades (2000-2019) of surveillance data, analyzing human cases (381 cases, 35 fatalities) and mosquito pools (6,632 positive pools). Findings highlight the dominant role of Culex species, particularly Cx. salinarius, in human transmission, with 69% of cases occurring near infected mosquito pools. Spatial analyses reveal transmission hotspots, emphasizing the importance of species-specific mosquito control. These insights contribute to refining urban vector management and public health strategies against WNV outbreaks.

Keywords: 
;  ;  ;  ;  ;  

Introduction

The 1999 West Nile virus (WNV) outbreak in New York City marked the virus's first introduction into the Western Hemisphere, leading to its rapid spread across North America [1,2,3]. Transmission dynamics have been influenced by factors such as climate change, urbanization, and habitat modifications affecting mosquito populations [3,4,5,6]. Rising temperatures and urban heat islands may be extending mosquito breeding seasons, thereby increasing WNV transmission rates [7]. Additionally, genetic studies suggest that ongoing viral evolution could impact mosquito infectivity and disease severity [8]. Given its significant public health impact—resulting in thousands of cases and hundreds of fatalities—WNV has been extensively studied [3,9]. Beyond mosquito bites, transmission has also been reported through blood transfusions and organ transplants, underscoring the need for continued surveillance [10].
Initially, dead bird reports served as early indicators of WNV activity [11]. However, due to logistical challenges such as delays and costs, many states transitioned to mosquito surveillance, with a particular focus on feeding behavior, as a more effective early detection method [3,11]. Despite extensive research examining climatic and landscape factors influencing WNV incidence, consistent patterns remain difficult to establish due to geographic and temporal variations in vector ecology [12,13,14,15,16].
From 1999 to 2019, the New York City Department of Health and Mental Hygiene (DOHMH) conducted extensive WNV surveillance, monitoring human cases, mosquito populations, and environmental conditions affecting transmission [17]. Given the persistent public health burden of WNV, continued epidemiological assessments remain essential. This study synthesizes two decades of data to analyze WNV epidemiology in an urban setting, with a focus on mosquito species dynamics and disease ecology [18,19,20,21].

2. Materials and Methods

2.1. Study Area

This study was conducted in New York City (NYC), a densely populated urban environment comprising five boroughs: Manhattan, Brooklyn, Queens, the Bronx, and Staten Island. With a population exceeding 8 million, NYC provides a unique setting for studying urban mosquito-borne disease dynamics due to its diverse landscapes, including highly urbanized areas, parks, wetlands, and stormwater retention basins. These varied habitats support multiple mosquito species that play a role in the transmission of West Nile virus (WNV).

2.2. Surveillance and Data Collection

Following the 1999 outbreak, DOHMH established extensive mosquito surveillance programs across the five boroughs of NYC. Between 2000 and 2019, 381 human WNV cases were recorded alongside 6,632 positive mosquito pools.
2.3:. Mosquito Sampling and Identification
Mosquitoes were collected weekly from May to October at 52–71 permanent trap sites, supplemented by an additional 200 sites annually in areas where WNV-positive mosquito pools had been detected. While permanent sites remained active throughout the mosquito season, supplemental sites were used temporarily. Collected mosquitoes were identified to species, and up to 50 individuals of the same species from a single site were grouped into pools for WNV testing at the DOHMH Public Health Laboratory.

2.4. Statistical and Spatial Analysis

To examine correlations between human WNV cases and infected mosquito pools, Pearson correlation coefficients were computed using SAS Enterprise Guide 7.1, with statistical significance set at p<0.05. Cases with incomplete data (e.g., missing onset dates or addresses) were excluded from statistical analysis. Further tests analyzed Cx. pipiens, Cx. restuans, and Cx. salinarius pools located within a 2-mile radius of human cases (5 miles for Cx. salinarius), collected within 10 days of symptom onset. Pools from less abundant mosquito species were also cross-referenced with human cases occurring in the same time frame.
Geographic Information System (GIS) tools (ArcMap v10.6.1) were employed for spatial analysis, identifying high-risk transmission zones through kernel density estimation. Flight range parameters for mosquito species were based on documented literature [22].

2.5. Ethical Considerations

This study was conducted as part of routine public health surveillance by the DOHMH. All patient data were anonymized before analysis. Ethical review and informed consent were not required, as the study involved retrospective analysis of de-identified public health surveillance data.

3. Results

Between 2000 and 2019, the New York City Department of Health and Mental Hygiene (DOHMH) recorded 381 human cases of West Nile Virus (WNV), comprising 66 instances of West Nile Fever and 315 cases of West Nile Neuroinvasive Disease, with 35 fatalities. Concurrent mosquito surveillance detected 6,632 WNV-positive pools, with Culex pipiens and Culex restuans accounting for 91.36% of positive samples, while Culex salinarius constituted 6.12%.
Pearson correlation analyses established a statistically significant association between human WNV cases and the presence of infected mosquito pools (r=0.22, p<0.05). Of the total positive mosquito pools, 986 were linked to human infections: 708 belonged to Cx. pipiens and Cx. restuans, 251 to Cx. salinarius, and 27 to other species. Despite being less abundant, Cx. salinarius showed a disproportionately strong correlation with human infections, contributing to 60.9% of human-associated mosquito pools, compared to 11.7% for Cx. pipiens and Cx. restuans (Table 2).
Table 1. Surveillance of West Nile virus in human being and mosquitoes in NYC, 2000-2019.

Year
Human Cases Classification Number of positive mosquito pools Pools associated with human cases ***
Human Cases Confirmed Local human cases * Human cases with positive mosquito pools within a 5-mile radius** Cx. pipiens & Cx. restuans Cx. salinarius Other species Total positive pools Cx. pipiens & Cx. restuans Cx. salinarius Other species Total associated positives pools
2000 14 10 9 105 32 28 165 12 21 5 38
2001 9 5 3 210 24 9 243 9 0 0 9
2002 29 21 8 151 35 13 199 18 23 0 41
2003 32 25 22 234 35 8 277 40 33 0 73
2004 5 1 0 148 10 26 184 0 0 0 0
2005 14 13 9 119 3 0 122 17 3 0 20
2006 12 12 9 167 15 14 196 43 11 3 57
2007 18 17 4 159 12 3 174 9 0 0 9
2008 15 15 8 182 9 6 197 15 3 1 19
2009 3 2 0 39 1 0 40 0 0 0 0
2010 42 41 34 375 18 0 393 108 19 0 127
2011 11 11 7 170 9 2 181 11 9 1 21
2012 41 40 24 288 24 0 312 40 17 0 57
2013 10 9 3 236 11 2 249 6 1 2 9
2014 15 14 13 350 12 9 371 32 4 1 37
2015 38 32 26 789 32 6 827 158 31 3 192
2016 6 6 4 280 2 0 282 6 0 0 6
2017 21 20 13 759 24 3 786 49 9 0 58
2018 36 34 31 928 69 27 1,024 119 53 11 183
2019 10 10 6 370 35 5 410 16 14 0 30
Total 381 338 233 6,059 412 161 6,632 708 251 27 986
*Human cases: Includes only those originating in NYC and categorized as definite, likely, or possible. Cases excluded are those with unknown or unlikely sources, no onset date, or no address. **Mosquito pools: Includes all pools collected within 10 days prior to the onset dates of human cases. Each pool consists of groups of mosquitoes tested for WNV, with fewer than 50 mosquitoes per group. ***Spatial considerations: For Cx. pipiens and Cx. restuans, pools within a 2-mile radius were analyzed. For Cx. salinarius, pools within a 5-mile radius were included. For other species, a 2-mile radius was used for short-distance flyers, and a 5-mile radius for long-distance flyers.
Table 2. Analysis of Mosquito Species Associated with Human Cases
Characteristic Cx. pipiens and Cx. restuans Cx. salinarius Other Species
Mosquito pools associated with human cases 708 251 27
Percentage of all positive pools for each species (%) 11.69% 60.92% 16.77%
Number of human cases associated 193 124 21
Human cases with only one positive mosquito species 106 38 2
Average distance to human cases (miles) 1.25 3.22 2.47
Percentage of mosquito pools associated with human cases within 1 mile (%) 22.21% 1.62% 0.61%
Percentage within 1–2 miles (%) 49.59% 2.33% 0.91%
Percentage within 2–5 miles (%) 0 21.5% 1.22%
Further spatial analysis identified persistent WNV transmission hotspots in northern Staten Island, southern Brooklyn, northwestern and northeastern Queens, and parts of the eastern Bronx (Figure 1). These regions exhibited significant overlap between human cases and positive mosquito pools, highlighting the need for targeted vector control strategies in high-risk urban zones.
Pearson correlation coefficients for each mosquito species further reinforced these findings, with values of 0.87 for Cx. pipiens and Cx. restuans, 0.78 for Cx. salinarius, and 0.89 when considering all positive mosquito species combined. While Cx. pipiens and Cx. restuans were found to be the dominant vectors due to their prevalence in WNV-positive pools, the data suggest that Cx. salinarius plays a critical role in transmission despite its lower numbers.

4. Discussion

Culex species in New York City exhibit distinct behavioral adaptations compared to their counterparts in rural and suburban areas, largely influenced by urban ecological factors such as limited wildlife hosts, high human density, and fragmented green spaces. In NYC, Cx. pipiens and Cx. restuans show significant anthropophilic tendencies, with over 25% of their blood meals sourced from humans [17]. This contrasts with nonurban environments, where these species primarily feed on avian hosts, sustaining the WNV enzootic cycle [18,23,24,25,26].
Among the Culex species in NYC, Cx. salinarius stands out due to its even greater preference for human hosts—approximately 30% higher than Cx. pipiens and Cx. restuans combined [17]. Despite its lower abundance, Cx. salinarius plays a critical role in WNV transmission, acting as a bridge vector between birds and humans. This species’ heightened anthropophilic behavior increases the likelihood of spillover events and urban outbreaks [5,23,24,25,26].
Spatial analyses and blood meal studies confirm Cx. salinarius as disproportionately responsible for human infections, despite representing only 6.12% of all WNV-positive mosquito pools. Notably, it accounted for 60.92% of pools associated with human cases, whereas Cx. pipiens and Cx. restuans contributed just 11.69% (see Table 2). These findings align with recent research by Clark et al. (2024), reinforcing the idea that Cx. salinarius plays a more substantial role in urban transmission than previously recognized [27].
While Cx. pipiens and Cx. restuans exhibited a strong correlation with human cases (Pearson correlation coefficient: 0.87, p<0.01), largely due to their dominance in WNV-positive pools (91.4% of total pools) and widespread presence in NYC [1], Cx. salinarius displayed a more localized but equally significant correlation (Pearson correlation coefficient: 0.78, p<0.01). This relationship remained evident even when restricting analysis to pools collected within species-specific flight ranges (approximately 5 miles for Cx. salinarius) and within 10 days preceding human case onset. These findings highlight the species’ unique role as a high-risk vector [28,29], particularly in dense urban areas with limited avian hosts [17].
Persistent transmission hotspots in northern Staten Island, southern Brooklyn, northeastern Queens, northwestern Queens, and parts of the eastern Bronx (Figure 1) further emphasize the need for targeted interventions. These areas provide favorable breeding conditions, such as stormwater retention basins, and proximity to green spaces or wetlands, supporting large mosquito populations. High densities of Cx. pipiens and Cx. restuans contribute to sustained transmission cycles, while the emergence of Cx. salinarius in these hotspots demonstrates its adaptive feeding behavior in urban landscapes [23,24].
In peak years like 2018, mosquito pools reached a record high of 1,024, while human WNV cases totaled 36. That year, hotspot areas in Queens and Staten Island exhibited significant overlap between human cases and mosquito activity, underscoring the importance of focusing vector control efforts in these locations. Across the study period (2000–2019), a total of 986 mosquito pools were associated with human cases, including 708 pools of Cx. pipiens and Cx. restuans, 251 pools of Cx. salinarius, and 27 pools of other species. These results suggest that vector surveillance should not only monitor mosquito abundance but also track species composition, as Cx. salinarius poses a disproportionate risk for human infections.
These findings carry important implications for public health strategies. The strong human-feeding preference of Cx. salinarius, combined with its presence in high-risk urban zones, suggests that control efforts should specifically target this species. Integrating spatial mapping with biological data can help optimize vector control interventions, particularly in hotspot areas during peak transmission periods [25,26]. The ability of Cx. pipiens and Cx. restuans to thrive in urban environments further reinforces the need for long-term surveillance and environmental modifications, such as eliminating standing water in stormwater basins and maintaining green spaces, which often serve as breeding sites [17,25,30].
Despite these insights, further research is needed to explore the ecological and behavioral adaptations of urban Culex populations. Investigating seasonal shifts in host preference, overwintering behavior, and species-specific breeding patterns could provide a deeper understanding of their role in disease transmission. Additionally, examining the effects of climate variability and anthropogenic landscape changes on mosquito populations will be crucial for developing long-term strategies to mitigate WNV and other vector-borne diseases [14,29].
Given the persistent nature of WNV transmission in NYC, Integrated Vector Management (IVM) programs must be adapted to urban ecological conditions. Strengthening public health infrastructure, enhancing mosquito surveillance, and fostering community engagement will be critical in mitigating WNV risks and addressing the emergence of other mosquito-borne diseases such as chikungunya, dengue, and Zika [30].
The record-high WNV activity observed in NYC in 2018—nearly two decades after its initial emergence—suggests that climate change, including prolonged mosquito breeding seasons and urban heat island effects, is intensifying transmission risks. Rising temperatures and increased heat retention in cities create optimal conditions for mosquito survival and viral amplification, extending transmission periods and heightening the potential for large-scale outbreaks [7].
Beyond environmental factors, viral evolution remains a significant concern in WNV epidemiology. Genetic analyses suggest that WNV strains continue to evolve, potentially enhancing mosquito infectivity and transmission efficiency [8]. This evolution may contribute to the virus’s ability to persist in urban settings and influence disease severity in human hosts [8]. Certain genetic variants could be better suited for transmission by urban mosquito populations, partially explaining the continued outbreaks in NYC. However, debate remains regarding the extent to which genetic mutations impact transmission dynamics. While some researchers argue that evolving strains may lead to increased virulence or altered host preferences, others believe that environmental and ecological factors play a more substantial role. Future studies should prioritize genomic surveillance to assess whether emerging WNV variants exhibit higher virulence or vector competence. Understanding these evolutionary patterns will help refine public health strategies and anticipate shifts in disease transmission.
Incorporating climate-based risk assessments into vector surveillance and control programs is essential. The combined effects of climate change and viral evolution demand adaptive mosquito management strategies that account for shifting vector habitats, extended transmission periods, and the emergence of new viral strains. Proactive measures such as predictive modeling of outbreak patterns and early intervention strategies will be vital in mitigating future WNV risks in NYC and other metropolitan regions.
Ultimately, these findings underscore the importance of a comprehensive, multidisciplinary approach to WNV mitigation. As urban landscapes evolve, integrating ecological, climatic, and genomic surveillance with targeted mosquito control measures will be crucial in reducing WNV-related morbidity and mortality in high-risk populations.

5. Conclusions

The resurgence of WNV activity in New York City between 2010 and 2019 underscores the complexity of urban vector management. Peak years, such as 2018, recorded the highest number of positive mosquito pools (1,024), while 2010 saw the highest number of human cases (42), reinforcing the increasing risk of WNV transmission in densely populated urban settings [23]. These findings illustrate the ongoing challenge of mitigating vector-borne diseases in metropolitan environments, particularly in the face of climate variability, evolving mosquito behaviors, and changing ecological landscapes.
This study confirms the significant role of Cx. salinarius in WNV transmission, despite its lower abundance compared to Cx. pipiens and Cx. restuans. Its heightened anthropophilic tendencies and strong association with human cases suggest that vector control strategies should prioritize this species. However, while targeted interventions may help mitigate transmission risk, broader ecological and climate-related factors—such as increased urban heat retention and extended mosquito breeding seasons—complicate disease prevention efforts.
This study underscores the necessity of an integrated and adaptive approach to WNV management [20,31]. Key strategies should include targeted mosquito control efforts, such as reducing breeding sites and modifying habitats to limit vector proliferation. Enhanced surveillance of mosquito population dynamics, combined with public awareness initiatives, will be essential for effective intervention. Additionally, the increasing prevalence of other mosquito-borne diseases, such as chikungunya and dengue, highlights the urgency of strengthening vector control infrastructure to address long-term public health risks in urban settings [32,33].
As WNV continues to evolve, genomic surveillance will play a crucial role in tracking changes in viral transmission efficiency and virulence. This raises an important question: should vector control strategies focus solely on reducing mosquito populations, or should they also incorporate methods to monitor and respond to shifts in virus-host interactions? A data-driven approach that integrates epidemiological, ecological, and genetic surveillance will be critical in refining WNV mitigation strategies and preparing for future mosquito-borne disease threats in urban environments.

Acknowledgments

We extend our heartfelt gratitude to the Office of Vector Surveillance and Control and the Bureau of Communicable Disease (BCD) for their unwavering dedication to vector-borne disease surveillance and public health efforts. We also acknowledge the invaluable contributions of our field surveillance teams and laboratory scientists, whose meticulous data collection, specimen processing, and steadfast commitment to vector control were essential throughout the study period. Special thanks to the New York City Public Health Laboratories for their diligent and timely testing of mosquito specimens, ensuring rapid data availability during the study. We extend our sincere appreciation to our leaders, Corinne Schiff and Mario Merlino, for their guidance and support, as well as to our esteemed senior epidemiologist, Dr. Sally Slavinski, for her invaluable insights and leadership. We also recognize Zahir Shah, Shamim Riaj, and Tonuza Bazli for their significant contributions to the spatial and epidemiological analyses that enriched this research. Finally, we express our deep appreciation to the peer reviewers, whose constructive feedback and insightful suggestions helped enhance the clarity, rigor, and overall impact of this manuscript.

References

  1. Bajwa, W.I. A taxonomic checklist and relative abundance of the mosquitoes of New York City. Journal of the American Mosquito Control Association 2018, 34, 138–142. [Google Scholar] [CrossRef]
  2. Bajwa, W.I.; Merlino, M. Application of relational Bayesian networks to vector control in New York City. International Journal of Infectious Diseases & Epidemiology 2021, 2, 45–48. [Google Scholar]
  3. Ronca, S.E.; Ruff, J.C.; Murray, K.O. A 20-year historical review of West Nile virus since its initial emergence in North America: Has West Nile virus become a neglected tropical disease? PLoS Neglected Tropical Diseases 2021, 15, e0009190. [Google Scholar] [CrossRef] [PubMed]
  4. Kramer, L.D.; Ciota, A.T.; Kilpatrick, A.M. Introduction, spread, and establishment of West Nile virus in the Americas. Journal of Medical Entomology 2019, 56, 1448–1455. [Google Scholar] [CrossRef] [PubMed]
  5. Kilpatrick, A.M. Globalization, land use, and the invasion of West Nile virus. Science 2011, 334, 323–327. [Google Scholar] [CrossRef]
  6. Paz, S. Effects of climate change on vector-borne diseases: An updated focus on West Nile virus in humans. Emerging Topics in Life Sciences 2019, 3, 143–152. [Google Scholar] [CrossRef]
  7. Skaff, N.K.; Cheruvelil, K.S.; Nateghi, R. Predicting the influence of climate change on West Nile virus transmission: A machine learning approach. Environmental Research 2020, 186, 109527. [Google Scholar] [CrossRef]
  8. Grubaugh, N.D.; Ebel, G.D.; Goebel, S.H.; Weger-Lucarelli, J.; Kuhn, J.H.; Brault, A.C. Genomic epidemiology reveals multiple introductions of West Nile virus into the United States and adaptive evolution. PLoS Pathogens 2019, 15, e1007678. [Google Scholar] [CrossRef]
  9. Ferraguti, M.; Magallanes, S.; Mora-Rubio, C.; Bravo-Barriga, D.; Marzal, A.; Hernandez-Caballero, I.; Aguilera-Sepúlveda, P.; Llorente, F.; Pérez-Ramírez, E.; Guerrero-Carvajal, F.; Jiménez-Clavero, M.Á.; Frontera, E.; Ortiz, J.A.; de Lope, F. Implications of migratory and exotic birds and the mosquito community on West Nile virus transmission. Infectious Diseases 2023, 1–14. [Google Scholar] [CrossRef]
  10. Mrzljak, A.; Dinjar-Kujundzic, P.; Santini, M.; Barbić, L.; Košuta, I.; Savić, V.; Tabain, I.; Vilibić-Čavlek, T. West Nile virus: An emerging threat in the transplant population. Vector-Borne and Zoonotic Diseases 2020, 20, 613–618. [Google Scholar] [CrossRef]
  11. Carney, R.M.; Ahearn, S.C.; McConchie, A.; Glaser, C.; Jean, C.; Barker, C.; Park, B.; Padgett, K.; Parker, E.; Aquino, E.; Kramer, V. Early warning system for West Nile virus risk areas, California, USA. Emerging Infectious Diseases 2011, 17, 1445–1454. [Google Scholar] [CrossRef] [PubMed]
  12. DeGroote, J.P.; Sugumaran, R.; Brend, S.M.; Tucker, B.J.; Bartholomay, L.C. Landscape, demographic, entomological, and climatic associations with human disease incidence of West Nile virus in the state of Iowa, USA. International Journal of Health Geographics 2008, 7, 1–16. [Google Scholar] [CrossRef] [PubMed]
  13. Komar, N. West Nile virus: Epidemiology and ecology in North America. Advances in Virus Research 2006, 61, 185–234. [Google Scholar] [CrossRef]
  14. Heidecke, J.; Lavarello Schettini, A.; Rocklöv, J. West Nile virus ecoepidemiology and climate change. PLOS Climate 2023, 2, e0000129. [Google Scholar] [CrossRef]
  15. McMillan, J.R.; Chaves, L.F.; Armstrong, P.M. Ecological predictors of mosquito population and arbovirus transmission synchrony estimates. Journal of Medical Entomology 2023, 60, 564–574. [Google Scholar] [CrossRef]
  16. Duggal, N.K.; Langwig, K.E.; Ebel, G.D.; Brault, A.C. On the fly: Interactions between birds, mosquitoes, and the environment that have molded West Nile virus genomic structure over two decades. Journal of Medical Entomology 2019, 56, 1467–1474. [Google Scholar] [CrossRef] [PubMed]
  17. Bajwa, W.I.; Slavinski, S.; Shah, Z.; Zhou, L.; Bazli, T.V. Comprehensive mosquito surveillance and control plan. New York City Department of Health and Mental Hygiene 2025, New York, NY. Retrieved from https://www.nyc.gov/assets/doh/downloads/pdf/wnv/2025/wnvplan2025.
  18. Farajollahi, A.; Fonseca, D.M.; Kramer, L.D.; Kilpatrick, A.M. (2011). ‘Bird biting’ mosquitoes and human disease: A review of the role of Culex pipiens complex mosquitoes in epidemiology. Infection, Genetics, and Evolution 2011, 11, 1577–1585. [Google Scholar]
  19. Eder, M.; Cortes, F.; Teixeira de Siqueira Filha, N.; Araújo de França, G.V.; Degroote, S.; Braga, C.; Turchi Martelli, C.M. Scoping review on vector-borne diseases in urban areas: Transmission dynamics, vectorial capacity, and coinfection. Infectious Diseases of Poverty 2018, 7, 124. [Google Scholar] [CrossRef]
  20. Kwan, J.L.; Park, B.; Carpenter, K.; Ngo, T.E.; Civen, R.; Reisen, W.K. Comparison of enzootic risk measures for predicting West Nile disease, Los Angeles, California, USA, 2004–2010. Emerging Infectious Diseases 2012, 18, 1298–1306. [Google Scholar] [CrossRef]
  21. Ciota, A.T.; Drummond, C.L.; Ruby, M.A.; Drobnack, J.; Ebel, G.D.; Kramer, L.D. Dispersal of Culex mosquitoes (Diptera: Culicidae) from a wastewater treatment facility. Journal of Medical Entomology 2012, 49, 35–42. [Google Scholar] [CrossRef]
  22. Verdonschot, A.M.; Besse-Lototskaya, A.A. Flight distance of mosquitoes (Culicidae): A metadata analysis to support the management of barrier zones around rewetted and newly constructed wetlands. Limnologica 2014, 45, 69–75. [Google Scholar] [CrossRef]
  23. Hamer, G.L.; Kitron, U.D.; Goldberg, T.L.; Brawn, J.D.; Loss, S.R.; Ruiz, M.O.; Hayes, D.B.; Walker, E.D. Host selection by Culex mosquitoes and its role in arbovirus transmission. Journal of Vector Ecology 2008, 33, 89–99. [Google Scholar]
  24. Kilpatrick, A.M.; Kramer, L.D.; Jones, M.J.; Marra, P.P.; Daszak, P. West Nile virus epidemics in North America are driven by shifts in mosquito feeding behavior. PLoS Biology 2006, 4, e82. [Google Scholar] [CrossRef] [PubMed]
  25. Kilpatrick, A.M.; Pape, W.J. Predicting human West Nile virus infections with mosquito surveillance data. American Journal of Epidemiology 2013, 178, 829–835. [Google Scholar] [CrossRef]
  26. Riccetti, N.; Fasano, A.; Ferraccioli, F.; Gomez Ramirez, J.; Stilianakis, N.I. Host selection and forage ratio in West Nile virus–transmitting Culex mosquitoes: Challenges and knowledge gaps. PLOS Neglected Tropical Diseases 2022, 16, e0010819. [Google Scholar] [CrossRef] [PubMed]
  27. Clark, K.R.; Johnson, M.P.; Hayes, D.E. The role of Culex salinarius in West Nile virus transmission: An urban perspective. Journal of Vector Ecology 2024, 49, 157–172. [Google Scholar] [CrossRef]
  28. Amely, M.B.; Nathan, D.B.; Lawrence, E.R.; Barry, W.A.; Lindsay, P.C. Vector potential index: Bridging competence and contribution as an integrative measure of relative transmission capability. 2025. [CrossRef]
  29. Weaver, S.C.; Charlier, C.; Vasilakis, N.; Lecuit, M. Zika, chikungunya, and other emerging vector-borne viral diseases. Annual Review of Medicine 2018, 69, 395–408. [Google Scholar] [CrossRef]
  30. Rochlin, I.; Faraji, A.; Healy, K.; Andreadis, T.G. West Nile virus mosquito vectors in North America. Journal of Medical Entomology 2019, 56, 1475–1490. [Google Scholar] [CrossRef]
  31. Fauver, J.R.; Pecher, L.; Schurich, J.A.; Bolling, B.G.; Calhoon, M.; Grubaugh, N.D.; Burkhalter, K.L.; Eisen, L.; Andre, B.G.; Nasci, R.S.; Lebailly, A.; Ebel, G.D.; Moore, C.G. Temporal and spatial variability of entomological risk indices for West Nile virus infection in northern Colorado: 2006–2013. Journal of Medical Entomology 2015, 53, 425–434. [Google Scholar] [CrossRef]
  32. Benelli, G.; Canale, A.; Higuchi, A.; Murugan, K.; Pavela, N.M. The recent outbreaks of Zika virus: Mosquito control faces a further challenge. Asian Pacific Journal of Tropical Disease 2016, 6, 253–258. [Google Scholar] [CrossRef]
  33. World Health Organization (WHO). (2012). Global strategy for dengue prevention and control 2012–2020. WHO Press. Retrieved from https://apps.who.int/iris/bitstream/handle/10665/75303/9789241504034_eng.
Figure 1. Hotspots of WNV human cases with positive mosquito pools within 10 days before the onset of human disease in NYC, 2000-2019. (a) Mosquito pool hotspots; (b) Human case hotspots.
Preprints 149993 g001aPreprints 149993 g001b
Disclaimer/Publisher’s Note: The statements, opinions and data contained in all publications are solely those of the individual author(s) and contributor(s) and not of MDPI and/or the editor(s). MDPI and/or the editor(s) disclaim responsibility for any injury to people or property resulting from any ideas, methods, instructions or products referred to in the content.
Copyright: This open access article is published under a Creative Commons CC BY 4.0 license, which permit the free download, distribution, and reuse, provided that the author and preprint are cited in any reuse.
Prerpints.org logo

Preprints.org is a free preprint server supported by MDPI in Basel, Switzerland.

Subscribe

Disclaimer

Terms of Use

Privacy Policy

Privacy Settings

© 2025 MDPI (Basel, Switzerland) unless otherwise stated