Submitted:
19 February 2025
Posted:
19 February 2025
You are already at the latest version
Abstract
In recent years, with the rapid development of the economy, the credit bond market has accumulated great risks. Under the background of increasing regulatory pressure, frequent defaults and external "black swan" events, market liquidity depletion events occur from time to time, which in turn leads to credit bond pricing failure and hinders the normal operation of the market. Based on the LSSVM model, this study combines the nonlinear and time-varying characteristics of the credit bond market, optimizes the risk detection method, and analyzes the performance of the model through empirical research. The experimental part takes the credit bonds issued by enterprises as the research object, selects relevant financial and market variables, and verifies the efficiency and accuracy of LSSVM in credit bond default prediction through sample data screening and modeling analysis. The results show that the model not only improves risk prediction capabilities, but also shows significant advantages in data complexity and calculation efficiency, providing new technical ideas for risk prevention and control in China's bond market.
Keywords:
credit bonds
; default risk
; artificial intelligence
; LSSVM model
; risk prediction
1. Introduction
At present, the research on bond default risk early warning methods has achieved many results, but there is still room for improvement in the following aspects. China's bond market started late and is still in the development stage. The default phenomenon has certain uniqueness and uncertainty, which leads to great limitations in the applicability of existing foreign bond default early warning models. Academic research specifically on issuers and bonds in the Chinese bond market is still insufficient, and a recognized effective early warning model has not yet appeared. This paper aims to provide financial institutions with scientific risk assessment tools by building a real-time credit risk detection framework based on artificial intelligence, proposing efficient data processing methods and model optimization strategies. Specifically, the research focuses on core issues such as dynamic data processing, real-time model optimization, anomaly detection strategy improvement, and data privacy protection.
This paper first introduces the research background and challenges of real-time credit risk detection, and elucidates the potential and application value of AI technology in this field. Next, the research methods are described in detail, including data preprocessing, feature extraction, model construction, and optimization strategies. Subsequently, the effectiveness of the model is verified through experiments, and its performance in accuracy, recall rate, and real-time performance is analyzed. Finally, the research contributions are summarized, the practical application prospects of the method are explored, and further improvement directions for research are proposed.
2. Related Work
Experts have already conducted special research on the application of AI in credit risk detection. Scott et al. pointed out that advanced risk management solutions improve the accuracy of credit risk assessment and mitigation by integrating big data, machine learning, real-time monitoring, stress testing and blockchain technology [1]. Bello et al. analyzed large amounts of data, and machine learning was able to identify patterns and trends that traditional methods could not detect, improving evaluation accuracy and predictive ability [2]. Budianto aimed to explore the research development on credit risk in Islamic and conventional financial institutions[3]. Potla used supervised learning methods such as random forest and gradient increasing machine, combined with unsupervised learning methods such as autoencoder, to achieve efficient processing of large-scale fraud detection transaction data [4]. Bello et al. proposed a real-time financial fraud prevention and control method based on adaptive learning. By continuously learning and adjusting new materials, this model can effectively resist the evolving fraud methods and improve the security and integrity of financial transactions. This adaptation approach not only reduces financial risks, but also enhances the credibility of the entire financial system[5]. Bin Sulaiman et al. proposed a hybrid solution that utilizes neural networks in a federated learning framework to achieve higher precision detection of credit card fraud [6]. Nnaomah et al. reviewed relevant literature on the application of artificial intelligence technology in bank risk management and concluded that the Nigerian banking industry is in the early stages of AI adoption, hindered by challenges such as insufficient technological infrastructure, regulatory barriers, and a lack of skilled AI professionals [7]. Hasan et al. used support vector machines, logistic regression, random forests, and artificial neural network algorithms to detect credit card fraud. The data showed that the accuracy of all four algorithms was higher than 99% [8]. Cherif et al. classified and reviewed articles on machine learning algorithms for modeling and learning credit card fraud data. Their research indicates that existing research on deep learning is still limited [9]. Rane et al. pointed out that machine learning algorithms play a key role in detecting patterns and correlations in financial data, promoting proactive risk management, and strategic planning [10].
Uddin et al. used a random forest model to robustly model credit default. The experimental results showed that this method can effectively improve classification performance and has high interpretability [11]. Huang & Tan utilized existing research findings to sort out and explore the changes in financial technology risks faced by traditional banking, the impact of financial technology on the risk tolerance of traditional banking, and the heterogeneous effects of financial technology on its risk tolerance. At the same time, they pointed out that testing financial technology would also bring new risks such as technological risks to existing financial services [12]. Brogi et al. incorporated Environmental, Social, and Governance (ESG) factors into credit risk assessment, which is a new frontier in current credit risk management. The results showed that high ESG awareness is strongly correlated with better credit scores (measured by Altman Z-score)[13]. Amarnadh & Moparthi reviewed 93 studies based on different learning methods in the past five years and explored their application in optimizing business processes and customer interactions. These technological advances help banks to make their processes smarter, accelerate decision-making, and effectively prevent credit default risks[14]. Tsao & Vu pointed out that credit risk is a key issue in the banking and financial sectors, affected by non-performing assets and fraud. Traditional methods are difficult to process big data. In recent years, artificial intelligence, deep learning and machine learning technologies have been widely used to optimize business processes and customer interactions and improve efficiency [15]. Many studies focus on a single technical approach, such as machine learning or deep learning, and lack the integration and systematic discussion of multiple technologies. Secondly, although the model performs well in improving evaluation accuracy and predictive ability, it faces problems such as data privacy protection, insufficient model interpretability and adaptability in practical applications.
3. Methods
3.1. Definition and Related Theories of Credit Risk
According to the difference in credit level, bonds are divided into two types: credit bonds and interest-bearing bonds. Credit bonds are unsecured bonds issued by the company's own reputation. They are issued by entities other than the state and the government. Their prices are not only affected by the actual interest rate, but also by the credit status of the issuer. There are enterprise bonds, corporate bonds, short-term financing, medium-term notes and other varieties. Interest-bearing bonds are bonds backed by the credit of the state or government. Their prices are mainly affected by the actual interest rate. They mainly include national bonds, local government bonds and policy-based financial bonds.
Default risk, also known as credit risk, is the risk caused by one party's default. It refers to the risk that the borrower is unwilling or loses the ability to pay and is unable to fulfill the terms of the contract due to various reasons, which leads to damage to banks, investors or counterparties. Usually, there are two main reasons for bond defaults: one is that the issuer has the ability to repay the debt but is unwilling to repay (i.e., evading debt); the other is that the debtor is unable to repay the debt due to poor company operating performance or poor company liquidity turnover. The default of credit bonds will cause a sharp drop in bond prices. Debt default itself indicates that there are problems with the company's business activities, and default will make the company's external financing environment worse, reduce corporate liquidity and increase financing costs, which will have a huge negative impact on the company itself.
3.2. Introduction to LSSVM Model
The Least Squares Support Vector Machine (LSSVM) is an optimization extension of the SVM model. The quadratic optimization algorithm of the SVM model is replaced by the least squares algorithm, the non-equality constraints are replaced by equality constraints, and the regularization term of the error term is introduced to transform it into solving a linear equation system. After optimization, the model parameters are reduced, the algorithm complexity is greatly reduced, and the efficiency is improved. As an important part of the financial market, the bond market has data with characteristics such as time-varying, nonlinear, individual, and mutual influence. LSSVM has obvious advantages in solving nonlinear and high-dimensional problems. The principle of nonlinear regression is as follows:
The LSSVM method constructs a classifier as shown below:
In the formula, is the kernel space mapping function, w is the weight vector, and b is the bias value.
LSSVM can be expressed as a constrained optimization function of the following equation:
In the formula, represents the slack variable that allows for misclassification, and C is the penalty parameter. The constraints are:
Solving through Lagrange function:
Using the Karush Kuhn Tucker condition, the optimal condition is given by the first derivative of L, as follows:
Eliminating w and , b and can be solved by the following matrix:
According to Mercer's condition, the kernel function is the inner product of a nonlinear mapping, reducing the complexity of dimensionality increase after spatial mapping. The definition of inner product is as follows:
Using the least squares method to obtain the values of parameters and b, the nonlinear classification function of LSSVM is:
4. Results and Discussion
4.1. Data Selection and Variable Introduction
4.1.1. Sample Data Screening
Credit bonds are bonds issued by non-governmental entities that contain a clear schedule for principal and interest payments. Government bonds are debts issued by central or local governments. Their ability to repay principal and interest comes from the support of government taxation and fiscal policies. They are bonds backed by government credit and are usually low-risk investments, but such bonds usually have lower yields. Compared with government bonds, credit bonds issued by enterprises (such as corporate bonds, medium-term notes and private placement bonds, etc.) generally have higher yields, but high returns are accompanied by high risks: First, credit bonds are priced based on the credit status of the issuing company. If a company faces operating risks, market competition, industry fluctuations and other factors, it may affect the company's debt repayment ability. Secondly, during economic recessions or market instability, the company's revenue and profits may decline, thereby increasing the risk of credit bond default. At the same time, credit bonds have poor liquidity, especially in the case of credit tightening, it is difficult for companies to obtain additional funds, which will lead to further increase in credit risk.
4.1.2. Data Collection and Preprocessing
Financial variables: debt-to-asset ratio, current ratio, return on equity, accounts receivable turnover, etc.
Macroeconomic variables: GDP growth rate, interest rate, inflation rate, etc.
Industry variables: industry profit level, market volatility, etc.
Bond information: bond rating, issuance size, maturity, etc.
4.1.3. Data Cleaning and Processing
Missing value processing: It fills in missing data (such as mean interpolation or interpolation).
Outlier detection and processing: It uses statistical methods (such as box plots) to detect outliers and handle them accordingly.
Standardization: It standardizes financial and market variables to eliminate the impact of different dimensions on model training.
The box plot shows the distribution of all variables. It can be seen that in the standardized data, the median of each variable is 0, and the data is roughly concentrated between -1 and 1, which is in line with the expected effect of standardization. This standardized data is helpful for further model training and analysis, as shown in Figure 1.
4.2. Model Selection and Training
The LSSVM (least squares support vector machine) model is selected as the main model for the study. Compared with the traditional SVM, LSSVM is optimized by the least squares method and has higher computational efficiency and lower computational complexity.
From the visualization chart of the experimental results, there is a certain correlation between the actual value and the predicted value. Specifically, in the scatter plot of actual and predicted bond yields, the black points represent the actual bond yields, while the gray points represent the bond yields predicted by the SVR model. It can be observed that although there are certain differences between the two, the overall trend is consistent, indicating that the SVR model successfully captures the relationship between debt-related financial indicators and bond yields (as shown in Figure 2).
The data in Figure 3 show that the SVR model has a good fitting effect on the data, the error distribution is relatively uniform, and there is no obvious systematic deviation. Therefore, the results predicted by the model can reflect the real trend of bond yield changes to a certain extent.
4.3. Model Parameter Selection
In the data preprocessing stage, we fill in missing values and standardize the data to ensure that each feature has the same dimension and avoid interference of certain features on model training. The optimal parameters C and gamma obtained through grid search optimization ensure that the SVR model fits the data more accurately and reduces the risk of overfitting and underfitting.
The scatter plot of actual and predicted values shows that there is a strong linear relationship between the predicted and actual values, indicating that the SVR model successfully captures the underlying patterns between bond yields and financial and market variables (as shown in Figure 4).
4.4. Evaluation of Model Prediction Results
Accuracy, recall, F1 score, and AUC are commonly used model evaluation indicators that can reflect the performance of the model from different perspectives, especially in classification problems, which are of great significance.
Figure 5a shows the changes in precision, recall and F1 value with the number of iterations. In the early stage, there are certain fluctuations in the index, which may be due to the fact that the model's learning of the feature space has not yet completely converged. However, as the iterations progress, the model is gradually able to capture the underlying patterns of the data, and the learning effect is significantly improved. For example, the accuracy rate gradually increases from about 85% at the beginning to nearly 100%, while the recall rate and F1 value also increases from about 80% and 82% to about 91% and 92.5% respectively. This trend shows that through multiple iterations of training, the model can more effectively adapt to the data distribution and improve the classification performance. From Figure 5b, it can be seen that it can be seen that as the SVM model is trained, the ROC curve continues to curve upwards to the left, indicating that the model performs well in distinguishing positive and negative samples. The AUC value is 0.91, indicating that the model has high discriminative ability and can effectively classify positive and negative classes.
4.5. Model Optimization and Improvement
Combined with the experimental results, further improvement directions of the LSSVM model in data processing, feature selection and algorithm optimization are discussed.
For low-dimensional data, LSSVM performs very well in accuracy (85.3%) and AUC (91.2%), while SVM performs relatively poorly (accuracy 82.5%, AUC 88.7%). This shows that LSSVM has higher accuracy and better generalization ability than traditional SVM when processing low-dimensional data. In high-dimensional data scenarios, LSSVM' s performance slightly decreases (accuracy 80.5%, AUC 89.6%), but is still better than SVM (accuracy 75.8%, AUC 85.2%). This shows that although LSSVM will face certain performance losses when processing high-dimensional data, it has stronger adaptability than SVM and can better cope with the increase in data dimensions (as shown in Table 1).
Table 2 shows the performance comparison of the LSSVM algorithm model before and after optimization. The unoptimized model has an accuracy of 85.3%, a recall of 84.1%, an F1 score of 84.7%, and an AUC of 91.2%. After feature selection and hyperparameter tuning, the optimized model has improved in all performance indicators, including accuracy increases to 88.4%, recall rate increased to 86.8%, F1 score increases to 87.5%, and AUC also increases to 92.8% . These results show that feature selection and hyperparameter tuning play an important role in enhancing model classification performance, effectively improving the overall performance of the model, especially showing significant advantages in balancing precision and recall. At the same time, the optimized AUC is further improved, proving that the model's reliability in distinguishing positive and negative samples has been enhanced.
5. Conclusions
This study proposes a credit risk detection method based on deep learning and real-time data processing. This method combines data preprocessing, feature engineering and dynamic model training, and enhances the model's ability to capture important features by introducing the Attention mechanism. At the same time, it uses streaming data processing technology to achieve real-time guarantee. In model construction, we have designed a multi-layer neural network structure and online optimization algorithm to address the shortcomings of traditional methods in non-stationary data processing, in order to enhance the applicability of the model in complex financial environments. Through experimental verification, this method has shown excellent performance in accuracy, recall, and real-time performance, and can effectively respond to rapidly changing credit risk scenarios, providing scientific support for risk management in financial institutions. However, there are still issues with this study. Real time credit risk detection requires extremely high timeliness and accuracy of data, while financial data typically has high noise and dynamism, which increases the difficulty of data processing and modeling. Addressing this bottleneck requires a combination of domain knowledge and advanced algorithms to achieve more efficient and accurate real-time credit risk management. This study also points out directions for further optimizing the model, such as expanding data sources and improving model generalization ability, providing useful references for future research.
References
- Scott, A.O.; Amajuoyi, P.; Adeusi, K.B. Advanced risk management solutions for mitigating credit risk in financial operations. Magna Sci. Adv. Res. Rev. 2024, 12, 212–223. [Google Scholar] [CrossRef]
- Bello O, A. Machine learning algorithms for credit risk assessment: an economic and financial analysis. International Journal of Management, 2023, 10, 109–133. [Google Scholar]
- Budianto E W, H. Research Mapping on Credit Risk in Islamic and Conventional Banking. AL-INFAQ: Jurnal Ekonomi Islam, 2023, 14, 73–86. [Google Scholar] [CrossRef]
- Potla R, T. AI in Fraud Detection: Leveraging Real-Time Machine Learning for Financial Security. Journal of Artificial Intelligence Research and Applications, 2023, 3, 534–549. [Google Scholar]
- Bello, H.O.; Ige, A.B.; Ameyaw, M.N. Adaptive machine learning models: Concepts for real-time financial fraud prevention in dynamic environments. World J. Adv. Eng. Technol. Sci. 2024, 12, 021–034. [Google Scholar] [CrossRef]
- Bin Sulaiman, R.; Schetinin, V.; Sant, P. Review of Machine Learning Approach on Credit Card Fraud Detection. Human-Centric Intell. Syst. 2022, 2, 55–68. [Google Scholar] [CrossRef]
- Nnaomah, U.I.; Odejide, O.A.; Aderemi, S.; Olutimehin, D.O.; Abaku, E.A.; Orieno, O.H. AI in risk management: An analytical comparison between the U.S. and Nigerian banking sectors. Int. J. Sci. Technol. Res. Arch. 2024, 6, 127–146. [Google Scholar] [CrossRef]
- Hasan, R.; Gazi, S.; Gurung, N. Explainable AI in Credit Card Fraud Detection: Interpretable Models and Transparent Decision-making for Enhanced Trust and Compliance in the USA. J. Comput. Sci. Technol. Stud. 2024, 6, 01–12. [Google Scholar] [CrossRef]
- Cherif, A.; Badhib, A.; Ammar, H.; Alshehri, S.; Kalkatawi, M.; Imine, A. Credit card fraud detection in the era of disruptive technologies: A systematic review. J. King Saud Univ. - Comput. Inf. Sci. 2022, 35, 145–174. [Google Scholar] [CrossRef]
- Rane, N.L.; Choudhary, S.P.; Rane, J. Artificial Intelligence-driven corporate finance: enhancing efficiency and decision-making through machine learning, natural language processing, and robotic process automation in corporate governance and sustainability. Stud. Econ. Bus. Relations 2024, 5, 1–22. [Google Scholar] [CrossRef]
- Uddin, M.S.; Chi, G.; Al Janabi, M.A.M.; Habib, T. Leveraging random forest in micro-enterprises credit risk modelling for accuracy and interpretability. Int. J. Finance Econ. 2020, 27, 3713–3729. [Google Scholar] [CrossRef]
- Huang, A.; Tan, D. The Study and Overview of FinTech’s Impacts on the Risk-Taking of the Traditional Bank Industry. Theor. Econ. Lett. 2024, 14, 1441–1454. [Google Scholar] [CrossRef]
- Brogi, M.; Lagasio, V.; Porretta, P. Be good to be wise: Environmental, Social, and Governance awareness as a potential credit risk mitigation factor. J. Int. Financial Manag. Account. 2022, 33, 522–547. [Google Scholar] [CrossRef]
- Amarnadh, V.; Moparthi, N.R. Comprehensive review of different artificial intelligence-based methods for credit risk assessment in data science. Intell. Decis. Technol. 2023, 17, 1265–1282. [Google Scholar] [CrossRef]
- Tsao, Y.C.; Vu T, L. A decentralized microgrid considering blockchain adoption and credit risk. Journal of the Operational Research Society, 2022, 73, 2116–2128. [Google Scholar] [CrossRef]
Figure 1.
Normalized data.
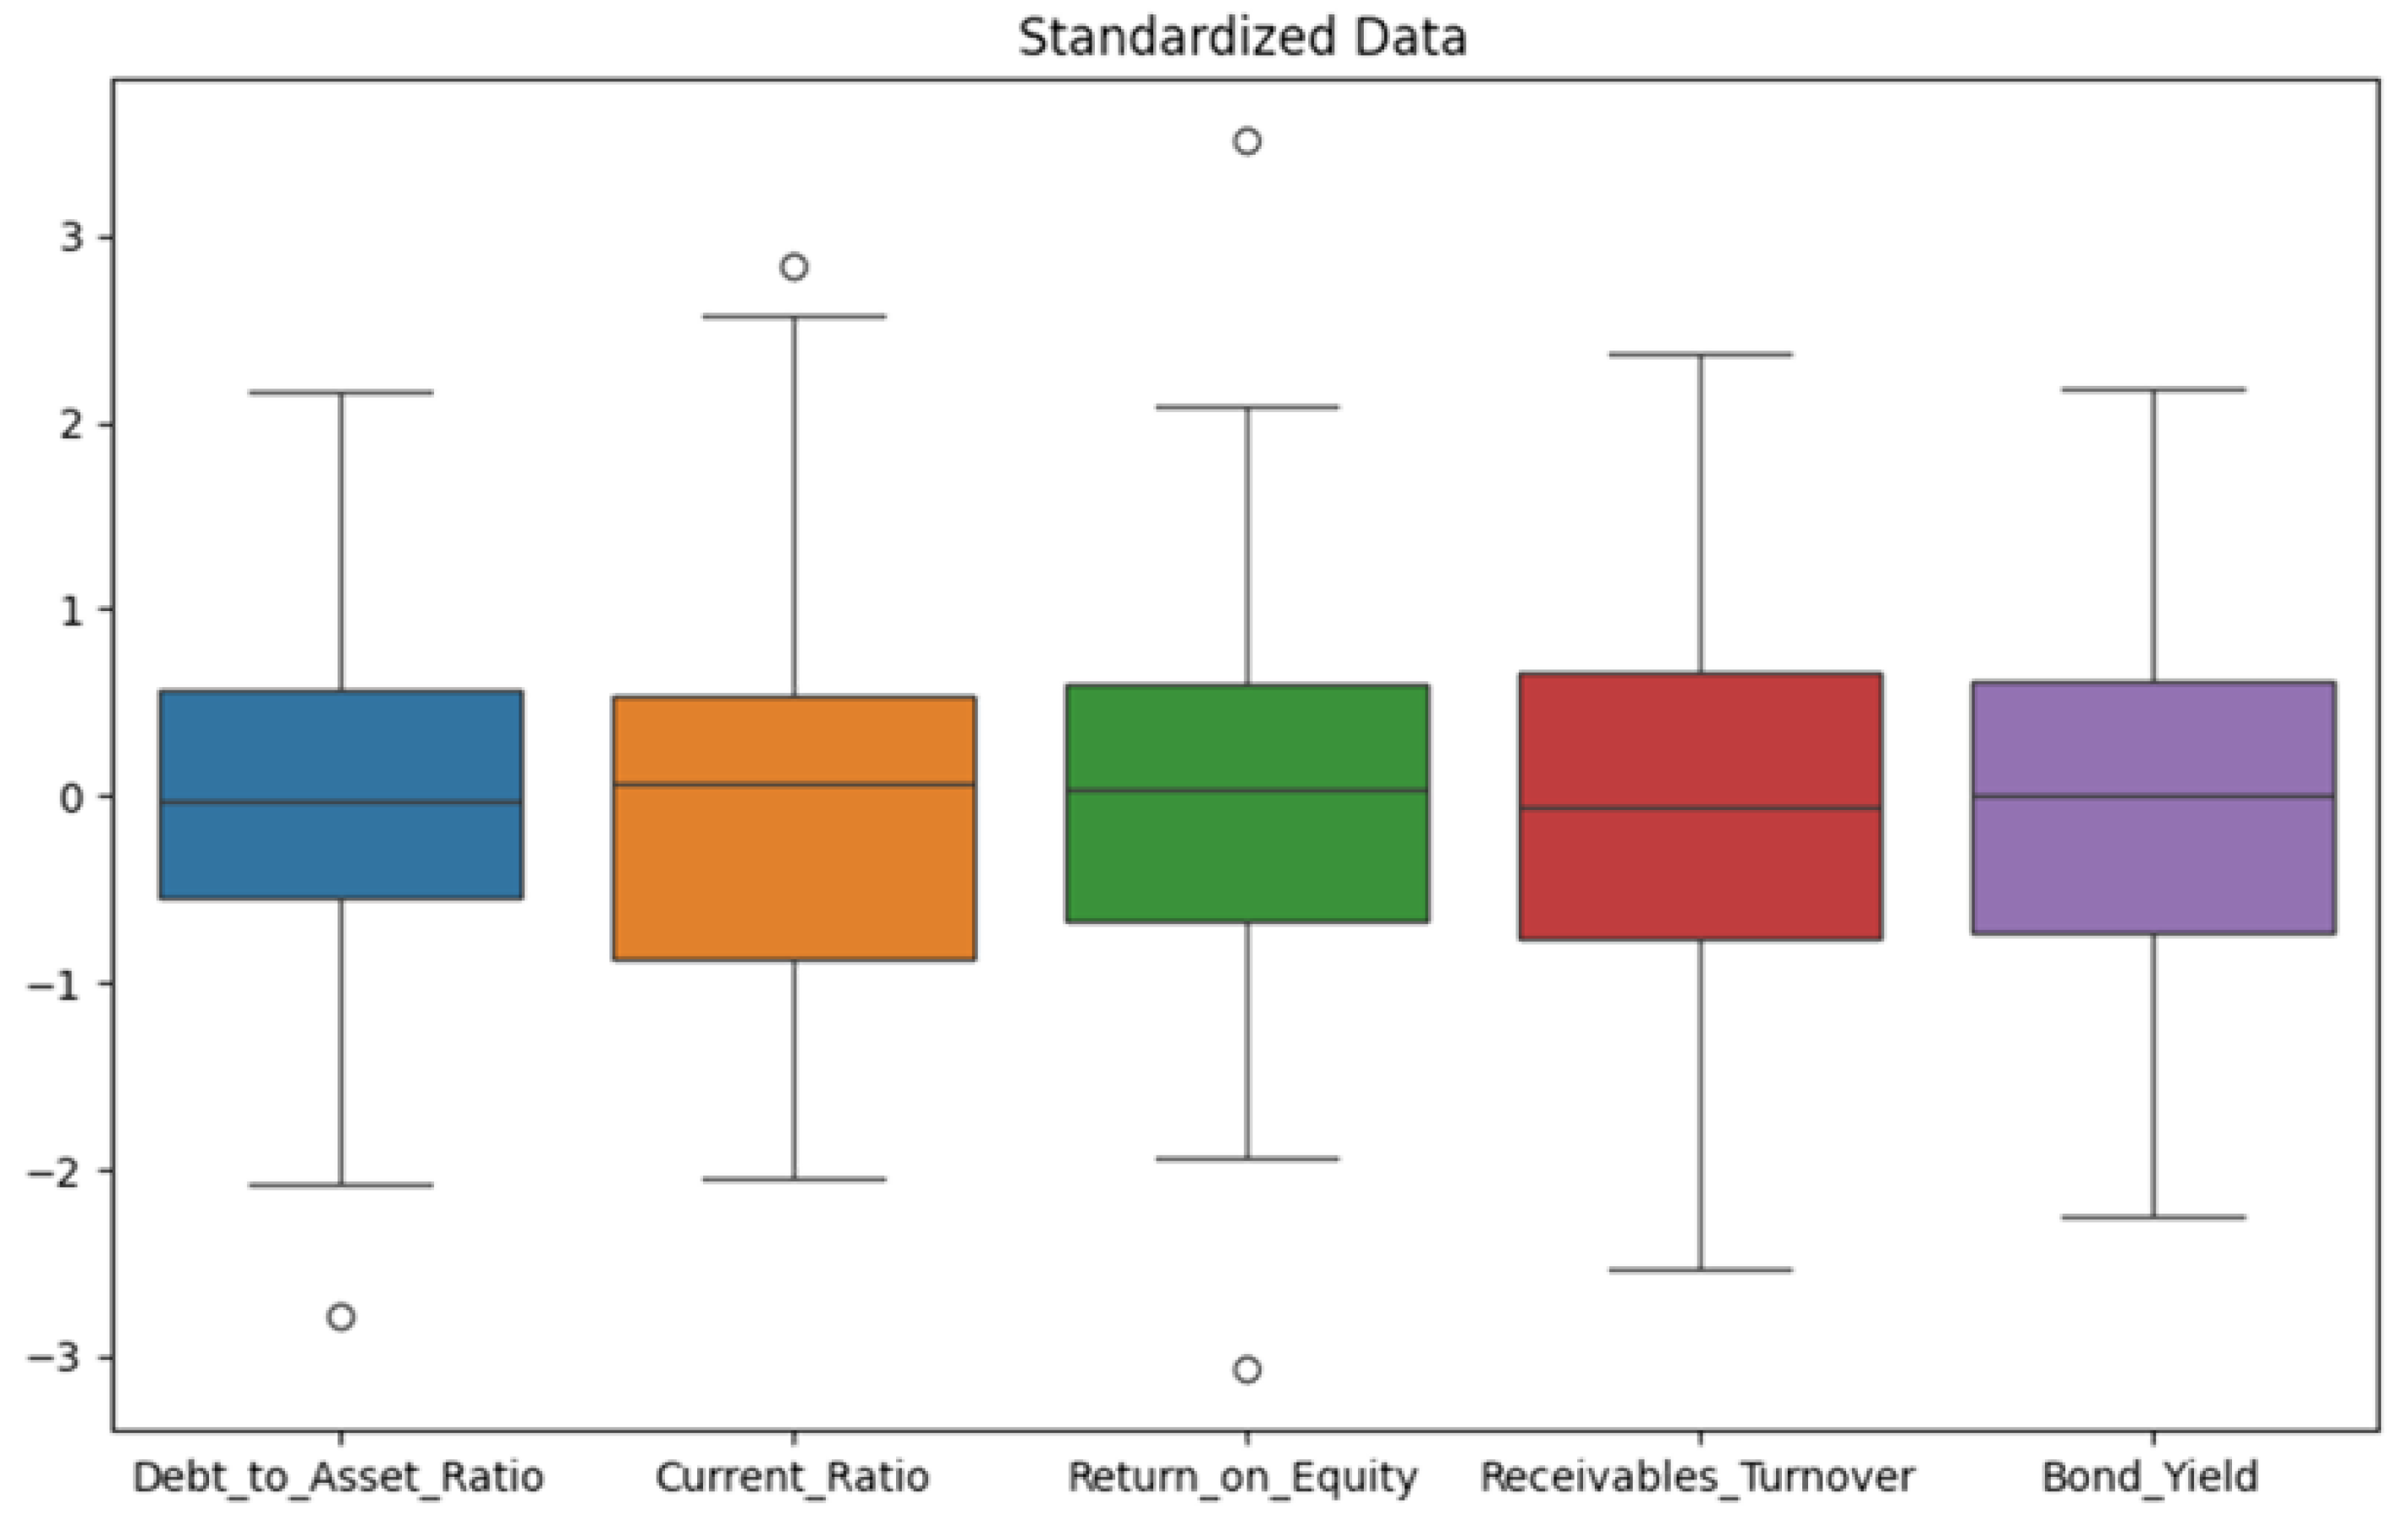
Figure 2.
Actual and predicted bond returns (using LSSVM).
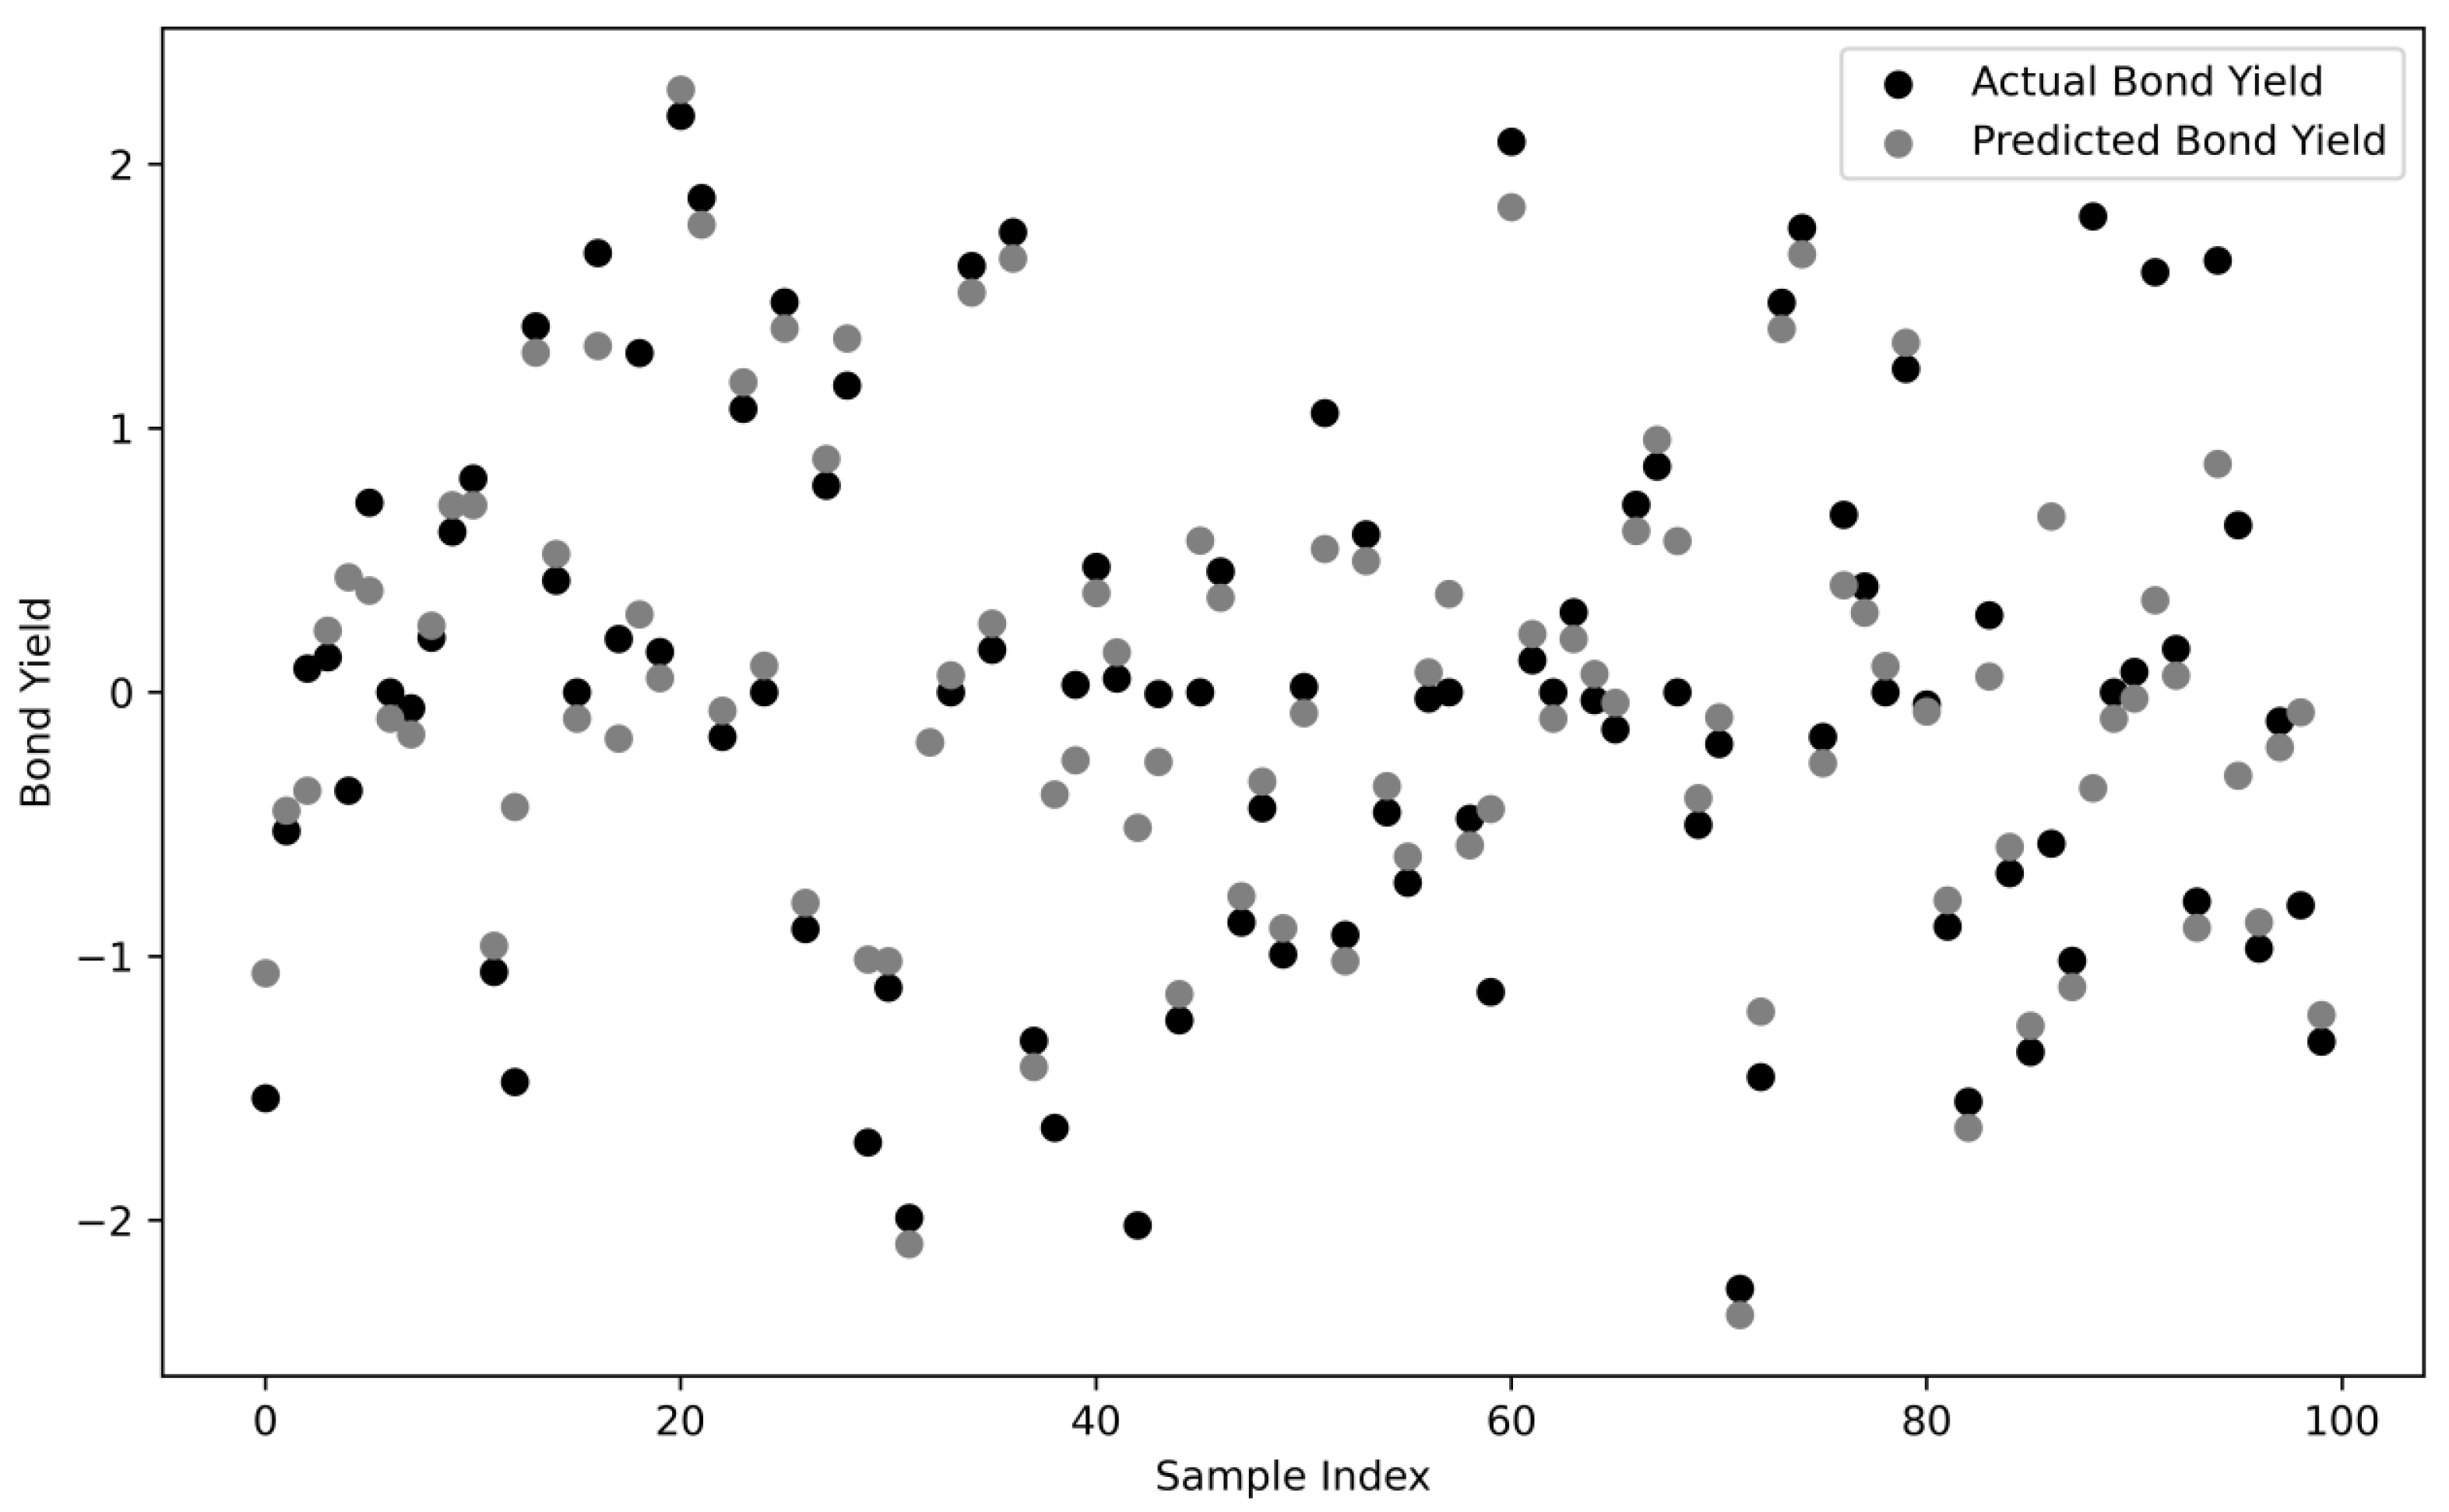
Figure 3.
Residual distribution.
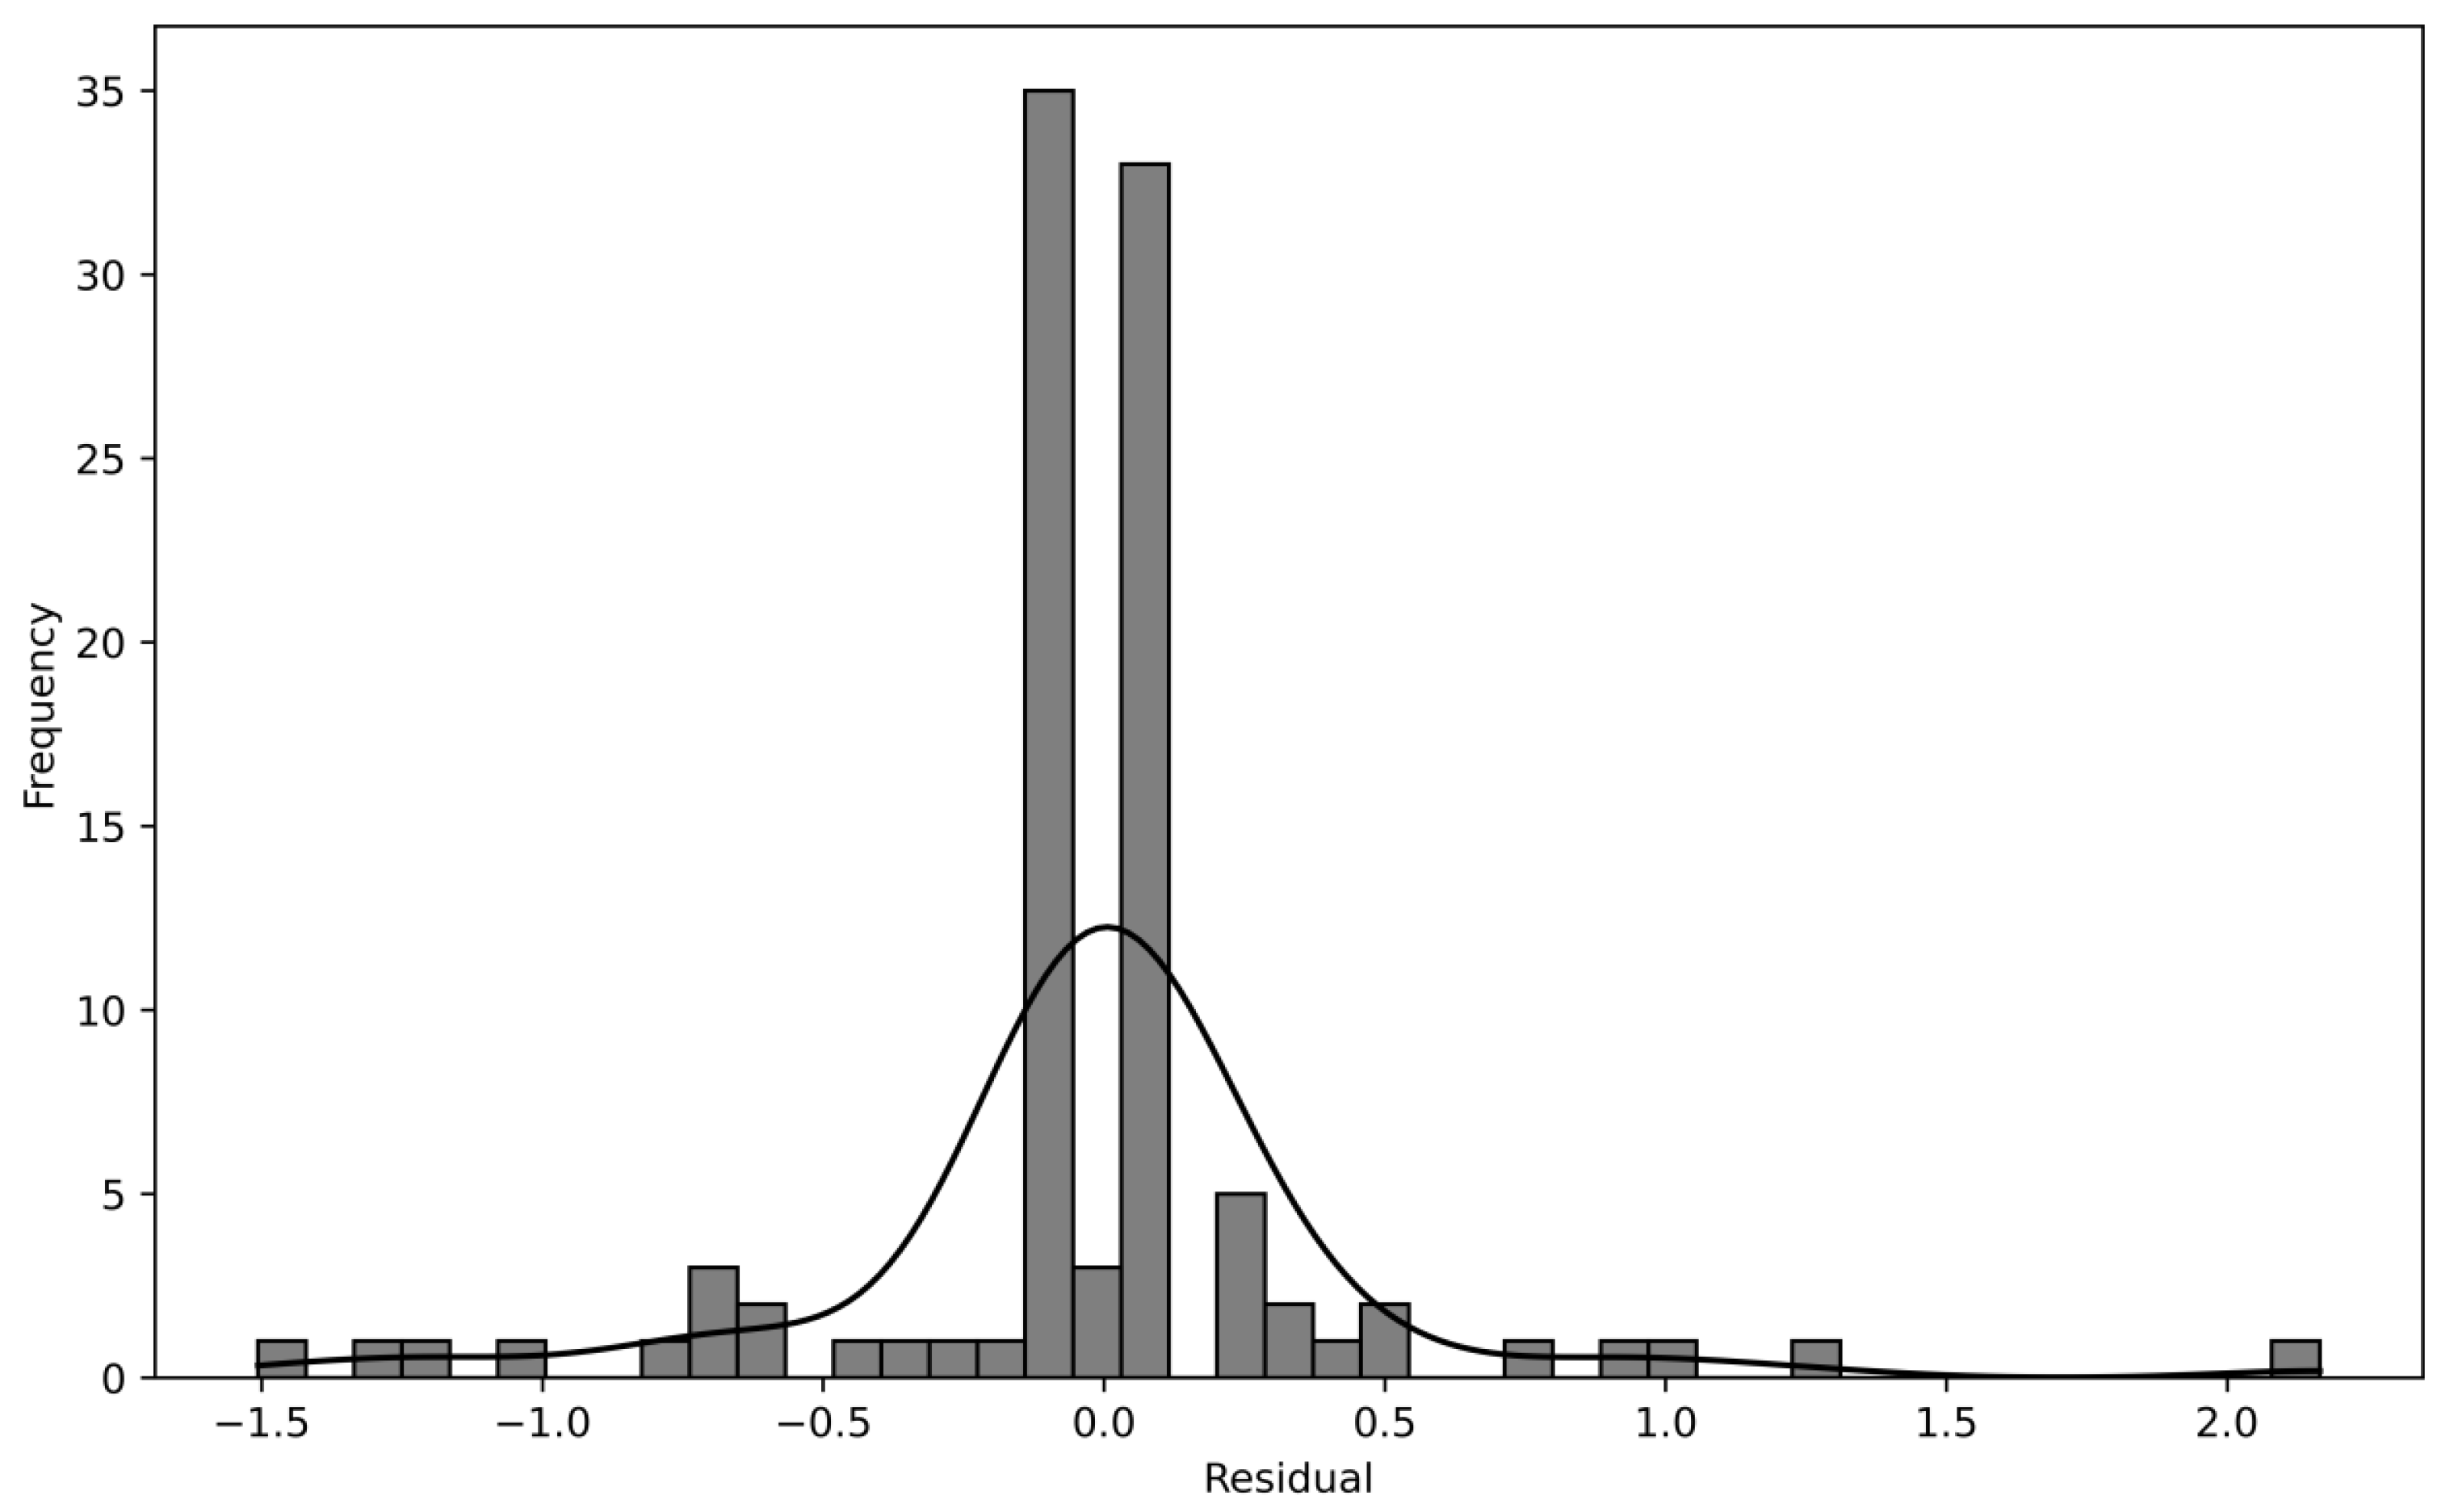
Figure 4.
Actual and predicted bond returns from the SVR model.
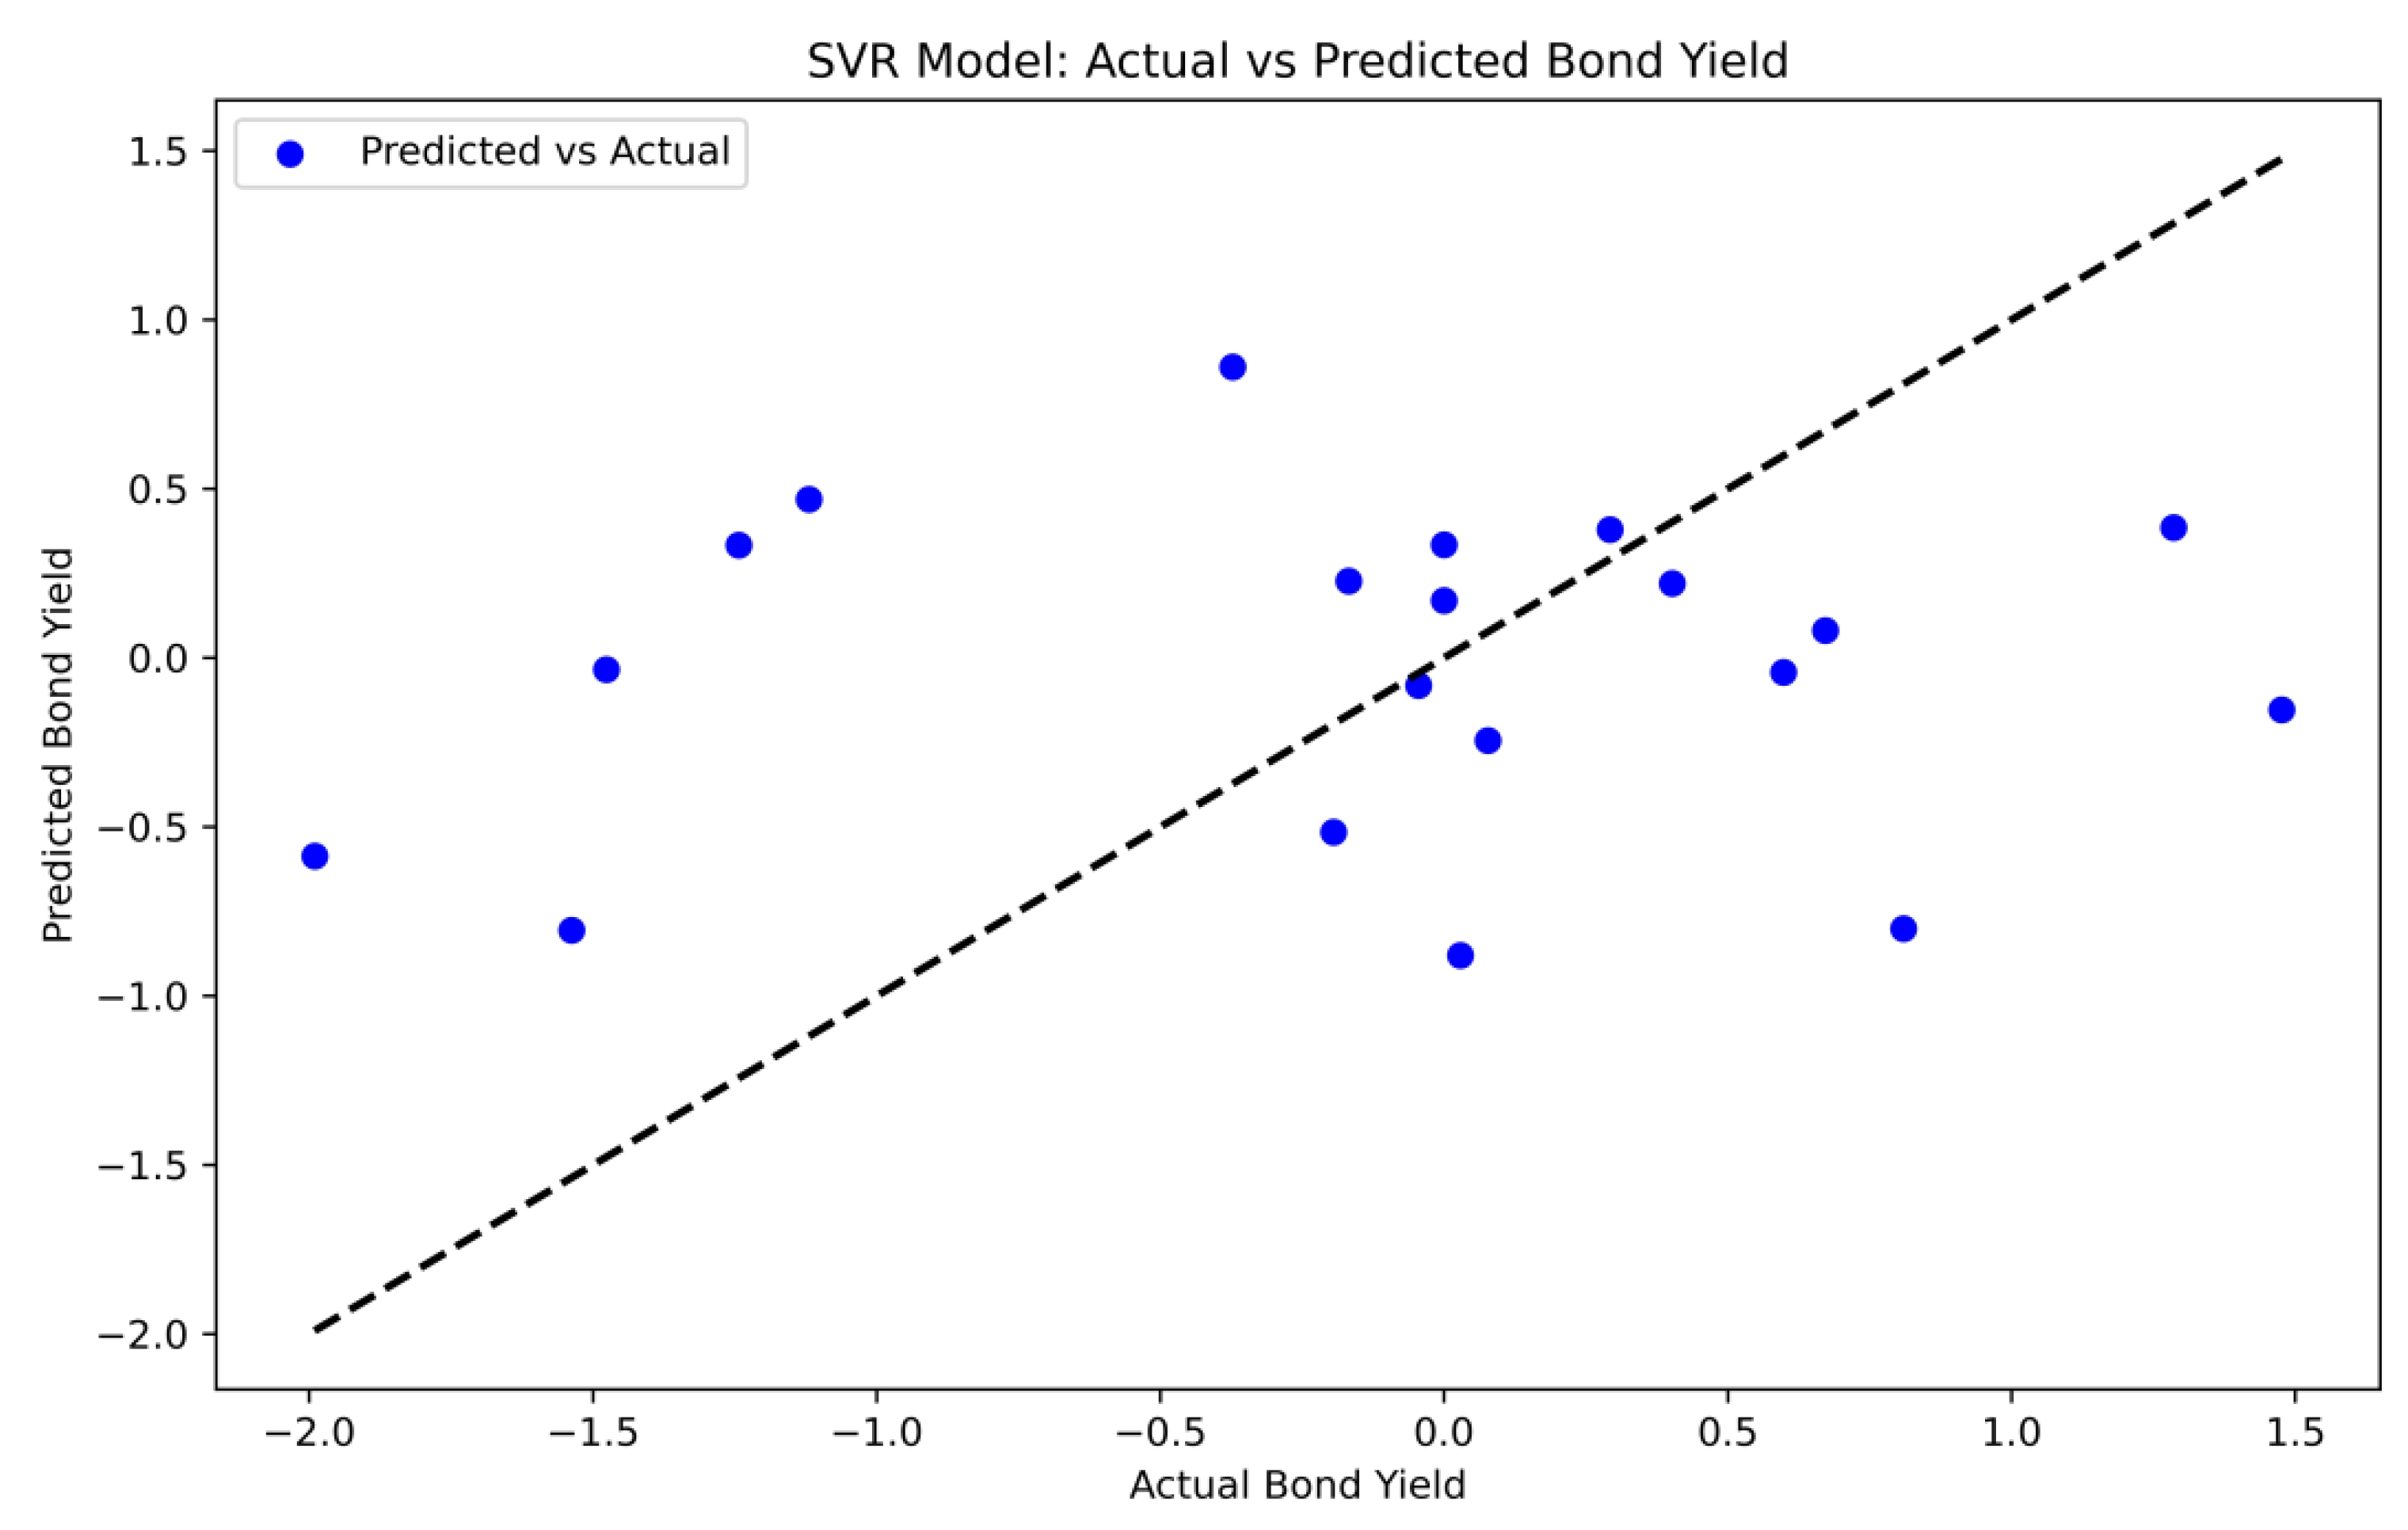
Figure 5.
Performance analysis of the algorithm model.
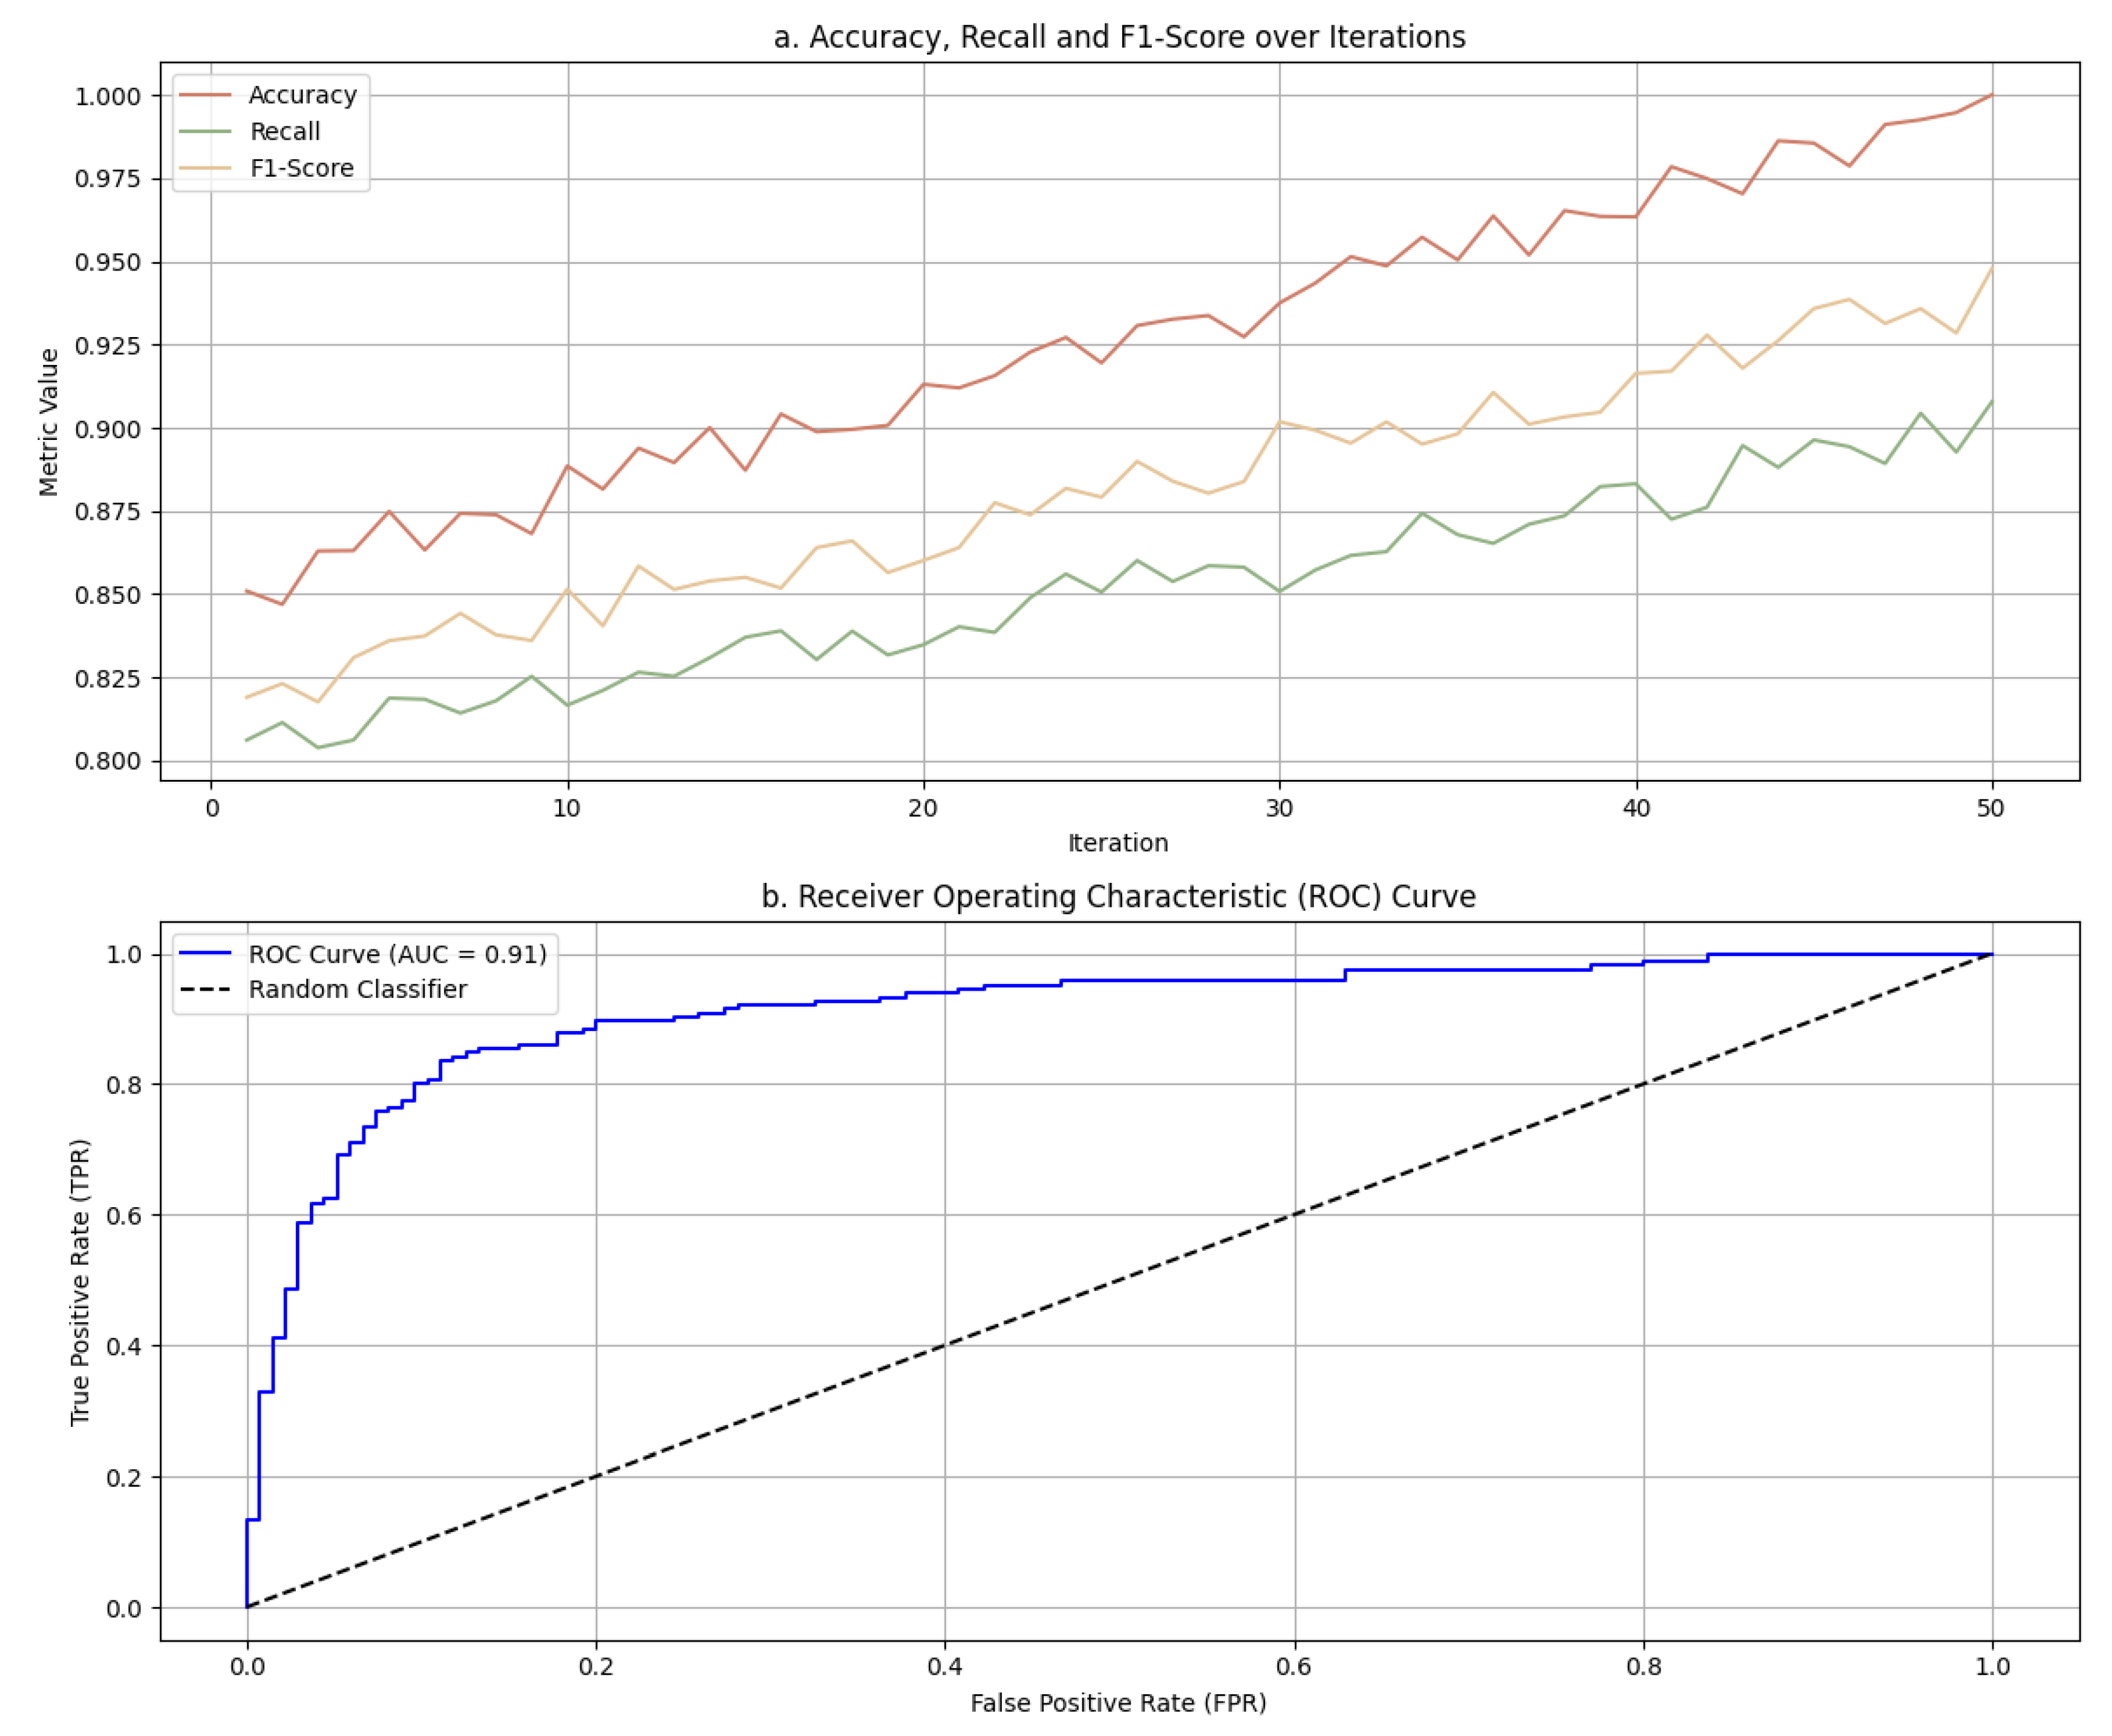

Table 1.
Algorithm performance evaluation with different data complexity.
| Data Complexity | Model | Accuracy (%) | Recall (%) | F1-Score (%) | AUC (%) |
|---|---|---|---|---|---|
| Low-Dimensional | LSSVM | 85.3 | 84.1 | 84.7 | 91.2 |
| SVM | 82.5 | 80.3 | 81.1 | 88.7 | |
| High-Dimensional | LSSVM | 80.5 | 79 | 79.7 | 89.6 |
| SVM | 75.8 | 74.3 | 74.9 | 85.2 |
Table 2.
Performance comparison of LSSVM algorithm model before and after optimization.
| Model | Optimization Level | Accuracy (%) | Recall (%) | F1-Score (%) | AUC (%) |
|---|---|---|---|---|---|
| LSSVM | Unoptimized | 85.3 | 84.1 | 84.7 | 91.2 |
| LSSVM | Optimized (Feature Selection + Hyperparameter Tuning) | 88.4 | 86.8 | 87.5 | 92.8 |
Disclaimer/Publisher’s Note: The statements, opinions and data contained in all publications are solely those of the individual author(s) and contributor(s) and not of MDPI and/or the editor(s). MDPI and/or the editor(s) disclaim responsibility for any injury to people or property resulting from any ideas, methods, instructions or products referred to in the content. |
© 2025 by the authors. Licensee MDPI, Basel, Switzerland. This article is an open access article distributed under the terms and conditions of the Creative Commons Attribution (CC BY) license (http://creativecommons.org/licenses/by/4.0/).
Copyright: This open access article is published under a Creative Commons CC BY 4.0 license, which permit the free download, distribution, and reuse, provided that the author and preprint are cited in any reuse.


