1. Introduction
Cardiovascular disease (CD) is a general denomination for an illness that affects the blood vessels and the heart tissue [
1]. According to the Brazilian Society of Cardiology, the CD is between Brazil’s prior causes of fatalities and the world (confirmar com a WHO). [
2]. It is believed that cardiac insufficiency, heart attacks, atrial fibrillation, and arterial hypertension affect approximately 45,7 million people in Brazil, that is, 32% of the adult population [
3]. [
4] An estimated number of obits in Brazil was disclosed as about 400 thousandth people in the year 2019, the primary cause of death in that year.
The CD treatment and diagnosis demand high budgets for the public health service and derate the well-being of the population. A high priority is necessary with investments in prognosis and prevention, which must significantly impact productivity losses and the high costs of posterior treatments [
4].
An interesting approach to improving the attention of patients with CD is telemedicine. Telemedicine focusing on CD is associated with a reduction of cost treatment, international, and readmissions, as well as a decrease in mortality rate and better patient comfort and satisfaction [
5].
In the work [
6], the comparative effectiveness of telemedicine interventions with conventional healthcare in patients with cardiac insufficiency was examined, and it found that medically supported telemedicine systems were more effective for adults, particularly in reducing all-cause hospitalization, cardiac hospitalization, all-cause mortality, cardiac mortality, and length of stay. In [
7], a case study of the use of telemedicine with the auxiliary tool of artificial intelligence in the city of Tarumã - SP is presented, in which there was a 21% decrease in premature deaths due to cardiovascular diseases and 25% in premature deaths due to circulatory diseases.
To detect CD and to give an accurate diagnosis, the electrocardiogram - ECG - is one of the main types of test/exam, and the innovation trends and available technologies make this exam vary adherent to telemedicine procedures . It consists of recording the variation in the bio-electrical activity of the heart, which represents the cyclic contractions and relaxations of the human heart muscle and provides important information about the functional aspects of the heart and the cardiovascular system [
8]. It is a procedure that has the benefits of having well-defined parameters, low cost, and high sensitivity in detecting CD [
9]. The use of AI in analyzing ECG signals to detect arrhythmia and CD has been a trend. [
1] stated that automation is necessary to reduce errors and human burden during the interpretation of ECG signals is shown to have better performance in ECG classification/ measurements and also showed that automated classification/measurements of ECG signals can improve the accuracy and efficiency of diagnoses.
Heart rate - or heart rhythm or cardiac frequency, is one of the most relevant measures that can be estimated via ECG signals, and its unity is beats per minute (bpm); its measure has a diversity of applications, e.g., [
10]. Interpreting this measure is more significant if it can be detected in small windows than a single computation of a mean in larger time intervals. The variability of the heart rhythm in short time intervals [
11] can be a rich signature to help classifier systems in automated diagnosis. Several works in the specialized literature approach the cardiac frequency estimation with different sensors, systems or methods to estimate this paramount quantity to diagnosis tools [
12,
13,
14,
15,
16,
17,
18,
19].
In this work, an LPC-based automated heart rhythm estimator based on the reconstruction and error of the ECG signal with low-order linear prediction coefficients is concept-proved in an experimental test bed. The method was previously described in [
20] in a theoretical and simulated test and comparison with other methods using some canonical datasets . The prototype system composed of an ESP32 microprocessor module and an AD8232 ECG signal conditioning module is described in the next section, and the experimental tests conducted using a synthetic ECG wave produced with a Tektronix AFG1022 function generator are plotted in the results section. The last section reports some conclusions and the perspective for future works.
2. Materials and Methods
2.1. Electrocardiogram Signals
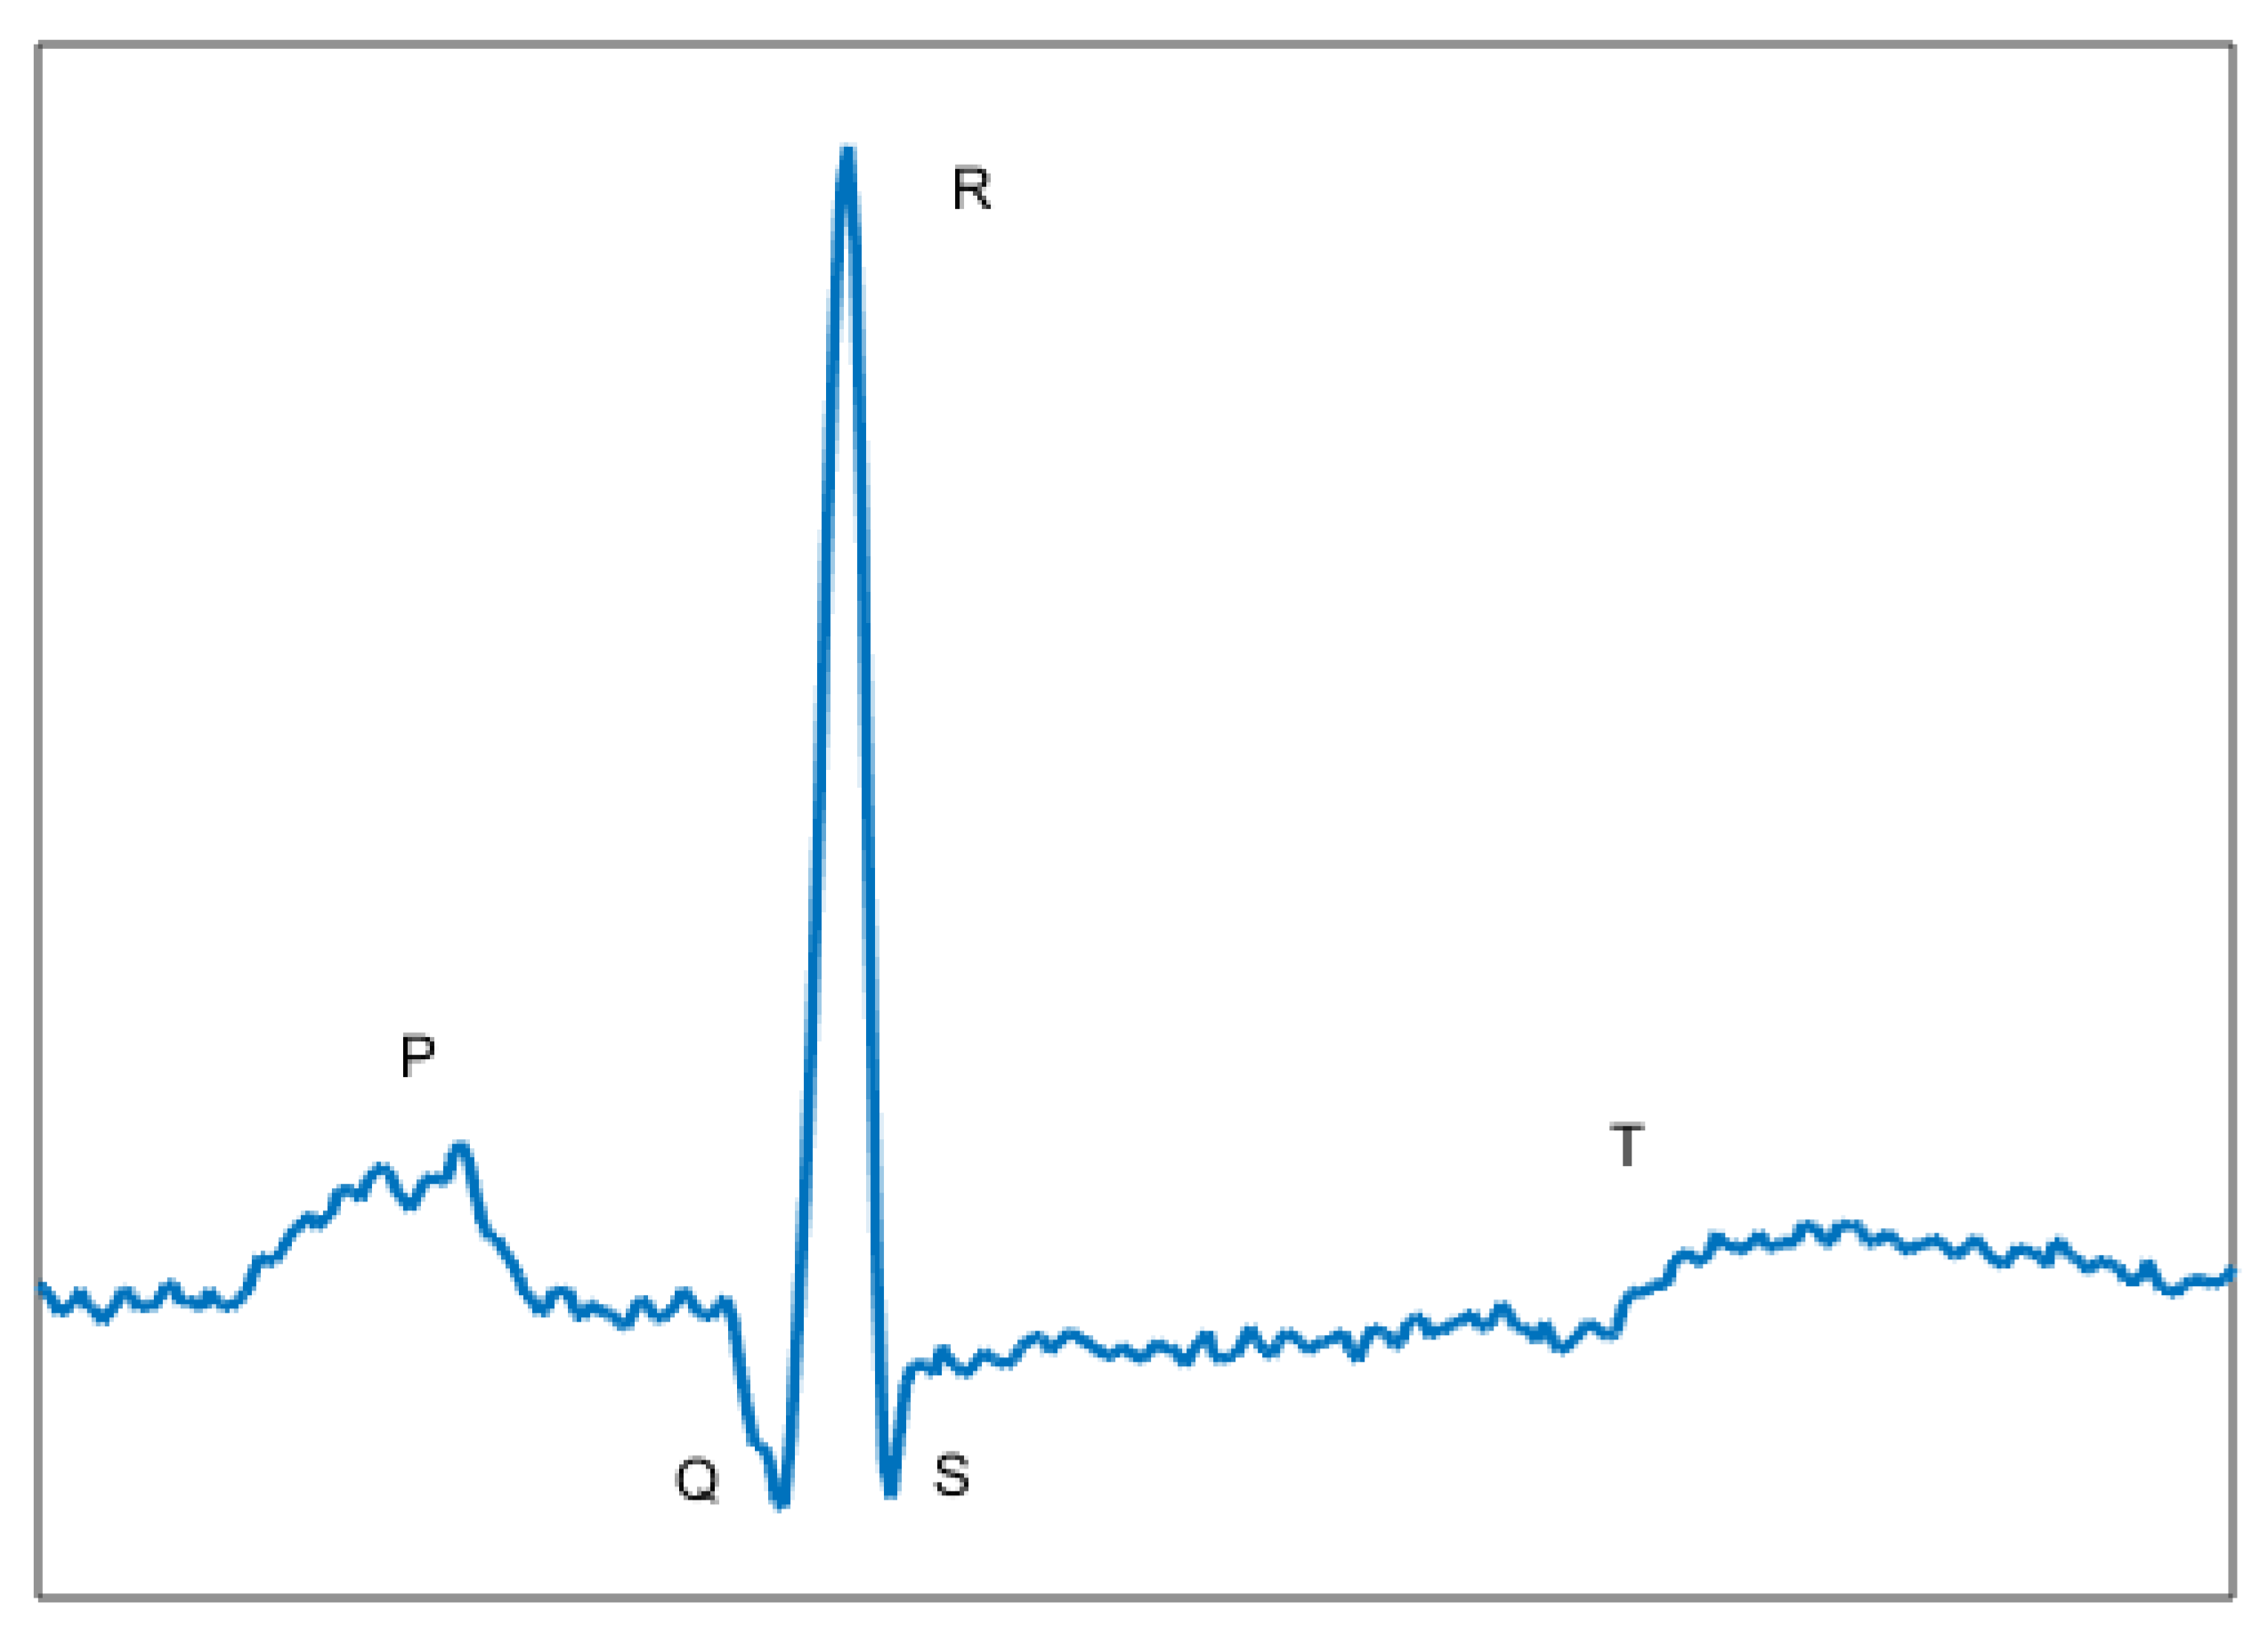
The ECG signal (
Figure 1) carries information about biological changes that occur in the heartbeat generated by stimulus from the ventricle and atrium. The signal presents three major characteristics: Length given in samples (or seconds), amplitude in milivolts and morphology, where it is possible to identify your waveform.
In
Figure 1 is shown the major waves of the ECG signal: P wave, QRS complex and T wave. The QRS complex is composed of the Q, R and S waves [
21]. In the majority of cases, the cardiac events occur in these waves. For that, a large amount of research has focused on the complex QRS.
In the tests with the system, a Tektronix AFG1022 Arbitrary Function Generator is used to give a reference ECG with a known set of cardiac frequencies, and the signals were then injected in the acquisition interface to a real time processing.
2.2. Linear Prediction Coefficients Filtering
2.2.1. LPC—Linear Prediction Coefficients
The fundamental idea of LPC is to express the one-step prediction
of a discrete signal
from its previous
p samples [
22,
23], whose difference equation is given by
where
are the coefficients of LPC and
p is the order of the predictor.
The estimation error
is then:
Knowing the Equation
1, the Equation
2 can be rewritten as
whose linear prediction coefficients
minimize the mean square of error
and can be found using the Equation
4
where
is given by
The error signal
is sensible to sudden variations of signal
due the behavior of high-pass filter, as can be deduced applying
-Transform to error
(
3).
This property is used in the estimation of the heartbeat. The method is presented in the next section.
2.3. LPC: Heart Rhythm Estimation
Knowing most researches about characteristic extraction of ECG signals are focused on QRS complex, in this paper, it is proposed the use of a method based on LPC for identification of the instants when occurring the QRS complex.
To understand the method, let considers the discrete-time ECG signal
, whose samples can be predicted from the signal
obtained by the 4th-order (
p=4) LPC model (
1). From the difference
, it is determined
which is sensible to high-frequency components, and consequently, to the variations of the signal level in the QRS complex. In this way, threshold search can be easily applied on
to retrieve information about heart rhythm, as can be seen in
Figure 2. Since the error signal carries only high frequency in this band, the off-set, drift caused by spurious interference and even possible
T wave prominence are absent. Then, the threshold logic detection of the peaks is effective.
The chosen threshold for detection has some degree of subjectivity [
24]. However, given a sorted sequence in ascending order of the normalized absolute value of the error error:
its acceptable to discard the 10% greater values of the samples in
, generating a truncated sequence,
. Considering that this new sequence gives to the spiking events a good prominence, a reference to the threshold can be computed using the median
:
and, finally taken an adequate calibration for the threshold as:
Adequate values for the parameter
for use with the MIT database were founded to
. A sample
m is then considered as and event to be marked if the condition
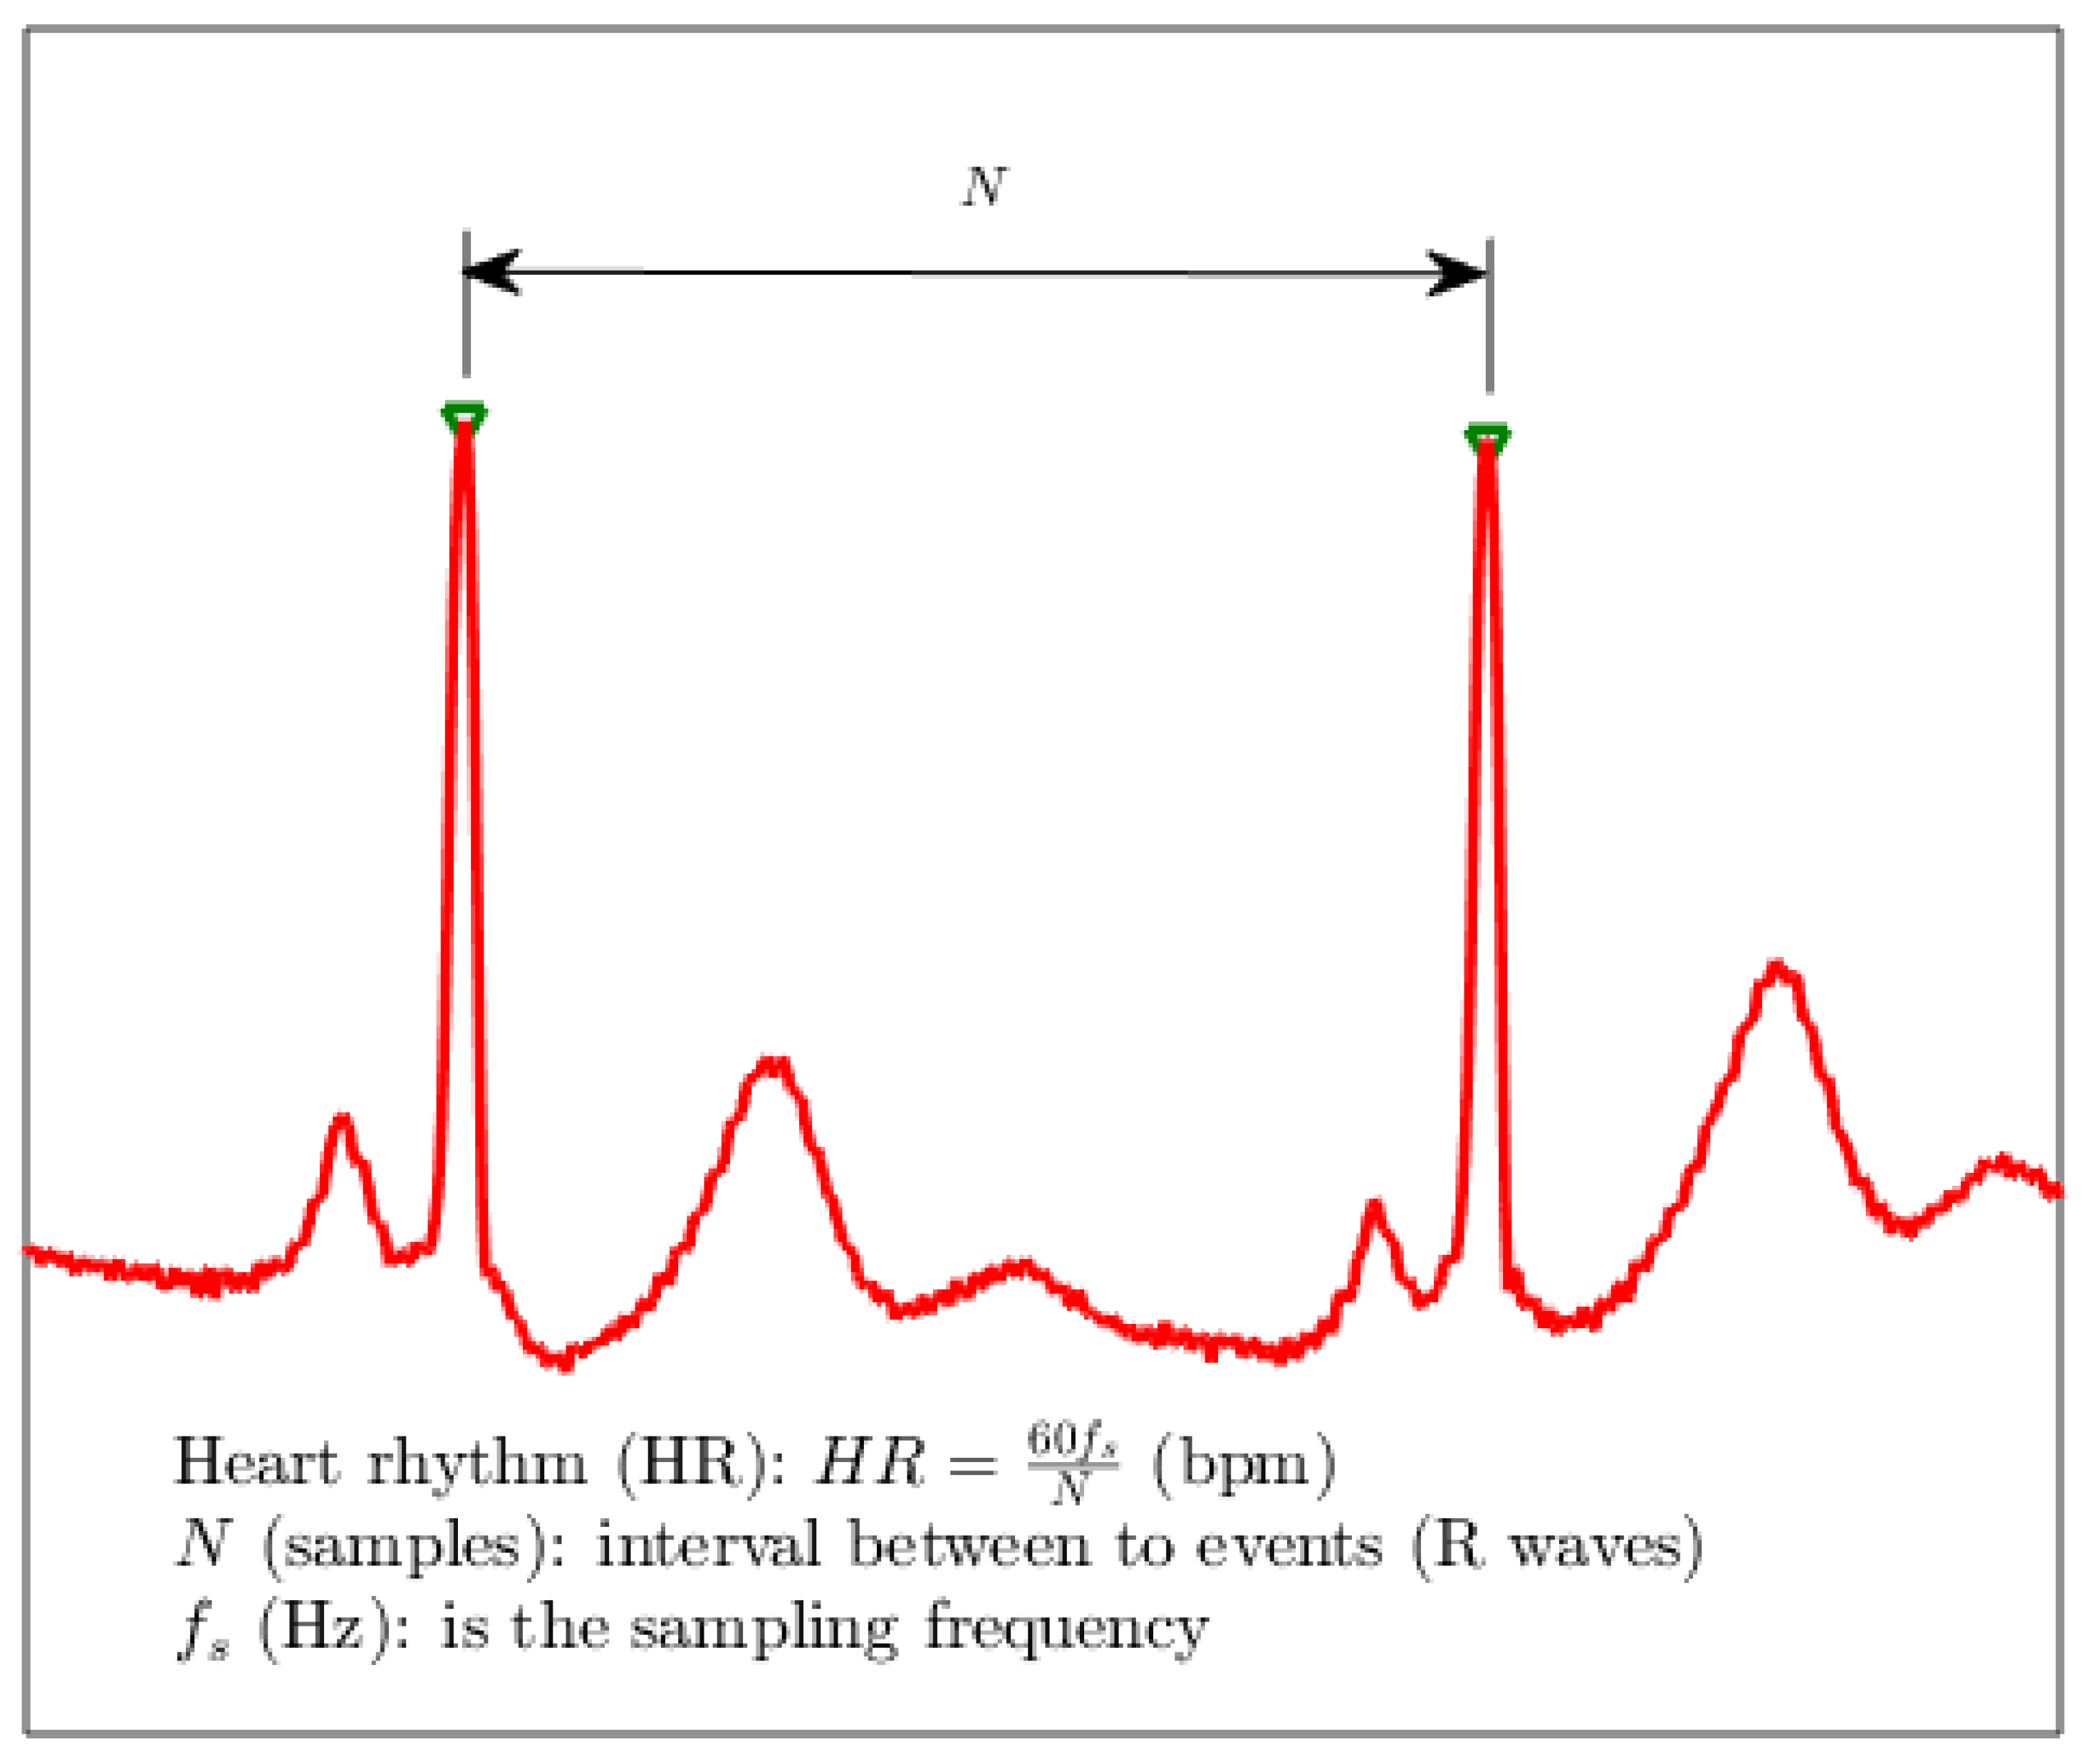
is matched. For each two consecutive marked samples
and
with
, the heart rhythm
in beats per minute (bpm) can be estimated as:
in which
is the sampling frequency in hertz.
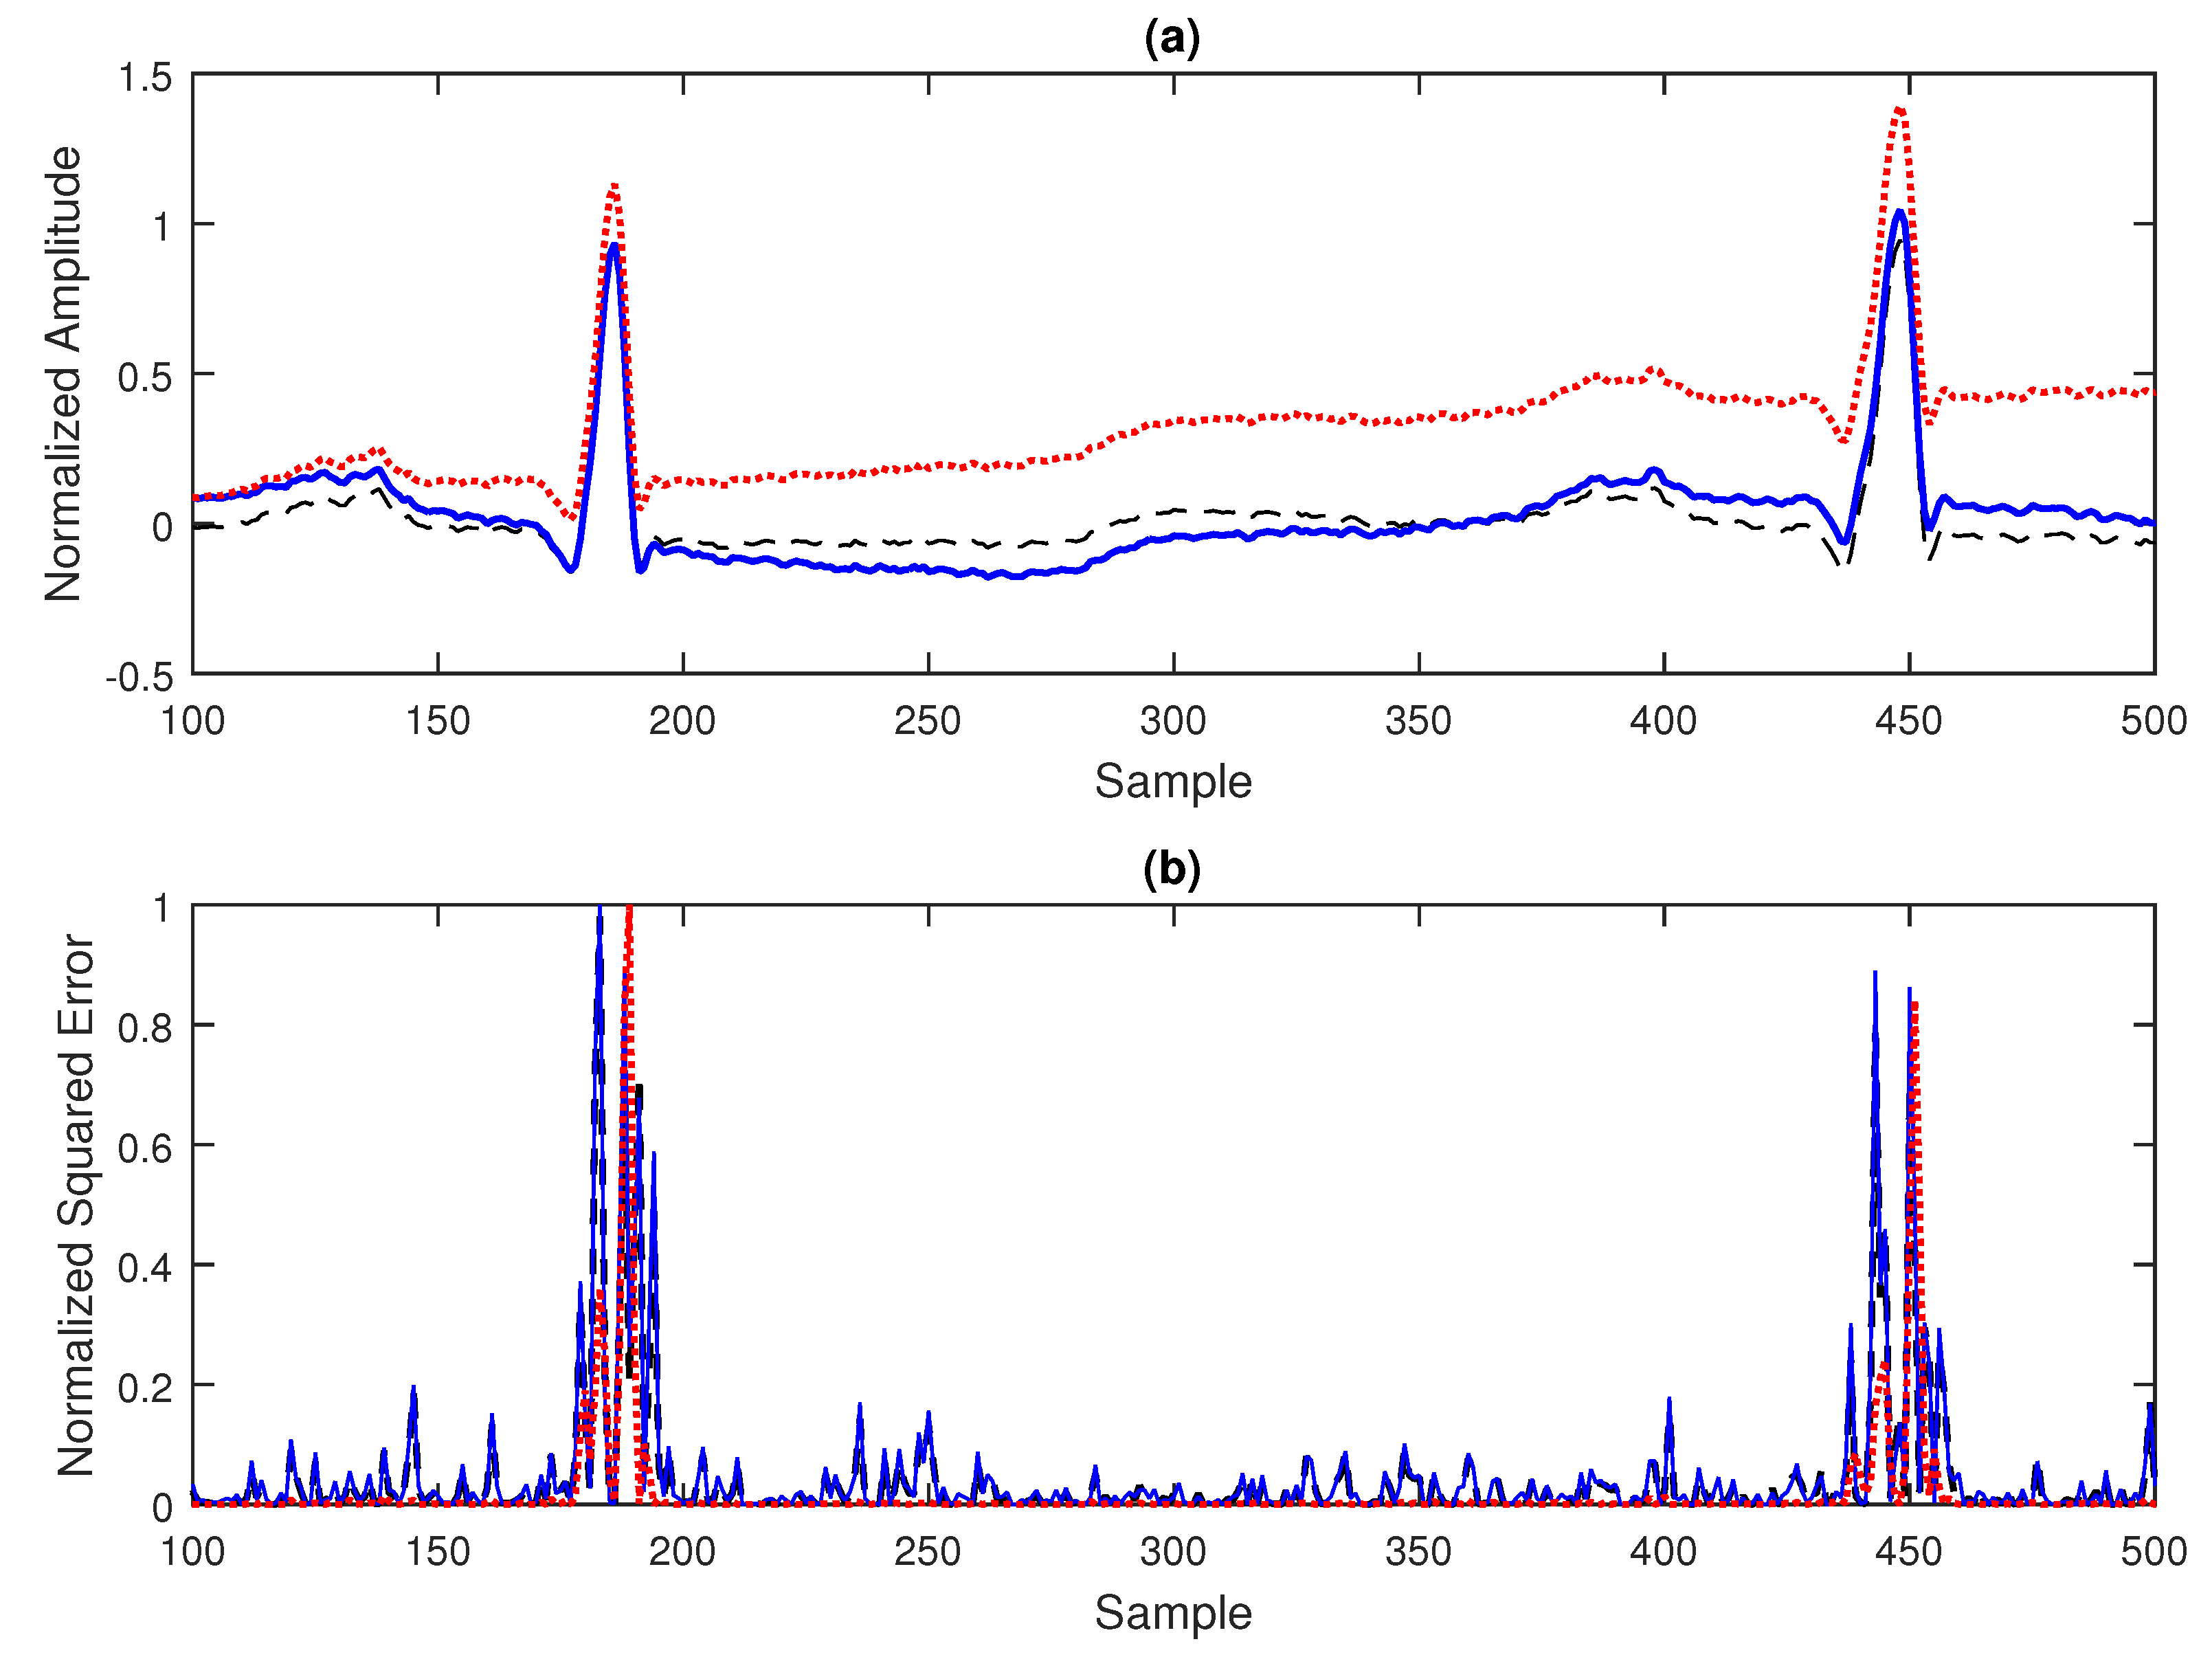
As an example, in
Figure 3(a), an excerpt form a ECG signal from the MIT database with correction of baseline is displayed in your basal state and also contaminated with wanderer and drift spurious signals. In the
Figure 3(b), one can see the very similar pattern for the normalized squared error
2.4. Experimental Setup
Having understood the dynamics of the ECG signal and the technological trends in their diagnosis, the system specification was initiated according to the classification of [
25], characterized as a single-lead system for outpatient/home medical application, with the purpose of diagnosing diseases and at low cost, identifying itself as a smart system due to the use of IoT, cloud and Artificial Intelligence (AI) technologies. Based on the analyses of traditional ECG systems and Smarts Health Care presented in [
26,
27] and considerations on the form of data acquisition and preprocessing (filtering, resampling and normalization), some functional requirements were established:
Sampling rate 250 samples/s and 12-bit resolution;
Use of instrumentation amplifier;
0.5 to 40 Hz bandpass filter or a high-pass filter together with a low-pass filter;
Notch filter at 60 Hz;
Use of processor compatible with the implementation;
Use of 1GB micro-sd-card electronics;
Use of LCD, TFT or OLED screen;
Use of charge control electronics for lithium-ion batteries;
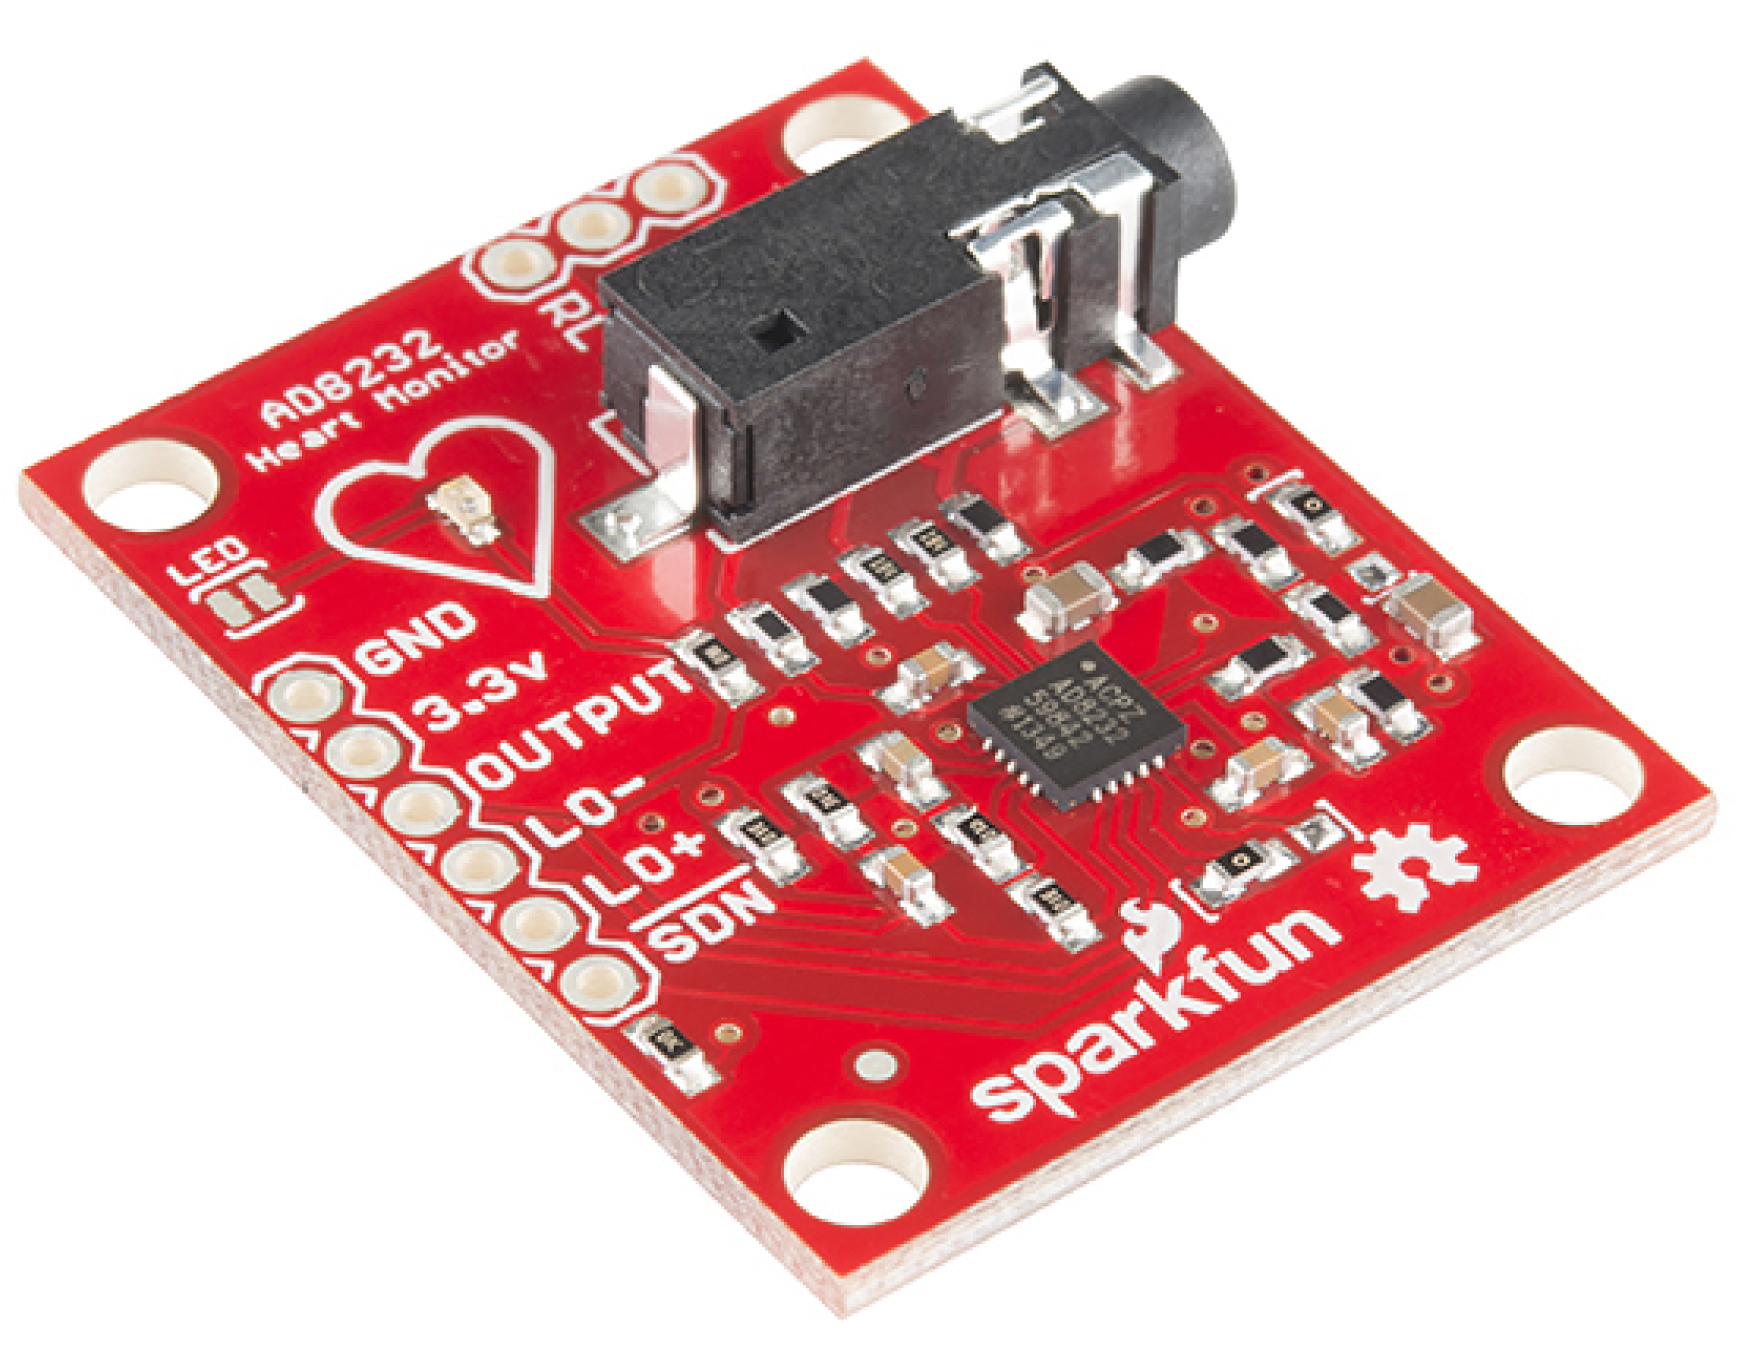
Silver and silver chloride (Ag/AgCl) electrodes and a Sparkfun AD8232 single-lead heart rate monitor module illustrated in
Figure 4 are used for data acquisition and preprocessing. This type of electrode was chosen because it is easy to find and because of its low price, however. The Sparkfun AD8232 module is an electronic board based on the Analog Devices AD8232 integrated circuit that is designed to extract, amplify, and filter small biopotential signals in the presence of noisy conditions, such as those created by motion or remote electrode placement. The configuration implemented in Sparkfun’s AD8232 is to obtain an ECG waveform with minimal distortion, with a second-order high-pass filter and cutoff frequency of 0.5 Hz followed by a second-order low-pass filter and cutoff frequency of 40 Hz with the use of a third electrode for optimal common-mode rejection
1. Since a 60 Hz
notch filter is not implemented via
hardware in the module, it was implemented digitally in the code.
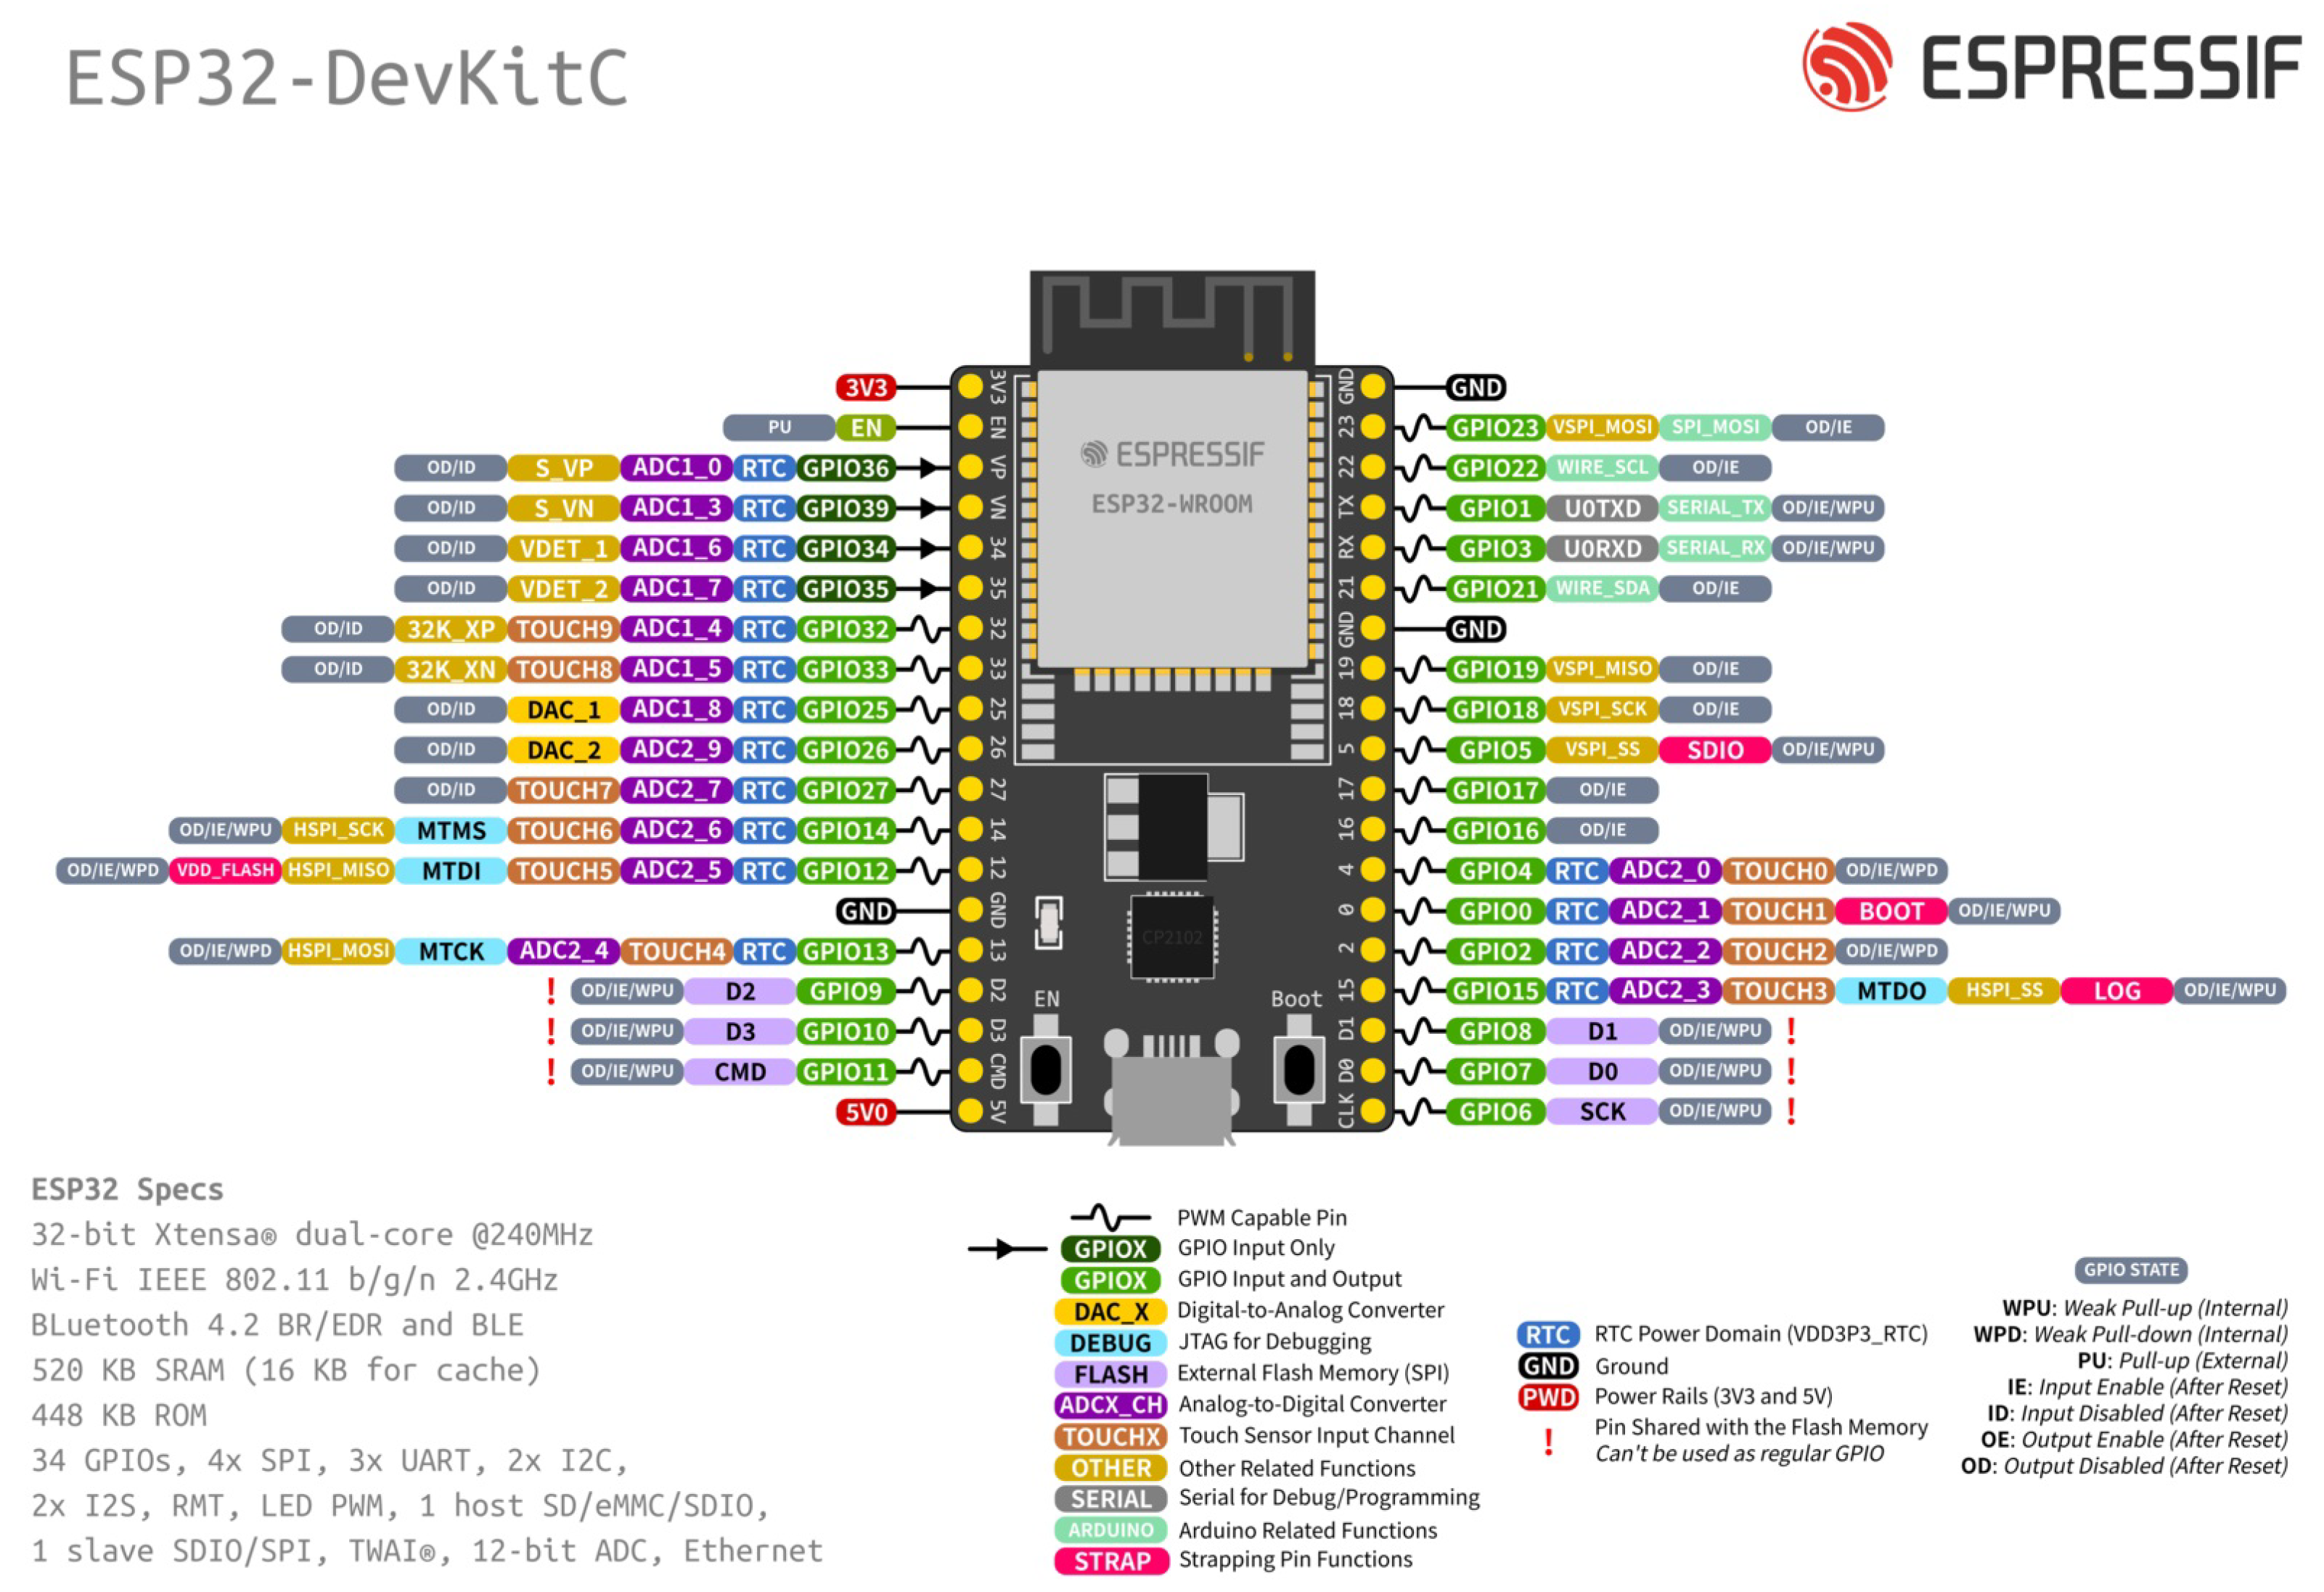
The hardware development (processing) platform chosen to execute the project was the ESP32-DevKit of
Figure 5, which is a small ESP32-based development board produced by Espressif. The ESP32 is a unique integrated circuit that combines 2.4 GHz Wi-Fi and Bluetooth technologies
2 and has a 32-bit 240 MHz single/dual-core Xtensa processor, 448 KB ROM, 520 KB SRAM, 16 KB SRAM in RTC, QSPI supports multiple flash/SRAM chips, 34 GPIOs, 4 SPI, 2 I2S, 2 I2C, 3 UART, 1 host (SD/eMMC/SDIO), 1 slave (SDIO/SPI), TWAI®, RMT (TX/RX), PWM Motor, PWM LED, 12-bit ADC, 2 8-bit DAC, Wifi IEEE 802.11b/g/n (up to 150 Mbps) and Bluetooth v4.2 BR/EDR and BLE. Its choice was based on the relatively low cost of the platform, reasonable processing power, and the availability of integrated Wi-Fi Bluetooth communication, which allows ease of programming and reduction of the prototype size. Although the ESP32 does not have Digital Signal Processor (DSP) functions, the literature shows that it has good performance for implementations in ECG signals [
28,
29].
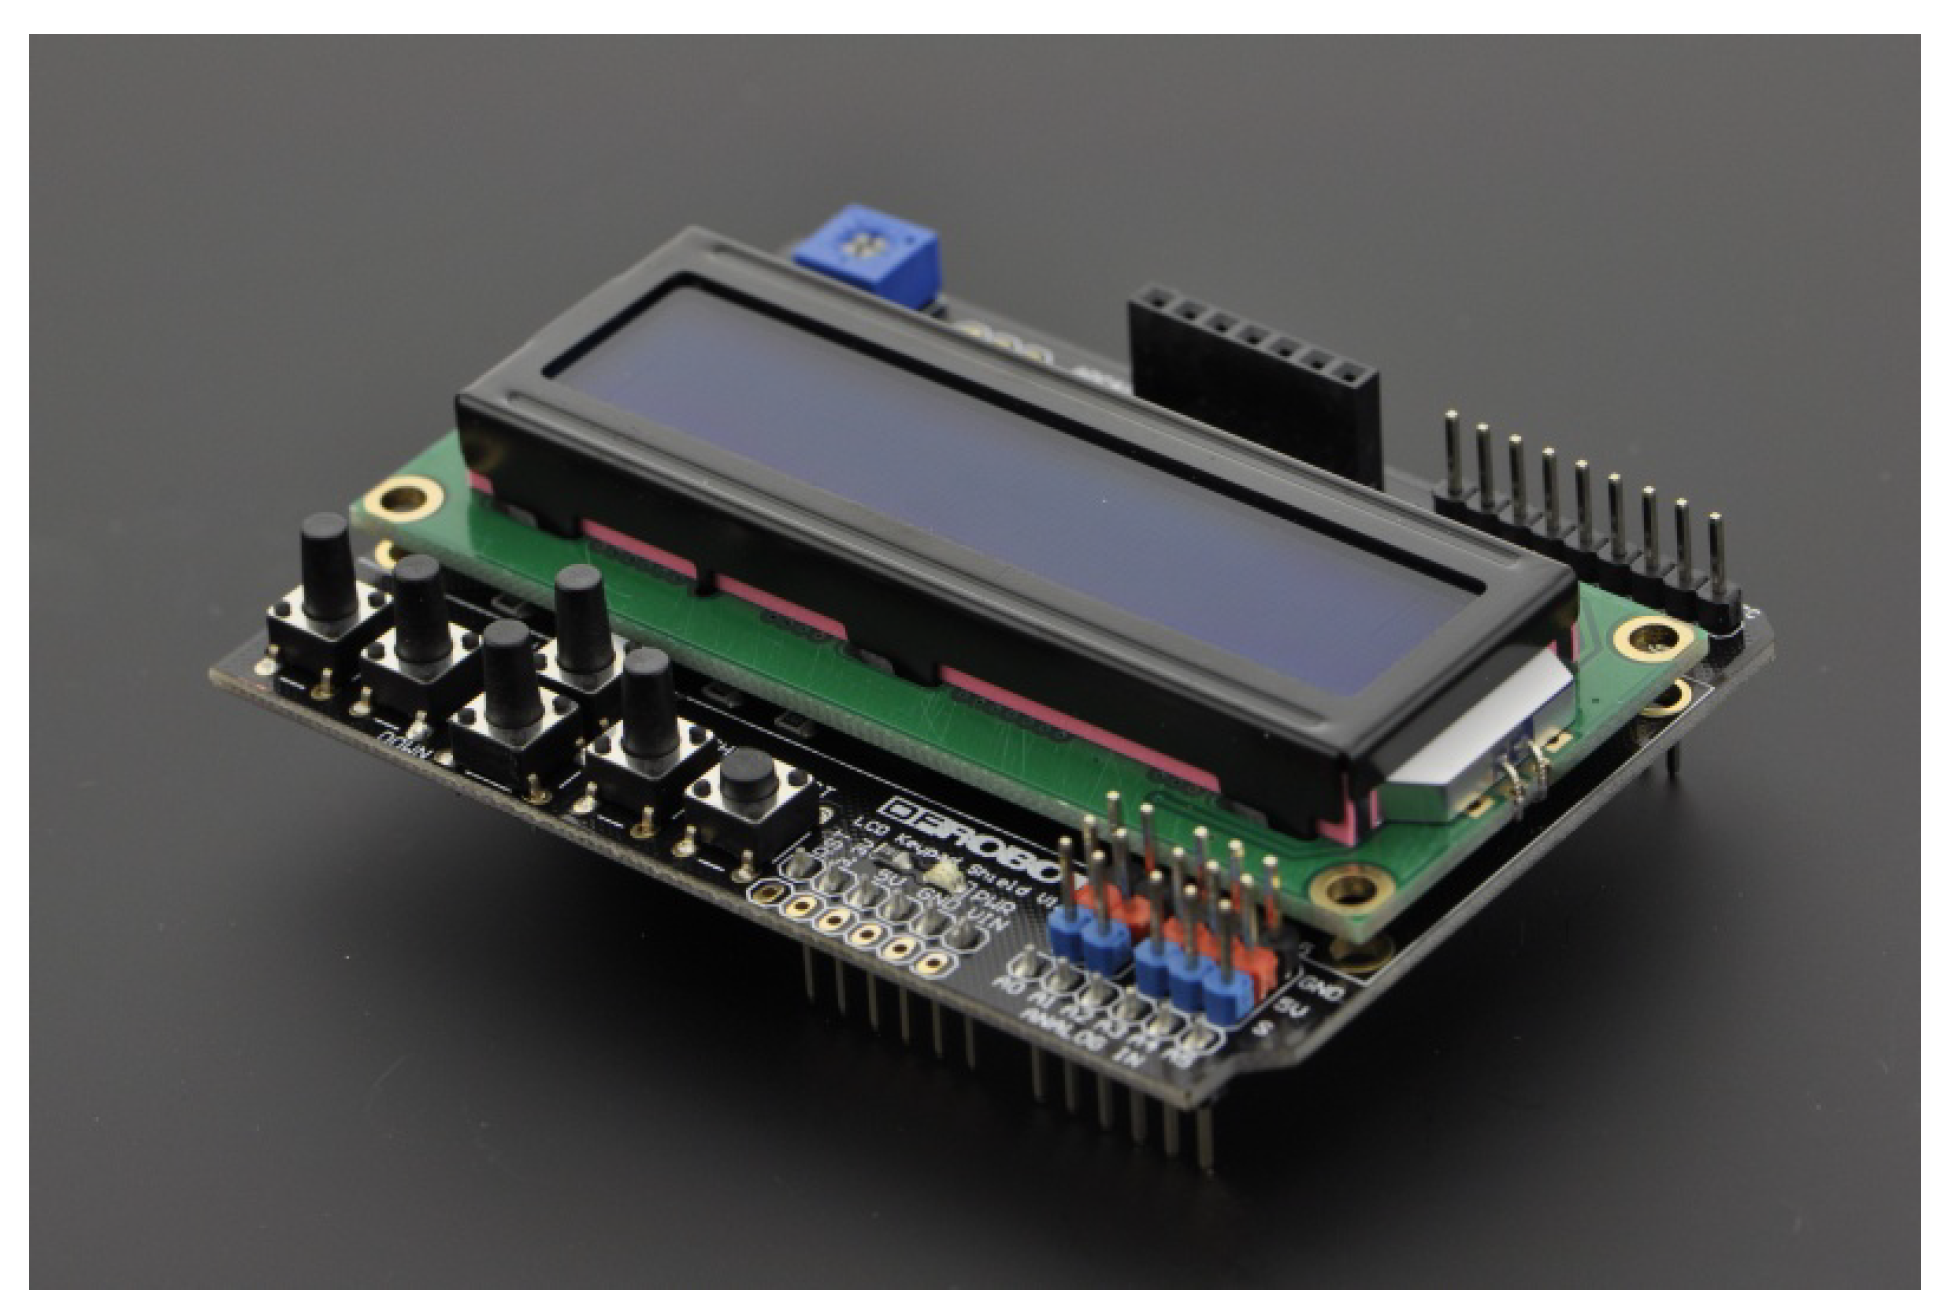
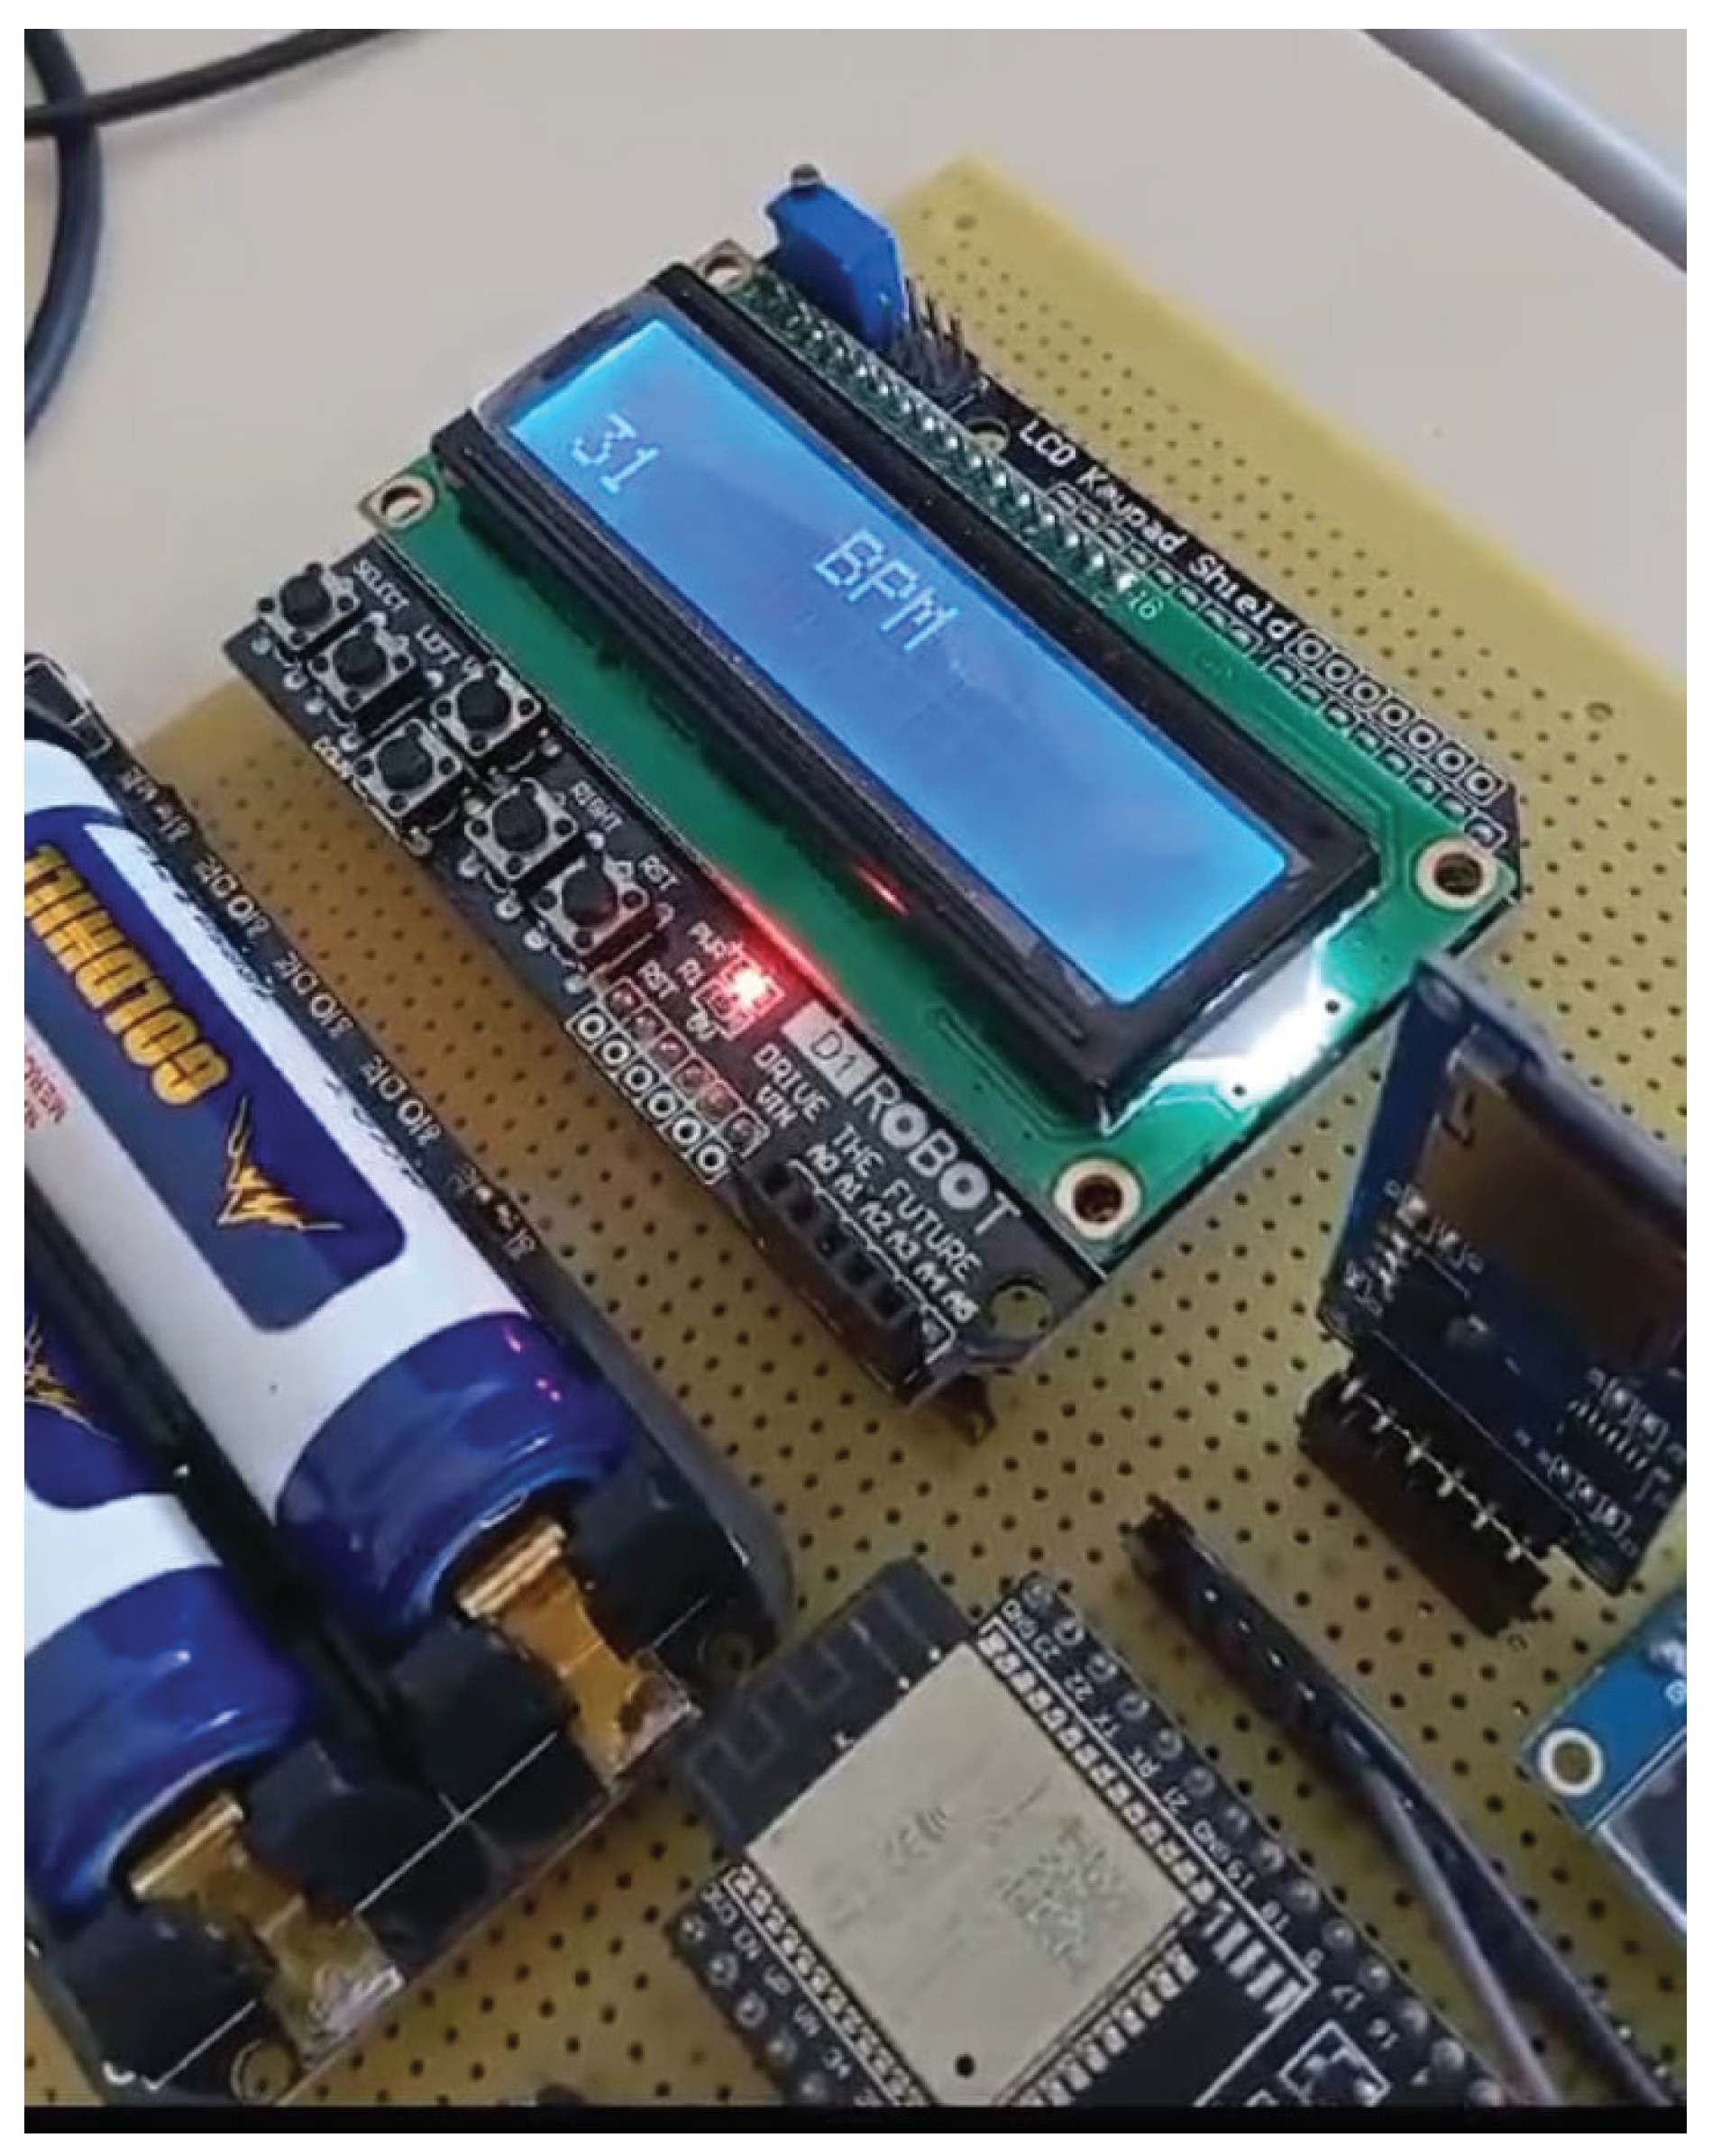
The selected solution for the HMI was DFRobot LCD Keypad Shield
3displayed in
Figure 6. It is a module that allows the development of a navigable interface. It consists of a 16x2 white character LCD with blue backlight and 5 keys that allow selection, up, right, down and left. Initially the system only shows the heart rate value calculated by the LPC method, but a menu can be developed in future versions.
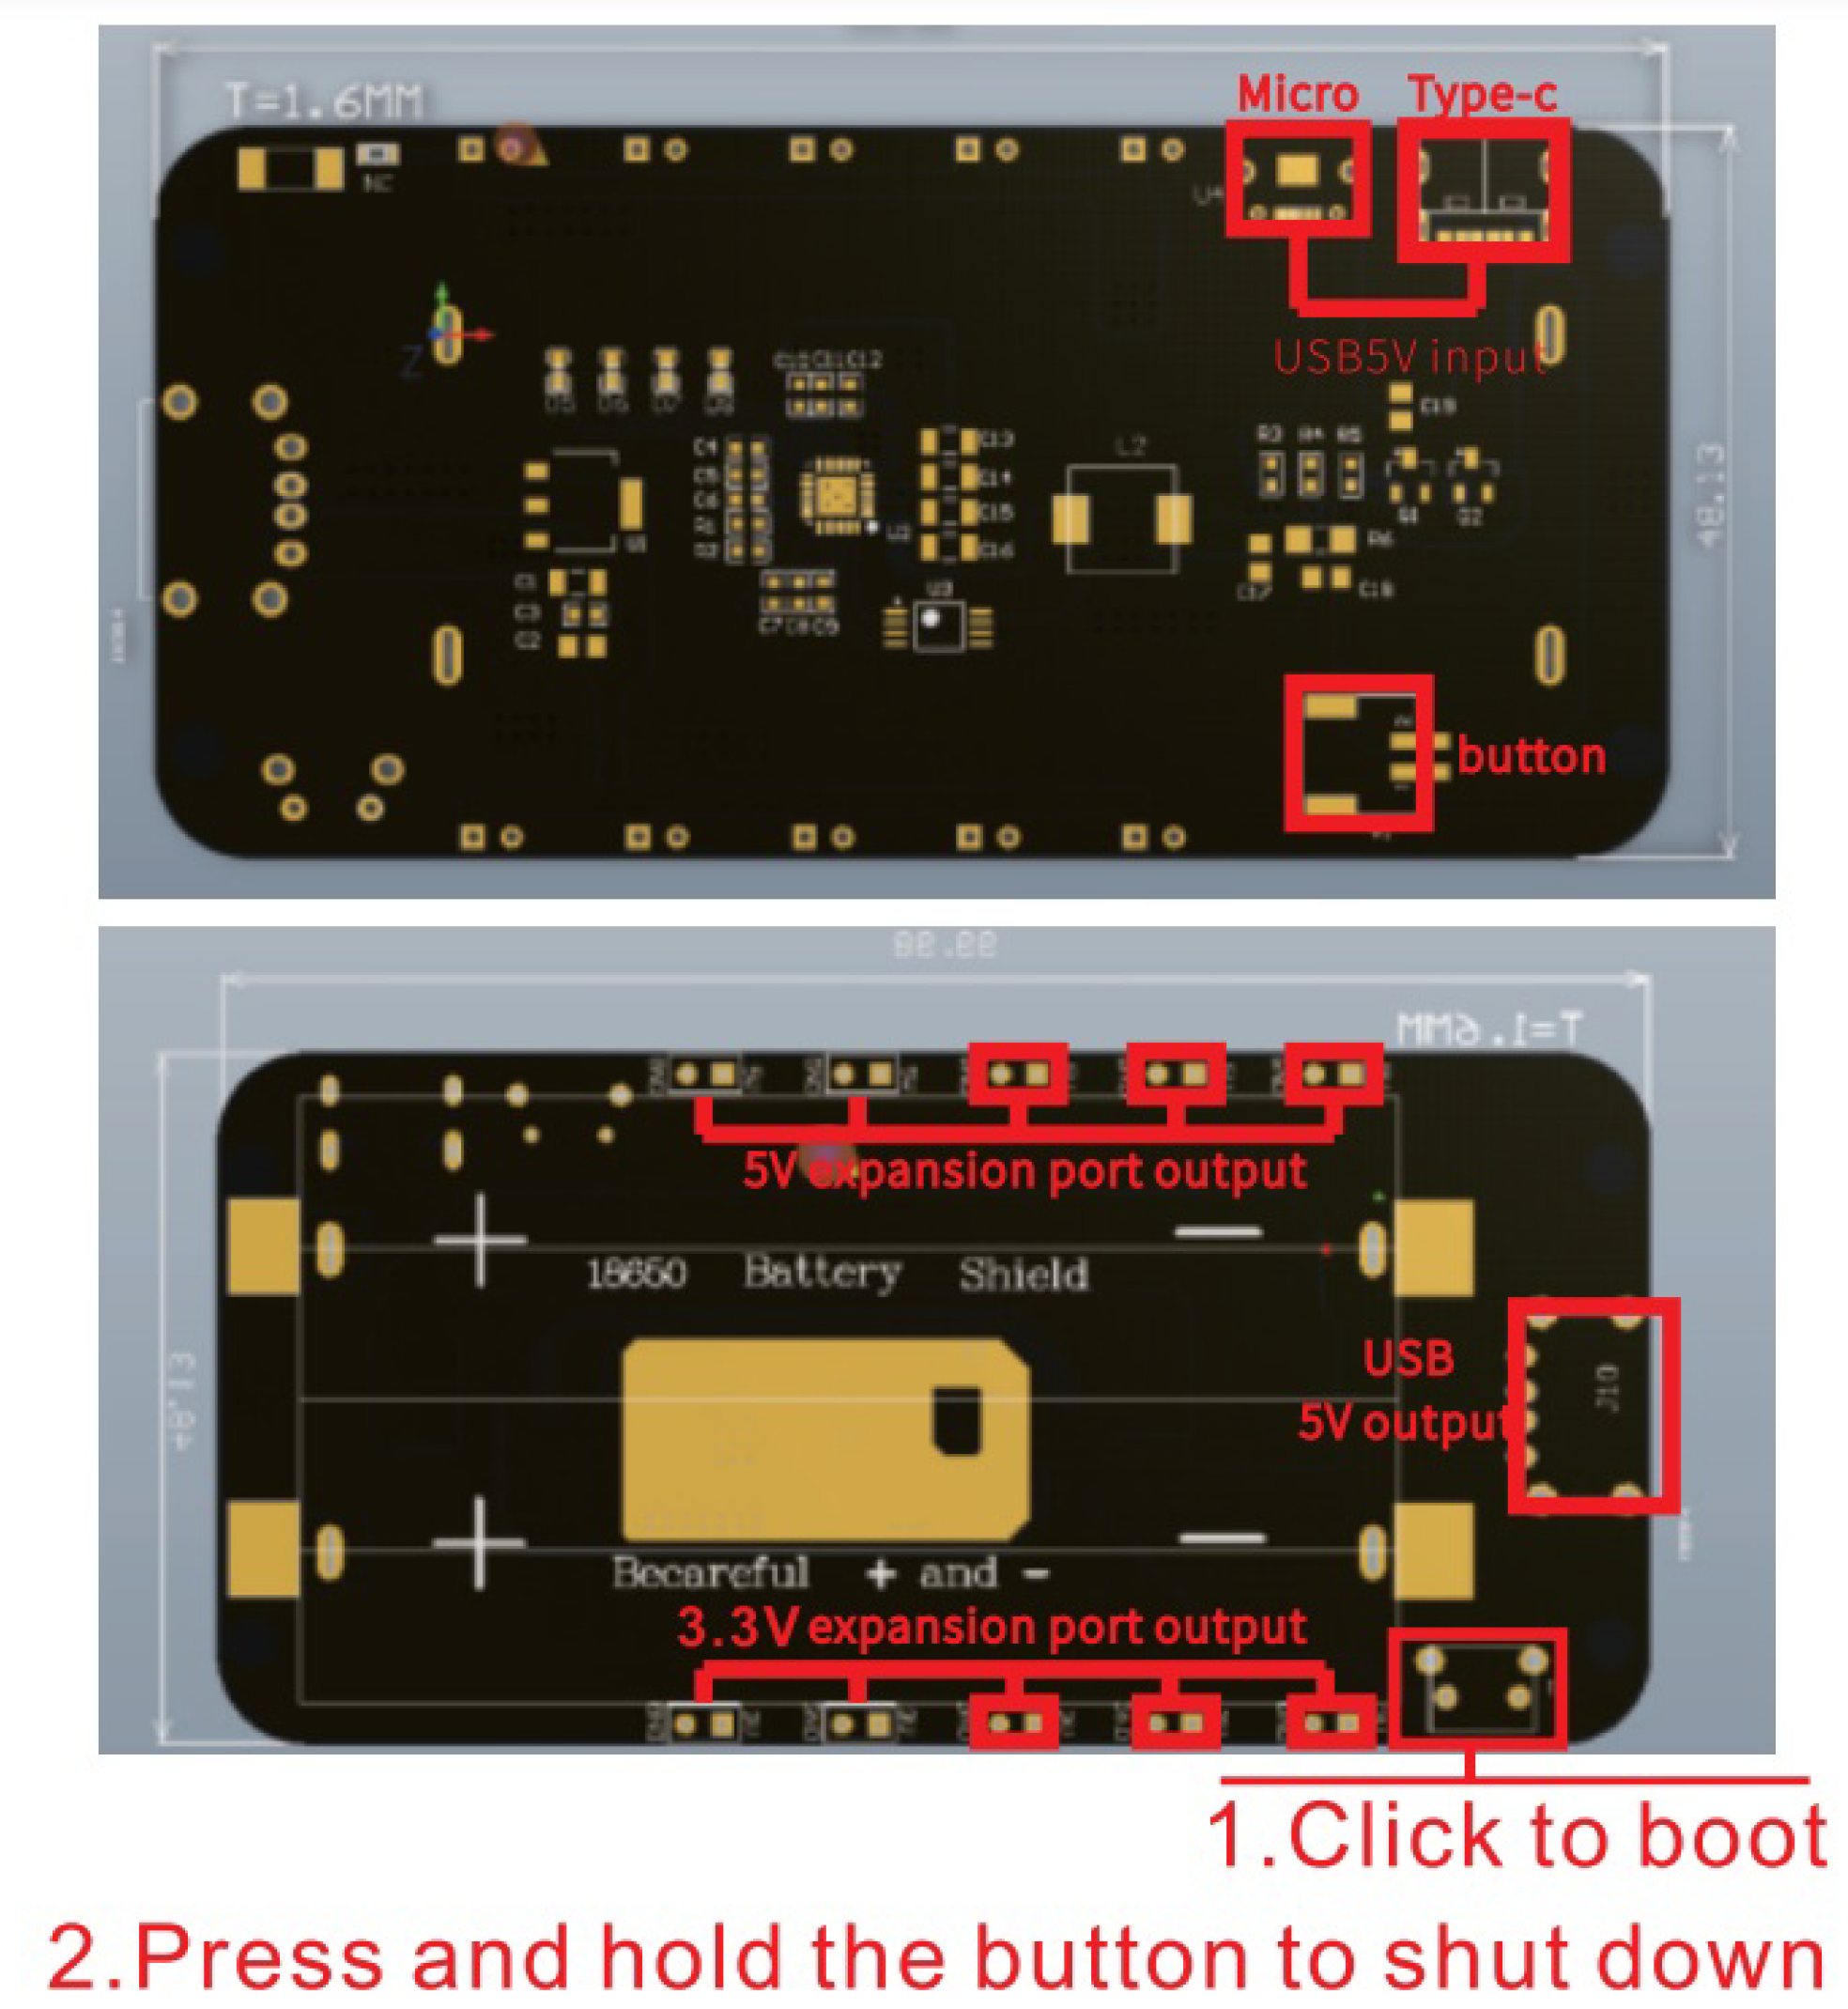
The system is powered by a shield for charging two 18650 Lithium-Ion batteries illustrated in
Figure 7. This has output voltages of 5 volts (2 amps) and 3.3 volts (1 amp), battery overcharge and over-discharge protection, 0.5 amp USB (Micro, C) connectors, and LED indicators for charging and full charge.
MATLAB (Matrix Laboratory) is a programming and numerical computing platform for analyzing data, developing algorithms, and creating models that combine an environment tailored for interactive analysis and design processes with a programming language expressed in matrix and array mathematics
4. It validates the LPC frequency estimation algorithm before deploying the code in the ESP32-Dev-Kit.
The firmware implementation is through Arduino IDE which uses a C++ programming language with some modifications. This choice was based on ease of use, availability of sample codes and libraries for accessing peripherals.
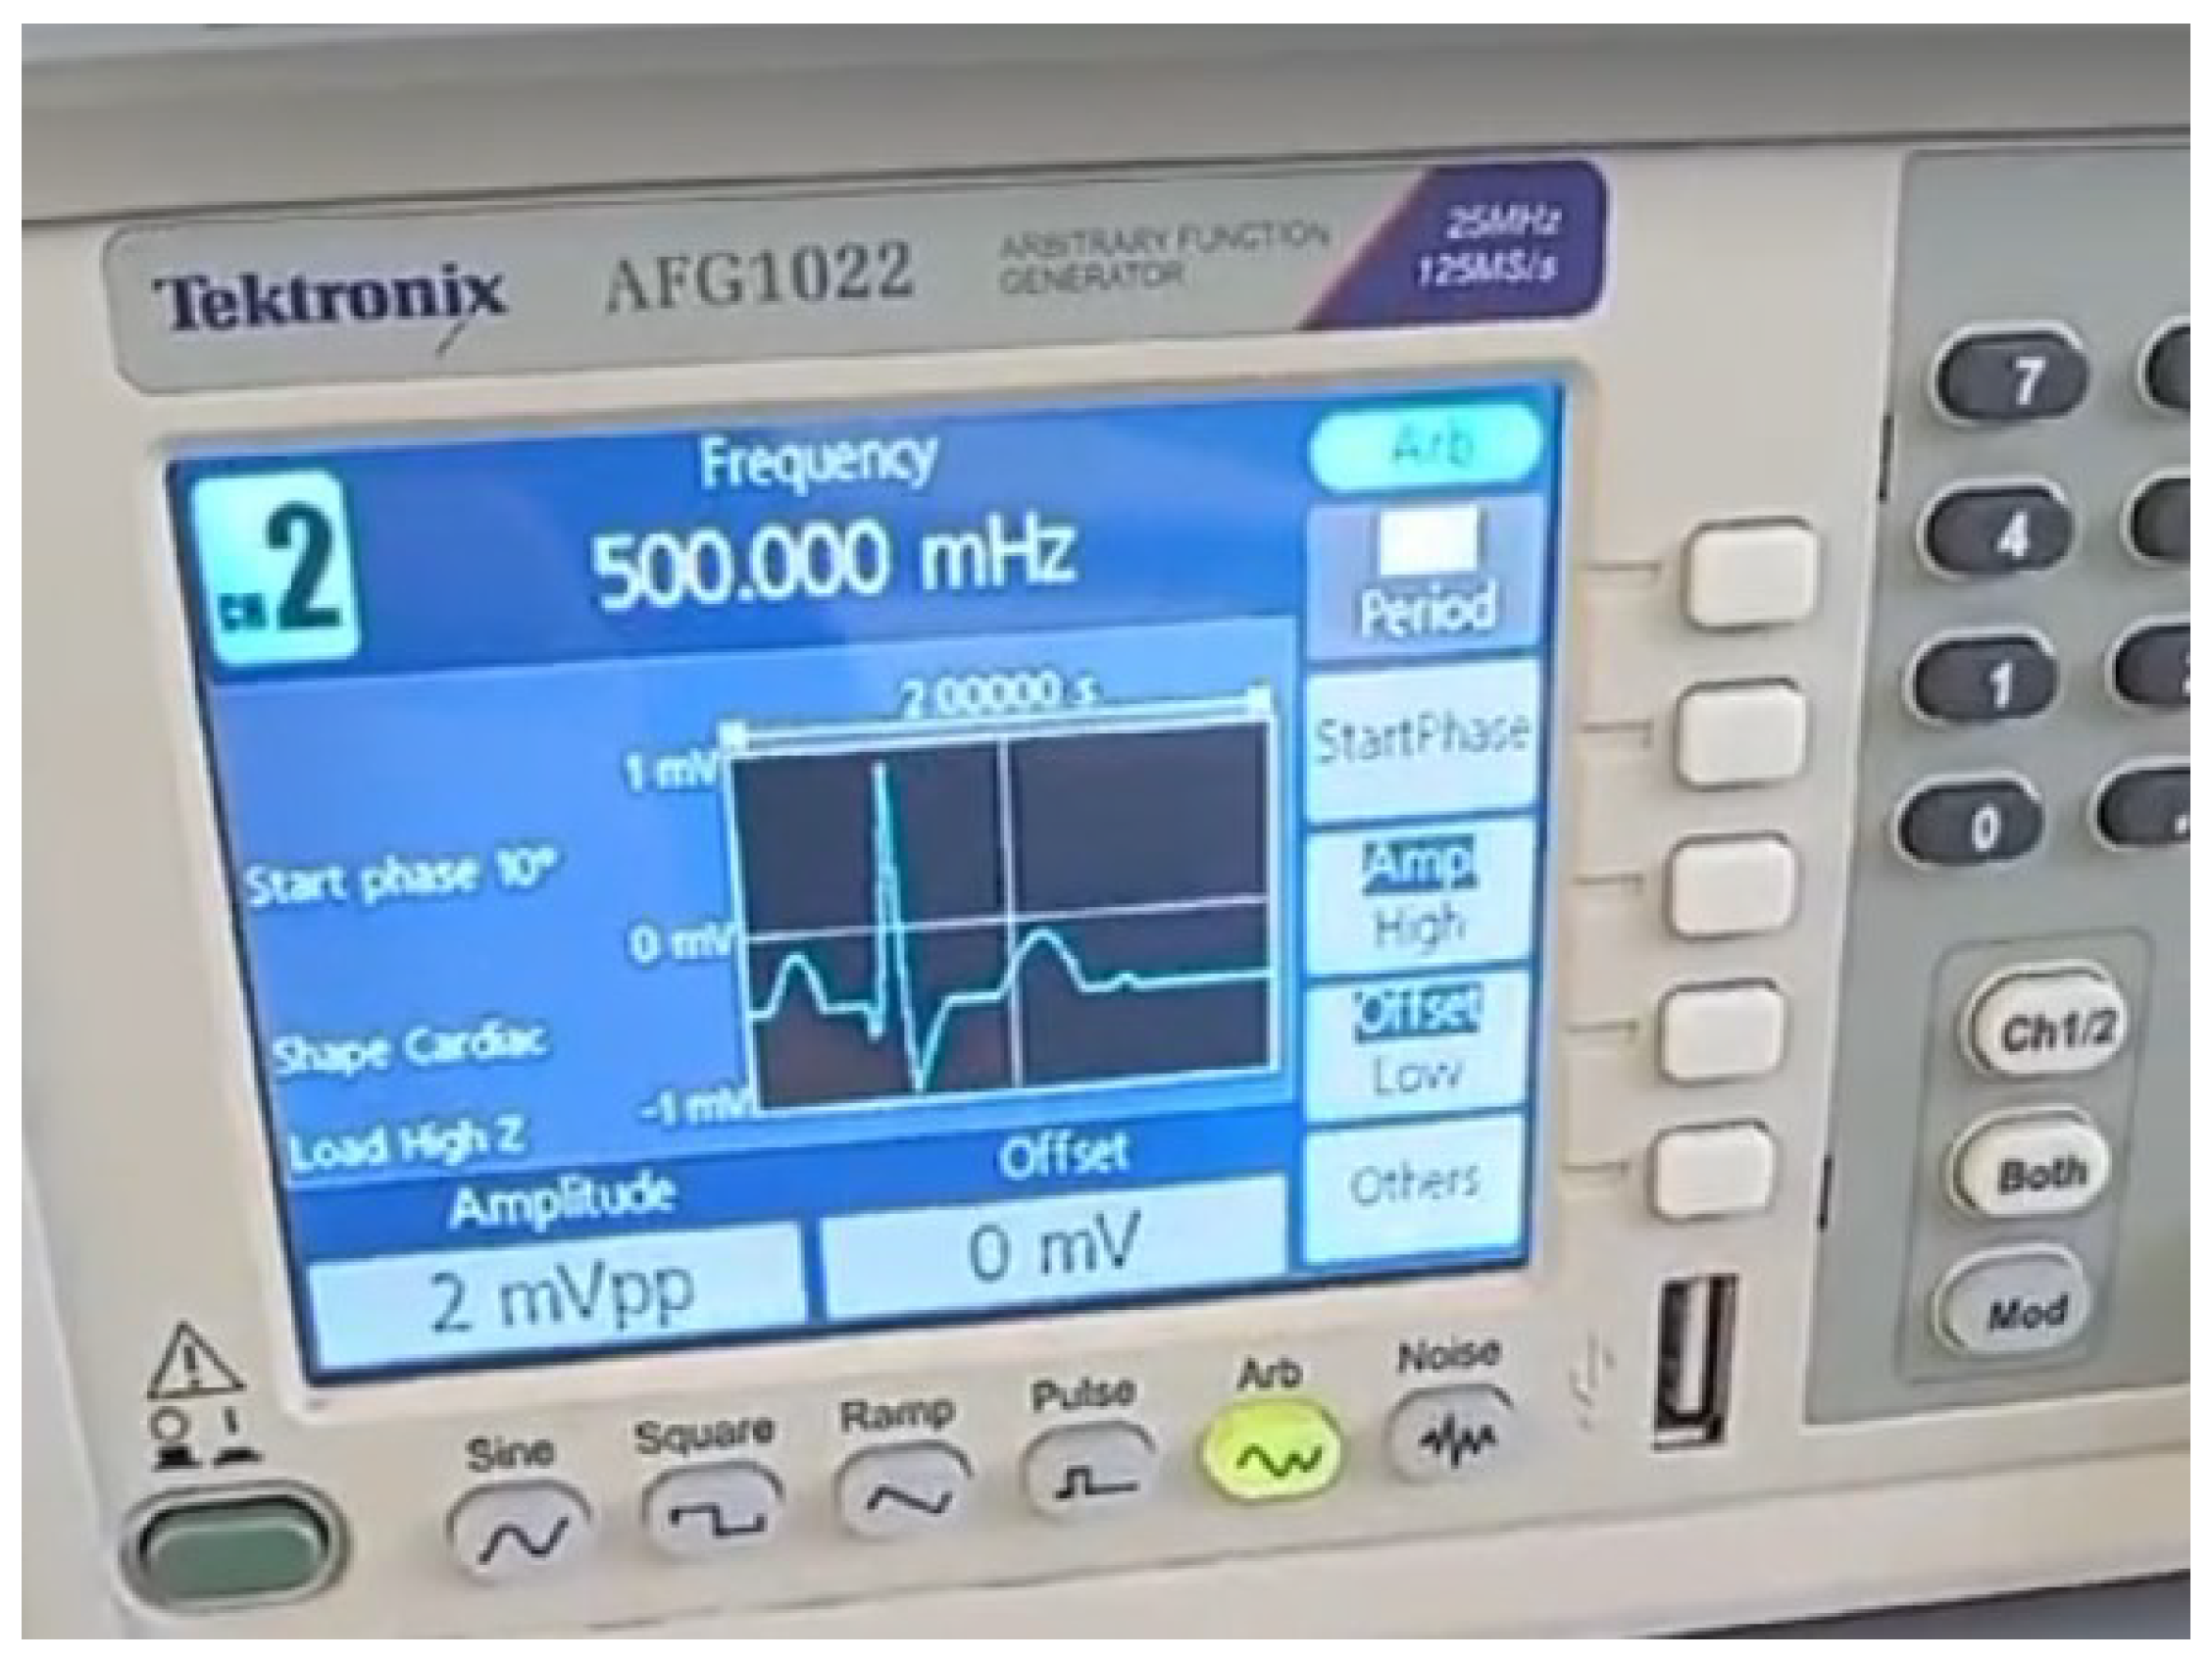
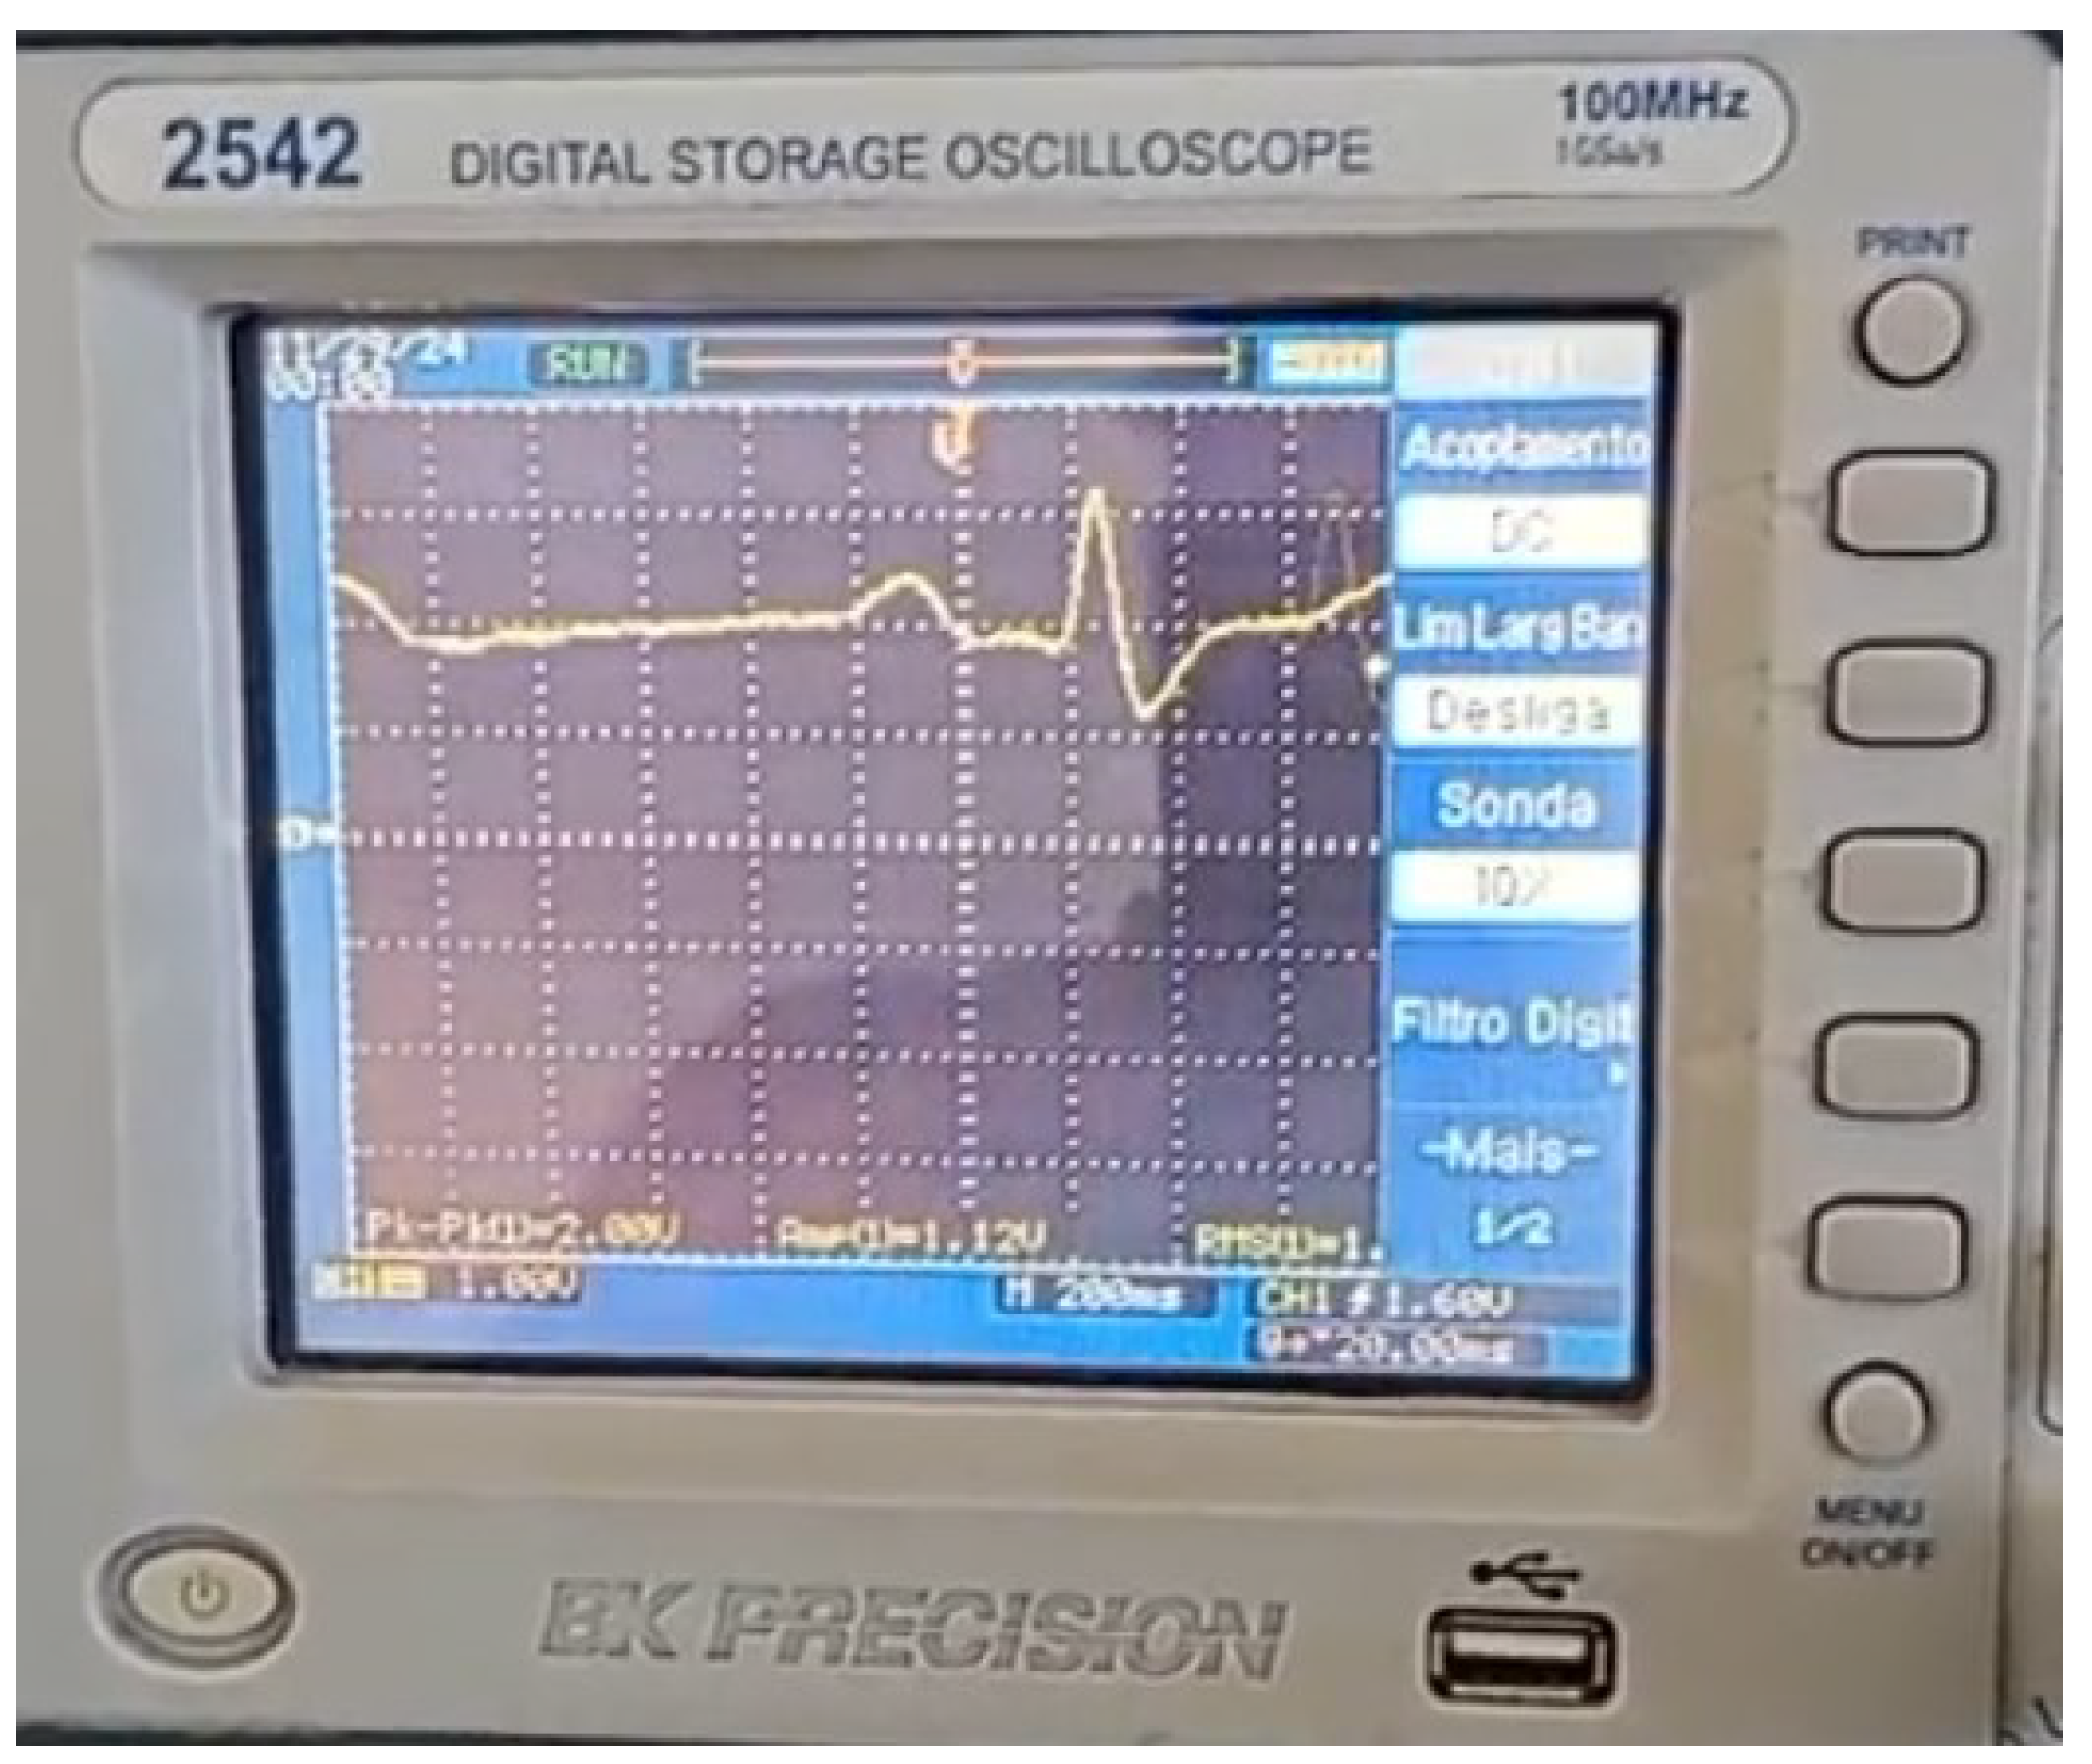
In the system validation, a Tektronix AFG1022 arbitrary function generator was used, which can emulate ECG signal as displayed in
Figure 8. The system was evaluated by generating ECG signals at heart rates of 30, 60, 120, and 180 beats per minute. The heart rate was estimated using 100 cardiac cycles per frequency, and performance was assessed by calculating the accuracy.
3. Results
The main code for LPC computations was tested in a function for MATLAB with excerpts of signals form the MIT or PhysioNet databases [
30,
31] and the obtained results were quite plausible. As an example, in
Figure 9 a test with an bigemy-affected ECG excerpt from MIT database is displayed, and the algorithm was able to capture the instantaneous heart rate as can be seen in the stem plot of heartbeats events.
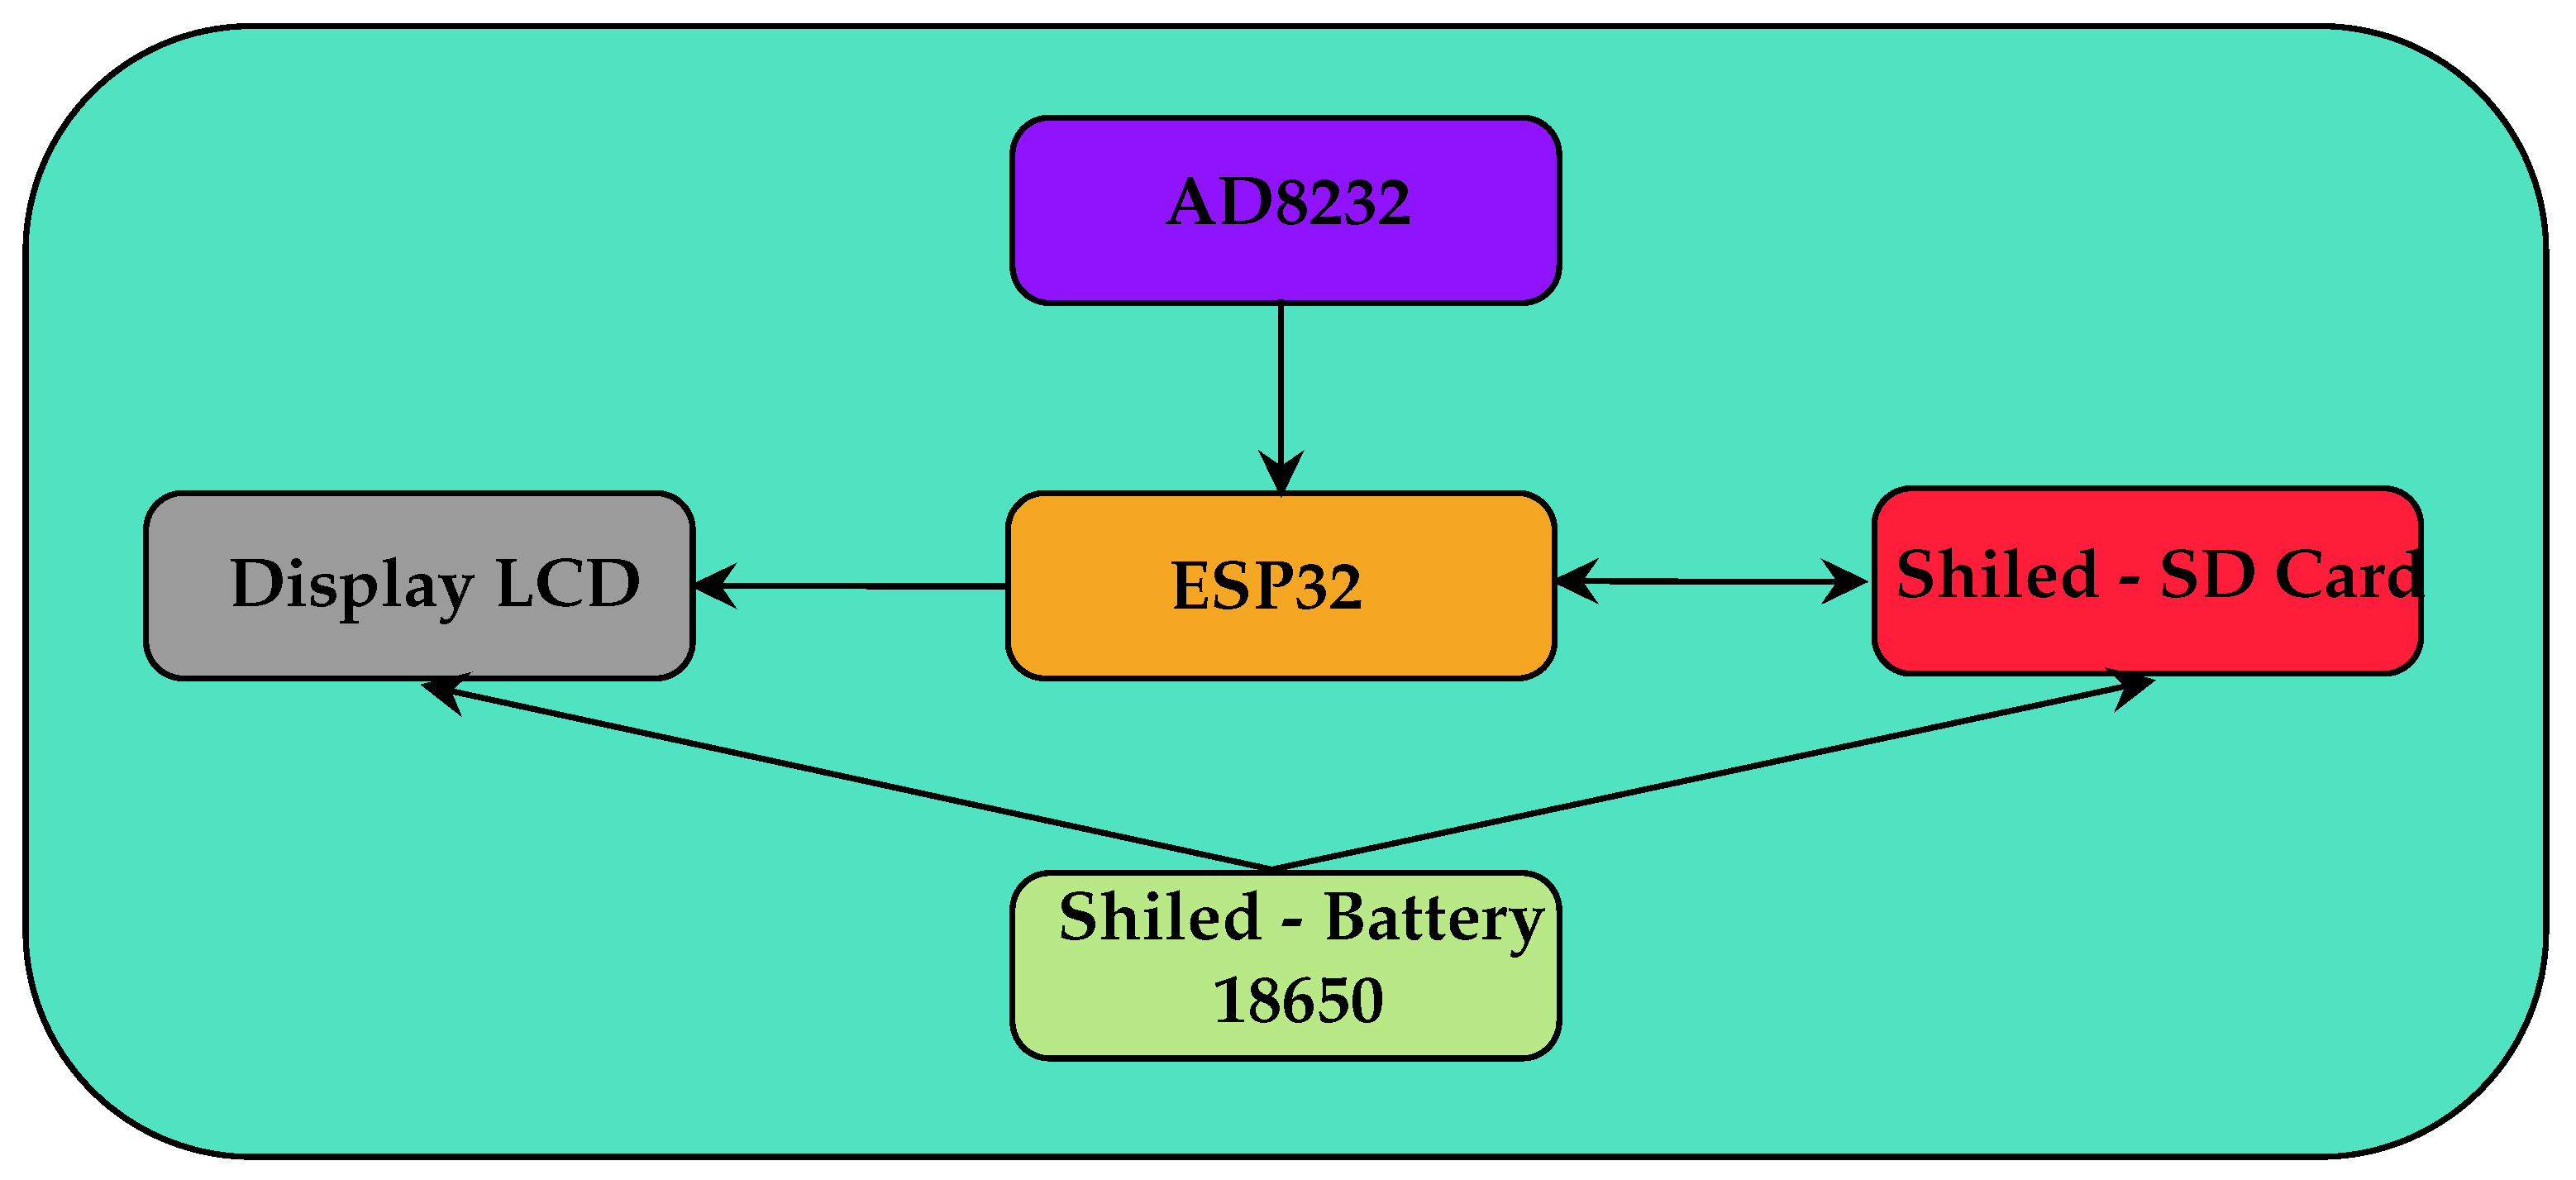
The developed hardware is based on the block diagram shown in
Figure 10. The system consists of an ESP32 microprocessor module that reads the signal from the AD8232 ECG signal conditioning module, executes the LPC algorithm to determine the heart rate, presents the data on an LCD display and saves the data to an SD-Card, in addition to a charge control module for 18650 lithium-ion batteries and a voltage source of 3.3 and 5 volts. Capacitors of 2.2 uF and 10 uF were placed near the power pins of the ESP32 and AD8232 modules to eliminate possible 60 Hz noise.
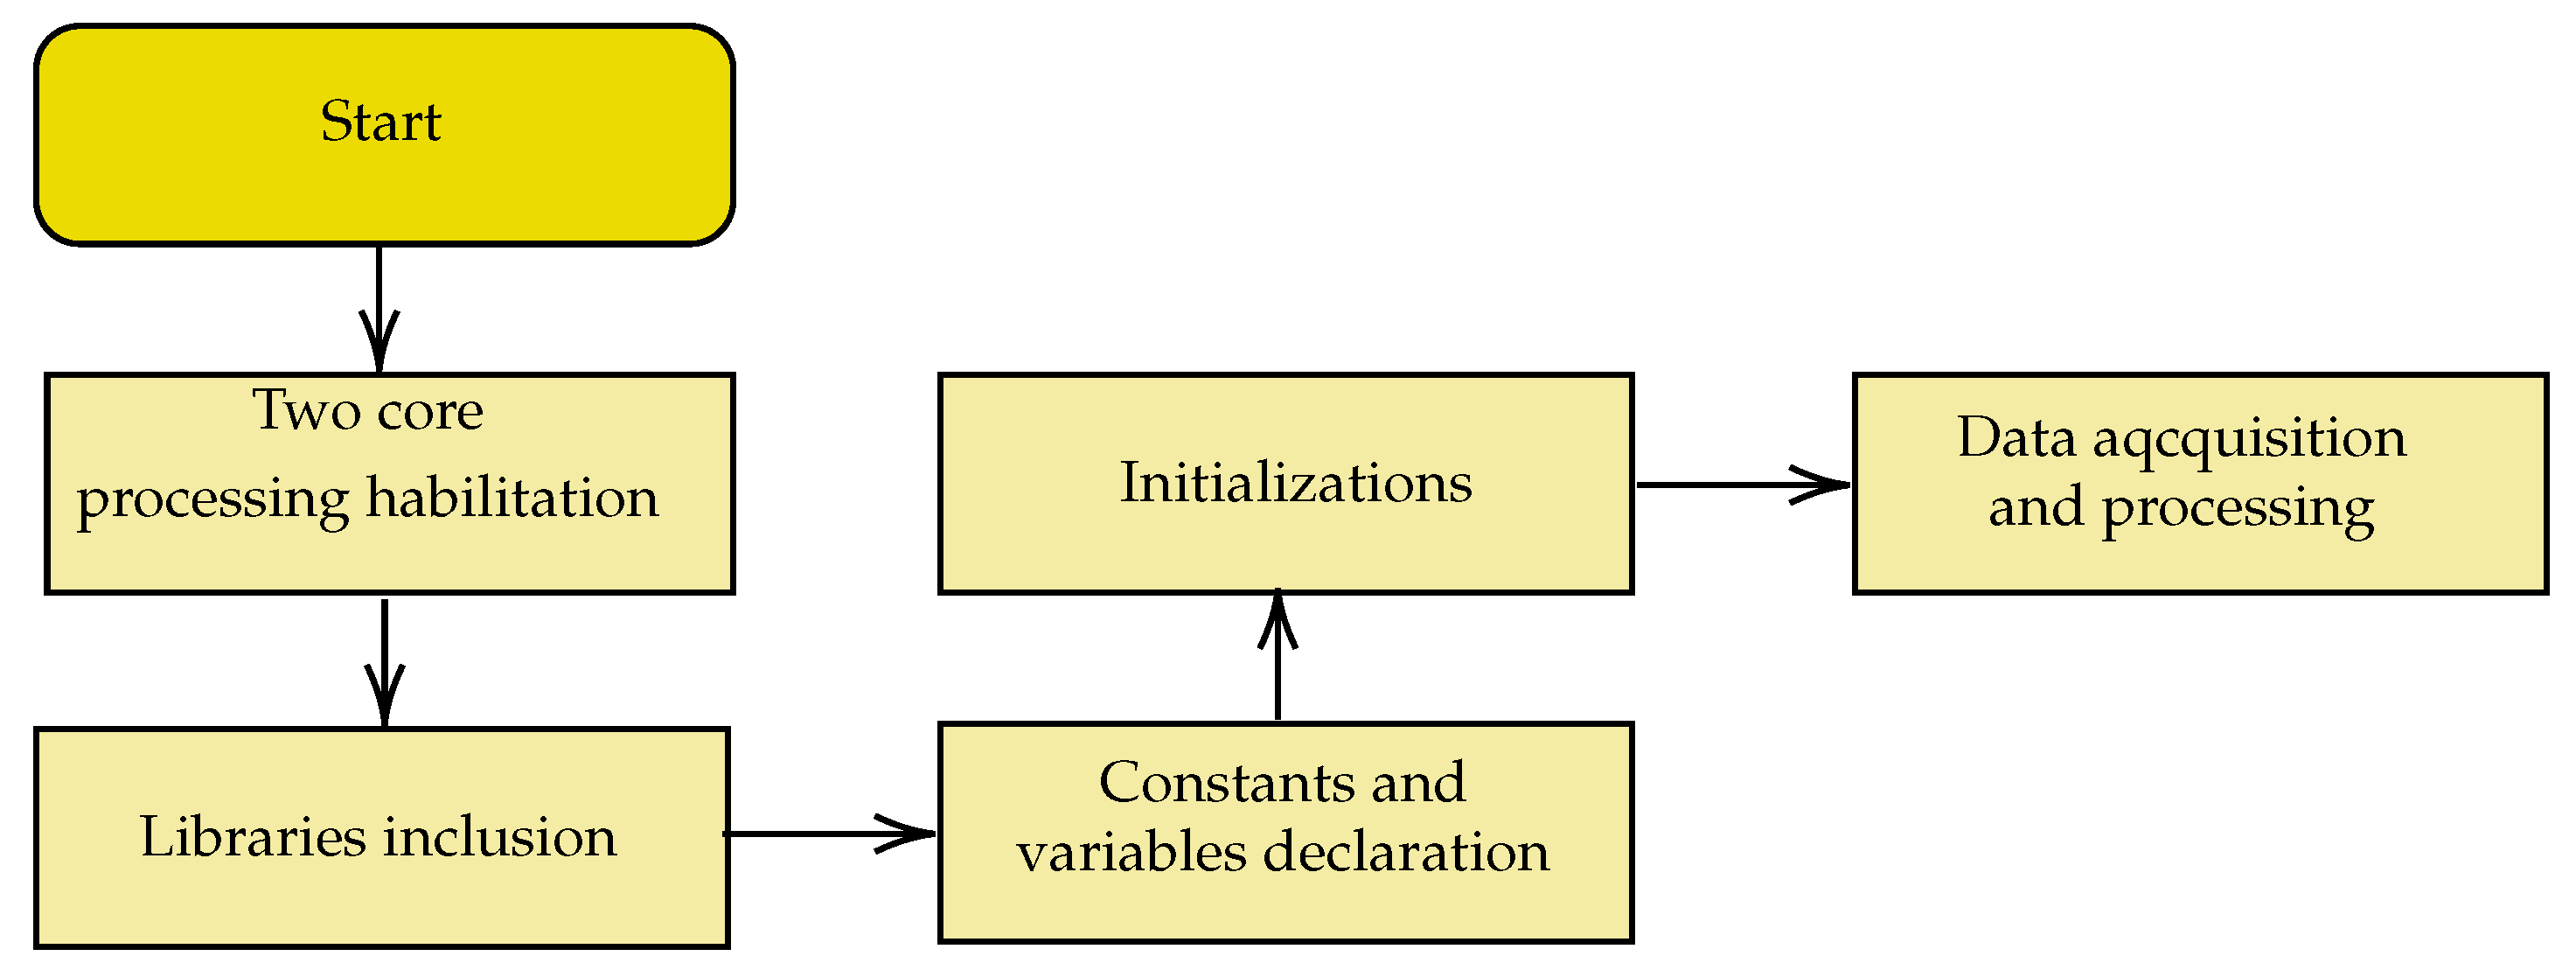
The developed firmware was based on the actions in the block diagram in
Figure 11,
Figure 12 and
Figure 13.
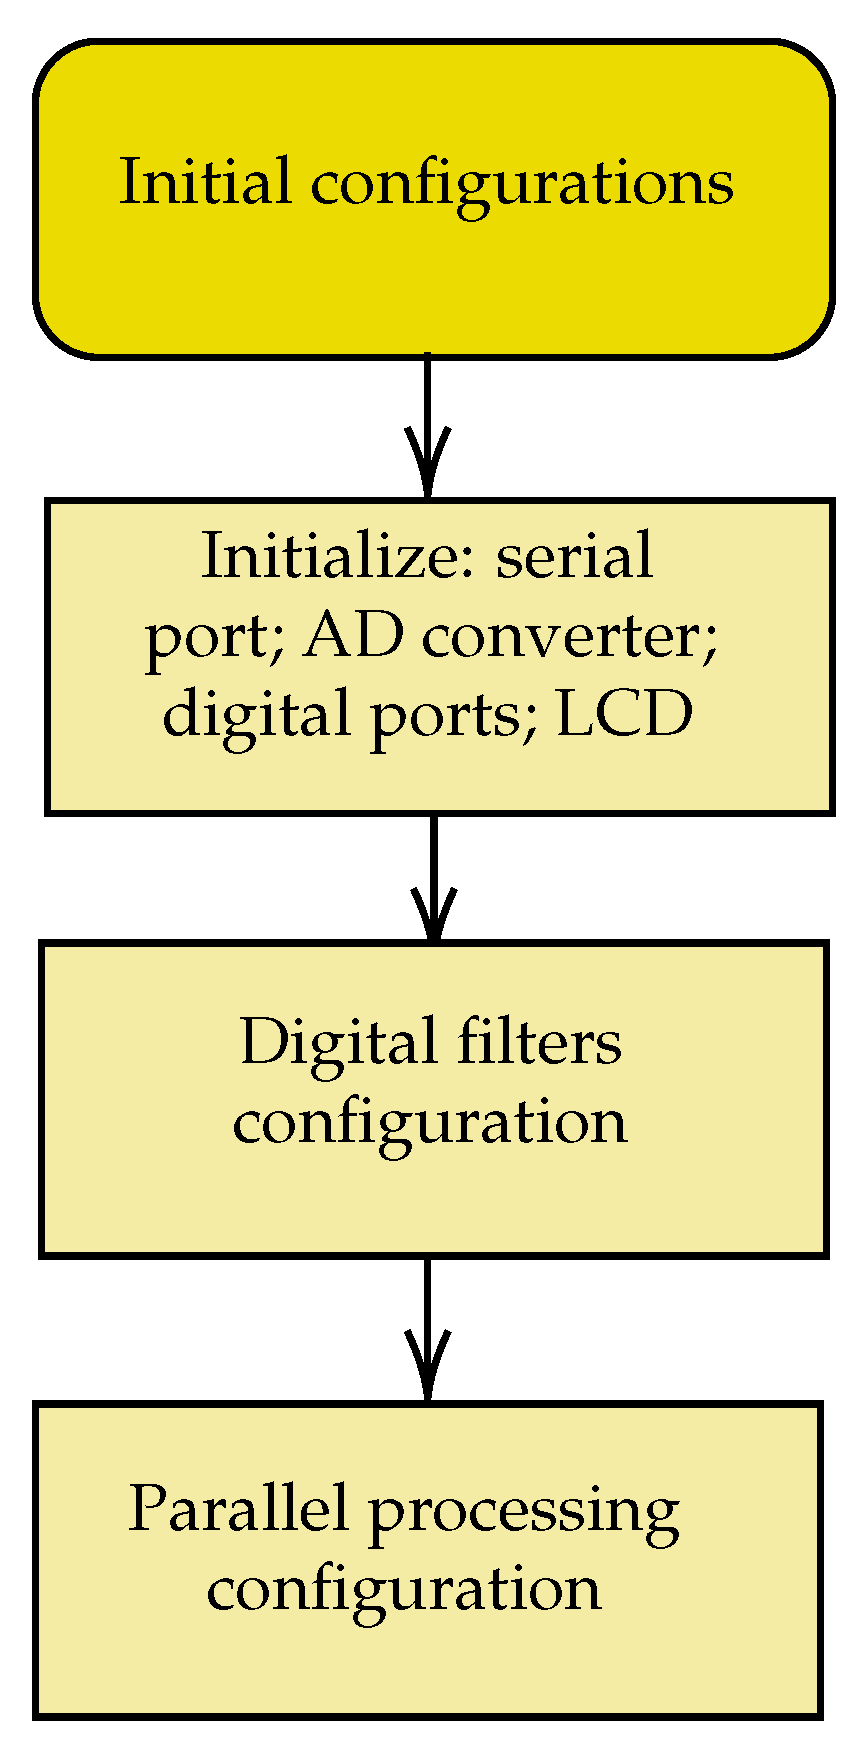
Figure 11 provides an overview of the code produced. The sequence of initial configurations of internal and external peripherals used, of parallel processing in two cores, and of digital filters is shown in
Figure 12.
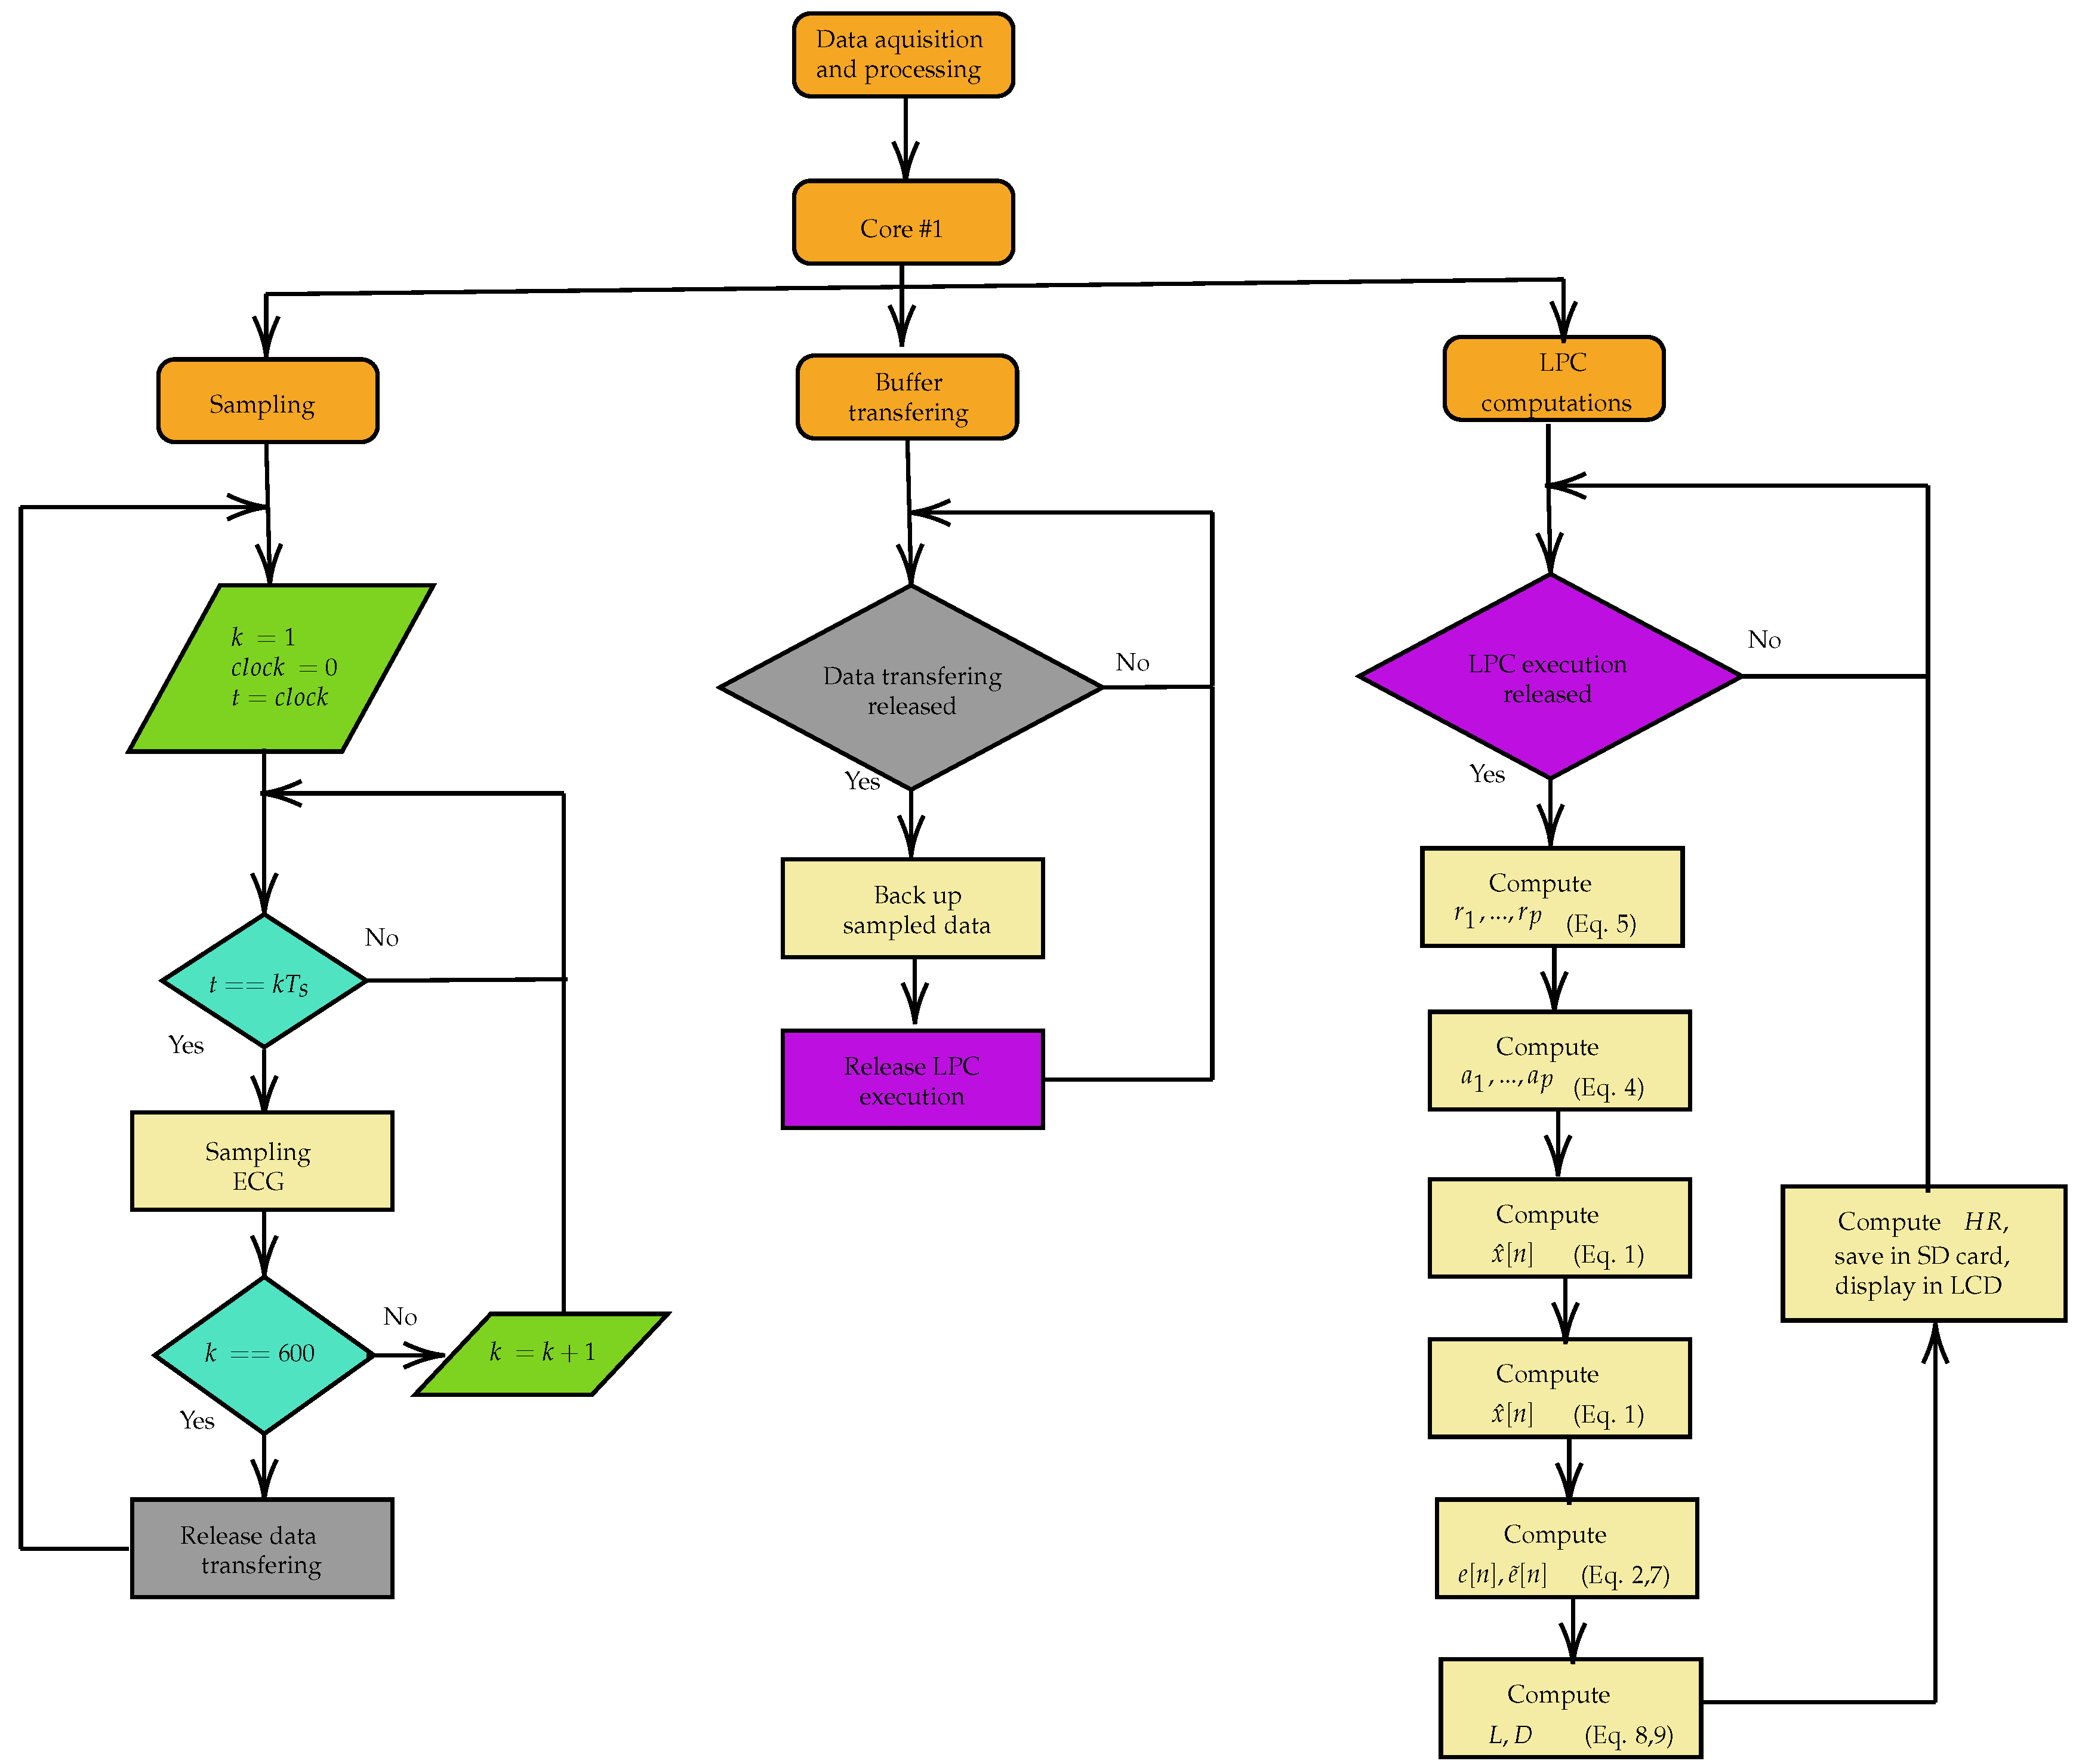
The Acquisition and Processing block of
Figure 11 is detailed in
Figure 13. Core 0 was reserved for future processing of the Wifi communication and the other tasks are executed in Core 1. The ECG signal acquisition and filtering activities were assigned to a parallel processing task that is executed within a time interval of 4 milliseconds, providing a sampling rate of 250 samples per second. A 60 Hz digital notch filter and a second-order low-pass digital filter with a cutoff frequency of 500 Hz are applied to the signal. Upon reaching 600 acquired samples, another task is enabled from a semaphore and the transfer of these samples from the acquisition buffer to another begins, avoiding overwriting of this buffer during the processing of the heart rate determination algorithm. The LPC algorithm for estimating the heart rate with order
and displaying it on an LCD are only executed after enabling a semaphore at the end of the buffer sample transfer task. The flow control of the parallel processing was executed using the Free RTOS real-time operating system.
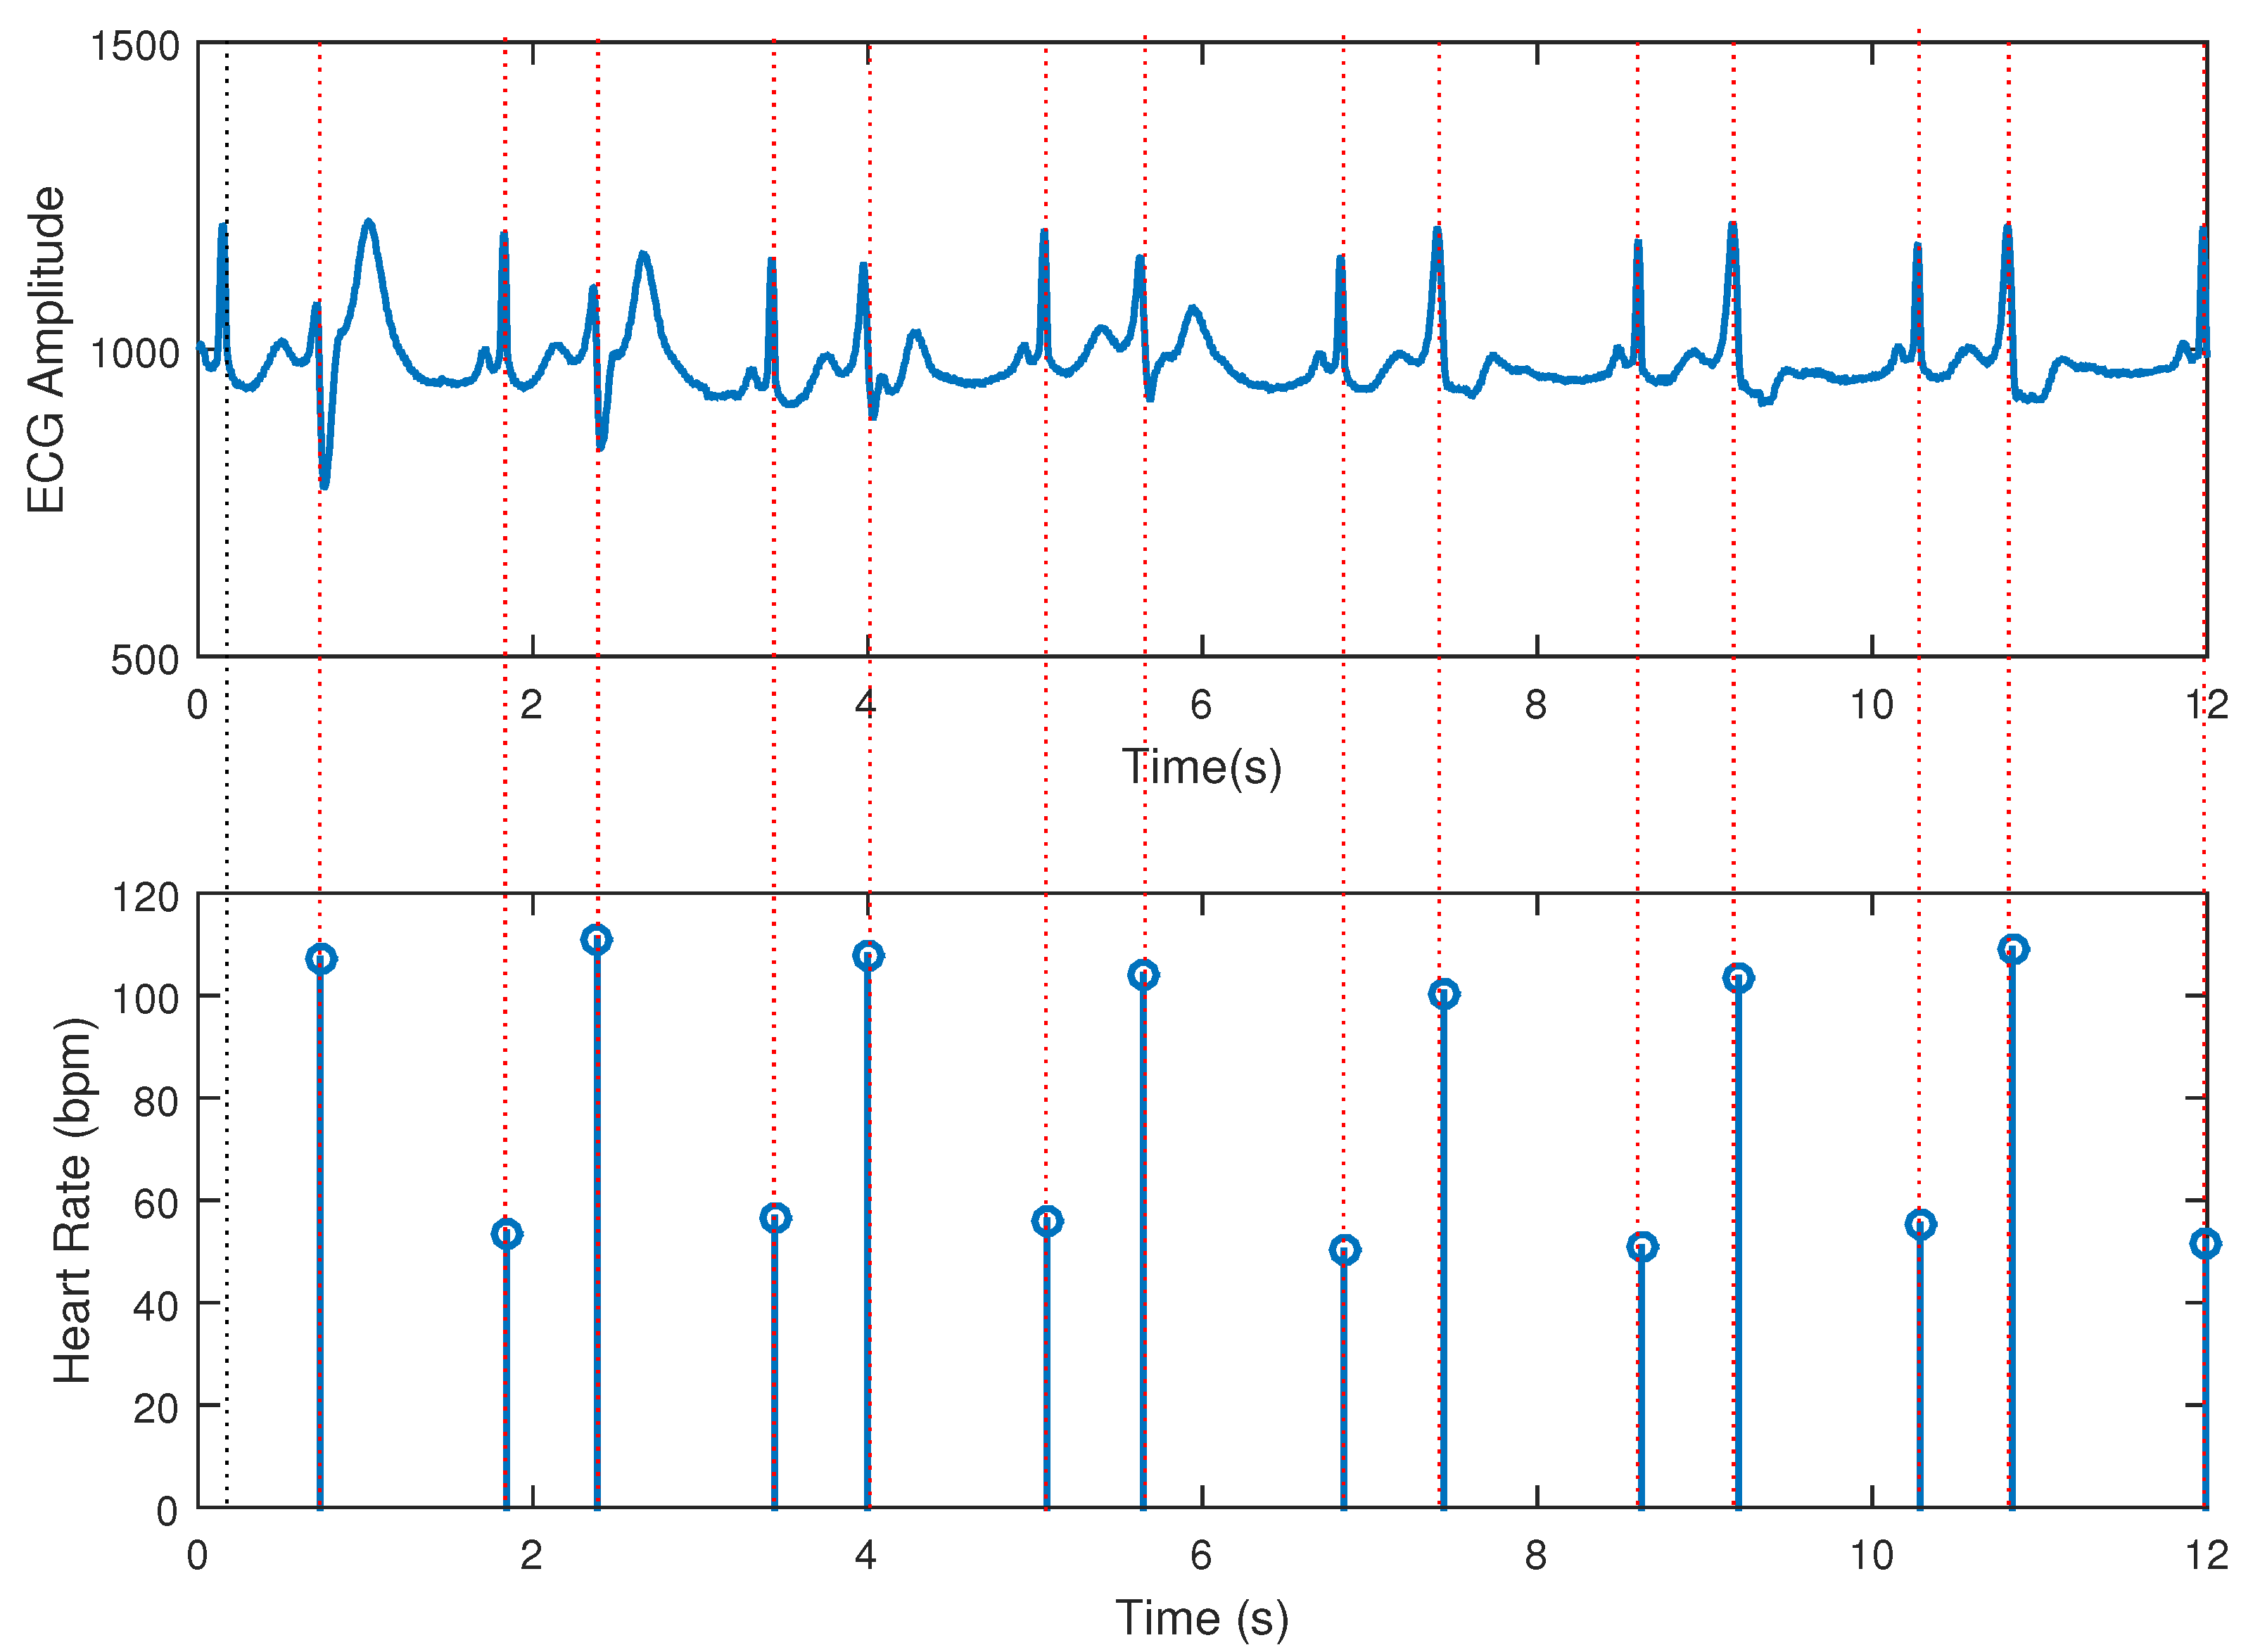
The ECG signal emulated by the Tektronix AFG1022 function generator with a frequency of 30 BPM (0.5 Hz),
Figure 8 and
Figure 14, is input into the developed system. The result of the real-time processing of this signal by the LPC heart rate estimation algorithm is shown in
Figure 15. The system was evaluated by generating ECG signals at heart rates of 30, 60, 120, and 180 beats per minute. The heart rate was estimated using 100 cardiac cycles per frequency, and performance was assessed by calculating the accuracy. The generated signals was injected into the prototype real-time tracking of the accuracy. The used function generator is displayed in
Figure 14. In
Table 1, one can see the accuracy of the measured frequencies, and the tiny standard deviation demonstrates that the instantaneous heart rate has been successfully estimated since the waves have a fixed frequency.
4. Discussion
At 30 BPM, 66 measurements were 30 BPM and 34 measurements were 29 BPM, resulting in a mean of 29.66 and an accuracy of 98.87%. At 60 BPM, 87 measurements were 60 BPM and 13 measurements were 59 BPM, resulting in a mean of 59.87 and an accuracy of 99.78%. At 120 BPM, 94 measurements were 120 BPM and 6 measurements were 119 BPM, resulting in a mean of 119.94 and an accuracy of 99.95%. At 180 BPM, 67 measurements were 180 BPM and 13 measurements were 178 BPM, resulting in a mean of 179.27 and an accuracy of 99.82%.
The operation of the system is stable and the heart rate measurement results showed accuracies between 98.87% (30 BPM) and 99.95% (120 BPM). These results were satisfactory compared to those obtained by [
32], which reached accuracies between 98.18% and 100% using the same algorithm in a similar code for Matlab and with data from the MIT-BIH database and also reached accuracies between 42.47% and 97.02% using a code based on the Wavelet Transform [
33].
5. Conclusions
This paper presents a method and system for heart rate estimation using linear prediction filtering in an effective real-time firmware for applications of instantaneous heart rate detection. The obtained experimental results are accurate and can be considered a proof of concept of a simulated, offline result previously obtained by the authors. The next steps of the work involve using the instantaneous heart rate measurement from the system to feed trained deep-learning CNN-1D for automated diagnosis of heart diseases from captured real-time ECGs.
Author Contributions
Conceptualization, V.S., F.S., J.A. and J.L.; methodology, V.S., F.S., J.A. and J.L.; software, V.S. and J.L.; validation, V.S.; formal analysis, V.S., F.S., J.A.; investigation, V.S., F.S., J.A. and J.L.; resources, J.A. and F.S.; data curation, V.S. and J.A.; writing—original draft preparation, V.S., F.S., J.A.; writing—review and editing, V.S., F.S., J.A.; visualization, V.S., F.S., J.A. and J.L.; supervision, F.S and J.A.; project administration, F.S. and J.A.; funding acquisition, F.S. and J.A. All authors have read and agreed to the published version of the manuscript.
Funding
This research was partially funded by CNPq, grant number # 306178/2023-0 and and The APC was funded by Instituto Federal da Bahia.
Data Availability Statement
The data presented in this paper can be send by the authors at reasonable request.
Conflicts of Interest
The authors declare that they have no conflicts of interest.
References
- Chaitanya, M.K.; Sharma, L.D.; Roy, A.; Rahul, J. A review on artificial intelligence for electrocardiogram signal analysis. Big Data Analytics and Artificial Intelligence in the Healthcare Industry 2022, pp. 38–72.
- Précoma, D.B.; Oliveira, G.M.M.d.; Simão, A.F.; Dutra, O.P.; Coelho, O.R.; Izar, M.C.d.O.; Póvoa, R.M.d.S.; Giuliano, I.d.C.B.; Alencar, A.C.d.; Machado, C.A.; et al. Atualização da diretriz de prevenção cardiovascular da Sociedade Brasileira de Cardiologia-2019. Arquivos Brasileiros de Cardiologia 2019, 113, 787–891. [Google Scholar] [PubMed]
- Stevens, B.; Pezzullo, L.; Verdian, L.; Tomlinson, J.; George, A.; Bacal, F. Os custos das doenças cardíacas no Brasil. Arquivos Brasileiros de Cardiologia 2018, 111, 29–36. [Google Scholar] [PubMed]
- Oliveira, G.M.M.d.; Brant, L.C.C.; Polanczyk, C.A.; Malta, D.C.; Biolo, A.; Nascimento, B.R.; Souza, M.d.F.M.d.; Lorenzo, A.R.D.; Fagundes Júnior, A.A.d.P.; Schaan, B.D.; et al. Estatística Cardiovascular–Brasil 2021. Arquivos brasileiros de cardiologia 2022, 118, 115–373. [Google Scholar]
- Kruse, C.S.; Soma, M.; Pulluri, D.; Nemali, N.T.; Brooks, M. The effectiveness of telemedicine in the management of chronic heart disease–a systematic review. JRSM open 2017, 8, 2054270416681747. [Google Scholar]
- Zhu, Y.; Gu, X.; Xu, C. Effectiveness of telemedicine systems for adults with heart failure: a meta-analysis of randomized controlled trials. Heart failure reviews 2020, 25, 231–243. [Google Scholar]
- Amaral, F.; Fernandes, E.; Drabowski, N.; Alves, M.; Nunes, A.; da Silva, E.; Bastos, M.; Romera, J.; de Castro Figueroa, R.; et al. Estudo de caso de Tarumã: O uso de telemedicina e Inteligência Artificial para redução da mortalidade por doenças cardíacas e otimização dos recursos em saúde 2022.
- Salgueiro, A.T.F. Detecção de problemas cardíacos usando sinais de electrocardiograma (ECG). Master’s thesis, Universidade de Coimbra, 2020.
- Andrade, M.V.; Maia, A.C.; Cardoso, C.S.; Alkmim, M.B.; Ribeiro, A.L.P. Custo-benefício do serviço de telecardiologia no Estado de Minas Gerais: projeto Minas Telecardio. Arquivos Brasileiros de Cardiologia 2011, 97, 307–316. [Google Scholar]
- Schirato, S.R.; El-Dash, I.; El-Dash, V.; Natali, J.E.; Starzynski, P.N.; Chaui-Berlinck, J.G. Heart rate variability changes as an indicator of decompression-related physiological stress. Undersea and Hyperbaric Medicine 2018, 45, 173–182. [Google Scholar] [CrossRef] [PubMed]
- Natali, J.E.S.; Starzynski, P.N.; Chaui-Berlinck, J.G. Oscillatory patterns in heart rate variability and complexity: A meta-analysis. Biomedical Signal Processing and Control 2017, 33, 66–71. [Google Scholar] [CrossRef]
- Santos, M.; Fonseca, J.; Barros, A. New method to heart instantaneous frequency estimation. In Proceedings of the Proceedings of the 2004 14th IEEE Signal Processing Society Workshop Machine Learning for Signal Processing, 2004. IEEE, 2004, p. 473–480. [CrossRef]
- Silva, A.F.; Carmo, J.P.; Mendes, P.M.; Correia, J.H. Simultaneous cardiac and respiratory frequency measurement based on a single fiber Bragg grating sensor. Measurement Science and Technology 2011, 22, 075801. [Google Scholar] [CrossRef]
- Damla, O.; Altug, C.; Pinar, K.K.; Alper, K.; Dilek, I.G.; Kadriye, A. Heart rate variability analysis in patients with multiple sclerosis. Multiple Sclerosis and Related Disorders 2018, 24, 64–68. [Google Scholar] [CrossRef]
- Badr, A.; Badawi, A.; Rashwan, A.; Elgazzar, K. XBeats: A Real-Time Electrocardiogram Monitoring and Analysis System. Signals 2022, 3, 189–208. [Google Scholar] [CrossRef]
- Yen, H.T.; Kurosawa, M.; Kirimoto, T.; Hakozaki, Y.; Matsui, T.; Sun, G. Non-Contact Estimation of Cardiac Inter-Beat Interval and Heart Rate Variability Using Time-Frequency Domain Analysis for CW Radar. IEEE Journal of Electromagnetics, RF and Microwaves in Medicine and Biology 2023, 7, 457–467. [Google Scholar] [CrossRef]
- Mason, H.T.; Martinez-Cedillo, A.P.; Vuong, Q.C.; Garcia-de Soria, M.C.; Smith, S.; Geangu, E.; Knight, M.I. A Complete Pipeline for Heart Rate Extraction from Infant ECGs. Signals 2024, 5, 118–146. [Google Scholar] [CrossRef]
- Thakur, S.; Chao, P.C.P.; Tsai, C.H. Precision Heart Rate Estimation Using a PPG Sensor Patch Equipped with New Algorithms of Pre-Quality Checking and Hankel Decomposition. Sensors 2023, 23, 6180. [Google Scholar] [CrossRef] [PubMed]
- Zakynthinaki, M.S.; Kapetanakis, T.N.; Lampou, A.; Ioannidou, M.P.; Vardiambasis, I.O. A Neural Network Model for Estimating the Heart Rate Response to Constant Intensity Exercises. Signals 2021, 2, 852–862. [Google Scholar] [CrossRef]
- Lima, J.S.; Silva, F.G.S.; Araujo, J.M. An LPC-Based Approach to Heart Rhythm Estimation. In Proceedings of the XXVII Brazilian Congress on Biomedical Engineering; Bastos-Filho, T.F.; de Oliveira Caldeira, E.M.; Frizera-Neto, A., Eds., Cham, 2022; pp. 1795–1799. [CrossRef]
- Becker, D.E. Fundamentals of Electrocardiography Interpretation. Anesthesia Progress 2006, 53, 53–64. [Google Scholar] [CrossRef]
- Marvi, H.; Esmaileyan, Z.; Harimi, A. Estimation of LPC Coefficients using Evolutionary Algorithms. Journal of AI and Data Mining 2013, 1, 111–118. [Google Scholar]
- Beraldo, O.A. Processamento Digital do Sinal de Eletrocardiograma para Aplicação em Experimentos de Fisiologia Cardíaca. PhD thesis, Escola de Engenharia de São Carlos, Universidade de São Paulo, 1997.
- Araujo, J.M.; Embirucu, M.; Fontes, C.H.O.; de Andrade Lima, L.; Kalid, R. Melhoria da performance em reconciliação de dados pela eliminação de outliers com pré-filtro por predição linear. In Proceedings of the Proceedings of 8th International Seminar on Electrical Metrology, 2009, pp. 1–5.
- Serhani, M.A.; T. El Kassabi, H.; Ismail, H.; Nujum Navaz, A. ECG monitoring systems: Review, architecture, processes, and key challenges. Sensors 2020, 20, 1796. [Google Scholar]
- Bansal, A.; Joshi, R. Portable out-of-hospital electrocardiography: A review of current technologies. Journal of arrhythmia 2018, 34, 129–138. [Google Scholar] [CrossRef]
- Ardeti, V.A.; Kolluru, V.R.; Varghese, G.T.; Patjoshi, R.K. An Overview on State-of-the-Art Electrocardiogram Signal Processing Methods: Traditional to AI-Based Approaches. Expert Systems with Applications 2023, p. 119561.
- Anbukarasu, P.; Nanisetty, S.; Tata, G.; Ray, N. Tiny-HR: Towards an interpretable machine learning pipeline for heart rate estimation on edge devices. arXiv preprint arXiv:2208.07981 2022.
- Asutkar, S.; Chalke, C.; Shivgan, K.; Tallur, S. TinyML-enabled edge implementation of transfer learning framework for domain generalization in machine fault diagnosis. Expert Systems with Applications 2023, 213, 119016. [Google Scholar]
- Moody, G.B.; Mark, R.G. The impact of the MIT-BIH Arrhythmia Database. IEEE Engineering in Medicine and Biology Magazine 2001, 20, 45–50. [Google Scholar] [CrossRef] [PubMed]
- Plawiak, P. ECG signals (1000 fragments), 2017. Version 3. [CrossRef]
- Lima, J.d.S.; et al. Modelo para detecção de arritmias cardíacas baseado em coeficientes de predição linear e rede neural convolucional 1D 2022.
- Aniyan, A. ECG Beat Calculation, 2020. Retrieved from MATLAB Central File Exchange, June 6, 2020.
|
Disclaimer/Publisher’s Note: The statements, opinions and data contained in all publications are solely those of the individual author(s) and contributor(s) and not of MDPI and/or the editor(s). MDPI and/or the editor(s) disclaim responsibility for any injury to people or property resulting from any ideas, methods, instructions or products referred to in the content. |
© 2025 by the authors. Licensee MDPI, Basel, Switzerland. This article is an open access article distributed under the terms and conditions of the Creative Commons Attribution (CC BY) license (http://creativecommons.org/licenses/by/4.0/).