
Submitted:
19 February 2025
Posted:
20 February 2025
You are already at the latest version
Abstract
As with many software systems whether manually engineered or automatically generated, the need to identify and eliminate or resolve errors in the system's implementation --- so-called "bugs" is an important aspect of good and effective software construction and maintenance. In standard Software Engineering parlance, this practice is what is known as "debugging" the system --- or rather "software debugging", and for the case of software implemented using the TEA programming language, is such an important aspect of the language's ecosystem, the debugging mechanisms have been designed and implemented as part of the core language's runtime --- essentially, the TEA debugger is part of the language's Software Operating Environment (SOE), and in this paper, we highlight what features the TEA debugger offers, how it works and what remains to be done so as to help software engineers build robust and error-free software in the TEA language by leveraging the essential software debugging features of the TEA language runtime; tttt.
Keywords:
Software Engineering
; Software Debugging
; Debuggers
; Text Processing Languages
; TEA
1. TEA Debugging Preamble
In the early phases of designing and implementing the Transforming Executable Alphabet (TEA) language, it became quite clear that not only might developers and software engineers leveraging the new language’s syntax and its unusual approach to general-purpose programming via a Text-Processing paradigm meet with some difficulties, but that, there would be a sure need for a mechanism to help readily isolate, understand and fix the source of errors in software built using the still rare and undoubtedly unique language [1]. Thus, when the first Reference Implementation (RI) of the complete (a: to z:) TEA language was rolled-out in 2024[2], it also came with an in-built debugger for TEA programs accessible via the “-d" flag for the command-line TEA interpreter; tttt — TEA Text Transforming Terminal (TTTT) [3,4], in which case the so invoked TEA program would be said to be running in "DEBUG MODE".
As per the standard semantics of the term “debugging" — see excerpts from the Oxford Dictionary of Computing[5] below:
Definition 1
(Debugging). The identification and removal of localized implementation errors — or bugs — from a program or system. By contrast, testing seeks to establish whether bugs exist but does not isolate or remove them. Program debugging is often supported by a debug tool [debugger], a software tool that allows the internal behavior of the program to be investigated. Such a tool would typically offer trace facilities..., allow the planting of breakpoints (i.e. points in the program at which execution is to be suspended so that examination of partial results is possible), and permit examination and perhaps modification of the values of program variables when a breakpoint is reached.
Our theory and practice of debugging in TEA wishes to stay true to what the traditions of the important Software Engineering sub-discipline of Software Debugging calls for. It is based on this background that we then shall take a moment to explore what sort of debugging is [readily] possible for TEA programs as per the current language design, implementation and support tools in the TEA SOE — Software Operating Environment[6]. This we shall mostly cover in Section 2, while Section 3 shall wrap-up this paper by focusing on what isn’t yet possible or what remains to be done concerning debugging in TEA.
2. An Exploration of Debugging in TEA
In the first part of this section (Section 2.1), we shall look at a high-level overview of what is currently practically possible concerning debugging in TEA as per the standard debugging theory (refer to Definition 1). That section is presented using a Question-Answer approach to quicken and keep the discussions factual and succinct. We shall then progress into a deeper, more hands-on exploration of what is currently [practically] possible concerning debugging in the TEA RI in Section 2.2, starting with simple explorations in Section 2.2.1, then diving into more advanced debugging concerns in Section 2.2.2. In Section 2.3 we shall close off with an authoritative overview of what exactly happens in a typical DEBUG MODE session of the TEA debugger via tttt.
2.1. Quick Overview of TEA Debugging
- Q1
-
Is there support for debugging in the TEA SOE?
- A1.
- YES. The official TEA RI environment[2] — currently with support for running standard TEA programs on Linux via the commandline, but also for other *nix-compliant systems such as for Microsoft Windows via the Windows Subsystem for Linux, makes possible and officially supports debugging in the TEA standard SOE[3,4].
- Q2
-
How does the TEA SOE support/enable debugging?
- A1.
- The “-d" flag when passed to the standard TEA interpreter — tttt, allows for the TEA program thus invoked or executed, to be run in DEBUG MODE (see Section 2.2 for details and practical examples).
- Q3
-
Is it possible to flag an erroneous TEA program before it is run?
- A1.
- Only syntax errors might easily be caught upfront because lexing happens before any actual execution of the instructions in a TEA program happens (refer to the “TEA PROGRAM EXECUTION PROCESS" illustrated in the TEA TAZ [3]); at invocation time.
- A2.
- Though, instructions such as e: and e*: might process imported TEA code during run-time (meaning, after the execution of the active TEA program already started); and this could be code that wasn’t available or seen at program invocation or validation time; such as code from the network via w:, and which is then stored into a vault/memory for later reference via v:. In case such imported code is erroneous, it can only be flagged as such at the time when attempts to execute it as TEA code manifest — such as when code originally imported into a vault (at which point it is merely a string as far as TEA semantics and types are concerned) is finally evaluated as TEA code via a call to e*: [3]
- Q4
-
What constitutes an erroneous TEA program?
- A1.
- Invalid Syntax (such as qualifying a TEA primitive with an unknown or unsupported qualifier symbol; only *, ! and *! are valid TEA command qualifiers (see TCQ in the formal TEA language grammar [3]) allowed as per current TEA grammar and syntax.
- A2.
- But also, Invalid Semantics — such as some TEA primitives being invoked with the wrong number of parameters or with an invalid signature; for example, invoking the memory clearing command c: with any parameter — e.g. a literal string such as in c:TEST or with reference to some memory location such as passing the name of some vault e.g. in c:vRECORDS, won’t do anything expected because such invocations are currently treated by the TEA RI as being “INERT" [3]. Invoking an “INERT" TEA instruction essentially isn’t harmful, though it is wasteful since the instruction is processed without [any potentially useful] effect[s]. Nonetheless, future versions of the TEA runtime might flag warnings for such instances as an example. However, some semantic errors such as invoking a memory-referencing TEA instruction without a valid argument — these, by convention being the TEA instructions in which a TEA primitive is qualified with the symbol *; such as when a: which is meant to compute anagrams of its parameters, is invoked with a non-existent vault/memory pointer in the instruction a*:{SOME DATA} instead of a*:vDATA, results in a run-time memory-violation error. These can’t yet be caught at invocation time, but do get flagged and cause exceptions when encountered during run-time.
- Q5
-
When a TEA program contains an erroneous sector, would the entire program fail to run or only the erroneous sector?
- A1.
- Sometimes, especially if the error is semantic, it might only be possible to catch it at run-time (such as in the executing of strings imported from external sources — like with w: as TEA code or processing of results from executing external commands as TEA code — like with z:.) In such cases, when an exception occurs during the running of that instruction, the entire program fails or halts.
- A2.
- But if the error is perhaps semantic, though, without effects; such as calling j!:PARAM — Don’t Jump, yet it takes a name for a potential jump point — typically, the name of a label in the TEA program code; such code, which in TEA is considered “INERT" shall be parsed but shall merely be skipped without any errors or modifications to the preceding or succeeding system state apart from advancing the instructions counter [3].
- Q6
-
What kinds of errors can be automatically flagged in a TEA program before or while it is being run; syntactic, semantic, or environmental?
- A1.
- Syntactic: at program invocation time or when an e: command is processed anywhere in the program. Semantic: when the interpreter fails to correctly process a supported TEA Instruction. Environmental: if access to some external resources (such as with w: or z:) fail or meet with run-time errors.
- Q7
-
Can u trace the running of a TEA program? How?
- A1.
-
A TEA program invoked using the tttt command on the command-line can readily be traced by leveraging an invocation of the kind such as:tttt -fc problematic_program.tea -d 2>&1 | tee trace.txtIn this case, the TEA program to be thus debugged is held in the script problematic_program.tea, which is passed to the TEA interpreter via the “-fc" flag, and then, using the special Linux utility tee, we are able to ensure that even when the problematic program is interactive (such as when it contains blocking, input-prompting commands such as i:), we are able to have normal program input/output on the terminal, but while all the associated output — whether to STDOUT or STDERR are likewise echoed into the file we designate for capturing the program’s trace; in this case the file “trace.txt"
- Q8
-
How is logging done in TEA?
- A1.
- Manually: such as when a developer manually uses i: to display some program state or variables during normal execution or by having the TEA runtime printing the final output at the end of some computation (which output could contain several pieces of information constructed from several variables or instructions before the program terminates).
- A2.
- Automatically: as when the TEA program is run in DEBUG MODE (more on this later) — also, refer to previous question.
- Q9
-
Can TEA programs log errors without polluting the program’s output (like by writing to STDERR instead of STDOUT)?
- A1.
- No. Currently the TEA RI runtime doesn’t [yet] support output to STDERR or any other output stream other than STDOUT (unless, with clever use of external effects such as with special external-environment accessing TEA commands such as w: — Web, or z: — Zap, — which might write to some external resource such as the network or some system data sink via non-TEA commands or protocols, this is thus accomplished).
- Q10
-
Can TEA programs control the logging based on severity of issue (INFO, DEV, EXCEPTION level, etc)?
- A1.
- No. Currently, only one TEA logging level is supported in automatic logging via the “-d" flag.
- A2.
- But clever programs can use conditional processing (such as creative use of the f: — [conditionally] Fork, or q: — [conditionally] Quit commands and other flow-control TEA commands such as with j: — [unconditionally] Jump) to conditionally determine what is logged or processed based on program state.
- Q11
-
Can users of the TEA runtime inspect its internal state at run-time?
- A1.
- Yes. Whatever the TEA runtime allows to be introspected in DEBUG MODE (more about this in Section 2.2)
- Q12
-
How do users/developers of TEA programs contact TEA language engineers for assistance?
- A1.
- Via project’s Git Repo: https://bit.ly/projtea — via which one can leverage pull-requests, comments, etc.
- A2.
- Via official TEA implementer contacts made public — refer to the official manuals that come with the tttt Linux package: man tttt, or consult the TEA official documentation — part of the official TEA RI repository[2].
- Q13
-
How is Python useful in simplifying debugging of the TEA runtime?
- A1.
- Because the TEA runtime (tttt) RI is implemented using Python exclusively [4], thus any debugging facilities that Python supports or offers (such as output mechanisms to STDOUT, but also to the Filesystem — though, that is hardly exploited at the moment), as well as control of logging level and ability to log to STDERR could be utilized in future generations of the TEA runtime.
- Q14
-
How to debug a TEA program without relying on low-level runtime features (basically, strictly from TEA level)?
- A1.
- Manually: use i: command creatively or the expected TEA program’s final output to inspect earlier or final program/system state and outputs from any other TEA command(s) and not just from i:.
- A2.
- Automatically: use DEBUG MODE — with the “-d" flag to tttt, to automatically dump system and program state and outputs at each instruction (before and after) and at the program’s ultimate end.
2.2. Practical Debugging of Programs in the TEA RI
2.2.1. Simple TEA Programs and The TEA DEBUGGING MODE
The tttt utility which is the official interpreter and runtime for TEA language programs allows for tracing and introspection of both the TEA programs and the TEA runtime via the “-d" — DEBUG flag, at a program’s invocation time[2]. This is currently the only, and officially sanctioned method of engaging the TEA SOE’s debugger or debugging tool.
To appreciate the difference running a TEA program with or without DEBUG MODE does, consider the following basic example of a TEA program that is meant to merely print the message “Hello World" and return:
| Listing 1.A Simple Hello World in TEA |
 |
That basic program, when invoked on the commandline shall behave as show in Figure 1.
However, invoking that same exact simple program in Listing with DEBUG MODE turned ON shall behave as shown in Figure 2.
That simple example does bring several things to light. However, before we delve into what exactly happens when a program is run in DEBUG MODE, let us look at a more involved example.
2.2.2. Advanced TEA Programs and Program Debugging via The TEA DEBUGGER
The program in Listing is a basic TEA program meant to draw a simple textbox around some text the user provides — either at invocation time or at run-time.
| Listing 2.A Textbox Drawing Program in TEA |
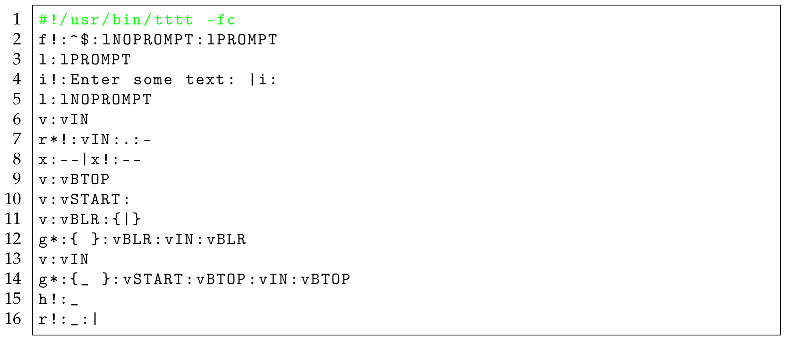 |
In Scenario 1, let us look at what happens when that program from Listing is invoked with an explicit input text specified at invocation time — refer to Figure 3, in which case the user invokes the program’s script with the explicit input as the string “sample input text".
We see, by looking at the provided screenshot, that the program indeed obeys the logic in the TEA program — refer to Line #2 in Listing , which controls the TEA program thus; in case the program at that moment — which, given this is the first instruction in the program; happens immediately after the TEA program’s code starts to be interpreted/processed — happens to have some non-empty value in the active memory — what in TEA is called the “Active Input", or rather “AI" (refer to the TEA TAZ for details [3]), and this because the instruction uses the condition ^$ — a regular expression matching an empty string, to test for whether the AI is NOT empty — because of the ! qualifier applied to the f: — [conditionally] Fork TEA command, then, we jump to the location/sector in the TEA program under the label lNOPROMPT since we need not prompt for an input then. However, if there was no explicit input provided — meaning AI is empty at the instruction on Line #2, then we jump to the sector or code-block under the label lPROMPT. As can be seen in the screenshot in Figure 4, invoking the same program in Listing without an explicit input shall result in the TEA runtime prompting for user input as per the [two] instructions on Line #4.
So, to appreciate how TEA DEBUGGING works, let us take a moment to look at yet another version of the program in Listing .
The version of the Textbox Drawing Program shown in Listing is meant to improve on the one in Listing by doing just one extra thing: Drawing an extra textbox below the one with the input text, merely showing the basic statistic of “how many characters" were found in the input text; e.g. for the input string “Hello", it should draw a textbox containing that word alone, and then a second one below that, containing just the information “5 CHARS".
| Listing 3.A Textbox Drawing Program in TEA with STATISTICS |
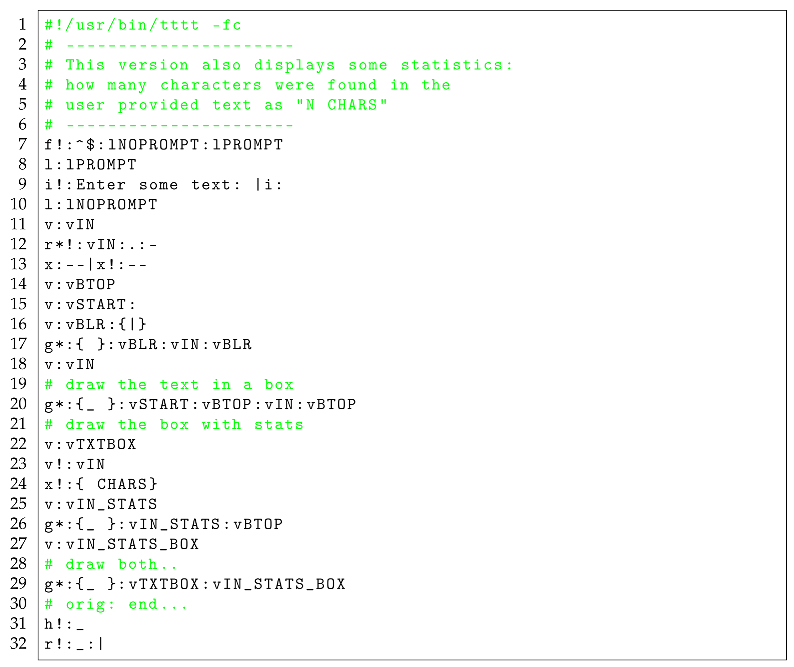 |
When we attempt to run the TEA program in Listing with the explicit input “Hello" as introduced above, we see that the program then produces the output shown in Figure 5
You shall immediately notice that this screenshot in Figure 5 doesn’t seem to produce the result we expect; in particular, the input that was provided, is the string “Hello", which by basic enumeration of the characters it contains, is expected to report a CHARACTER COUNT equivalent to “5" — not the reported “3 CHARS".
To establish whether indeed we are dealing with a potential BUG in that program, we might invoke it again with a different input string — for example, with the longer string “Hello World" — which we expect to tally to “11 CHARS". So, looking at what happens when we invoke the program in Listing with such an explicit input — see Figure 6, we surely find that instead of the Expected Output of “11 CHARS", this program AGAIN reports the erroneous output “3 CHARS".
2.2.3. The Debugging Process in TEA
Because software debugging is not just about identifying a problem in the software but also resolving it (see Definition 1) [5], a good way to approach debugging problems then must also include a sane dose of how to understand the nature and root-cause of the problem thus identified, so as to eventually eliminate it. To use the terminology and philosophy of other researchers and authorities on the subject; in debugging software, we must begin by clearly understanding what exactly is going on; so-called fault localization [7] — which basically is about identifying where in the problematic source-code of the program the error seems to originate from. That attempt to localize the bug might be approached by careful attempts to reproduce the error or bug [8], while eliminating invalid hypotheses of where it is that the error is originating from in the system. We must then proceed to fault understanding [7], which basically deals with getting to understand the root-cause of the problem/bug thus identified — and this, we realize might proceed by careful stripping down of the original program into smaller or more manageable instances or perhaps leveraging more focused “test cases" for the bug, so that we eventually arrive at a clearer, closest-to-root-cause understanding of the problem [8]. Thereafter, and also finally, we must apply some remedial actions — so-called fault correction, so that a means to “fix" the program’s source-code; basically, eliminating the problematic behavior from the program by modifying it as necessary, is conducted, and thus the root-cause of the bug is thus eliminated. That is essentially what debugging is about [7].
With the above theoretical insights to aid our approach to debugging in TEA, we can then return to our example debugging task in Section 2.2.2, and deal with the bug we have seen manifest in the outputs of running the TEA program in Listing .
As of this moment in our debugging process, we are still trying to locate where exactly the bug is originating from — fault localization, however, we also wish to understand exactly what this bug is so we can clearly pinpoint where it is in the program. Thus, to better clarify on what the bug is, we must add to the two tests we’ve already run in the cases illustrated in Figure 5 and Figure 6; one with the explicit input “Hello", the other with “Hello World".
First, to pinpoint where the bug is originating from, we note — since we have some good understanding of the TEA language semantics[3], that the potentially erroneous section of the problematic program should be around the section where we approach the computation of the length of the input text. Thus, revisiting our program in Listing , we note that the problematic sections should be the Lines #22-#27; the section dealing with both computing and presenting the statistic of interest.
To test whether this is where the problem is actually originating from, we note that in particular, the instruction at Line #23 seems to be where the problem is. Why? Perhaps because, we know that whatever happens past that instruction — such as in instruction on Line #24 where we construct the text reporting the statistic; using the x!: — Xenograft TEA primitive with the ! qualifier which then implies we wish to affix the provided suffix “ CHARS" to AI — where it is understood that AI, the Active Input, shall at that moment contain just a number — the computed length of the text we wish to report the length for.
To test whether indeed we are looking at the right section in the code, we might conduct two more tests;
- We might instead run the same program but with the input to be processed obtained using a different method; for example, instead of the explicit, command-line input argument approach shown in Figure 5 and Figure 6, we could let the program prompt for a run-time user-provided input so we see if we might obtain the correct or a different statistic in the result.
- Alternatively, we might forego all user input, and inject an explicit input for which we know the exact length, right before we compute the input’s length, and thus determine if the problem is either with our program logic or perhaps with the underlying TEA language semantics or runtime.
So, starting with Test Case #1 above, we run the same, unmodified program from Listing , however, this time, not providing an explicit invocation-time input, and instead letting the program proceed to prompt for a user input (see instructions on Lines #9; the first being the prompt, the other the one capturing the input the user provides). We can see an instance of this test running in a screenshot in Figure 7, in which case the run-time input we provide is still “Hello World".
Having run this 3rd test case, and still finding that instead of the expected “11 CHARS" the program, despite having used an input provided in a different way still reports the erroneous “3 CHARS", we seem to now be getting closer to the actual source of the problem.
We then attempt a better localization of the fault, by proceeding to implement the Test Case #2 specified above; we basically modify the program in Listing as shown in Listing .
| Listing 4.A MODIFIED Textbox Drawing Program in TEA with STATISTICS |
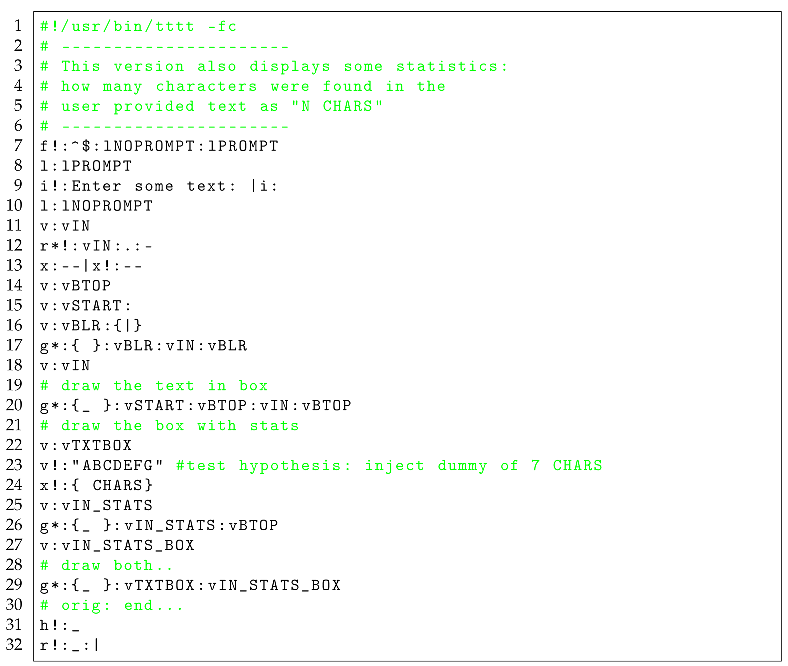 |
In particular, looking at the altered program in Listing , we particularly note that the modified instruction — see Line #23: effectively, the new instruction being v!:"ABCDEFG", injects the explicit string “ABCDEFG" of 7 characters in length, and indeed, as we see in the screenshot after running this modified program — see Figure 8, we notice that now, given the same [run-time] input — “Hello World", of 11 characters, as we’ve used in the tests shown in Figure 6 and Figure 7, we then see our new test case present a different result; “7 CHARS" it says, which is exactly proving our hypothesis that the code/instruction(s) computing the input’s length must be where the problem has been stemming from.
At this point then, we must bring the TEA DEBUGGER into context once more; given that we have an idea where the problematic code is within the program — in particular, having noticed that modifying Line #23 seems to be causing alterations in the error/bug, we can then use the DEBUG MODE of tttt, to ascertain what exactly is going on both in our program as well as the TEA runtime when this bug manifests.
For this case, we shall invoke the same program as in Listing , but with the addition of the “-d" flag to the TEA interpreter when we invoke it. Also, this time, we shall return to passing an explicit invocation-time input parameter as in the case demonstrated in Figure 6. The invocation we are to make is:
tttt -fc box_text_wprompt_stats-injection.tea -d -i "Hello World"
And making this call, we notice as captured in the TEA debugger dump1 for this test as captured in a Github Gist, that indeed, around Lines #165-#168, also shown [with long lines truncated with ellipses] in Listing — see Lines #6-#10, that indeed, the debugger reports that the instruction we just modified is in fact computing the length of the string “ABCDEFG" and not our input “Hello World" as we had originally intended.
| Listing 5.Excerpt of TEA debugger Trace Dump |
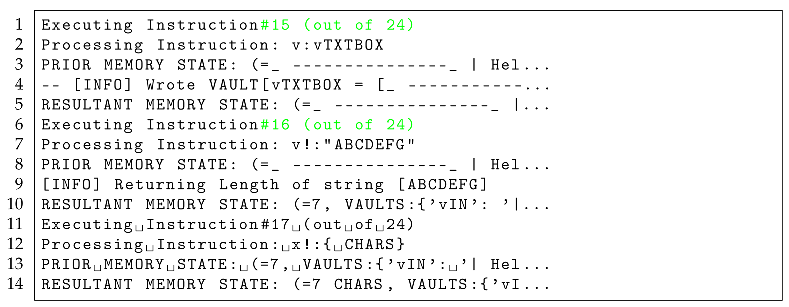 |
Thus, we are done with our fault localization, and have also enhanced our fault understanding. Now, we must embark on fault correction!
Of course, when it comes to fixing the bugs thus identified in a software system such as we are currently looking at, one could leverage several things as far as addressing the identified error is concerned; by manipulating the problematic program as through experimentation, the identified [and/or visible] problem with a system might be eliminated — but, this doesn’t necessarily imply that the underlying cause of the problem has been addressed[7]. But also, knowledge — both via experience as well as that of the problem domain and technicalities of the system under development can help the software engineer or developer to arrive at a sufficient solution for the problem at hand once it has been identified and well understood.
In our case, since we have isolated the instruction causing the problem in our target program, we can look at it critically, and with knowledge of what it is we originally intended to achieve versus what is actually happening, and then proceed to try out some potentially effective solutions. In particular, looking at the problematic instruction (Line #23 in Listing ) in the original program before we modified it:
v!:vIN
We notice the following telling problems:
-
First of all, we notice that, the instruction was meant to actually compute the length of a string stored in a vault — essentially, a kind of pointer, however, based on the known semantics of TEA instructions, we can tell with sufficient knowledge that this instruction signature isn’t possibly doing the right thing. Why?
- (a)
- We know that the convention in TEA is that vault-accessing instructions use the * qualifier against the TEA primitive command of interest so as to make it clear they are meant to manipulate some pointer [3]. However, this instruction’s signature, though it is qualified with !, which for the v: command also maps to length-computation operations, is missing the expected * qualifier!
- (b)
- By looking at the semantics of the v: — Vault TEA command in the TEA TAZ, we find that indeed, the correct variant of this command for the computation of the length of a string held in a vault is the command with the signature: v*!:vNAME — which is defined as “Return the length of what is stored in the vault vNAME. Without vNAME, is like v!:"
- Further, by looking at the evidence we amassed while testing around this bug in the cases above, we see that, before we modified the instruction — such as in Listing ), the program was reporting the length of the input as “3 CHARS", which, looking at the above problematic instruction signature as well as what we just uncovered concerning the computation of the length of strings held in TEA vaults, is enough to explain why the result was always “3 CHARS" irrespective of the input passed to the program; basically, as it was, the instruction on Line #23 in Listing was treating the provided instruction argument vIN as an explicit string and not as the pointer to the vault with the name “vIN"! And so, it was correct to return the length of the string as 3, because that’s how many characters are in that instruction’s argument when treated as a literal string!
Thus, armed with the above context and potential theories for why the bug was manifesting, we can then embark on a hunt for a potentially final solution thus: we shall go back to the program of interest in Listing , modify it so as to eliminate the wrong instruction on line Line #23, and make any other necessary modifications so as to fix the error.
Solution#1: First of all, by merely correcting the instruction signature in that program on Line #23 to the following:
v*!:vIN
We notice that re-running the program with that fix now starts to produce meaningful outputs as shown in the screenshot in Figure 9; in particular, notice that the reported statistics nowsomewhat correspond to the expected values – see Table 1.
Thus we see that despite the solution having addressed the lack of variance in the computed input statistic as was the case in the problematic program in Listing , and yet, still with this solution, we haven’t yet obtained the exact solution we originally set out to accomplish — but we are somewhat closer to a solution.
A further scrutiny of the original program, together with this newly introduced solution shall reveal some other problems such as:
- We notice that, now that we are correctly referencing the input in the modified instruction on Line #23, and yet, the discrepancy in the input lengths computed as shown in Table 1 begs for an explanation!
-
A closer looks then, reveals that, despite the modified instruction referencing the original vault holding the input value — which, we see being set on Line #11 in Listing in the instruction:v:vINAnd yet, before we compute the length of the value in vIN on Line #23, we notice that this value gets overridden by the instruction on Line #18; basically, the following instruction that occurs before that:g*:{ }:vBLR:vIN:vBLRPads the actual input in vIN with 2 characters before and after as part of the code for constructing the string that will be used to display the final text in the textbox, thus the 4 extra characters we see being reported in Table 1!
Thus we come to Solution#2: Basically, apart from what we have already done in Solution#1, we shall also need to ensure that the original input value is exactly what we are computing the length against, and not some later modification of it. Thus, with this in mind, we arrive at the correct program as depicted in Listing , and which we correctly see performing as shown in Figure 10 and which results are likewise depicted in Table 2.
| Listing 1.A Textbox Drawing Program in TEA with STATISTICS After SOLUTION#2 |
|
Thus we come to the conclusion of a practical exploration of how software debugging is conducted or approached in TEA, the TEA SOE or with the TEA RI runtime. In the next section, we shall wrap it up with a quick summary of all that TEA debugging does from a high-level.
2.3. Overview of Debugging in TEA
In general, we find that the TEA debugger, which can be engaged via the “-d" flag of the tttt interpreter allows for:
- Inspection of how a TEA program is being lexed and parsed — both syntax validation at program start, as well as how each instruction is processed later on during the program’s execution.
- Inspection of a program’s Inputs and how these are processed; input sanitisation and parsing — especially noting that TEA programs understand all input and data to merely be strings and only in special instances, regular expressions. Also, that strings in TEA can be delimited — such as with “STR" or {STR} or not — such as with merely STR
- Inspection of Instruction Execution Order and Precedence (Program Control Flow) — quite useful when a program involves jumps, forks and looping.
- Inspection of a program’s Memory Footprint — Vaults; Named Variable Containers, Active Input; Default Input for Next Instruction, Secondary Memory; The Unnamed Vault, Initial Program Input; y*: and any other memory or storage quirks possible in TEA.
- Inspection of Program Outputs — such as contents of the Default Vault, Last Instruction’s Output and the Final Program Output.
It is also important to note that without the “-d" flag to tttt, the only output one would get from running a TEA program is the program’s run-time outputs (such as prompts with the i: command) or the program’s final output (or no output at all; if the program processed nothing or the final output is empty and no intermediate instruction produced any displayable output). Essentially, only i: can print while a TEA program is in a non-terminal state, and this, only when used in blocking, prompt mode — see example in Listing on Line #4 and in Figure 4.
Finally, whether in DEBUG MODE or not, tttt doesn’t yet support output to alternative streams other than default system output stream; STDOUT.
3. A Plan to Improve Debugging in the TEA SOE
Before we conclude our discussions and explorations concerning debugging TEA, let us take a moment to consider what the future of debugging in TEA might or ought be like in case we make further enhancements of the language’s runtime, debugger and support tools — essentially, if TEA evolves beyond what it currently is.
Specifically concerning the TEA debugger;
-
First of all, because we note that traditional debuggers typically allow for some sort of interactive, step-through debugging as one of their very useful features, and yet this is missing in TEA, we could improve debugging in the TEA SOE by;
- (a)
-
Breakpoints: Implementing a breakpoint mechanism in TEA program syntax (for example, the control flow mechanism of TEA labels, l: might be extended for this... with breakpoints implemented using unnamed labels of some special signature like:l!: # look, no label name: this could be a breakpoint!This would then allow the TEA runtime to halt in the program execution at any point where such a breaking statement/instruction is met in the TEA program while in DEBUG MODE; thus we realize useful interrupts in TEA program execution; currently, attempts to use the above syntax would only result in an exception or syntax error.
- (b)
- Willful State Dumps at Only Breakpoints: Basically, allowing for some state dumping at each such breakpoint [when such breakpoints are encountered during DEBUG MODE]. Already, TEA with DEBUG MODE dumps state at each instruction met. But also, such a mechanism could allow for finer control of when or how the dumping or tracing of a TEA program happens — for example, by limiting the dumping of system state and debugging information to only sections marked with such statements — could operate as [debugging] sector delimiters in a manner similar to how current TEA label-blocks work. This, so that state dumping or tracing only occurs at moments in the program when it is turned ON/OFF by such breakpoints. This would also allow for a feature similar to the “Watch" facilities in other GPL environments.
- (c)
- Modifying State at Breakpoints: Optionally, allow for the user/developer to not only watch the system state (such as program variables and their current values, as at the breakpoint), but to also allow them to be able to modify; change, overwrite or delete them before normal execution of the program continues.
- User-Controllable DEBUG MODE Levels: As it is currently, the TEA debugger doesn’t make it any easy for the user or developer to control how much information or what kind of information the DEBUG MODE of tttt produces. So, in future generations of the runtime, such a problem could be resolved by allowing for perhaps the use of a “Debug Level" parameter to the “-d" flag; something like -d [D|I|W|E] or perhaps -d [DEV|INFO|WARN|ERROR] or -d [0|1|2|3], such that invoking the debugger with -d D would set the debugging level to DEV-level, at which level everything; errors, warnings, info, debugging info, etc shows up; useful for developers and engineers. While, invoking the debugger with -d E or -d 3 or -d ERROR sets the level to ERROR-level, at which moment only critical, perhaps severe must-show only bits of information get to be displayed, otherwise the debugger remains silent. This feature could also be linked to the matter of when or how to control the logging and verbosity of the DEBUG MODE of the TEA runtime, as well as when to channel information to perhaps STDERR as opposed to or only to STDOUT.
- Enhanced DEBUG MODE Info: For example, we note that for someone a bit or entirely unfamiliar with the semantics of TEA or its syntax, sometimes looking at a TEA program might be not only intimidating, but perhaps also perplexing — especially when someone must make sense of what is going on or why without access to the language’s manual or a TEA expert. Thus, to help with clarifying things for both beginners and regular users of the language, the DEBUG MODE could be enhanced further by including [more] insightful information about each TEA instruction encountered in a program — basic things like tagging or annotating the instruction with its formal name; e.g. upon encountering i:, tagging that as “Input", “Prompt for Input" or better, “Interact", while i!:STR would be tagged as “Unconditionally Set Input", while i:STR would be “Conditionally Set Input" — to help someone understand when which variant of the I: TEA primitive shall do or behave like what or why it is behaving in a particular way in a problematic program. This feature, when applied to the seemingly small set of the 26 TEA Primitives; a: to z: — and some newbies don’t even realize that TEA allows ALL-UPPERCASE commands too — A: to Z:, shall really help some developers come to appreciate and love this very neat and razor-sharp general-purpose programming language.
Apart from the above list of potential enhancements to the TEA debugger and the debugging experience in TEA, a few other matters also need to be considered in future generations of the language, its runtime and debugging facilities if not the entire TEA SOE. In particular, we can give attention to:
-
Introduction of a Static Code Analysis Mode of the TEA runtime: Essentially, without even having to actually execute a TEA program (basically, processing the program without producing effects), allow for some mechanism similar to the “-d" flag of tttt — perhaps “-sa"? — that would go through the provided TEA code or program script, and merely check it for potential errors likely to lead to bugs, code patterns likely to lead to security vulnerabilities, problems with the quality of the code and issues that could make the code difficult to maintain in the long-run.This same feature could for example be responsible for issuing warnings when a TEA program is found to be containing otherwise harmless code, but which code is either useless or merely wasteful — such as instances of INERT TEA statements. By combining this facility with the DEBUG MODE — whether or not the static analysis is to be part of the debugger or a separate facility in the TEA runtime or ecosystem shall be decided later, but, the two mechanisms brought together, shall surely make the identification, resolution and avoidance of mistakes, bugs and critical errors in TEA software much more easier to manage.
-
Implement Floyd-Method Cut-Points:Lastly, and to especially assist with automated program verification or the writing of logic proofs in TEA — a kind of automated program verification, which might also be useful in advanced forms of system debugging and testing of program correctness, we could implement the so-called “FLOYD METHOD" [5] that calls for the implementation of “cut-points" — somewhat similar to breakpoints, or perhaps the equivalent of assertion statements in a TEA program. These then, would be useful such as in the testing of some proof-conditions (e.g. that the AI is nonempty at some moment in the program of interest), and which, if the condition isn’t passed/correct at that moment in the program’s execution, the program halts with an error or exception, and so that, a program that passes all such cut-points without errors is expected to be logically correct as per the nature or conditions of the tests embedded within the TEA program, and thus program verification or validation can be done automagically.However, as per the current TEA language semantics, looks like clever or rather, creative use of the [conditional] Quit command — Q:, already offers a facility very close to what such Floyd Cut-points would do — without triggering run-time exceptions though, and only merely causing the TEA program to quit/halt once some desired condition in the program is unmet upon the processing of that particular instruction.
Acknowledgments
Despite the work on TEA having been going on independently over the years since 2019, and especially in 2024 when it shifted into a full-fledged GPL targeting non-mobile environments — also when much of the work we see concerning the TEA debugger got accomplished, this particular paper on the TEA debugger and debugging in TEA was only recently inspired by friends - Prof. Michael Coblenz (University of California San Diego) and his doctoral student, Hailey Li whose [still-on-going] study on practical software debugging I got a chance to recently participate in, and which then brought to my attention the need to fill a knowledge gap in how the important matter of debugging is catered for in the still young TEA programming language from my lab. The ideas in this paper though, definitely are of use to researchers and practitioners of software engineering and in particular software debugging in general.
References
- Lutalo, J.W. Thoughts & Ideas Behind Design of TEA Language, 2024. v1.1.
- mcnemesis. cli_tttt: Command Line Interface for TTTT, 2024. Accessed: 2024-09-21.
- Lutalo, J.W. TEA TAZ - Transforming Executable Alphabet A: to Z: COMMAND SPACE SPECIFICATION, 2024.
- Joseph Willrich Lutalo. “Software Language Engineering - Text Processing Language Design, Implementation, Evaluation Methods”. In: Preprints (Dec. 2024). [CrossRef]
- Dictionary of computing, 4 ed.; Oxford University Press, 1996.
- Lutalo, J.W.; Eyobu, O.S.; Kanagwa, B. DNAP: Dynamic Nuchwezi Architecture Platform-A New Software Extension and Construction Technology 2020. [CrossRef]
- Parnin, C.; Orso, A. Are automated debugging techniques actually helping programmers?, New York, NY, USA, 2011. [CrossRef]
- Spinellis, D. Modern debugging: the art of finding a needle in a haystack 2018. 61. [CrossRef]
| 1 |
Figure 1.
A Simple Hello World in TEA
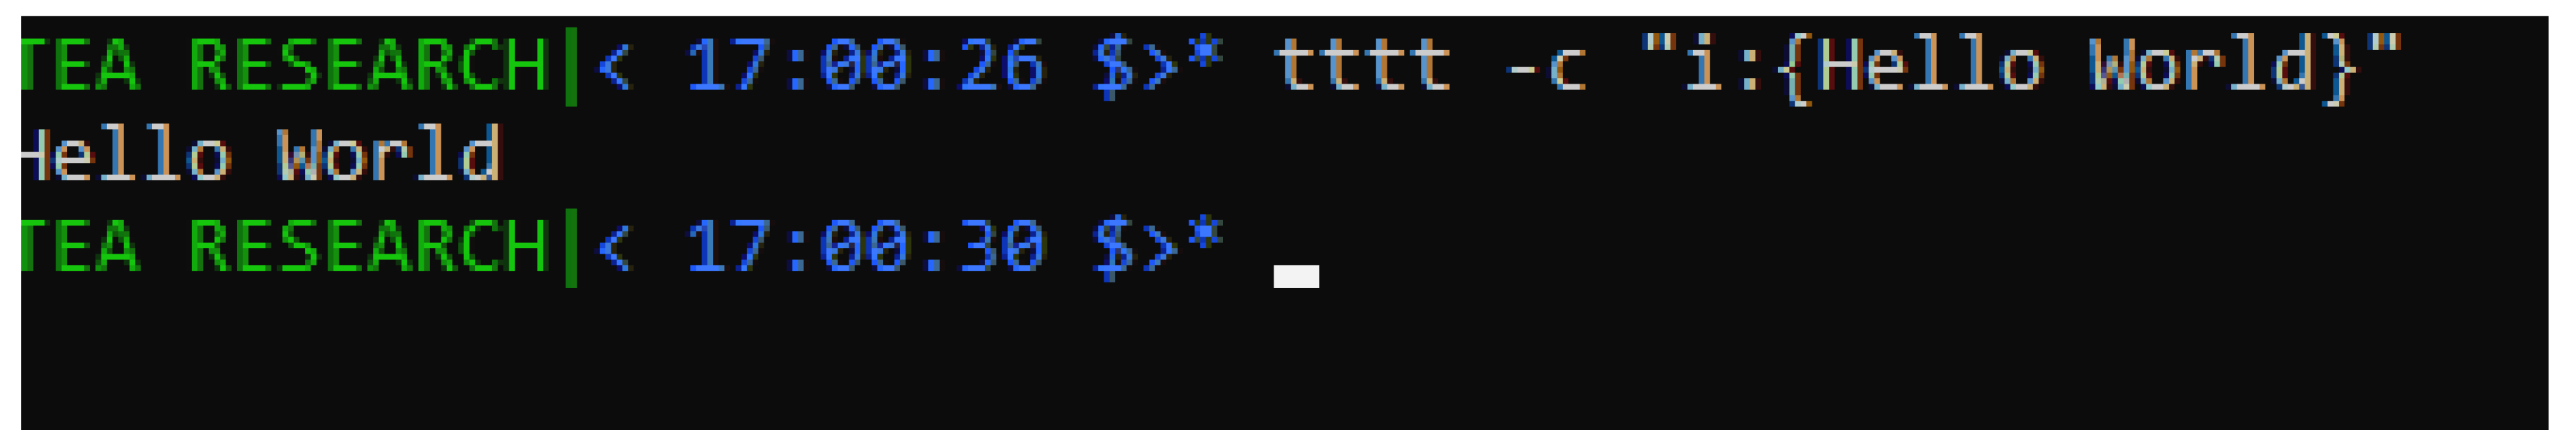
Figure 2.
The Simple Hello World in TEA run in DEBUG MODE
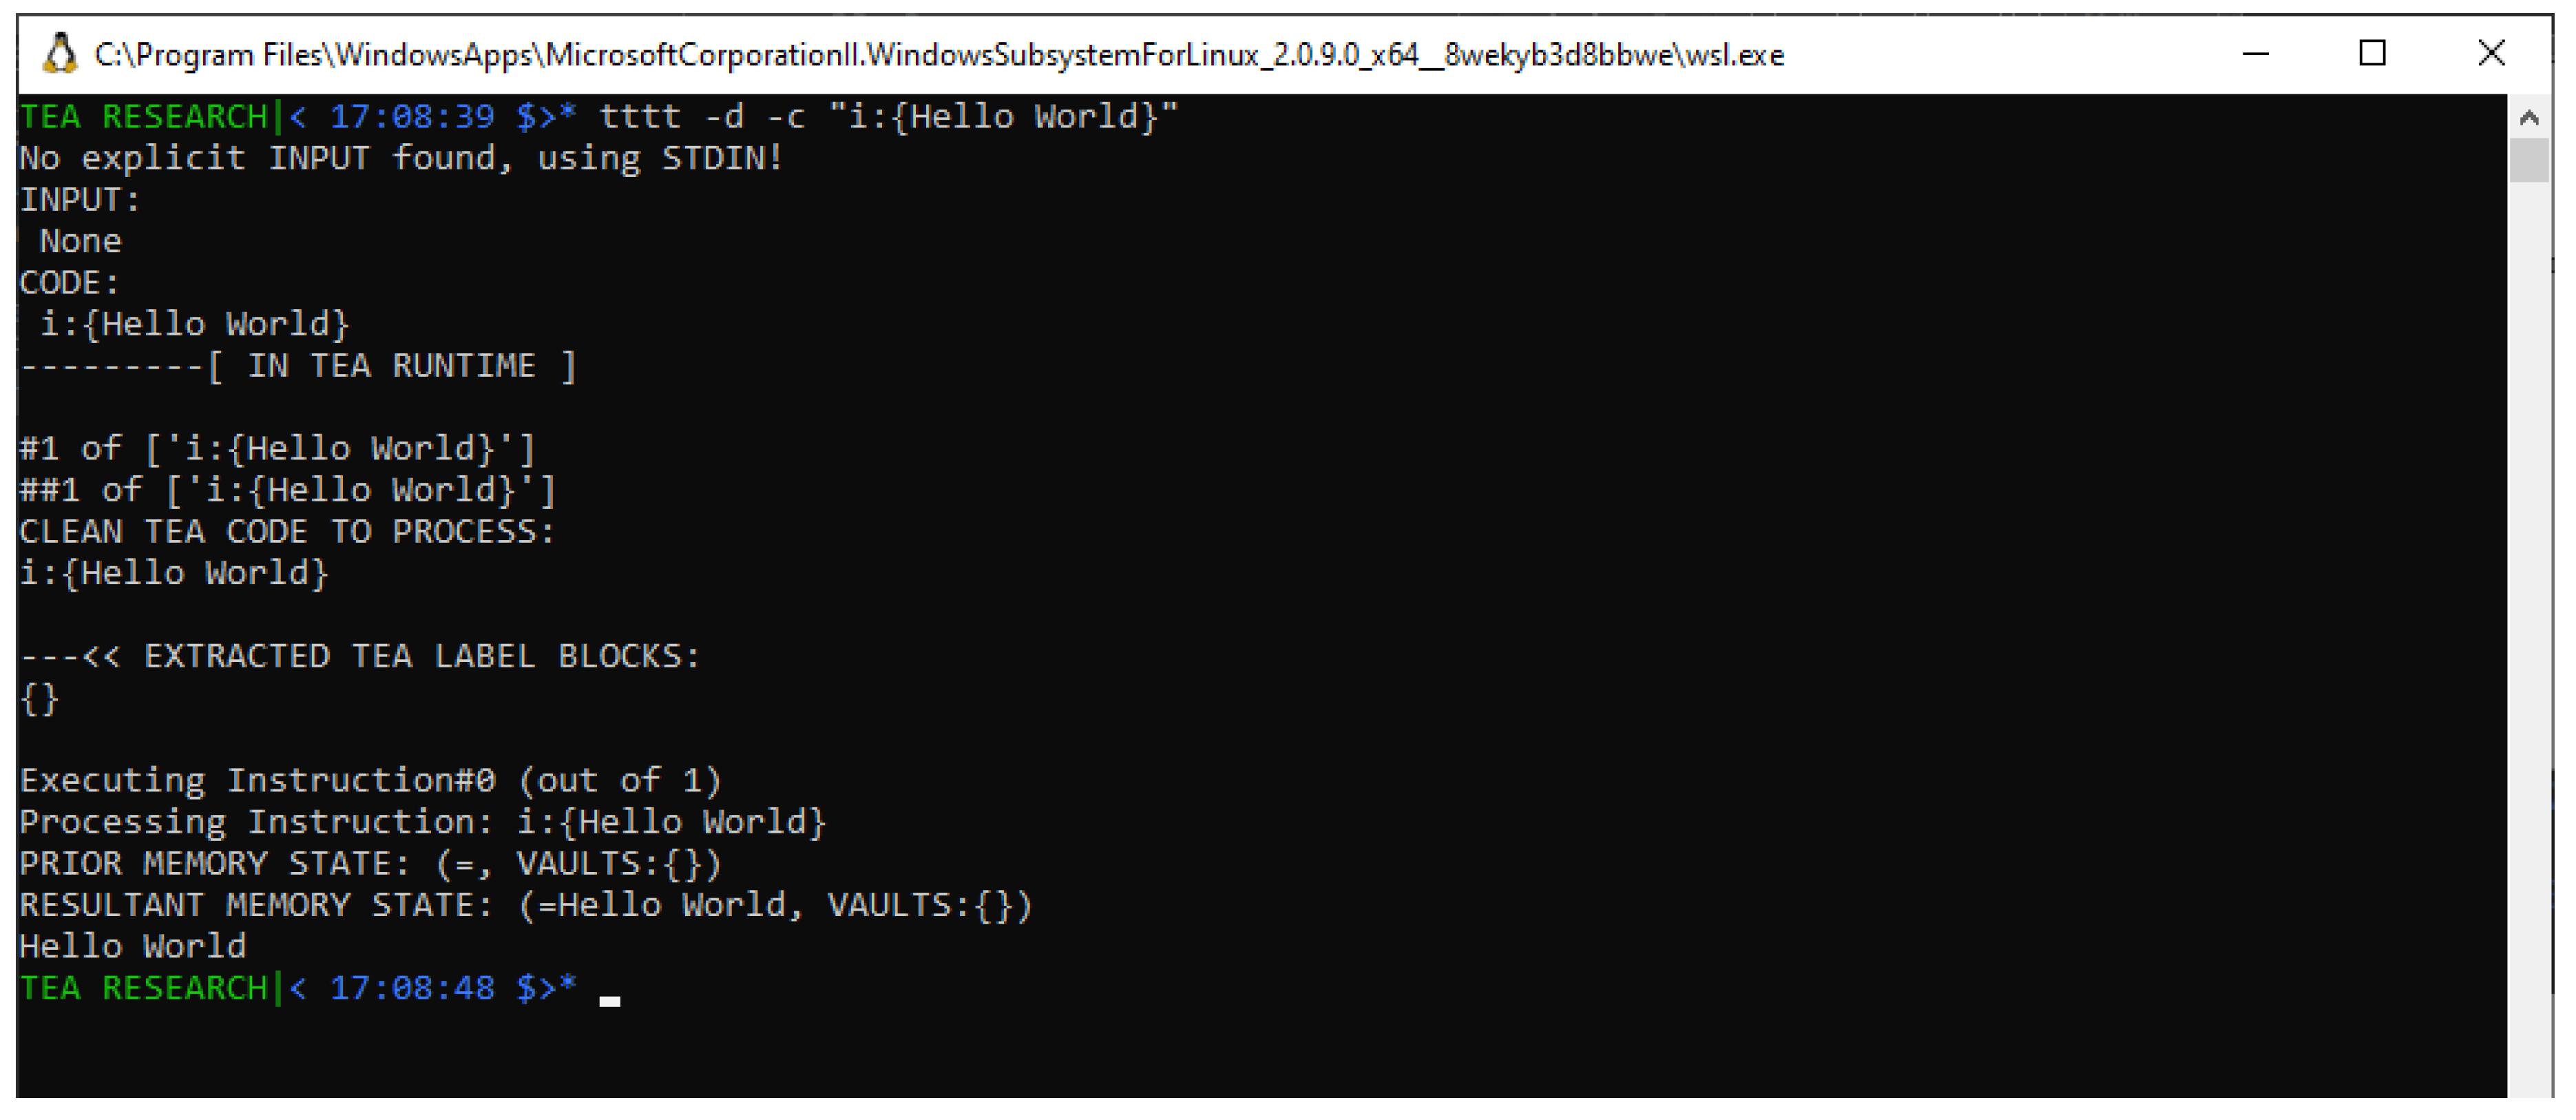
Figure 3.
A Textbox Drawing Program in TEA with Explicit Invocation-time Input
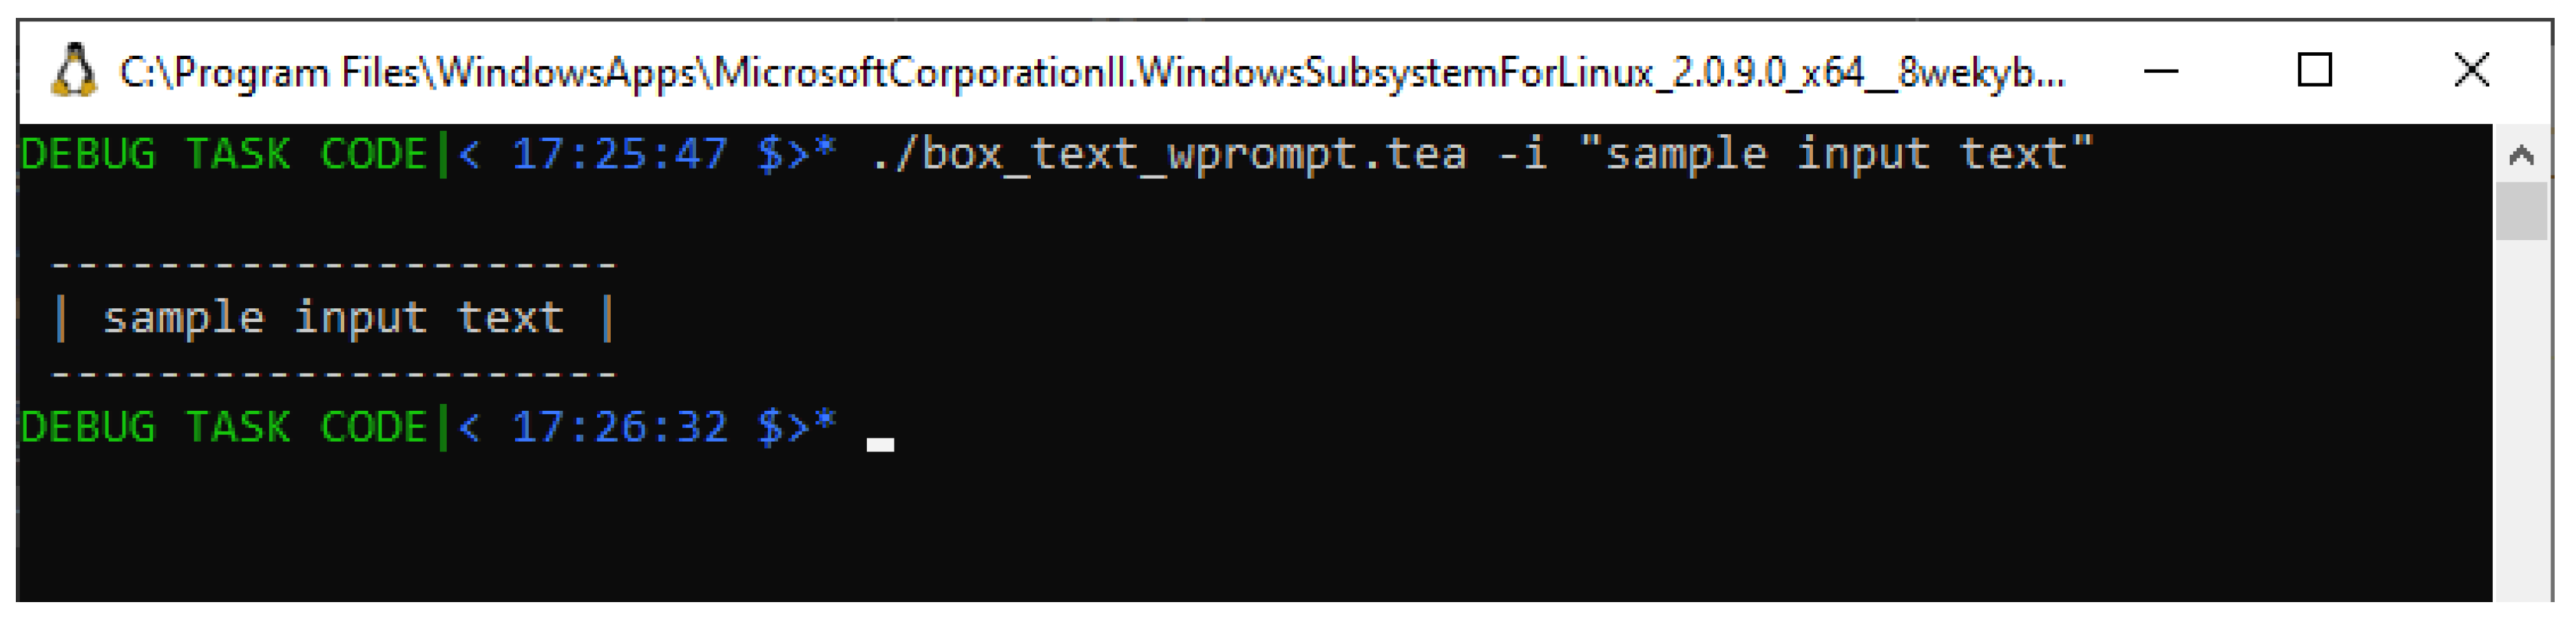
Figure 4.
A Textbox Drawing Program in TEA WITHOUT Explicit Invocation-time Input
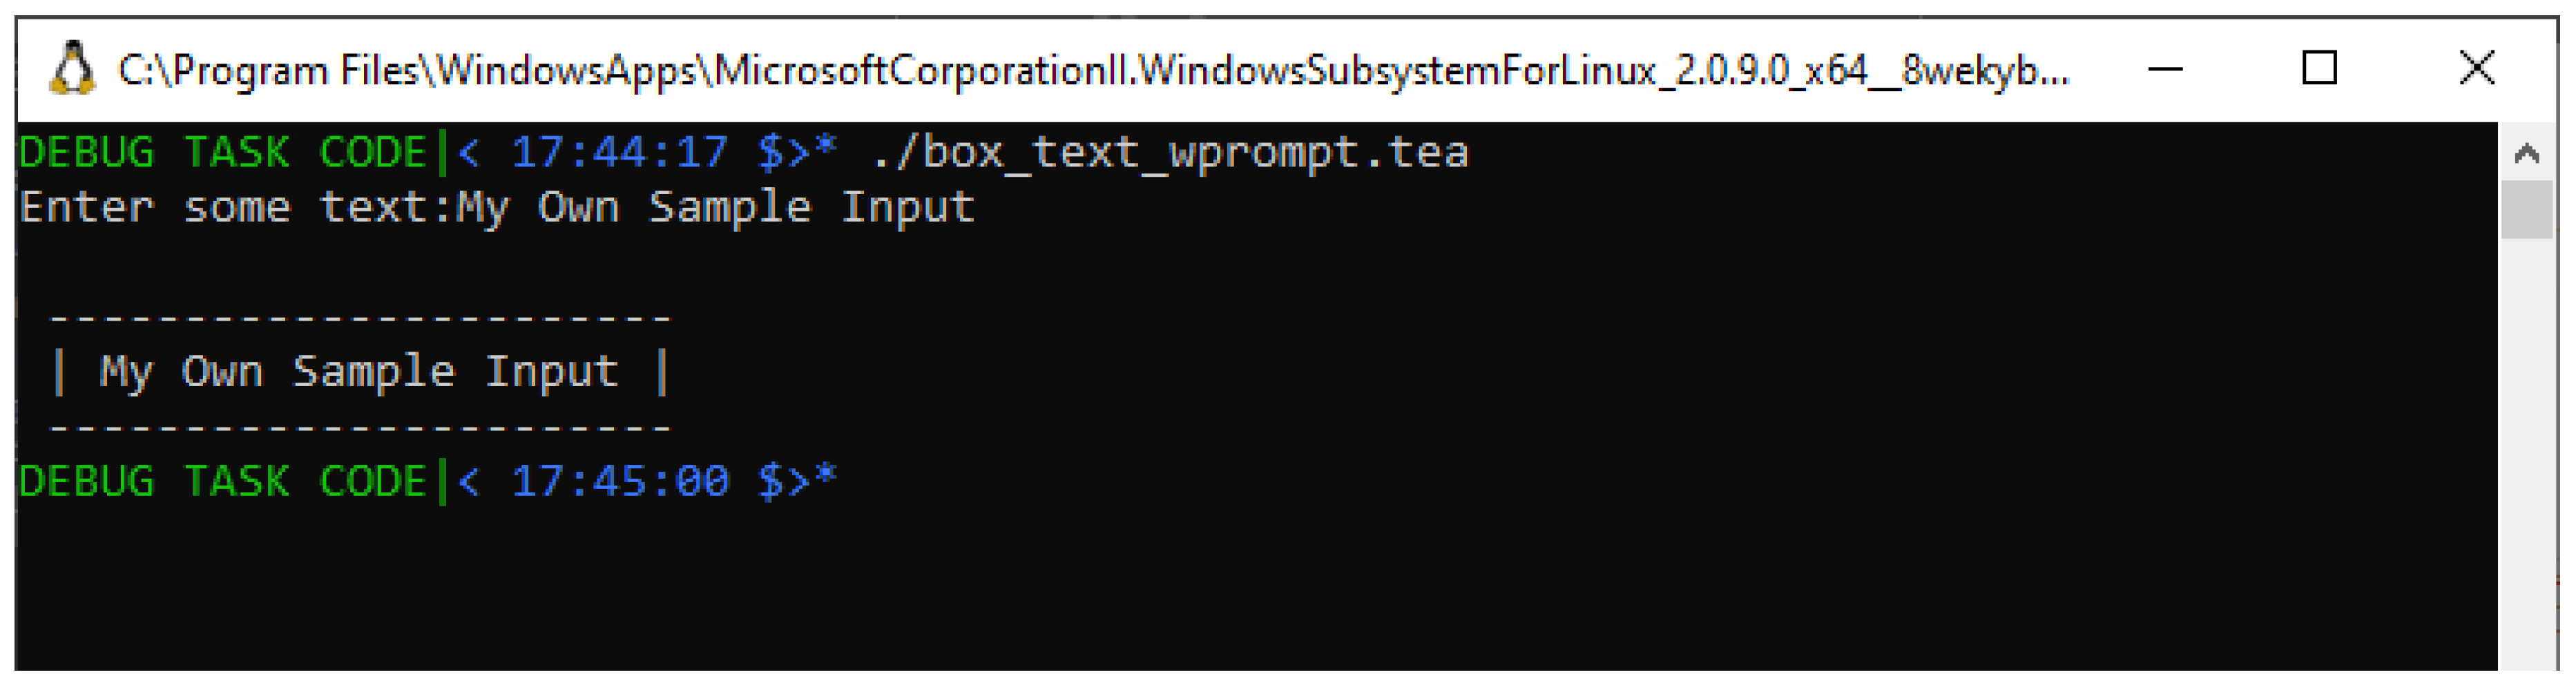
Figure 5.
A Textbox Drawing Program in TEA with STATISTIC for Explicit Input “Hello"
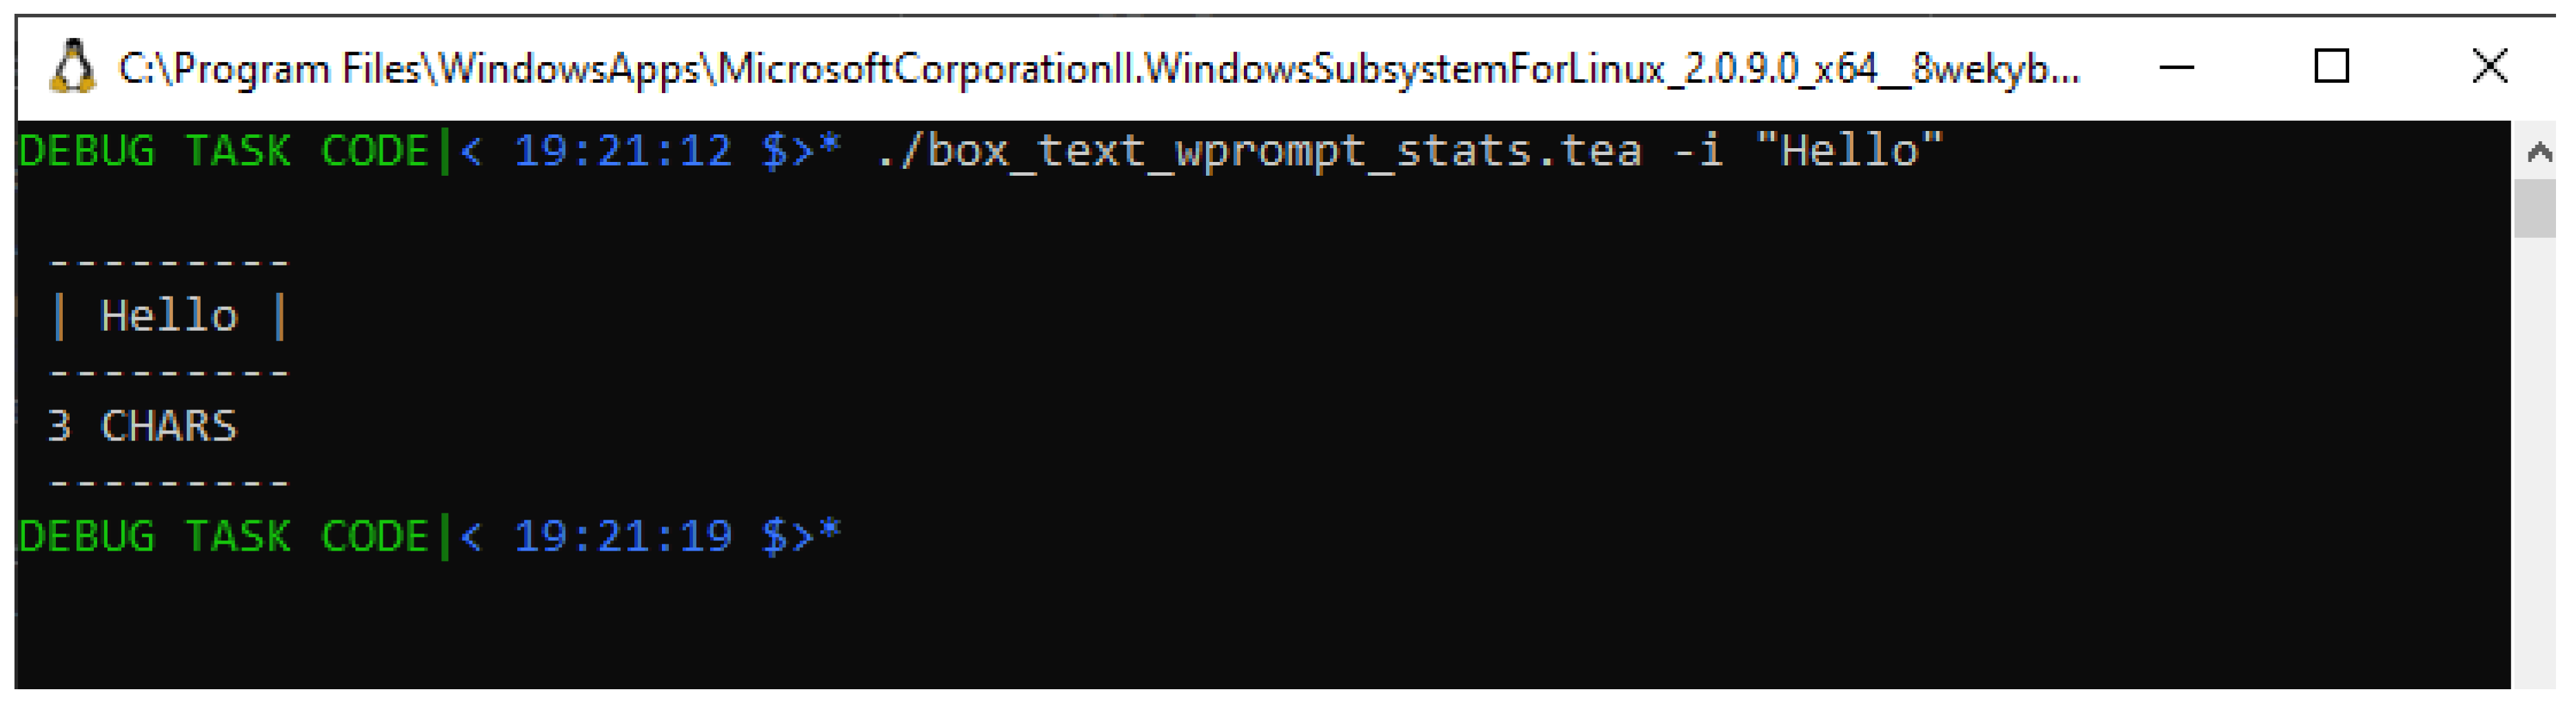
Figure 6.
A Textbox Drawing Program in TEA with STATISTIC for Explicit Input “Hello World"
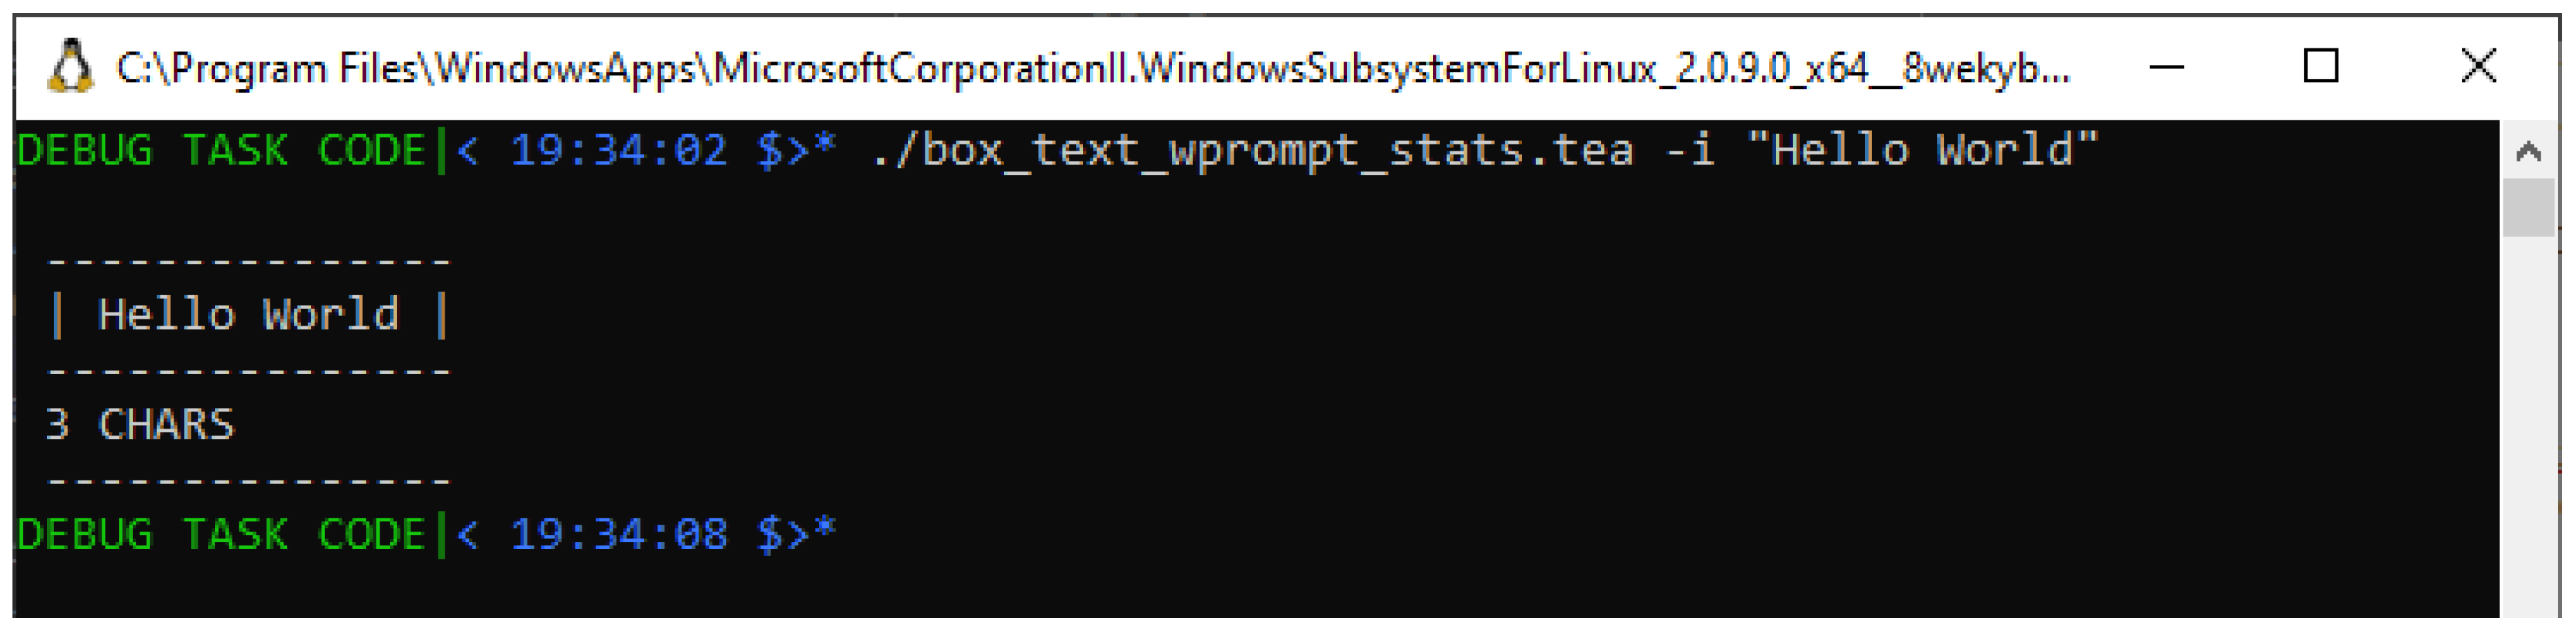
Figure 7.
Testing the TEA Textbox Drawer’s STATISTIC with Run-Time User Input “Hello World"
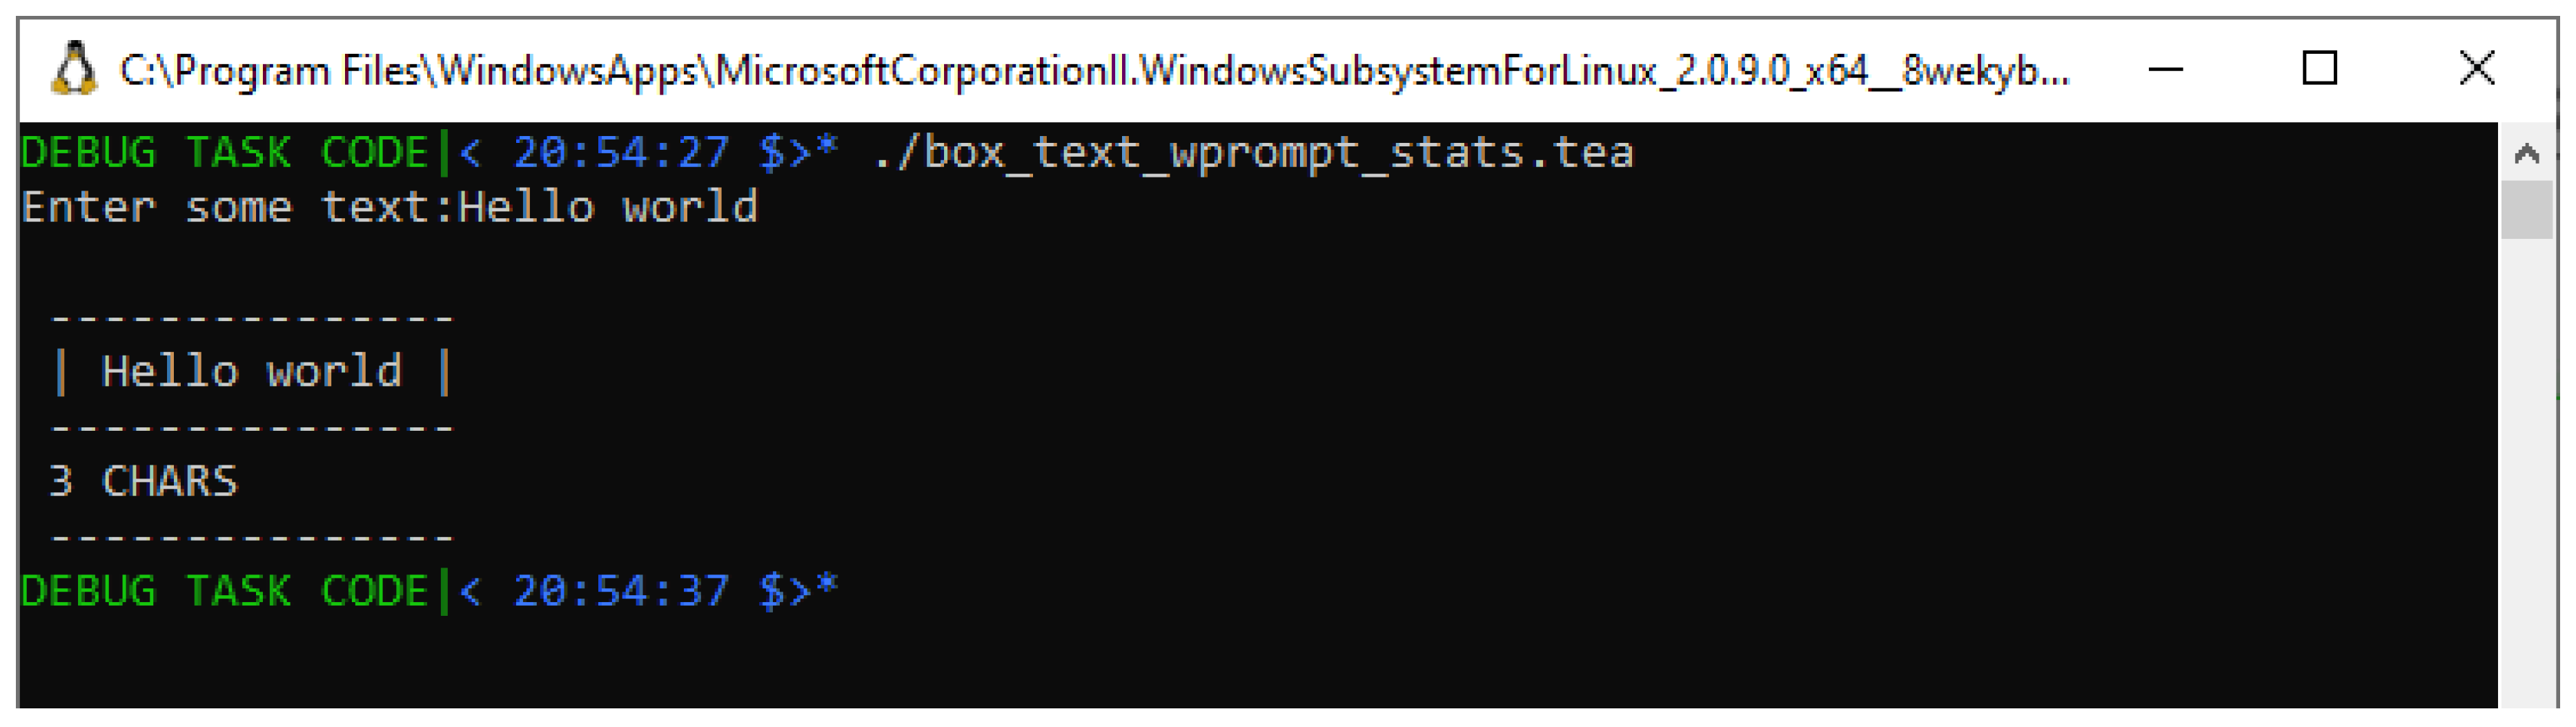
Figure 8.
Testing the MODIFIED Textbox Drawing Program with INJECTED Input “ABCDEFG"
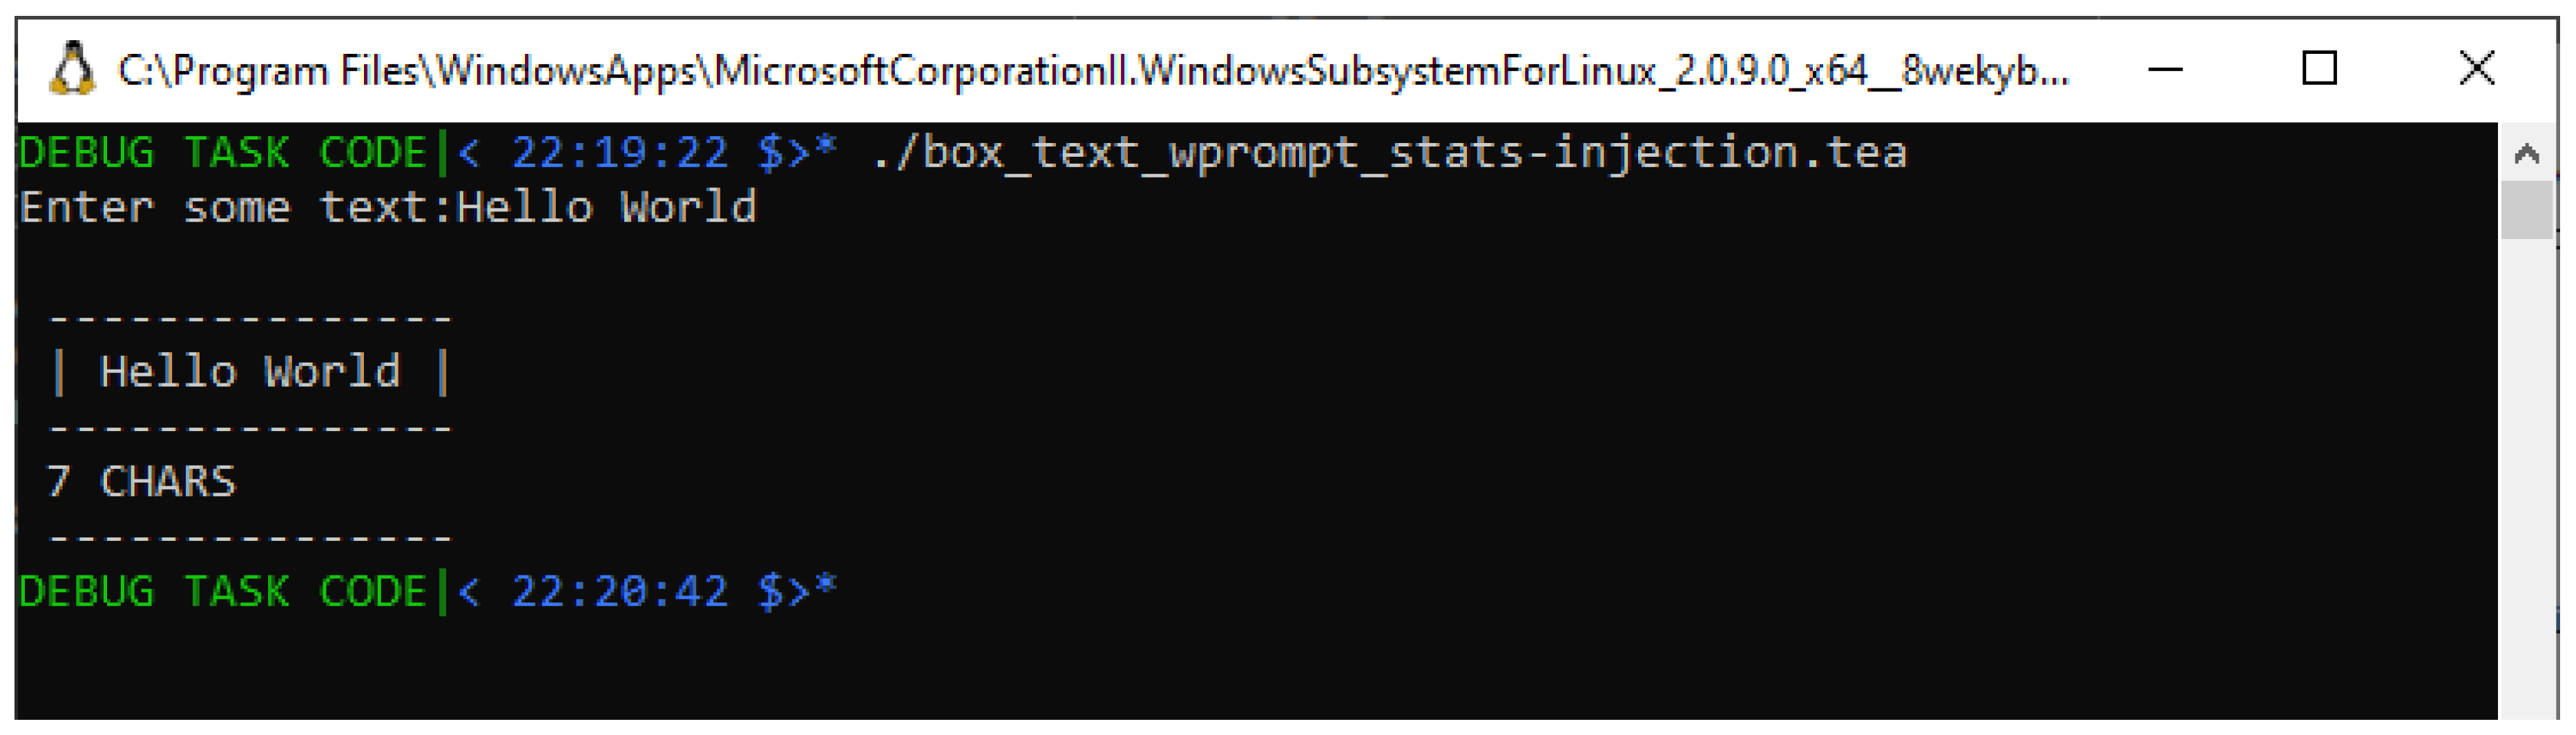
Figure 9.
Testing Solution#1 of the Textbox Drawing Program with VARIOUS inputs
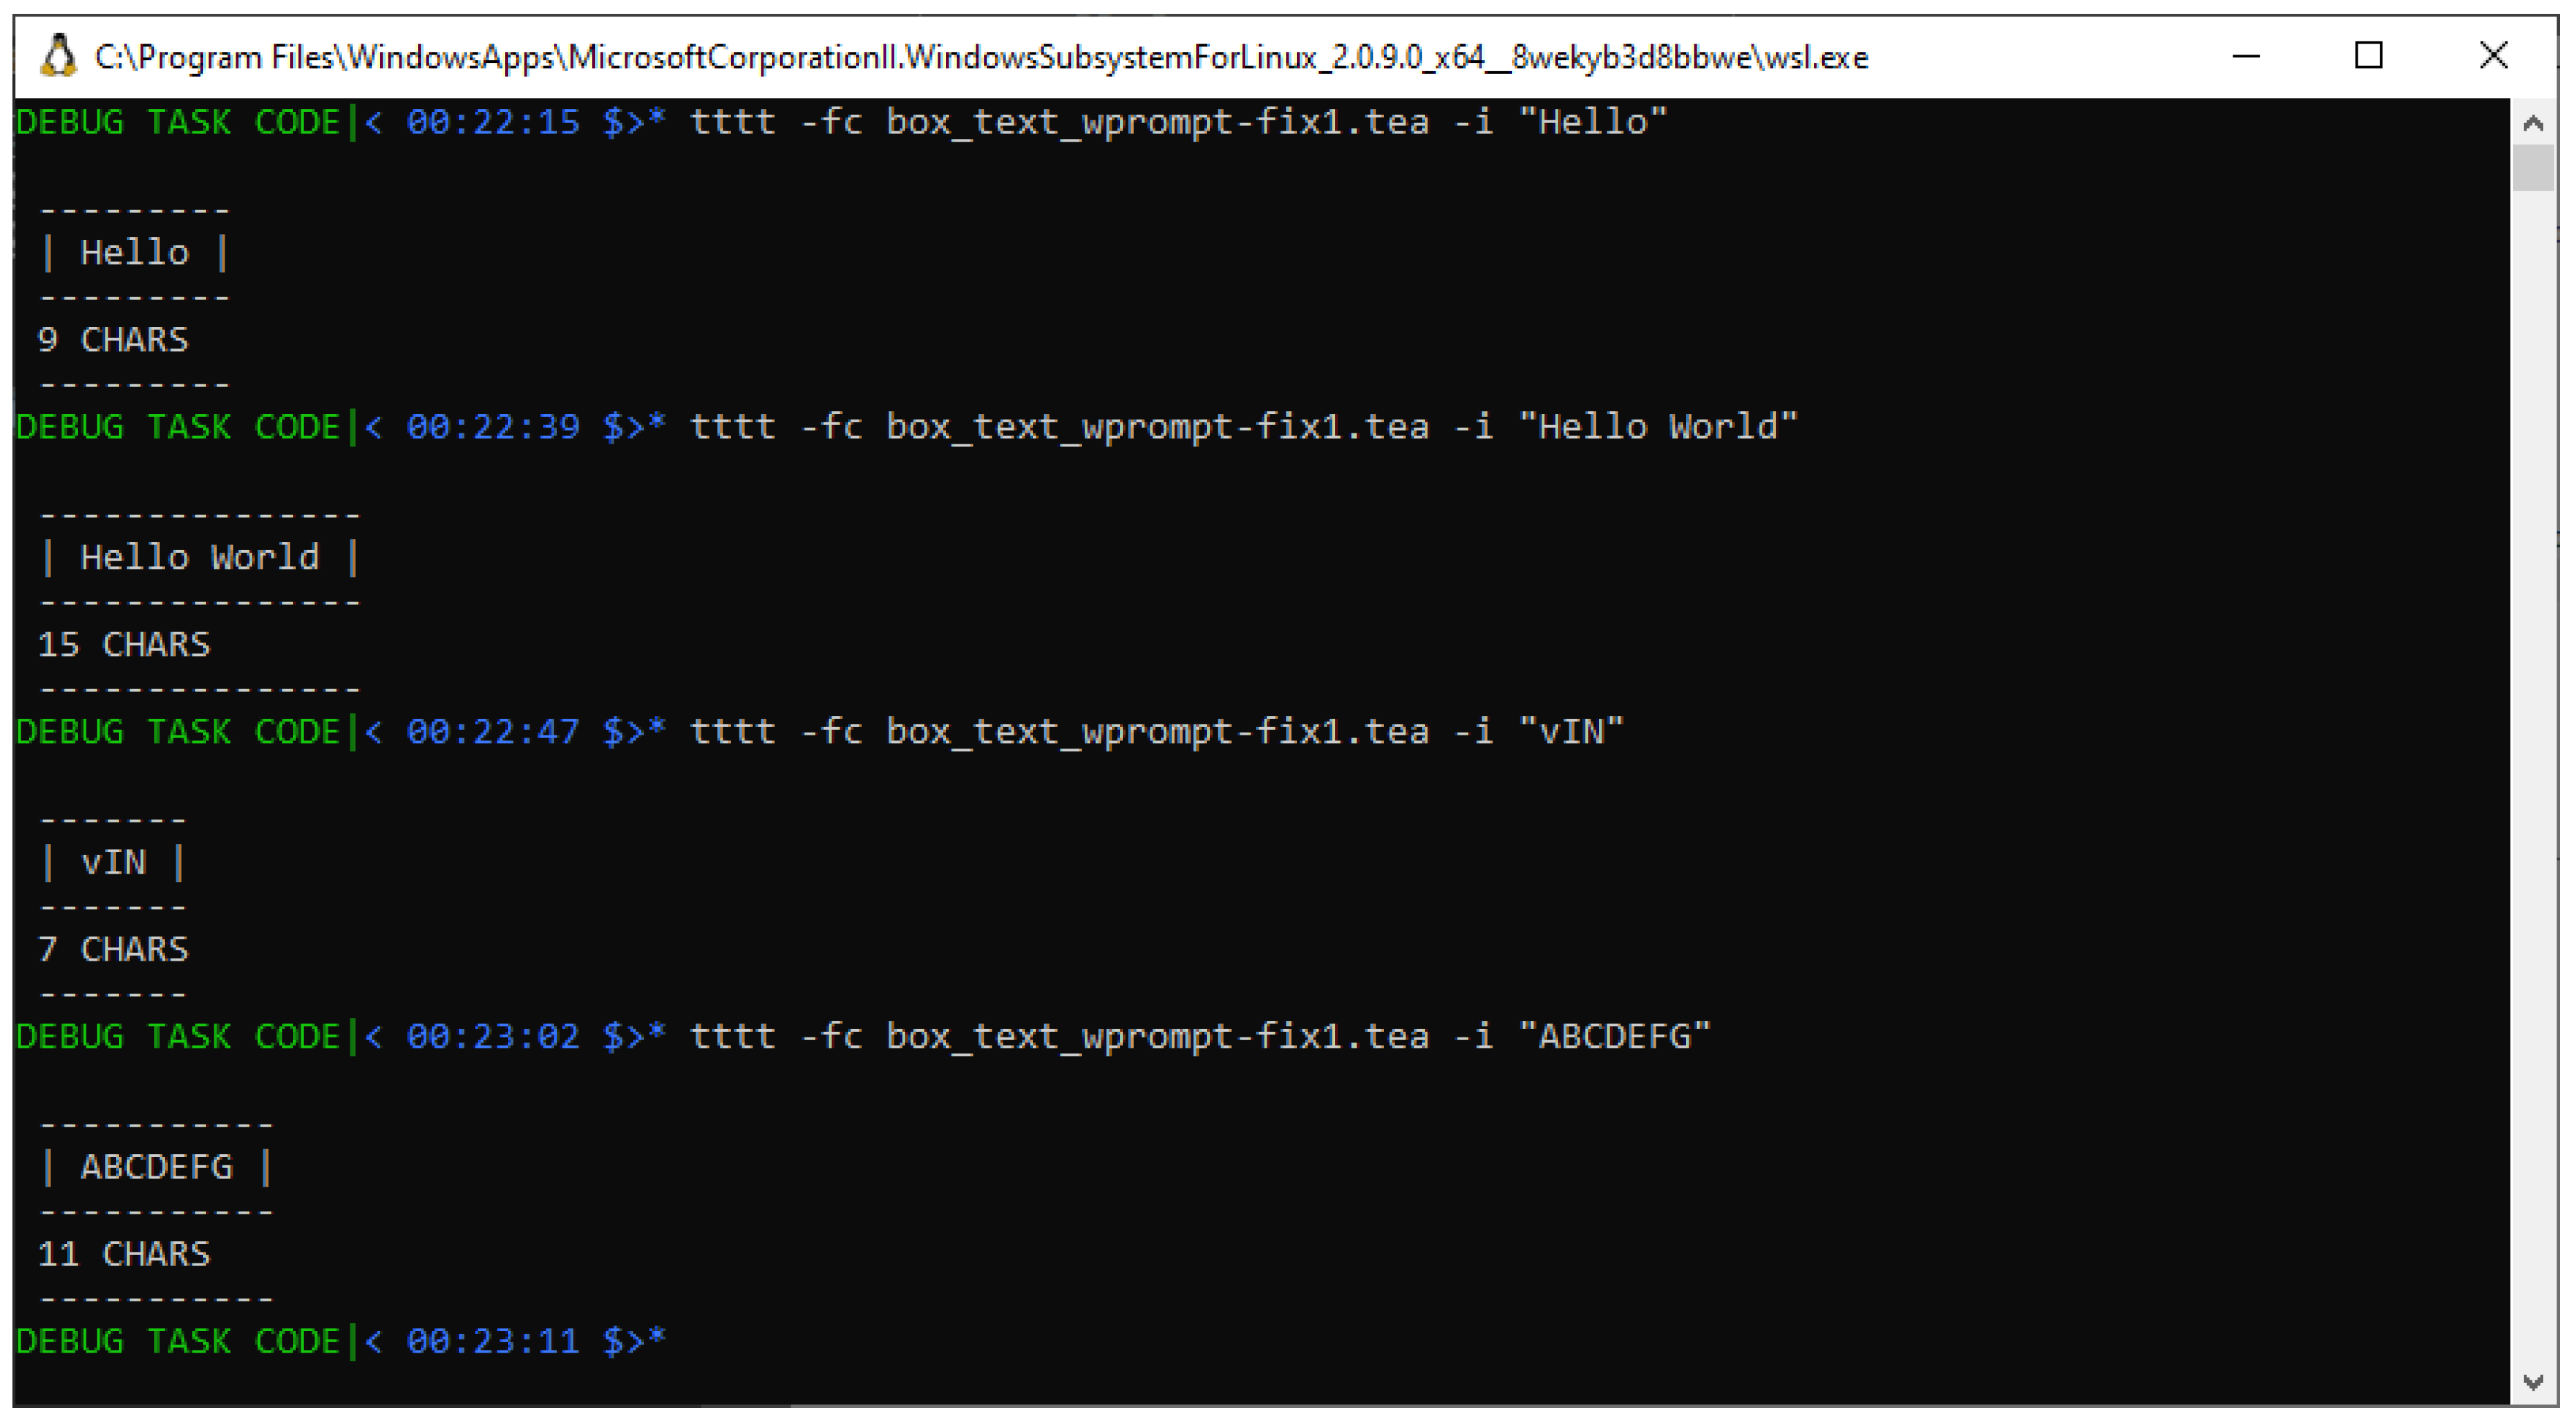
Figure 10.
Testing Solution#2 of the Textbox Drawing Program with VARIOUS inputs
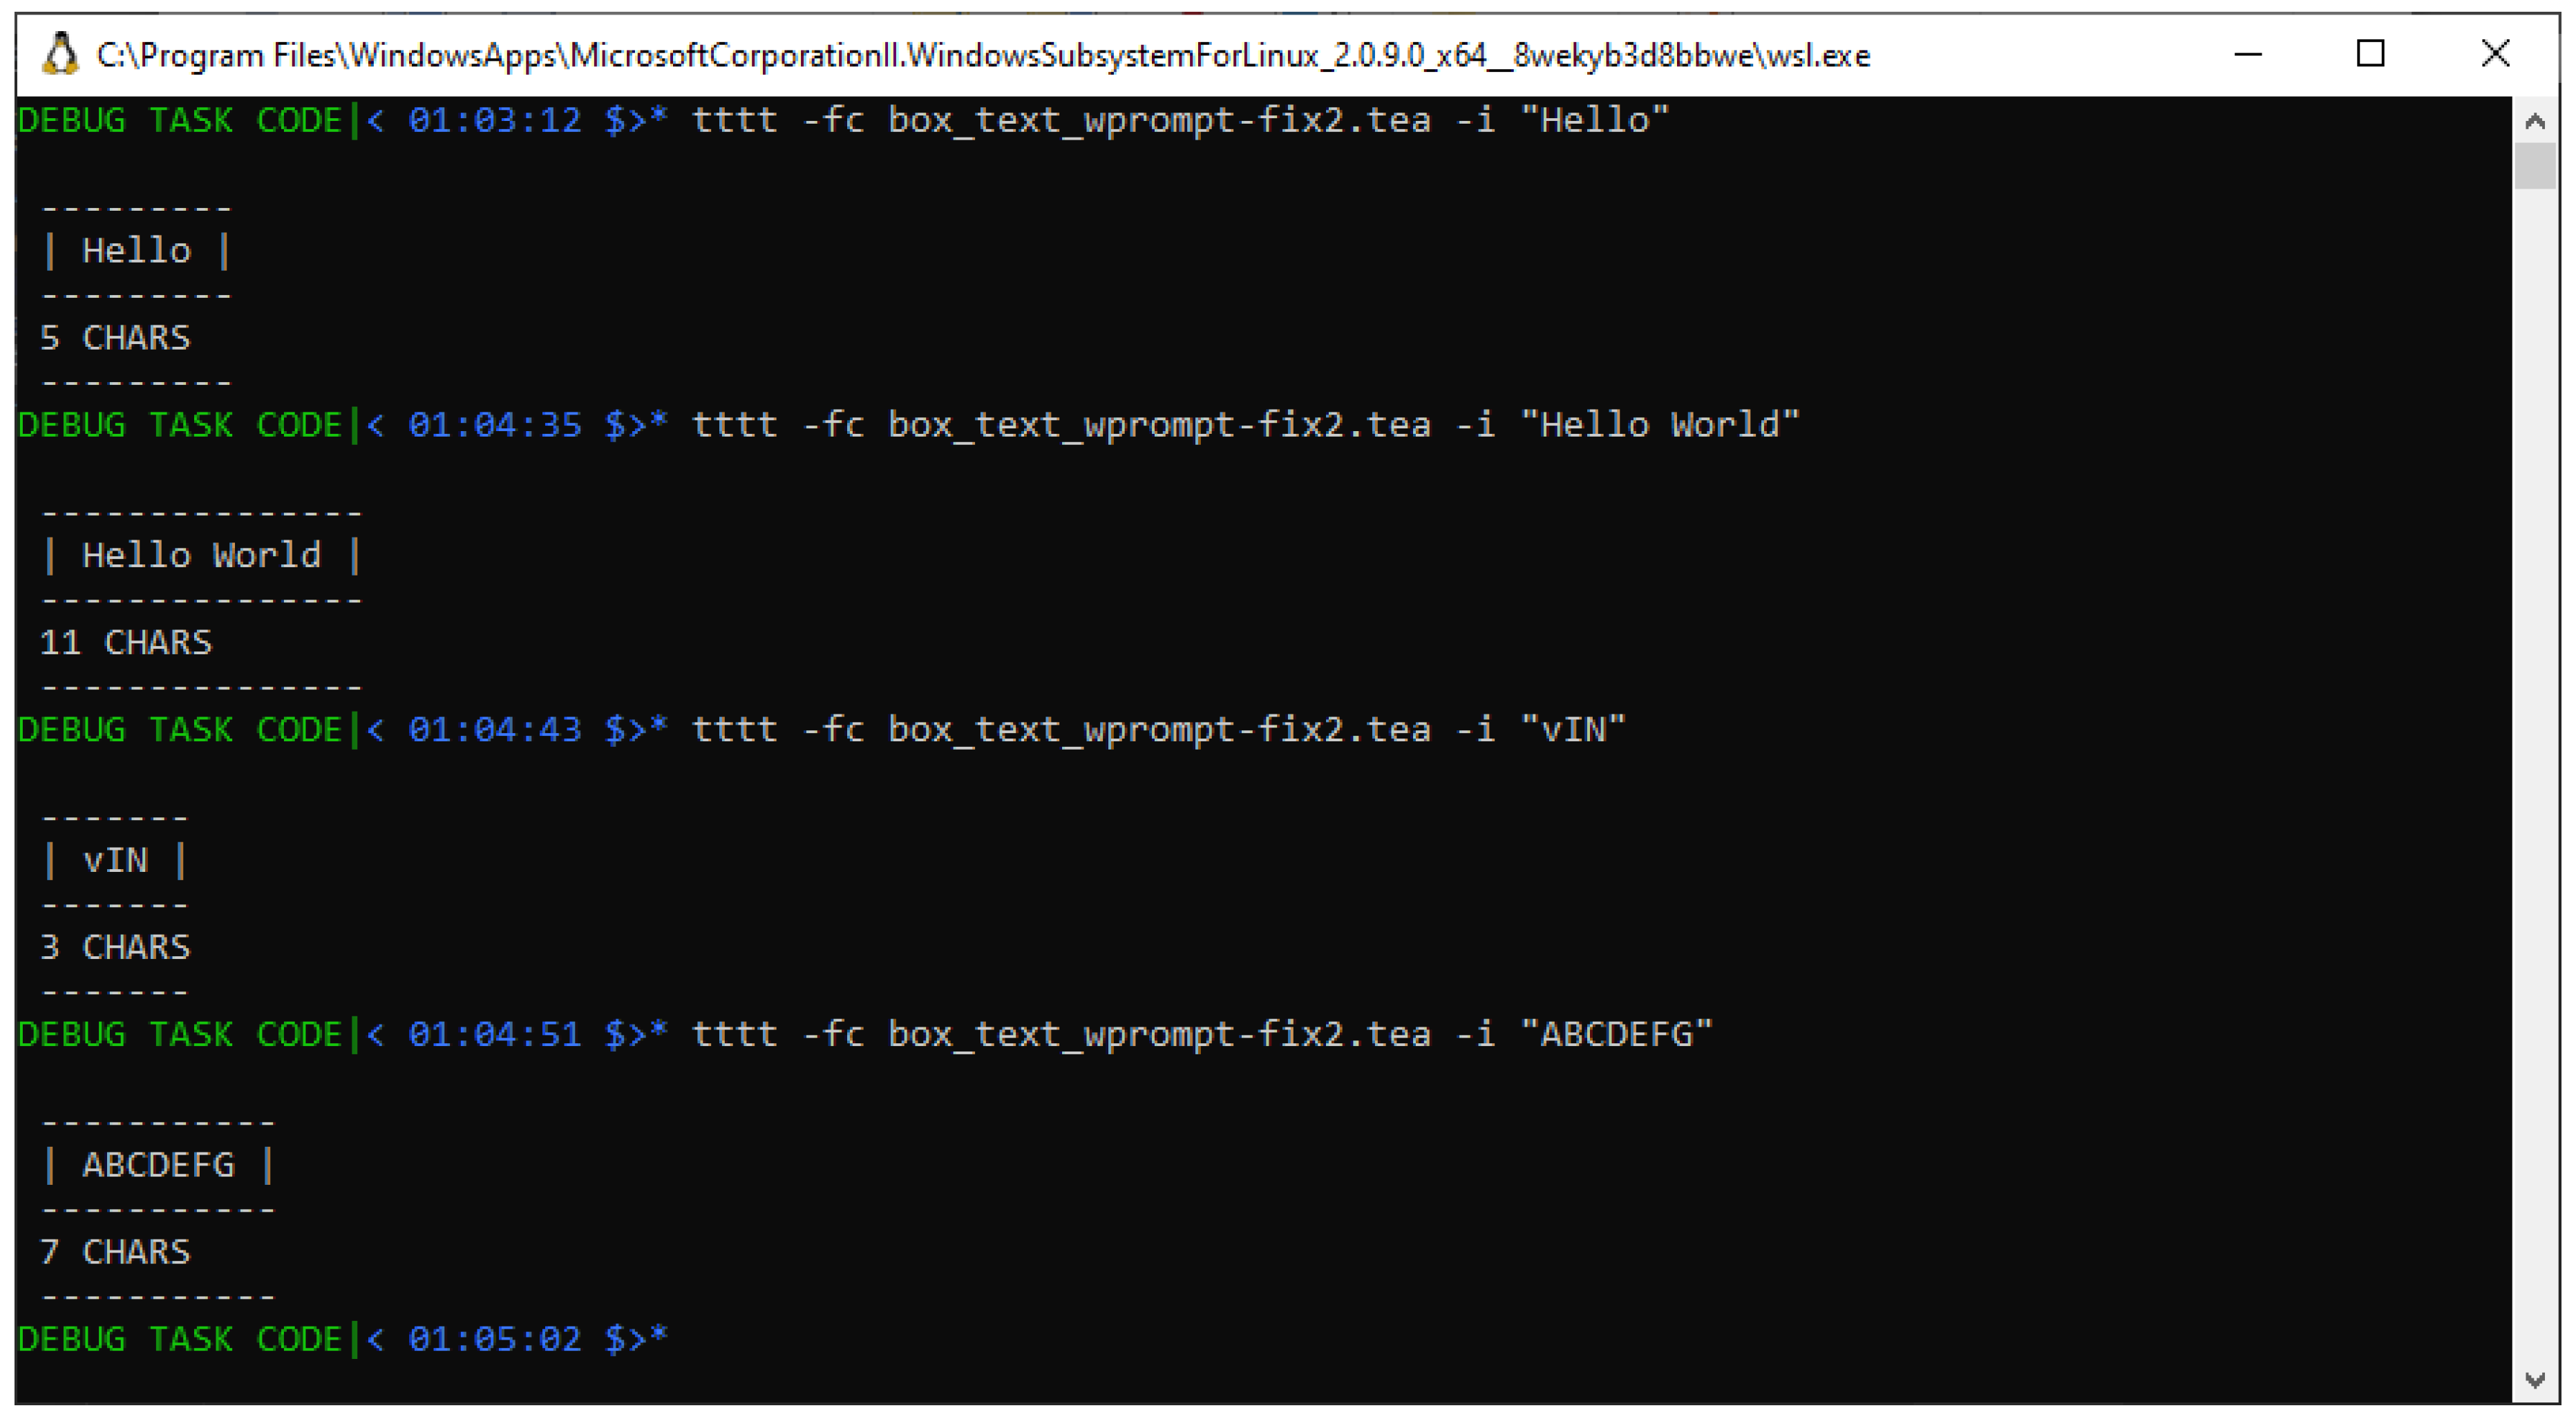

Table 1.
Results from Testing Solution#1
| INPUT | EXPECTED STAT | REPORTED STAT | ERROR |
|---|---|---|---|
| Hello | 5 CHARS | 9 CHARS | 4 |
| Hello World | 11 CHARS | 15 CHARS | 4 |
| vIN | 3 CHARS | 7 CHARS | 4 |
| ABCDEFG | 7 CHARS | 11 CHARS | 4 |
Table 2.
Results from Testing Solution#2
| INPUT | EXPECTED STAT | REPORTED STAT | ERROR |
|---|---|---|---|
| Hello | 5 CHARS | 5 CHARS | 0 |
| Hello World | 11 CHARS | 11 CHARS | 0 |
| vIN | 3 CHARS | 3 CHARS | 0 |
| ABCDEFG | 7 CHARS | 7 CHARS | 0 |
Disclaimer/Publisher’s Note: The statements, opinions and data contained in all publications are solely those of the individual author(s) and contributor(s) and not of MDPI and/or the editor(s). MDPI and/or the editor(s) disclaim responsibility for any injury to people or property resulting from any ideas, methods, instructions or products referred to in the content. |
© 2025 by the authors. Licensee MDPI, Basel, Switzerland. This article is an open access article distributed under the terms and conditions of the Creative Commons Attribution (CC BY) license (http://creativecommons.org/licenses/by/4.0/).
Copyright: This open access article is published under a Creative Commons CC BY 4.0 license, which permit the free download, distribution, and reuse, provided that the author and preprint are cited in any reuse.


