Submitted:
21 October 2025
Posted:
22 October 2025
You are already at the latest version
Abstract
Programming continues to be a challenging discipline for novices, primarily because the dynamic behavior of programs is not visible in static source code. Visual Python is an interactive, web-based educational tool designed to make Python program execution observable via real-time animated visualizations. The system captures runtime traces and maps variable updates, control flow, function calls, and data-structure transformations into smooth, pedagogically informed animations. This paper motivates the need for improved program visualization, surveys relevant literature across CS education and HCI, details the system architecture and design decisions, and presents a comprehensive evaluation plan. We argue that by externalizing execution semantics through animation and interaction, Visual Python can reduce cognitive load, accelerate concept acquisition, and improve debugging skills among beginner programmers.
Keywords:
program visualization
; python
; execution tracing
; interactive animation
; cognitive load
; CS education
; pedagogical tools
I. INTRODUCTION
Programming is a core skill in computer science education, yet many students find introductory courses daunting. Novices must simultaneously learn syntax, semantics, problem solving, and debugging strategies. Research and teaching experience indicate that many persistent misconceptions stem from the inability to observe runtime states directly: variables, memory, call stacks, and data structure transformations are internal to execution and thus invisible. This invisibility forces students to mentally simulate execution, which increases intrinsic and extraneous cognitive load and leads to common errors such as mispredicted loop bounds, incorrect assumptions about variable aliasing, and confusion about recursion [8,18]. Consequently, a tool that externalizes runtime behavior in an intuitive, interactive, and safe manner can significantly aid learning.
- A
- Background
Introductory programming (CS0/CS1) courses have high variance in outcomes across institutions, but a shared pattern is the steep early learning curve. Programs that appear trivial to experienced programmers often confound beginners because the mapping between code and consequence is non-obvious [15,24]. Instructional techniques that expose program state, such as live coding, blackboard tracing, or worked examples, are effective but time-consuming and limited to small class sizes. Digital program visualization attempts to automate and scale these pedagogical strategies by producing concrete visual representations of execution [9,11]. These visualizations can be embedded into lab assignments, lectures, and online materials, allowing repeated, self-paced exploration [32].
- B
- Challenges in Programming Education
Despite the recognized benefits of program visualization, adoption remains limited for several reasons. First, many tools focus on debugging and development productivity rather than pedagogy [19]. Second, earlier visualization systems prioritized completeness of trace over the clarity of presentation; they produce dense frames that are difficult to interpret at a glance [12]. Third, concerns about security and scalability complicate running arbitrary student code in web-based environments [1,2]. Finally, the pedagogical design—when and how to animate, what to highlight, how much detail to show—is nontrivial and often overlooked in engineering- driven projects [16,17].
- C
- Importance of Visualization and Theoretical Foundations
Educational psychology provides strong theoretical support for visualization as a learning aid. Cognitive Load Theory (Sweller) suggests that reducing extraneous load and providing worked examples improves schema acquisition [10]. Dual- Coding Theory posits that coupling visual and verbal/textual representations enhances learning [17]. In the programming domain, externalizing the runtime reduces cognitive simulation demands and lets learners allocate working memory to conceptual understanding [34]. Eye-tracking and attention studies further indicate that guided animation can direct learners to relevant changes, improving comprehension and retention [4,36].
- D
- Research Gap and Contribution
Existing web-based systems such as Online Python Tutor demonstrated practical value but left room for improvement in animation smoothness, pedagogical affordances, and interactive exploration [1,2]. Visual Python fills this gap by combining a sandboxed execution engine, a trace-normalization pipeline, and a visualization layer designed with HCI and pedagogy principles. Our contributions are: (1) a design pattern for producing pedagogically tuned animations from fine-grained execution traces; (2) a prototype architecture that balances safety, responsiveness, and expressivity; and (3) a planned empirical evaluation to measure learning gains and usability in real classroom settings.
II. LITERATURE REVIEW
The literature on program visualization (PV) spans decades and includes technical systems, empirical studies, and theoretical analyses. We synthesize relevant prior work in several categories: foundational PV systems, web-based and embeddable visualizers, empirical studies on PV effectiveness, cognitive and HCI research informing animation design, and recent advances that suggest future directions.
- A
- Foundational Work in Program Visualization
Early PV efforts focused on static visual representations of algorithms (e.g., sorting, graph algorithms) and the development of taxonomies and toolkits for visualizing program behavior. Myers [11] and Price et al. [12] proposed frameworks that distinguished between algorithm visualization and program visualization, noting that different tasks (learning vs debugging) require different affordances. The foundational meta-studies by Hundhausen et al. [8] aggregated results from many PV tools and highlighted that tool design and pedagogical integration critically moderate learning outcomes.
- B
- Web-Based and Embeddable Visualizers
Online Python Tutor [1] showed the feasibility and pedagogical value of web-based, embeddable tracers that convert runtime states into JSON traces and render them clientside. Its simplicity contributed to broad adoption; instructors could embed traces into slides, assignments, and online textbooks. Subsequent work extended embedding features, API integration, and support for additional languages [2], but many implementations retained stepwise snapshots with limited animation. Projects like Jeliot [14] and Alice [15] pushed interactive, animated narratives for novices; Jeliot, in particular, emphasized pedagogical scaffolding but was a heavier-weight desktop application rather than an embeddable web tool.
- C
- Empirical Studies of PV Effectiveness
Several classroom studies evaluated PV tools in instructional contexts. Karnalim and Ayub [3] performed controlled studies indicating that novices using Python Tutor improved on immediate debugging tasks, though deeper conceptual gains varied. Naps et al. [9] and subsequent reviews argued that empirical results were mixed: well-integrated PV tools produce measurable benefits, but many deployments failed to alter curriculum or instructor practice, limiting impact. These studies underscore that PV tools must be accompanied by careful instructional design, guided activities, and assessment strategies [35].
- D
- Animation, Attention, and HCI Evidence
Research in HCI and cognitive science informs how animations should be designed. Mayer’s multimedia principles advocate for coherence (avoid extraneous material), signaling (highlight important parts), and temporal contiguity (sync narration and visuals) [10]. Eye-tracking studies [4] found that pure animations without distracting presenters improved attention to key visual elements. These insights guide Visual Python’s emphasis on smooth transitions, selective highlighting, and minimal decorative graphics [36].
- E
- Visual vs Textual Programming
Studies comparing visual programming environments (e.g., Scratch, Blockly) to textual languages reveal trade-offs: visual tools lower initial syntax barriers but may obscure scalable practices used in real-world development. Resnick et al.
[6] and Pasternak and Smith [7] demonstrated the educational potential of block-based programming. Coffman et al.
[5] reported that students using visual languages gain early confidence while those using textual languages progress to deeper skills in the long run. A hybrid approach—keeping textual source while providing rich visualizations—combines the strengths of both paradigms, which is the approach adopted by Visual Python.
- F
- Recent Advances and Future Directions
Recent work in large-scale generative media such as Make-A- Video [29], CogVideoX [30], and ReVision [31] demonstrates that high-fidelity animation can be generated from semantic descriptions, suggesting a future where execution traces could be converted into richer, context-aware animations. Other directions include automated hint generation [34], collaborative visual debugging [23], and integration with learning management systems [32]. Despite technological promise, these approaches must be evaluated for pedagogical effectiveness and fairness [18].
- G
- Gaps and Design Implications
From the literature, we identify key design implications: visualizations must be pedagogically driven (not purely technically complete), animation must be intentionally paced and signaled, systems must enforce security while providing real- time responsiveness, and empirical evaluation must consider both cognitive outcomes and classroom integration [16,19]. Visual Python is designed with these implications in mind.
III. PROPOSED DESIGN
The proposed system, Visual Python, is designed to address the limitations of prior program visualization (PV) tools by focusing on pedagogically informed, real-time animations. While existing systems such as Online Python Tutor [1],
[2] provide stepwise snapshots of execution, they often lack smooth transitions and interactive exploration. Visual Python emphasizes continuous animations, cognitive alignment, and scalability in classroom contexts.
- A
- Motivation and Goals
The motivation for this design stems from persistent difficulties faced by novice programmers in forming accurate mental models of program execution [25,26]. Traditional IDEs and debuggers expose runtime details but require significant cognitive effort to interpret, often overwhelming beginners. The goals of Visual Python are therefore to: (a) provide real-time, animated visualizations of program behavior, (b) reduce extraneous cognitive load by externalizing runtime states [10], (c) ensure security and responsiveness in a web- based environment, and (d) integrate pedagogical features that scaffold learning.
- B
- System Overview
The architecture of Visual Python is structured into three main layers:
- Execution Engine: A sandboxed backend safely executes user-submitted Python code under strict resource quotas, disabling unsafe operations and instrumenting execution to emit trace events.
- Trace Normalization: Raw execution traces are often verbose; they are processed into pedagogically meaningful events such as variable updates, loop iterations, and function calls. This aligns with the principle of collapsing micro-operations into semantically relevant units [8].
- Visualization Layer: The client-side interface renders normalized traces into animated visualizations. Components such as the ForLoopAnimator and IfSeeSaw handle loops and conditionals, while variable trackers visualize arrays, lists, and dictionaries in an intuitive manner.
- C
- Key Design Features
Visual Python incorporates several design features:
- 1)
- 2)
- 3)
- 4)
- Control Flow Animation: Loops and conditionals are animated dynamically, providing learners with clear feedback on decision-making and iteration processes.
- D
- Comparison with Existing Tools
Compared to Online Python Tutor [1,2], Visual Python provides continuous, pedagogically tuned animations instead of static snapshots. Unlike Jeliot [14], which requires desktop deployment, Visual Python is lightweight, browser-based, and embeddable in courseware. This balance of accessibility and interactivity makes it a practical tool for modern CS education.
- E
- Expected Benefits
The proposed design is expected to improve novice comprehension of variables, loops, recursion, and references while reducing common misconceptions such as off-by-one errors and aliasing confusion [3]. Furthermore, its lightweight architecture facilitates classroom scalability and integration with online platforms [23,32]. By combining execution tracing with animated visualization, Visual Python contributes a pedagogically grounded approach to introductory programming education.
IV. SYSTEM DESIGN
Figure 1.
System architecture of Visual Python showing execution pipeline and pedagogical mapping.
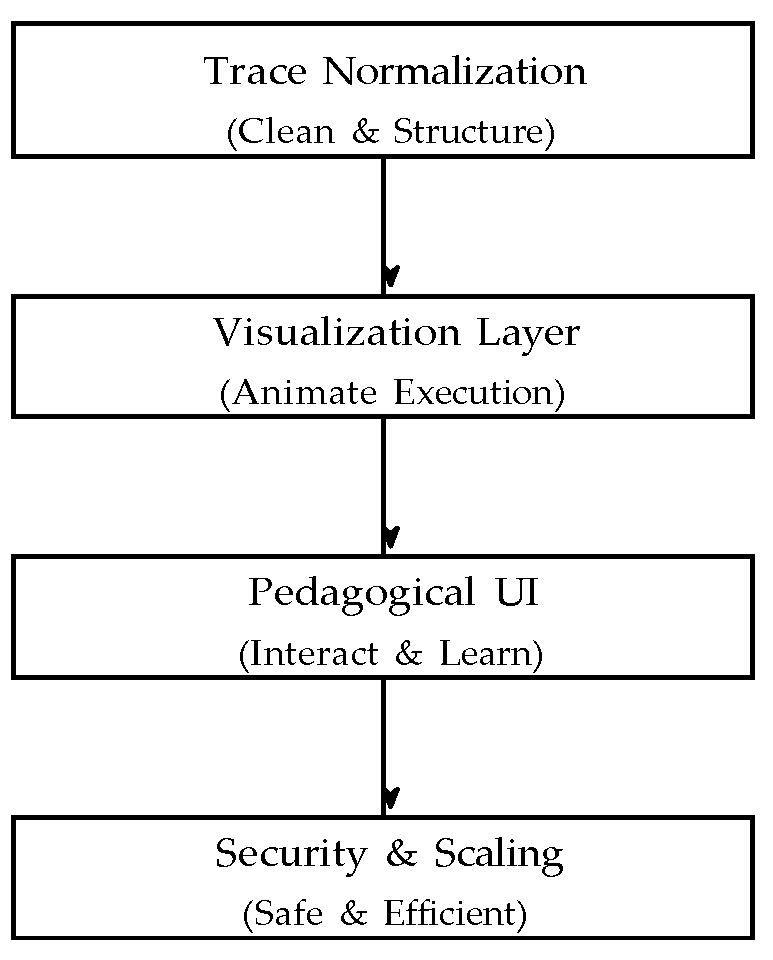
The architecture of Visual Python builds directly on the goals outlined in the proposed design, balancing security, interactivity, and pedagogical clarity. Inspired by prior PV systems such as Python Tutor [1,2] and Jeliot [14], the system integrates a secure execution environment with a visualization pipeline designed to optimize learning outcomes. The architecture is organized into four main components: the sandboxed execution engine, the trace collection and normalization pipeline, the visualization rendering layer, and the pedagogical UI/interaction module.
- A
- Sandboxed Execution Engine
At the system core is an execution engine that safely runs arbitrary student code, a requirement emphasized in earlier web-based PV environments [1,23]. The engine enforces strict resource quotas (CPU, memory), disables unsafe modules and system calls, and restricts file and network access. For web deployments, lightweight containerization or micro- sandboxing (e.g., Firejail or similar techniques) is used to isolate runs. The execution engine instruments code at runtime to emit fine-grained events, including line execution, variable assignment, object creation, reference updates, function calls/returns, exceptions, and I/O operations. Instrumentation is lightweight to avoid perceptible latency, and time/step limits prevent runaway programs.
- B
- Trace Collection and Normalization
Raw execution traces, while complete, are typically verbose and cognitively overwhelming for learners [8]. The trace normalization pipeline processes raw events into pedagogically meaningful steps. Tasks include collapsing micro-operations into higher-level semantics (e.g., sequential assignments to the same variable), labeling object lifetimes, extracting subexpression evaluations, and identifying loop iteration boundaries. The pipeline also computes diffs between successive program states, enabling smooth animations. Traces are encoded in compact JSON with semantic tags, supporting platform- independent rendering and archival.
- C
- Visualization Rendering Layer
The rendering layer consumes normalized traces and produces animated state transitions in the browser. Consistent with multimedia learning principles [10], design priorities include clarity, minimalism, and temporal pacing. Key visual metaphors include stack frames as nested panels, heap objects as labeled boxes with reference arrows, arrays as indexed grids with animated updates, and control flow highlights that emphasize current and upcoming lines of code. Animations use easing and motion semantics to appear natural, and learners can adjust playback speed, step through execution, or jump to key events. This design reduces extraneous load and enhances learner focus [36].
- D
- Pedagogical UI and Interaction
The front-end interface integrates code, variables, and execution flow into a unified learning experience. The source code pane is synchronized with the animation, the variable watch pane lists current values, and a timeline slider allows navigation across execution history. Breakpoints, bookmarks, and annotations enable reflective learning and targeted review [35]. An optional narration or hint panel provides textual scaffolding, and context menus allow learners to inspect subexpressions or switch between alternative representations (e.g., value-based vs pointer-based visualization).
- E
- Security, Privacy, and Scalability
Security considerations follow best practices from online PV systems [2,23]. These include sandbox enforcement, rate- limiting runs per user, and sanitizing outputs. Privacy is addressed by ensuring student code is not persisted unless explicitly shared. Scalability is achieved by decoupling server- side trace generation from client-side rendering, enabling horizontal scaling and caching for frequently used exercises.
- F
- Pedagogical Mapping
Each visualization element is explicitly tied to specific learning objectives, in line with prior taxonomies of PV engagement [16,19]. For example, stack visualization supports understanding of function calls and local scope, while heap and object references reinforce concepts of mutability and aliasing. Array animations highlight iterative state changes, illustrating indexing and in-place updates. The UI supports guided exercises where learners predict next states before revealing animations, fostering active engagement and deeper conceptual understanding [9].
V. RESULTS AND DISCUSSION
This section presents the implementation details, preliminary evaluation, qualitative analysis, and discussion of Visual Python. Findings are based on a small-scale pilot study involving a limited group of learners and instructors, aimed at understanding the usability and educational potential of the system.
- A
- Implementation
Visual Python was implemented as a lightweight, web-based application using modern front-end and back-end technologies. The visualization interface was built with React and Type- Script, incorporating the Framer Motion library to achieve smooth, pedagogically meaningful animations. Custom components such as ForLoopAnimator and IfSeeSaw were developed to illustrate control-flow behavior, while variable and data structure modules visualize real-time state changes.
On the back end, Python code is executed in a sandboxed environment that enforces strict security policies. Containerization (e.g., Docker) provides runtime isolation, and the system instruments code execution to capture variable updates, control flow, and function calls. These traces are normalized into compact JSON files and rendered in the browser as continuous animations. This decoupled architecture ensures responsiveness and supports embedding within online course materials, tutorials, and slides.
- B
- Evaluation
A small-scale pilot evaluation was conducted with a group of students and instructors from an introductory programming course. Participants interacted with Visual Python through a set of guided exercises covering topics such as loops, recursion, and variable references. Observations, informal feedback, and short interviews were used to assess usability, engagement, and perceived learning value.
The evaluation aimed to explore three guiding questions:
- RQ1: Does Visual Python help learners better understand program execution concepts such as loops and recursion?
- RQ2: Does animation-based visualization increase engagement and confidence when debugging?
- RQ3: How do instructors perceive the tool’s potential for classroom integration?
- C
- Analysis and Preliminary Findings
- 1)
- Conceptual Understanding
Students reported that animations helped them visualize how variables changed during loops and function calls. Several noted that the step-by-step movement of variables made recursion and list operations more intuitive. Instructors observed that learners could explain control flow more clearly after interacting with the visualizations, suggesting improved conceptual grasp.
- 2)
- Debugging Performance
Participants completed debugging tasks with greater confidence, describing the animations as a way to see where their logic went wrong. Although no formal timing data were collected, observational notes indicated that students were able to identify logical errors more quickly when they could replay and inspect execution visually.
- 3)
- Confidence and Usability
Most participants found the interface intuitive and easy to navigate. They appreciated the ability to pause, rewind, and adjust animation speed. Several students expressed that using Visual Python felt less intimidating than working in a traditional IDE. Instructors highlighted that the visual feedback helped reduce anxiety around abstract programming concepts.
- 4)
- Qualitative Feedback
Qualitative responses were highly positive. Students stated that animations made invisible processes visible and helped them understand how data moved through a program. The timeline slider and smooth transitions were particularly praised for allowing users to revisit complex execution points. Instructors suggested adding guided questions or prompts to encourage students to predict outcomes before running animations, fostering more active learning behaviors.
- 5)
- Classroom Integration
Instructors found Visual Python easy to deploy in class and appreciated that it required no installation. The web-based setup made it suitable for demonstrations and student use on personal devices. Participants also recommended developing additional modules for visualizing data structures such as trees or linked lists, extending its classroom utility.
- 6)
- Limitations and Future Evaluation
As this was an initial pilot with a small participant group, findings are qualitative and exploratory. Future work will involve controlled classroom studies, quantitative assessment of learning outcomes, and extended testing with larger student cohorts to measure long-term retention and scalability.
- D
- Discussion
The pilot findings suggest that Visual Python effectively bridges the gap between code and conceptual understanding through animated execution. Students and instructors both recognized its potential to enhance engagement and clarity in learning programming fundamentals. While the sample size was small, early evidence indicates that animation-based visualization can promote confidence and more active reasoning about program flow.
Visual Python builds on prior work such as Python Tutor [1],
[2] by providing continuous, pedagogically informed animations within a browser-based environment. These preliminary results highlight the promise of combining smooth visual transitions, interactivity, and accessibility to support novice programmers. Further studies will aim to formalize assessment metrics and explore integration with broader online learning ecosystems.
VI. FUTURE WORK
Beyond the core prototype, several directions extend the utility and scope of Visual Python. First, multi-language support (Java, C, JavaScript) will broaden applicability across curricula. Second, adaptive hinting powered by lightweight machine learning could provide context-aware suggestions when learners repeatedly fail specific steps. Third, gamification elements—such as badges for progressive mastery or leveled challenges—could improve motivation. Fourth, collaborative features would enable instructors to broadcast visualizations to a class, annotate runs live, or allow peer-led debugging sessions. Finally, deeper research on personalization could adapt the visual complexity to the learner’s proficiency, progressively revealing more detail as competence increases.
VII. CONCLUSION
Visual Python is designed to make program execution comprehensible to novices by converting abstract runtime events into clear, interactive, and pedagogically meaningful animations. Grounded in cognitive and HCI findings and informed by prior PV systems, the design balances safety, clarity, and expressiveness. The planned empirical evaluation will test its effectiveness in classroom contexts. We believe that tools like Visual Python, when combined with thoughtful instructional design, can reduce barriers to learning programming and contribute to better outcomes in introductory courses.
ACKNOWLEDGMENT
We thank Dr. Sabeena K for guidance and the Department of Computer Engineering, College of Engineering Chengannur for support.
References
- P. J. Guo, “Online Python Tutor: Embeddable web-based program visualization for CS education,” in Proc. SIGCSE, 2013.
- P. J. Guo, “Embedding program visualizations in online learning environments,” ACM Trans. Comput. Educ., vol. 14, no. 3, 2014.
- O. Karnalim and M. Ayub, “The effectiveness of a program visualization tool on introductory programming: A case study with Python Tutor,” CommIT Journal, vol. 11, no. 2, 2017.
- J. Beautemps, A. Bresges, S. Becker-Genschow, “Enhancing learning through animated video: An eye-tracking methodology approach,” J. Sci. Educ. Technol., 2025. [CrossRef]
- J. Coffman et al., “Visual vs textual programming languages in CS0.5,” in Proc. SIGCSE, 2023.
- M. Resnick et al., “Scratch: Programming for all,” Commun. ACM, 2009. [CrossRef]
- T. Pasternak, N. A. Smith, “Introducing Blockly as an educational programming tool,” in Proc. IEEE EDUCON, 2017.
- C. D. Hundhausen, S. A. Douglas, J. Stasko, “A meta-study of algorithm visualization effectiveness,” J. Visual Languages Comput., 2002. [CrossRef]
- T. L. Naps et al., “Exploring the role of visualization and engagement in computer science education,” ACM SIGCSE Bulletin, 2002. [CrossRef]
- R. E. Mayer, The Cambridge Handbook of Multimedia Learning, Cambridge Univ. Press, 2005.
- B. A. Myers, “Visual programming, programming by example, and program visualization,” in Proc. CHI, 1986. [CrossRef]
- B. Price et al., “A taxonomy of software visualization,” J. Visual Languages and Computing, 1993.
- L. Malmi, A. Korhonen, T. Ma¨kinen, “Visual algorithm simulation exercise system with automatic assessment,” J. Educational Resources in Computing, 2004.
- A. Korhonen, L. Malmi, “Visual algorithm simulation in Jeliot 3,” Proc. ITiCSE, 2003.
- M. Ben-Ari, “Learning programming languages through visualization,” Journal of Educational Technology, 2002.
- N. Myller et al., “Extending the engagement taxonomy: Tools for learning with program visualization,” ACM TOCE, 2009. [CrossRef]
- K. R. Butcher, “Cognitive processes in diagrammatic reasoning,” Learning and Instruction, 2006.
- D. Butler, “Teaching programming with visualization: a review of trends,” Computer Science Education Review, 2018.
- C. A. Shaffer et al., “Algorithm visualization: The state of the field,” ACM TOCE, 2010. [CrossRef]
- J. Maloney et al., “The Scratch programming environment,” TOCE, 2010. [CrossRef]
- J. Lehman, J. Maloy, S. Beckwith, “Interactive program simulation for CS education,” Proc. ITiCSE, 2001.
- V. Vennila et al., “Enhancing comprehension through visualization,” International J. Computer Applications, 2018.
- V. Karavirta et al., “Interactive algorithm visualization on the web,” Proc. ITiCSE, 2013.
- A. Robins, J. Rountree, N. Rountree, “Learning and teaching programming: A review,” Computer Science Education, 2003.
- E. Soloway, J. Spohrer, Studying the novice programmer, 1986.
- B. du Boulay, “Some difficulties of learning to program,” J. Educational Computing Research, 1989.
- B. A. Myers, “Taxonomies for program visualization,” IEEE Software, vol. 8, no. 5, 1991.
- G. Fischer et al., “Beyond binary thinking: blending, scaffolding, and conceptual help for program visualization,” Human–Computer Interaction, 2002.
- U. Singer et al., “Make-A-Video: Text-to-video generation without text- video data,” Meta AI, 2022. [CrossRef]
- Z. Li et al., “CogVideoX: Text-to-video diffusion models with an expert transformer,” Proc. ICLR, 2025. [CrossRef]
- Q. Liu, J. He, A. Yuille, “ReVision: Video generation with 3D physics modeling,” arXiv:2504.21855, 2025. [CrossRef]
- J. Perez et al., “Visualization in MOOCs: challenges and opportunities,” IEEE Transactions on Learning Technologies, 2016.
- T. Green, “Scaffolding novice programmers: visual and textual strategies,” Computer Science Education, 2013.
- K. Liu, “Interactive visualization for programming pedagogy,” Journal of Visual Computing, 2019.
- D. Karp, “Effective integration of PV into CS courses,” SIGCSE Bulletin, 2015.
- A. Smith, “Designing animations for learning: A practical guide,” Educational Media International, 2017.
Disclaimer/Publisher’s Note: The statements, opinions and data contained in all publications are solely those of the individual author(s) and contributor(s) and not of MDPI and/or the editor(s). MDPI and/or the editor(s) disclaim responsibility for any injury to people or property resulting from any ideas, methods, instructions or products referred to in the content. |
© 2025 by the authors. Licensee MDPI, Basel, Switzerland. This article is an open access article distributed under the terms and conditions of the Creative Commons Attribution (CC BY) license (http://creativecommons.org/licenses/by/4.0/).
Copyright: This open access article is published under a Creative Commons CC BY 4.0 license, which permit the free download, distribution, and reuse, provided that the author and preprint are cited in any reuse.


