Submitted:
18 February 2025
Posted:
19 February 2025
Read the latest preprint version here
Abstract
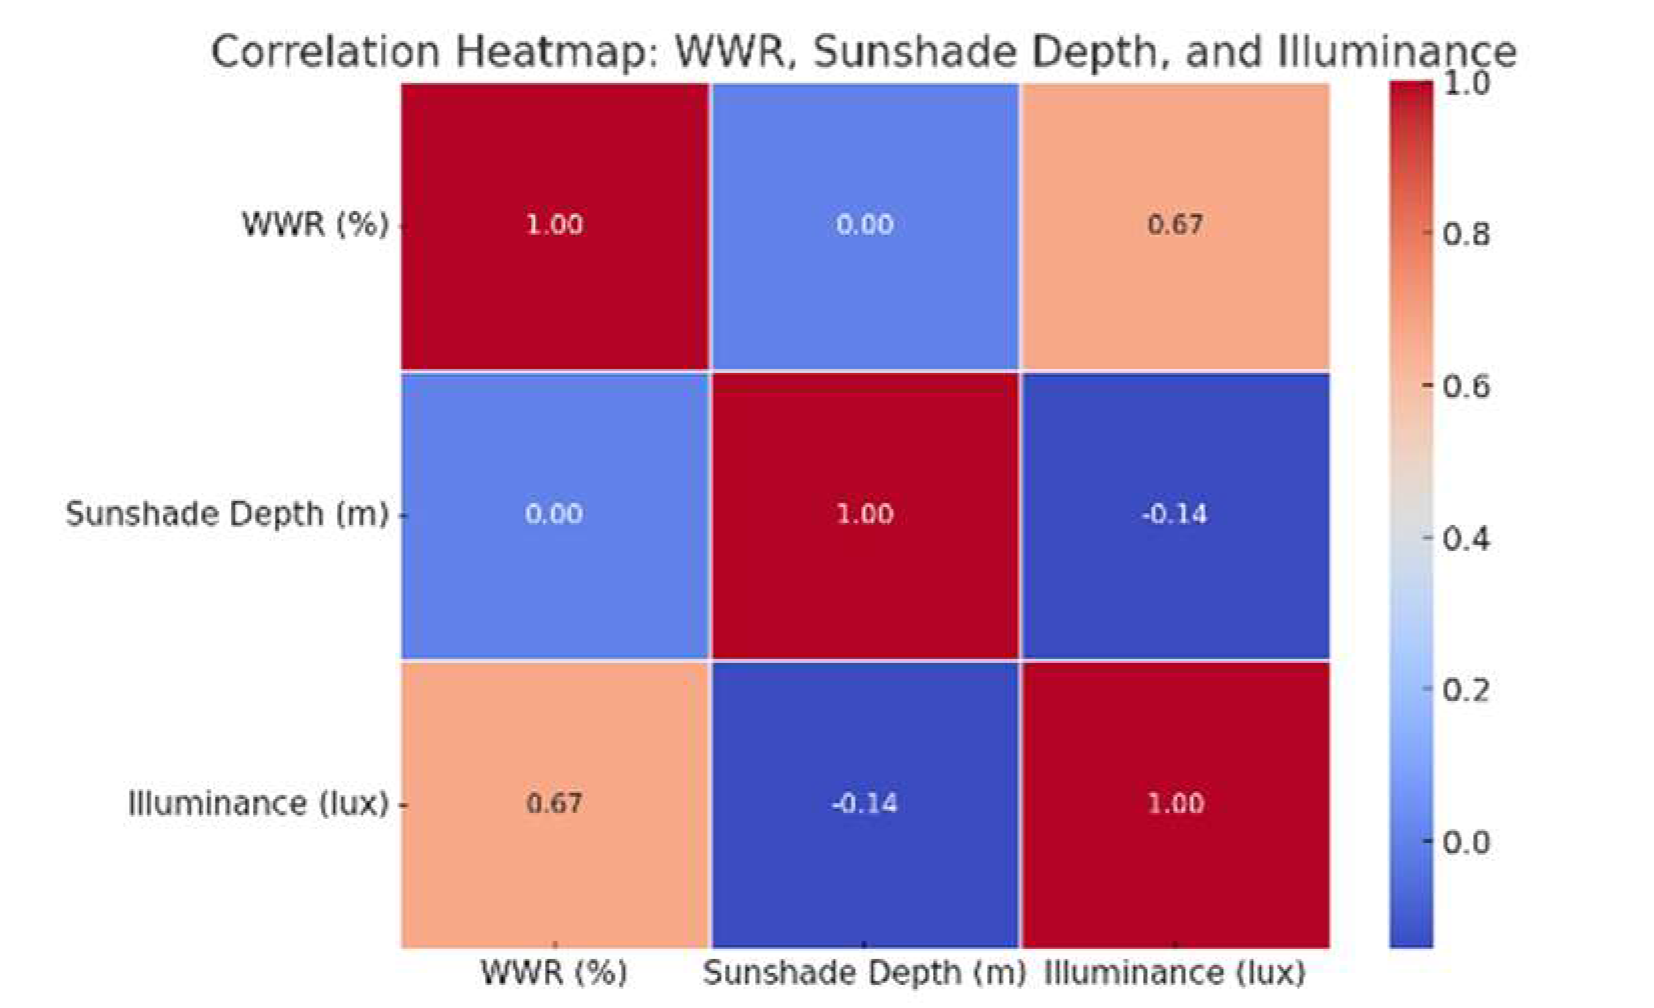
Daylight plays a crucial role in enhancing the physical and mental well-being of occupants, particularly students who spend approximately fourteen years of their early life in school classrooms. The built environment significantly influences students' intelligence, performance, health, and psychological well-being. Although the minimum illuminance level of 300 lux is mandated by National building code 2016, it is not spelt out clear in the conformance report of educational department. So, lighting remains undefined and unregulated, primarily due to the subjectivity of light perception among users. This study assesses the existing scenario of a classroom for illuminance levels by field measurements and computational daylight simulations using Rhinoceros 8.0 with Climate Studio plugins. The research aims to establish quantifiable relationships between key parameters such as window-to-wall ratio, annual sun exposure, spatial daylight autonomy, sunshade depth with respect to vegetation; and propose window optimization strategies tailored to different site conditions, ensuring that classrooms consistently meet the required illuminance levels. It was found that there is a significant impact of trees, window-to-wall ratio and sunshade depths on the daylight. These findings are useful to researchers and the architects to take informed decisions in the pre design stage for sustainable design solutions.
Keywords:
1. Introduction
2. Materials and Methods
2.1. Literature Review
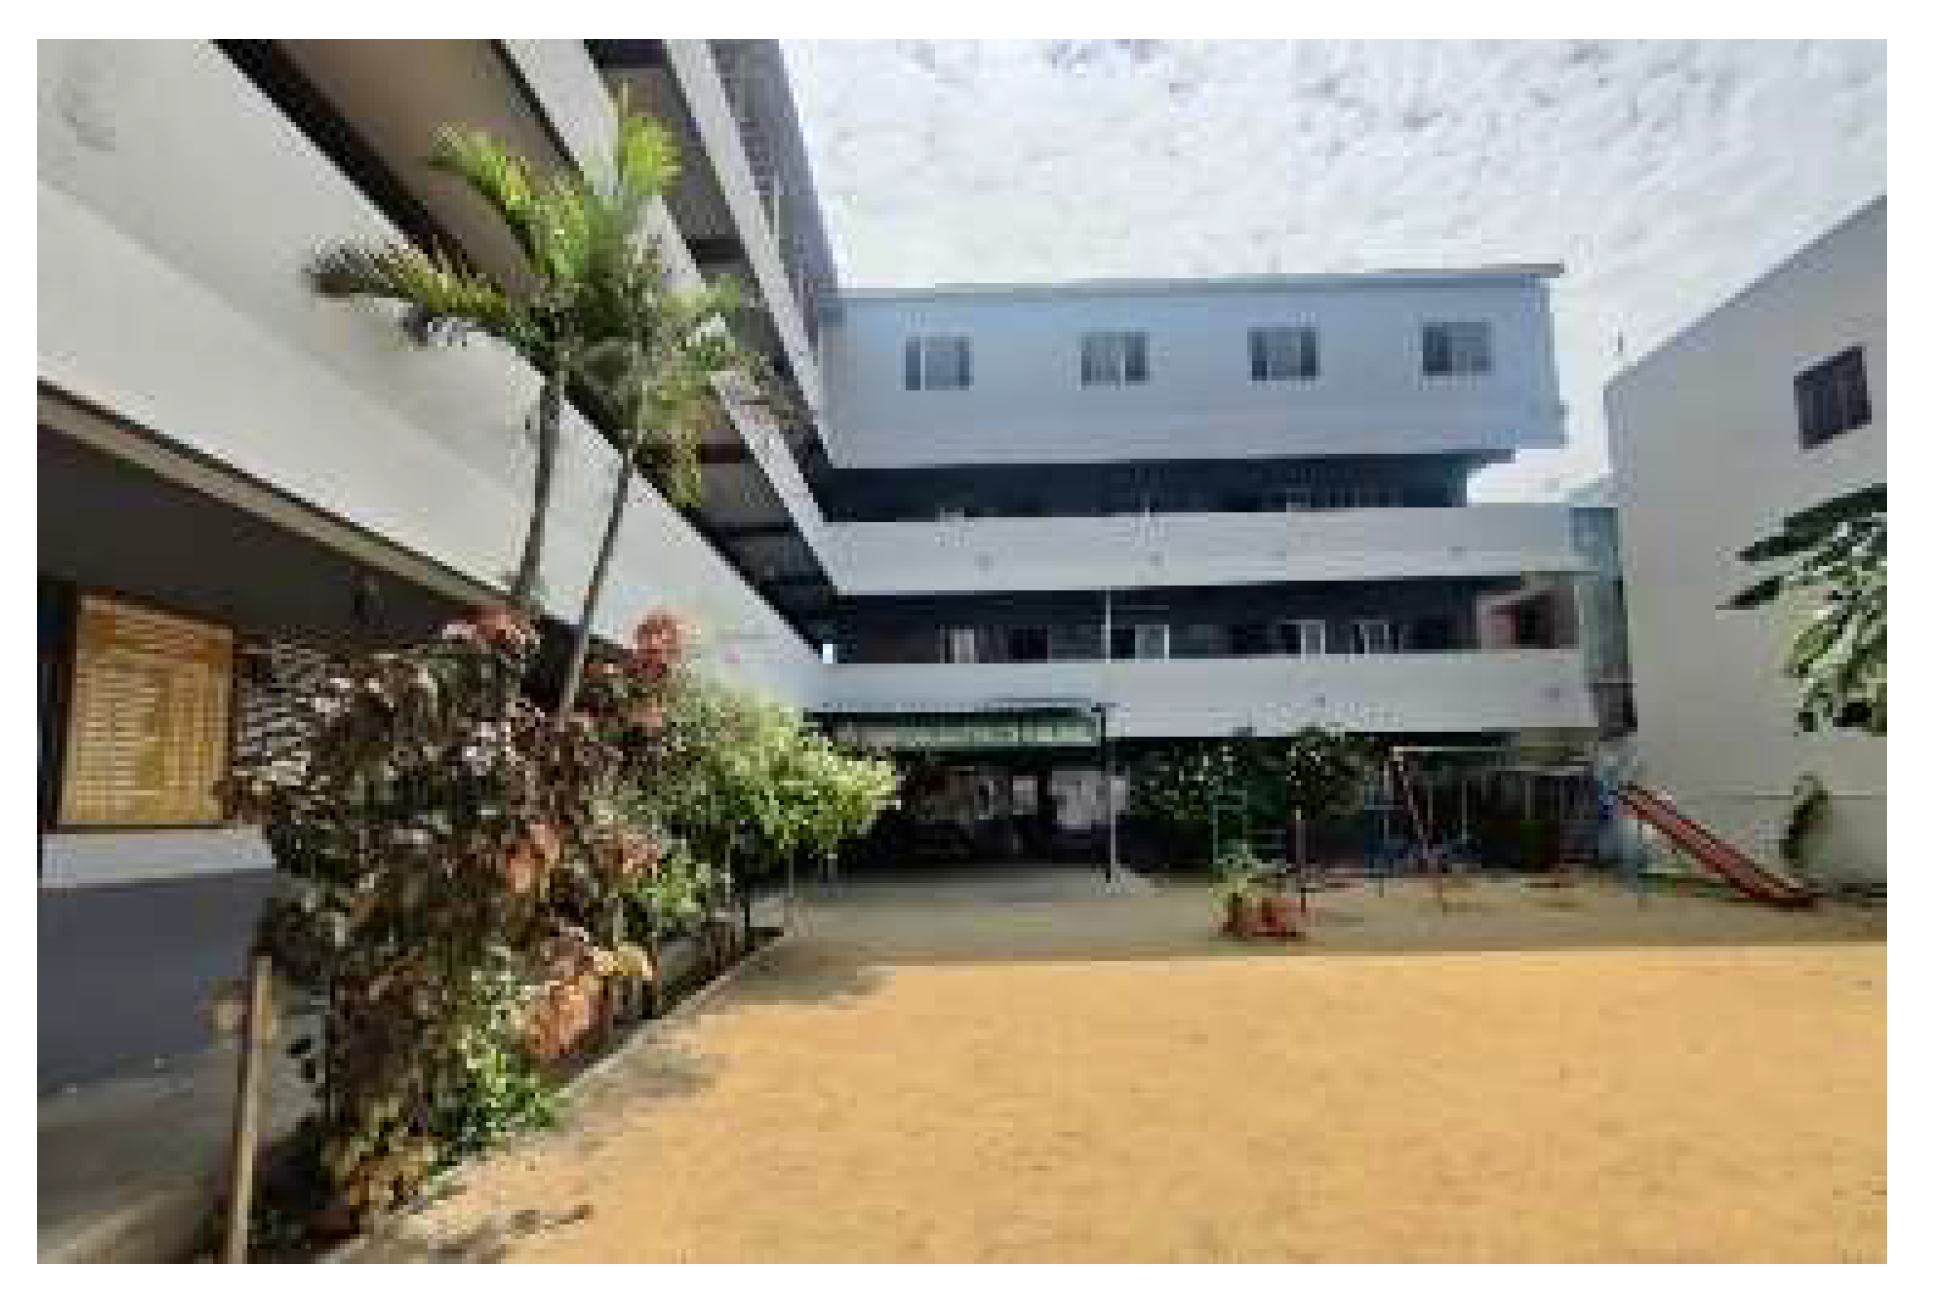
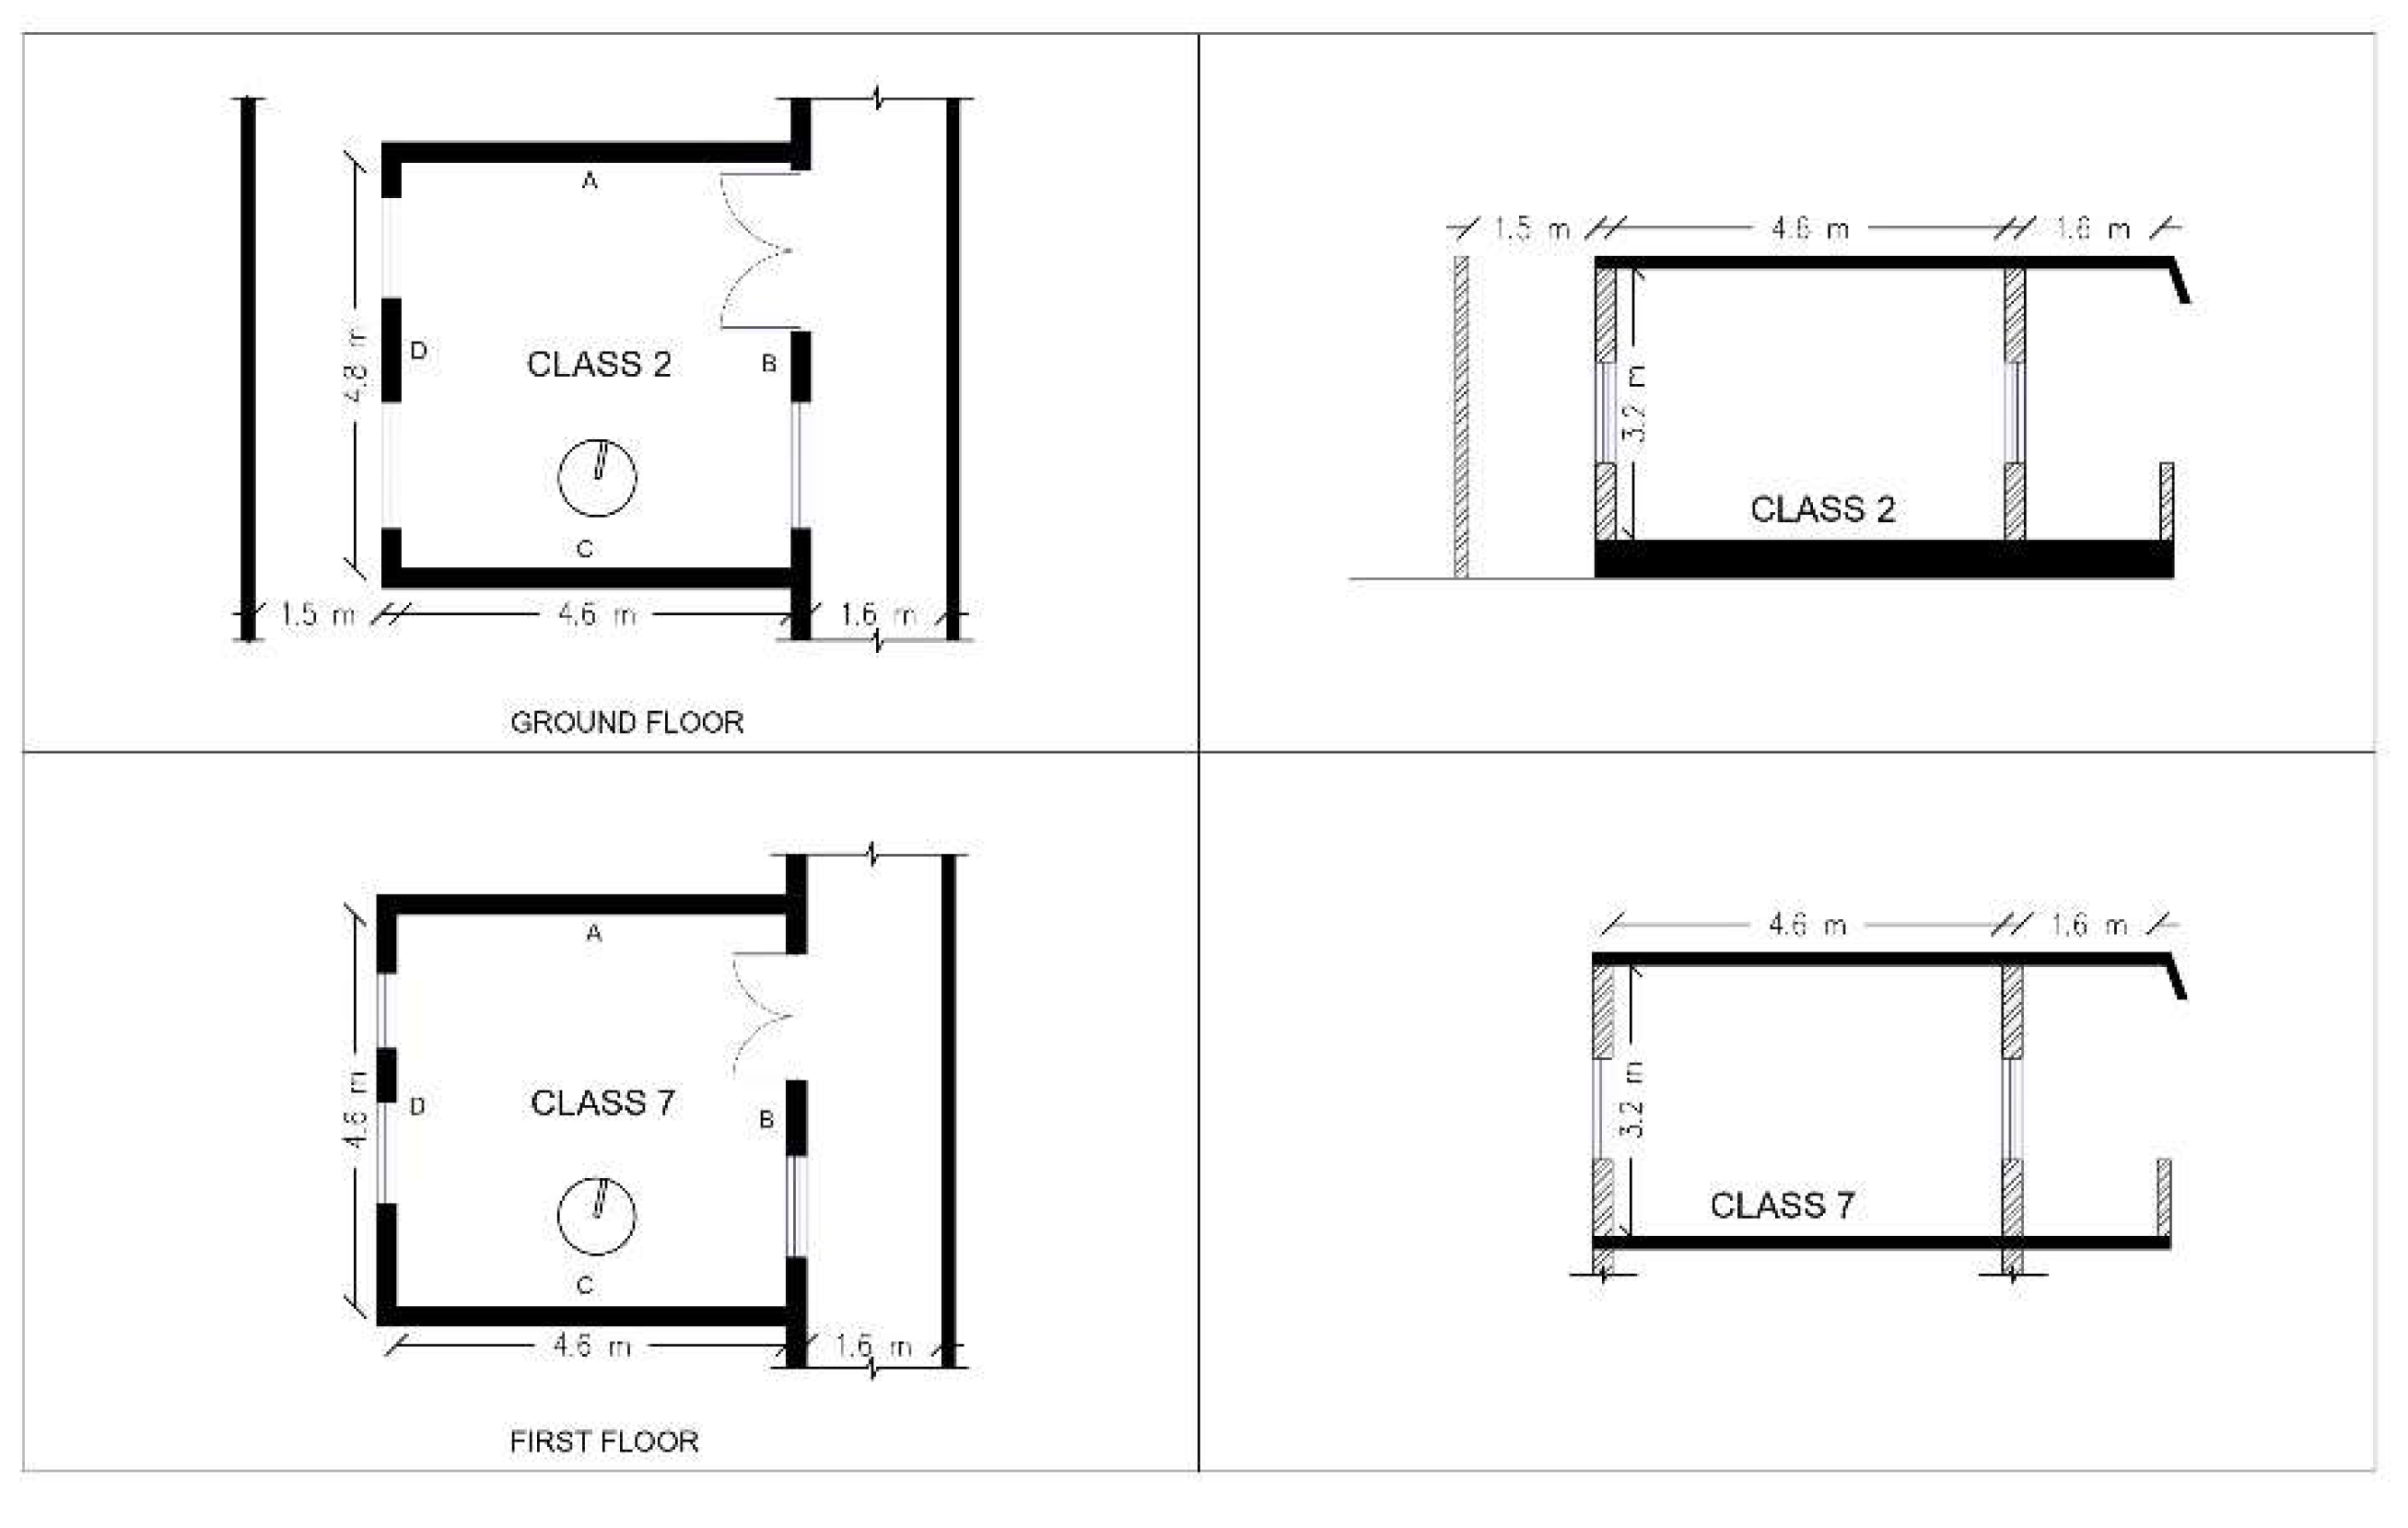
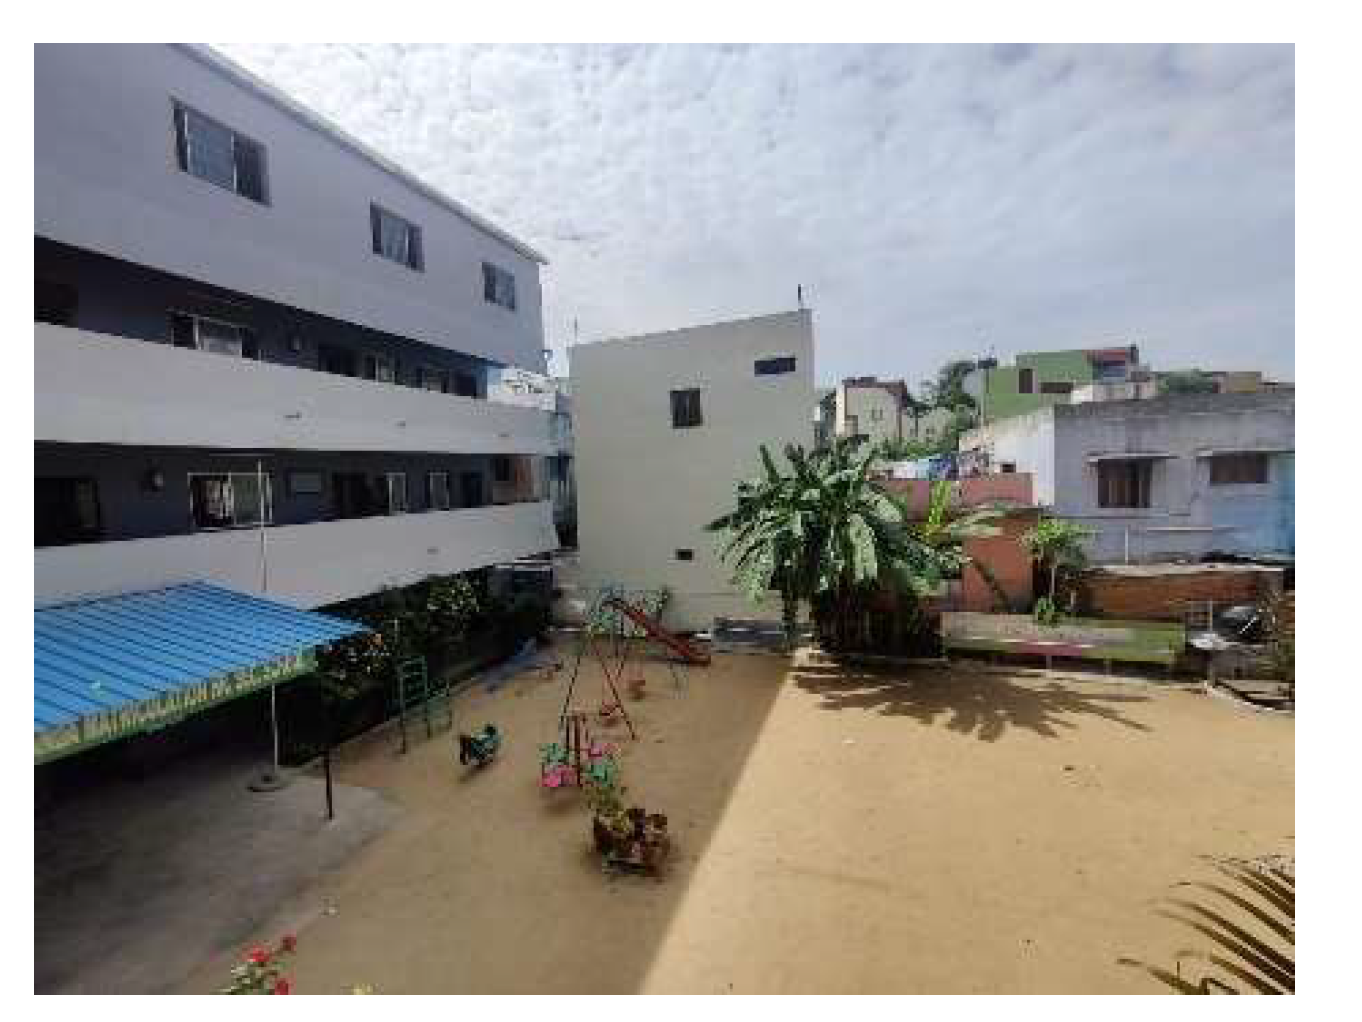
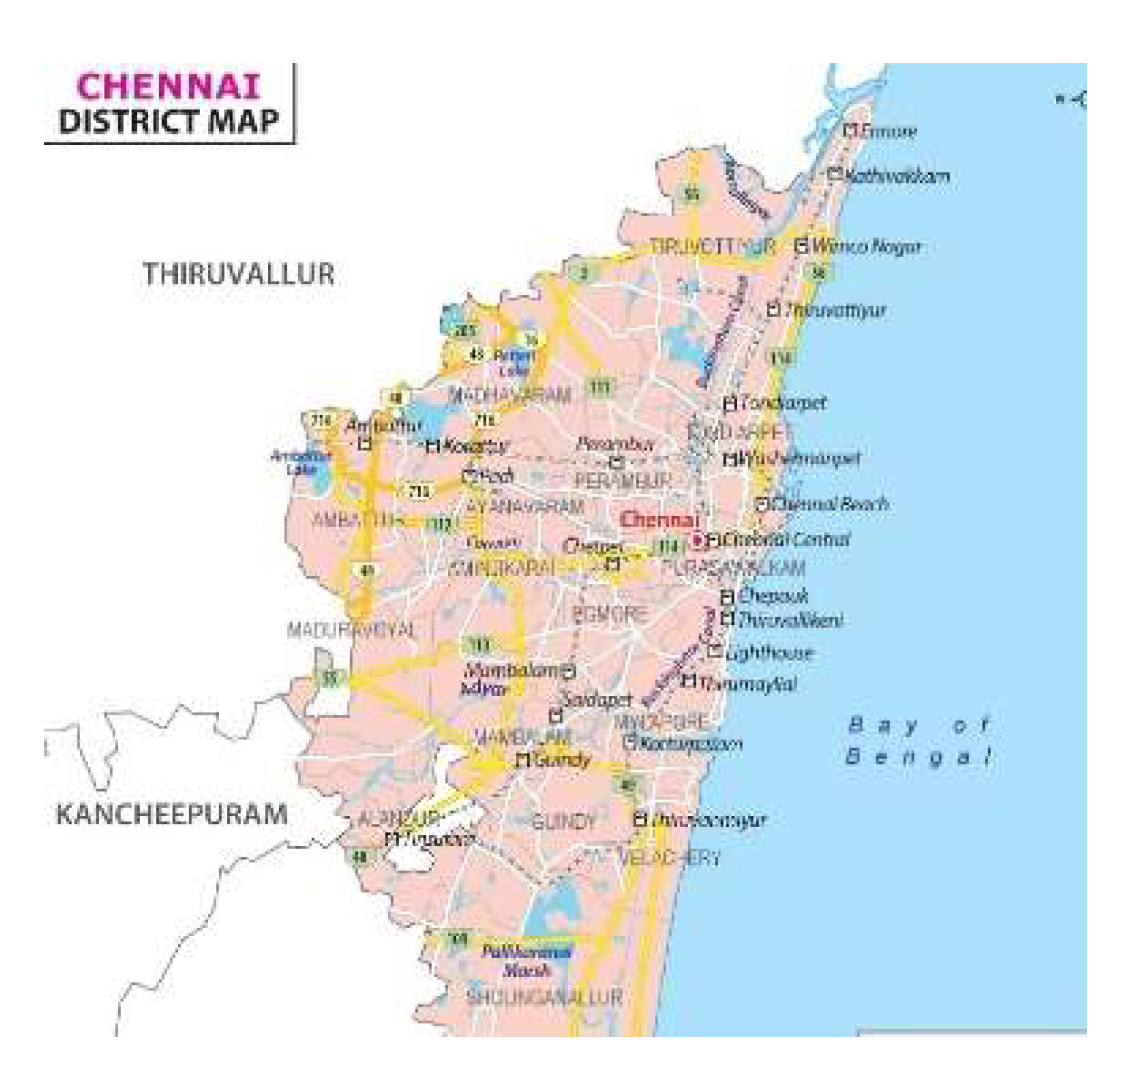
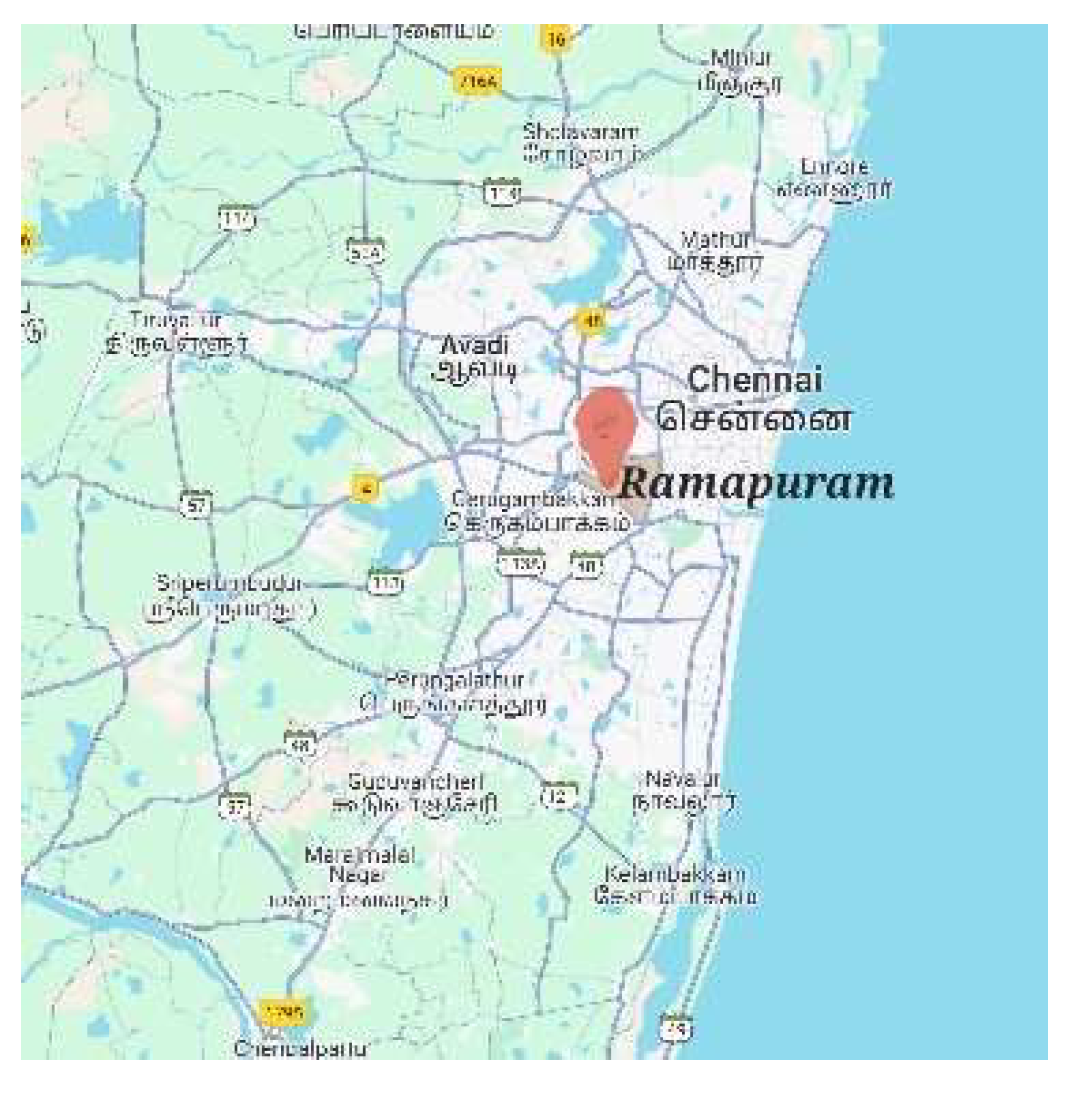
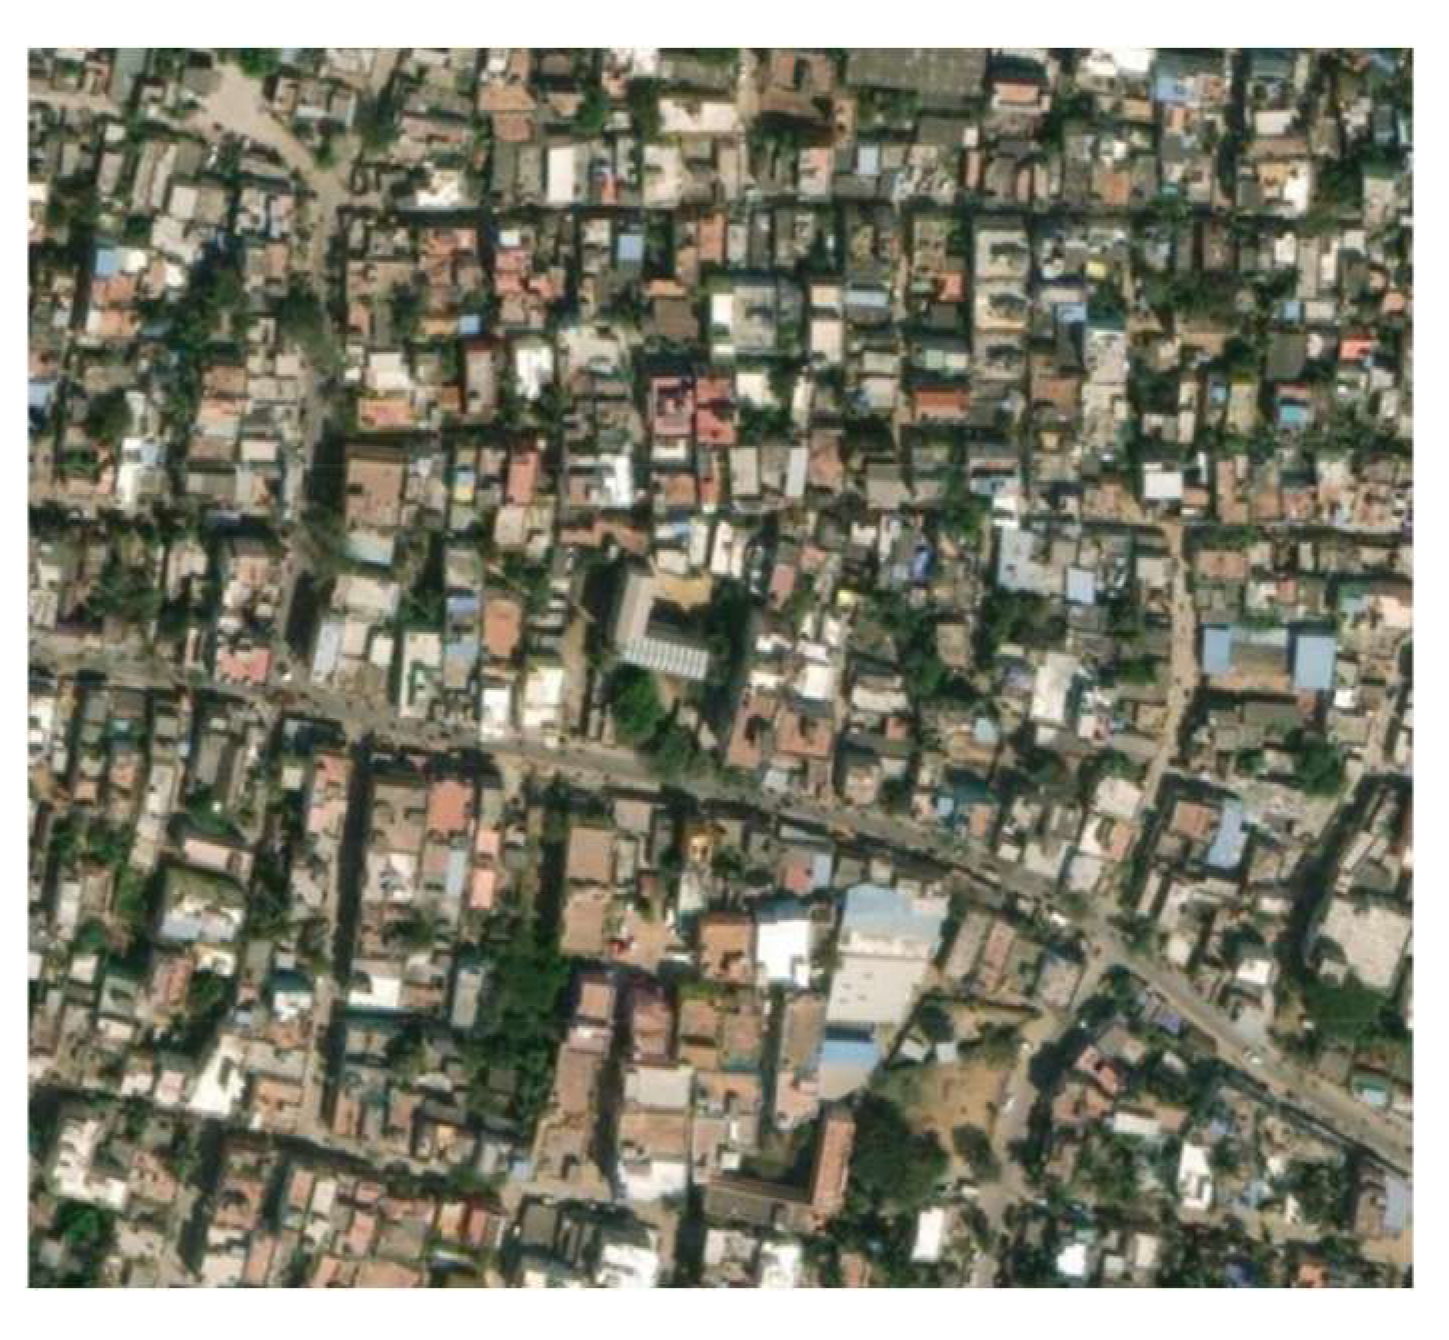
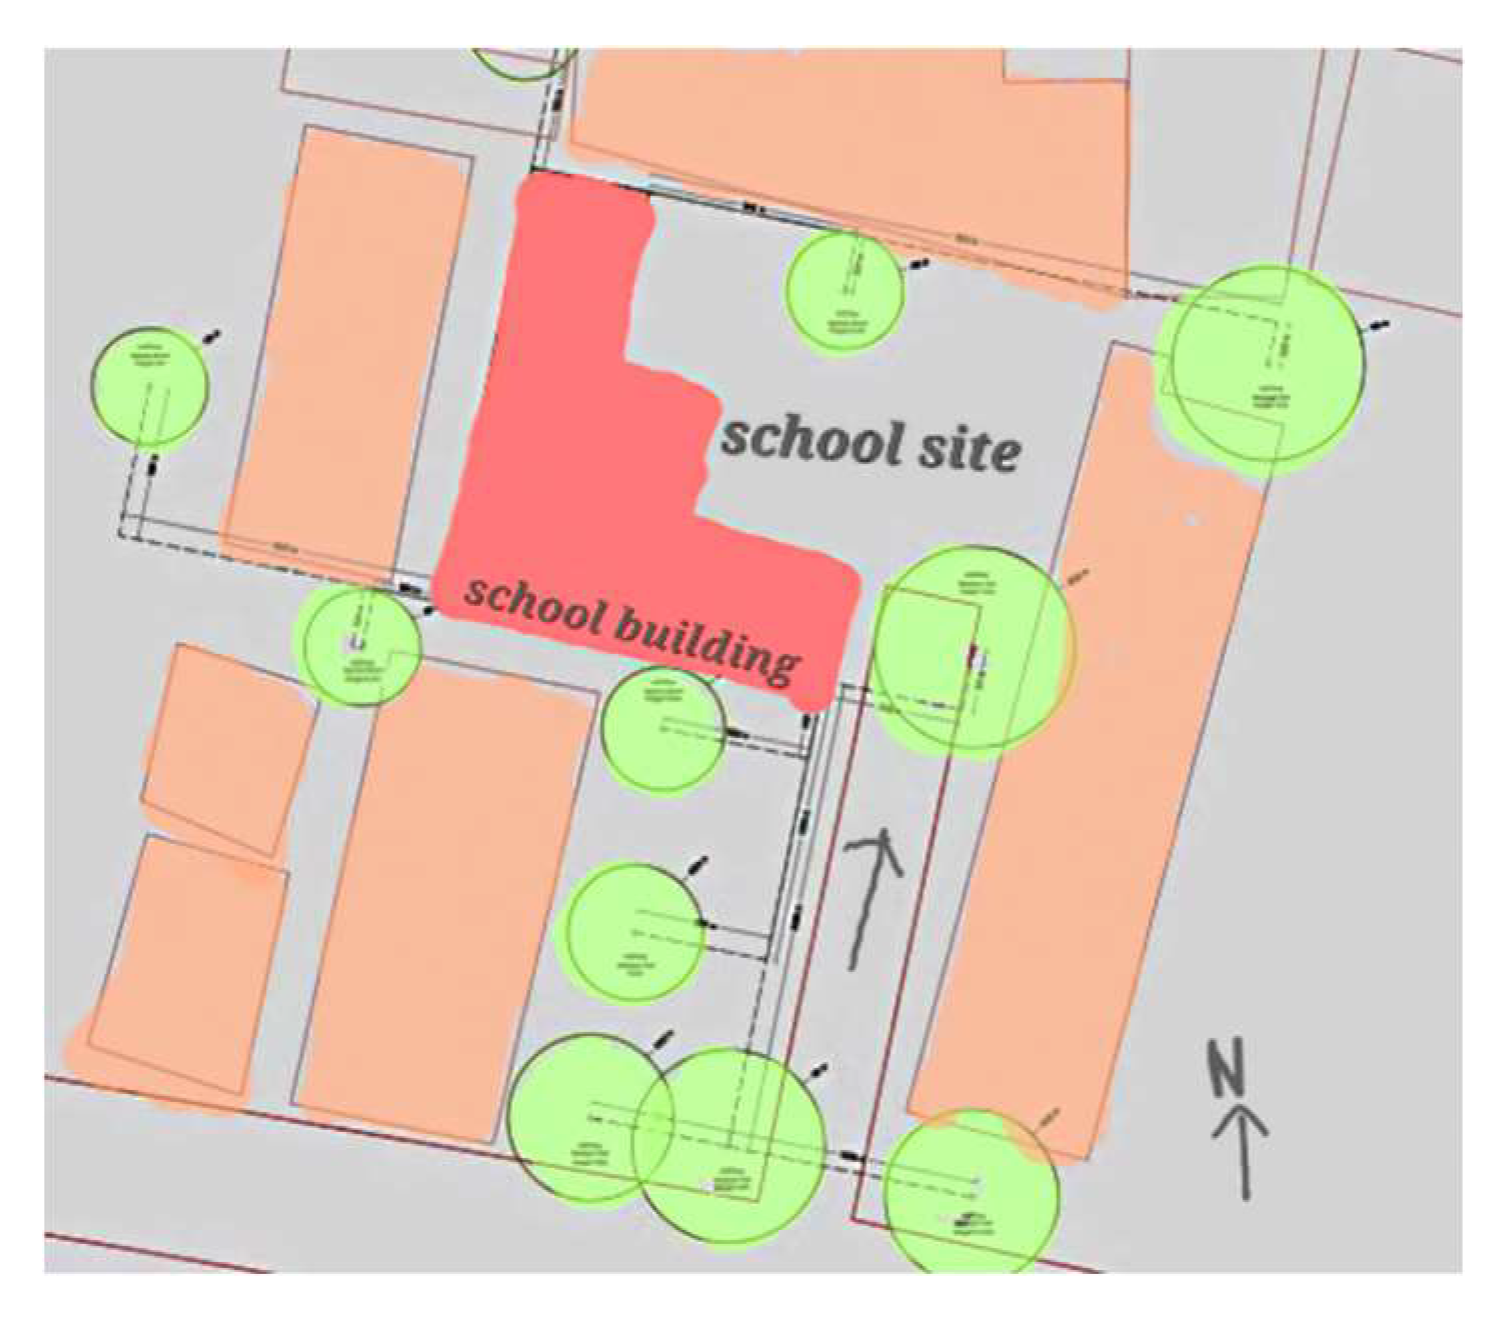
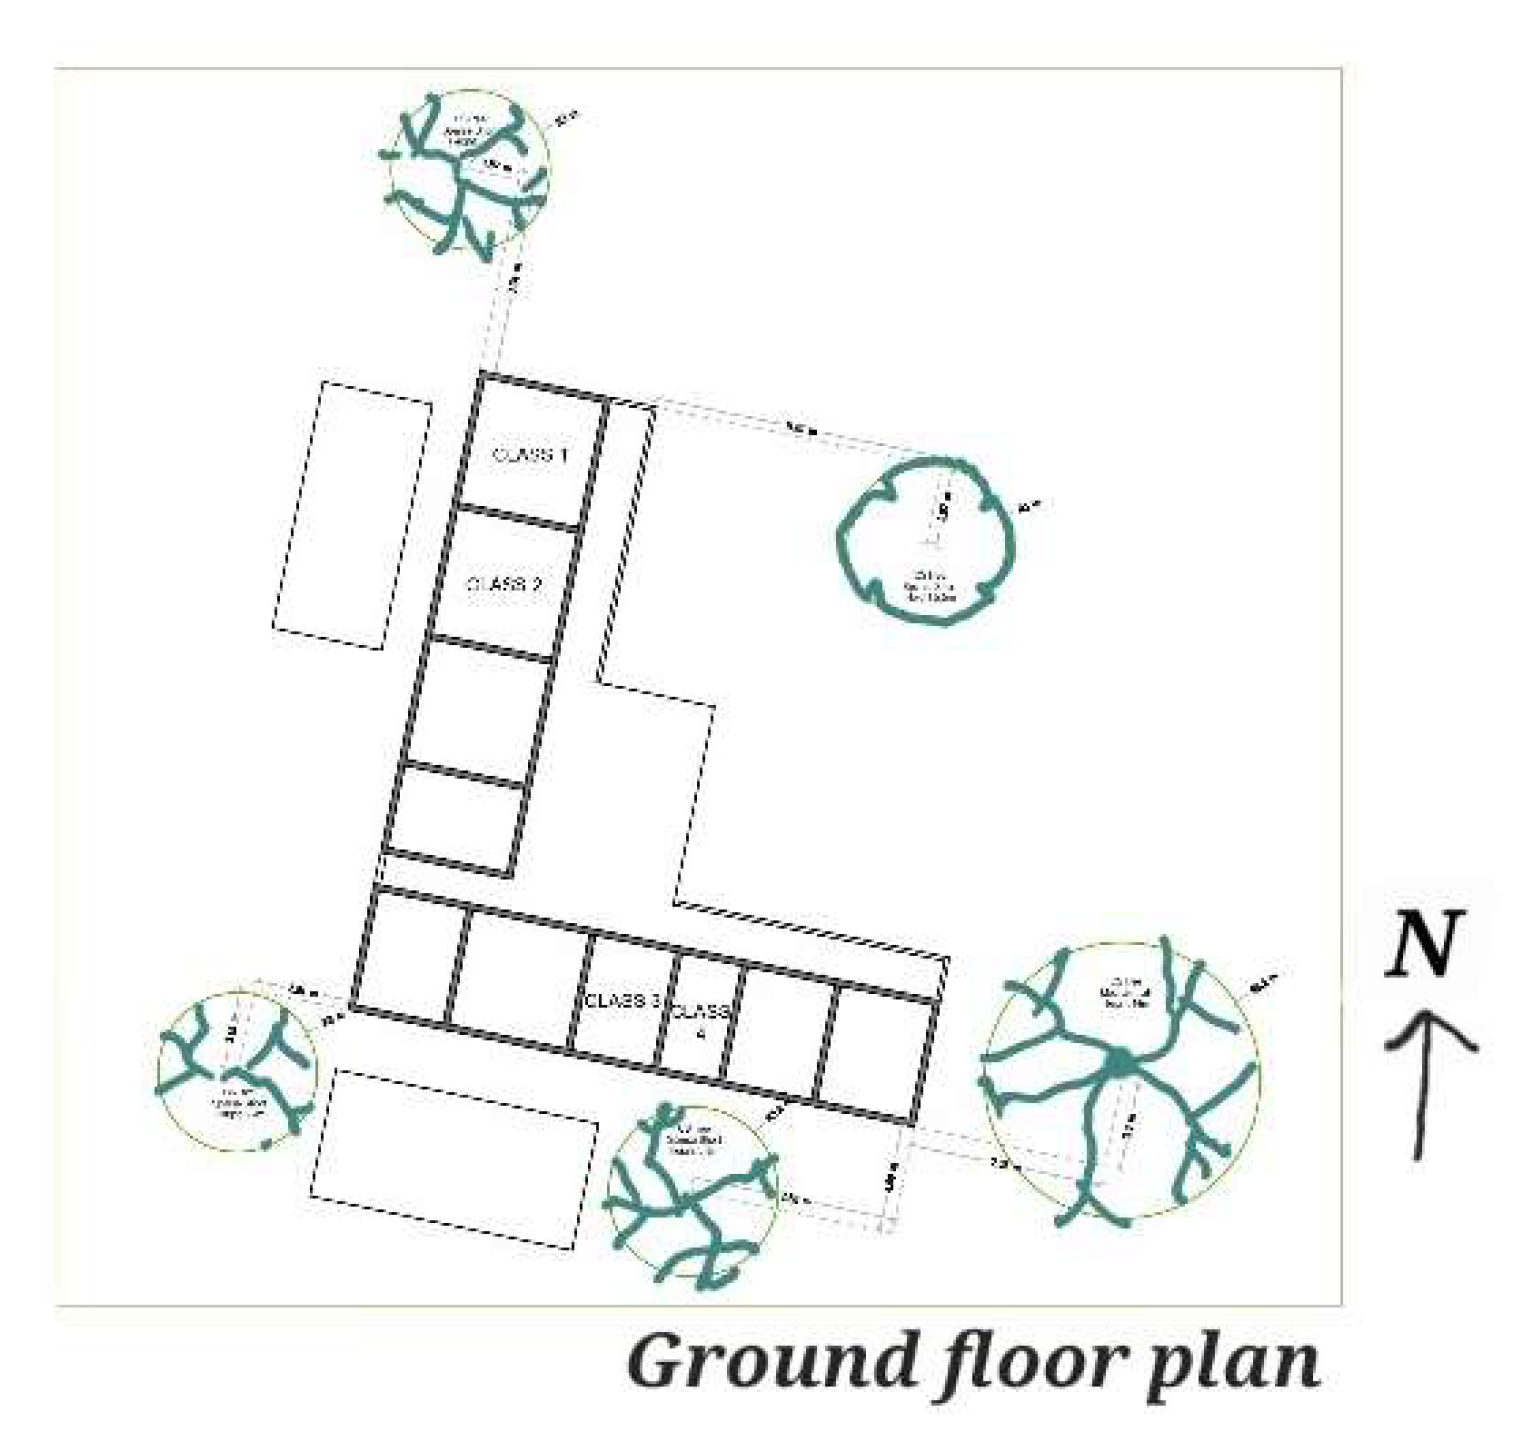
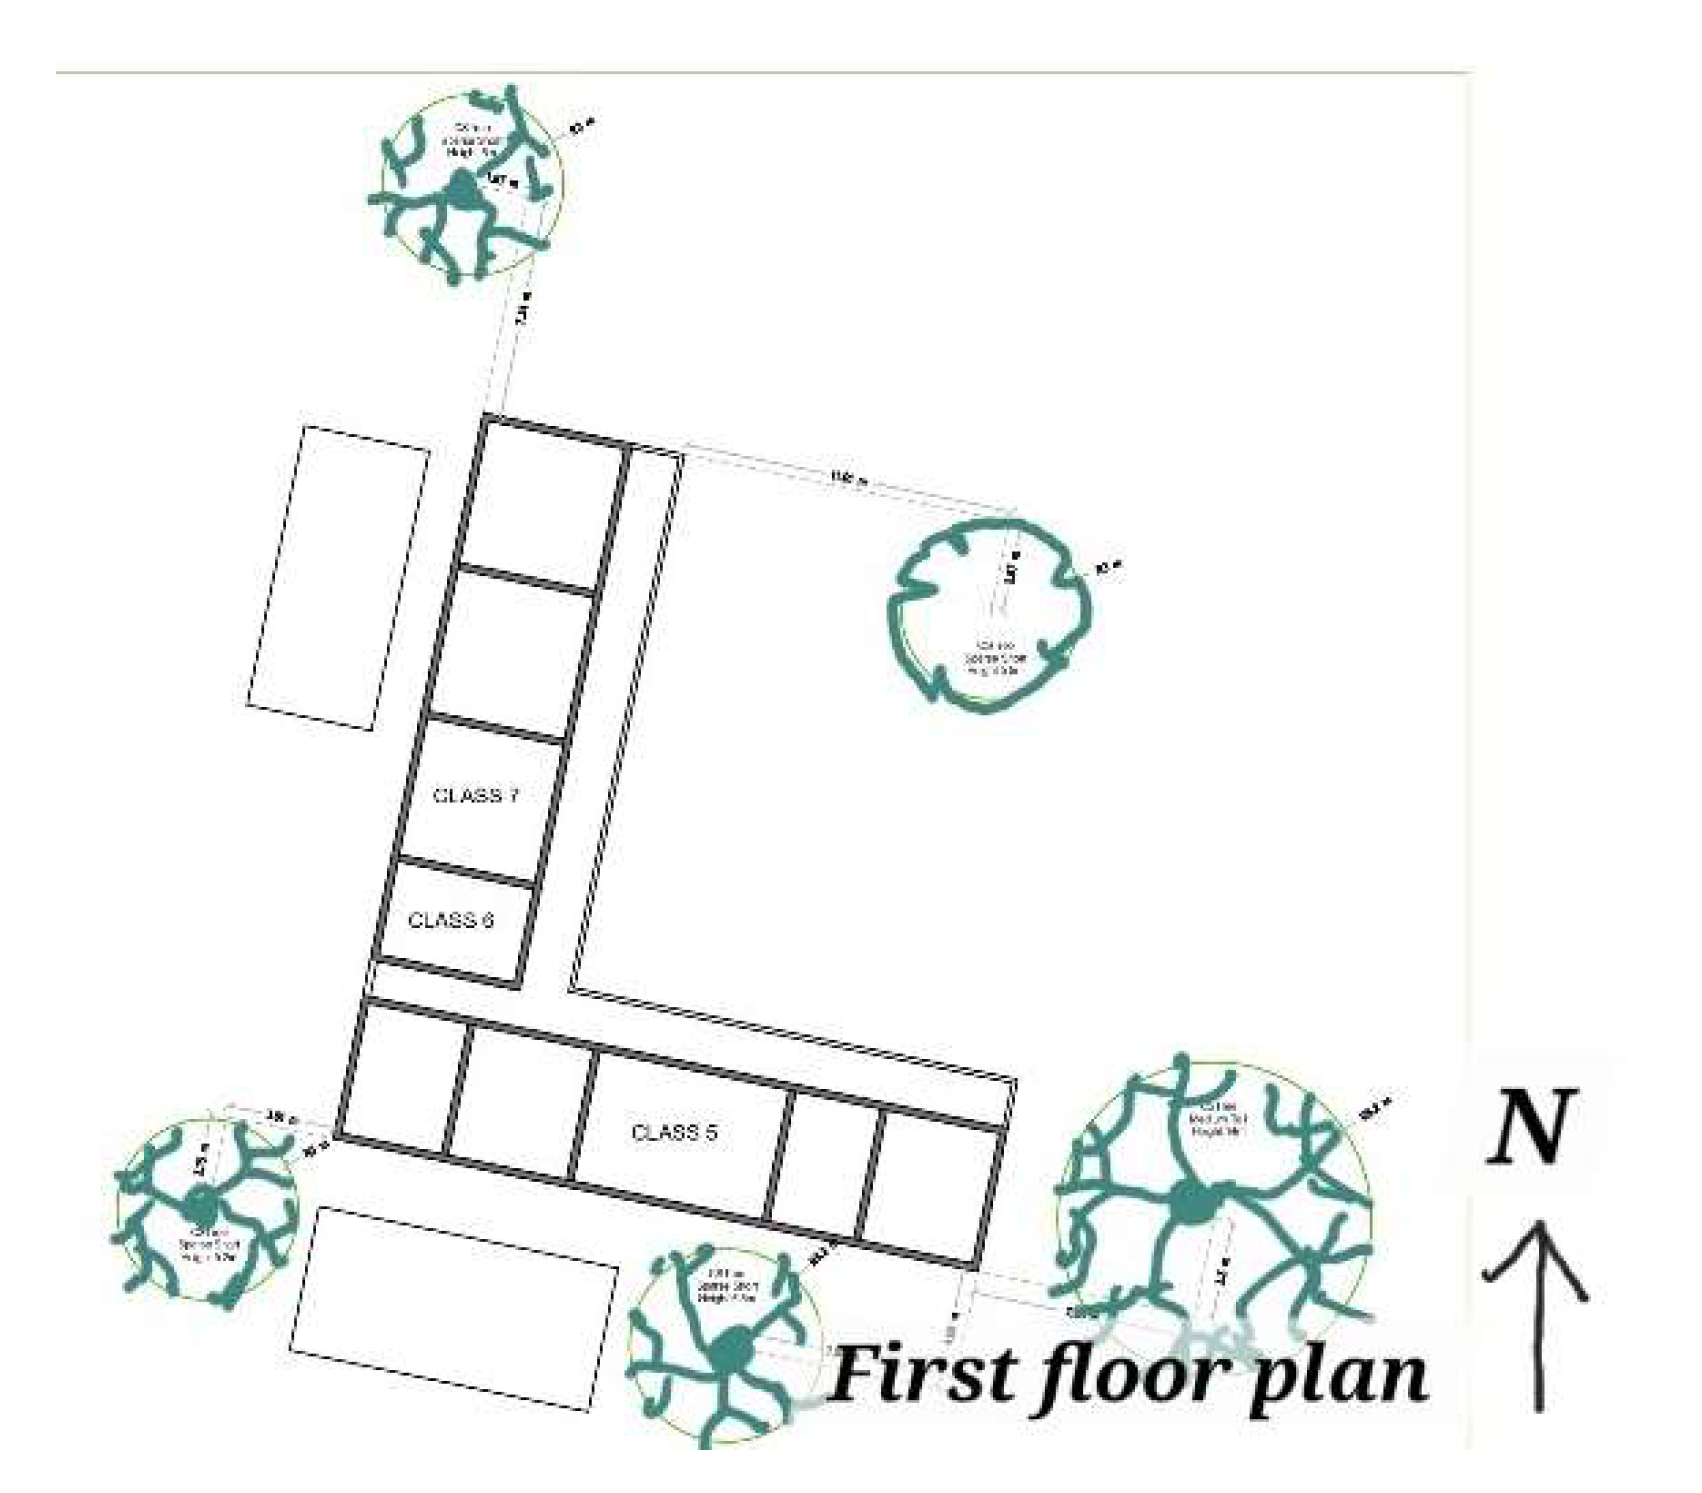
2.2. Study Area and Site Selection
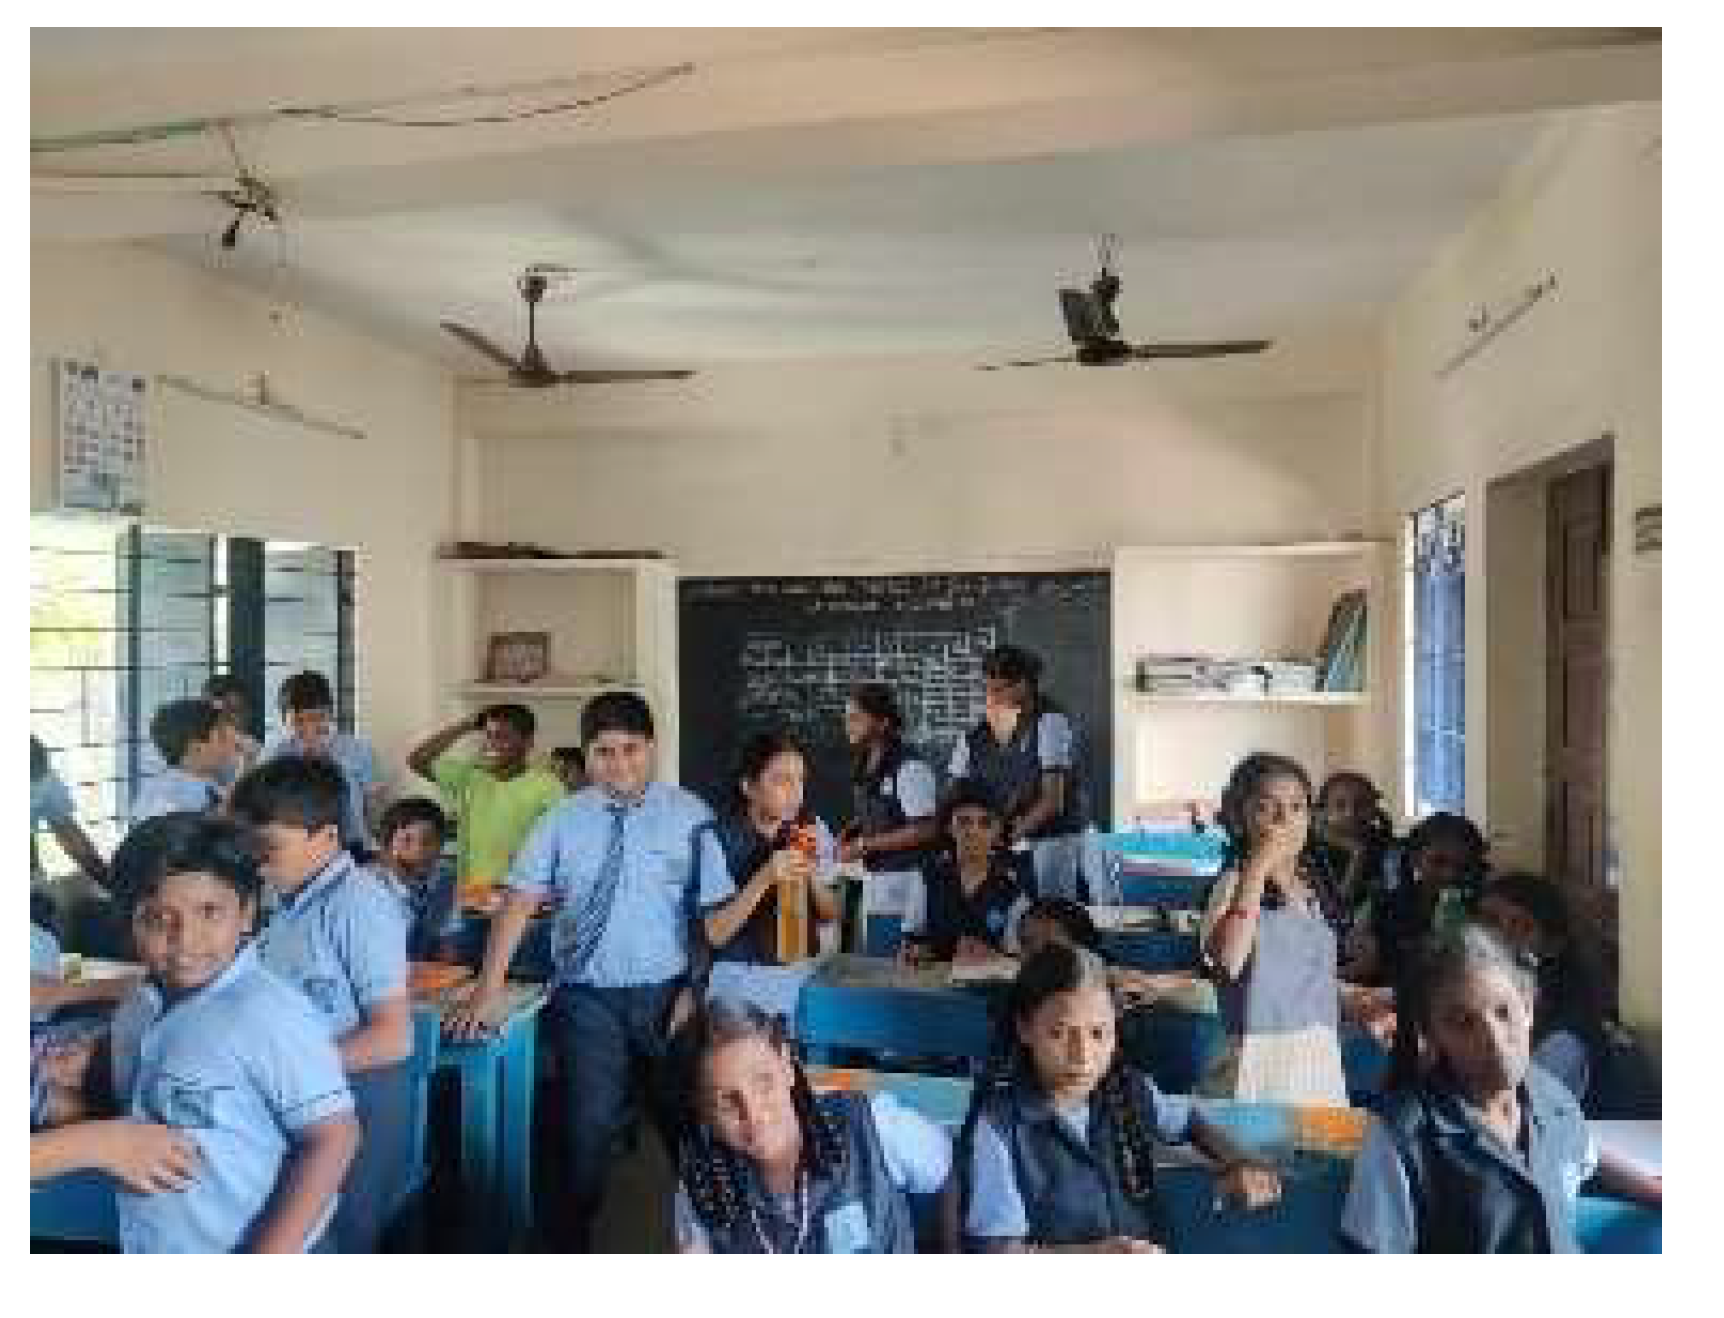
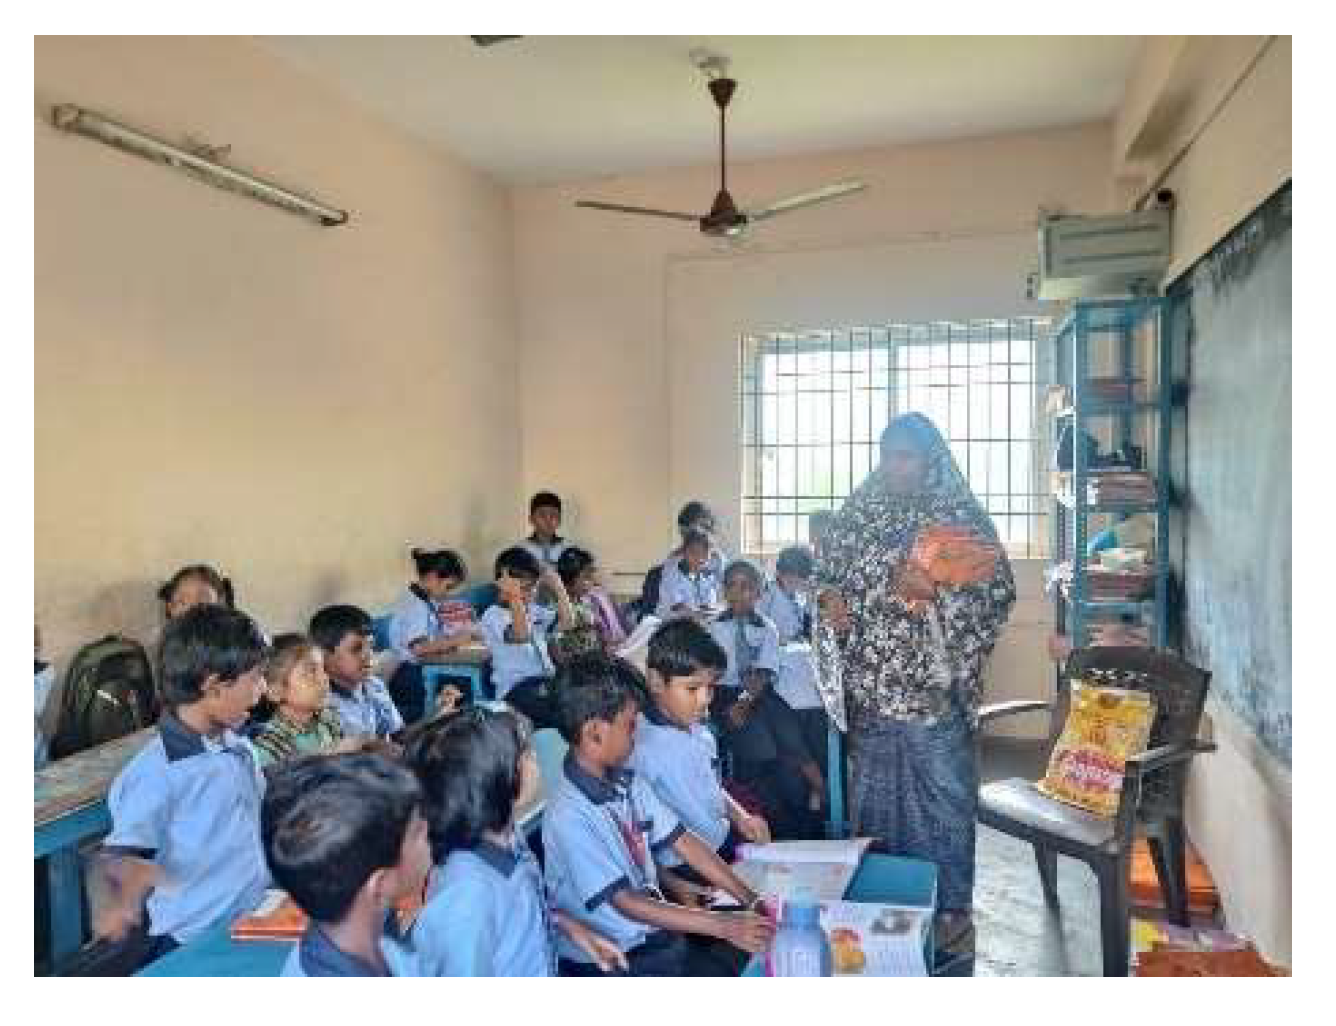
2.3. Field Measurements
2.3.1. Discussions from Field Study
2.3.2. Influence of Adjacent Buildings on the West Side of the School and the Social Context
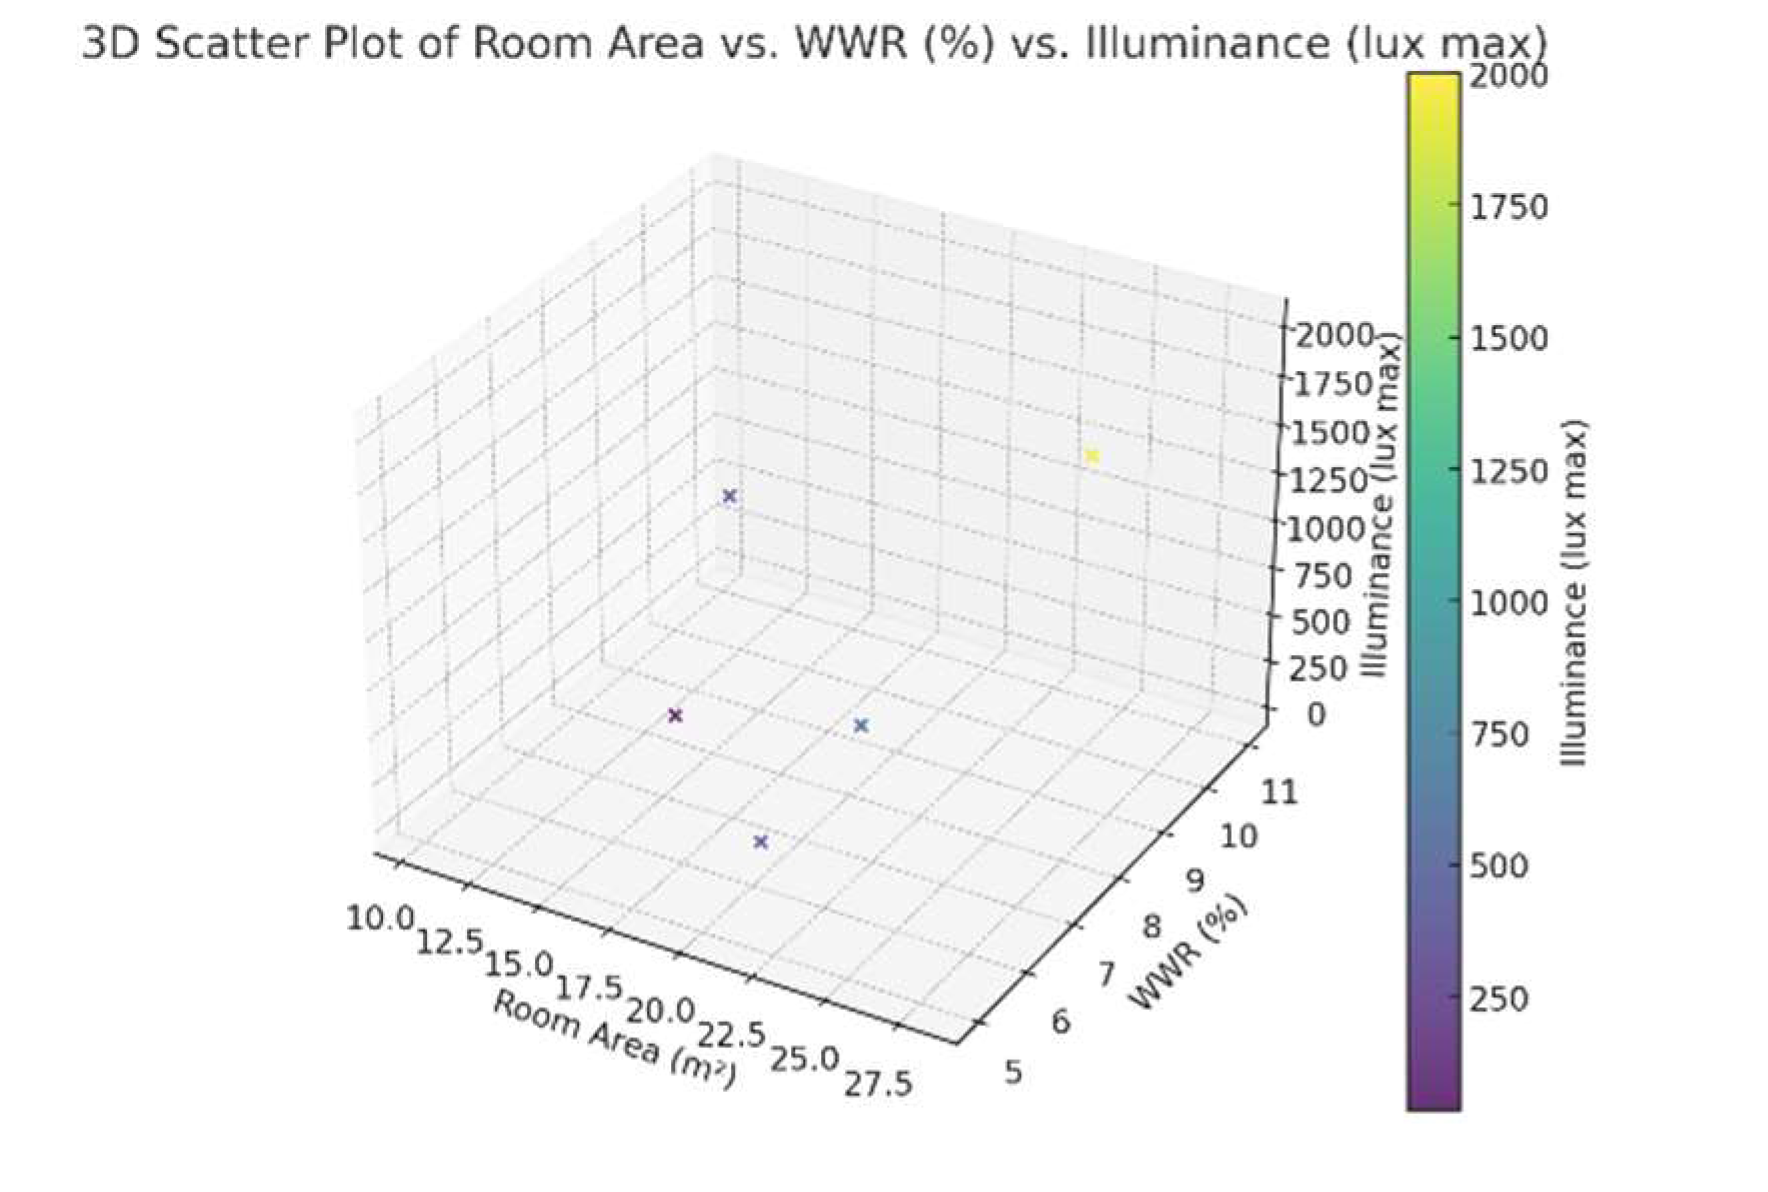
2.3.3. Room Area vs WWR vs Illuminance
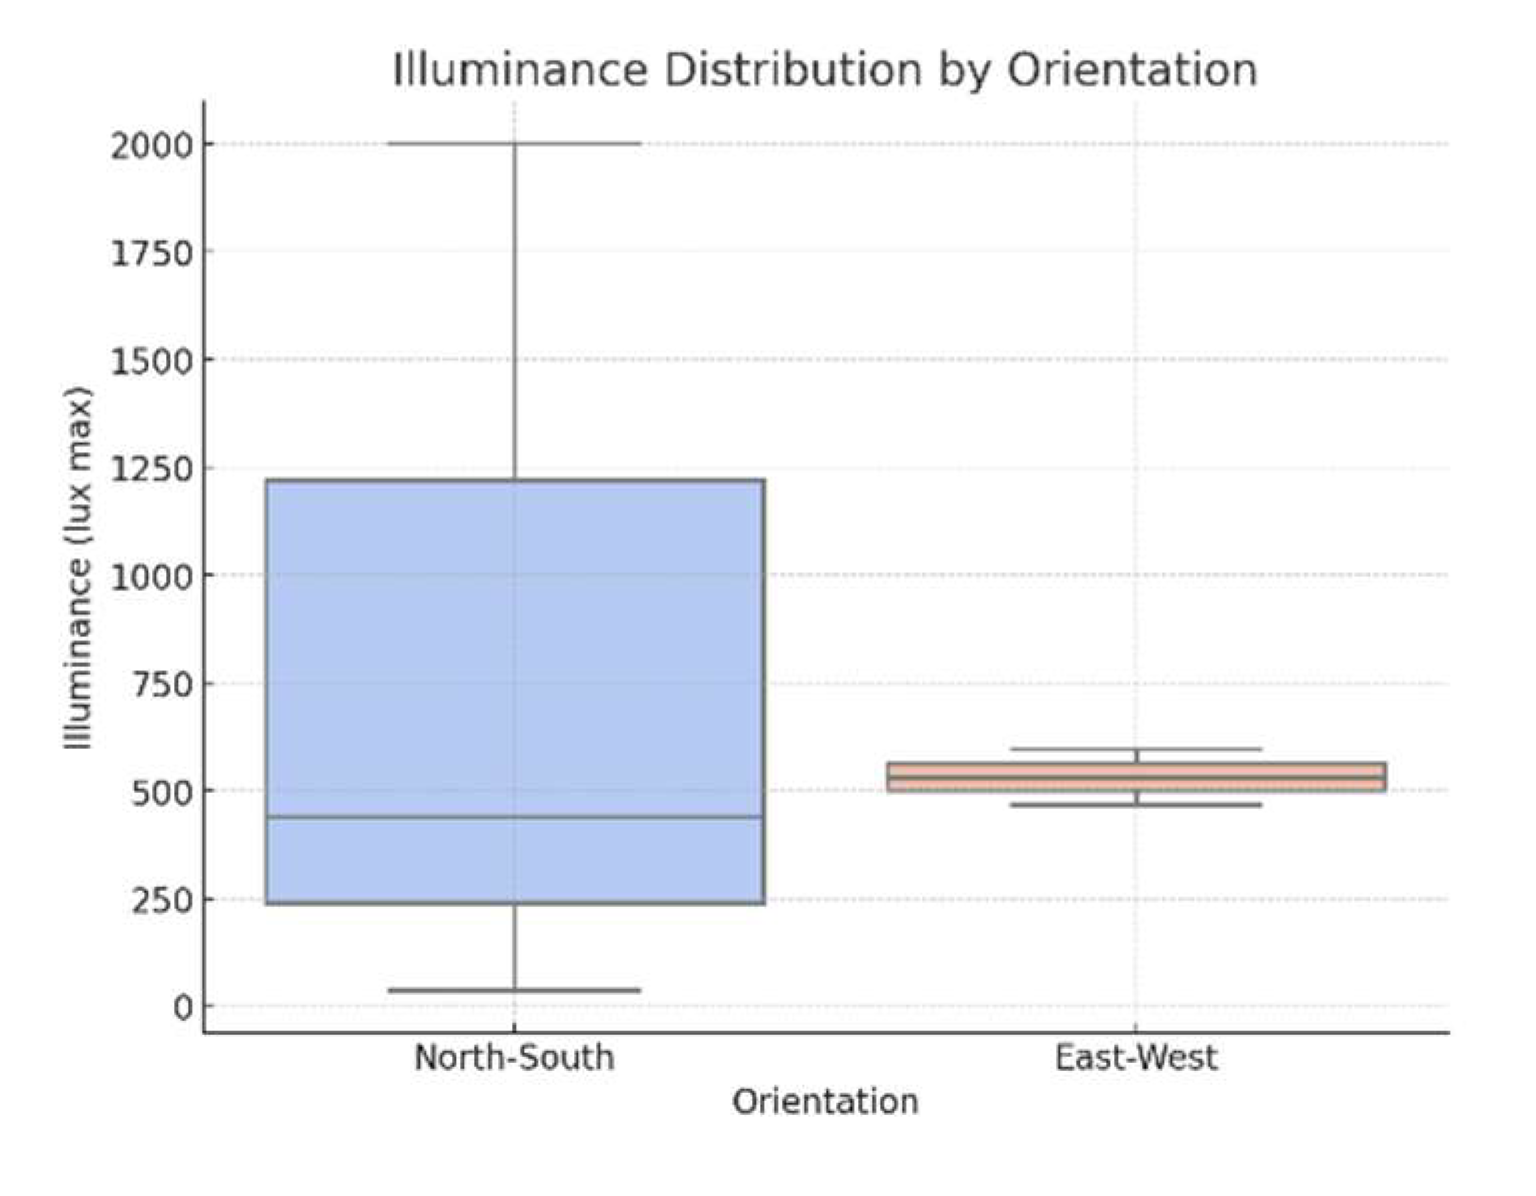
2.3.4. Illuminance Distribution by Orientation
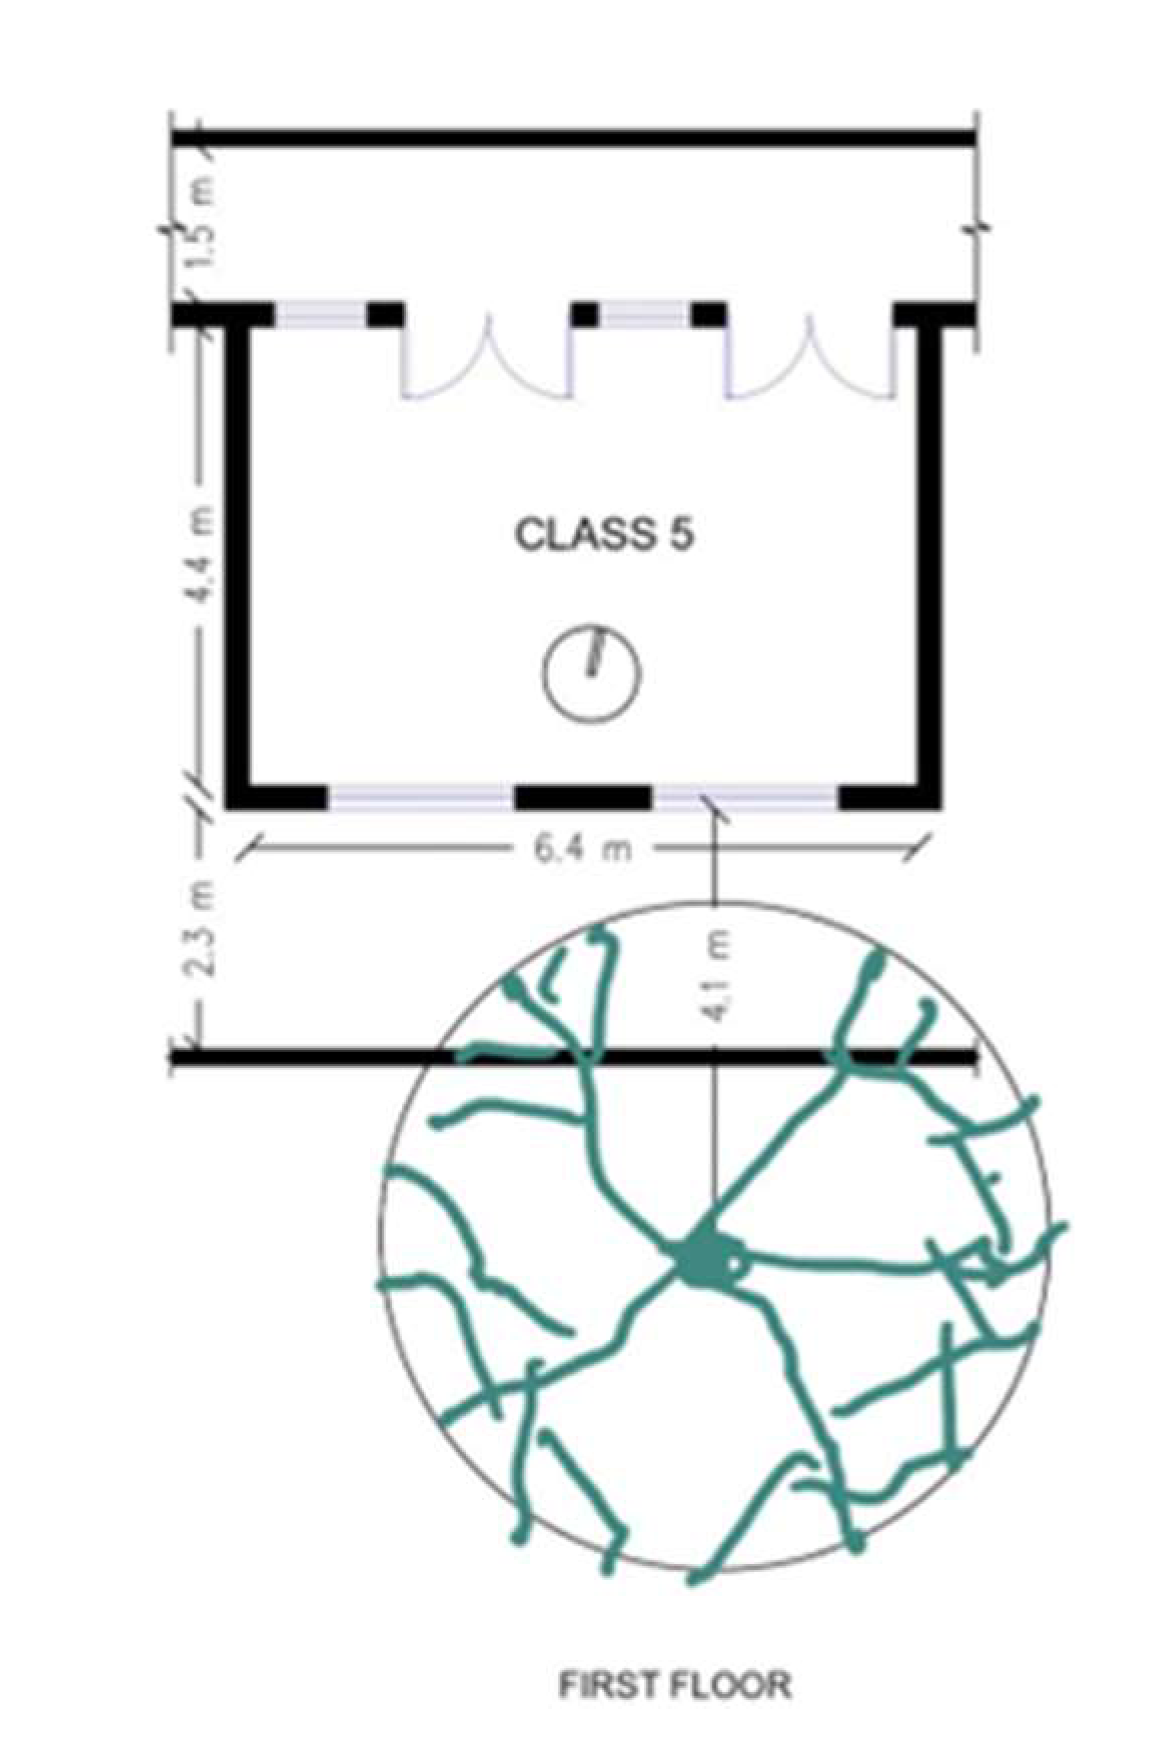
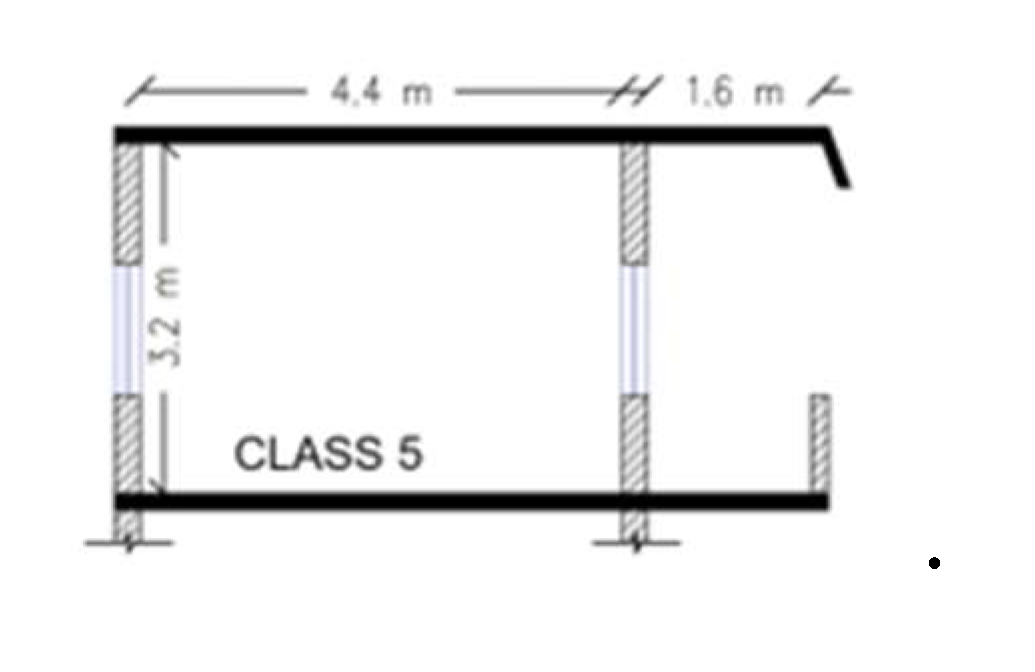
2.3.5. Illuminance in the Classrooms Facing North-South
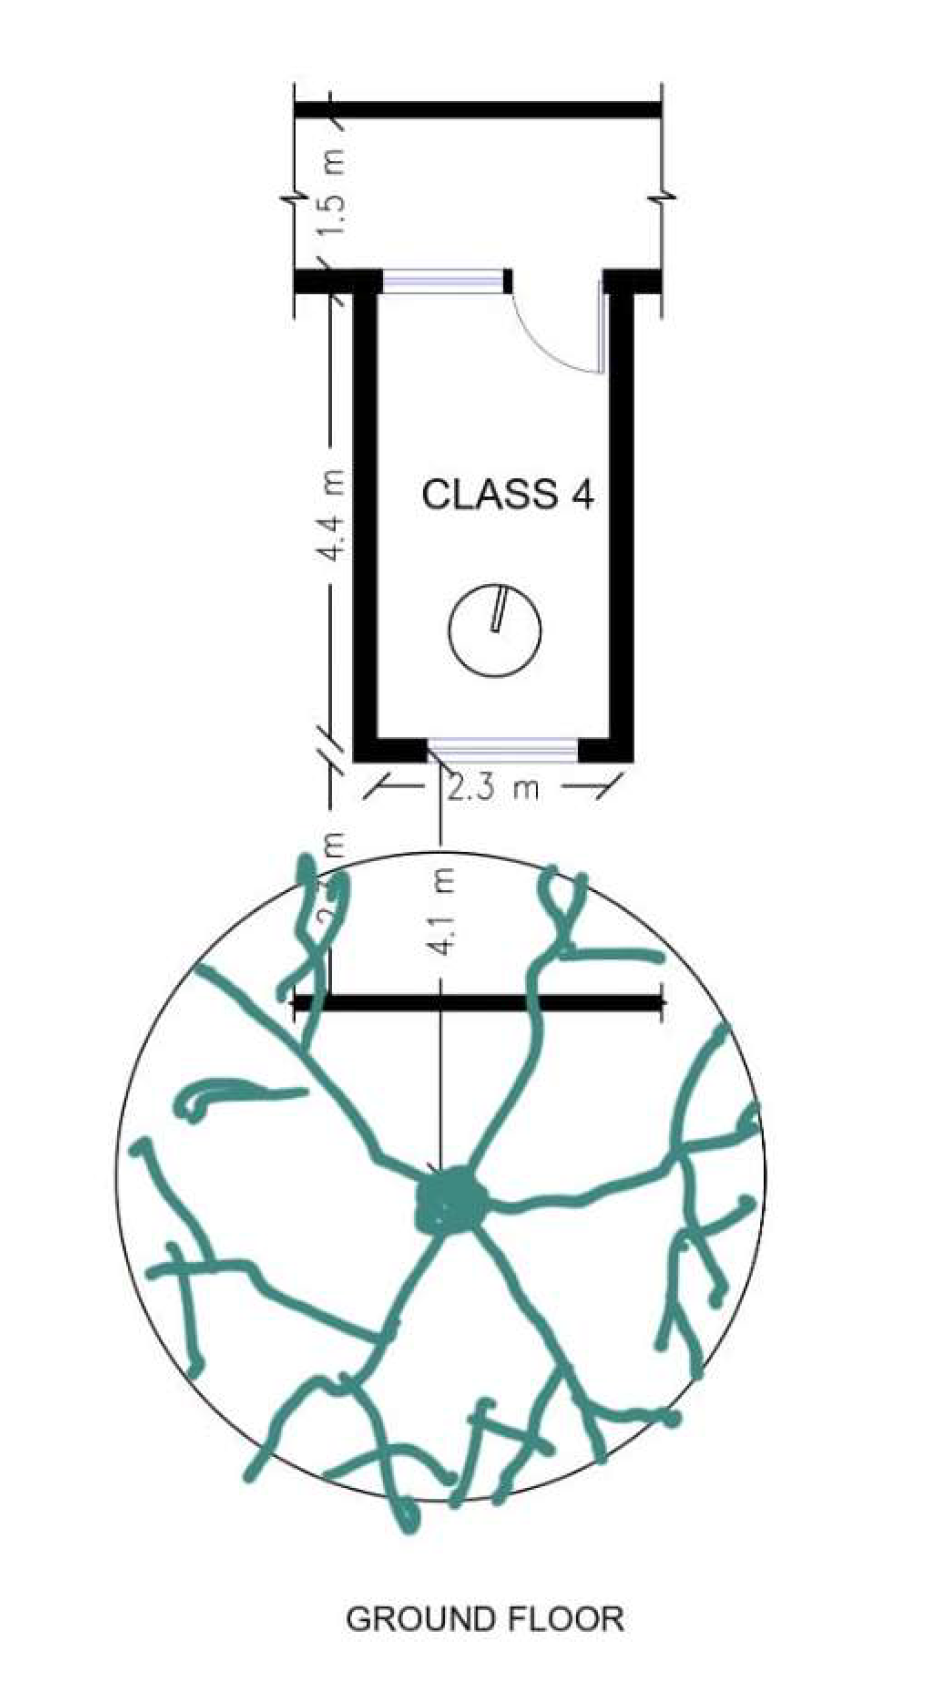
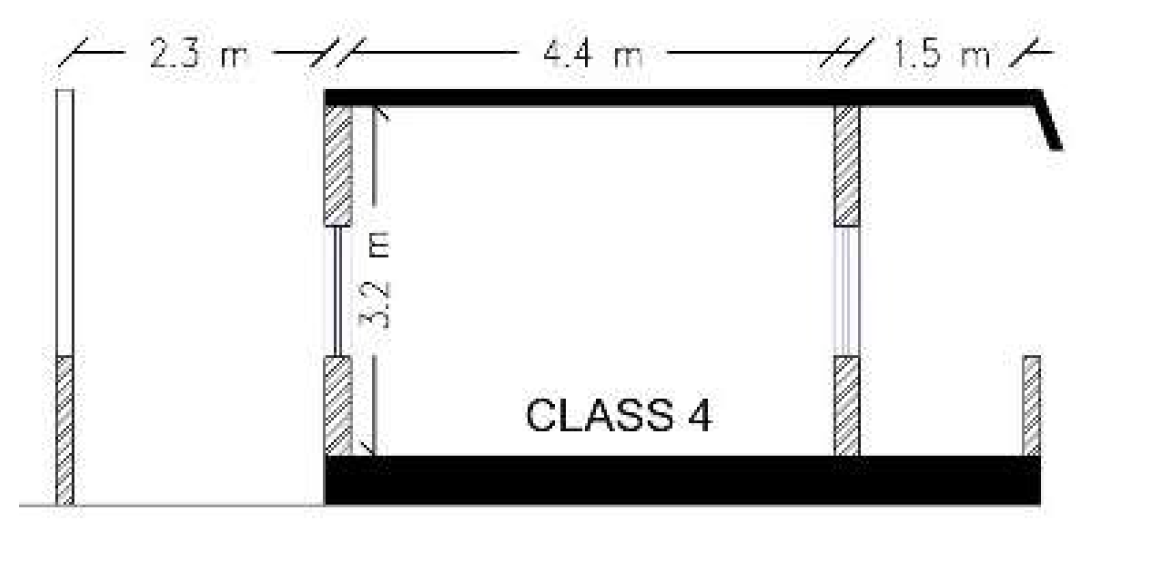
2.3.6. Illuminance in Classrooms Having Different Sizes

| Existing vs. projected Illuminance (without considering shading, window placement, and reflection properties) | ||||||
|---|---|---|---|---|---|---|
| Block | Class | Floor | Area (m2) | WWR (%) | Illuminance lux (max) | Projected Illuminance= Current Illuminance x(Current WWR 20) |
| North-south | 5 | First | 28.16 | 8 | 2000 | 5000 |
| East-west | 7 | First | 22.08 | 5 | 467 | 1868 |
| East-west | 2 | Ground | 22.09 | 7 | 596 | 1702 |
| North-south | 3 | Ground | 13.64 | 8 | 37 | 92 |
| North-south | 4 | Ground | 10.35 | 11 | 440 | 800 |
2.4. Digital Modeling and Simulation
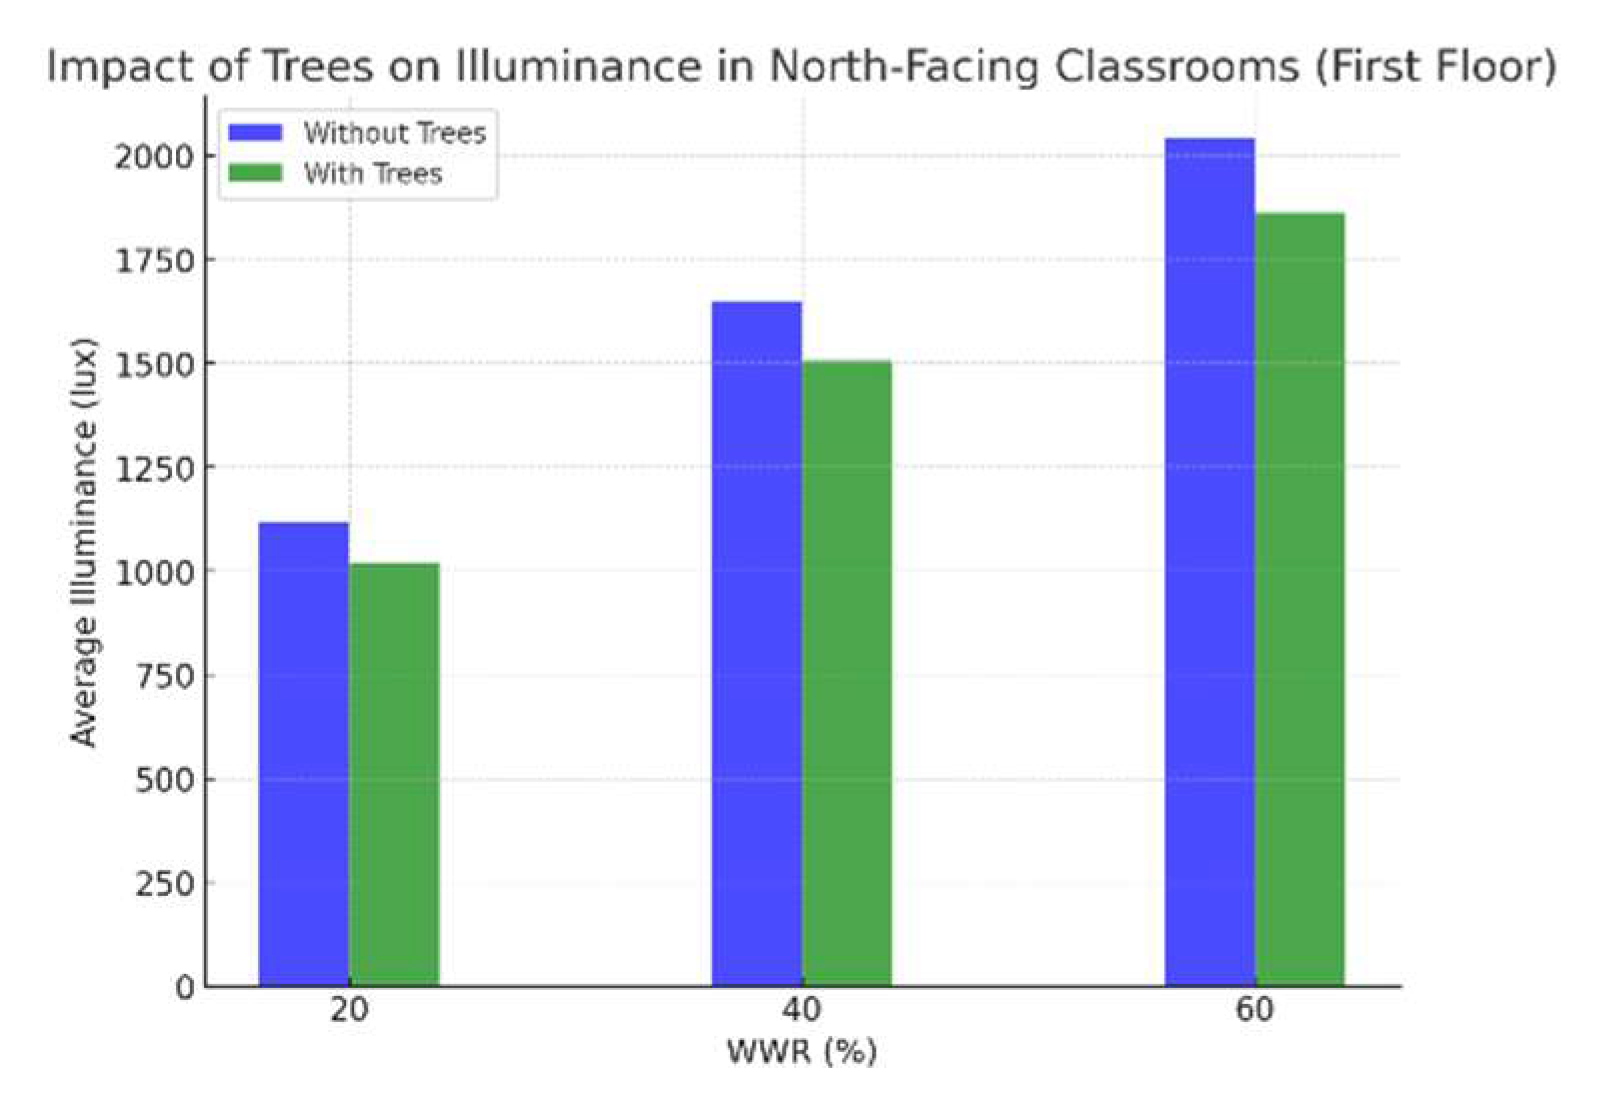
2.4.1. Case 1: Same Orientation Versus Different Floor, Varying WWR, With and Without Trees
| Analysis of WWR and Average Illuminance Lux with and without trees | ||||
| Classrooms facing North | WWR (%) | Average Illuminance in Lux (without Trees) | Average Illuminance in Lux (with Trees) | Average Illuminance Reduction (%) |
| Classroom 4 (Ground Floor) | 20 | 1028 | 678 | 34 |
| Classroom 4 (Ground Floor) | 60 | 1756 | 1225 | 30 |
| Classroom 5 (First Floor) | 20 | 1119 | 1021 | 8.7 |
| Classroom 5 (First Floor) | 60 | 2041 | 1863 | 8.7 |
2.4.2. Case 2: Theoretical projection Vs simulated results
2.4.3. Case 3: Classrooms on the Same Floor but Different Orientations
| Classroom size vs WWR vs Illuminance | ||||||
| Classroom | Block | Size m |
Floor | WWR % |
Average Illuminance lux (min) | Average Illuminance lux (max) |
| Classroom 2 | East-west | 4.9 x 4.7 | Ground | 40 | 20 | 596 |
| Classroom 3 | North-south | 4.4 x 3.1 | Ground | 34 | 60 | 440 |
2.4.4. Case 4: Classrooms on the Same Floor, Same Orientation and Different Sunshade Depth
| Comparison of 20% WWR with Trees for GF Class 2 (East Facing) & Class 3 | |||||
| Block | Shade (m) | sDA (%) | ASE (%) | Avg Lux | |
| Classroom 2 | East-west | 0m | 75.50% | 7.60% | 530 |
| Classroom 3 | North-south | 0m | 93.90% | 14.00% | 731 |
| Classroom 2 | East-west | 0.6m | 56.70% | 7.60% | 444 |
| Classroom 3 | North-south | 0.6m | 92.10% | 2.60% | 611 |
| Classroom 2 | East-west | 0.75m | 53.80% | 7.60% | 442 |
| Classroom 3 | North-south | 0.75m | 91.20% | 1.30% | 598 |
2.4.5. Case 5: Classrooms on the Same Floor, Different Orientations, and WWR
| Illuminance, sunshade depth, orientation and WWR | ||||||
| Ground floor | Classroom 2 -East Facing | Classroom 3 -North Facing | ||||
| WWR | 20% | 40% | 60% | 20% | 40% | 60% |
| Sunshade depth (m) | Avg Illuminance - lux | Avg Illuminance - lux | ||||
| 0m | 602 | 903 | 1058 | 954 | 1399 | 1688 |
| 0.6m | 520 | 802 | 969 | 892 | 1294 | 1543 |
| 0.75m | 518 | 792 | 955 | 873 | 1295 | 1514 |
2.4.6. Case 6: Optimization for Expected 500 lux Average illuminance in East-West and North-South Facing Classrooms on the Ground Floor
| Optimum conditions for Avg Illuminance of 500 lux for different orientations on Ground Floor | ||||||
| Classroom | Optimized WWR (%) | Optimized Sunhade (m) | Expected Avg Lux (Without Trees) | Optimized WWR (%) | Optimized Sunhade (m) | Expected Avg Lux (With Trees) |
| East-west Facing (Classroom 2) | 25 | 0.75 | 500 | 30 | 0.6 | 500 |
| North Facing (Classroom 3) | 18 | 1 | 500 | 22 | 0.75 | 500 |
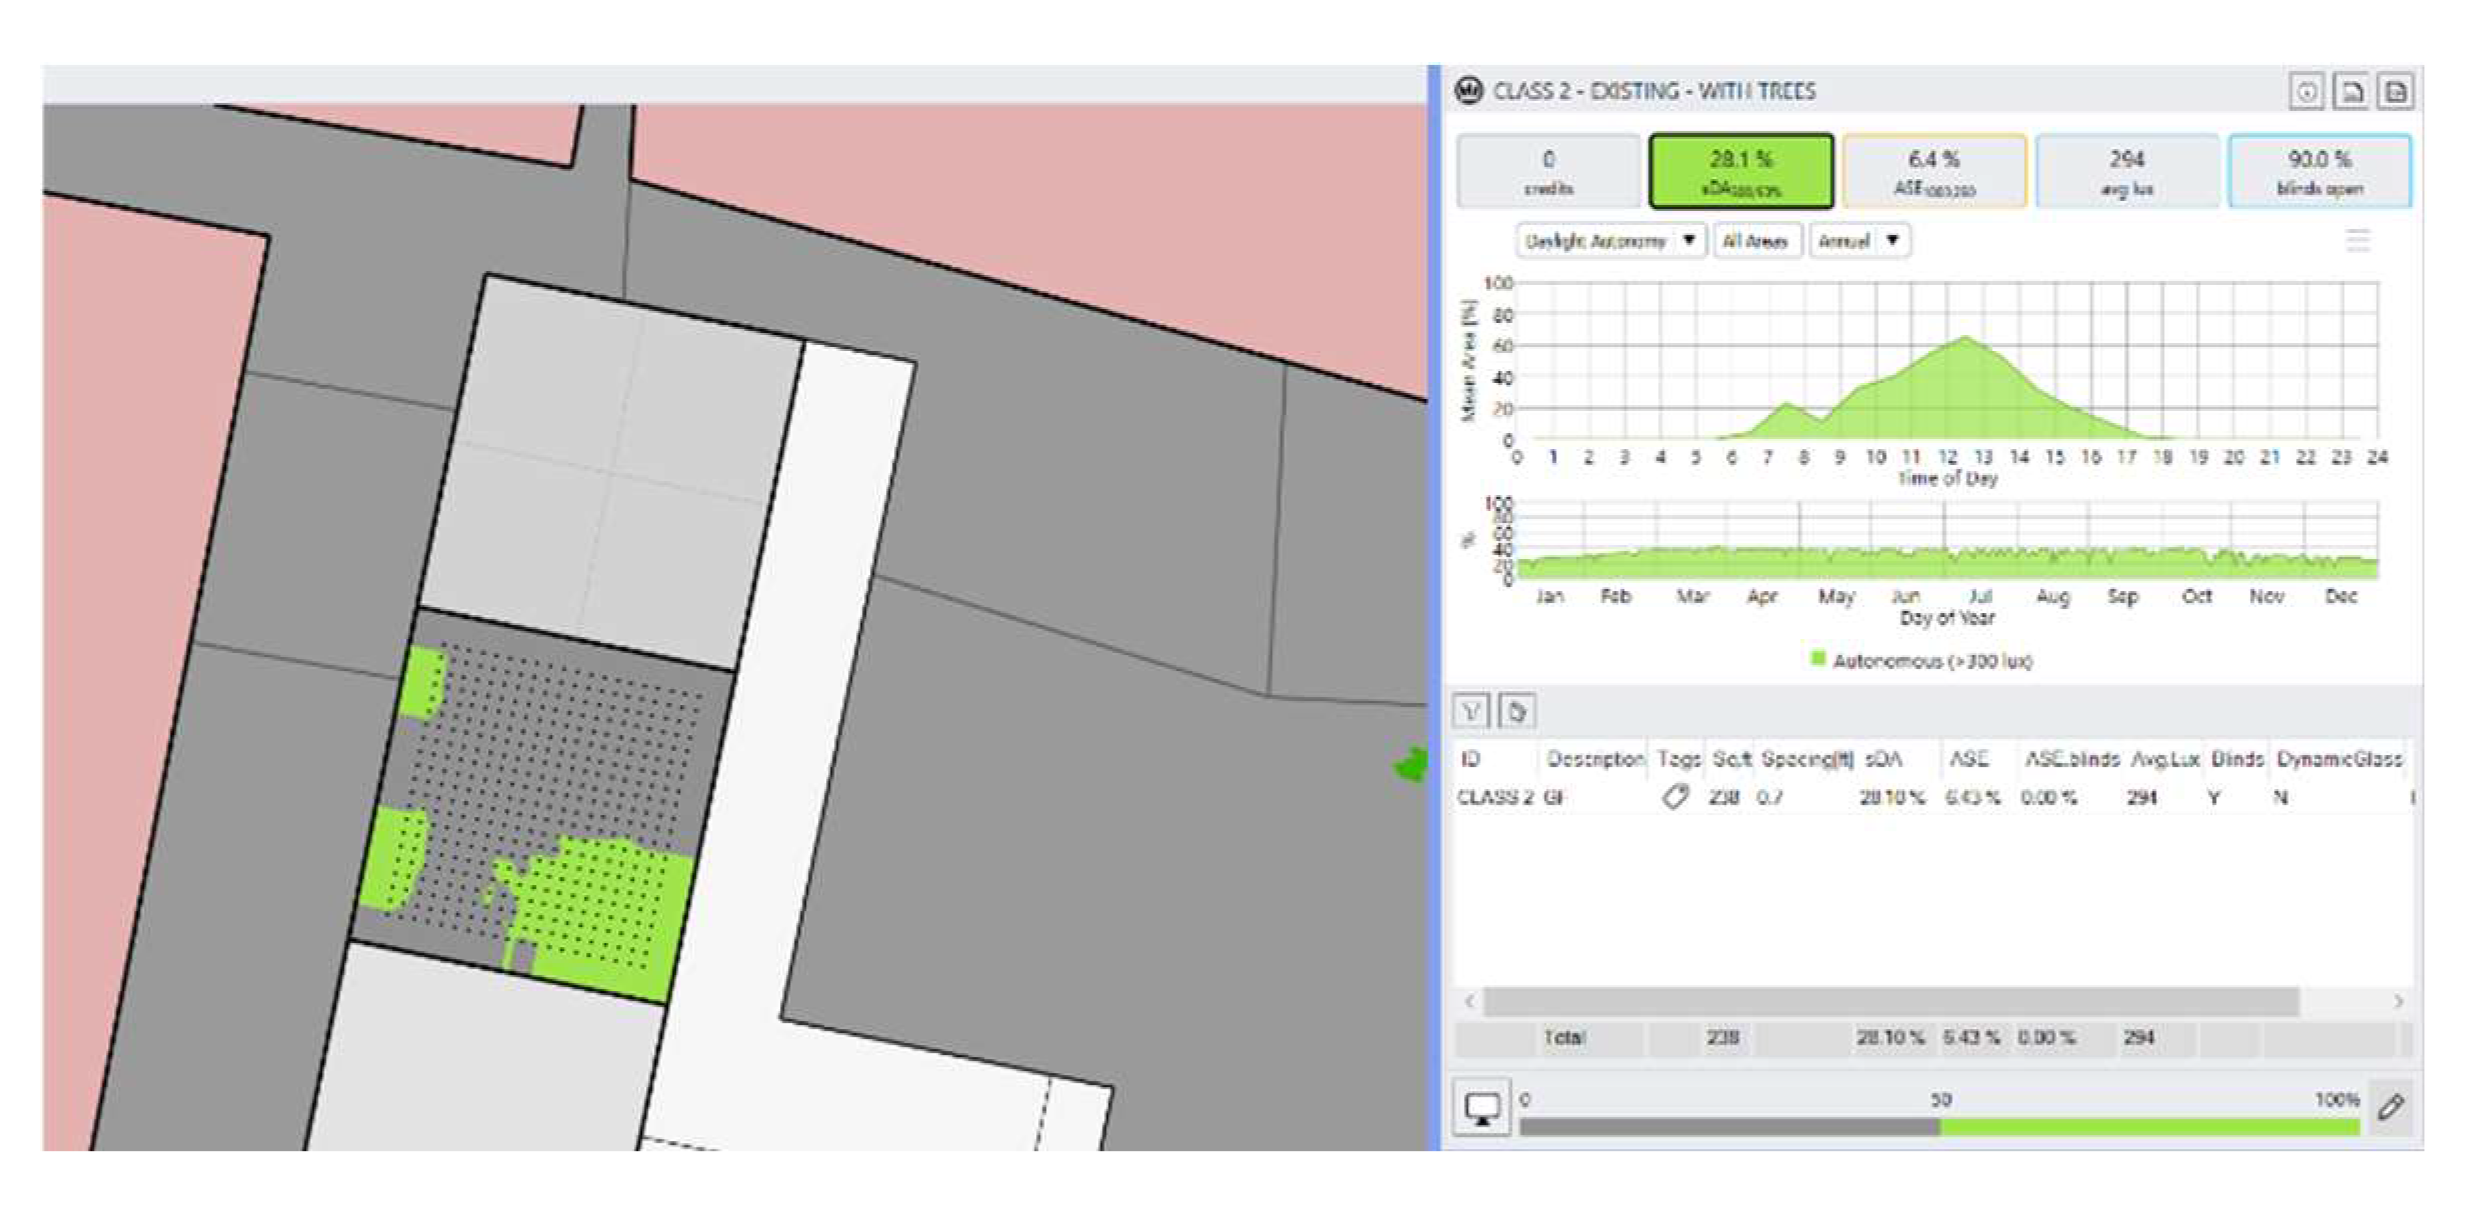
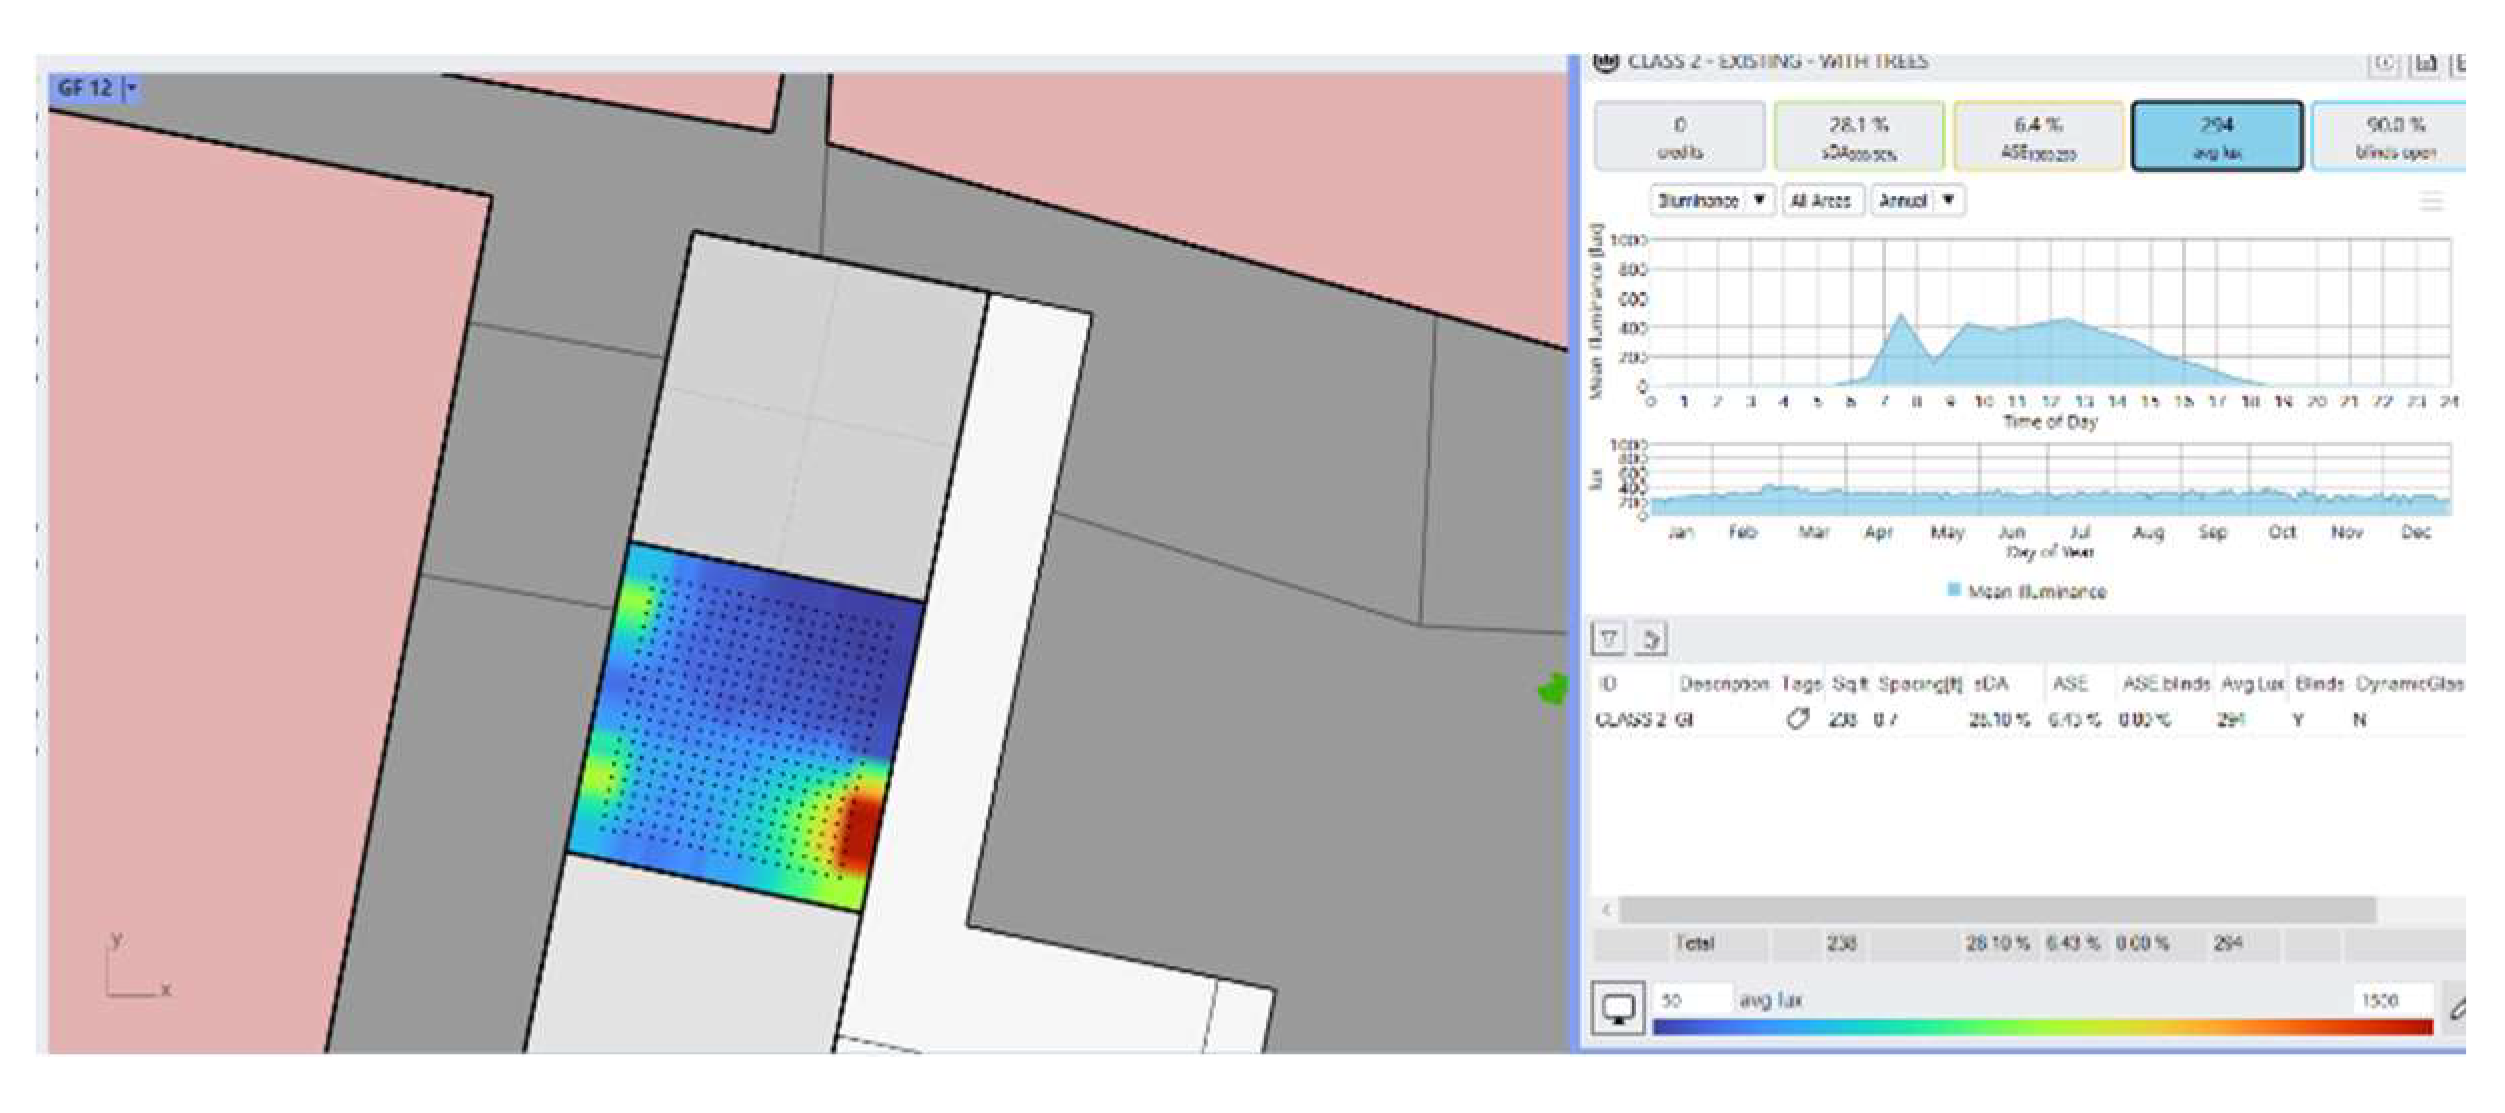
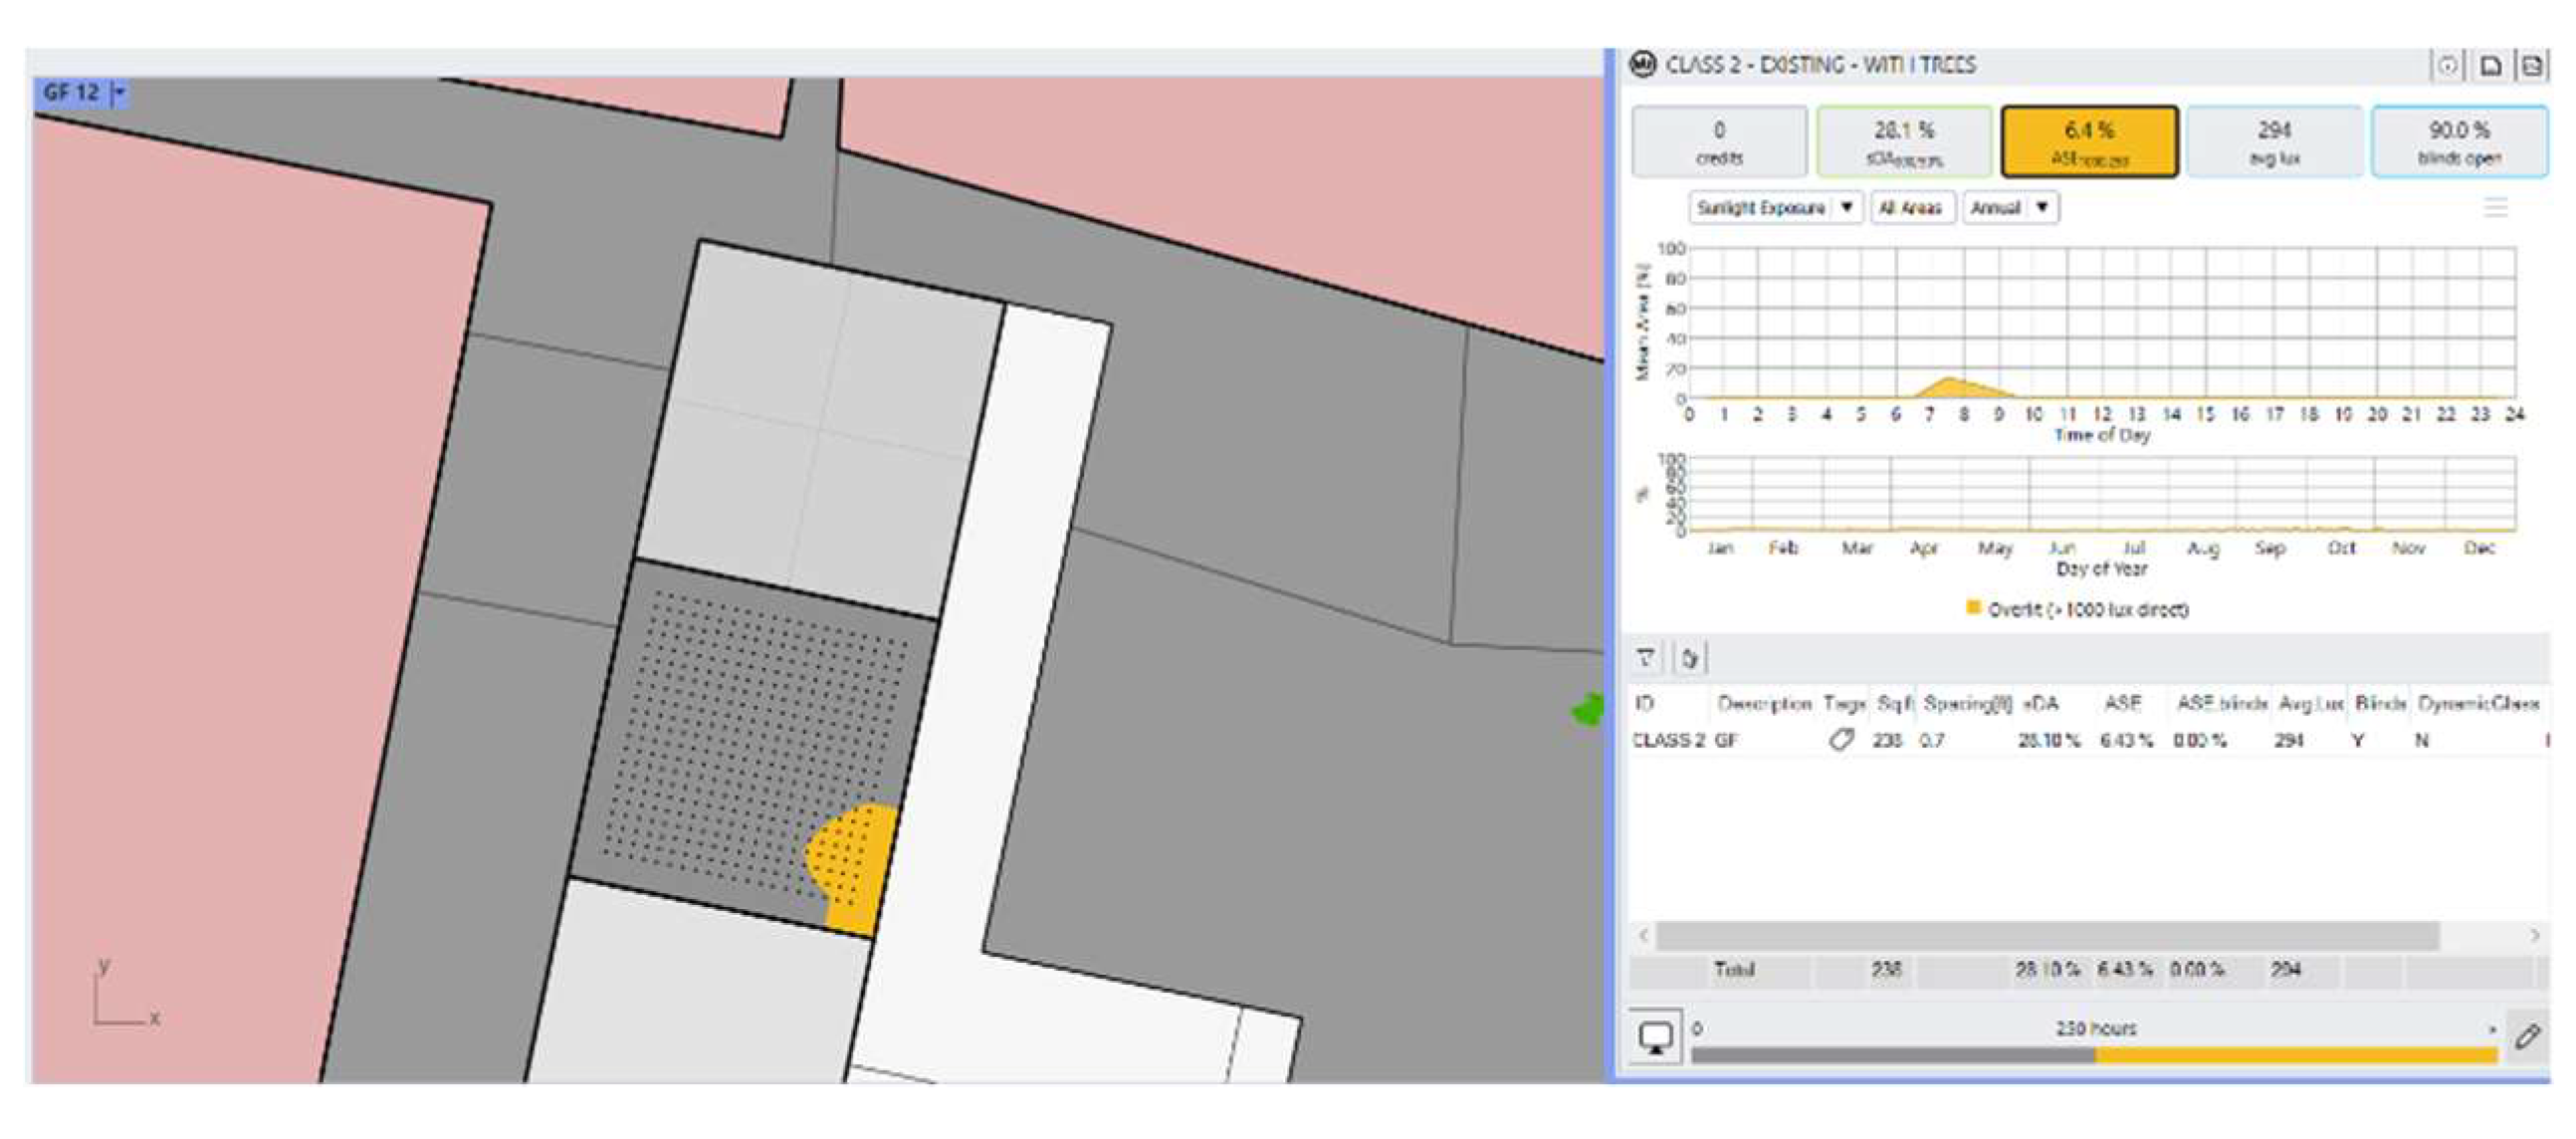
2.4.7. Impact of Trees on Illuminance
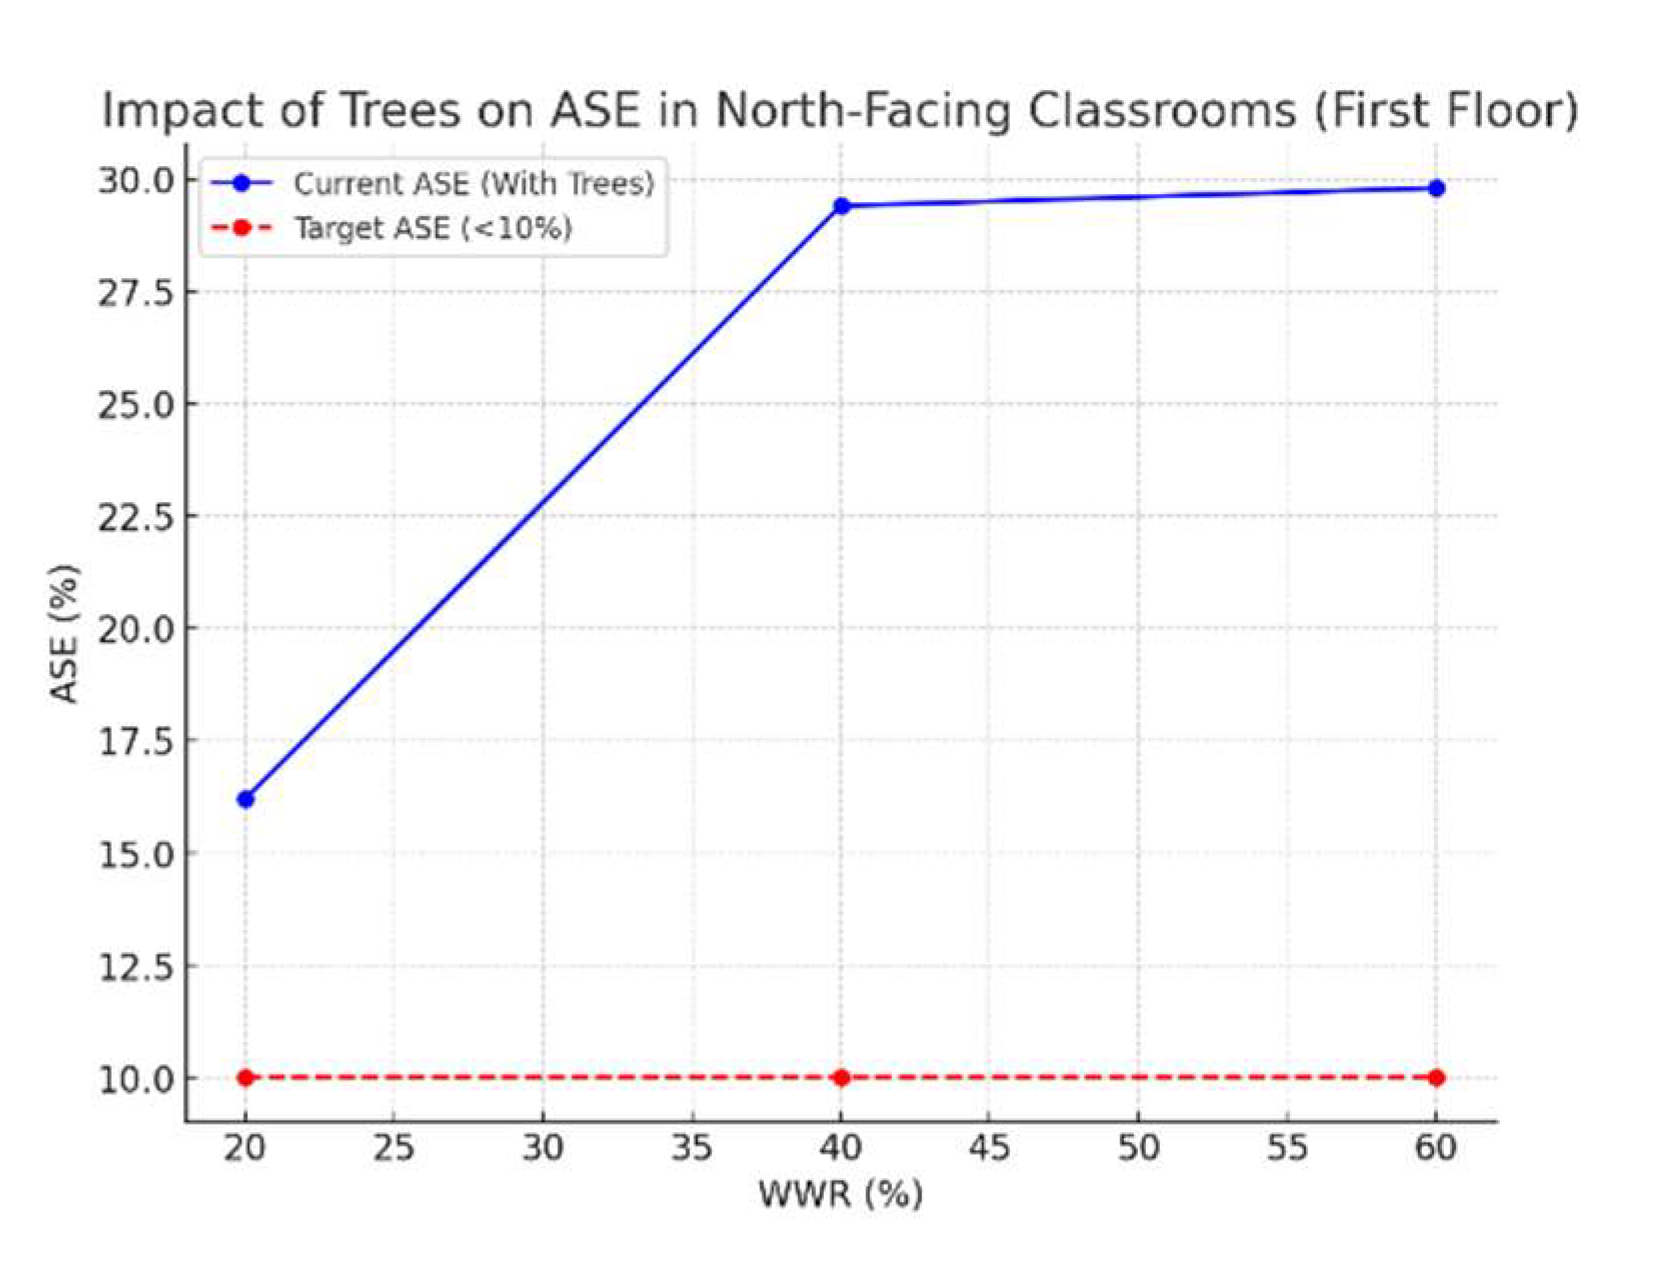
3. Results
3.1. Classroom Orientation
3.2. Window-to-Wall Ratio (WWR)
3.2. For Classrooms Without Trees
3.4. Sunshade Depth
3.5. Vegetation and External Shading
3.6. Glazing and Diffused Light Control
4. Conclusions
Funding
Acknowledgments
Abbreviations
| ASE | Annual Sun Exposure |
| sDA | Spatial daylight autonomy |
| WWR | Window -to-wall ratio |
| DF | Daylight factor |
Appendix A
| Classroom | Optimized WWR (%) | Optimized Sunshade (m) | Expected Avg Lux (Without Trees) | Optimized WWR (%) | Optimized Sunshade (m) | Expected Avg Lux (With Trees) |
| East-west Facing (Classroom 2) | 25 | 0.75 | 500 | 30 | 0.6 | 500 |
| North Facing (Classroom 3) | 18 | 1 | 500 | 22 | 0.75 | 500 |
| North-South Facing (Classroom 5) | 20 | 0.75 | 500 | 24 | 0.6 | 500 |
| North-South Facing (Classroom 4) | 22 | 1 | 500 | 26 | 0.75 | 500 |
| East-West Facing (Classroom 7) | 25 | 0.75 | 500 | 30 | 0.6 | 500 |
| East-west Facing (Classroom 2) | 20 | 1 | 300 | 25 | 0.75 | 300 |
| North Facing (Classroom 3) | 15 | 1.2 | 300 | 20 | 1 | 300 |
| North-South Facing (Classroom 5) | 18 | 1 | 300 | 22 | 0.75 | 300 |
| North-South Facing (Classroom 4) | 20 | 1.2 | 300 | 24 | 1 | 300 |
| East-West Facing (Classroom 7) | 22 | 1 | 300 | 26 | 0.75 | 300 |
| Classroom | ground floor |
|||||
| Optimized WWR (%) | Optimized Sunshade (m) | Expected Avg Lux (Without Trees) | Optimized WWR (%) | Optimized Sunshade (m) | Expected Avg Lux (With Trees) | |
| East-west | 25 | 0.75 | 500 | |||
| North south | 22 | 0.75 | 500 | |||
| First floor | ||||||
| East west | ||||||
| North south | ||||||
References
- Vijayalaxmi, J. , & Sekar, S. P. Thermal performance of naturally ventilated residential buildings with various room orientations in the hot-humid climate of Chennai, India. Journal of Architectural and Planning Research 2013, 30, 1–22. [Google Scholar]
- Samani, Sanaz. (2012). The Impact of Indoor Lighting on Students’ Learning Performance in Learning Environments: A knowledge internalization perspective. International Journal of Business and Social Science. 3. International Journal of Business and Social Science Vol. 3 No. 24 [Special Issue – December 2012] :127-136.
- Veitch, J. A. (n.d.). October 2012:A literature review Daylighting and View Effects through Residential Windows-. Lighting Design + ApplicationVolume 42, Issue 10, , Pages 56-58 2012 SAGE Publications;
- Alama, Areej & Sabbagh, Mostafa. (Apr.-2020). Comparing daylight distribution between two classroom prototypes in jeddah public schools. International Journal of Advances in Mechanical and Civil Engineering, ISSN: 2394-2827 Volume-7, Issue-3,.
- Dická, Zuzana & Dolníková, Erika & Katunský, Dušan. (2024). The impact of shading by vegetation on the level of daylight in buildings: A case study. E3S Web of Conferences. 550. 10.1051/e3sconf/202455001003.
- Raja Nur Syaheeza Raja Mohd Yazit1*, Elina Mohd Husini2 , Mohd Khedzir Khamis3 , Megat Faridrullah Zolkefli4 , Yakubu Aminu Dodo5 (2020)Illuminance Level Measurement at Lower Working Plane Height in Islamic Religious SchoolAsian Journal of University Education (AJUE) Volume 16, Number 3, October 2020 pg 125-137.
- Yassin, A. A. , Sheta, S. A., & ELWazeer, M. A. Parametric Study on Window-Wall Ratio (WWR) for Day lighting Optimization in Multi-Story Residential Buildings: Case Study of an Apartment Complex in Mansoura City, Egypt. IARJSET 2017, 4, 21–32. [Google Scholar]
- Dass Mathalamuthu, A. , Lukman, N., Ibrahim, N., Ponniah, V., Wira, M., Shafiei, M., & Ismail, R. Illuminance Uniformity Using Public Works Department (PWD) Standard Design for Public Schools Classroom Design in Malaysia. Journal of Advanced Research in Fluid Mechanics and Thermal Sciences Journal Homepage 2018, 52, 205–214. [Google Scholar]
- Alwetaishi, M. , Al-Khatri, H., Benjeddou, O., Shamseldin, A., Alsehli, M., Alghamdi, S., & Shrahily, R. An investigation of shading devices in a hot region: A case study in a school building. Ain Shams Engineering Journal 2021, 12, 3229–3239. [Google Scholar] [CrossRef]
- Piparsania, K. R., Vaidya, P., & Kalita, C. (2020) Evaluation of daylight performance of classroom spaces in ahmedabad. Ds 101: Proceedings of NordDesign 2020, Lyngby, Denmark, 12th - 14th August 2020.
- Abdullah, W. N. H. W. , Tharim, A. H. A., Ismail, A., & Ahmad, A. C. Determination of Design Solutions to Overcome the Daylighting Design Failure Observed in Existing Educational Building. International Journal of Sustainable Construction Engineering and Technology 2022, 13, 153–167. [Google Scholar] [CrossRef]
- Kweon, B. S. , Ellis, C. D., Lee, J., & Jacobs, K. The link between school environments and student academic performance. Urban Forestry and Urban Greening 2017, 23, 35–43. [Google Scholar] [CrossRef]
- Moreno, M. B. P. , & Labarca, C. Y. Methodology for assessing daylighting design strategies in classroom with a climate-based method. Sustainability (Switzerland) 2015, 7, 880–897. [Google Scholar] [CrossRef]
- Dicka, Z. , Dolnikova, E., & Katunsky, D. (2024). The impact of shading by vegetation on the level of daylight in buildings: A case study. E3S Web of Conferences, 550. [CrossRef]
- Altomonte, S. (2008). Daylight for Energy Savings and Psycho-Physiological Well-Being in Sustainable Built Environments.
- Dryden, M. , Webster, W. J., & Fraser, B. J. (n.d.). Rethinking the Effects of Classroom Environments on Student Learning in a Large School System.
- Knoop, M. , Stefani, O., Bueno, B., Matusiak, B., Hobday, R., Wirz-Justice, A., Martiny, K., Kantermann, T., Aarts, M. P. J., Zemmouri, N., Appelt, S., & Norton, B. Daylight: What makes the difference? Lighting Research and Technology 2020, 52, 423–442. [Google Scholar] [CrossRef]
- Ciacci, C. , Bazzocchi, F., di Naso, V., & Rocchetti, A. Influence of Window-wall ratio on global energy consumption of nzeb kindergartens in Italy. Building Simulation Conference Proceedings 2019, 5, 3063–3070. [Google Scholar] [CrossRef]
- Kim, J. Y. , Park, C. Y., Hyun, J. H., Kim, S. H., Yun, S. H., & Lee, D. K. Landscape Design for Improved Thermal Environment: An Optimized Tree Arrangement Design for Climate-Responsive Outdoor Spaces in Residential Buildings Complexes. Sustainable Cities and Society 2023, 97. [CrossRef]
- Theodorson, J. (n.d.). North V. South: The Impact of Orientation in Daylighting School Classrooms.
- Atthaillah, Mangkuto, R. A., Koerniawan, M. D., Hensen, J. L. M., & Yuliarto, B. Optimization of Daylighting Design Using Self-Shading Mechanism in Tropical School Classrooms with Bilateral Openings. Journal of Daylighting 2022, 9, 117–136. [Google Scholar] [CrossRef]
- Liu, X. Liu, X., Sun, Y., Wei, S., Meng, L., & Cao, G. Illumination distribution and daylight glare evaluation within different windows for comfortable lighting. Results in Optics 2021, 3. [CrossRef]
- Asim Ahmad, Anil Kumar, Om Prakash, Ankish Aman,Daylight availability assessment and the application of energy simulation software – A literature review,Materials Science for Energy Technologies,Volume 3,2020,Pages 679-689,ISSN 2589-2991,https://doi.org/10.1016/j.mset.2020.07.002.(https://www.sciencedirect.com/science/article/pii/S2589299120300410). [CrossRef]
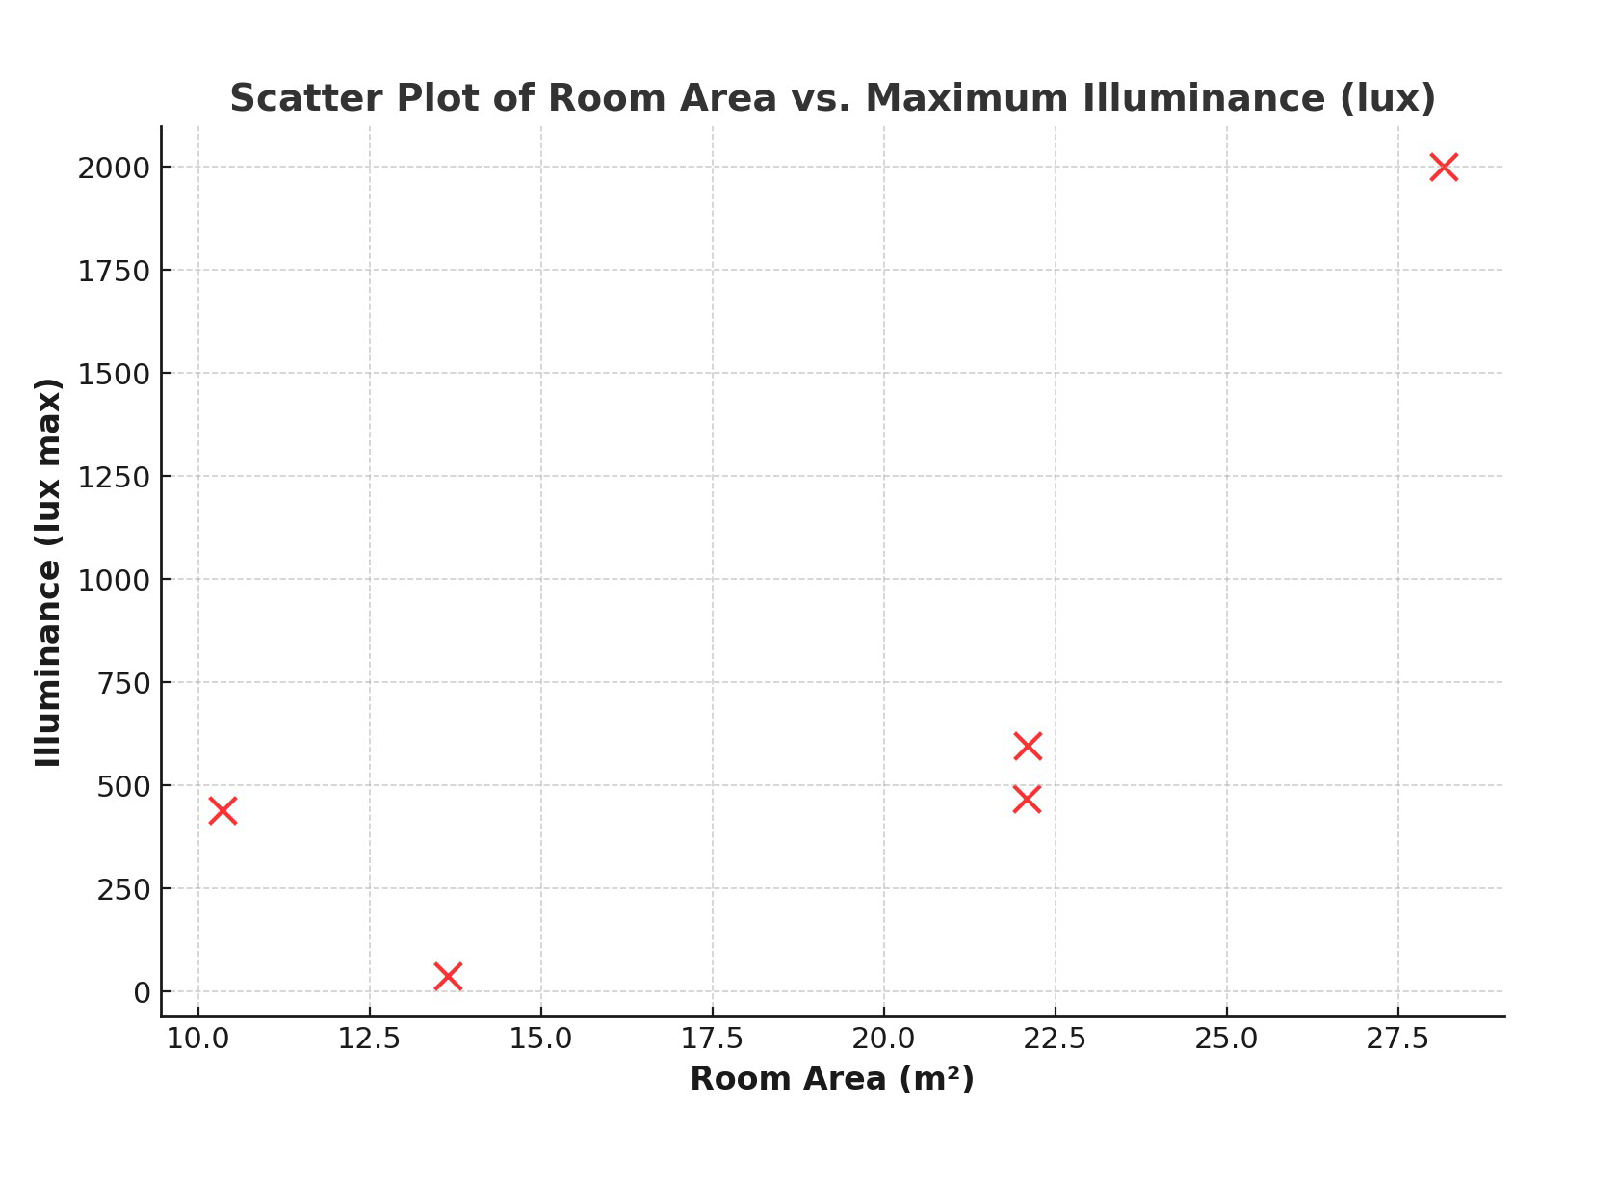
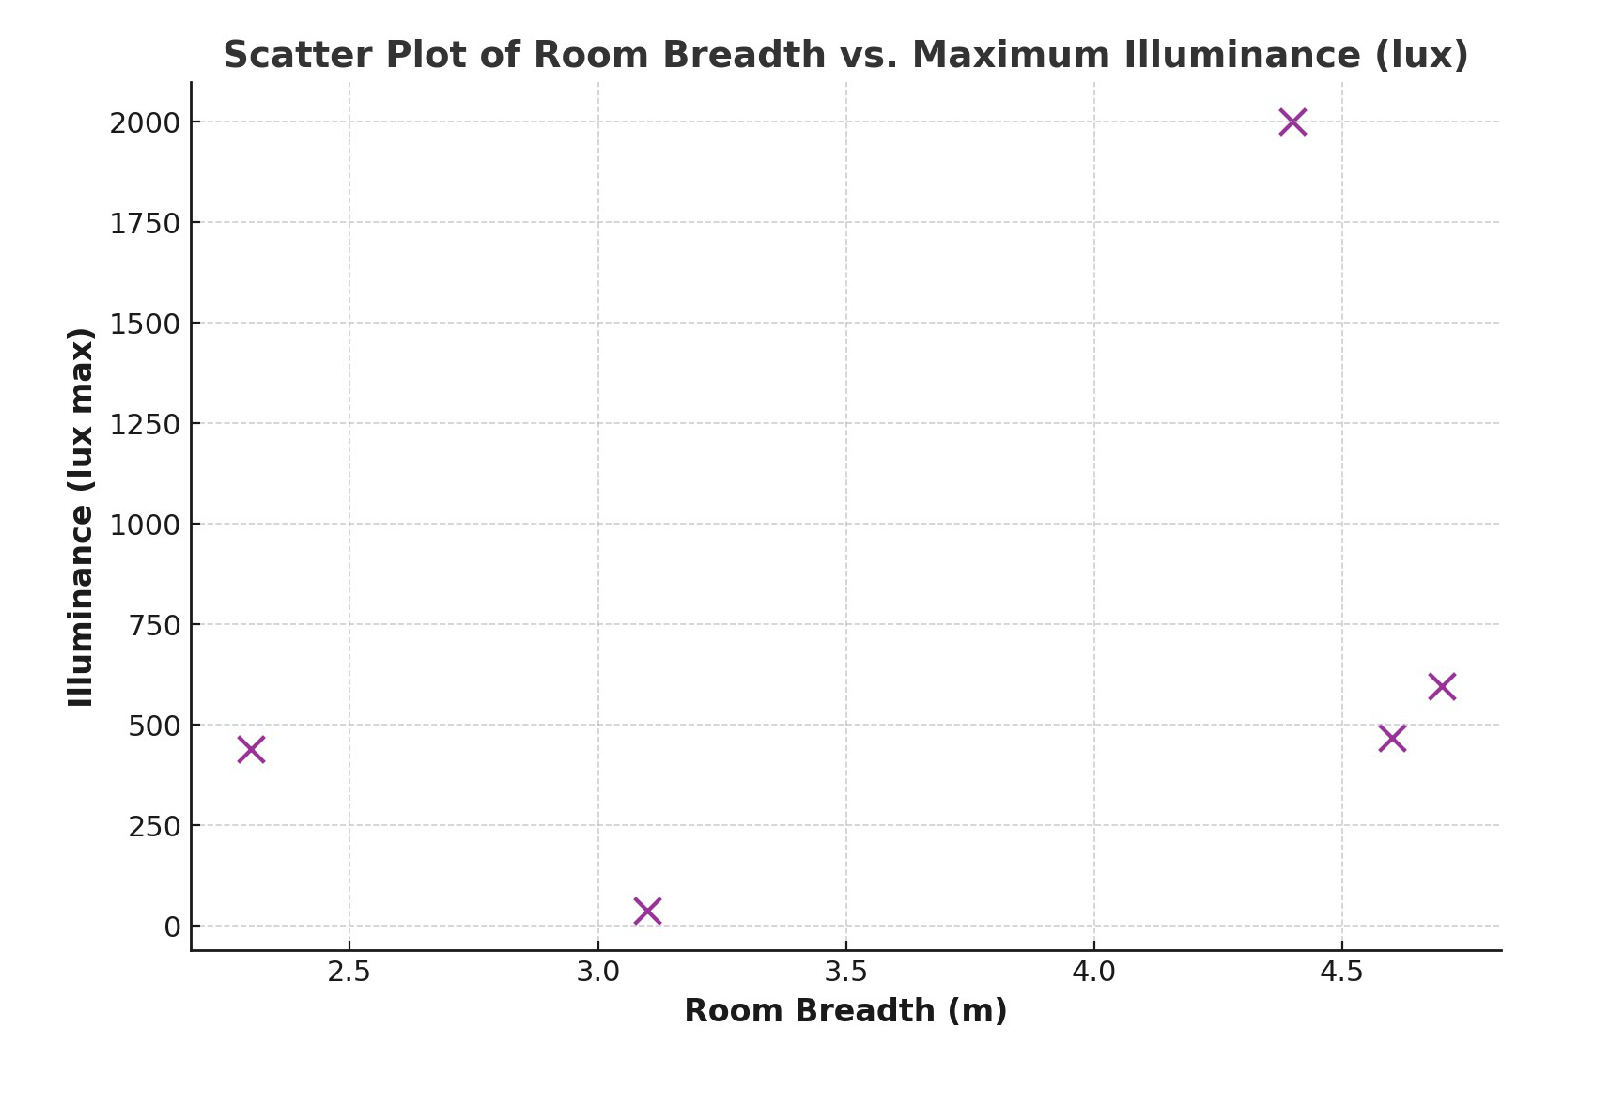
| Block | Class | Floor | Length (m) | Breadth (m) | Area (m2) | WWR (%) | Illuminance lux (min) | Illuminance lux (max) |
|---|---|---|---|---|---|---|---|---|
| North-south | 5 | First | 6.4 | 4.4 | 28.16 | 8% | 20 | 2000 |
| East-west | 7 | First | 4.8 | 4.6 | 22.08 | 5% | 30 | 467 |
| East-west | 2 | Ground | 4.7 | 4.7 | 22.09 | 7% | 20 | 596 |
| North-south | 3 | Ground | 4.4 | 3.1 | 13.64 | 8% | 15 | 37 |
| North-south | 4 | Ground | 4.5 | 2.3 | 10.35 | 11% | 60 | 440 |
Disclaimer/Publisher’s Note: The statements, opinions and data contained in all publications are solely those of the individual author(s) and contributor(s) and not of MDPI and/or the editor(s). MDPI and/or the editor(s) disclaim responsibility for any injury to people or property resulting from any ideas, methods, instructions or products referred to in the content. |
© 2025 by the authors. Licensee MDPI, Basel, Switzerland. This article is an open access article distributed under the terms and conditions of the Creative Commons Attribution (CC BY) license (http://creativecommons.org/licenses/by/4.0/).


