Submitted:
18 February 2025
Posted:
19 February 2025
You are already at the latest version
Abstract
Understanding how woody plants cope with severe water shortages is critical, espe-cially for regions where droughts are becoming more frequent and intense. We studied the effects of drought intensity, focusing on post-drought resprouting, autumn leaf se-nescence and the subsequent spring bud burst. Furthermore, we aimed to study popu-lation differentiation in the drought and post-drought responses. We performed a summer dry-out experiment in a common garden of potted Prunus spinosa L. (Rosaceae) saplings. We looked at the responses in different visual stress symptom categories and at provenance differentiation between a local (Western Europe), a more southern and a more northern provenance. The chance on post-drought resprouting was larger for the more severely affected plants, and the timing of resprouting was earlier than for the less severely affected ones. The plants that displayed wilting of the leaves during the drought had a leaf senescence 2.7 days earlier than the controls, whereas plants with 25 to 75% and more than 75% of desiccated leaves were 7 and 15 days later, respectively. During the drought, the local provenance was the first to de-velop visual symptoms. Still, for the plants with no to mild symptoms due to the drought, this provenance displayed a larger chance for post-drought resprouting. Among the control plants, the northern provenance was earlier, and the southern was later in leaf senescence compared to the local provenance. This differentiation disap-peared for the plants with more than 25% of desiccated leaves due to the drought. Whereas leaf senescence could be earlier or later depending on the developed drought symptoms, the timing of bud burst was only delayed. Results indicate that resprouting and timing of leaf senescence are responsive to the severity of the experienced drought in a provenance dependent way.
Keywords:
water limitation
; dry-out experiment
; black thorn
; leaf discoloration
; recovery
; phenology
; bud burst
; provenance trial
1. Introduction
Forests are essential to hydrological and biogeochemical cycles, providing numerous ecosystem services vital for biodiversity conservation [1,2]. The rise in extreme weather events like droughts and heatwaves due to climate change may lead to higher tree mortality rates, potentially causing a net release of CO2 in the atmosphere. Among these extreme events, drought and its related disturbances have the greatest global impact on forests [3,4]. Drought is expected to increase in frequency and severity in many regions in the future resulting from global climate change [5,6]. Trees may not be able to adapt in time to increases in aridity through evolutionary mechanisms due to their long reproductive life cycles and limited capacity to move away from stressful environments. The imminent threat of extended and more severe droughts underscores the need to study drought effects on woody plants [4,6].
During water limitation, plants eventually undergo desiccation, leading to a decrease in cell turgor pressure and causing the stomatal pores on leaf surfaces to close. This closure significantly slows down the dehydration process [7]. Wilting of the leaves and the loss of stem conductivity occur when drought stress becomes severe [8,9]. In trees, stomata generally close prior to the development of cavitation in the hydraulic conduit system, despite the negative impacts of stomatal closure, specifically lowered carbon assimilation [10]. After stomatal closure, further water loss can still happen through the cuticula, stomatal leakiness, and through the bark [10].The light-harvesting capacity of leaf photosynthesis is damaged only after a significant loss of hydraulic function under prolonged dehydration [11]. During extreme drought, leaf shedding is an adaptive strategy to enhance survival chances [12,13]. Typically, leaf shedding occurs after stomatal closure [10], with xylem embolism in the leaves being a primary cause of leaf mortality during drought [14,15,16]. The shedding reduces the evaporative leaf surface area, helping woody perennials delay cavitation in stem conductive tissues [17]. However, shedding leaves without fully resorbing the nutrients results in net nutrient loss, which can influence the functioning of the tree in the long run [17]. Recovery and restoration of a damaged crown after a severe drought involves, amongst others, supplementary carbon investment, either from non-structural carbohydrate reserves or through the assimilation in residual or newly post-drought developed leaves [18].
While much focus has been placed on understanding the physiological aspects contributing to drought-induced tree mortality, it is likewise crucial to comprehend the mechanisms that are involved in drought recovery. Resilience to dehydration can be evaluated by examining both the impact of the drought and the rate of post-drought recovery [19]. If cavitation of the conducting tissues is minimal or non-existent, recovery after re-watering is swift, with stomata reopening and allowing new carbon to be assimilated [18]. Though, if cavitation thresholds are surpassed, recovery of photosynthesis is slower [18]. Many plant species can resprout vegetatively after substantial biomass loss caused by environmental stress, including drought [18]. In woody plants, the resprouting response to disturbances has been defined in two ways: binary or continuous [20,21]. In a binary framework, a plant either dies or resprouts and survives. A continuous framework defines the resprouting response as a spectrum, ranging from weak to strong reactions to the disturbance. This response can vary within an individual or within a population, depending on the severity and frequency of the disturbance [21,22]. Quite evidently, plants require adequate storage reserves to resprout after the loss of shoots and foliage. These reserves include non-structural carbohydrates stored in roots and stems [23,24].
Senescence is the final stage in the life cycle of leaves, and in deciduous woody species it signals the transition from the active to the dormant stage [13,25]. It marks a shift from nutrient assimilation to nutrient remobilization, which is vital for plant fitness [13]. This involves a gradual and coordinated disassembly of macromolecules, leading to nutrient accumulation, which is then mobilized away from the senescing leaves [26]. When leaves get older, they become more permissive to the induction of senescence and at the same time remain competent for perceiving senescence-delaying or -reverting signals [27]. Leaf senescence is governed by complex genetic programs, finely regulated at multiple levels [26,28] and is influenced by various environmental stresses [13,29]. Literature provides mixed reports on whether drought stress leads to earlier, later, or unchanged timings of autumn leaf senescence, which complicates our understanding of its effects. Drought stress can advance leaf senescence [25,30]. This is supported by observations of early leaf abscission due to hydraulic failure in response to drought [13]. Other studies report that drought stress can delay autumn leaf senescence [31,32]. No difference in timing of leaf senescence upon drought stress has also been reported [29].
In this study, we carried out a controlled experiment in greenhouse conditions to assess the effects of drought. The experiment was performed with three provenances of Prunus spinosa L. (Rosaceae) in a common garden setting. P. spinosa, commonly known as blackthorn or sloe, is a deciduous thorny shrub with small, oval, serrated leaves and dark blue-black fruits called sloes. It blooms in early spring with white flowers before leaf emergence and is known for its dense growth, providing habitat and food for wildlife [33]. P. spinosa is a deciduous and widespread shrub species in Central and Southern Europe reaching up to Western Asia [33]. It is found in forest margins, wooded banks and hedgerows, prefers sunny and open spaces, and is adaptable to different soil conditions [33]. In Belgium it is often planted for species diversity, restoration of historical landscapes and to support wildlife [34]. P. spinosa is a widespread shrub species, but it has received little attention in scientific research on woody species due to its lack of economic value. Still, some studies have emphasized key characteristics of the species regarding its morphology and genetics [35,36,37] Understanding its drought tolerance can inform conservation strategies aimed at maintaining biodiversity and ecosystem services in increasingly drought prone environments. In addition, within species, responses to drought are not necessarily similar for different populations originating from diverse geographic origins, and a better knowledge on population differentiation in drought responses can help decisions on assisted migration as an anticipation to the climate change.
Potted saplings were subjected to water deprivation during the summer of 2021, followed by rewatering. We hypothesized that the responses to the water with-holding would be affected by (i) the severity of the drought and (ii) by the provenance of the saplings. Our main objective was to gain more understanding of the post-drought recovery process, with a specific focus on the ability for post-drought resprouting and on the timing of leaf senescence. The common garden allowed the assessment of the variability in responses among the different provenances. We were able to relate visual symptoms of drought stress with post-drought responses. Most strikingly, leaf senescence was advanced or delayed depending on the severity of the drought stress. We also observed population differentiation in the drought responses.
2. Results
2.1. Initial Traits
At the start of the treatment plants from the Belgian provenance were the highest and also displayed the largest diameter compared to the other two provenances (Table 1, Figure 1a,b). Also, plants from the Belgian provenance were characterized by relatively larger leaves. Long shoot leaves from the Belgian provenance were larger (length and widest width) than from the Spanish-Pyrenean, whereas the short shoot leaves from the Belgian provenance were longer than the Spanish-Pyrenean and wider than the Swedish provenance (Figure S1, Table S1). Stomatal density in the Belgian provenance did not differ from the other two provenances, nor did the stomatal length (Figure S2, Table S2).
2.2. Development of Visual Drought Symptoms
2.3. Post-Drought Resprouting
Some of the droughted plants resprouted after the rewatering whereas others did not. First, a model was run to examine the resprouting ability in the different levels of visual drought symptoms for all the droughted plants. Plants with desiccated leaves at the end of the drought period (<25%, 25 – 75% and > 75% of desiccated leaves) displayed a significantly higher chance for post-drought resprouting than the plants without visual drought symptoms (significant drought categories <25%, 25 – 75% and > 75% of desiccated leaves in Table 3). The modelled chance of resprouting for the plants in the category < 25% of desiccated leaves was in between the chances of normal plants and plants with more than 25% of desiccated leaves (Figure 3a).
Secondly, we looked at putative differences in the resprouting response among the plants of the three provenances. Modelling the plants with visual drought symptoms up to 25% of desiccated leaves (normal, wilting and <25% desiccated leaves) revealed that the chance to resprout was lower for the Spanish-Pyrenean and for the Swedish provenance compared to the Belgian one (significant provenances in Table 3, Figure 3b). Among the plants that displayed severe drought symptoms (25-75% and >75% of desiccated leaves) there was no significant difference anymore among the three provenances in modelled chance for post-drought resprouting (no significant values for the provenances in Table 3).
For the droughted plants that resprouted after the rewatering (n=64), the timing of resprouting was modelled. The first model focused on the different categories of visual drought symptoms. Because of the low number of plants in the categories with no to mild drought symptoms (score 1, 2 and 3), these were pooled, resulting in a visual drought symptoms variable with three levels: no to mild symptoms (n=9), 25-75% desiccated leaves (n=13) and more than 75% (n=42). The last two categories resprouted significantly earlier (significant categories for visual drought symptoms in Table 4, Figure 4a).
When looking at differentiation among the provenances for the timing of post-drought resprouting (Belgian n=38, Spanish-Pyrenean n=11, Swedish n=15) we could not take into account the different visual drought symptom categories in the model because of the low number of plants in each subgroup. No provenance differentiation was present (no significant provenances in Table 4).
2.4. Autumn leaf senescence
Timing of autumn leaf senescence was modelled for all the plants in the experiment. The first focus was to look for differentiation in responses among the control plants and the different categories of visual drought symptoms. The timing of leaf senescence was 2.7 days earlier for the droughted plants that displayed wilted leaves (score 2) in comparison to the control plants (significant categories of visual drought symptoms in Table 5, Figure 4b). Droughted plants with less than 25% of desiccated leaves (score 3) displayed no difference in timing compared to the control plants whereas the timing was 7 and 15 days later for the plants with more than 25% of desiccated leaves (scores 4 and 5 respectively) (significant categories of visual drought symptoms in Table 5, Figure 4b). Finally, droughted plants without visual stress symptoms (score 1) did not differ from the control plants.
Secondly, the timing of autumn leaf senescence was compared between the plants of the different provenances. For the control plants, the timing of leaf senescence in the Spanish-Pyrenean provenance was 2.6 days later than in the Belgian provenance, and it was 2.4 days earlier in the Swedish provenance (significant provenances in Table 5, Figure 5a). In the pooled categories of no to mild visual drought symptoms (scores 1, 2 and 3) in the drought treated plants, the timing for the Spanish-Pyrenean provenance was 4.7 days later than the Belgian provenance and there was a tendency (p-value = 0.051 in Table 5) for the Swedish provenance to be earlier (3.3 modelled days) (significant provenances in Table 5, Figure 5b). For the droughted plants that displayed severe symptoms (more than 25% of the leaves desiccated due to the drought: pooled scores 4 and 5) the timing of leaf senescence did not differ anymore among the three provenances (no significant provenances in Table 5, Figure 5c). Based on the models, the time span between no to mild (pooled scores 1, 2 and 3) and severe visual drought symptoms (pooled scores 4 and 5) was 16.2 days for the Swedish provenance, 14.4 days for the Belgian and 11.5 days for the Spanish-Pyrenean provenance.
The relative chlorophyll content in a subset of control plants was compared with a subset of severely affected plants (plants that lost more than a quarter of their foliage due to the drought). In both groups the relative chlorophyl content decreased, but it decreased at a faster rate in the control group than in the group of severely affected plants (significant interaction term between the time variable and the drought variable in Table 6, Figure 6), corroborating the results of the leaf senescence scores, with plants that had more than 25% of their leaves desiccated due to the drought, senescing significantly later than the control plants.
2.5. Timing of Bud Burst
In the year following the treatment, the plants that displayed wilting and desiccation in less than 25% of the leaves, as well as the plants with more severe visual drought symptoms (>75% desiccated leaves) were characterized by a delayed bud burst (significant categories of visual drought symptoms in Table 7, Figure 7). The group of plants that displayed an earlier leaf senescence (wilting of the leaves during the drought), the intermediate group that did not deviate in leaf senescence from the controls (<25% desiccated leaves), and one of the groups that showed a later senescence (>75% desiccated leaves), were all characterised by a significantly later bud burst (Table 8).
For the timing of bud burst among the plants from the different provenances, the dataset was split into the same three groups as for the timing of leaf senescence. The Swedish provenance burst its buds later than the Belgian provenance in all the three datasets (significant provenances in Table 7, Figure S3).
3. Discussion
3.1. Post-Drought Resprouting
Woody plants can experience significant damage to their foliage during severe drought conditions. However, many species have the ability to recover and produce new foliage after the drought has ended. Non-structural carbohydrates stored in stems and roots are used to produce the new shoots and leaves. Our study species, P. spinosa, was already shown to hold the capacity for resprouting after severe loss of above ground biomass by burning or cutting [38]. In our experiment, treated plants displayed a higher chance on post-drought resprouting when the severity of the drought had caused leaf desiccation, with the highest chance for the more severely affected plants. When stress severity increases, particularly after critical levels are reached such as cavitation thresholds during drought, the cost for carbon needed to reestablish functionality upon stress release also rises [39]. Resprouting may deplete carbohydrate reserves [24,40] when non-structural carbohydrates stored in stems and roots are used to produce the new shoots and leaves [39]. This seems to contradict with the earlier onset of resprouting in the most severely affected plants in our experiment. Most probably, this quick reaction underpins the urge with which these most severely affected plants need the newly formed foliage to maximise their chances on survival. This may come at a higher risk of finally dying off when a new drought or other types of stress, such as an early autumn frost, may occur.
Plants from the local provenance were the first to exhibit visual drought symptoms during the water withholding period, possibly partly governed by larger leaves and thus likely a larger transpiration area. At the interspecies level, large leaved species occupy in general rather wet and hot environments whereas small leaves are found more at higher latitudes and higher elevations [41]. This general rule may hold true intra-specifically [42,43], explaining the smaller leaves which could have contributed to the later onset of drought symptoms in the non-local provenances. Interestingly, the local provenance also exhibited a higher chance on post-drought resprouting when comparing groups with equal visual drought symptoms, suggesting that this provenance is not only characterized by a higher vulnerability to sudden and severe drought but also by a stronger resprouting response to recover from it.
3.2. Advancement or Delay of Autumn Leaf Senescence
In our common garden, we observed in the drought treated plants that the timing of leaf senescence ranged from earlier to later when compared to the controls. A similar “two strategies” response was already described for another common shrub Cornus sanguinea L. [44]. Droughted plants of C. sanguinea without visual stress symptoms or with desiccation of up to 25% of the foliage exhibited earlier leaf senescence compared to the control group, while heavily affected plants with more than 75% of desiccated leaves were delayed [44]. The intermediate group (26% to 75% desiccated leaves) did not differ from the controls [44]. Our results for P. spinosa are very similar albeit with a shift in visual stress symptoms caused by the drought for a comparable advancement or delay in leaf senescence timing. In P. spinosa, wilting symptoms correlated with the advancement of leaf senescence, whereas the group of less than 25% of desiccated leaves did not differ from the controls, and the group of more than 25% of desiccated leaves already delayed leaf senescence. Also similar to C. sanguinea, the more severely affected plants displayed a larger delay in leaf senescence timing. The later senescence in the group of plants with more than a quarter of their foliage desiccated by the drought was corroborated by relative chlorophyll content measurements.
An earlier leaf senescence is a well-known response to drought [13,30,45]. Although global warming delays the autumn date of foliar senescence, warming-related drought may counteract this by causing earlier foliar senescence due to water limitation [46]. Post-drought advancement of leaf senescence timing allows the plants to avoid nutrient loss due to limited resorption from desiccating leaves during a potential future drought [17]. Interesting to note is that the earlier senescence in our study concurred with the wilting of the leaves during the preceding drought. As leaf desiccation is related with hydraulic failure in the vascular tissue of the leaf [10], this may imply that turgor loss but not yet harm to the conductive tissues of the leaves produced the signals for the observed advancement. Abscisic acid is the well-studied signalling molecule that effects stomatal closure during drought [47], but does not directly induce earlier autumn leaf senescence [48]. Possibly, the accumulation of Reactive Oxygen Species, also an early response upon drought that leads to the closure of stomata [49], may have induced the advancement of autumn leaf senescence [50].
After severe drought stress, the demand for carbon increases to restore hydraulic conductivity [39], likely compelling plants to delay leaf senescence. This strategy, however, comes with increased risks, including higher mortality if new drought events would occur and greater susceptibility to injury from early autumn frosts [25]. Since mortality is associated with critical hydraulic failure [51], the risky delayed leaf senescence might represent a last effort to survive. A delay in leaf senescence following drought has been previously reported in Fagus sylvatica L. [52] and Quercus petraea (Matt.) Liebl. [31]. In drought experiments on F. sylvatica, increased photosynthesis was detected after drought release [52,53]. Similar to C. sanguinea [44], a group of droughted plants with intermediate visual drought symptoms (desiccated leaves up to 25%) did not deviate in timing of leaf senescence with the control group. It can be hypothesised that the two contrasting responses, earlier and later leaf senescence, cancel each other out.
Interestingly, the differentiation among the three provenances in timing of leaf senescence differed among the treatment groups. Whereas for the control plants leaf senescence was later in the Spanish-Pyrenean provenance and earlier in the Swedish one, compared to the local Belgian, these differences disappeared among the plants heavily affected by the drought, that senesced later. The synchronisation of this phenophase among the provenances in the severely affected plants may suggest that the signals for the onset and progression of leaf senescence are both genetically and environmentally controlled, showing a classic example of phenotypic plasticity with an environmental threshold that exceeds and dilutes the genetic pattern [54]. The foliage of the severely affected plants in our experiment consisted of a certain amount of relatively young, post-drought newly formed leaves. Because leaf senescence is initiated by leaf aging [27] this could, at least partly, explain the delay in leaf senescence. Additionally, it cannot be excluded that the later the leaf senescence occurs, the more the differentiation among the provenances fades due to altered environmental conditions such as photoperiod and temperature [54]. From repeated provenance trials at different geographic locations it is known that phenological behaviour of provenances is not only determined by genetic factors but also by the local conditions of the provenance trial [55,56]. Also, within one common garden, interannual differences in the timing of the phenophases among the provenances can vary due to different environmental conditions [57].
3.2. Bud Burst in the Year Following the Drought Treatment
Another interesting effect was observed in the phenological trait bud burst in the year following the treatments. A delay in bud burst timing, or no difference, was noticed when comparing the drought treated groups with the controls, but no advancement.. It can be hypothesised that the levels of non-structural carbohydrates contribute to these results. Post-drought repair of embolism in the conductive tissue positively correlated to stem non-structural carbohydrate depletion due to the drought, with the magnitude of hydraulic recovery positively correlating to the consumption of soluble sugars [58]. Also, a hampered build-up of non-structural carbohydrates in autumn due to defoliation can lead to a delayed bud burst in the next spring [59]. In our experiment, it could be postulated that the post-drought non-structural carbohydrate stores were possibly lowered both in the earlier senescing group of plants, because the growing season ended earlier, as in the later senescing group of plants, because resources were likely consumed in the repair of the hydraulic system, a process supported by the extended photosynthesis in later senescing leaves but not sufficient to bring the levels up to that of the control plants. Following this reasoning, this would imply that the treatment group with one to three quarters of desiccated leaves due to the drought, that did not deviate from the controls in timing of bud burst, succeeded in a build-up of non-structural carbohydrates up to the level of the controls, likely helped by the prolonged photosynthesis in the preceding autumn. This hypothesis is supported by the recently observed strong relation between the levels of non-structural carbohydrates and the timing of bud burst in spring [60].
Similar as previously reported, the control plants of the more Northernly originating Swedish provenance displayed both a later bud burst and an earlier leaf senescence when compared to the local provenance, indicating an adaptation to the shorter growing seasons at higher latitudes [61]. Control plants from the Spanish-Pyrenean provenance only displayed a later leaf senescence but no differentiation in bud burst (lower latitude but also higher altitude). Whereas the population differentiation in timing of leaf senescence disappeared for the plants that were more heavily affected by the drought, this phenomenon was not observed in the subsequent bud burst.
4. Materials and Methods
4.1. Plant Material
We established a common garden of potted plants that consisted of 274 P. spinosa plants derived from three provenances: 107 plants from a local Belgian provenance (Lat 50.953324, Lon 3.663467 and Alt 10m), 79 from a Spanish-Pyrenean provenance (Lat 42.630049, Lon -0.169068 and Alt 1270m) and 88 from a south Swedish provenance (Lat 55.67668, Lon 13.32481 and Alt 58m). Local climate, day length and also stone collection have been described before [61]. In short, drupes were picked in 2016 and the stones germinated in 2017. In this year, the seedlings grew in forestry trays (54.5 x 31cm with 28 cells) using normal nursery potting soil (1.5 kg/m³ NPK 12 + 14 + 24, 20% organic matter, pH levels from 5.0 to 6.5, electrical conductivity of 450 µS/cm, and 25% dry matter content). No extra fertilizer was mixed in the soil. In 2018 a temperature experiment was conducted on the seedlings and the effects of it were extinguished in 2020 [61]. At the end of 2018 the young plants were moved into 1 liter pots using the same soil type, and no extra nutrients was added. A common garden of the young plants was created on an outdoor container field at the Research Institute for Agriculture and Fisheries (Melle, Belgium). The plants were watered with automated sprinklers, which were watched by skilled technical personnel. The seedlings from the three provenances were intermingled in a single tree plot design. In the beginning of 2020, the plants were transferred to 4 liter pots, adding the same soil type without any extra fertilizer. The pots were again randomly intermingled and stayed on the container field throughout 2020 and into the beginning of 2021.
4.2. Drought Treatment
In mid-June 2021, we moved all the potted plants from the container field to a greenhouse. This greenhouse was equipped with an programmed shade net to protect the saplings from intense solar radiation. We conducted a dry-out experiment from June 29 to July 29. At the start and also at the end of the treatment, we fully hydrated all plants, including the controls, by placing the pots overnight in a water basin, while maintaining the water level at 5 cm above the base of the pots. Next morning, the excess of water was drained. By this, we could approach field capacity. From the start of the drought period, half of the plants received regular watering from experienced technicians to keep them well watered (control plants), while the other half received no water at all (droughted plants). The three provenances were evenly distributed between the control and drought group (Figure 8) and were randomly intermingled in each group. To prevent excessive mortality, the drought treatment was stopped when several plants showed (nearly) total leaf desiccation. By this point, various visual drought stress symptoms were evident in the drought treated plants (Figure 8).
After the treatment, the saplings were kept in a non-heated (but frost-free) greenhouse until January 2022, safeguarding they were constantly held under well-watered conditions. This was guaranteed by qualified technical employees. In January, the plants were then planted in an experimental field in Grimminge, Belgium. All treatment groups, as well as the provenances within each group, were randomly intermingled (single tree plot design).
4.3. Measurements and Observations
During and after the drought treatment, we performed various measurements and observations. All pots were weighted at the start of the treatment, after draining excess water (a proxy for field capacity), and about weekly thereafter during the treatment (Figure 9). The decrease in pot weight during the drought period was an indicator of the water scarcity experienced by the drought treated plants. The relative weight loss of the pots was calculated by subtracting the last weights from the initial weights at the beginning of the treatment and then dividing this difference by the initial weights.
Height and diameter were measured on all the plants (both control and drought treated) at the start of the treatment (June 29), and when plants had entered winter rest (November 16). Height of the saplings was measured up to the place where plants were still alive. The stem diameter was measured using a rod at 2 cm above the soil level.
We assessed the visual drought symptoms in the drought treated group, i.e., the wilting and desiccation of the leaves, on July 19, 22, 26 and 29, following a scoring protocol with 1: no visual drought stress symptoms, 2: leaves wilting but not yet desiccating, 3: < 25% of the leaves desiccated, 4: 25-75% of the leaves desiccated and 5: >75% of the leaves desiccated (Figure 8). Five plants that lost (nearly) all their leaves due to desiccation by the drought did not resprout after the rewatering and thus were not recorded in the leaf senescence scoring, but they did flush in the next spring (four Belgian and one Swedish). Three plants finally died off, two that lost more than 75% of their leaves due to the drought (both Belgian) and one with less than 25% desiccated leaves due to the drought (Swedish).
Plants in the drought treated group were scored for resprouting after the rewatering, following a scoring protocol with 1: buds not swelling, 2: buds swelling, 3: first leaves protruding but not yet unfolding, 4: first leaves unfolding, 5: first leaves unfolded but small, 6: first leaves clearly enlarging, 7: all new leaves on a plant enlarged. Resprouting was scored on August 3, 10 and 17. After august 17 no more plants started to resprout. A binary variable was deduced from the scorings on the last observation day (August 17) with 0: plants not resprouting (score 1) and 1: plants resprouting (scores > 1).
Autumn leaf senescence was scored applying a protocol with 1: green leaves, 2: light green leaves, 3: less than half of the leaves turning yellow, 4: more than half of the leaves yellowing, 5: all leaves yellow and starting to fall off [61]. This phenophase was recorded on September 21 and October 5 and 19. Bud burst in the spring of 2022 was evaluated applying a protocol with 1: winter rest, 2: buds swell, 3: buds open and first leaves protrude but do not yet unfold, 4: leaves unfold, 5: leaves unfolded and enlarged [61]. Bud burst was scored on April 7, 14 and 21. For both phenophases, the whole sapling (i.e., all buds or all non-desiccated leaves) was assessed and a mean score was assigned.
The relative chlorophyll content index in the leaves of a subset of plants was measured by making use of a chlorophyll content meter (CCM-200, Edaphic Scientific, Melbourne, Australia). The instrument determines the relative chlorophyll content of a leaf by calculating the ratio of optical transmission at 931 nm (near-infrared) to that at 653 nm (green). We focused on control plants at the one hand and plants that had reached severe visual drought symptoms during the drought period at the other hand. In the control group, 27 plants were chosen at random (10 Belgian, 9 Spanish-Pyrenean and 8 Swedish) and in the group of drought treated plants, 27 were chosen that displayed severe visual drought symptoms (3 with visual drought symptoms score 4 and 24 with score 5). Because more Belgian plants reached the highest score of visual drought symptoms, more Belgian plants were measured (19 Belgian, 3 Spanish-Pyrenean and 5 Swedish). In the middle of the young crown, a single mature and undamaged leaf that was representative to the plant, was carefully chosen for the measurement. Only leaves on short shoots were chosen. These leaves were indicated so that repeated measurements in time were made on the same leaves. Measurements were performed on September 21, October 5, October19 and November 2.
The leaf traits lamina length and lamina widest width were measured on the first fully developed and damage free leaf at the top of a representative long shoot at the top of the plant and on a fully developed leaf on a short shoot at the centre of the plant for all plants in the control group in the summer of 2021. For 57 randomly chosen plants (20 Belgian, 19 Spanish and 18 Swedish) in the control group, the stomatal density and stomatal length on the underside of the sampled leaves were counted and measured. A transparent nail varnish imprint was taken from the underside of the leaf at the centre of the leaf but avoiding the veins. These imprints were placed on microscope slides and examined using a Keyence VHX-7000 digital microscope (Keyence Corporation, Japan). In each nail varnish imprint two stomatal counts, each in a randomly chosen square of 0.0454 mm2, were performed. The lengths of five randomly selected stomata in each square were measured.
4.4. Statistical Analysis
We used the open-source statistical software R [62]. Linear models were applied to analyse height and diameter and their increments, and leaf and stomatal size measurements. Logistic regression models were applied for the post-drought resprouting [63]. For phenological observations (the timing of visual drought symptoms, timing of resprouting, timing of leaf senescence, and timing of bud burst), which were ordinal data, we utilized cumulative logistic regression with the ordinal package [64]. Figures were created using ggplot2 [65]. To account for repeated observations on the same plants, a unique plant identifier was included as a random effect. Mixed-effects modelling is particularly well-suited for analysing ecological data, as it can account for nested structures, handle unbalanced datasets, and incorporate random effects [66].
Height (Hei1) and diameter (Dia1) at the start of the treatment were modelled for all the plants, to detect initial growth variations between the provenances (Pro with Belgian, Spanish-Pyrenean and Swedish provenances):
Hei1= β0 + β1Pro
Dia1= β0 + β1Pro
The timing of the appearance of visual drought symptoms (Dro) in the drought treated group of plants was modelled using cumulative logistic regression, with pDro being the chance to have reached maximally a given drought score level, Day the day of observation, Pro the provenance, Rwe the relative weight loss of the pots and Hei1 the initial height.
(pDro/1 - pDro) = β0 - β1Day - β2Pro - β3Rwe - β4Hei1
For the drought treated plants, the chance to resprout after the rewatering (Res1) was modelled with logistic regression. For this, scorings of resprouting on the last observation day (August 17) were transformed to binary data (resprouting or not resprouting). The first model focussed on the influence of the visual drought symptoms (Dro):
(pRes1/1 - pRes1) = β0 + β1Dro + β2Hei1
When taking into account the provenance (Pro with Be: Belgian, Sp: Spanish-Pyrenean and Sw: Swedish) in the modelling of the post-drought resprouting (Res1Pro), some levels of visual drought symptoms were pooled to attain a higher number of plants for each provenance in each droughted group: Dro scores 1, 2 and 3 were pooled (no symptoms up to 25% of desiccated leaves, with nBe=14, nSp=31 and nSw=30), and also score 4 and 5 (more than 25% of desiccated leaves, with nBe=40, nSp=9 and nSw=15) were pooled. The dataset was split in two according to the two pooled levels of visual drought symptoms, to keep models as simple as possible. The two new datasets were used for modelling, applying the same model structure for both, with Hei1 the initial height:
(pRes1Pro/1 - pRes1Pro) = β0 + β1Pro + β2Hei1
For the droughted plants that recovered after rewatering by resprouting (n=64, Figure 8), the timing of the resprouting (Res2) was modelled using cumulative logistic regression. Because of the low number of resprouting plants in the different score levels of visual drought symptoms, the lower drought score levels were pooled so that three levels remained: no to mild symptoms with n=9 (pooled scores 1, 2 and 3), 25 to 75% desiccated leaves (score 4, n=13) and more than 75% (score 5, n=42). pRes2 was the chance to have maximally reached a given resprouting score (to have reached the given score or a score lower than this), Day the day of observation, Dro_adj the adjusted visual drought symptoms variable with pooled visual drought symptoms as described above, and Hei1 the initial height.
(pRes2/1 - pRes2)= β0 - β1Day - β2Dro_adj - β3Hei1
Because of the low number of plants for each provenance among the droughted plants that resprouted, the model for the timing of the resprouting (Res2Pro) containing the provenance (Pro) in the fixed part did not retain a visual drought symptoms variable:
(pRes2Pro/1- pRes2Pro)= β0 - β1Day - β2Pro - β3Hei1
The timing of leaf senescence in autumn (Sen) was modelled for controls and drought treated plants together, using cumulative logistic regression. Firstly, a model was run focussing on the different categories of visual drought symptoms. pSen was the chance to have maximally reached a given senescence score level on a given day, with Day the day of observation, Dro the control and the visual drought symptom groups and Hei2 the height at winter rest.
(pSen/1- pSen) = β0 - β1Day - β2Dro - β3Hei2
Secondly, the provenances were taken into account and again we had to take care of some drought categories with limited amount of plants for each provenance. Three datasets were constructed: one with the control plants, one with the pooled categories of no to mild visual drought symptoms (scores 1, 2 and 3) and one with the pooled categories of severe visual drought symptoms (scores 4 and 5). A model was run for each dataset to keep the models as simple as possible. pSenPro was the chance to have maximally reached a given senescence score level on the day of observation (Day), with Pro the provenance and Hei2 the plant height at winter rest. Three models were run with the following structure:
(pSenPro/1- pSenPro) = β0 - β1Day - β2Pro - β3Hei2
For all the leaf senescence models - the visual drought symptoms model and the provenance models - time spans were calculated between the different groups of drought categories or between the provenances based on the model statistics. The basic formula to calculate the day when 50% of the plants in a given group of plants had attained maximally a given leaf senescence score (D50%) was based on (pSen/1- pSen) being 0 for pSen = 0.5. Using the mean height at winter rest (mHei2):
D50% = (β0 - β2 - β3mHei2) / β1
Time spans for the timing of leaf senescence between two groups of plants (visual drought symptom groups or provenances) were calculated by subtracting the respective D50% values.
The relative chlorophyll content measurements of the leaves (RCC) were analysed to corroborate the autumnal leaf senescence scores for the plants that displayed severe visual drought symptoms. Because of too little measurements for every provenance separately, provenance was not taken into account in the model. Because the measurements were not linear over time, the time variable (Day) was quadratic in the model. Dro_adj2 was the variable indicating whether a plant belonged to the control group or to the group of plants that were severely affected by the drought (pooled Dro scores 4 and 5: >25% of the leaves desiccated). An interaction term between the time variable and this adjusted visual drought symptoms variable allowed the relative chlorophyll content index to diminish over time at a different rate for the different levels in the Dro_adj2 variable.
RCC = β0 + β1Day + β2 Day2 + β3Dro_adj2 + β4Day:Dro_adj2 + β5Day2:Dro_adj2
In the spring of the year after the drought treatment, bud burst (Bud) was scored on all the plants, both controls and drought treated. We modelled the probability (pBud) that on a given day a sapling had already reached a given bud burst score, or a score higher than this. First we focussed on the different visual drought symptom categories. Day was the day of observation, Dro consisted of the controls and the different levels of visual drought symptoms and Hei2 was the height at the end of the growing season.
(pBud/1 - pBud) = β0 - β1Day - β2Dro - β3Hei2
Similar as for the timing of leaf senescence, the timing of bud burst in the three provenances (pBudPro) was studied in three subdatasets: controls, mild visual drought symptoms (pooled scores 1, 2 and 3) and severe visual drought symptoms (pooled scores 4 and 5), with the following model structure:
(pBudPro/1 - pBudPro) = β0 - β1Day - β2Pro - β3Hei2
Leaf lamina length (Lle) and lamina widest width (Lww) were analysed using a linear model.
Lle = β0 + β1Pro
Lww = β0 + β1Pro
For stomatal length (Sle) a linear mixed model was applied to account for repeated measurements per plant.
Sle = β0 + β1Pro
Finally, for the stomatal density (Sde), a Poisson general linear mixed model was applied with a similar formula structure.
Sde = β0 + β1Pro
5. Conclusions
We related clear visual aspects of drought stress with variability in post-drought phenomena. Therefore, this experiment can be considered as a first logical step necessary for directing future research aiming to better comprehend underlying physiological, biochemical and molecular mechanisms that drive the observed results. We describe the dependence of post-drought recovery on the severity of the experienced drought. Strongly affected plants resprouted more but later than less affected ones. In addition, leaf senescence was advanced or delayed depending on the severity of the drought stress. We also show population differentiation in the drought responses. We saw a quicker appearance of stress symptoms during drought but also a higher chance on post-drought resprouting for the local provenance. Our results remain inconclusive in whether local populations could be more or less resilient in a changing climate with increasing intense drought periods.
Supplementary Materials
The following supporting information can be downloaded at the website of this paper posted on Preprints.org, Figure S1: Boxplots displaying the lamina length and lamina widest width of representative mature leaves on long shoots and short shoots of the control plants, according to their provenance. Be: Belgian, Sp: Spanish-Pyrenean, Sw: Swedish; Figure S2: Stomatal density (a) and stomatal length (b) of representative and mature long shoot leaves in the three provenances. Be: Belgian, Sp: Spanish-Pyrenean, Sw: Swedish; Figure S3: Modelled probability of the timing of bud burst for controls and for droughted plants (according to visual drought symptom categories), depending on the provenances. Provenances not significantly differing from the standard (Belgian) are displayed in grey; Table S1: Test statistics for the length and widest width of the lamina of mature leaves on long and short shoots of the control plants. The Belgian provenance is the standard to which the Spanish-Pyrenean (Sp) and the Swedish (Sw) provenances are compared to; Table S2: Test statistics for the density and the length of stomata of mature leaves on long shoots of the control plants. The Belgian provenance is the standard to which the Spanish-Pyrenean (Sp) and the Swedish (Sw) provenances are compared to.
Author Contributions
Conceptualization, K.V.M., E.N.P., K.V.C. and St.M.; methodology, K.V.M., E.N.P., D.B. and K.V.C.; investigation, D.B., Sh.M. and St.M.; validation, K.V.M.; formal analysis, K.V.M., D.B. and K.V.C.; data curation, D.B., K.V.M. and Sh.M.; writing—original draft preparation, D.B. and K.V.M.; writing—review and editing, D.B., K.V.M., K.V.C. and E.N.P.; supervision, K.V.C., K.V.M. and E.N.P. All authors have read and agreed to the published version of the manuscript.
Funding
This research received no external funding.
Data Availability Statement
Data are available at zenodo 10.5281/zenodo.13838214 (community: genfored)
Acknowledgments
We thank Mathieu Dolfyn for contributing significantly to the data acquisition. Marc Schouppe and Nico De Regge helped in taking care of the plants.
Conflicts of Interest
The authors declare no conflicts of interest.
References
- Bonan, G.B. Forests and climate change: forcings, feedbacks, and the climate benefits of forests. Science 2008, 320, 1444-1449, doi:10.1126/science.1155121. [CrossRef]
- Pan, Y.; Birdsey, R.A.; Fang, J.; Houghton, R.; Kauppi, P.E.; Kurz, W.A.; Phillips, O.L.; Shvidenko, A.; Lewis, S.L.; Canadell, J.G.; et al. A Large and Persistent Carbon Sink in the World’s Forests. Science 2011, 333, 988-993, doi:doi:10.1126/science.1201609. [CrossRef]
- Reichstein, M.; Bahn, M.; Ciais, P.; Frank, D.; Mahecha, M.D.; Seneviratne, S.I.; Zscheischler, J.; Beer, C.; Buchmann, N.; Frank, D.C.; et al. Climate extremes and the carbon cycle. Nature 2013, 500, 287-295, doi:10.1038/nature12350. [CrossRef]
- Choat, B.; Brodribb, T.J.; Brodersen, C.R.; Duursma, R.A.; López, R.; Medlyn, B.E. Triggers of tree mortality under drought. Nature 2018, 558, 531-539, doi:10.1038/s41586-018-0240-x. [CrossRef]
- Naumann, G.; Alfieri, L.; Wyser, K.; Mentaschi, L.; Betts, R.A.; Carrao, H.; Spinoni, J.; Vogt, J.; Feyen, L. Global Changes in Drought Conditions Under Different Levels of Warming. Geophysical Research Letters 2018, 45, 3285-3296, doi:https://doi.org/10.1002/2017GL076521. [CrossRef]
- Trenberth, K.E.; Dai, A.; van der Schrier, G.; Jones, P.D.; Barichivich, J.; Briffa, K.R.; Sheffield, J. Global warming and changes in drought. Nature Climate Change 2014, 4, 17-22, doi:10.1038/nclimate2067. [CrossRef]
- Blackman, C.J.; Brodribb, T.J.; Jordan, G.J. Leaf hydraulics and drought stress: response, recovery and survivorship in four woody temperate plant species. Plant Cell Environ 2009, 32, 1584-1595, doi:10.1111/j.1365-3040.2009.02023.x. [CrossRef]
- Bartlett, M.K.; Klein, T.; Jansen, S.; Choat, B.; Sack, L. The correlations and sequence of plant stomatal, hydraulic, and wilting responses to drought. Proc Natl Acad Sci U S A 2016, 113, 13098-13103, doi:10.1073/pnas.1604088113. [CrossRef]
- Martin-StPaul, N.; Delzon, S.; Cochard, H. Plant resistance to drought depends on timely stomatal closure. Ecology Letters 2017, 20, 1437-1447, doi:https://doi.org/10.1111/ele.12851. [CrossRef]
- Blackman, C.J.; Creek, D.; Maier, C.; Aspinwall, M.J.; Drake, J.E.; Pfautsch, S.; O’Grady, A.; Delzon, S.; Medlyn, B.E.; Tissue, D.T.; et al. Drought response strategies and hydraulic traits contribute to mechanistic understanding of plant dry-down to hydraulic failure. Tree Physiology 2019, 39, 910-924, doi:10.1093/treephys/tpz016. [CrossRef]
- Trueba, S.; Pan, R.; Scoffoni, C.; John, G.P.; Davis, S.D.; Sack, L. Thresholds for leaf damage due to dehydration: declines of hydraulic function, stomatal conductance and cellular integrity precede those for photochemistry. New Phytologist 2019, 223, 134-149, doi:https://doi.org/10.1111/nph.15779. [CrossRef]
- Nadal-Sala, D.; Grote, R.; Birami, B.; Knüver, T.; Rehschuh, R.; Schwarz, S.; Ruehr, N.K. Leaf Shedding and Non-Stomatal Limitations of Photosynthesis Mitigate Hydraulic Conductance Losses in Scots Pine Saplings During Severe Drought Stress. Front Plant Sci 2021, 12, 715127, doi:10.3389/fpls.2021.715127. [CrossRef]
- Munne-Bosch, S.; Alegre, L. Die and let live: leaf senescence contributes to plant survival under drought stress. Funct Plant Biol 2004, 31, 203-216, doi:10.1071/FP03236. [CrossRef]
- Wolfe, B.T.; Sperry, J.S.; Kursar, T.A. Does leaf shedding protect stems from cavitation during seasonal droughts? A test of the hydraulic fuse hypothesis. New Phytologist 2016, 212, 1007-1018, doi:https://doi.org/10.1111/nph.14087. [CrossRef]
- Hochberg, U.; Windt, C.W.; Ponomarenko, A.; Zhang, Y.-J.; Gersony, J.; Rockwell, F.E.; Holbrook, N.M. Stomatal Closure, Basal Leaf Embolism, and Shedding Protect the Hydraulic Integrity of Grape Stems Plant physiology 2017, 174, 764-775, doi:10.1104/pp.16.01816. [CrossRef]
- Vilagrosa, A.; Bellot, J.; Vallejo, V.R.; Gil-Pelegrin, E. Cavitation, stomatal conductance, and leaf dieback in seedlings of two co-occurring Mediterranean shrubs during an intense drought. J Exp Bot 2003, 54, 2015-2024, doi:10.1093/jxb/erg221. [CrossRef]
- Marchin, R.; Zeng, H.; Hoffmann, W. Drought-deciduous behavior reduces nutrient losses from temperate deciduous trees under severe drought. Oecologia 2010, 163, 845-854, doi:10.1007/s00442-010-1614-4. [CrossRef]
- Zeppel, M.J.B.; Harrison, S.P.; Adams, H.D.; Kelley, D.I.; Li, G.; Tissue, D.T.; Dawson, T.E.; Fensham, R.; Medlyn, B.E.; Palmer, A.; et al. Drought and resprouting plants. New Phytologist 2015, 206, 583-589, doi:https://doi.org/10.1111/nph.13205. [CrossRef]
- Ingrisch, J.; Bahn, M. Towards a Comparable Quantification of Resilience. Trends in ecology & evolution 2018, 33, 251-259, doi:10.1016/j.tree.2018.01.013. [CrossRef]
- Kenefick, C.; Livesley, S.; Farrell, C. A systematic review of resprouting in woody plants and potential implications for the management of urban plantings. Ecology and Evolution 2024, 14, e10839, doi:https://doi.org/10.1002/ece3.10839. [CrossRef]
- Bond, W.J.; Midgley, J.J. Ecology of sprouting in woody plants: the persistence niche. Trends in ecology & evolution 2001, 16, 45-51, doi:10.1016/S0169-5347(00)02033-4. [CrossRef]
- Vesk, P.A.; Westoby, M. Sprouting Ability across Diverse Disturbances and Vegetation Types Worldwide. Journal of Ecology 2004, 92, 310-320.
- Clarke, P.J.; Lawes, M.J.; Midgley, J.J.; Lamont, B.B.; Ojeda, F.; Burrows, G.E.; Enright, N.J.; Knox, K.J.E. Resprouting as a key functional trait: how buds, protection and resources drive persistence after fire. New Phytologist 2013, 197, 19-35, doi:https://doi.org/10.1111/nph.12001. [CrossRef]
- Piper, F.I.; Paula, S. The Role of Nonstructural Carbohydrates Storage in Forest Resilience under Climate Change. Current Forestry Reports 2020, 6, 1-13, doi:10.1007/s40725-019-00109-z. [CrossRef]
- Estiarte, M.; Peñuelas, J. Alteration of the phenology of leaf senescence and fall in winter deciduous species by climate change: effects on nutrient proficiency. Global Change Biology 2015, 21, 1005-1017, doi:https://doi.org/10.1111/gcb.12804. [CrossRef]
- Sasi, J.M.; Gupta, S.; Singh, A.; Kujur, A.; Agarwal, M.; Katiyar-Agarwal, S. Know when and how to die: gaining insights into the molecular regulation of leaf senescence. Physiology and Molecular Biology of Plants 2022, 28, 1515-1534, doi:10.1007/s12298-022-01224-1. [CrossRef]
- Schippers, J.H.; Schmidt, R.; Wagstaff, C.; Jing, H.-C. Living to die and dying to live: the survival strategy behind leaf senescence. Plant physiology 2015, 169, 914-930.
- Guo, Y.; Ren, G.; Zhang, K.; Li, Z.; Miao, Y.; Guo, H. Leaf senescence: progression, regulation, and application. Molecular Horticulture 2021, 1, 5, doi:10.1186/s43897-021-00006-9. [CrossRef]
- Mariën, B.; Dox, I.; De Boeck, H.J.; Willems, P.; Leys, S.; Papadimitriou, D.; Campioli, M. Does drought advance the onset of autumn leaf senescence in temperate deciduous forest trees? Biogeosciences 2021, 18, 3309-3330, doi:10.5194/bg-18-3309-2021. [CrossRef]
- Tan, S.; Sha, Y.; Sun, L.; Li, Z. Abiotic Stress-Induced Leaf Senescence: Regulatory Mechanisms and Application. Int J Mol Sci 2023, 24, doi:10.3390/ijms241511996. [CrossRef]
- Vander Mijnsbrugge, K.; Turcsan, A.; Maes, J.; Duchene, N.; Meeus, S.; Steppe, K.; Steenackers, M. Repeated Summer Drought and Re-watering during the First Growing Year of Oak (Quercus petraea) Delay Autumn Senescence and Bud Burst in the Following Spring. Frontiers in Plant Science 2016, 7, doi:10.3389/fpls.2016.00419. [CrossRef]
- Leuzinger, S.; Zotz, G.; Asshoff, R.; Körner, C. Responses of deciduous forest trees to severe drought in Central Europe. Tree Physiol 2005, 25, 641-650, doi:10.1093/treephys/25.6.641. [CrossRef]
- Popescu, I.; Caudullo, G. Prunus spinosa in Europe: distribution, habitat, usage and threats. 2016.
- Uyttenbroeck, R.; De Vos, B.; Vander Mijnsbrugge, K. Verspreiding en standplaats van inheemse bomen en struiken in Vlaanderen. INBO.R.2014.1388322; Research Institute of Nature and Forest: Brussels, Belgium, 2014.
- Mohanty, A.; Martín, J.P.; Aguinagalde, I. Population Genetic Analysis of European Prunus spinosa (Rosaceae) Using Chloroplast DNA Markers. American journal of botany 2002, 89, 1223-1228.
- Brown, J.A.; Montgomery, W.I.; Provan, J. Strong spatial structuring of clonal genetic diversity within blackthorn (Prunus spinosa) hedgerows and woodlands. Tree Genetics & Genomes 2022, 18, 5, doi:10.1007/s11295-022-01538-x. [CrossRef]
- Vander Mijnsbrugge, K.; Turcsán, A.; Depypere, L.; Steenackers, M. Variance, Genetic Control, and Spatial Phenotypic Plasticity of Morphological and Phenological Traits in Prunus spinosa and Its Large Fruited Forms (P. x fruticans). Front Plant Sci 2016, 7, 1641, doi:10.3389/fpls.2016.01641. [CrossRef]
- Michielsen, M.; Szemák, L.; Fenesi, A.; Nijs, I.; Ruprecht, E. Resprouting of woody species encroaching temperate European grasslands after cutting and burning. Applied Vegetation Science 2017, 20, 388–396.
- Ruehr, N.K.; Grote, R.; Mayr, S.; Arneth, A. Beyond the extreme: recovery of carbon and water relations in woody plants following heat and drought stress. Tree Physiol 2019, 39, 1285-1299, doi:10.1093/treephys/tpz032. [CrossRef]
- Pratt, R.B.; Jacobsen, A.L.; Ramirez, A.R.; Helms, A.M.; Traugh, C.A.; Tobin, M.F.; Heffner, M.S.; Davis, S.D. Mortality of resprouting chaparral shrubs after a fire and during a record drought: physiological mechanisms and demographic consequences. Glob Chang Biol 2014, 20, 893-907, doi:10.1111/gcb.12477. [CrossRef]
- Wright, I.J.; Dong, N.; Maire, V.; Prentice, I.C.; Westoby, M.; Díaz, S.; Gallagher, R.V.; Jacobs, B.F.; Kooyman, R.; Law, E.A.; et al. Global climatic drivers of leaf size. Science 2017, 357, 917-921, doi:doi:10.1126/science.aal4760. [CrossRef]
- Liu, W.; Zheng, L.; Qi, D. Variation in leaf traits at different altitudes reflects the adaptive strategy of plants to environmental changes. Ecol Evol 2020, 10, 8166-8175, doi:10.1002/ece3.6519. [CrossRef]
- Desmond, S.C.; Garner, M.; Flannery, S.; Whittemore, A.T.; Hipp, A.L. Leaf shape and size variation in bur oaks: an empirical study and simulation of sampling strategies. American journal of botany 2021, 108, 1540-1554, doi:https://doi.org/10.1002/ajb2.1705. [CrossRef]
- Vander Mijnsbrugge, K.; Vandepitte, J.; Moreels, S.; Mihaila, V.-V.; De Ligne, L.; Notivol, E.; Van Acker, J.; Van den Bulcke, J. Timing of autumnal leaf senescence in a common shrub species depends on the level of preceding summer drought symptoms. Environmental and Experimental Botany 2023, 216, 105539, doi:https://doi.org/10.1016/j.envexpbot.2023.105539. [CrossRef]
- Frei, E.R.; Gossner, M.M.; Vitasse, Y.; Queloz, V.; Dubach, V.; Gessler, A.; Ginzler, C.; Hagedorn, F.; Meusburger, K.; Moor, M.; et al. European beech dieback after premature leaf senescence during the 2018 drought in northern Switzerland. Plant biology (Stuttgart, Germany) 2022, 24, 1132-1145, doi:10.1111/plb.13467. [CrossRef]
- Wu, C.; Peng, J.; Ciais, P.; Peñuelas, J.; Wang, H.; Beguería, S.; Andrew Black, T.; Jassal, R.S.; Zhang, X.; Yuan, W.; et al. Increased drought effects on the phenology of autumn leaf senescence. Nature Climate Change 2022, 12, 943-949, doi:10.1038/s41558-022-01464-9. [CrossRef]
- Bharath, P.; Gahir, S.; Raghavendra, A.S. Abscisic Acid-Induced Stomatal Closure: An Important Component of Plant Defense Against Abiotic and Biotic Stress. Frontiers in Plant Science 2021, 12, doi:10.3389/fpls.2021.615114. [CrossRef]
- Kane, C.N.; McAdam, S.A.M. Abscisic acid can augment, but is not essential for, autumnal leaf senescence. Journal of Experimental Botany 2023, 74, 3255-3266, doi:10.1093/jxb/erad089. [CrossRef]
- Singh, R.; Parihar, P.; Singh, S.; Mishra, R.K.; Singh, V.P.; Prasad, S.M. Reactive oxygen species signaling and stomatal movement: Current updates and future perspectives. Redox biology 2017, 11, 213-218, doi:10.1016/j.redox.2016.11.006. [CrossRef]
- Lee, S.; Seo, P.J.; Lee, H.J.; Park, C.M. A NAC transcription factor NTL4 promotes reactive oxygen species production during drought-induced leaf senescence in Arabidopsis. The Plant journal : for cell and molecular biology 2012, 70, 831-844, doi:10.1111/j.1365-313X.2012.04932.x. [CrossRef]
- Mantova, M.; Herbette, S.; Cochard, H.; Torres-Ruiz, J.M. Hydraulic failure and tree mortality: from correlation to causation. Trends in Plant Science 2022, 27, 335-345, doi:10.1016/j.tplants.2021.10.003. [CrossRef]
- Arend, M.; Sever, K.; Pflug, E.; Gessler, A.; Schaub, M. Seasonal photosynthetic response of European beech to severe summer drought: Limitation, recovery and post-drought stimulation. Agricultural and Forest Meteorology 2016, 220, 83-89, doi:https://doi.org/10.1016/j.agrformet.2016.01.011. [CrossRef]
- Pflug, E.E.; Buchmann, N.; Siegwolf, R.T.W.; Schaub, M.; Rigling, A.; Arend, M. Resilient Leaf Physiological Response of European Beech (Fagus sylvatica L.) to Summer Drought and Drought Release. Frontiers in Plant Science 2018, 9, doi:10.3389/fpls.2018.00187. [CrossRef]
- Schlichting, C.D. Hidden reaction norms, cryptic genetic variation, and evolvability. Annals of the New York Academy of Sciences 2008, 1133, 187-203, doi:10.1196/annals.1438.010. [CrossRef]
- Wright, J.W.; Ivey, C.T.; Canning, C.; Sork, V.L. Timing of bud burst is associated with climate of maternal origin in Quercus lobata progeny in a common garden. Madroño 2021, 68, 443-449, 447.
- Vitasse, Y.; Hoch, G.; Randin, C.F.; Lenz, A.; Kollas, C.; Scheepens, J.F.; Körner, C. Elevational adaptation and plasticity in seedling phenology of temperate deciduous tree species. Oecologia 2013, 171, 663-678, doi:10.1007/s00442-012-2580-9. [CrossRef]
- Vander Mijnsbrugge, K.; Janssens, A. Differentiation and Non-Linear Responses in Temporal Phenotypic Plasticity of Seasonal Phenophases in a Common Garden of Crataegus monogyna Jacq. Forests 2019, 10, 293.
- Tomasella, M.; Petrussa, E.; Petruzzellis, F.; Nardini, A.; Casolo, V. The Possible Role of Non-Structural Carbohydrates in the Regulation of Tree Hydraulics. Int J Mol Sci 2019, 21, doi:10.3390/ijms21010144. [CrossRef]
- Amico Roxas, A.; Orozco, J.; Guzmán-Delgado, P.; Zwieniecki, M.A. Spring phenology is affected by fall non-structural carbohydrate concentration and winter sugar redistribution in three Mediterranean nut tree species. Tree Physiology 2021, 41, 1425-1438, doi:10.1093/treephys/tpab014. [CrossRef]
- Blumstein, M.; Oseguera, M.; Caso-McHugh, T.; Des Marais, D.L. Nonstructural carbohydrate dynamics’ relationship to leaf development under varying environments. New Phytologist 2024, 241, 102-113, doi:https://doi.org/10.1111/nph.19333. [CrossRef]
- Vander Mijnsbrugge, K.; Malanguis, J.M.; Moreels, S.; Turcsán, A.; Van der Schueren, N.; Notivol Paino, E. Direct Phenological Responses but Later Growth Stimulation upon Spring and Summer/Autumn Warming of Prunus spinosa L. in a Common Garden Environment. Forests 2022, 13, 23.
- R_Core_Team. R: A language and environment for statistical computing. R Foundation for Statistical Computing. 2022.
- Bates, D.; Machler, M.; Bolker, B.M.; Walker, S.C. Fitting Linear Mixed-Effects Models Using lme4. Journal of Statistical Software 2015, 67, 1-48.
- Christensen, R.H.B. Ordinal: regression models for ordinal data. R package version 2015.6-28. http://www.cran.r-project.org/package=ordinal/. 2015.
- Wickham, H. ggplot2: elegant graphics for data analysis; Springer-Verlag: New York, 2016.
- Zuur, A.; Ieno, E.; Walker, N.; Saveliev, A.; Smith, G. Mixed Effects Models and Extensions in Ecology with R; Springer New York: New York, 2009.
Figure 1.
Boxplots presenting the initial height (a) and diameter (b) of the saplings at the start of the treatment. Be: Belgian, Sp: Spanish-Pyrenean, Sw: Swedish.
Figure 1.
Boxplots presenting the initial height (a) and diameter (b) of the saplings at the start of the treatment. Be: Belgian, Sp: Spanish-Pyrenean, Sw: Swedish.

Figure 2.
Development of visual drought symptoms during the drought period in the three provenances. Normal: no visual drought symptoms, wilting: leaf wilting, <25%, 25-75% and >75%: percentage of desiccated leaves.
Figure 2.
Development of visual drought symptoms during the drought period in the three provenances. Normal: no visual drought symptoms, wilting: leaf wilting, <25%, 25-75% and >75%: percentage of desiccated leaves.
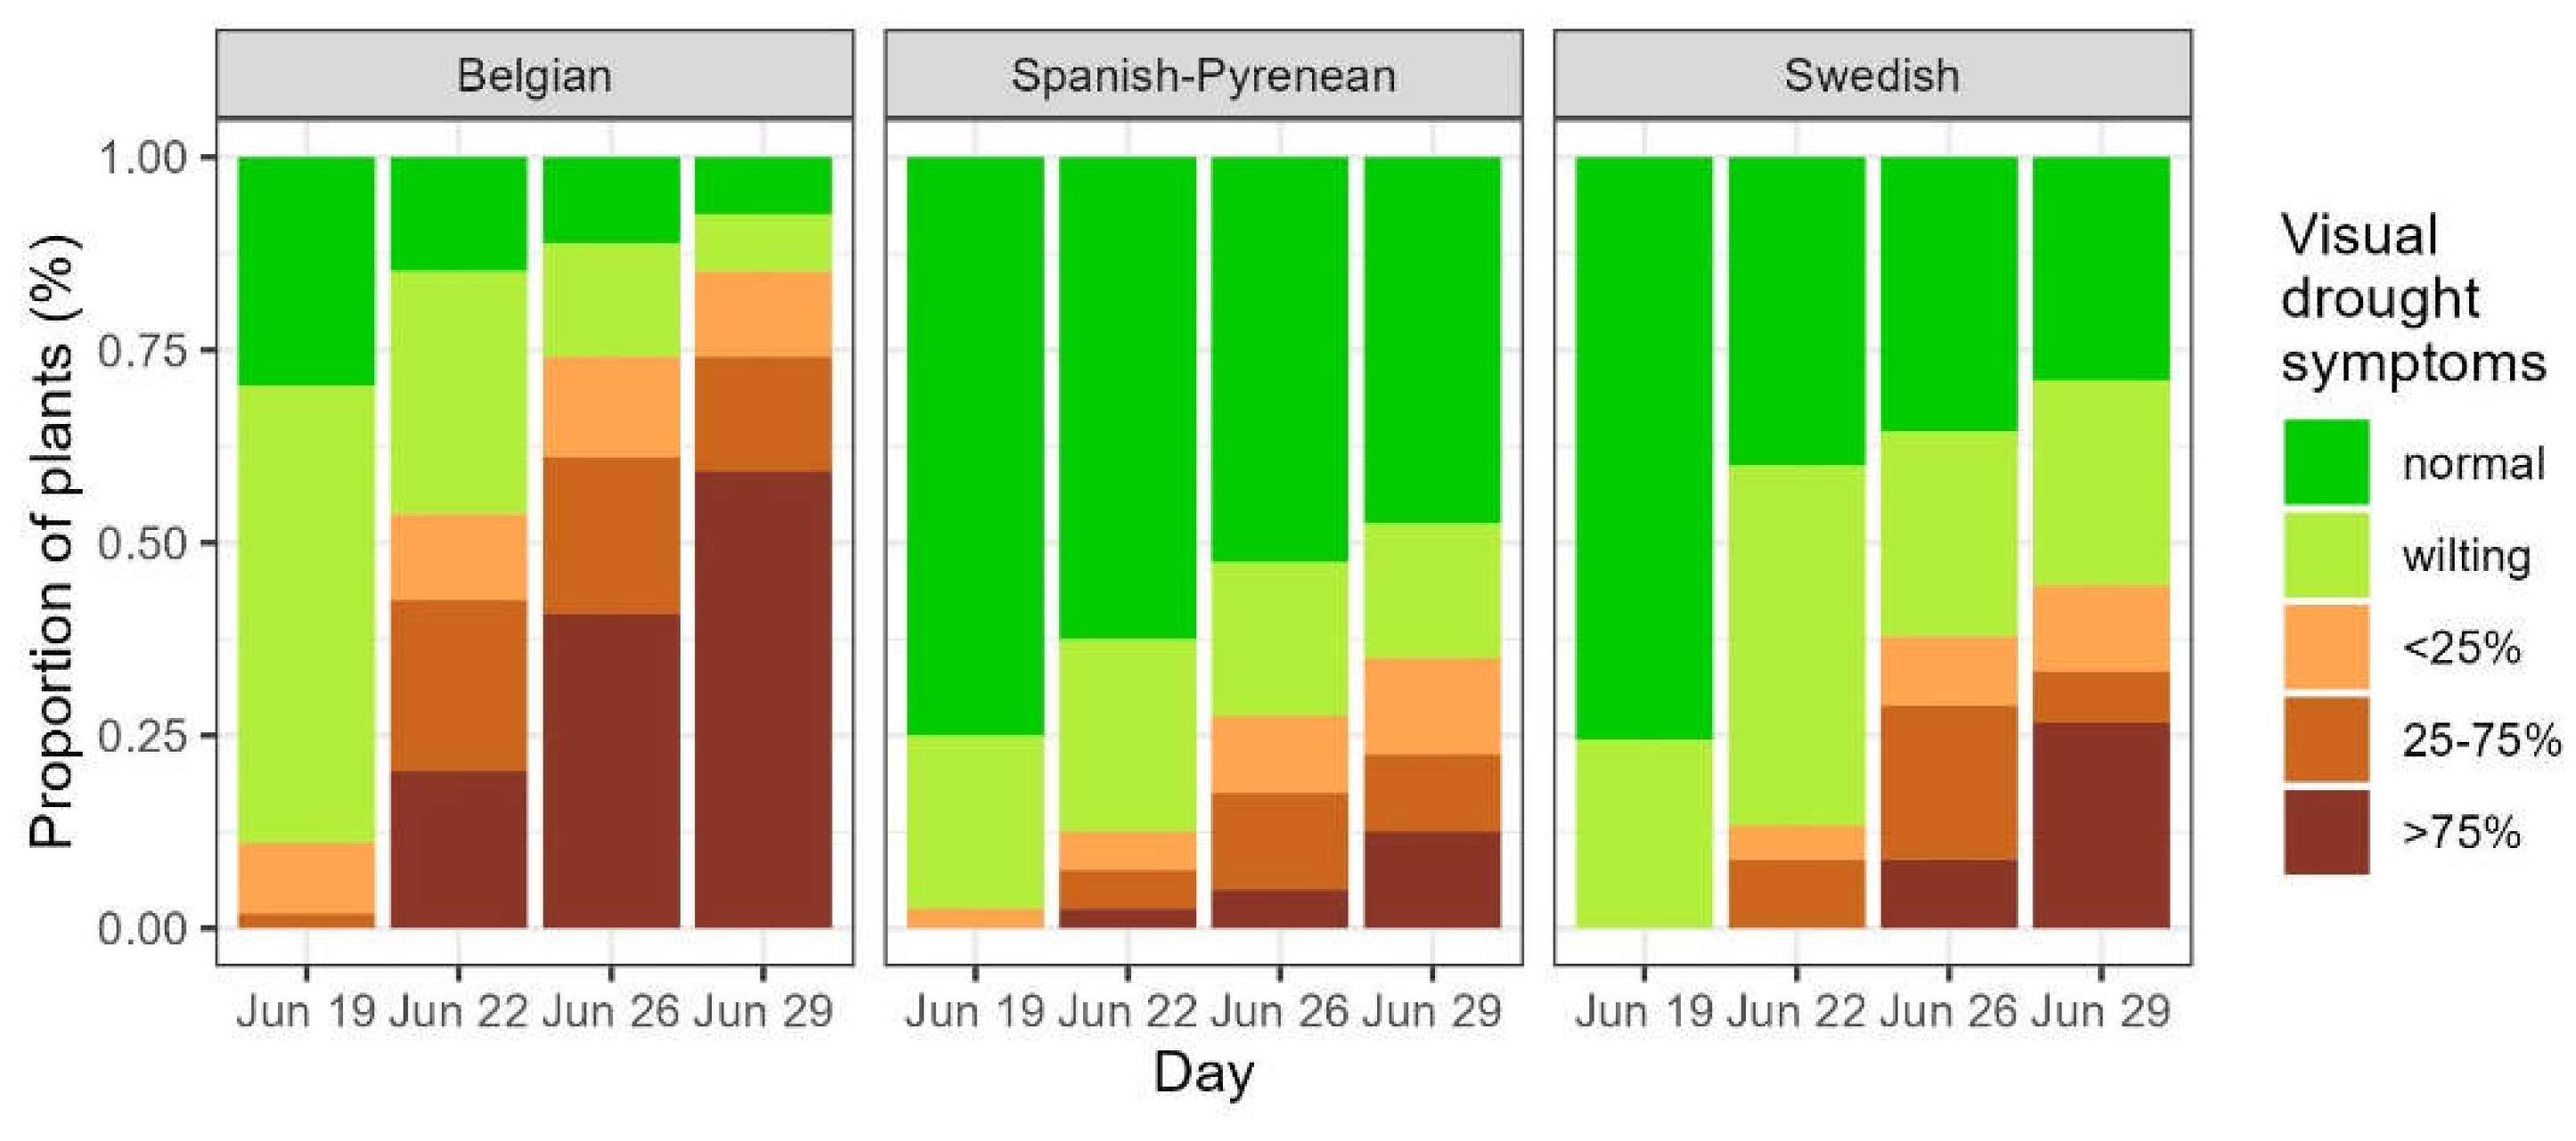
Figure 3.
Modelled probability of post-drought resprouting among the different categories of visual drought symptoms (a) and among the three provenances for the pooled visual drought categories normal, wilting leaves and <25% desiccated leaves (b). Normal: no visual drought symptoms, wilting: leaf wilting, <25%, 25-75% and >75%: percentage of desiccated leaves. Be: Belgian, Sp: Spanish-Pyrenean, Sw: Swedish. Categories not significantly differing from the standard (normal) are displayed in grey.
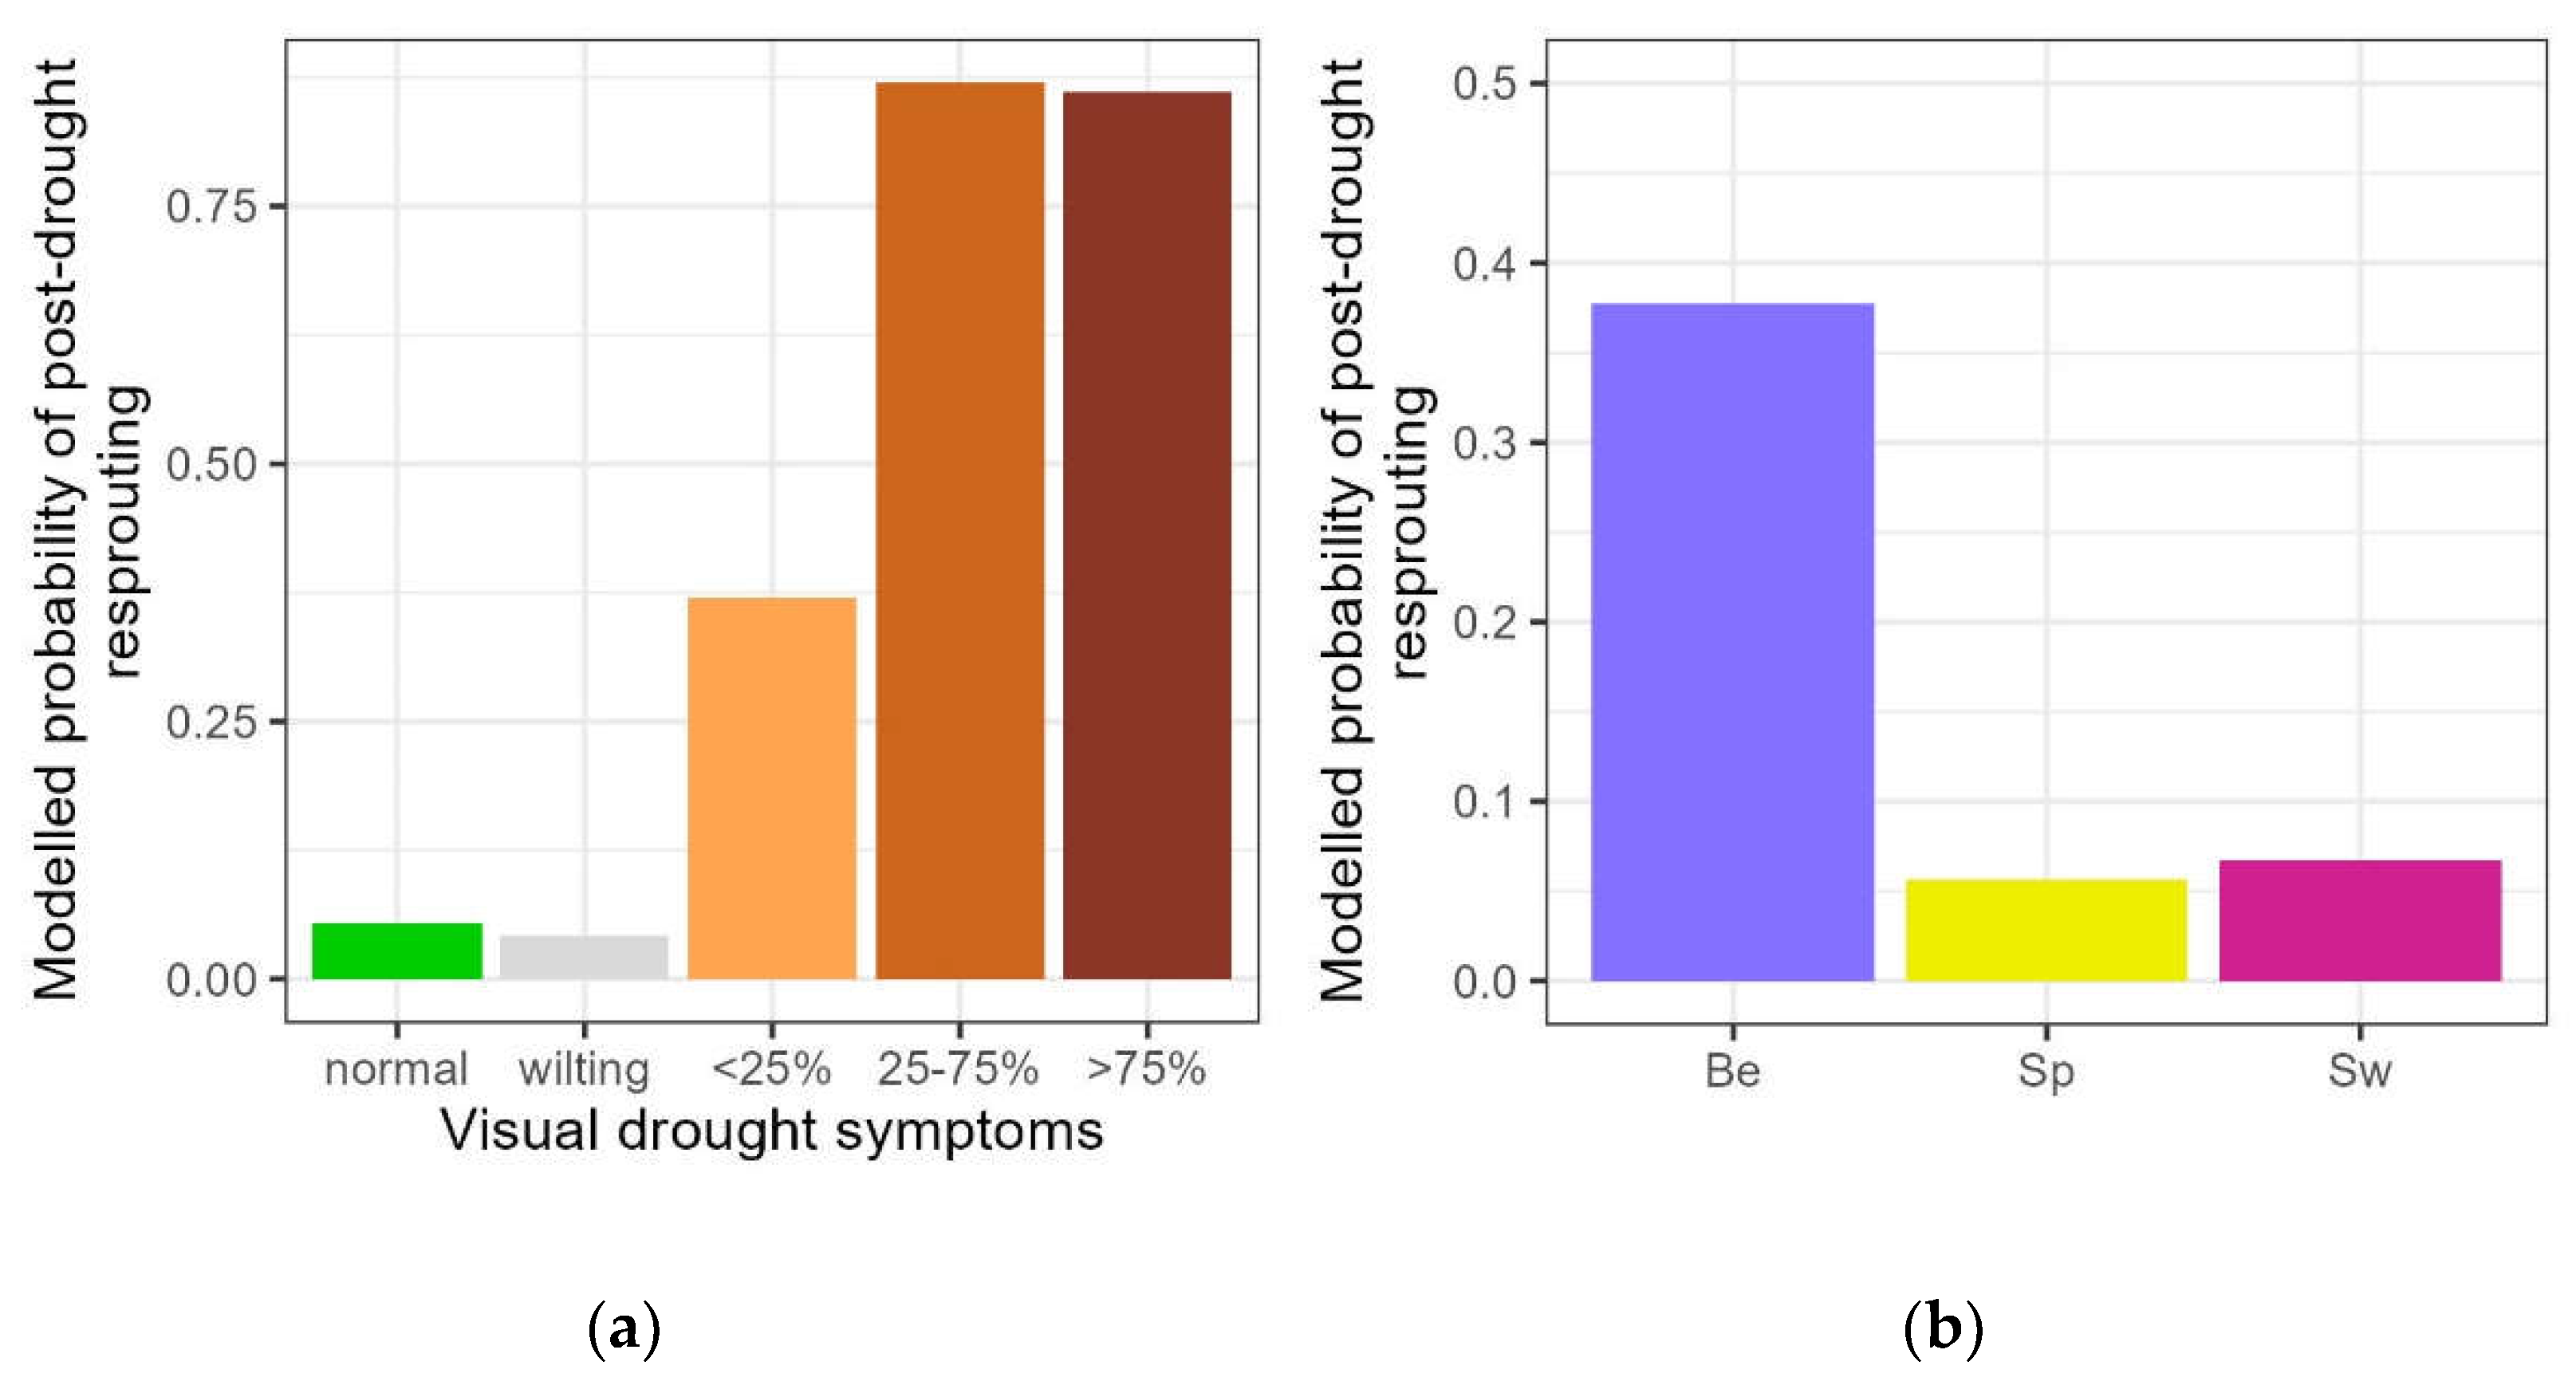
Figure 4.
Modelled probability of the timing of resprouting among the resprouting saplings (a) and modelled probability of the timing of leaf senescence for all controls and droughted plants (b), according to the visual drought symptom categories. For the resprouting (a), no to mild: pooling of no visual drought symptoms, wilting leaves and < 25% of desiccated leaves; 25-75% and >75%: percentages of desiccated leaves. For leaf senescence (b), normal: no visual drought symptoms, wilting: leaf wilting, <25%, 25-75% and >75%: percentage of desiccated leaves. Categories not significantly differing from the standard (control) are displayed in grey.
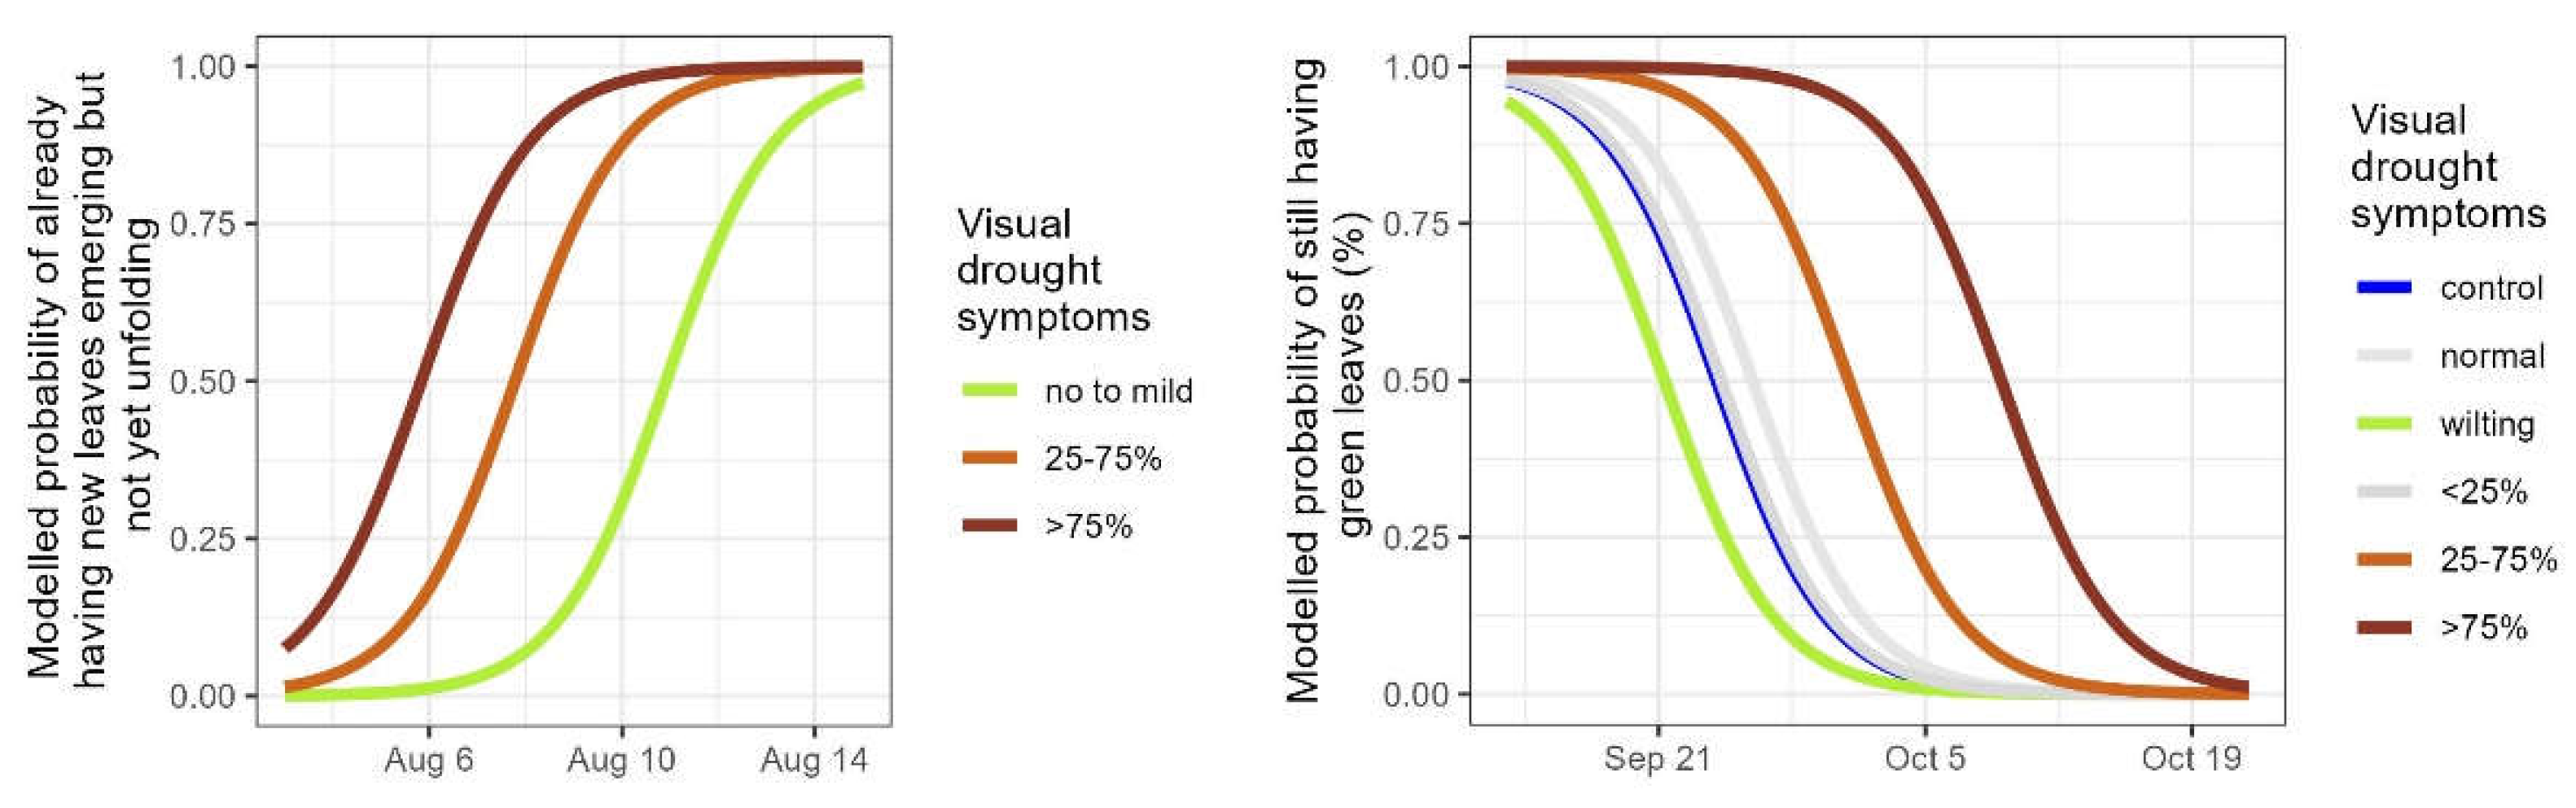
Figure 5.
Modelled probability of the timing of leaf senescence according to the provenance for controls (a), pooled categories of visual drought symptoms normal, wilting and <25% desiccated leaves (b) and pooled categories of visual drought symptoms 25-75% and >75% desiccated leaves (c). Provenances not significantly differing from the standard (Belgian) are displayed in grey.

Figure 6.
Modelled relative chlorophyll content index for control plants (n=27) and for plants severely affected by the drought ,i.e., that lost more than a quarter of their foliage (n=27).
Figure 6.
Modelled relative chlorophyll content index for control plants (n=27) and for plants severely affected by the drought ,i.e., that lost more than a quarter of their foliage (n=27).
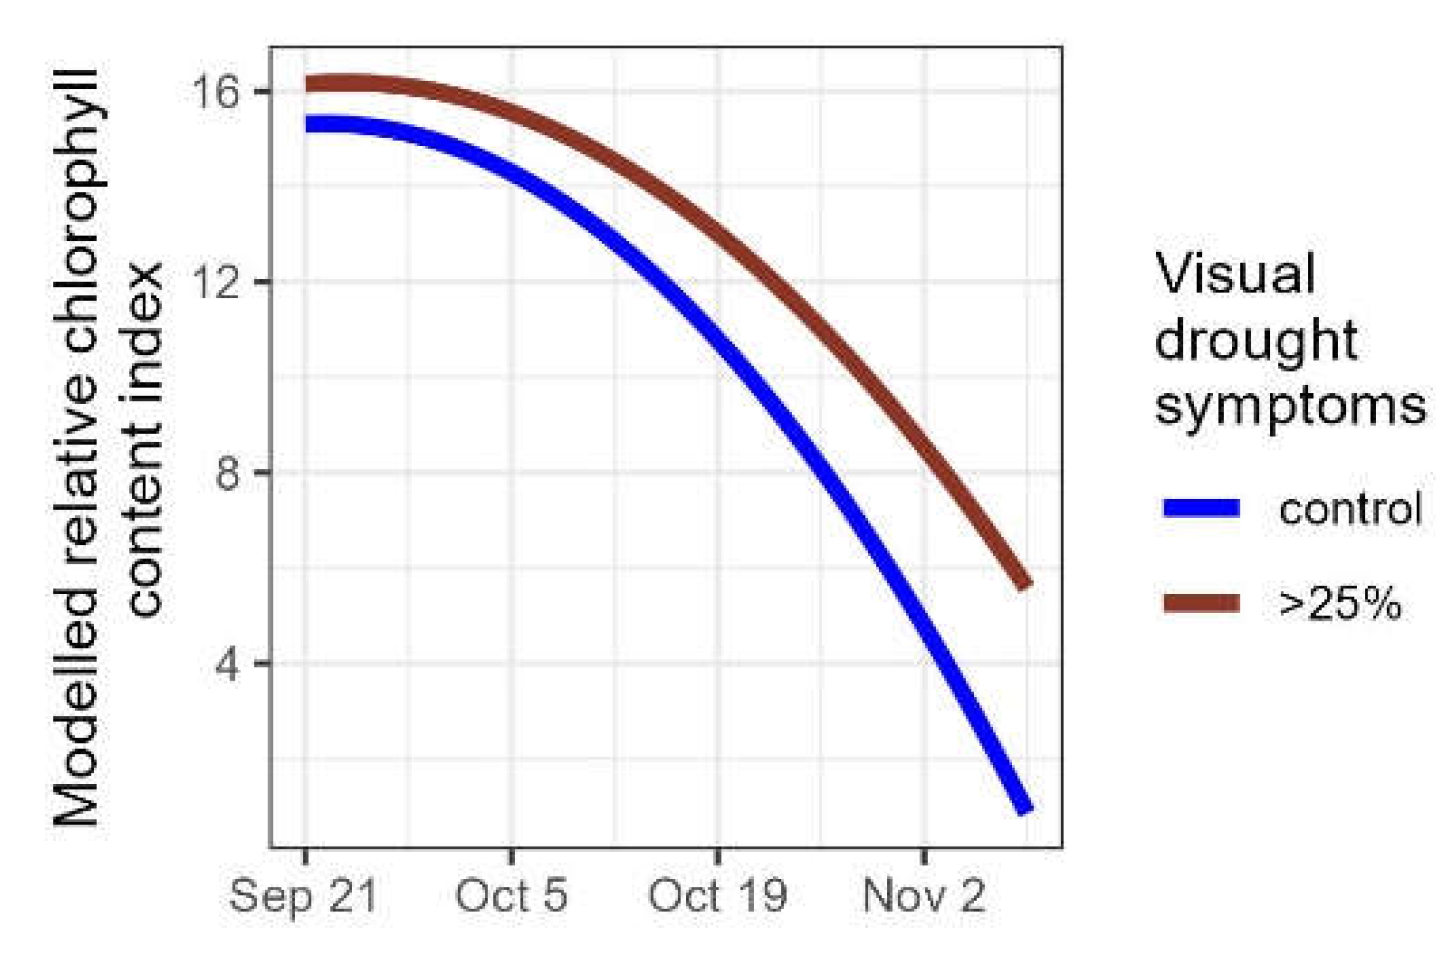
Figure 7.
Modelled probability of the timing of bud burst for controls and droughted plants, according to the visual drought symptom categories. Normal: no visual drought symptoms, wilting: leaf wilting, <25%, 25-75% and >75%: percentage of desiccated leaves. Categories not significantly differing from the standard (control) are displayed in grey.

Figure 8.
Schematic representation of the drought treatment with the plants subjected to water exclusion categorized according to the level of visible drought symptoms. The number of plants in each group is indicated with a further subdivision according to the provenance (Be: Belgian, Sp: Spanish-Pyrenean, Sw: Swedish). Several variables were recorded during and after the treatment. Hei1/Hei2/Dia1/Dia2: height and diameter, Dro: visual drought stress symptoms, Res: post-drought resprouting, Sen: autumn leaf senescence, Bud: bud burst.
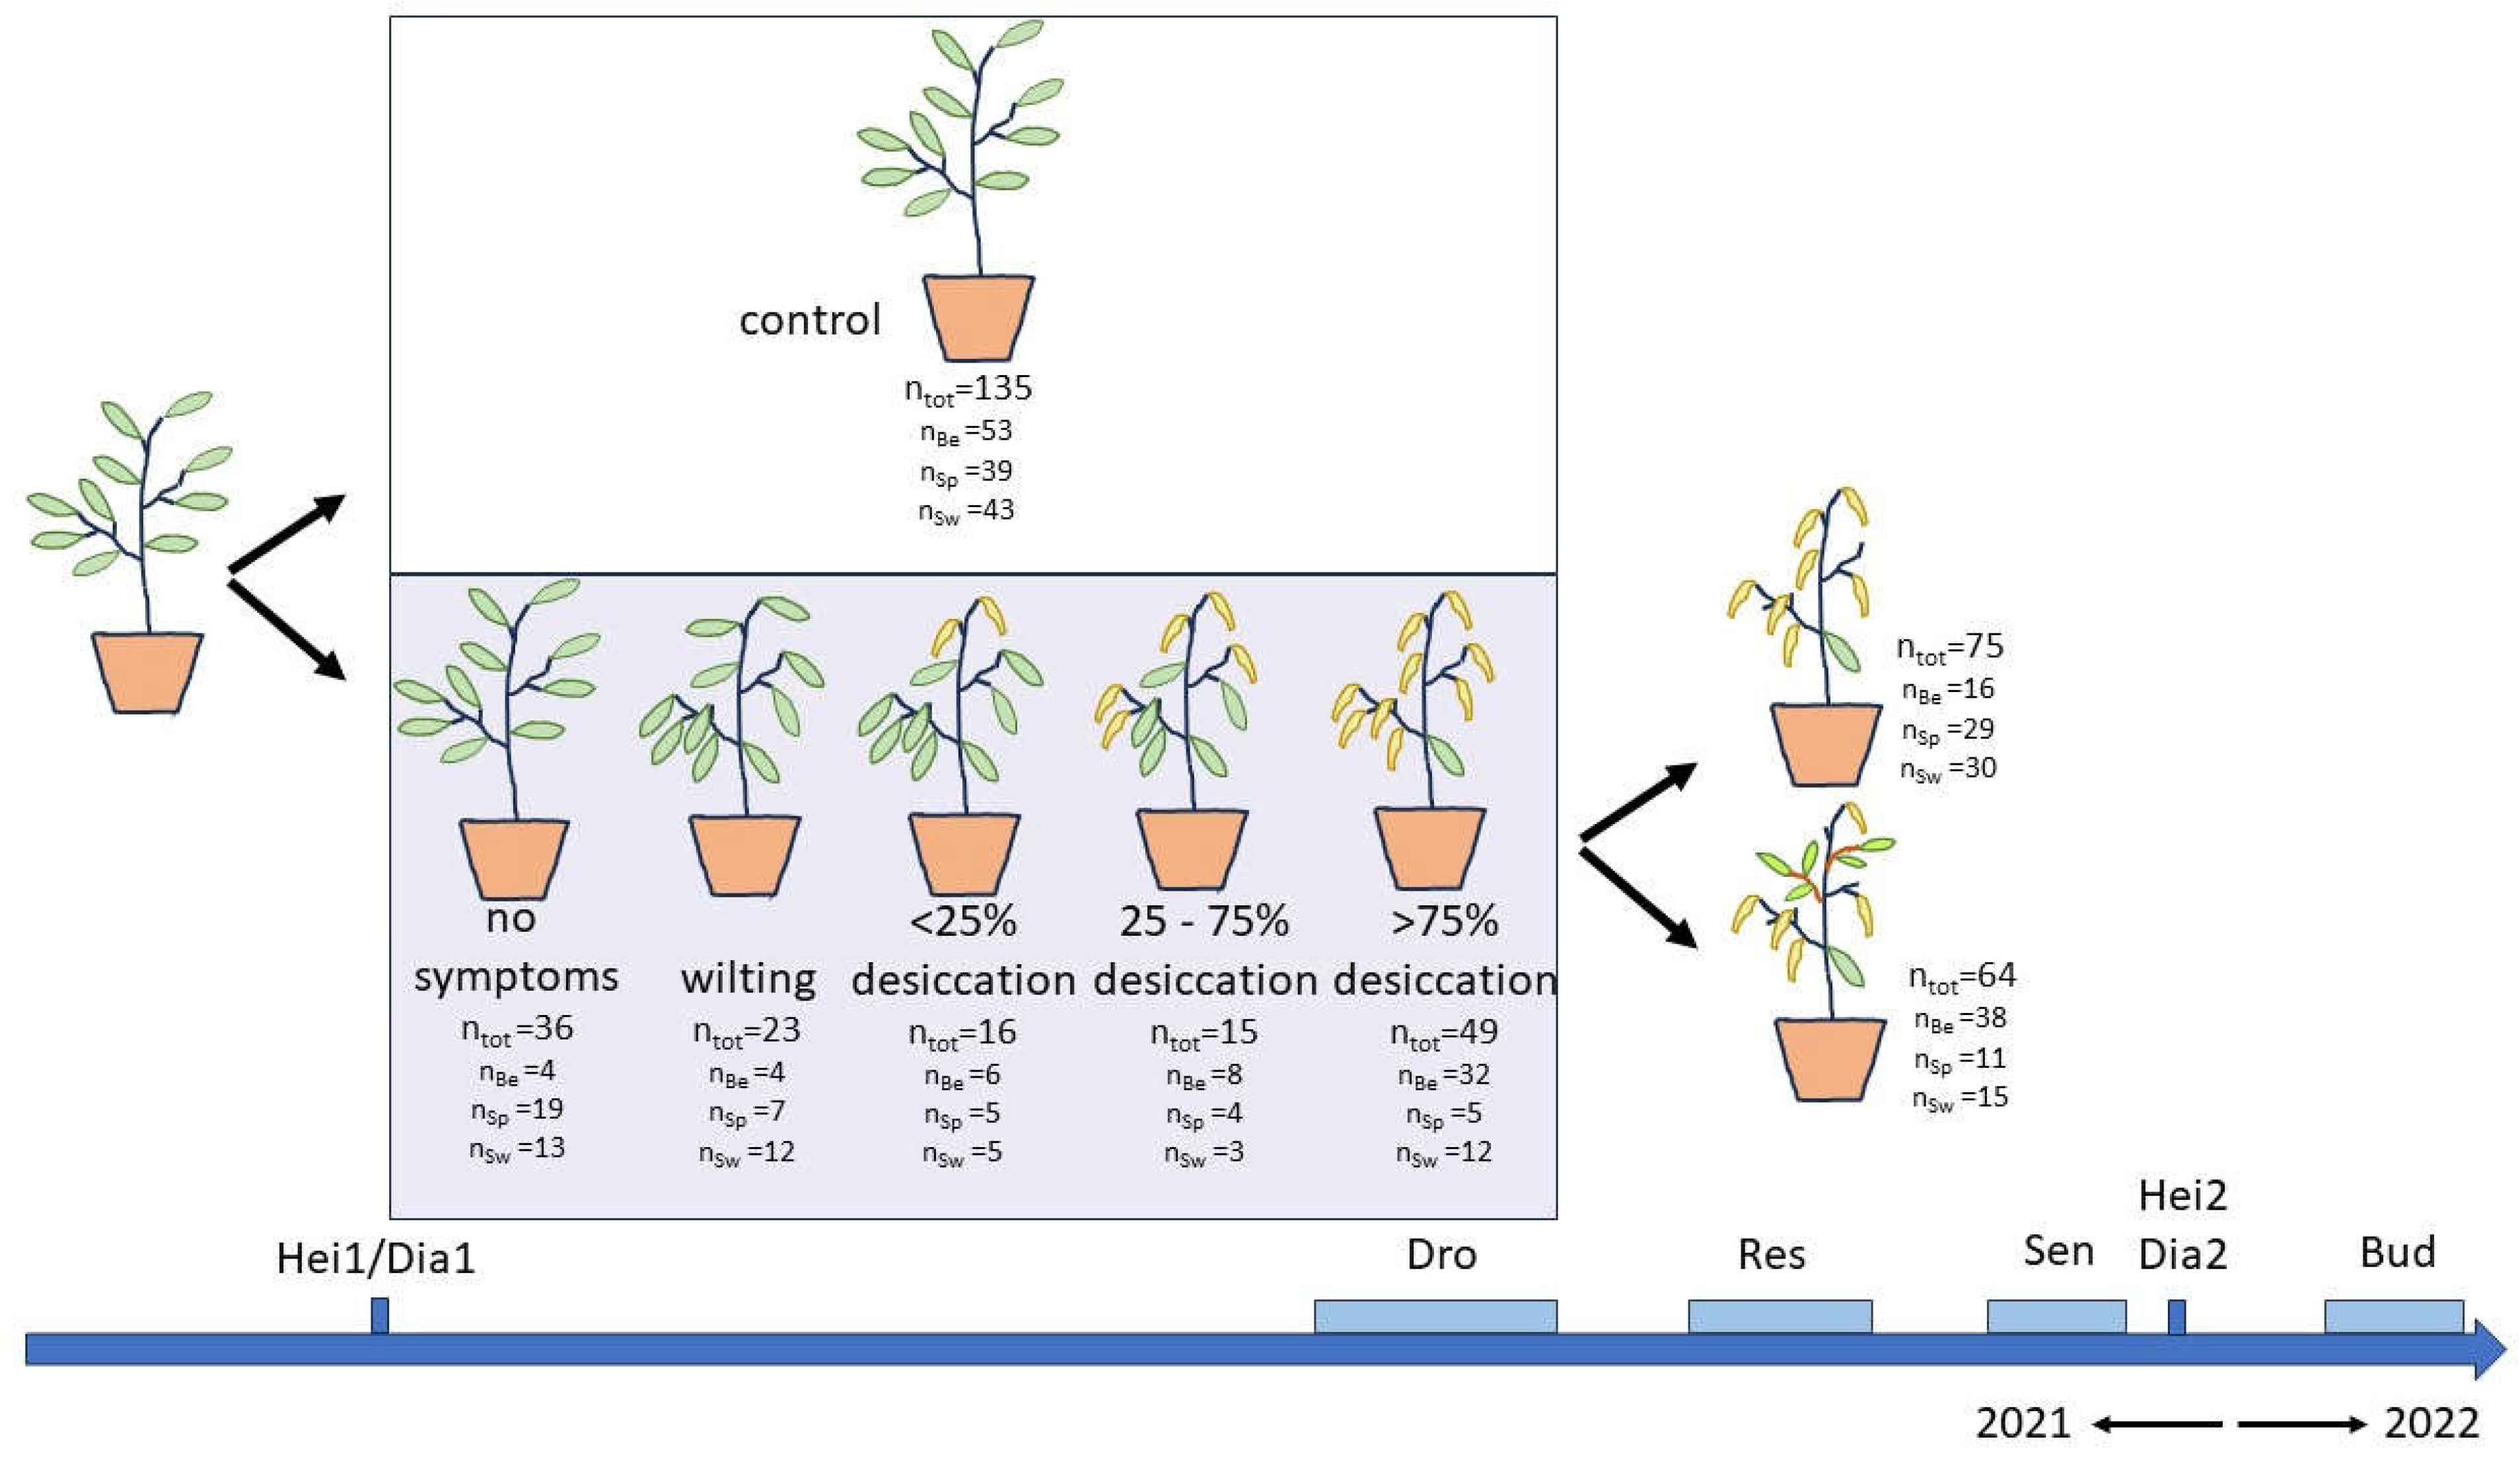
Figure 9.
Weights of the pots during the treatment for the control and drought group, according to the provenance.
Figure 9.
Weights of the pots during the treatment for the control and drought group, according to the provenance.
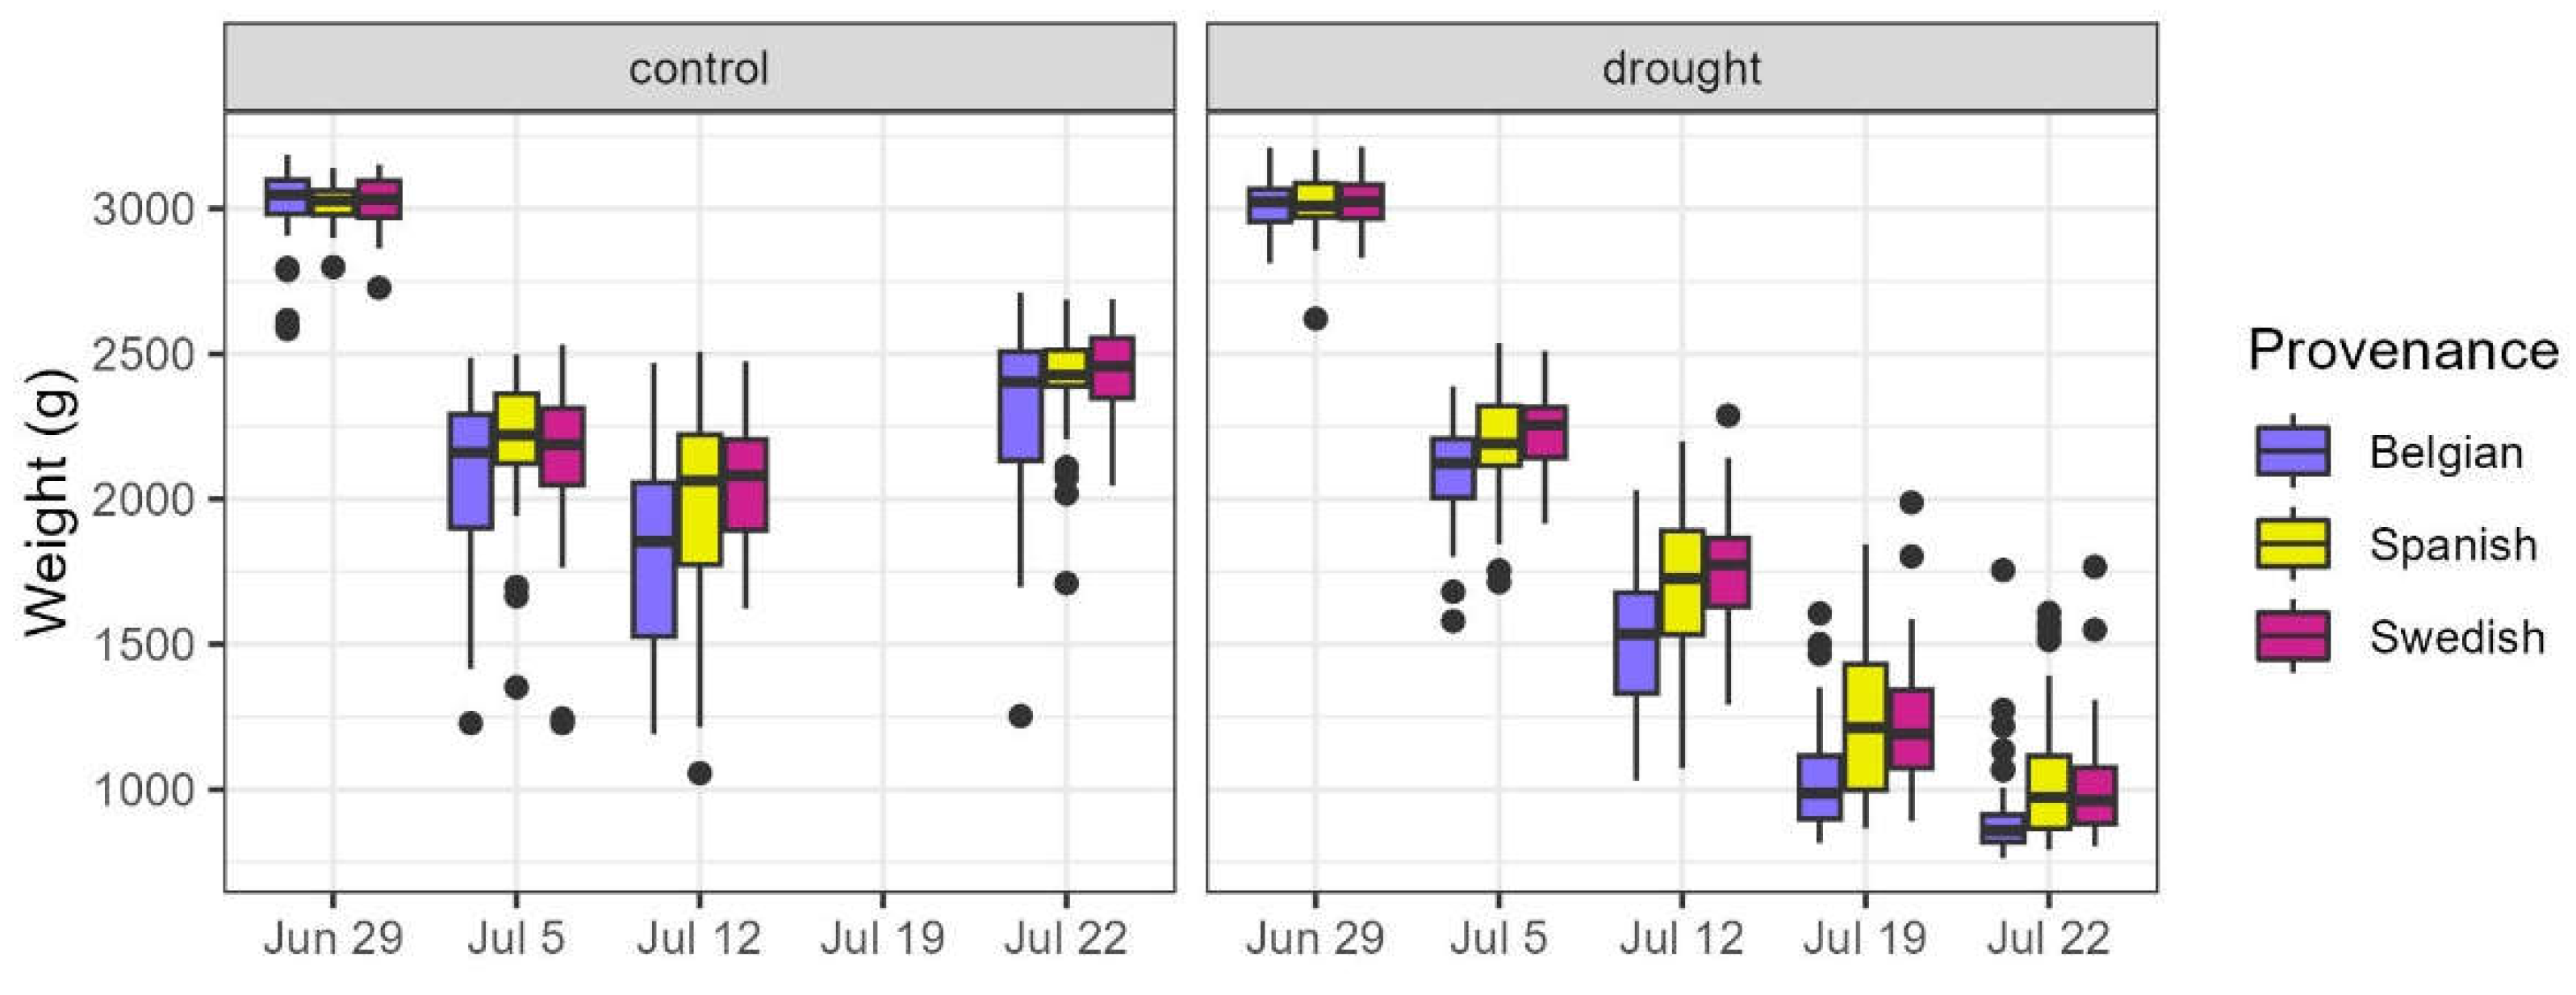

Table 1.
Test statistics for the height (Hei1) and diameter (Dia1) at the start of the treatment. The Spanish-Pyrenean (Sp) and the Swedish (Sw) provenances are compared to the standard Belgian provenance.
Table 1.
Test statistics for the height (Hei1) and diameter (Dia1) at the start of the treatment. The Spanish-Pyrenean (Sp) and the Swedish (Sw) provenances are compared to the standard Belgian provenance.
| Height | Diameter | |||||||
| Estimate | Std. error | t value | p value | Estimate | Std. error | t value | p value | |
| (Intercept) | 75,523 | 1,055 | 71,557 | < 0,001*** | 8,900 | 0,113 | 78,898 | < 0,001*** |
| Sp | -10,650 | 1,619 | -6,576 | < 0,001*** | -0,617 | 0,173 | -3,564 | < 0,001*** |
| Sw | -5,194 | 1,571 | -3,306 | 0,001** | -1,214 | 0,168 | -7,231 | < 0,001*** |
*** p < 0.001; ** p < 0.01; * p < 0.05.
Table 2.
Test statistics for the development of drought symptoms during the drought treatment. The Spanish-Pyrenean (Sp) and the Swedish (Sw) provenances are compared to the standard Belgian provenance. Rew is the relative weight loss, Day the day of observation, Hei1 the plant height at the start of the treatment.
| Estimate | Std. error | z value | p value | |
| Day | 0,707 | 0,057 | 12,330 | < 0,001*** |
| Sp | -3,416 | 0,815 | -4,194 | < 0,001*** |
| Sw | -1,754 | 0,713 | -2,459 | 0,014* |
| Rew | 77,327 | 9,396 | 8,230 | < 0,001*** |
| Hei1 | 0,053 | 0,028 | 1,930 | 0,054 |
*** p < 0.001; ** p < 0.01; * p < 0.05.
Table 3.
Test statistics for the modelling of the chance on post-drought resprouting in the drought treated plants among the different categories of visual drought symptoms (Dro) and among the provenances. In the model of the drought categories, the category normal (no symptoms, score 1) is the standard to which the other categories are compared to. In the two provenance models, the Belgian provenance is the standard to which the other provenances are compared to. Hei1 it the plant height at the start of the drought period. Sp: Spanish-Pyrenean provenance, Sw: Swedish provenance.
| Estimate | Std. error | z value | p value | ||
| Visual drought symptom categories (Dro) | (Intercept) | -2,477 | 1,703 | -1,454 | 0,146 |
| Dro score 2 | -0,238 | 1,258 | -0,190 | 0,850 | |
| Dro score 3 | 2,341 | 0,897 | 2,612 | 0,009** | |
| Dro score 4 | 4,766 | 1,087 | 4,383 | < 0,001*** | |
| Dro score 5 | 4,692 | 0,888 | 5,284 | < 0,001*** | |
| Hei1 | -0,006 | 0,024 | -0,231 | 0,818 | |
| provenances in dataset containing no to mild visual drought symptom categories(pooled Dro scores 1, 2 and 3) | (Intercept) | 1,511 | 2,561 | 0,590 | 0,555 |
| Sp | -2,320 | 0,972 | -2,387 | 0,017* | |
| Sw | -2,136 | 0,933 | -2,289 | 0,022* | |
| Hei1 | -0,031 | 0,037 | -0,831 | 0,406 | |
| provenances in dataset containing severe visual drought symptoms(pooled Dro scores 4 and 5) | (Intercept) | 0,625 | 2,578 | 0,242 | 0,808 |
| Sp | 17,060 | 2171,000 | 0,008 | 0,994 | |
| Sw | 0,310 | 0,868 | 0,358 | 0,721 | |
| Hei1 | 0,012 | 0,034 | 0,362 | 0,718 |
*** p < 0.001; ** p < 0.01; * p < 0.05.
Table 4.
Test statistics for the modelling of the timing of post-drought resprouting in the resprouting plants of the drought treated group, among the different categories of visual drought symptoms and among the provenances. In the model of the drought categories, the categories normal, wilting and <25% desiccated leaves (Dro scores 1, 2 and 3) are pooled and serve as the standard to which the other categories are compared to. In the provenance model, the Belgian provenance is the standard to which the other provenances are compared to. Day is the day of observation, Hei1 the plant height at the start of the treatment. Sp: Spanish-Pyrenean provenance, Sw: Swedish provenance.
| Estimate | Std. error | z value | p value | ||
| visual drought symptom categories (Dro with scores 1, 2 and 3 being pooled) | Day | -0,885 | 0,098 | -9,011 | < 0,001*** |
| Dro score 4 | -2,774 | 1,258 | -2,206 | 0,027* | |
| Dro score 5 | -4,498 | 1,149 | -3,916 | < 0,001*** | |
| Hei1 | -0,029 | 0,030 | -0,986 | 0,324 | |
| provenances | Day | -0,883 | 0,097 | -9,073 | < 0,001*** |
| Sp | 0,879 | 1,072 | 0,820 | 0,412 | |
| Sw | 0,344 | 0,955 | 0,360 | 0,719 | |
| Hei1 | -0,060 | 0,034 | -1,775 | 0,076 |
*** p < 0.001; ** p < 0.01; * p < 0.05.
Table 5.
Test statistics for the modelling of the timing of leaf senescence in controls and droughted plants, among the different categories of visual drought symptoms and among the provenances. In the visual drought symptoms model, the control plants are the standard to which the different categories of visual drought symptoms (Dro) are compared to. In the three provenance models, the Belgian provenance is the standard to which the other provenances are compared to. Day is the day of observation, Hei2 the plant height at the end of the growing season. Sp: Spanish-Pyrenean provenance, Sw: Swedish provenance.
| Estimate | Std. error | z value | p value | ||
| visual drought symptom categories (total dataset) | Day | 0,343 | 0,020 | 17,288 | <0,001*** |
| Dro score1 | -0,647 | 0,347 | -1,864 | 0,062 | |
| Dro score2 | 0,941 | 0,398 | 2,363 | 0,018* | |
| Dro score3 | -0,084 | 0,464 | -0,180 | 0,857 | |
| Dro score4 | -2,379 | 0,524 | -4,545 | <0,001*** | |
| Dro score5 | -5,126 | 0,442 | -11,609 | <0,001*** | |
| Hei2 | 0,013 | 0,009 | 1,516 | 0,129 | |
| provenances in dataset of control plants | Sp | -0,872 | 0,311 | -2,808 | 0,005** |
| Sw | 0,808 | 0,272 | 2,969 | 0,003** | |
| Day | 0,334 | 0,026 | 12,699 | <0,001*** | |
| Hei2 | 0,008 | 0,008 | 0,968 | 0,333 | |
| provenances in dataset of plants with no to mild visual drought symptoms (pooled Dro scores 1, 2 and 3) | Sp | -1,771 | 0,673 | -2,631 | 0,009** |
| Sw | 1,239 | 0,634 | 1,954 | 0,051 | |
| Day | 0,379 | 0,041 | 9,248 | <0,001*** | |
| Hei2 | 0,003 | 0,021 | 0,134 | 0,893 | |
| provenances in dataset of plants with severe visual drought symptoms (pooled Dro scores 4 and 5) | Sp | -0,694 | 1,052 | -0,659 | 0,510 |
| Sw | 0,569 | 0,872 | 0,652 | 0,514 | |
| Day | 0,390 | 0,064 | 6,129 | <0,001*** | |
| Hei2 | -0,006 | 0,033 | -0,172 | 0,863 |
*** p < 0.001; ** p < 0.01; * p < 0.05.
Table 6.
Test statistics for the modelling of the relative chlorophyll content index between control plants and plants that lost more than a quarter of their foliage due to the drought. The control plants are the standard to which the severely affected plants (Dro_adj2) are compared to. Day is the day of observation.
| Estimate | Std. error | DF | t value | p value | |
| (Intercept) | 11,45 | 0,69 | 152 | 16,65 | <0,001*** |
| Day | -55,78 | 3,21 | 152 | -17,37 | <0,001*** |
| Day2 | -18,04 | 3,15 | 152 | -5,72 | <0,001*** |
| Dro_adj2 | 1,98 | 0,97 | 52 | 2,04 | 0,047* |
| Day:Dro_adj2 | 15,49 | 4,40 | 152 | 3,52 | 0,001*** |
| Day2:Dro_adj2 | 4,00 | 4,38 | 152 | 0,91 | 0,362 |
Table 7.
Test statistics for the modelling of the timing of bud burst in controls and droughted plants, among the different categories of visual drought symptoms and among the provenances. In the visual drought symptoms model, the control plants are the standard to which the different categories of visual drought symptoms (Dro) are compared to. In the three provenance models, the Belgian provenance is the standard to which the other provenances are compared to. Day is the day of observation, Hei2 the plant height at the end of the growing season. Sp: Spanish-Pyrenean provenance, Sw: Swedish provenance.
| Estimate | Std. error | z value | p value | ||
| visual drought symptom categories (total dataset) | Dro score1 | 0,450 | 0,621 | 0,724 | 0,469 |
| Dro score2 | 2,374 | 0,756 | 3,139 | 0,002** | |
| Dro score3 | 1,839 | 0,902 | 2,038 | 0,042* | |
| Dro score4 | 0,366 | 0,895 | 0,409 | 0,682 | |
| Dro score5 | 1,901 | 0,565 | 3,363 | <0,001*** | |
| Hei2 | 0,058 | 0,014 | 4,028 | <0,001*** | |
| Day | -0,914 | 0,051 | -17,785 | <0,001*** | |
| provenances in dataset of control plants | Sp | -0,713 | 0,507 | -1,407 | 0,160 |
| Sw | 4,286 | 0,572 | 7,490 | <0,001*** | |
| Day | -0,854 | 0,069 | -12,427 | <0,001*** | |
| Hei2 | 0,061 | 0,015 | 4,033 | <0,001*** | |
| provenances in dataset of plants with no to mild visual drought symptoms (pooled Dro scores 1, 2 and 3) | Sp | 0,350 | 0,750 | 0,466 | 0,641 |
| Sw | 4,977 | 0,920 | 5,410 | <0,001*** | |
| Day | -0,889 | 0,099 | -9,017 | <0,001*** | |
| Hei2 | 0,105 | 0,027 | 3,913 | <0,001*** | |
| provenances in dataset of plants with severe visual drought symptoms (pooled Dro scores 4 and 5) | Sp | -0,114 | 1,198 | -0,095 | 0,924 |
| Sw | 4,829 | 1,170 | 4,129 | <0,001*** | |
| Day | -1,036 | 0,131 | -7,894 | <0,001*** | |
| Hei2 | -0,004 | 0,037 | -0,111 | 0,912 |
*** p < 0.001; ** p < 0.01; * p < 0.05.
Table 8.
Schematic representation of the timing of autumn leaf senescence and spring bud burst in the droughted plants in comparison to the controls. Droughted plants are grouped according to the categories of visual drought symptoms during the summer water withholding.
Table 8.
Schematic representation of the timing of autumn leaf senescence and spring bud burst in the droughted plants in comparison to the controls. Droughted plants are grouped according to the categories of visual drought symptoms during the summer water withholding.
| Visual drought symptoms during water withholding (Dro) | leaf senescence | bud burst |
| Score 1: no symptoms | = control | = control |
| Score 2: wilting leaves | earlier | later |
| Score 3: <25% desiccated leaves | = control | later |
| Score 4: 25%-75% desiccated leaves | later | = control |
| Score 5: >75% desiccated leaves | later | later |
Disclaimer/Publisher’s Note: The statements, opinions and data contained in all publications are solely those of the individual author(s) and contributor(s) and not of MDPI and/or the editor(s). MDPI and/or the editor(s) disclaim responsibility for any injury to people or property resulting from any ideas, methods, instructions or products referred to in the content. |
© 2025 by the authors. Licensee MDPI, Basel, Switzerland. This article is an open access article distributed under the terms and conditions of the Creative Commons Attribution (CC BY) license (http://creativecommons.org/licenses/by/4.0/).
Copyright: This open access article is published under a Creative Commons CC BY 4.0 license, which permit the free download, distribution, and reuse, provided that the author and preprint are cited in any reuse.


