
Submitted:
18 February 2025
Posted:
19 February 2025
You are already at the latest version
Abstract
Mining has direct and indirect impacts on natural resources. The tailings are generally stored in storage areas near the mine, extraction plants and can cover areas of several tens of hectares. These mine discharges have adverse environmental impacts on both the surrounding population and ecosystems. The objective of the present work was to establish a spatial distribution and to carry out the physico-chemical characterization of the mining discharges from the Katapula sedimentation basin (Kipushi). 40 soil samples were taken from the entire basin at a depth of 0 to 20 cm using a soil probe. The samples thus collected were crushed and sieved and analyzed by XRF (apparatus using X-ray fluorescence) and Potentiometric. Statistical processing of the data was carried out using the Surfer and ArcGIS 10.8 software to highlight the spatial distribution of the various chemical elements. To compare the averages of the total trace element concentrations in the sedimentation basin soil, a one-factor analysis of variance (ANOVA) was performed using Minitab. The results obtained revealed that the sedimentation basin soils contain high concentrations of metallic trace elements such as: Zn, Cu, Pb, As, Cr, Cd, Co, Ag and Ti with 2.24%; 4771 mg.kg-1; 1185 mg.kg-1; 866 mg.kg-1; 14.15 mg.kg-1; 199 mg.kg-1; 10 mg.kg-1; 8.3mg.kg-1 and 2823 mg.kg-1 respectively, spread throughout the basin. Of all these trace elements, Zinc is the element that had a very high concentration and Silver is the element that had a low concentration. The concentration of major elements such as Ca, Fe, Mn, Cl, was abundant, with Calcium having 14.4 ± 3.8 %. In general, the soil in this basin had a basic pH (7.3 ± 1). These results demonstrate the importance of implementing phytoremediation strategies to reduce the risk of dispersion of this pollution in the surrounding soil.
Keywords:
Soils
; metallic trace elements
; Katapula
; Kipushi
; sedimentation basin
; physico-chemical characterization
Introduction
Mining activities have both direct and indirect impacts on natural resources. These impacts mainly result from disturbing, displacing, and redistributing the land surface. Mining generates large quantities of tailings at various stages of mineral extraction and processing (Alaa et al., 2024). Tailings, which can cover an area of tens of hectares (Bussiere et al., 2005), are typically stockpiled in areas close to the mine or extraction site. Tailings tend to be left lying around and not treated.
Acid Mine Drainage (AMD) is generated by a series of chemical and biochemical reactions (Jio et al., 2023). The products of AMD can migrate from the impoundments and reach aquifers, surface waters, and the surrounding land, thereby affecting the quality of water and soil resources (Gunsinger et al., 2006b). Through leaching, certain metals can be released (Lei et al., 2010) and become bioavailable in the food chain. This can threaten the health and even the life of biological organisms (Thacharodi et al., 2024).
The Kipushi area is crossed by the copper arc. The area is rich in metallic and non-metallic indices due to its rich subsoil. In addition to the smokestacks, there is also the danger of water and soil contamination due to the presence of tailings dumped here and there in the town of the same name.
Acidification and leaching of heavy metals are the main causes of environmental degradation in the vicinity of the DMA sites, which consist of contaminated surface and subsurface water, as well as soil, which has an impact on plant and animal life (Simate and Ndlovo, 2014). As a result, the implementation of on-site remediation activities (Simate and Ndlovu, 2014) has proven that the Kipushi tailings ponds pose an environmental health risk and a major challenge for the cleanup of toxic pollutants. (Simate and Ndlovu, 2014).
A variety of ex situ and in situ remediation technologies have been used to reduce the risks associated with heavy metal contaminated soils (Ok et al., 2011b, c; Shutcha et al., 2010). In-situ immobilization by means of chemical additives is a promising technology for the remediation of heavy metals in agricultural soils and the reduction of environmental and health risks (Ok et al., 2011b). In-situ immobilization of metals can be achieved by applying additives to the soil.
In this study, we will provide a blueprint for successful plant-mediated remediation of heavy metal-contaminated soils. This work was aimed at determining the spatial distribution and physicochemical characterization of mining effluents discharged from the Kipushi Sedimentation Basin (KATAPULA). Specifically, the objectives were: (i) to assess the hazard of mine tailings stored in the tailings pond by determining their physico-chemical properties, and (ii) to develop a management plan to ensure proper establishment of vegetation cover through phytoremediation.
2. Materials and Methods
2.1. Study Environment
For this study, one site was selected. It is the sedimentation basin of the ACK Mining Company, which is owned by GCM and is located in the KIPUSHI area.
The following criteria were used to select the study sites: (i) the site had to be located in the Democratic Republic of Congo, the province of Haut-Katanga, (ii) the site had to be a tailings pond (sedimentation) belonging to a long-established mining company, (iii) the danger posed by these tailings to the surrounding environment. Other constraints, such as lack of permits and site accessibility, also limited the options.
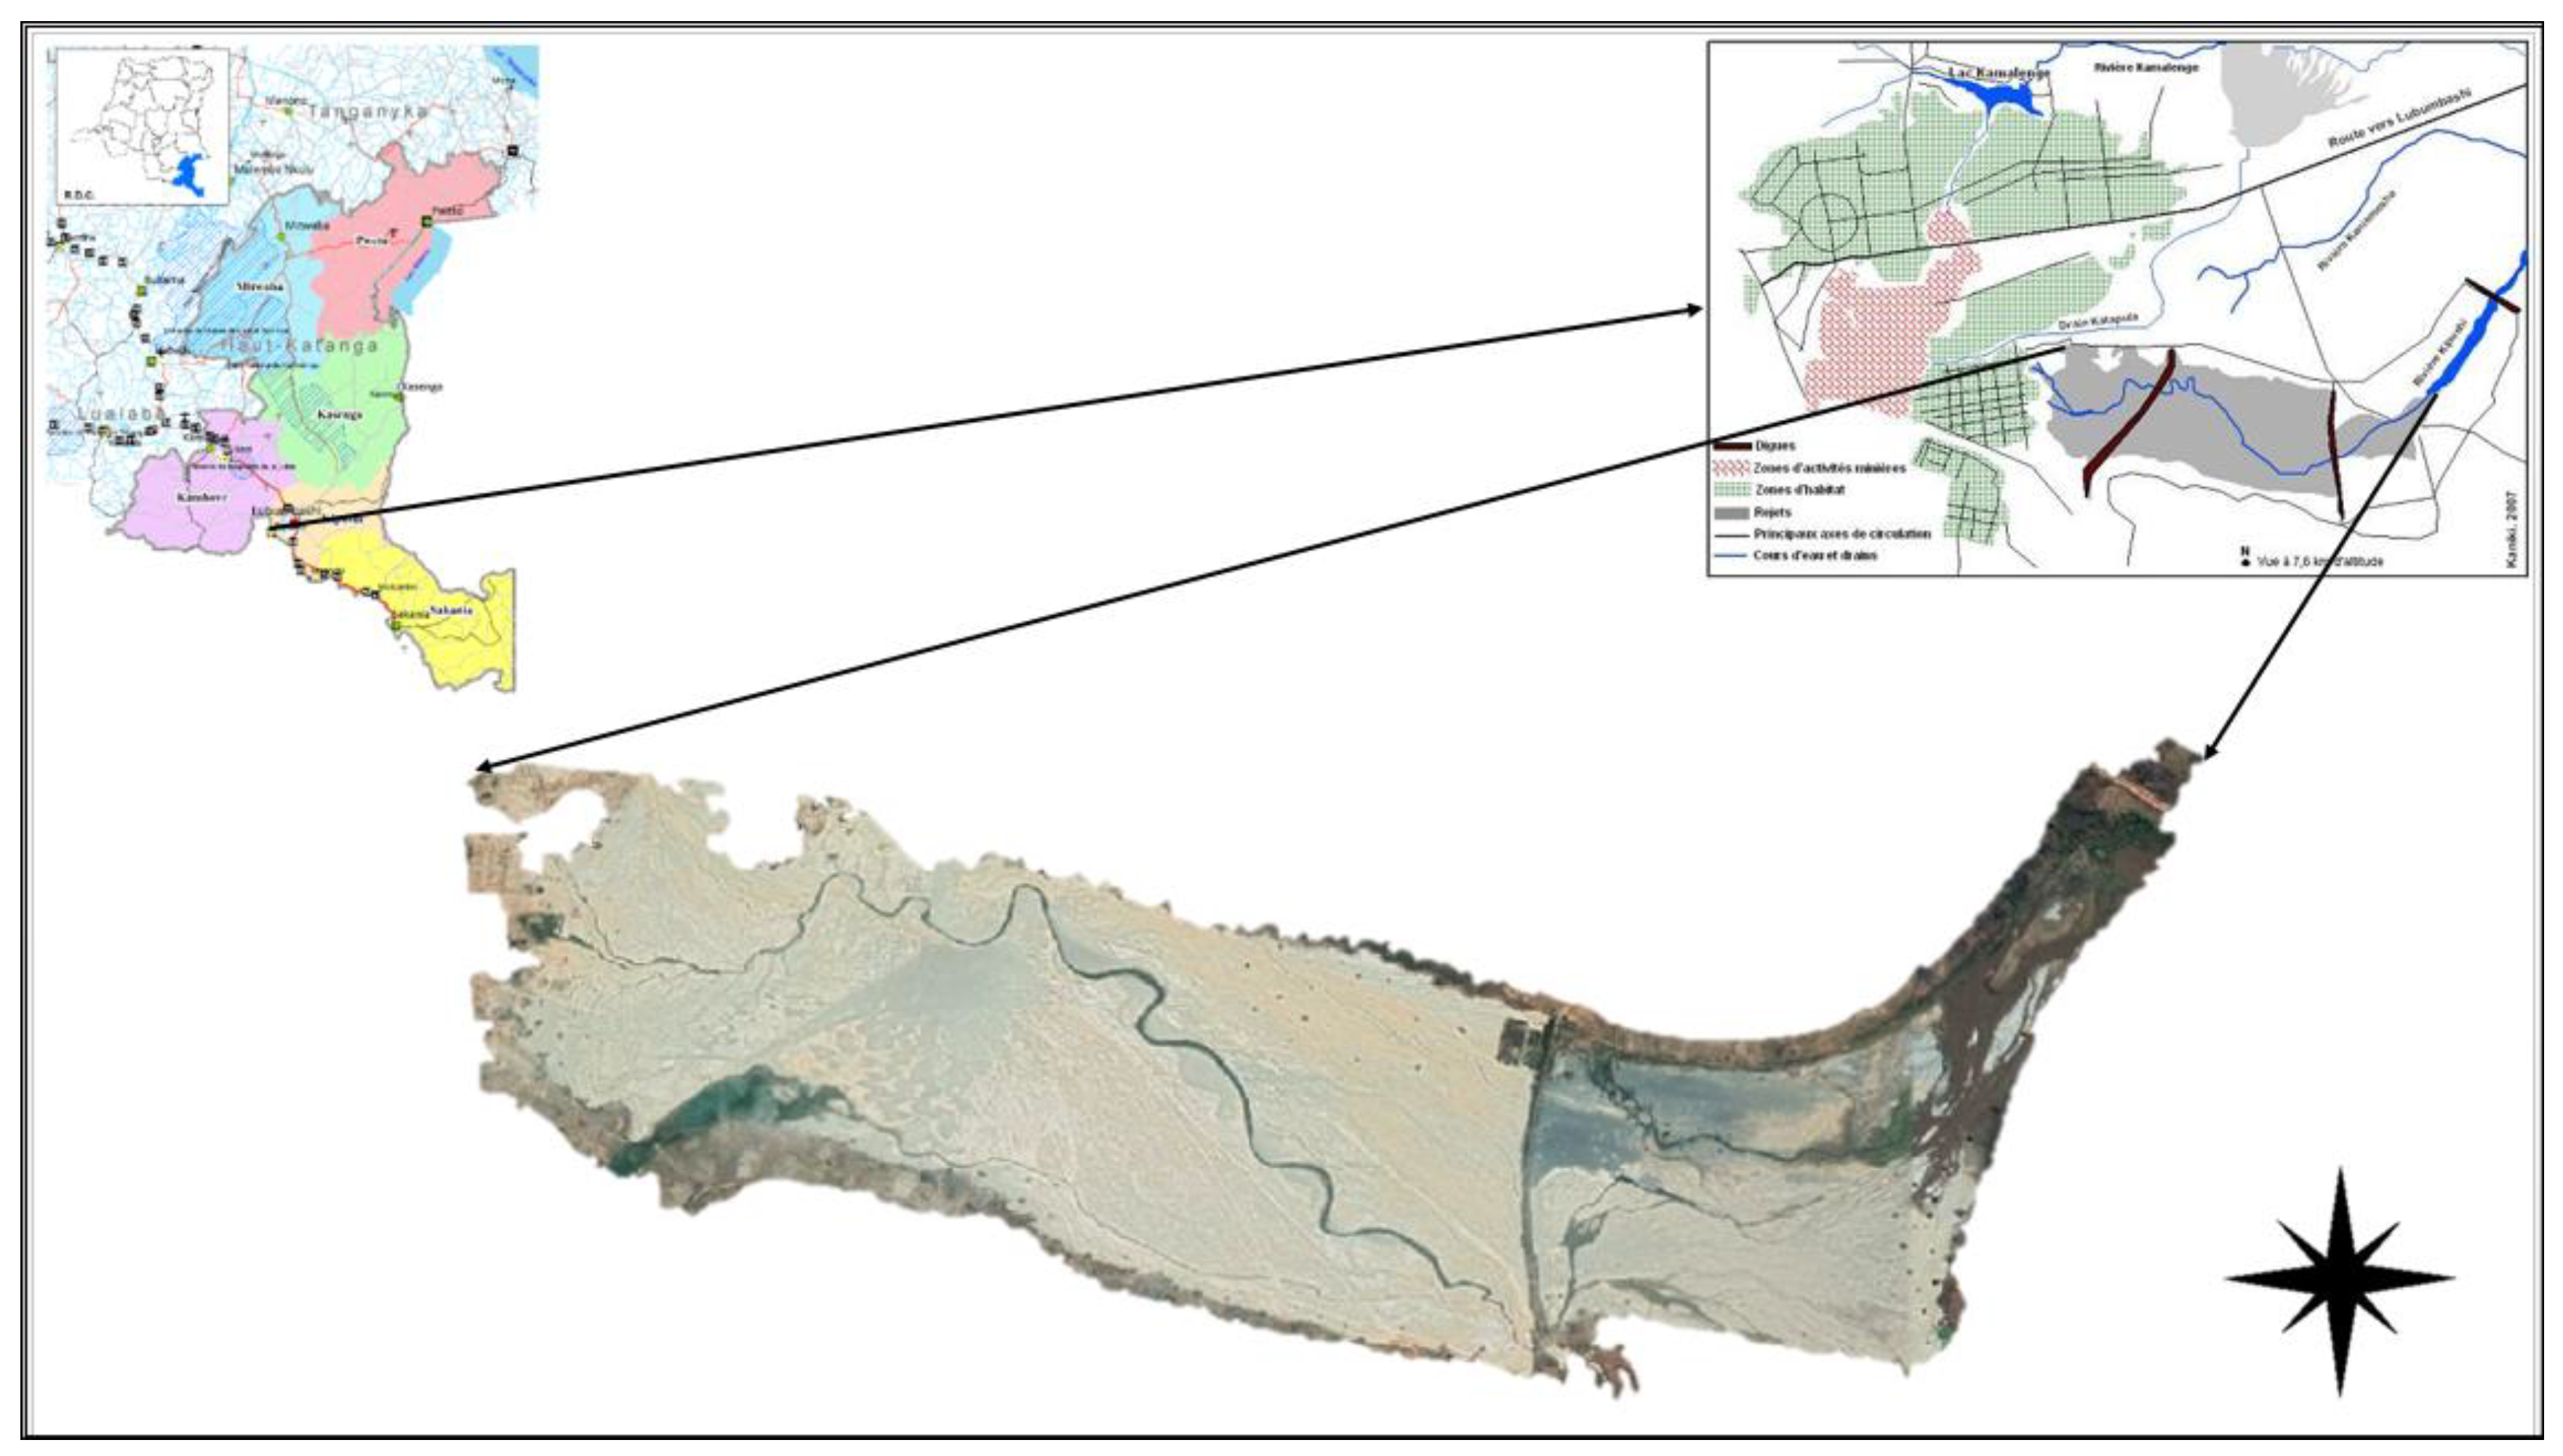
The town of KIPUSHI (11°45'40''S, 27°14'50''E and 1,351 m altitude) is located 30 km southwest of the city of Lubumbashi. It is home to two concentrators: The Ancien Concentrateur de Kipushi (ACK), located on the Gécamines site, and the Compagnie Minière de Sud-Katanga (CMSK), formerly known as NCK (Nouveau concentrateur de Kipushi), resulting from a partnership between Gécamines and the Malta Forrest Group (Kaniki, 2008).
Figure 1.
Study area.
2.2. Soil Sampling and Preparation
In order to carry out this study, soil samples were taken on a random basis throughout the Katapula (the sampling area). Sampling points were projected (Figure 5) using Google Earth software.
Throughout the basin, forty samples were collected. The samples were taken at a depth of between 0 cm and 20 cm with the use of a soil probe. Plastic bags were then used to collect the samples. Because the contaminants in our study area are assumed to be homogeneous, this method was chosen.
2.3. Laboratory Studies
To determine the different chemical elements present in the soil samples, an XRF instrument was used in this study (Figure 5). X-ray fluorescence spectrometry is a method of chemical analysis by means of a physical property of matter, X-ray fluorescence (Yoshimura et al., 2002). When a material is bombarded with X-rays, it re-emits the energy in the form of X-rays. The composition of the sample is characterized by the X-ray spectra re-emitted by the material.
The elemental composition, or concentration of chemical elements, can be determined by spectral analysis. In this study, a number of chemical elements have been detected, but only the most important ones have been retained.
In the lab, physicochemical analysis of the soils was performed. The samples were directly sieved with a 2 mm mesh sieve after 48 hours of air drying, due to their fine granulometry. The soil samples were analyzed at the Laboratoire Agro-Pédologique de la Faculté de Sciences Agronomiques de l'Université de Lubumbashi (LAP-FSA-UNILU) after preparation (drying + crushing to 2 mm).
The soil variables measured and the methods used for the characterization of the different soils were: hydrogen potential in water (pHeau) by potentiometric method and the total content of major elements and trace metals by X-ray fluorescence spectrometer (XRF).
2.4. Spatial Distribution Maps
The spatial distribution of trace metals in the sedimentation basin was performed using ArcGIS software (version 10.8 Golden software) to perform Kriging interpolation Erens et al. (2015a). In fact, Kriging performs the spatial interpolation of a regionalized variable by calculating the mathematical expectation of a random variable. It is based on the interpretation and modeling of the experimental variogram. It is the best unbiased linear estimator. It is based on an objective method (Yousefali & Safari, 2007). This method considers not only the distance between the data and the estimate point, but also the distances between the data in pairs.
2.5. Digital Terrain Model (DTM)
The SURFER version of Google Earth uses certain geographic information for the generation of the input variables: the elevation map, the latitude map and the longitude map. In this way, the superposition of cells is possible. The direct acquisition of maps is possible with SUFER. The following stages were used to create the DTM.
- ✓
- Delineating the study area in Google Earth, followed by complete digitization of the entire study area, then recording these paths in KML format;
- ✓
- The x, y, z coordinates were then obtained using GPS visualization. These were then saved in txt format;
- ✓
- Finally, we enter the SURFER software, where the txt format is saved in the DAT format. This format, in turn, is entered after clicking on the Grid menu to obtain the contour lines, and then on the 3D menu to obtain the three-dimensional shape.
2.6. Data Processing
Statistical processing: Descriptive statistics are used to collect observations about subjects with a given characteristic and translate those observations into numbers that provide information about those characteristics, with the goal of organizing and representing the information contained in the data. Pearson correlation is an index that reflects a linear relationship between two continuous variables (via the Pearson coefficient). The correlation coefficient ranges from -1 to +1, where 0 reflects no relationship between the two variables; a negative value means that when one variable rises, the other falls; while a positive value indicates that the two variables vary together in the same direction; Kriging for spatial analysis is an advanced geostatistical procedure that generates a surface determined from a scattered set of points with z scores.
Software: Minitab for the descriptive statistics, the principal component analysis (PCA) was carried out with the R software, the spatial distribution with the ArcGIS 10.8 software and the numerical model with the same SURFER 19 software.
3. Results and Discussion
3.1. Results
3.1.1. Descriptive Statistics for the Different Parameters Analyzed
The variations in the parameters analyzed, as shown in Table 1, indicate that the soils in the tailings pond generally have a basic pH, with a mean of 7.3 ± 1 and a median of 7.5 (Table 1). Two samples showed a very acidic pH, with values of 3 and 3.9. The first quartile (25% of the samples) is reached at 7.4, while the maximum is 8. Table 1 shows that Ca is the most abundant major element with a mean of 14.4 ± 3.8%, a median of 15.4% and a range from 3.7 to 20.5%. The mean for S is 4.8 ± 3.8%, with a median of 3.2% and a range of 1.61 - 19%. Fe and Mn average 6.4 ± 4.6% (median = 3.2%, range = 2.3 - 28.5%) and 803 ± 232 mg kg-1 (median = 855 mg kg-1, range = < 5 - 1064 mg kg-1), respectively (Table 1). Cl is generally below the XRF detection limit (concentration < 5 mg kg-1), with only 2 samples (out of 38) showing concentrations of 3858 and 4439 mg.kg-1, raising the mean to 212 ± 917 mg.kg-1, while the median is < 5 mg kg-1 (Table 1). Zn is the most abundant MTE in the Katapula tailings with a mean concentration of 22 365 ± 917 mg.kg-1 for a median of 14900 mg.kg-1 and a range of 1600 - 132800 mg.kg-1. It was followed by Cu and Ti with mean concentrations of 4771 ± 7673 mg.kg-1 (median = 2291 mg.kg-1, range = 1007 - 35200 mg.kg-1), 2824 ± 753 mg.kg-1 (median = 2869 mg.kg-1, range = < 5 - 4488 mg.kg-1), respectively. Pb and As also showed high concentrations with mean values of 1185 ± 1206 mg.kg-1 (median = 724 mg.kg-1, range = 147 - 4734 mg.kg-1) and 866 ± 760 mg.kg-1 (median = 674 mg.kg-1, range = 91 - 3961 mg.kg-1). Cd had a mean concentration of 199 ± 186 mg.kg-1 (median = 153 mg.kg-1, range = < 5 - 893 mg.kg-1). The other TMEs showed low concentrations and were generally below the detection limit. Except for Rb (mean 44 ± 12 mg.kg-1; median = 46 mg.kg-1, range = <5 - 83 mg.kg-1) and Mo (mean = 15 ± 10.3 mg.kg-1; median = 14 mg.kg-1, range = <5 - 62 mg.kg-1), Co, Cr and Sb had concentrations below 5 mg.kg-1 in more than 75% of their samples (third quartile).
3.1.2. Some Parameters Compared to Reference
The mean and median pH values are much higher in the Katapula tailings (7.3 and 7.5) compared to the reference soil in the Lubumbashi region (5.6 and 5.5), although the lowest pH values were observed in the Katapula tailings (pH = 3). Mean Fe in the basin is also higher (6.4 and 5.3%) compared to its reference value (3.6 and 3.8%). Mean Ag and its median are lower in the Katapula tailings (8.3 and < 5 mg.kg-1) compared to the Lubumbashi reference soil (20.2 and 20.1 mg.kg-1). Mean and median Cu values are much higher in Katapula tailings (4771 and 2291 mg.kg-1) compared to Lubumbashi reference soil (187 and 191 mg.kg-1). The mean and median Pb concentrations are also high in the Kipushi tailings (1185 and 724 mg.kg-1). This is compared to the reference soil values for the Lubumbashi region (40 and 32 mg.kg-1). Finally, compared to the reference soil of the Lubumbashi region (69 and 58 mg.kg-1), the mean and median Zn concentrations in the Katapula tailings (22365 and 14900 mg.kg-1) are much higher (Table 2).
3.1.3. Correlating the Concentrations of the Different Parameters Analyzed
Figure 2 shows the results of the Principal Component Analysis (PCA). Two principal axes (CP1 and CP2) accounting for 99.79% of the total variation were extracted from this analysis. As, Ag, Cl, S, Fe, Pb and Mo have larger positive loadings along the CP1axis, while pH, Ti, Mn, Ca, Rb and Cr have larger negative loadings along the CP1axis. Pb, Cu, Sb, Zn, Cd, Fe, and Cr are variables with the largest positive charges on CP2, while Mo, Ag, Cl, and Rb are negative charged on CP2. The total PCA pattern shows that Cu, Cd, Pb, Fe, Sb and Zn have positive correlations on CP 2, while As, S, Mo, Ag and Cl have positive correlations on CP 1. pH, Mn, Ti, Ca, Rb and Co have positive correlations, while S, Ag, Cl, Mo, As have negative correlations on CP 1.
The results of the Pearson correlation (Table 2) confirmed the trends observed in the PCA. It allowed a more detailed analysis of the significant correlations between the parameters. In fact, the following correlations were found to be significant (P < 0.05)
- ✓
- Positive significant correlations were observed between pH, Ca, Mn, Cd and Ti.
- ✓
- Significant positive correlations were observed between S, Fe, As, Cu, Mo and Pb. Significant positive correlations with Cl and Ag are also found for As, Mo and Pb.
- ✓
- In contrast, pH, Ca, Mn, Cd and Ti are significantly negatively correlated with S, Fe, Cl, As, Ag, Mo and Pb.
- ✓
- Co shows a significant negative correlation with both Ca and Rb. Rb also has a negative correlation with S and Cu.

Table 3.
Matrix of the correlation between the different chemical elements.
| pH | Ca | S | Fe | Mn | Cl | As | Ag | Cd | Co | Cr | Cu | Mo | Pb | Rb | Sb | Ti | Zn | |
|---|---|---|---|---|---|---|---|---|---|---|---|---|---|---|---|---|---|---|
| pH | 1,0 | |||||||||||||||||
| Ca | 0,7*** | 1,0 | ||||||||||||||||
| S | -0,8*** | -0,6*** | 1,0 | |||||||||||||||
| Fe | -0,2*** | -0,3 | 0,7*** | 1,0 | ||||||||||||||
| Mn | 0,9*** | 0,8*** | -0,7*** | -0,4* | 1,0 | |||||||||||||
| Cl | -0,4* | -0,3 | 0,2 | -0,1 | -0,4 | 1,0 | ||||||||||||
| As | -0,8*** | -0,5** | 0,7*** | 0,6*** | -0,7*** | 0,3* | 1,0 | |||||||||||
| Ag | -0,4* | -0,4* | 0,3 | -0,1 | -0,4** | 0,4** | 0,3* | 1,0 | ||||||||||
| Cd | 0,3* | 0,4* | -0,3 | 0,1 | 0,4** | -0,2 | -0,1 | -0,1 | 1,0 | |||||||||
| Co | 0,1 | -0,5** | 0,0 | -0,2 | -0,0 | -0,0 | -0,3 | -0,1 | -0,3 | 1,0 | ||||||||
| Cr | 0,1 | -0, | -0,2 | -0,2 | -0,0 | -0,1 | -0,2 | 0,0 | 0,3 | 0,3 | 1,0 | |||||||
| Cu | -0,2 | -0,3 | 0,4* | 0,3* | -0,2 | 0,2 | 0,3* | 0,1 | 0,5*** | 0,1 | 0,2 | 1,0 | ||||||
| Mo | -0,5** | -0,4* | 0,6*** | 0,1 | -0,5** | 0,4** | 0,5* | 0,4** | -0,5** | -0,0 | -0,3 | 0,2 | 1,0 | |||||
| Pb | -0,5** | -0,3 | 0,5** | 0,5** | -0,4* | 0,4** | 0,6** | 0,2 | 0,4* | -0,2 | 0,1 | 0,8*** | 0,2 | 1,0 | ||||
| Rb | 0,2 | 0,3 | -0,4* | -0,3 | 0,1 | 0,0 | -0,1 | 0,1 | 0,2 | -0,6*** | 0,1 | -0,4* | -0,2 | -0,1* | 1,0 | |||
| Sb | -0,1 | -0,1 | 0,1 | 0,4** | -0,0 | -0,1 | 0,1 | -0,1 | 0,5** | -0,0 | -0,1 | 0,5*** | -0,3 | 0,4* | -0,2 | 1,0 | ||
| Ti | 0,7*** | 0,3* | -0,6*** | -0,2 | 0,7*** | -0,5*** | -0,7*** | -0,5*** | 0,3* | 0,2 | 0,3 | -0,2 | -0,6*** | -0,4 | 0,2 | 0,0 | 1,0 | |
| Zn | 0,1 | 0,2 | -0,1 | 0,3 | 0,2 | -0,1 | 0,2 | -0,1 | 0,8*** | -0,2 | 0,2 | 0,6*** | -0,2 | 0,5*** | -0,1 | 0,5 | 0,1 | 1,0 |
*Significant difference (p < 0.05); **Highly significant difference (p < 0.01); ***Very highly significant difference (p < 0.001).
Below we notice simple linear correlations for positive and negative correlations are shown in Figure 3, Figure 4 and Figure 5. Figure 3 shows the correlations between the different fertility parameters, Figure 4 shows the correlations between the fertility parameters and the trace metals, while Figure 5 shows the positive correlations between the trace metals.
Figure 3.
Correlations among fertility parameters.
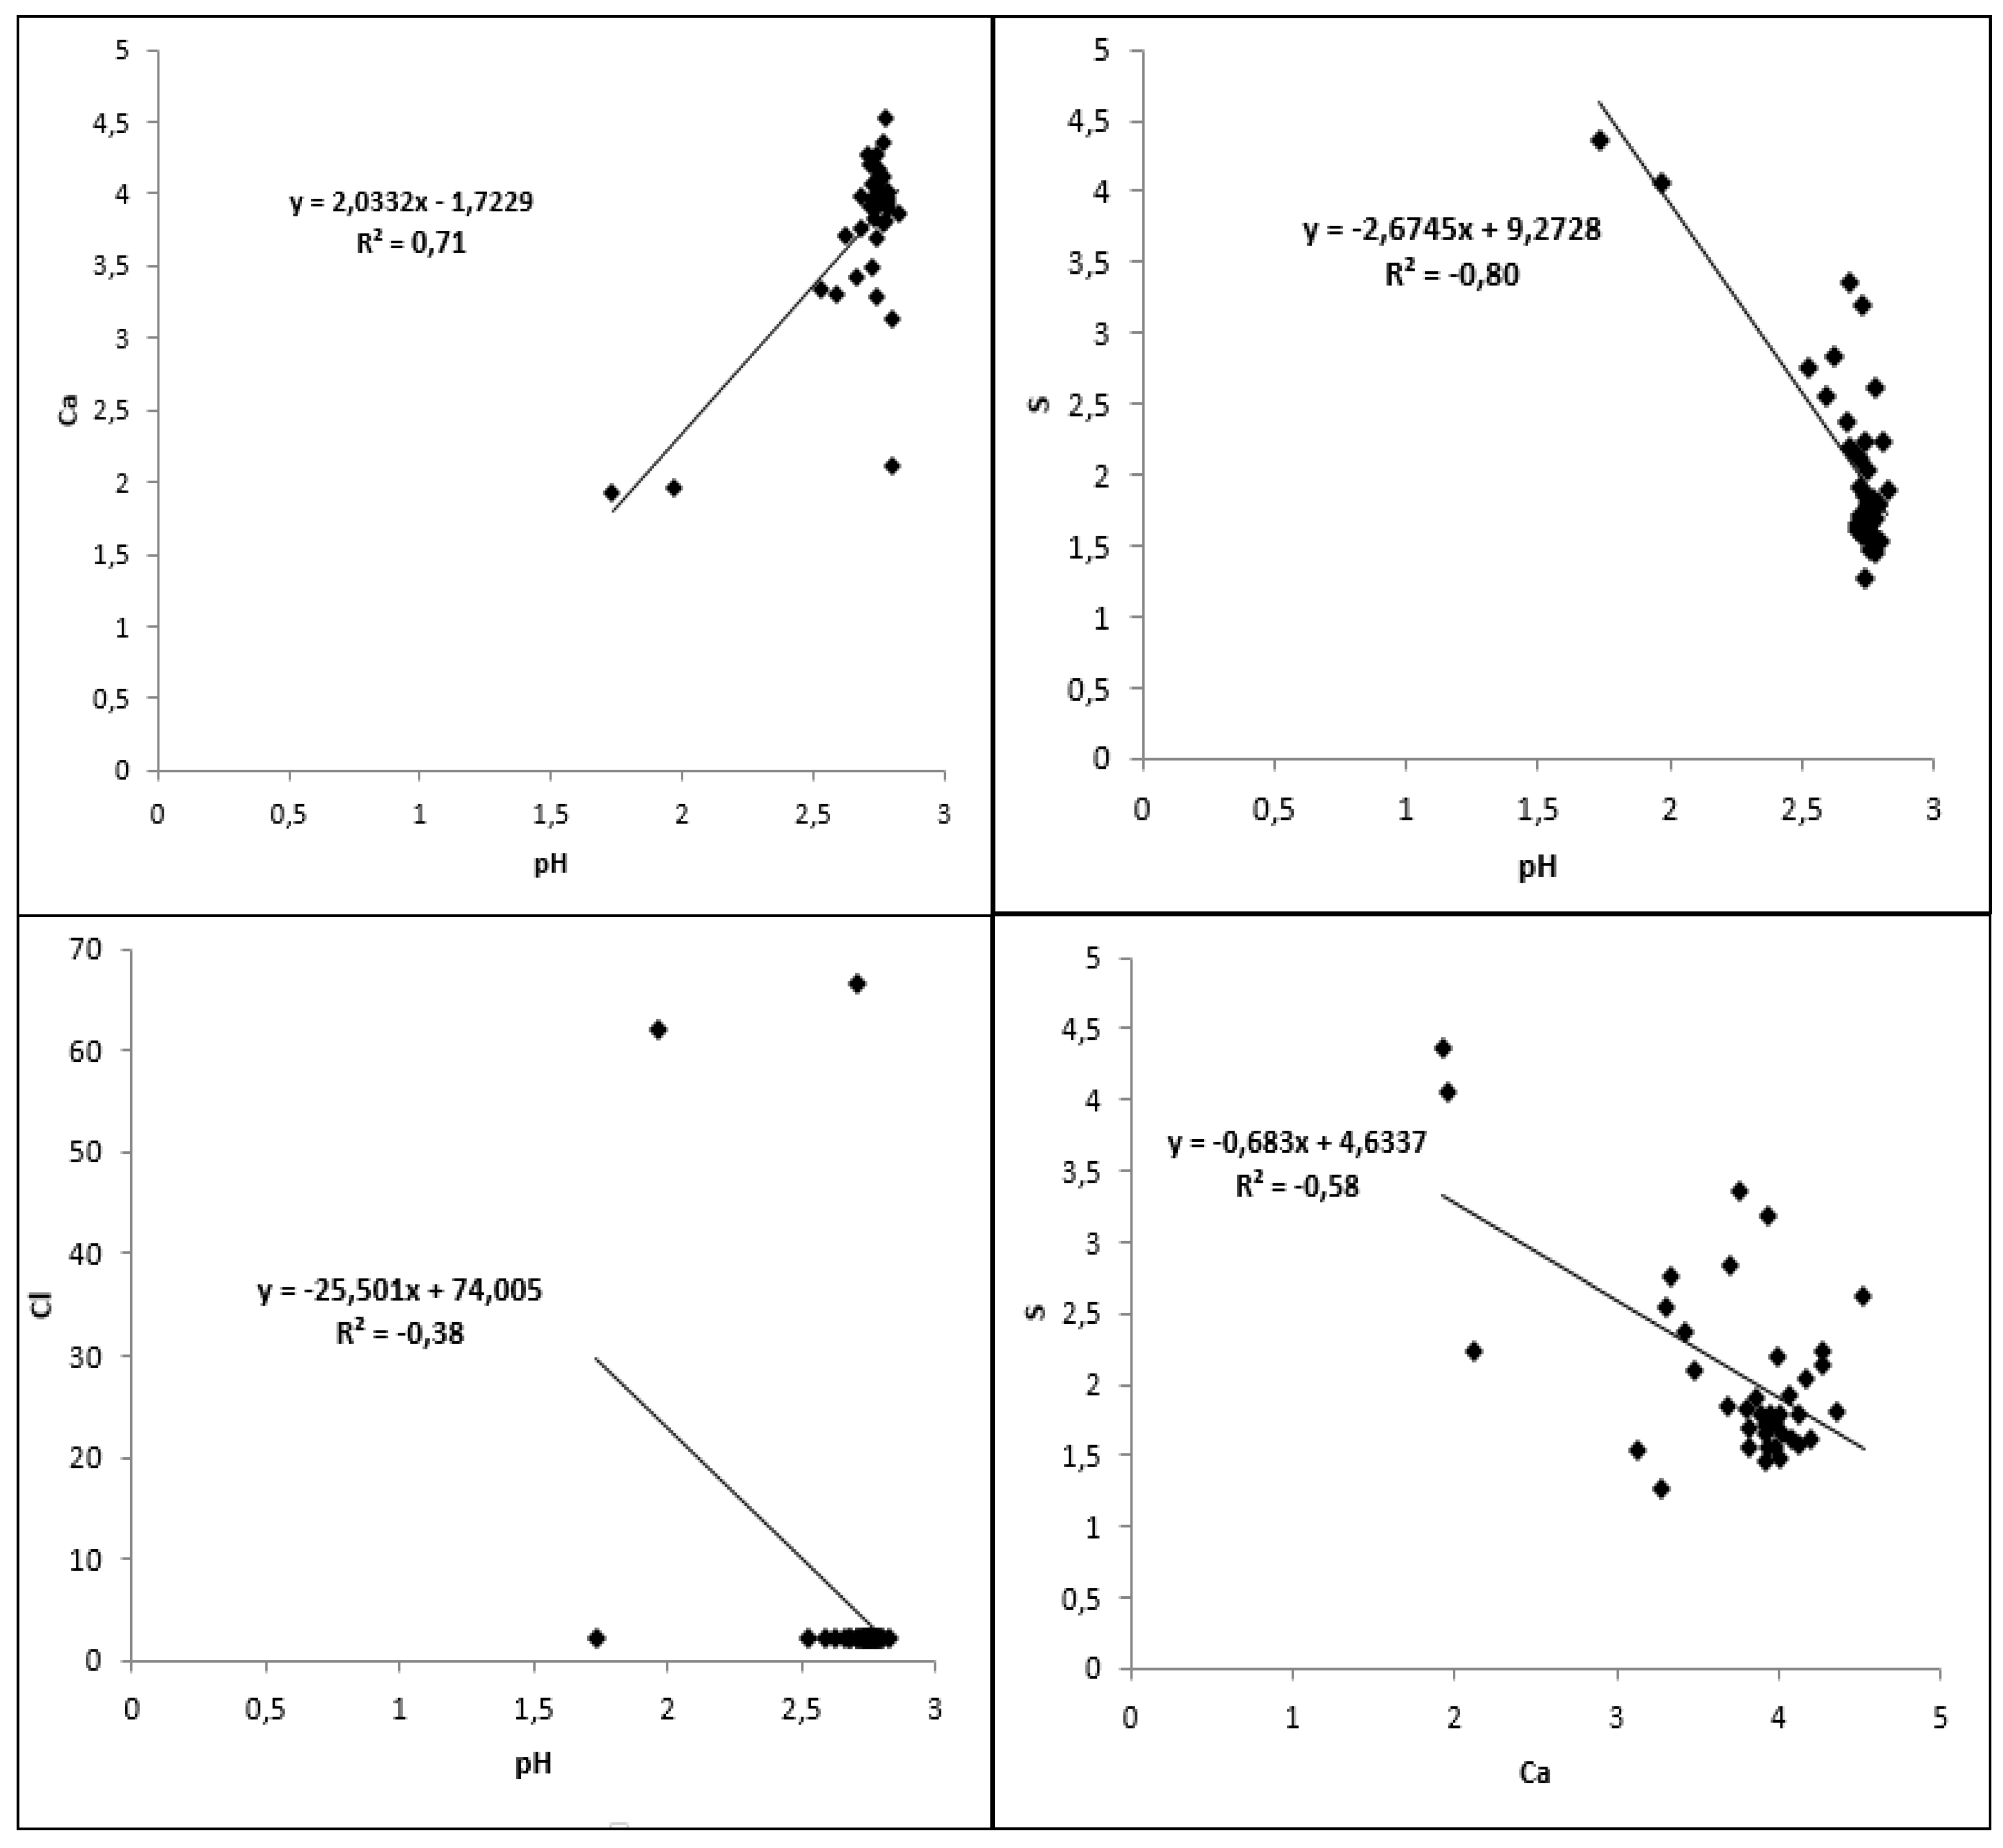
Figure 4.
Correlations between the fertility parameters (%) and the trace metals (mg.kg-1).
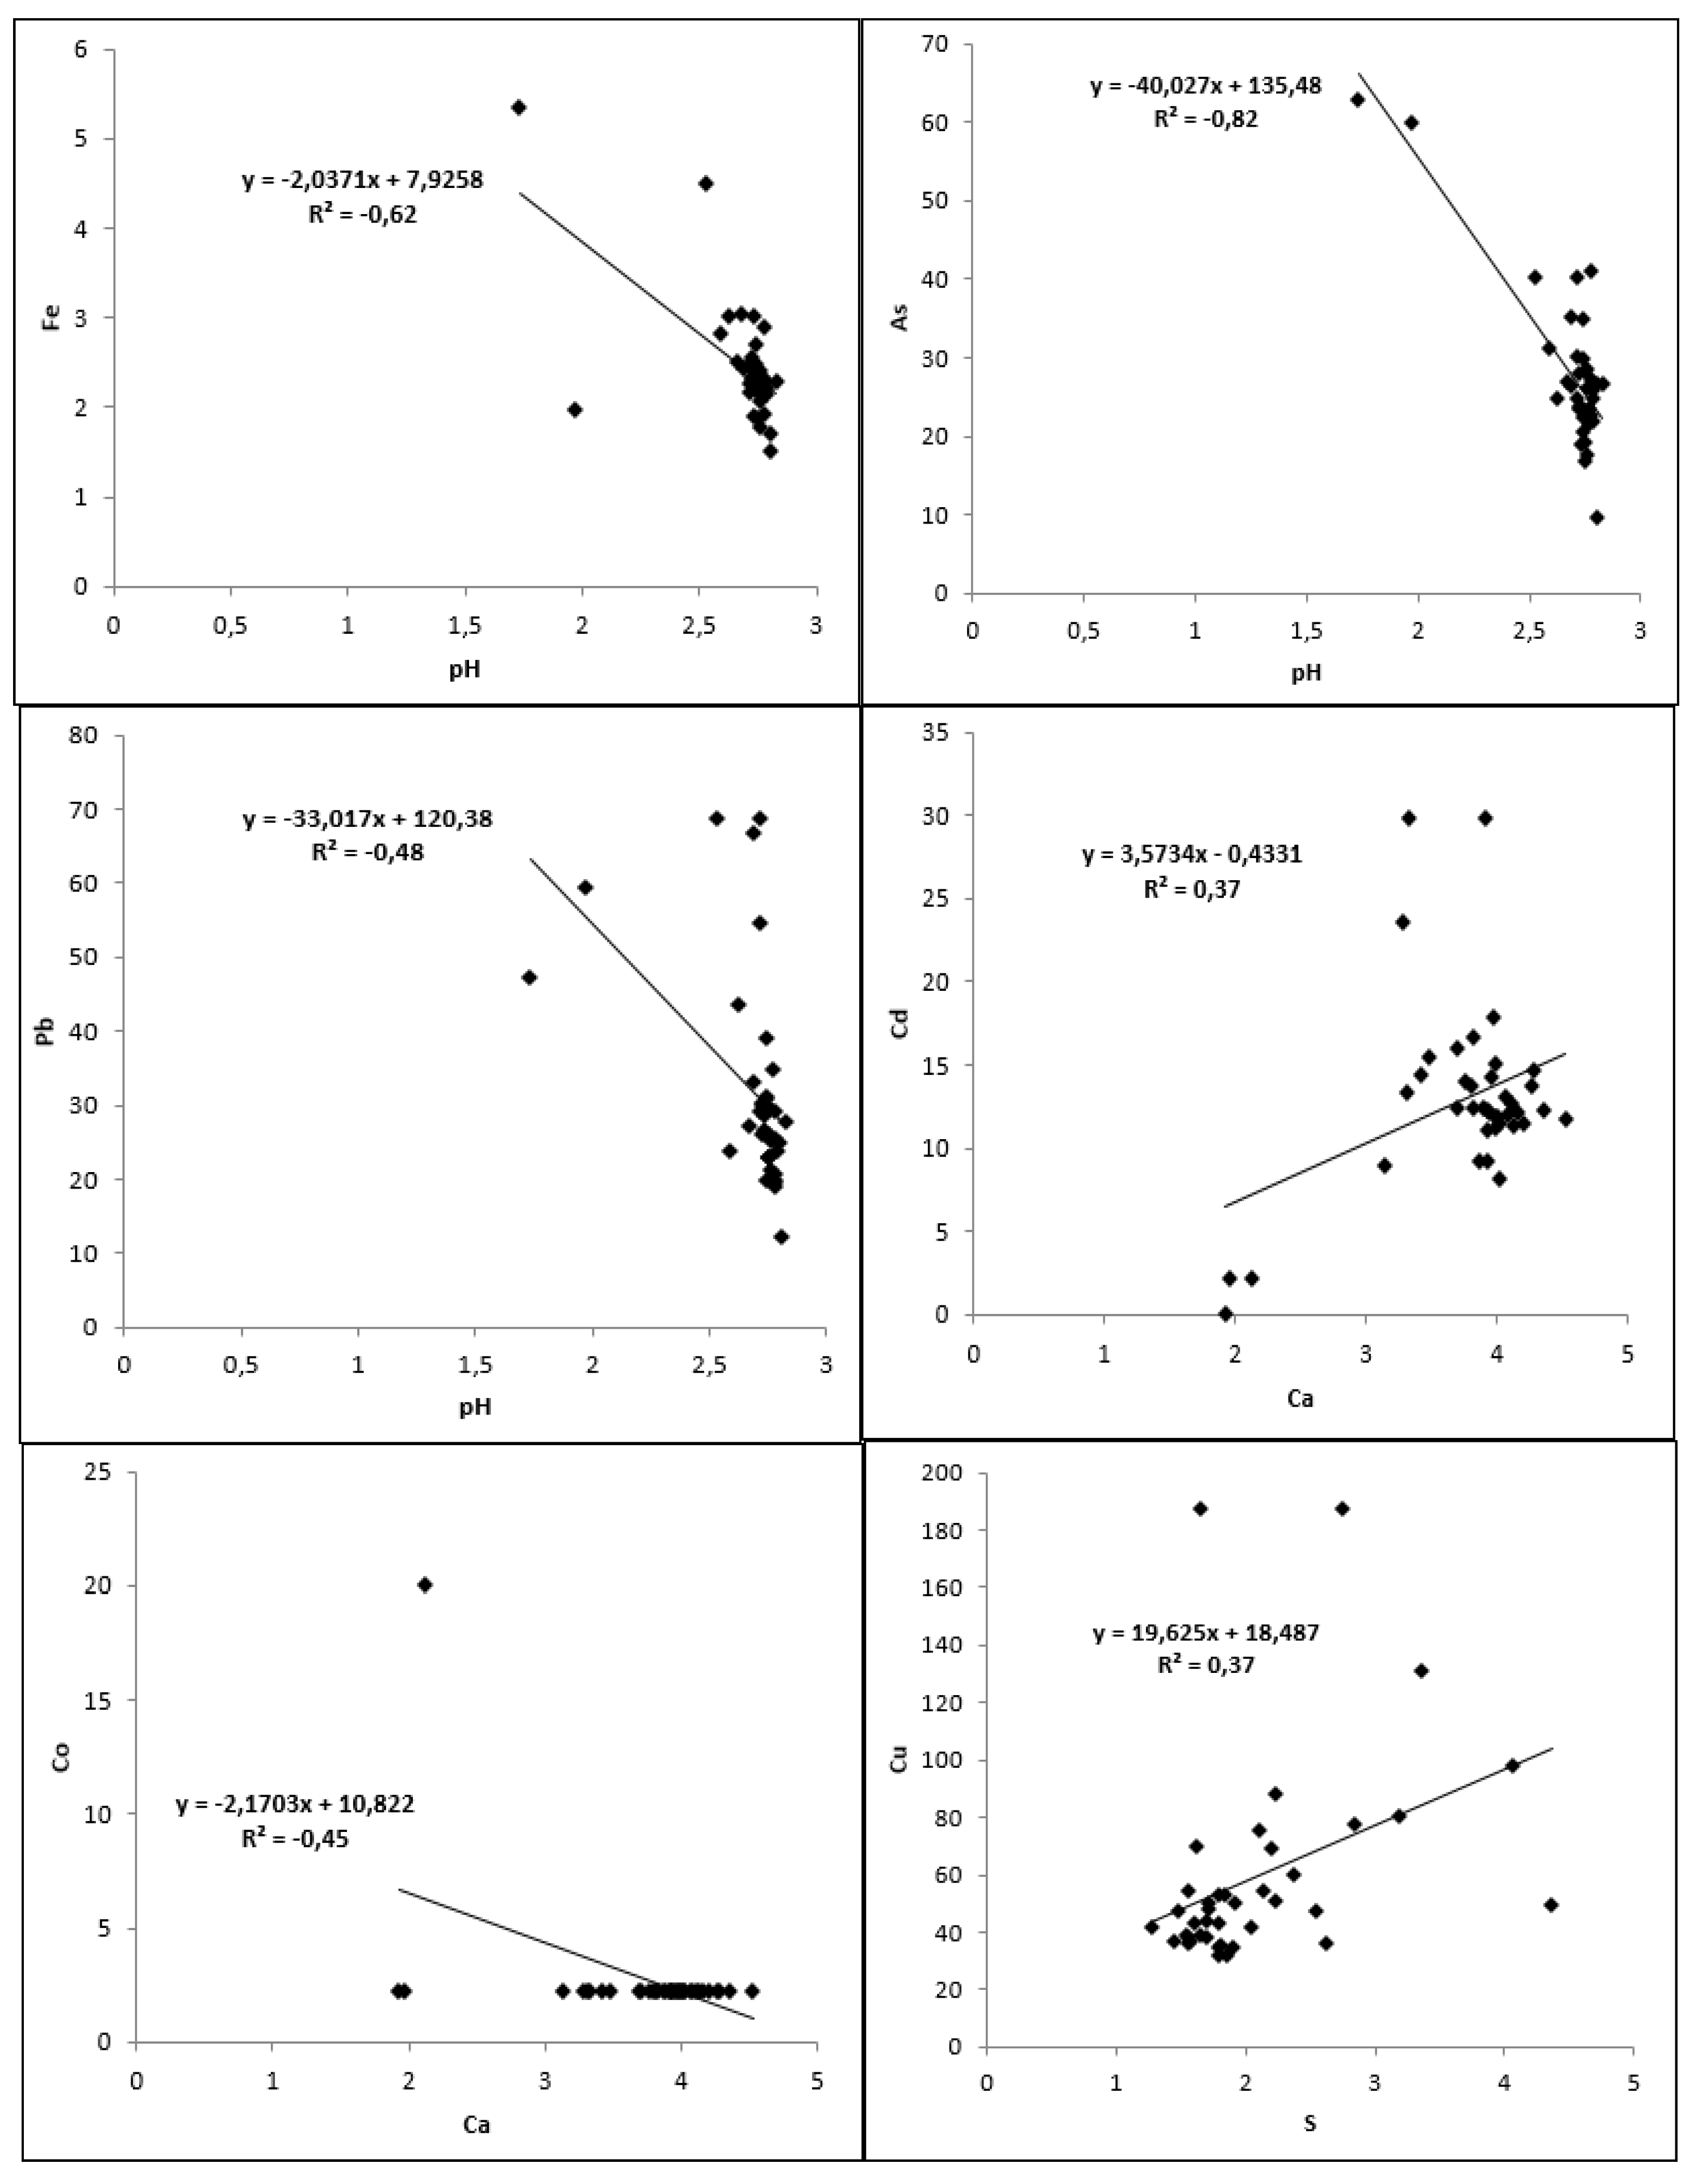
Figure 5.
correlations between the trace metals.
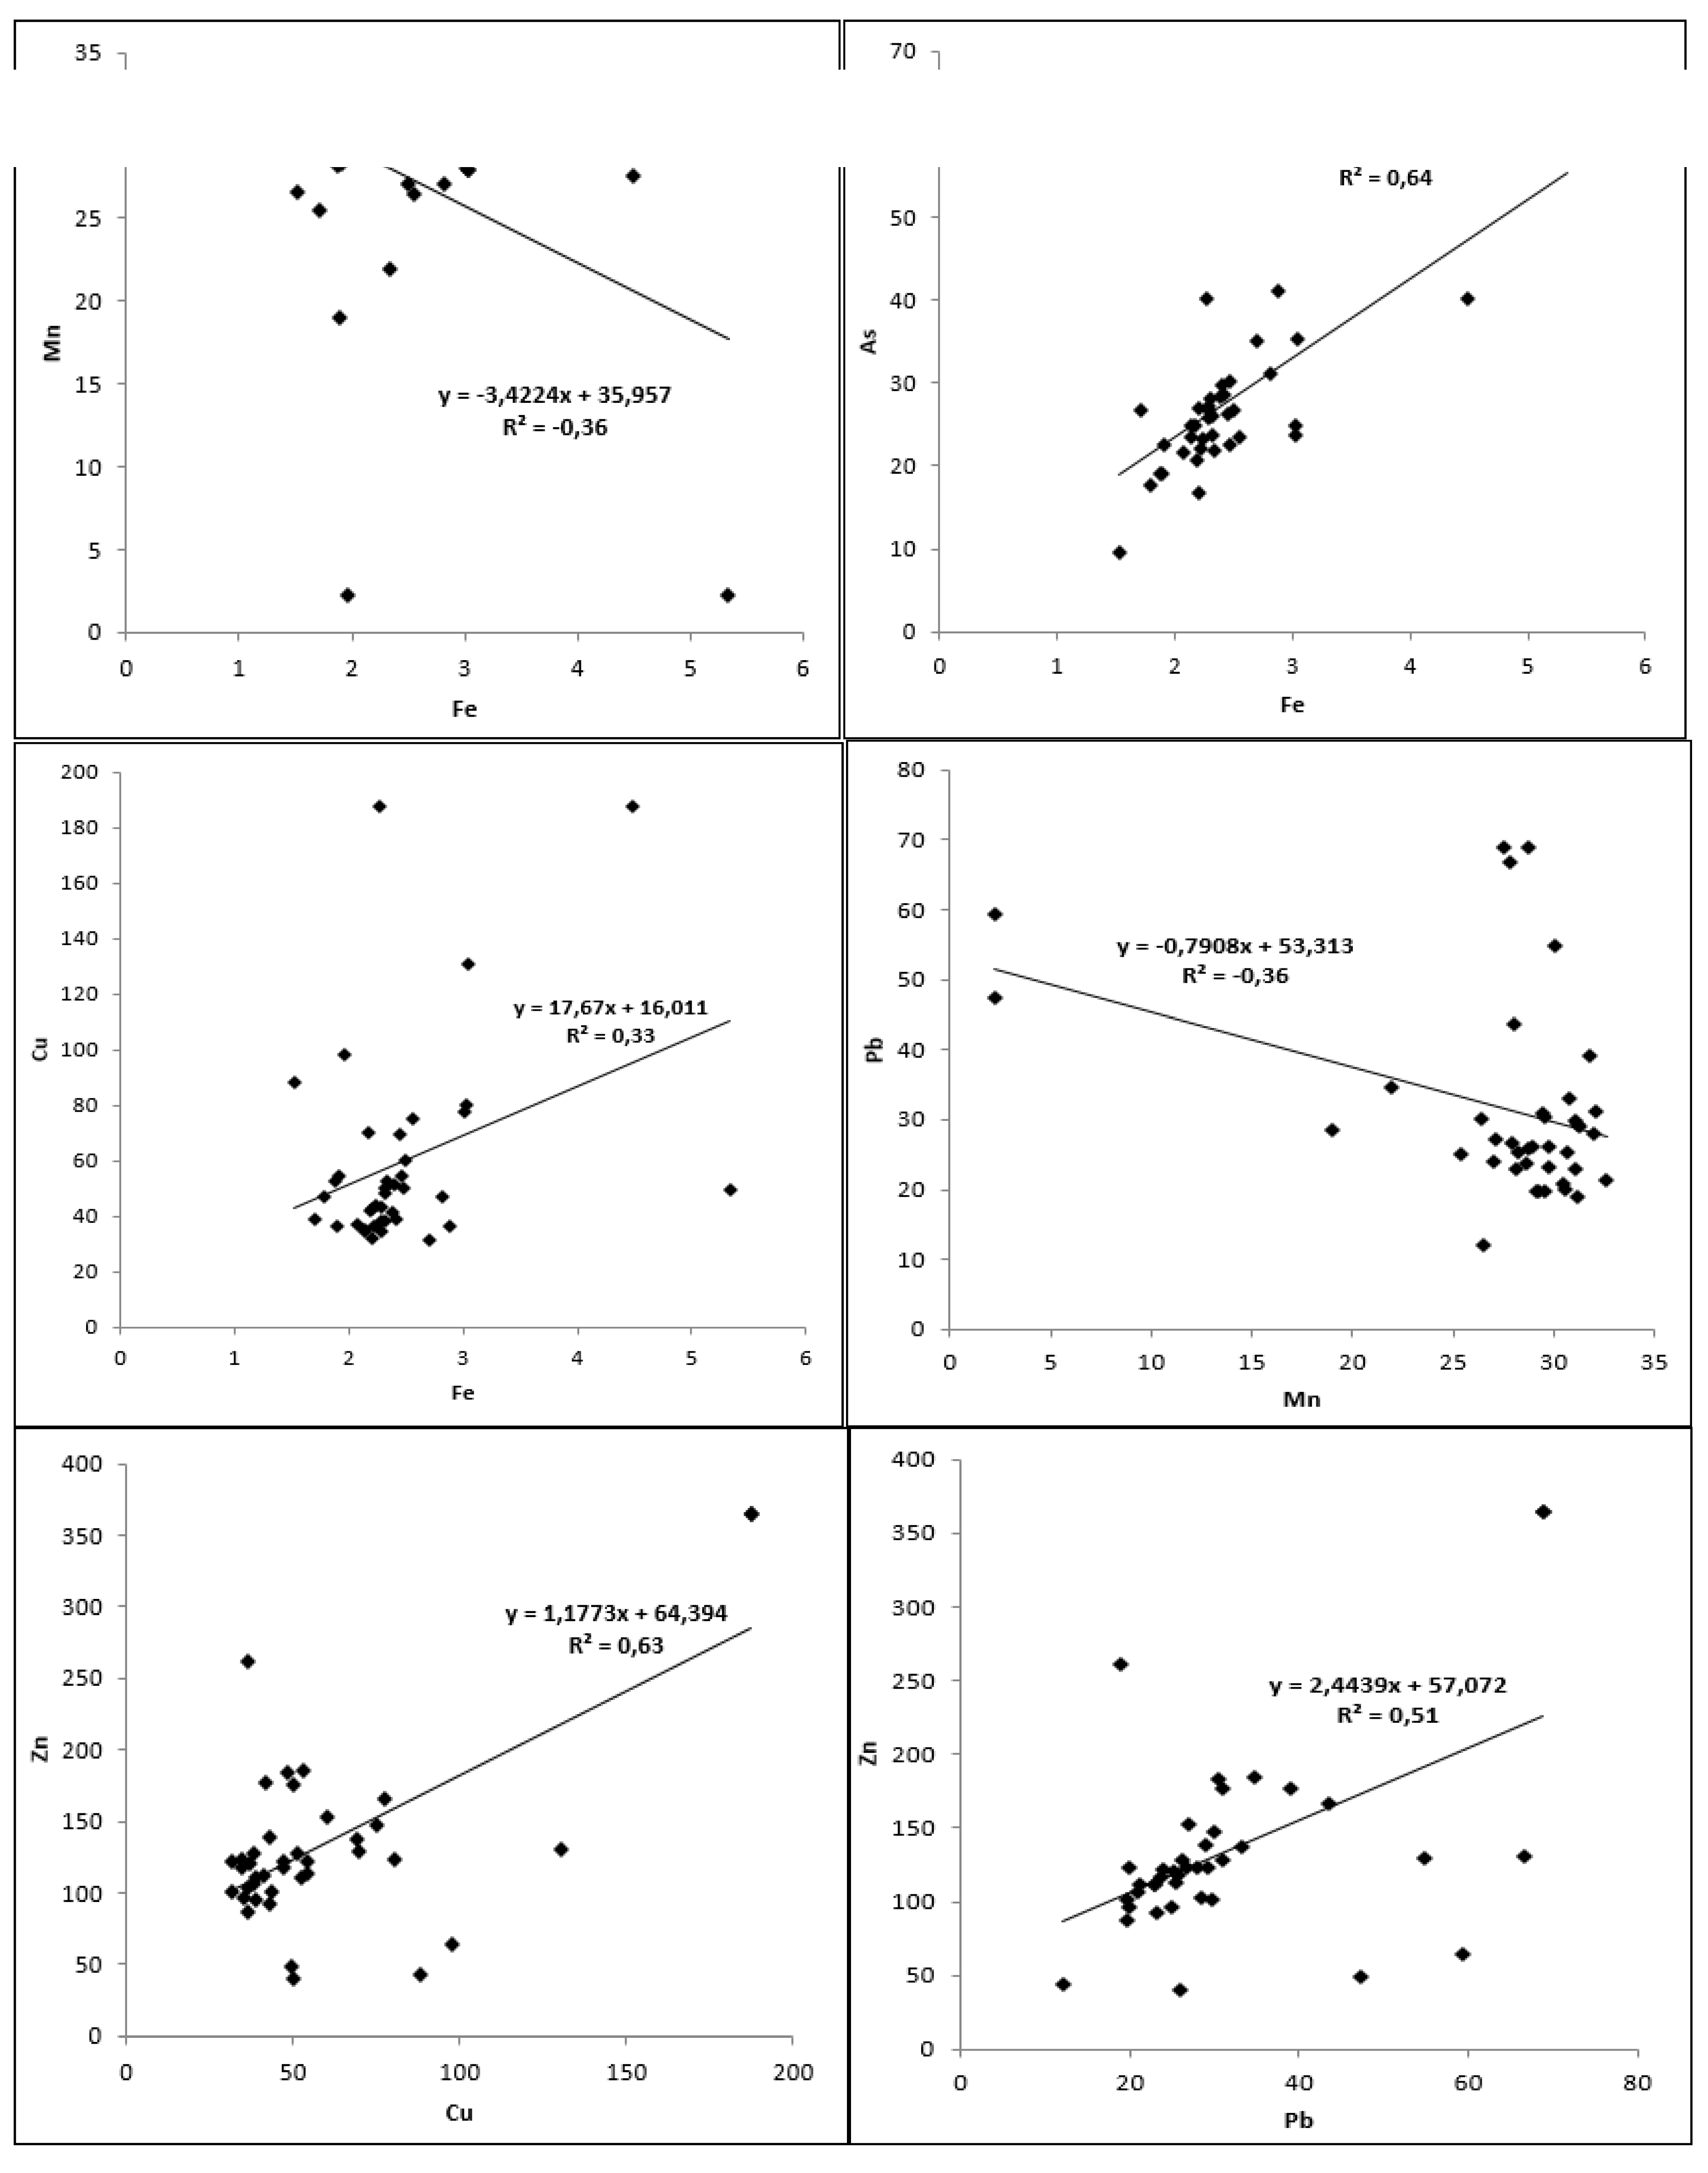
Figure 6.
Spatial distribution of heavy metal concentration for Ag, Cd, As, Cl, Co, Cr, Cu, Fe, Mn in Katapula Basin.
Figure 6.
Spatial distribution of heavy metal concentration for Ag, Cd, As, Cl, Co, Cr, Cu, Fe, Mn in Katapula Basin.
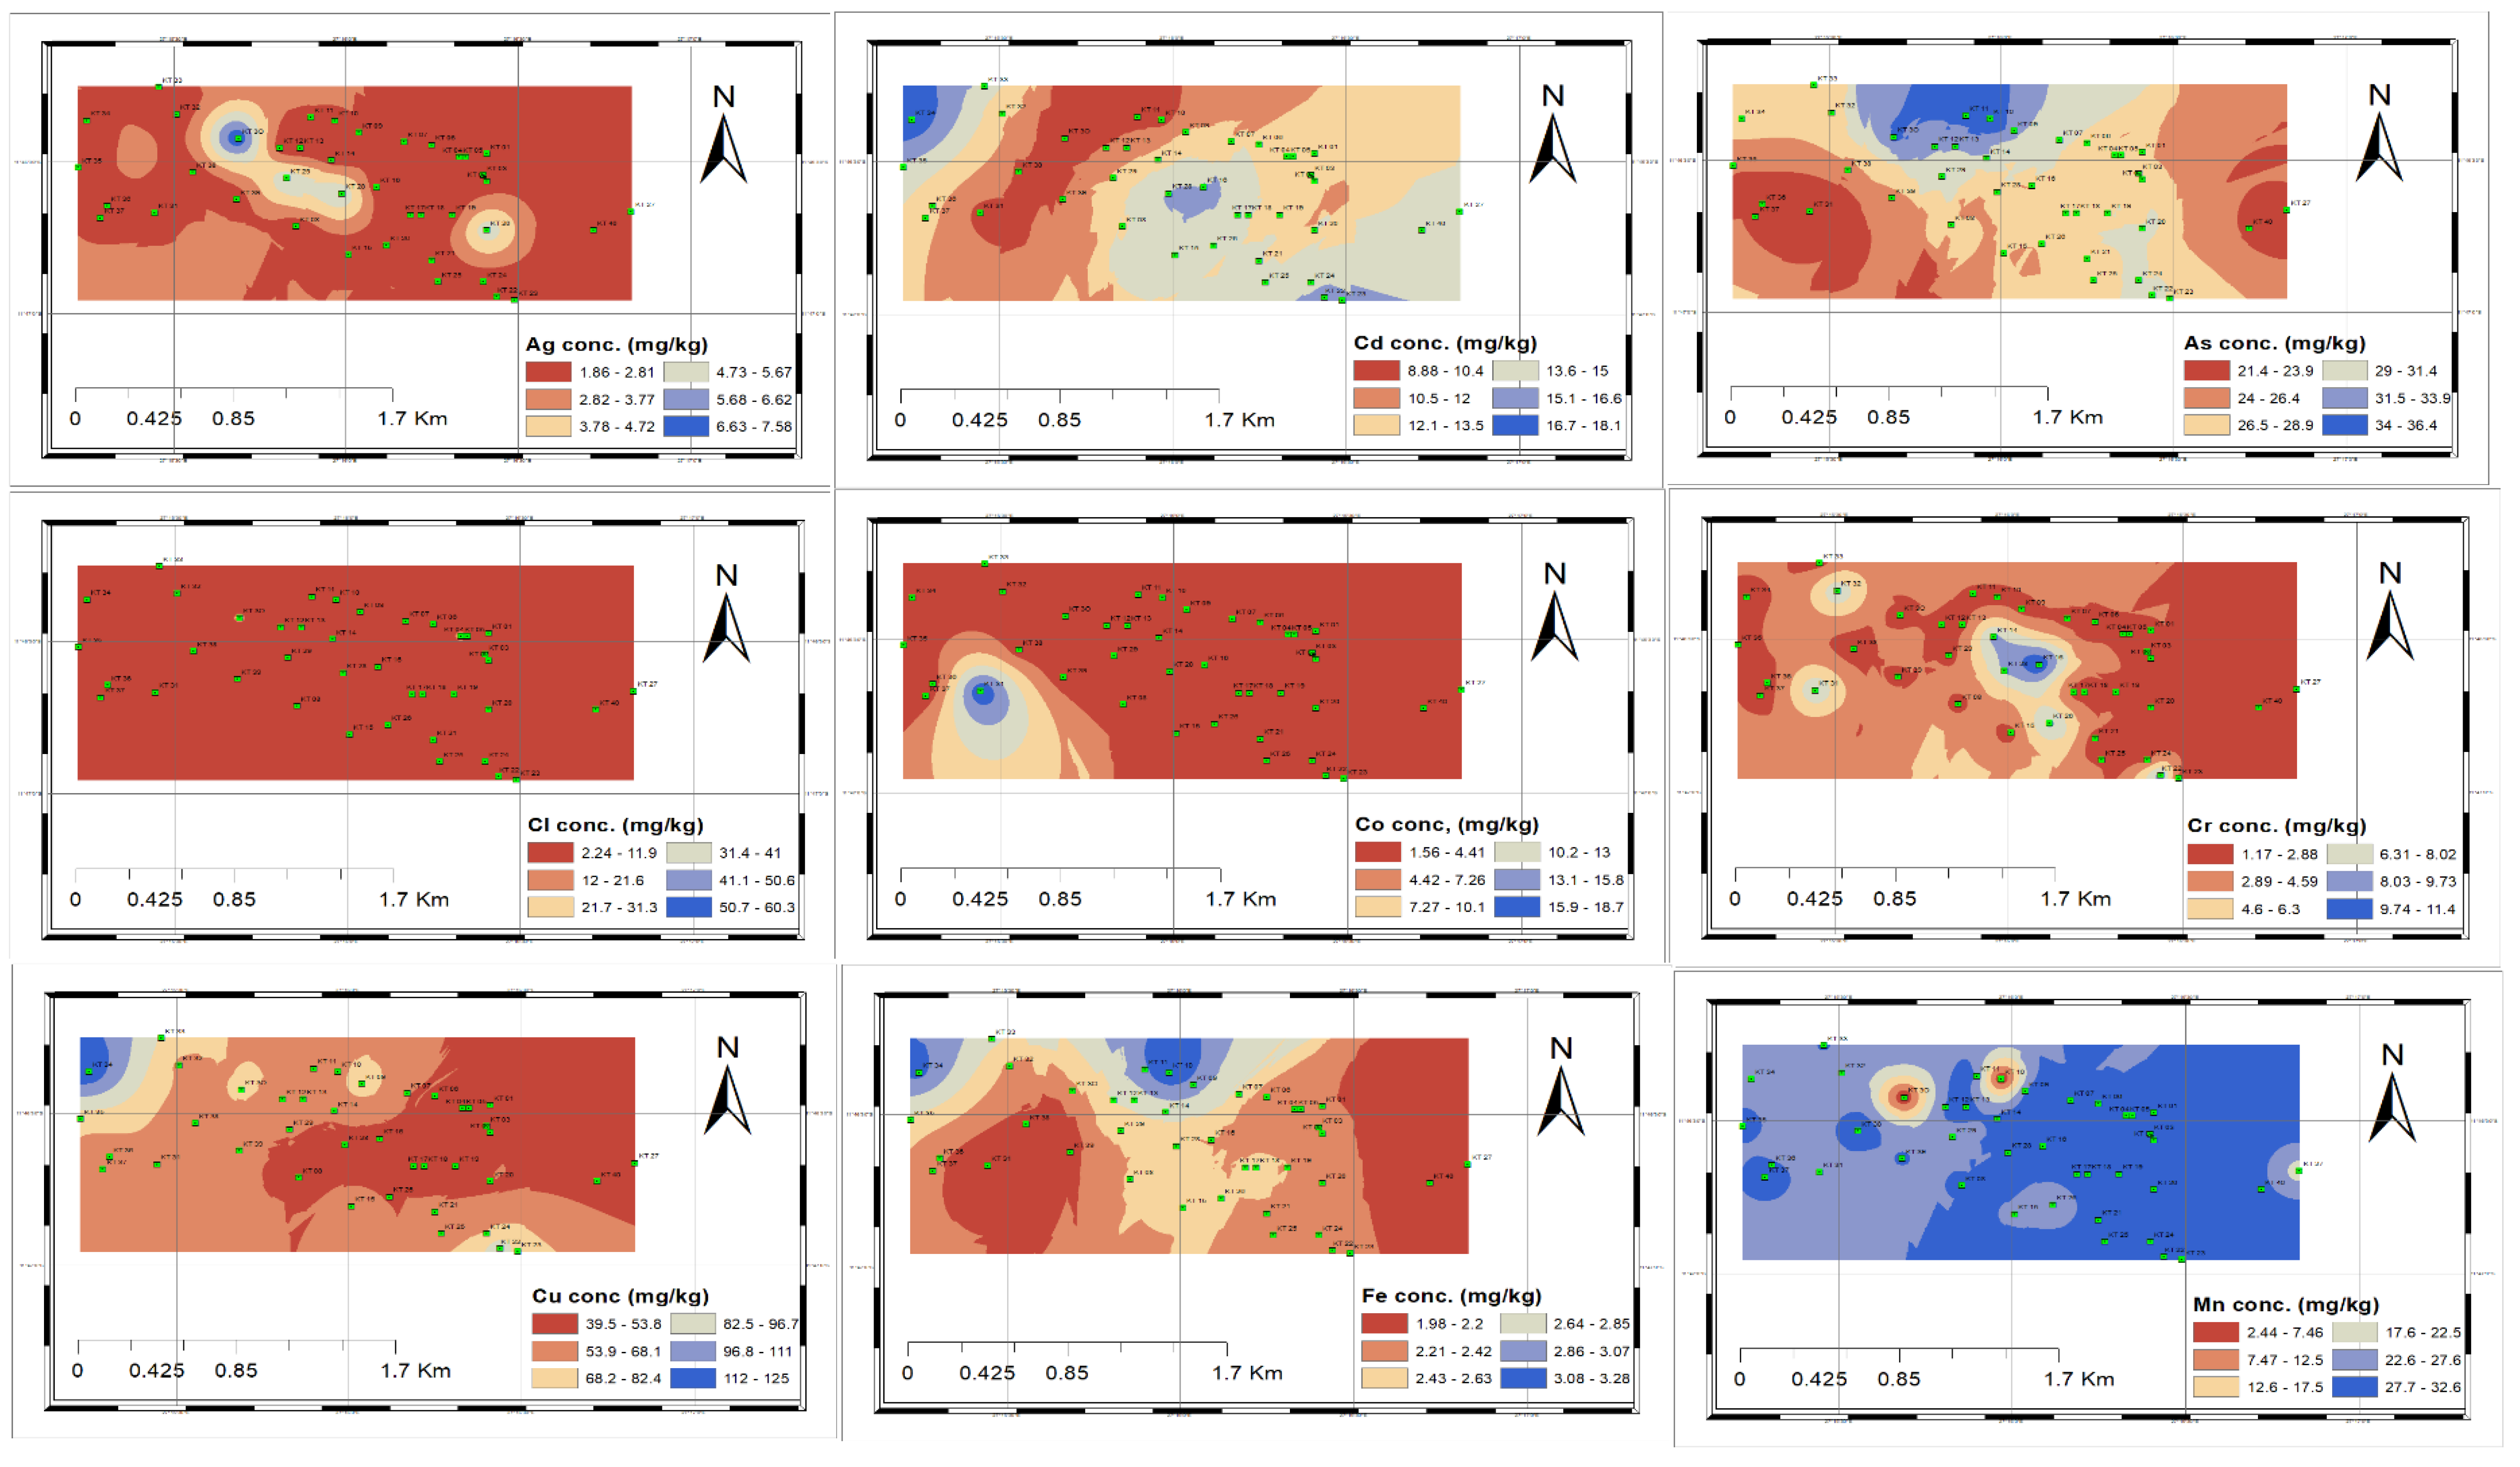
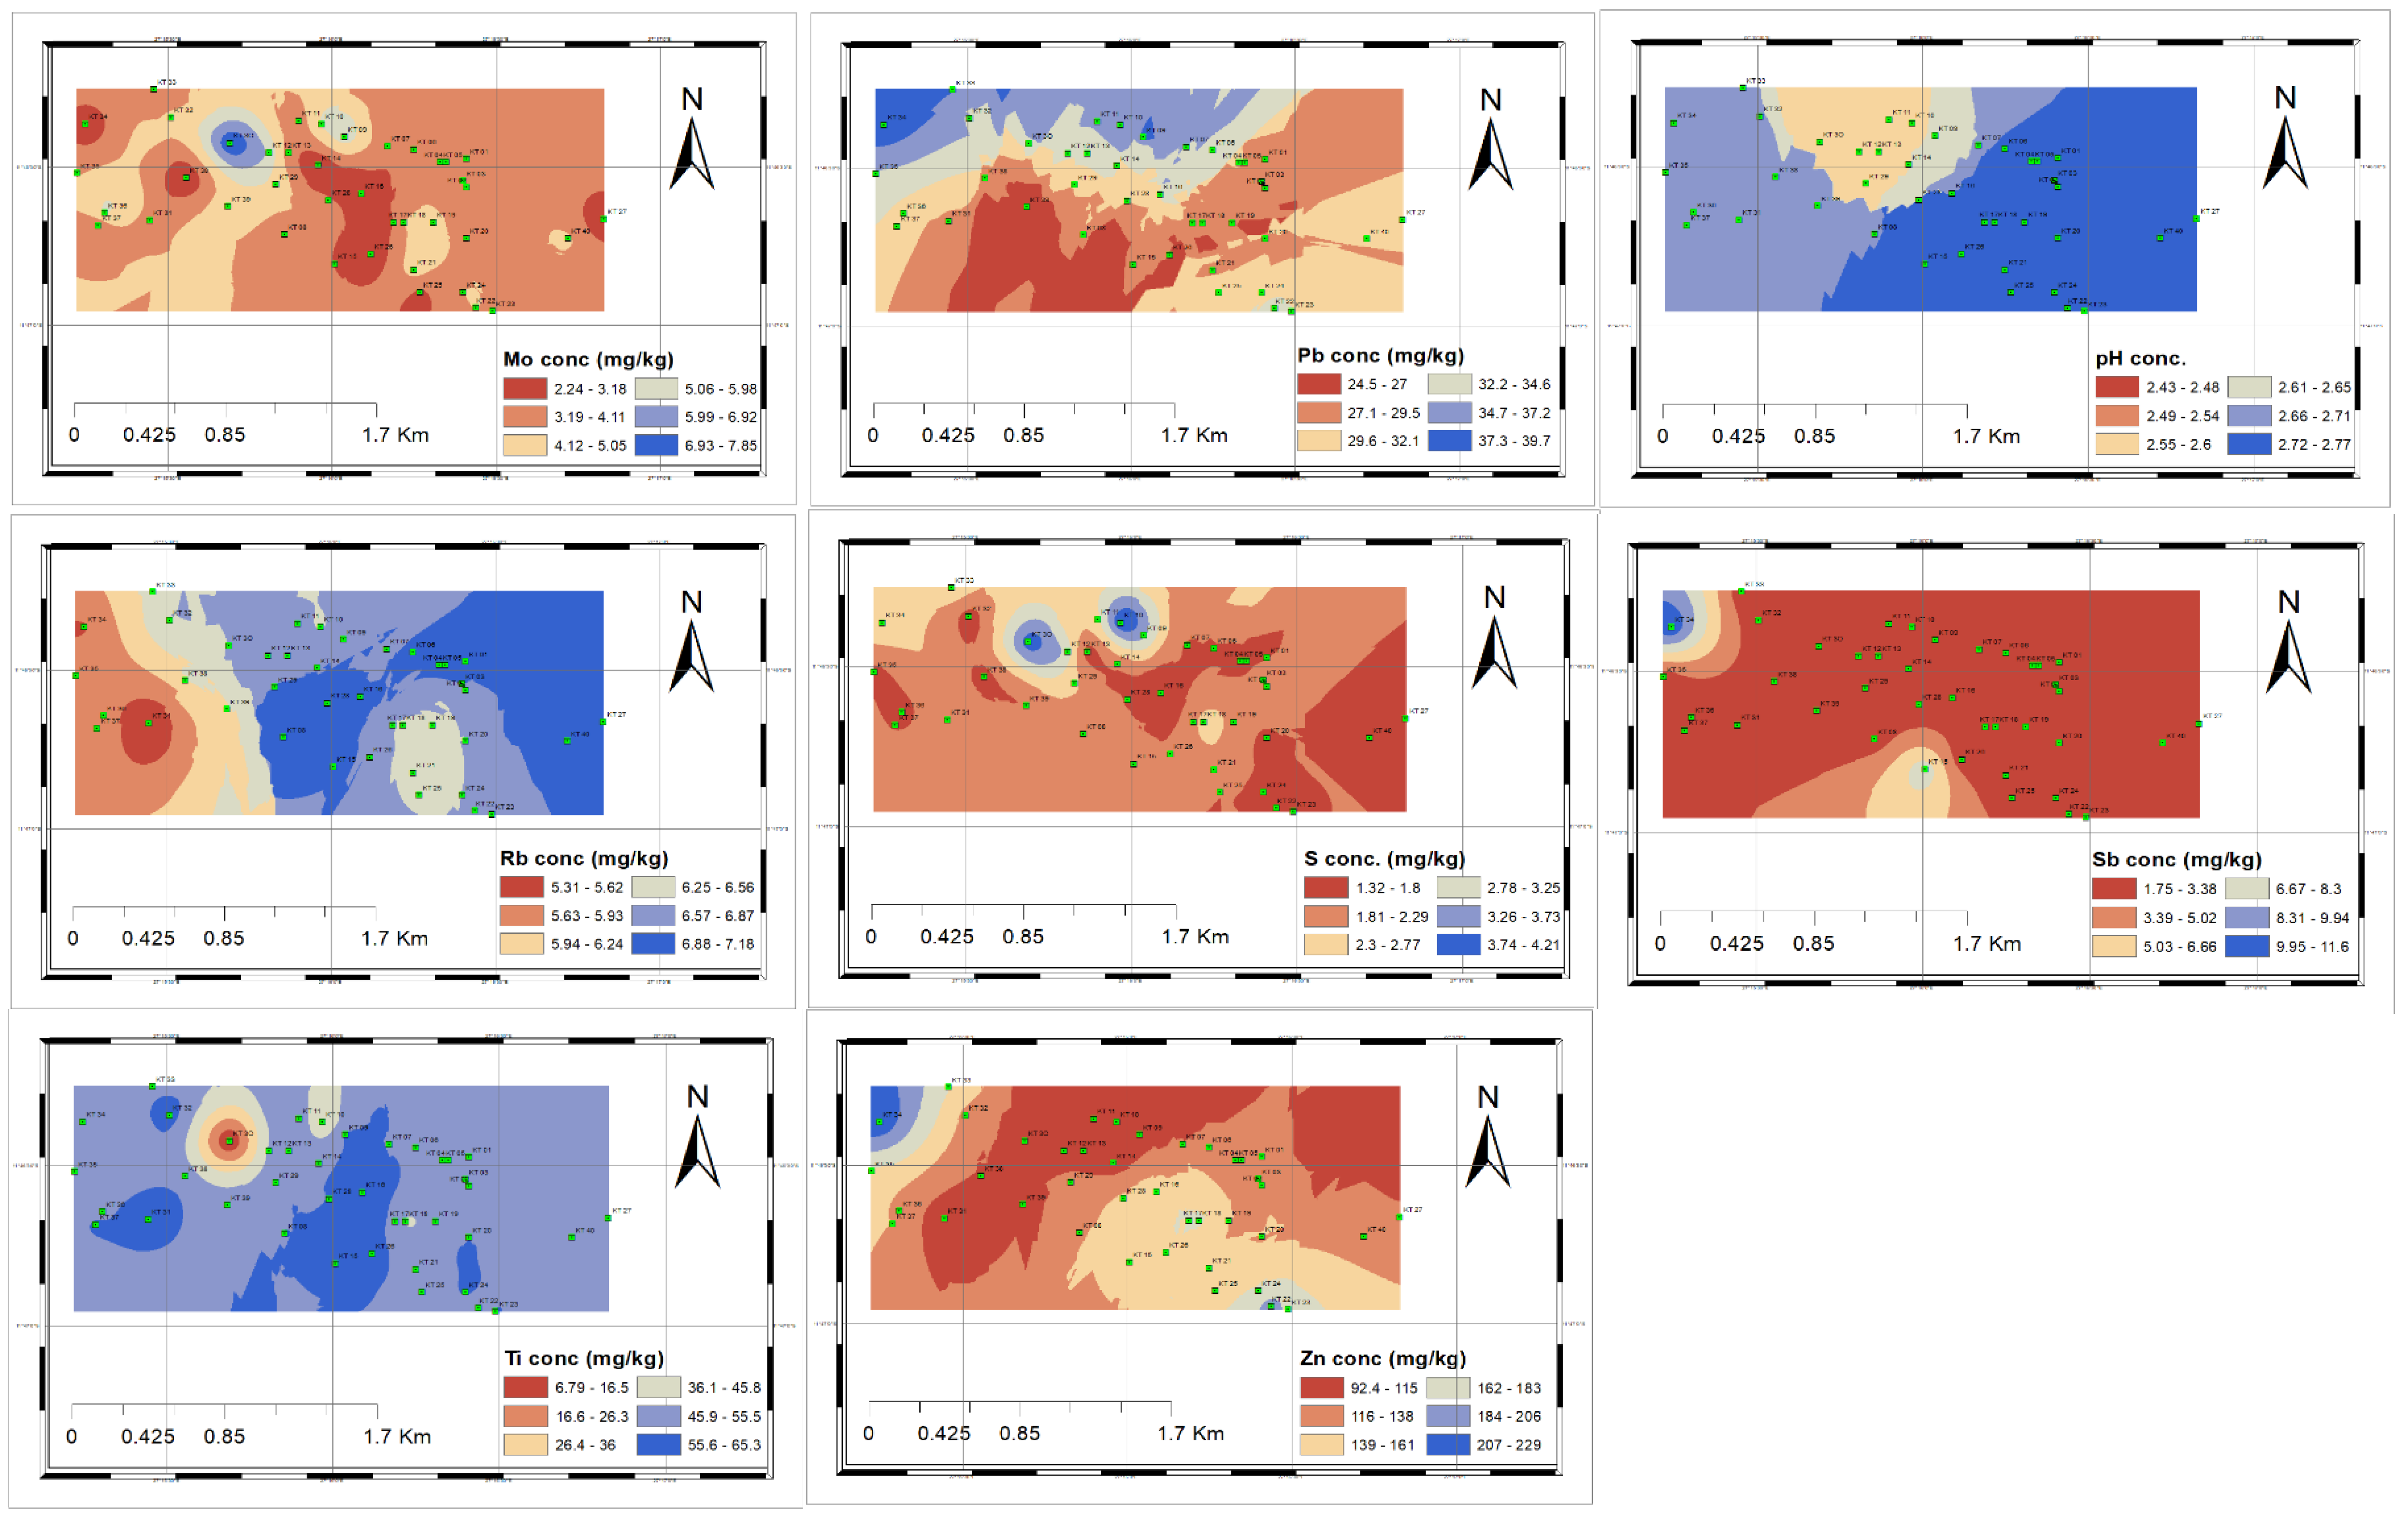
Figure 7.
Spatial distribution of pH and heavy metal concentration for Mo, Pb, Rb, S, Sb, Ti and Zn in Katapula Basin.
Figure 7.
Spatial distribution of pH and heavy metal concentration for Mo, Pb, Rb, S, Sb, Ti and Zn in Katapula Basin.
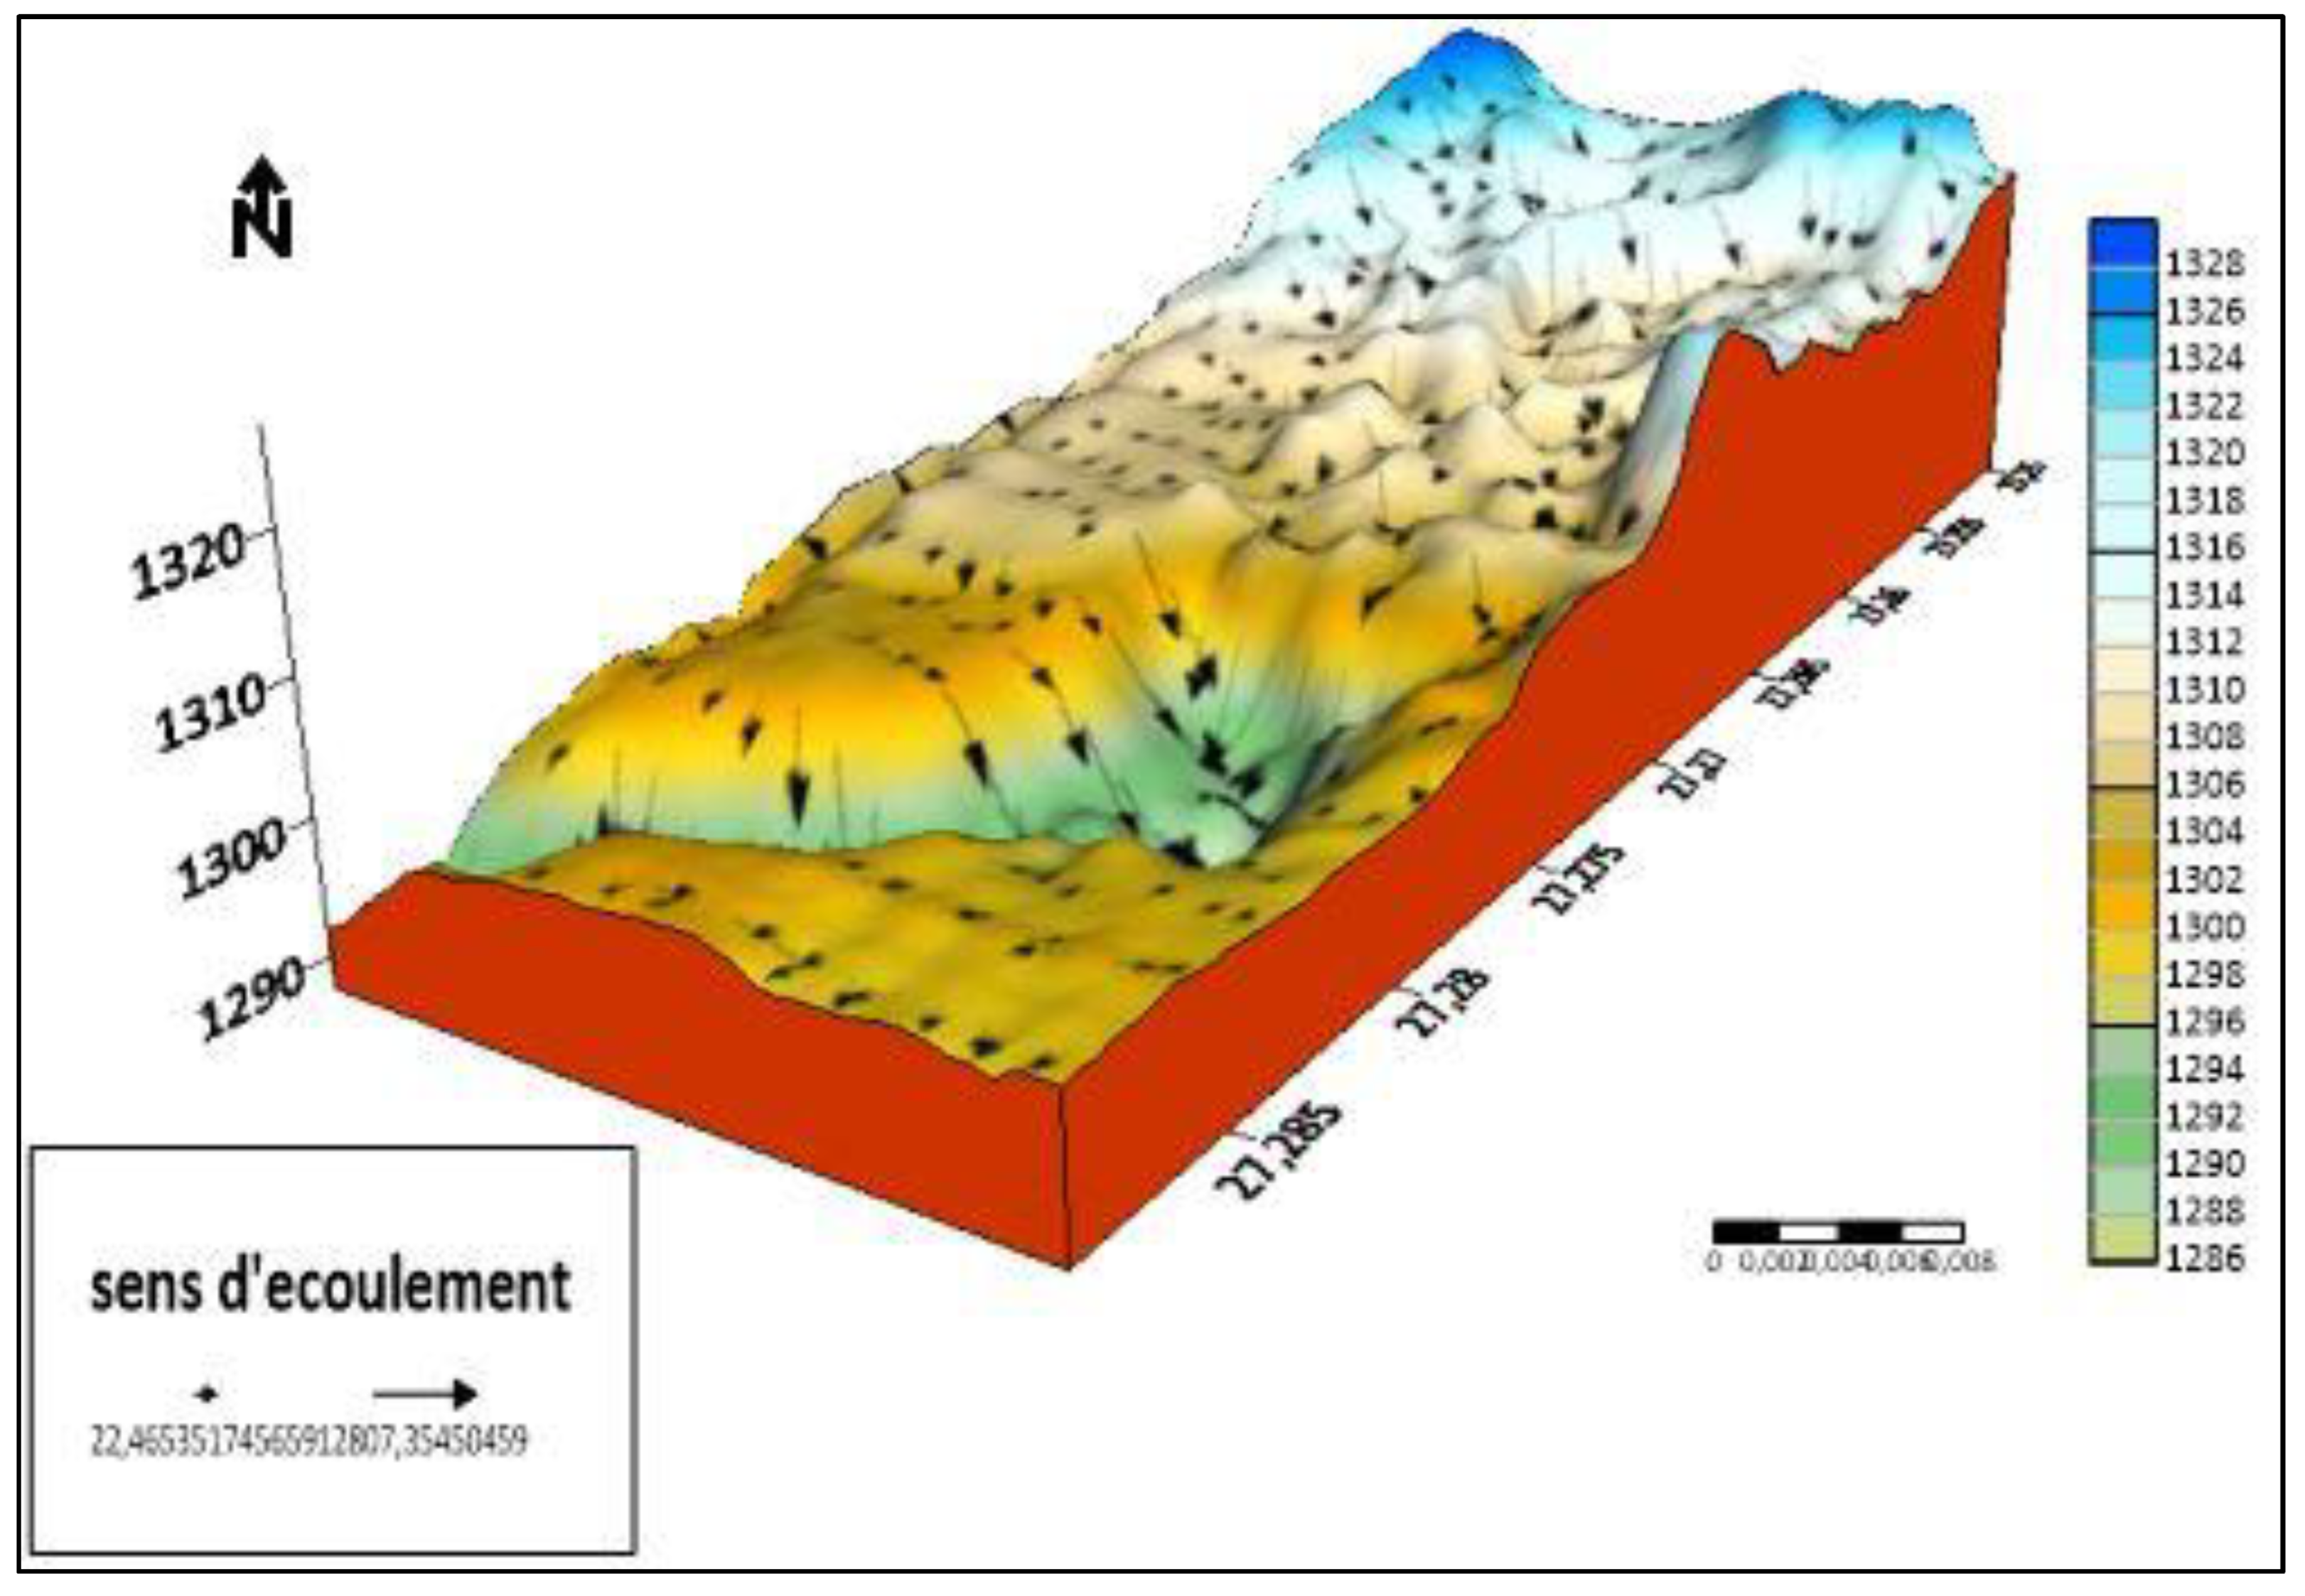
3.1.4. Digital Terrain Model (DTM) of the Sedimentation Basin.
As shown in Figure 12, the tailings basin has irregular topography, with a high level in the third dyke above 1,314 m, a mid-level in the second dyke between 1,300 and 1,314 m, and a low level in the third dyke below 1,200 m. Water flows preferentially from higher to lower levels in a south-north direction. In a south-north direction, water flows preferentially from higher to lower elevations. As a result, load accumulation preferentially occurs in basin 3. However, in addition to this general direction, there are local gradients that influence the flow on a smaller scale, not necessarily in the general direction.
In all cases, the Kipushi River is the main reservoir that receives the water from the sedimentation basin and provides for the evacuation of the water out of the valley.
Figure 8.
Digital terrain model and the direction of the water flow in the sedimentation basin.
3.2. Discussion
High total concentrations of Zn, Cu including Ti, As, Pb were found in the XRF analyses of samples taken from the mine tailings (Table 1). With the exception of Co, the observed concentration levels were much higher than the values of the soil taken as a reference from the region of Lubumbashi (Table 2). In other words, the levels of trace metals are higher than the reference pedo-geochemical background for soils that are considered to be uncontaminated in the region (Shutcha et al., 2015). In particular, Zn levels in tailings from the Kipushi Basin, on average, are 324-fold higher than the value considered as reference for less polluted soil in the area (22.365 mg.kg-1 versus 69 mg.kg-1), while Cu and Pb levels in tailings from the Kipushi Basin, on average, are 26-fold and 30-fold higher than the values considered as maximum normal. However, it should be emphasized that the values used as reference for comparison are pedo-geochemical background values. These values have been obtained from previous work on soils in and around Lubumbashi. Therefore, a much more in-depth study for the determination of the reference FPGN of the Katangan copper arc is of utmost importance.
Similar conclusions were reached by Mees et al. (2013), who found high levels of Zn and Cu in tailings samples from the Kipushi tailings in one of their studies conducted at the same site. The fact that Gécamines has been processing oxidized and sulfidized Zn and Cu ores for several years and the ores have not been mined may explain these high Zn and Cu values (Kitobo, 2009). The hydrometallurgical process used may explain the high As content in tailings samples from the Kipushi tailings pond. In fact, Kabata-Pendias (2010) pointed out that: "The main source of As contamination is metal extraction. The agglomeration of Zn and Pb, on the other hand, is much more closely related to the pedo-geochemical background of the area. It is certain that the polymetallic carbonate (Zn-Pb-Cu) deposits of the copper arc that feeds the KICO plant are directly responsible for the Cu-Co layered mineralization (Kampunzu, 2009).
High pH and Ca values are also found. This alkalinity is due to the use of lime by miners to neutralize heavy metals, as demonstrated in the work of Fu at al. (2014). The high pH and Ca values observed at Kipushi may therefore be explained. In addition, it is well known in the region that the oxidized minerals of the copper arc are generally rich in carbonate and have high pH values (Kampunzu et al., 2009).
According to Suresh et al. (2011), if the correlation coefficient between the metals under consideration is higher, the metals have a common source of origin with mutual dependence and similar behavior during transport. On the other hand, if the correlation coefficient between the other metals is low, the nature of these metals is not under the control of a single element, but rather under the control of a combination of host rocks and geochemical association.
The results obtained from this study are in line with the results obtained from the previous work carried out at the site for the tailings of the Kipushi Basin. In order to better characterize the soil in this environment, we suggest that future studies be conducted. For example, the geochemical background of this region as well as the exchangeable fraction of TME contained in the Kipushi Basin tailings should be analyzed to better assess their hazard.
The spatial distribution of trace metals in the sedimentation basinThe results on the spatial distribution of trace metals in the sedimentation basin showed that trace metals were not evenly distributed. These differences probably reflect the different anthropogenic inputs to the environment. For example, the high concentration of Cu in the sedimentation basin according to Varol (2001) is attributed to metal discharges from a copper mine plant; Similarly, high concentrations of Cd and Zn in sediments were related to large surface runoff from various mining industries into the river (Liao et al., 2016). The average concentration of Zn in sediments was higher than other metals, this is due to the fact that the minerals extracted and processed were rich in zinc and copper (Kitobo, 2009). The spatial distribution of trace metals differs in area and all had high concentrations in the Kipushi basin except for cobalt compared to the reference thresholds used. The concentrations of these metals were influenced by the content of the soil-geochemical background. The distribution of Zn and Pb were similar, with higher values in basin number 3. The heterogeneity of trace metal concentrations observed in the soils of sedimentation basins is normal, because the basin is separated from the dyke’s carrying vegetation that acts as wind breezes. These results are similar to those of Kaniki (2008) on environmental characterization of the mining and metallurgical discharges from the Congolese copperbelt and Kampunzu et al (2009).
Logically, the very high concentrations of trace metals were observed in basin 3 and this is explained by the fact that the latter, being from the topographical point of view at the lowest level of the sedimentation basin, collects directly all mining waste upstream of the mine.
3.2.1. Involvement of NTM in the Contamination of Other Environmental Compartments
It is from this MNT that the topographical profiles are constructed, and from this MNT that the topographic profiles are built, whose elevations are then added. The basin topography as shown (Figure 12) shows that the polluted MTA areas are at high altitudes. Rainwater can wash away polluted soils and migrate to low-lying points where the Kafubu River and several rivers run the risk of being polluted. The TMEs may also bioaccumulate in plant tissues around the sedimentation basin during flooding and cause metabolic disturbances (Cheng, 2003). Hence the best of rehabilitation strategy is through good management of runoff in the basin. The mapped runoff concentration axes overlap with observed gullies on the sedimentation basin. The potential risks of groundwater contamination by MTH-loaded seepage water are conceivable. Amisi (2010) identified the risk of contamination of the groundwater table by infiltration water near the hydrometallurgical plants in Lubumbashi. The work of Baya, 2018 shows that low levels of heavy metal contamination were observed in fields located at a great distance from the Kapolowe River, However, given the topography of the Kipushi basin, a possible contamination of fields in the vicinity would be possible Observing these results, it is worth noting that the tailings from the Kipushi basin (Cu, Pb, Fe, As and Zn) are higher than the standards described by Baize (2000) and the Lubumbashi pedogeochemical background (Shutcha et al., 2015).
The soil of the sedimentation basin, polluted in ETM becomes a possible source of direct or indirect release of these pollutants into the environment via water, dust flumes etc., where they become dangerous because potentially absorbed by living beings. This presents major risks of human exposure to MNT and supports the findings of Banza et al. (2009).
3.2.2. Practical Implications of Spatial Distribution and NTM Information for Phytoremediation Projects
On a practical level, this was after the results of this study were highlighted, which clearly showed levels (Zn, Cu, Ti, As, Pb, Fe) higher than the standards described by Baise (2000) and the background reference values geochemical of the Lubumbashi region according to Shutcha et al., (2015). The result of the spatial distribution of trace metals and the numerical terrain model implies that, the Kipushi sedimentation basin as a whole presents a constraint for the installation of a permanent vegetation cover, which is the difference in level depending on whether one is basin 1 to basin 3. Following this reality the first operation will be to limit this transportability of particles from upstream to downstream a guard ditch must be erected upstream of the basin just at the edge of the Sedimentation basin and the function of this ditch is to prevent runoff in this area and/or reduce the rate of water runoff in the sedimentation basin. Then, given the heterogeneity of this area, the amendment of the sedimentation basin will not be uniform but localized.
4. Conclusion
The general objective of this study was to establish a spatial distribution and to make the physico-chemical characterization of the mine discharges from the Kipushi sedimentation basin (KATAPULA). The results of this study have allowed to highlight spatial distribution models of trace metal elements in the sedimentation basin. These results showed that most trace elements in the basin were very high relative to the reference level used and their spatial distribution was not uniform. Trace elements with very high concentration were Zn and Cu with 2.24% and 4771 mg.kg-1 in soil respectively, and silver (8.3 mg.kg-1) was the element with lower concentration. For the content in the soil of major elements such as: Ca, Fe, Mn, Cl, an abundant concentration in these was found.
Overall, it was found that the soil of the sedimentation basin has high concentrations of trace metals, this demonstrates the need to implement remediation strategies for these soils by phytoremediation technologies, to reduce the risk of contamination in the food chain.
Without considering closing the research on this subject, future studies will therefore have to focus on determining the available levels in all chemical elements present in this area in order to predict with accuracy how much is missing and how much should be brought.
Author Contributions
Conceptualization, methodology, software, writing, G.S.; review and editing, M.J.A. and K.-S.C.; administration and supervision, K.-S.C. All authors have read and agreed to the published version of the manuscript.
Funding
This research received no funding.
Acknowledgments
We extend our gratitude to the Institute of International Research and Development at Kyungpook National University through the Korea International Cooperation Agency (KOICA) Scholarship Program for Sponsoring Creative Global Leaders. We appreciate their support and guidance for this scholarship program.
Conflicts of Interest
The authors declare no conflicts of interest.
References
- Kaniki T.A., 2008. Caractérisation environnementale des rejets minéro-métallurgiques du copperbelt congolais. Thèse de doctorat, Faculté des Sciences Appliquées, Université de Liège, Liège.
- Akcil, A. and Koldas, S. 2006. Acid Mine Drainage (AMD): causes, treatment and case studies. Journal of Cleaner Production, 14. P.1139-1145. [CrossRef]
- Gunsinger, M. R., C. J. Ptacek, D. W. Blowes, J. L. Jambor et M. C. Moncur. 2006. «Mechanisms controlling acid neutralization and metal mobility within a Nirichtailings impoundment». Applied Geochemistry, vol. 21, no 8, p. 1301-1321. [CrossRef]
- Lei, Y., Zhang, Q., He, K. B., Streets, D. G. 2010. Primary anthropogenic aerosol emission trends for China, Atmos. Chem. Phys., 11, 931-954. [CrossRef]
- Geoffrey S. Simate, Sehliselo Ndlovu. 2014. Acid mine drainage: Challenges and opportunities. Environmental Chemical Engineering. Pages 1785-1803. [CrossRef]
- Ok B., Jiang F., Li X., Mu S., 2011b. Heavy metal induced ecological risk in the city of Urumqi NW China. Environ Monit Assess 160 :33–45. [CrossRef]
- Shutcha, M N, Mubemba, Michel Mpundu, Faucon, Michel-Pierre, Luhembwe, Michel Ngongo, Visser, Marjolein, Colinet, Gilles and Meerts, Pierre (2010). 'Phytostabilisation of Copper-Contaminated Soil in Katanga: An Experiment with Three Native Grasses and Two Amendments', International Journal of Phytoremediation, 12: 6, 616 — 632. [CrossRef]
- Yoshimura T., Kagemori N., Kawai S., Sera K., Futatsugawa S., 2002. Trace elements in termites by PIXE analysis, Nuclear Instruments and Methods in Physics Research B 189 (2002) 450–453. [CrossRef]
- Erens H., Mujinya B.B., Mees F., Baert G., Boeckx P., Malaisse F., Van Ranst E., 2015 (a). The origin and implications of variations in soil-related properties within Macrotermes falciger mounds, Geoderma 249–250. [CrossRef]
- Yousefali & Safari, 2007. To Compare Two Interpolation Methods: IDW, KRIGING for Providing Properties (Area) Surface Interpolation Map Land Price. District 5, Municipality of Tehran area, Islamic Republic of Iran, 13p.
- Shutcha NM., Faucon MP., Kissi CK., Colinet G., Mahy G., Luhembwe NM. 2015. Trois ans d’expérience de phytostabilisation de sols acides dénudés extrêmement contaminés par la fusion du cuivre en utilisant la biodiversité végétale des sols riches en métaux en Afrique tropicale. Génie écologique 82, 81-90.
- Mees, F., Masalehdani, M.N.N., De Putter, T., D’Hollander, C., Van Biezen, E., Mujinya, B.B., Potdevin, J.L. and Van Ranst, E., 2013. Concentrations and forms of heavy metals around two ore processing sites in Katanga, Democratic Republic of Congo. Journal of African Earth Science, 77, 22-30. [CrossRef]
- Kitobo W., 2009. Dépollution et valorisation des rejets miniers sulfurés du Katanga. Cas des tailings de l’Ancien Concentrateur de Kipushi. Thèse de doctorat en Scinces de l’ingénieur, Université de Liège, 254 p.
- Kabata-Pendias, A. 2011. Trace Elements in Soils and Plants. Fourth ed. CRC Press Taylor & Francis Group.
- Kampunzu, A.B., Cailteux, J.L.H., Kamona, A.F., Intiomale, M.M. and Melcher, F. 2009. Sediment-hosted Zn-Pb-Cu deposits in the Central African Copperbelt. Ore Geology Reviews, 35, p263–297. [CrossRef]
- Fu, J.; Zhao, C.; Luo, Y.Y.; Liu, C.; Kyzas, G.Z.; Luo, Y.Y.; Zhao, D.; An, S.; Zhu, H. 2014. Heavy metals in surface sediments of the Jialu River, China: Their relations to environmental factors. J. Hazard. Mater. 270, 102–109. [CrossRef]
- Suresh G., Ramasamy V., Meenakshindaram V., Ponnu-samy V., 2011. Influence of mineralogical and heavy metal composition on natural radionuclide contents in the river sediments. Appl Radiat Isot 69: 1466-1474. [CrossRef]
- Varol, M., Gökot, B., Bekleyen, A., 2010. Assessment of water pollution in the Tigris River in Diyarbakır, Turkey. Water Practice and Technology 5 (1). [CrossRef]
- Liao, J.; Wen, Z.; Ru, X.; Chen, J.; Wu, H.; Wei, C. Distribution and migration of heavy metals in soil and crops affected by acid mine drainage: Public health implications in Guangdong Province, China. Ecotoxicol. Environ. Saf. 2016, 124, 460–469. [CrossRef]
- Cheng S. 2003. Heavy metal pollution in China: origin, pattern and control. Environmental Science and Pollution Research, 10(3) : 192-198. [CrossRef]
- Amisi, M., 2010. Perception de l’impact des activités minières au Katanga. Analyse par l’application de la théorie paysagère de Kevin Lynch, Thèse de doctorat inédite, Faculté des Sciences, UNILU, Lubumbashi, 2010.
- Baya K.T. 2018. Caractérisation chimique des substrats le long de la rivière Panda au niveau de Kapolowe Gare et évaluation de la dispersion des éléments traces métalliques. Mémoire DEA. 58p.
- Baize D., 2000. Guide des analyses en pédologie. Paris: INRA.
- Alaa Abbadi, Gábor Mucsi. 2024. A review on complex utilization of mine tailings: Recovery of rare earth elements and residue valorization. Environmental Chemical Engineering 12(3): pp113-118. [CrossRef]
- Yanan Jiao, Chunhui Zhang, Peidong Su, Yuanhui Tang, Zhipeng Huang, Tao Ma. 2023. A review of acid mine drainage: Formation mechanism, treatment technology, typical engineering cases and resource utilization. Process Safety and Environmental Protection 170: pp1240-1260. [CrossRef]
- Aswin Thacharodi, Ramu Meenatchi, Saqib Hassan, Naseer Hussain, Mansoor Ahmad Bhat, Jesu Arockiaraj, HuuHao Ngo, Quynh-Hoang Le, Arivalagan Pugazhendhi-2024. Microplastics in the environment: A critical overview on its fate, toxicity, implications, management, and bioremediation strategies. Environment Management 349: pp119-433. [CrossRef]
Figure 2.
Distribution of analyzed parameters by principal component analysis.
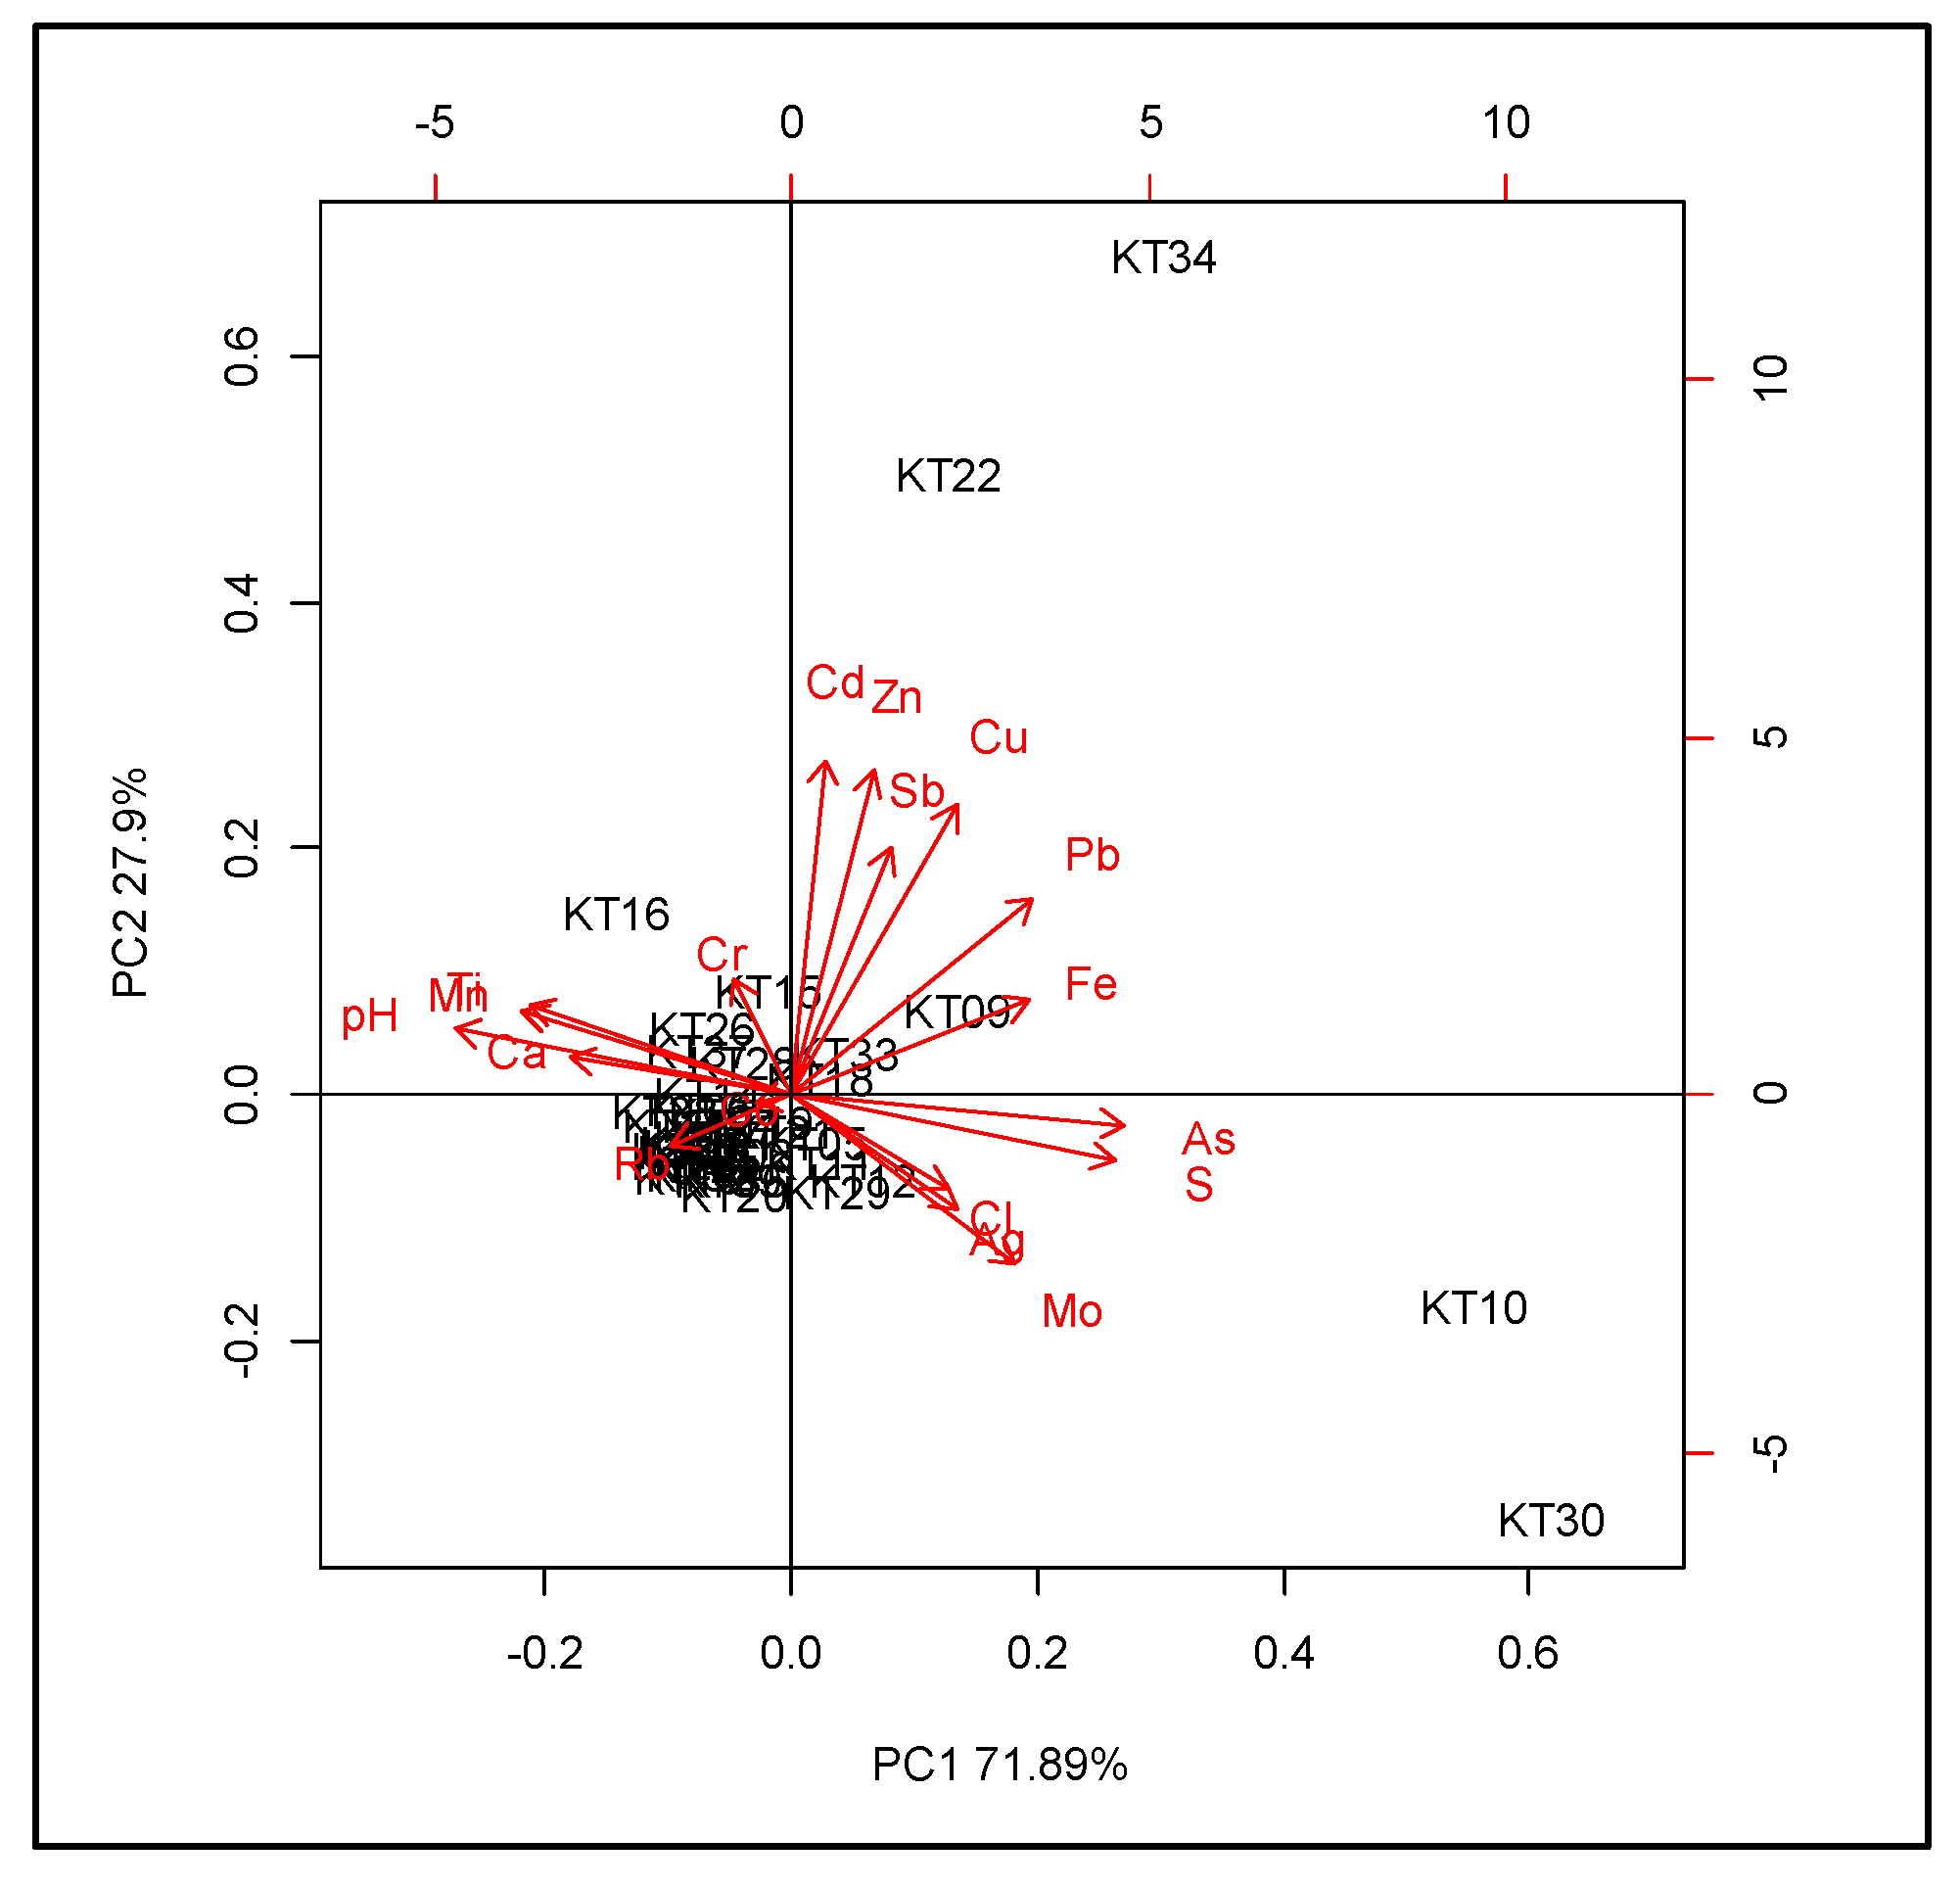
Table 1.
Descriptive statistics for the concentrations of the trace metals (mg.kg-1). Av = mean, SD = standard deviation, Min = minimum, Max = maximum, Med = median, Q1 and Q3 = first and third quartiles.
Table 1.
Descriptive statistics for the concentrations of the trace metals (mg.kg-1). Av = mean, SD = standard deviation, Min = minimum, Max = maximum, Med = median, Q1 and Q3 = first and third quartiles.
| Variable | Moy | ET | CV | Min | Q1 | Méd | Q3 | Max |
| pH | 7,3 | 1 | 13, | 3 | 7,4 | 7,5 | 7,7 | 8 |
| Ca (%) | 14,4 | 3,8 | 26 | 3,7 | 13,7 | 15 | 16,5 | 20,5 |
| S (%) | 4,8 | 3,7 | 78,3 | 1,6 | 2,7 | 3,2 | 5 | 19 |
| Fe (%) | 6,4 | 4,6 | 71,4 | 2,3 | 4,6 | 5,3 | 6,2 | 28,5 |
| Mn (mg kg-1) | 803 | 232 | 28,9 | < 5 | 763 | 855 | 947 | 1064 |
| Cl (mg kg-1) | 212 | 917 | 432 | < 5 | < 5 | < 5 | < 5 | 4439 |
| As (mg kg-1) | 866 | 760 | 87,8 | 91 | 509 | 674 | 866 | 3961 |
| Ag (mg kg-1) | 8,3 | 10,7 | 129 | < 5 | < 5 | < 5 | < 5 | 58 |
| Cd (mg kg-1) | 199 | 186 | 93,25 | < 5 | 129 | 153 | 207 | 893 |
| Co (mg kg-1) | 14,9 | 62,6 | 420 | < 5 | < 5 | < 5 | < 5 | 401 |
| Cr (mg kg-1) | 18,3 | 30,7 | 168 | < 5 | < 5 | < 5 | < 5 | 133 |
| Cu (mg kg-1) | 4771 | 7673 | 161 | 1007 | 1456 | 2291 | 4518 | 35200 |
| Mo (mg kg-1) | 15,8 | 10,3 | 64,9 | < 5 | 10,25 | 14 | 18 | 62 |
| Pb (mg kg-1) | 1185 | 1206 | 102 | 147 | 530 | 724 | 1065 | 4734 |
| Rb (mg kg-1) | 44,4 | 12,9 | 29 | < 5 | 38,3 | 46 | 51,8 | 83 |
| Sb (mg kg-1) | 9,7 | 22,2 | 230 | < 5 | < 5 | < 5 | < 5 | 135 |
| Ti (mg kg-1) | 2824 | 753 | 26,65 | < 5 | 2524 | 2869 | 3178 | 4488 |
| Zn (mg kg-1) | 22365 | 28142 | 126 | 1600 | 10300 | 14900 | 21150 | 132800 |
Table 2.
(adapted from Shutcha et al., 2018) Comparison of the values of some parameters analyzed in the Katapula tailings with soil reference values for the Lubumbashi region. Av = average, Min = minimum, Max = maximum, Med = median.
Table 2.
(adapted from Shutcha et al., 2018) Comparison of the values of some parameters analyzed in the Katapula tailings with soil reference values for the Lubumbashi region. Av = average, Min = minimum, Max = maximum, Med = median.
| Variable | Tailing Katapula | Valeurs références | ||||||
| Moy | Méd | Min | Max | Moy | Méd | Min | Max | |
| pH | 7,3 | 7,5 | 3,0 | 8,0 | 5,6 | 5,5 | 4,9 | 6,8 |
| Fe (%) | 6,4 | 5,3 | 2,3 | 28,5 | 3,6 | 3,8 | 0,9 | 7,4 |
| Co (mg.kg-1) | 14,9 | < 5,0 | < 5,0 | 401,0 | 20,2 | 20,1 | 7,1 | 38,0 |
| Cu (mg.kg-1) | 4771 | 2291 | 1007 | 35200 | 187 | 191 | 20 | 456 |
| Pb (mg.kg-1) | 1185 | 724 | 147 | 4734 | 40 | 32 | 7 | 82 |
| Zn (mg.kg-1) | 22365 | 14900 | 1600 | 132800 | 69 | 58 | 26 | 180 |
Disclaimer/Publisher’s Note: The statements, opinions and data contained in all publications are solely those of the individual author(s) and contributor(s) and not of MDPI and/or the editor(s). MDPI and/or the editor(s) disclaim responsibility for any injury to people or property resulting from any ideas, methods, instructions or products referred to in the content. |
© 2025 by the authors. Licensee MDPI, Basel, Switzerland. This article is an open access article distributed under the terms and conditions of the Creative Commons Attribution (CC BY) license (http://creativecommons.org/licenses/by/4.0/).
Copyright: This open access article is published under a Creative Commons CC BY 4.0 license, which permit the free download, distribution, and reuse, provided that the author and preprint are cited in any reuse.


