
Submitted:
17 February 2025
Posted:
18 February 2025
You are already at the latest version
Abstract
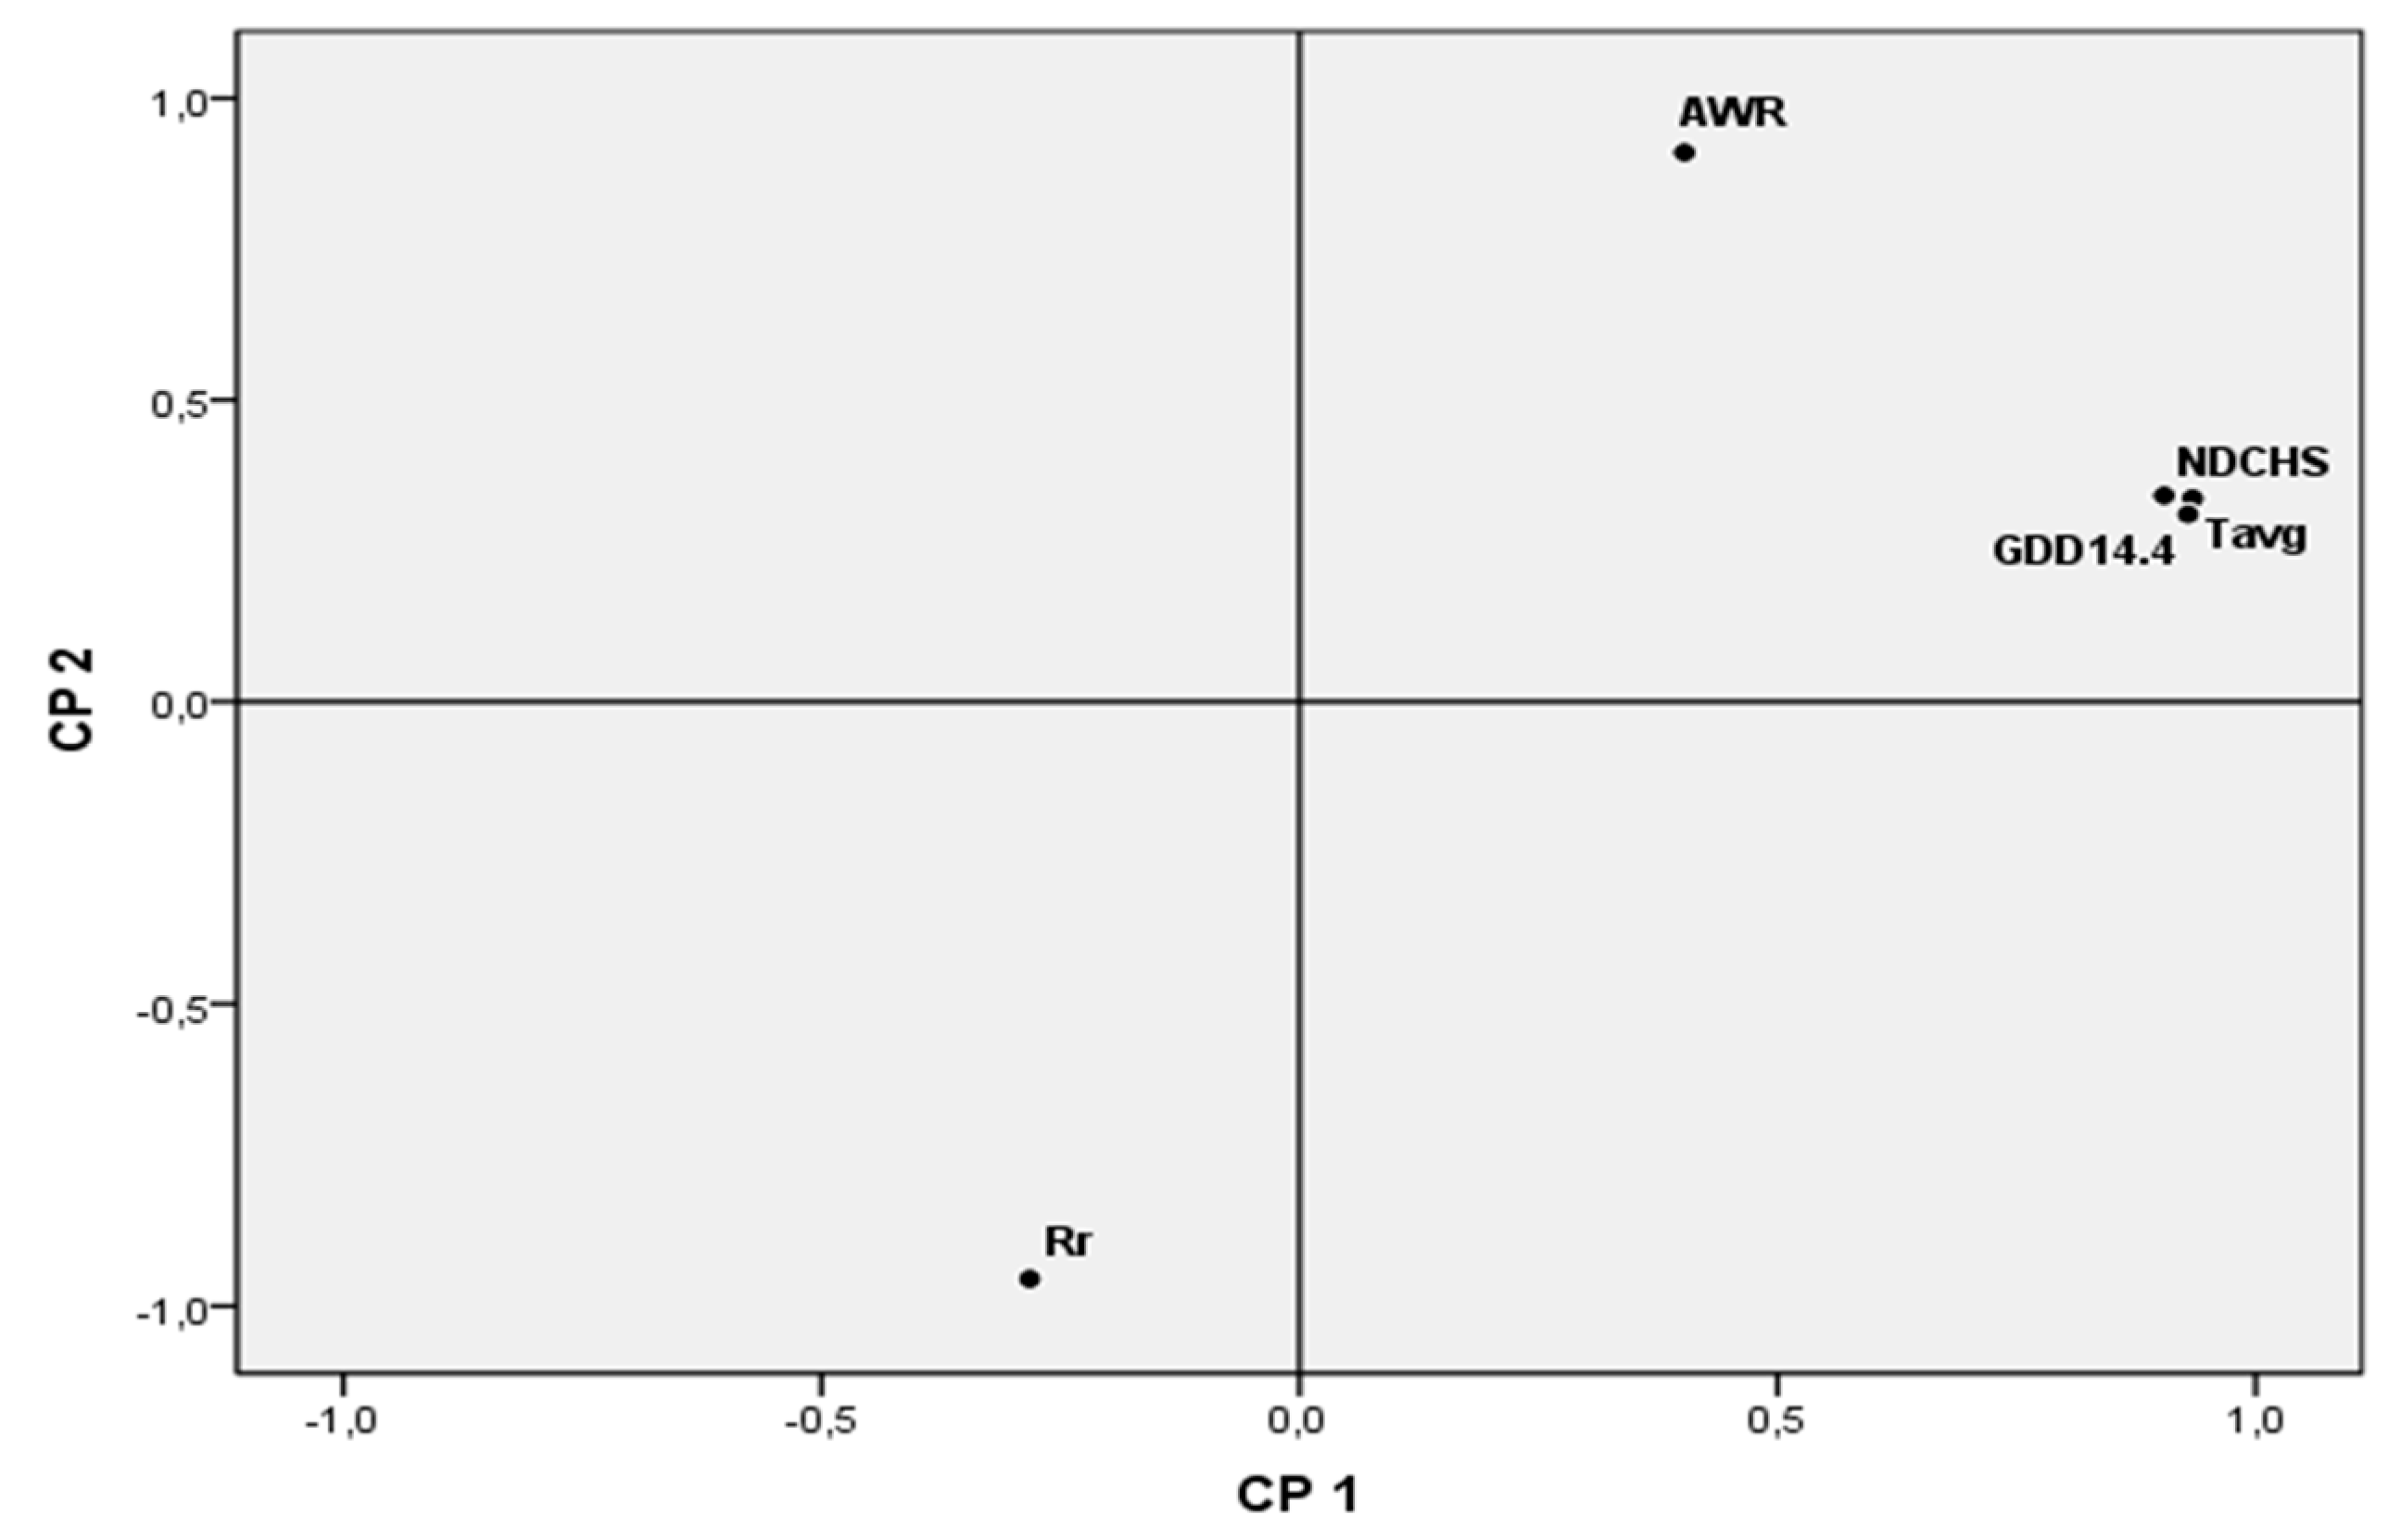
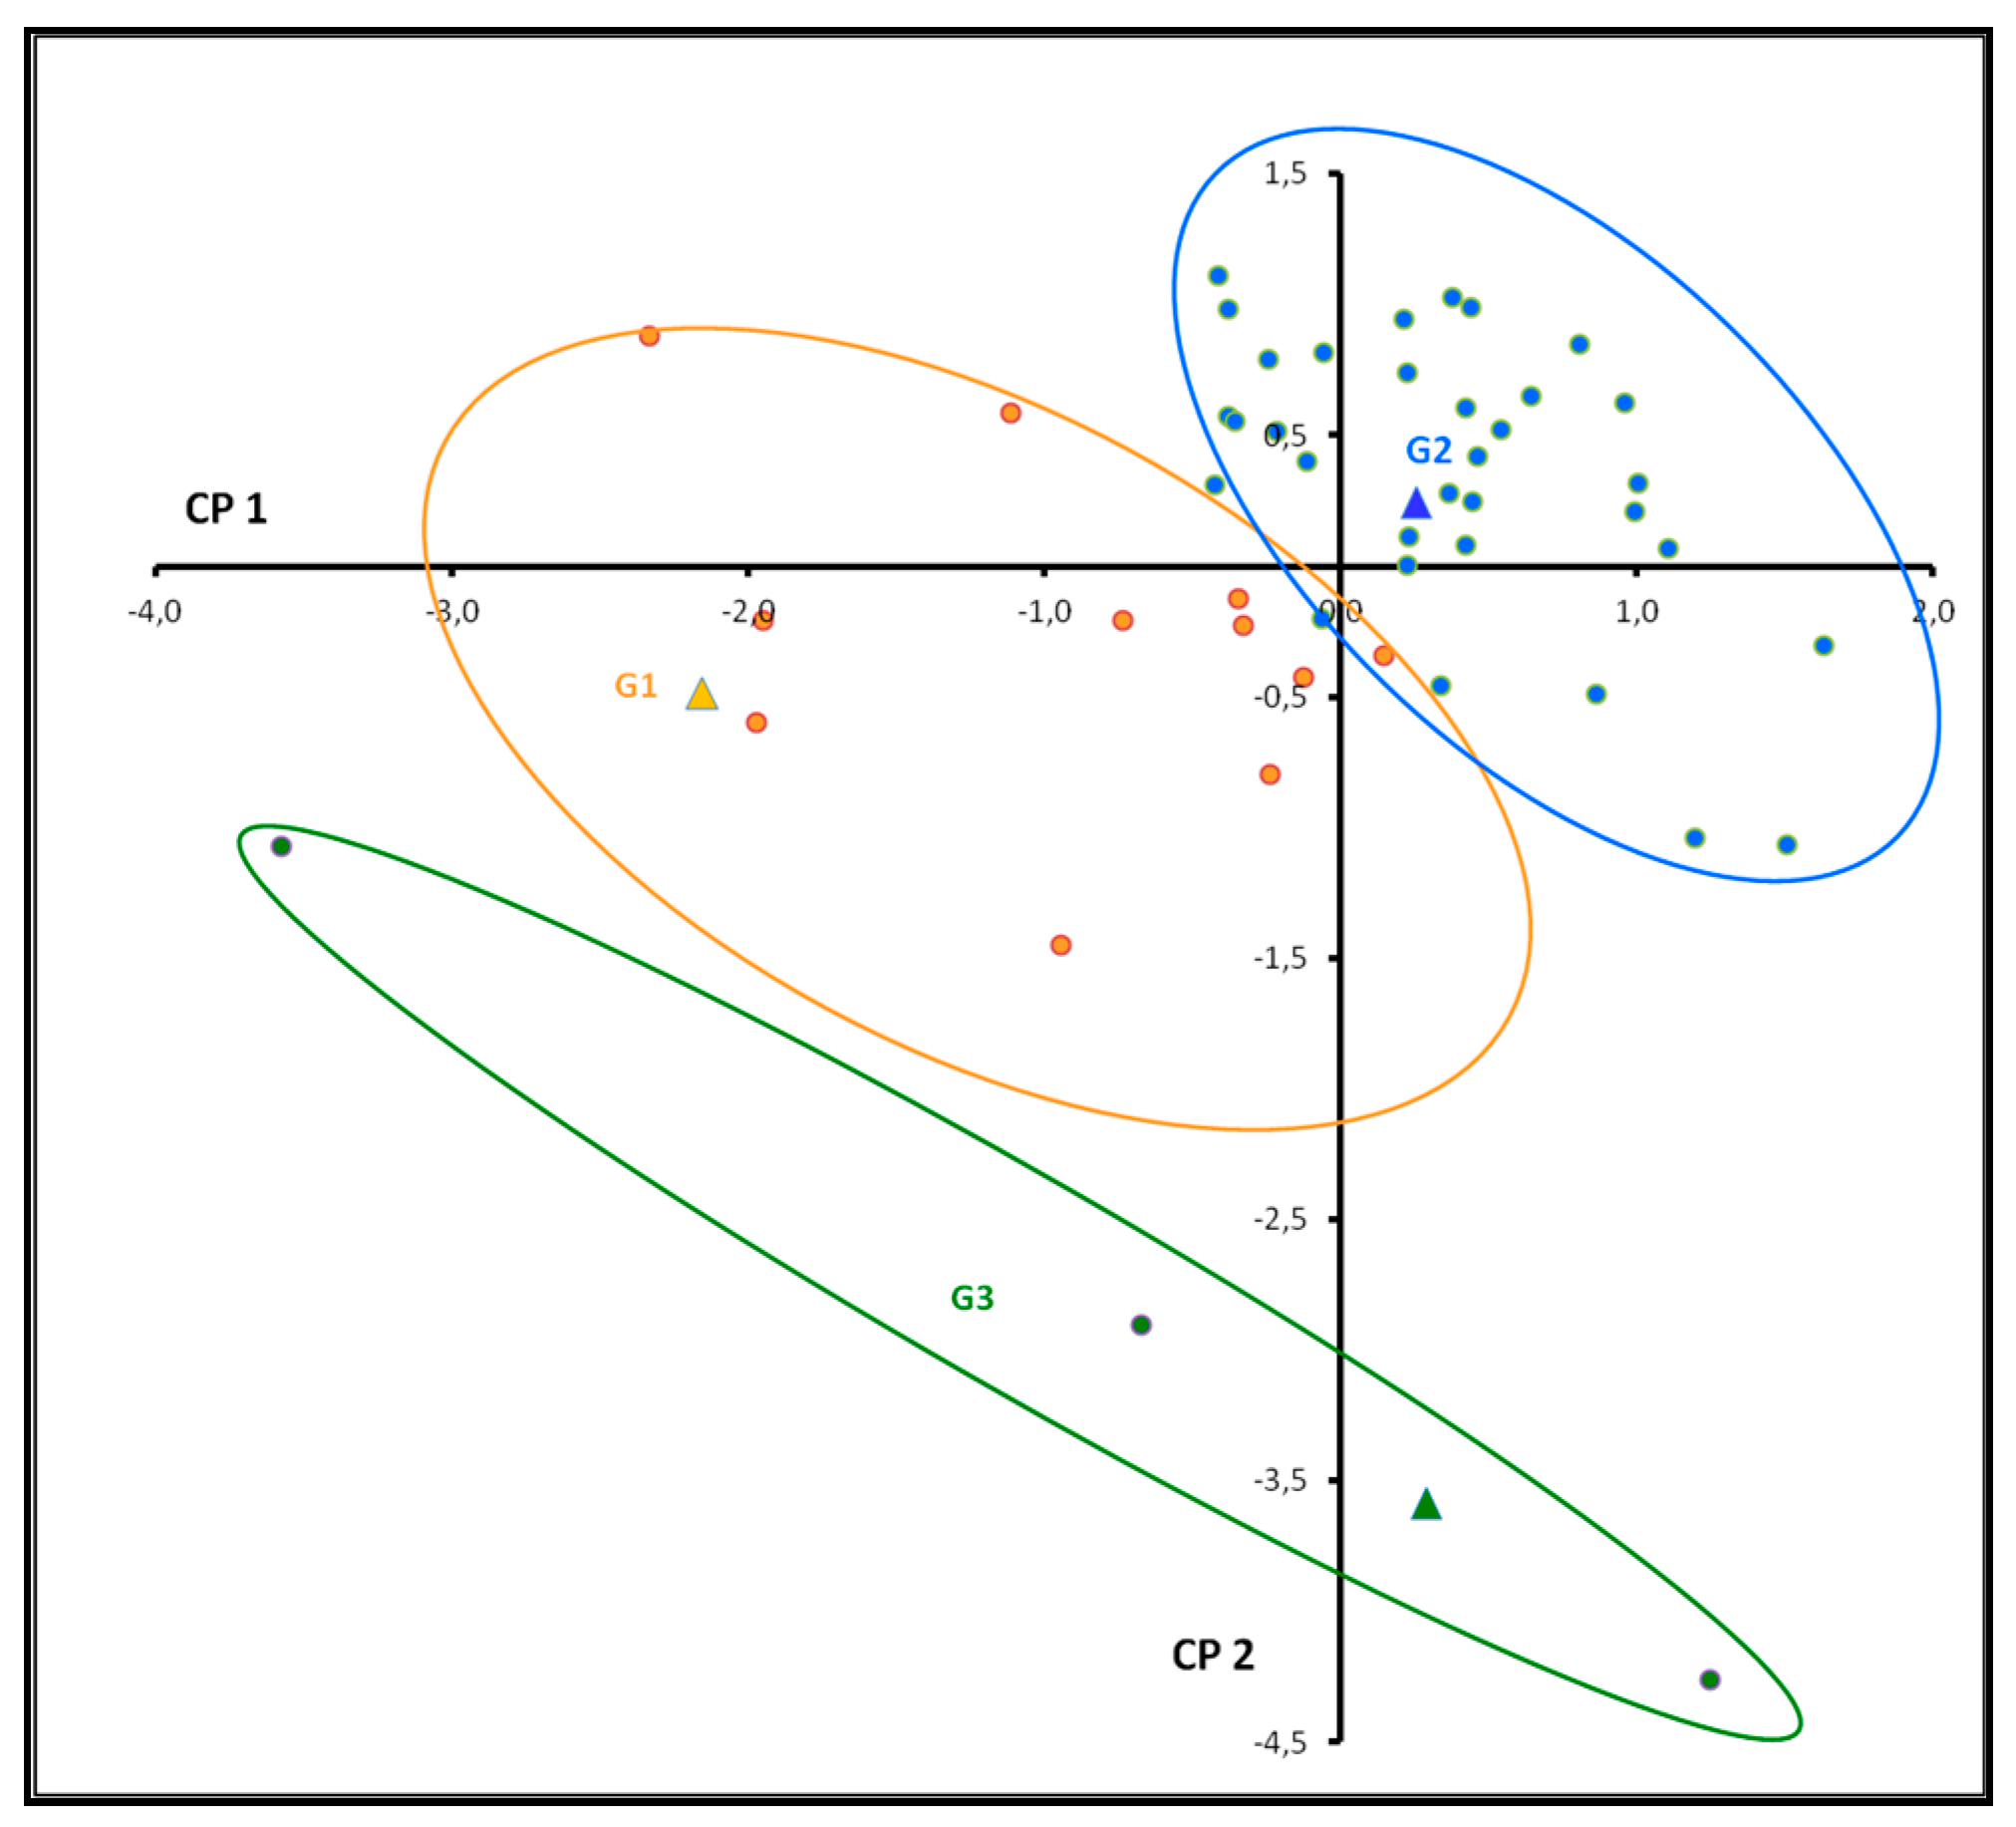
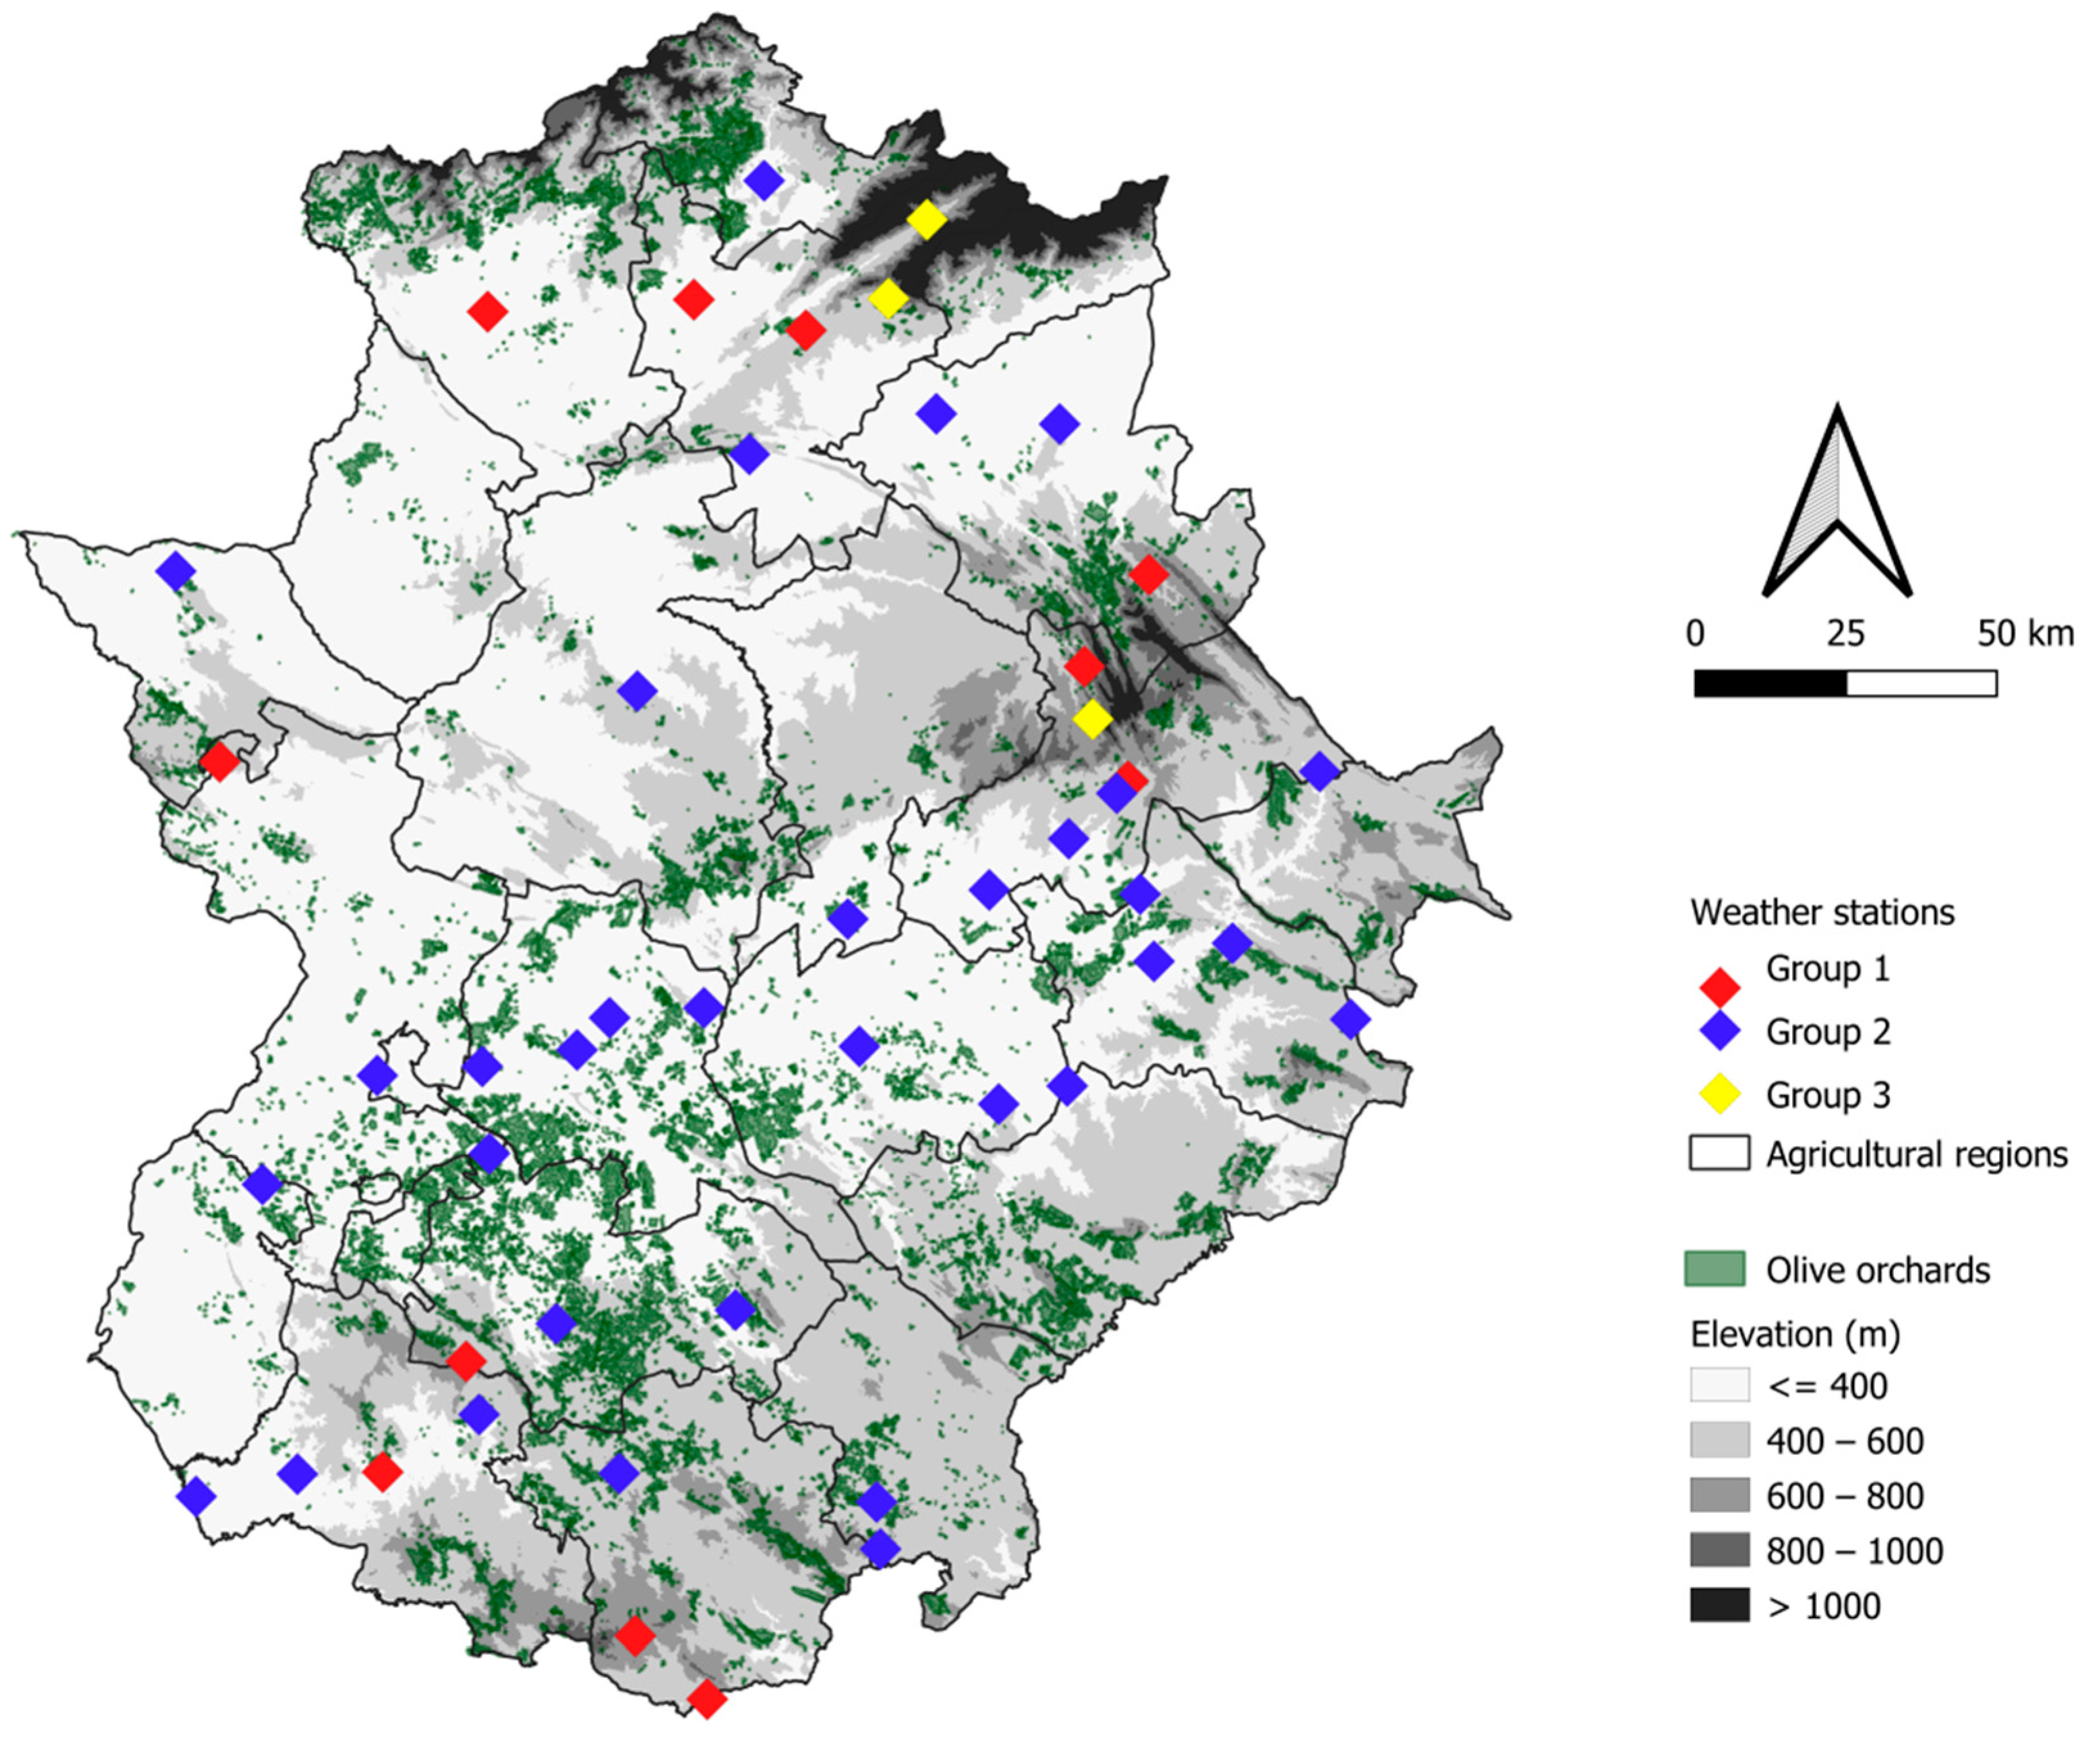
This study analysed the climatic characteristics of olive growing in Extremadura, a region in western Spain with some of the largest areas and production in Europe. A daily database was created from 47 weather stations located throughout Extremadura during the olive growing season from 1990-2021. To characterise and determine the olive growing climatology in Extremadura, the climatic variables and ten bioclimatic-physiological indices that provide information on the be-haviour of the olive tree have been calculated. The correlation between the fourteen variables used was carried out, a reduction was made and the number of minimum factors was determined using principal component analysis (PCA) and, in order to obtain homogeneous groups, cluster analysis was carried out. The result of index reduction revealed that annual rainfall (Rr), annual water re-quirement (AWR), mean annual temperature (Tavg), degree days above 14.4 °C accumulated in the olive growing period (GDD14.4) and the number of days with optimal temperatures for carbohy-drate synthesis in leaves (NDCHS) were sufficient to characterise the agricultural regions of Ex-tremadura, explaining between them 97.24% of the observed variability. The results indicate the presence of two principal components, one pertaining to thermal-physiological factors (PC1) and the other to hydric variables (PC2). Three homogeneous groups were determined by cluster analysis, one of which had cooler thermal conditions and no water requirements. The study found that an increase in the olive growing season or a shortening of the dormant period could result in a higher water input during the growing season and a lack of accumulation of chilling hours during the dormant period, causing crop maintenance problems in warmer locations. Climate change is expected to have significant impacts on this crop where climatic conditions are already very hot and dry. In the future, it is possible that the current olive growing areas in Extremadura will move to other areas where the temperature is cooler.
Keywords:
1. Introduction
2. Materials and Methods
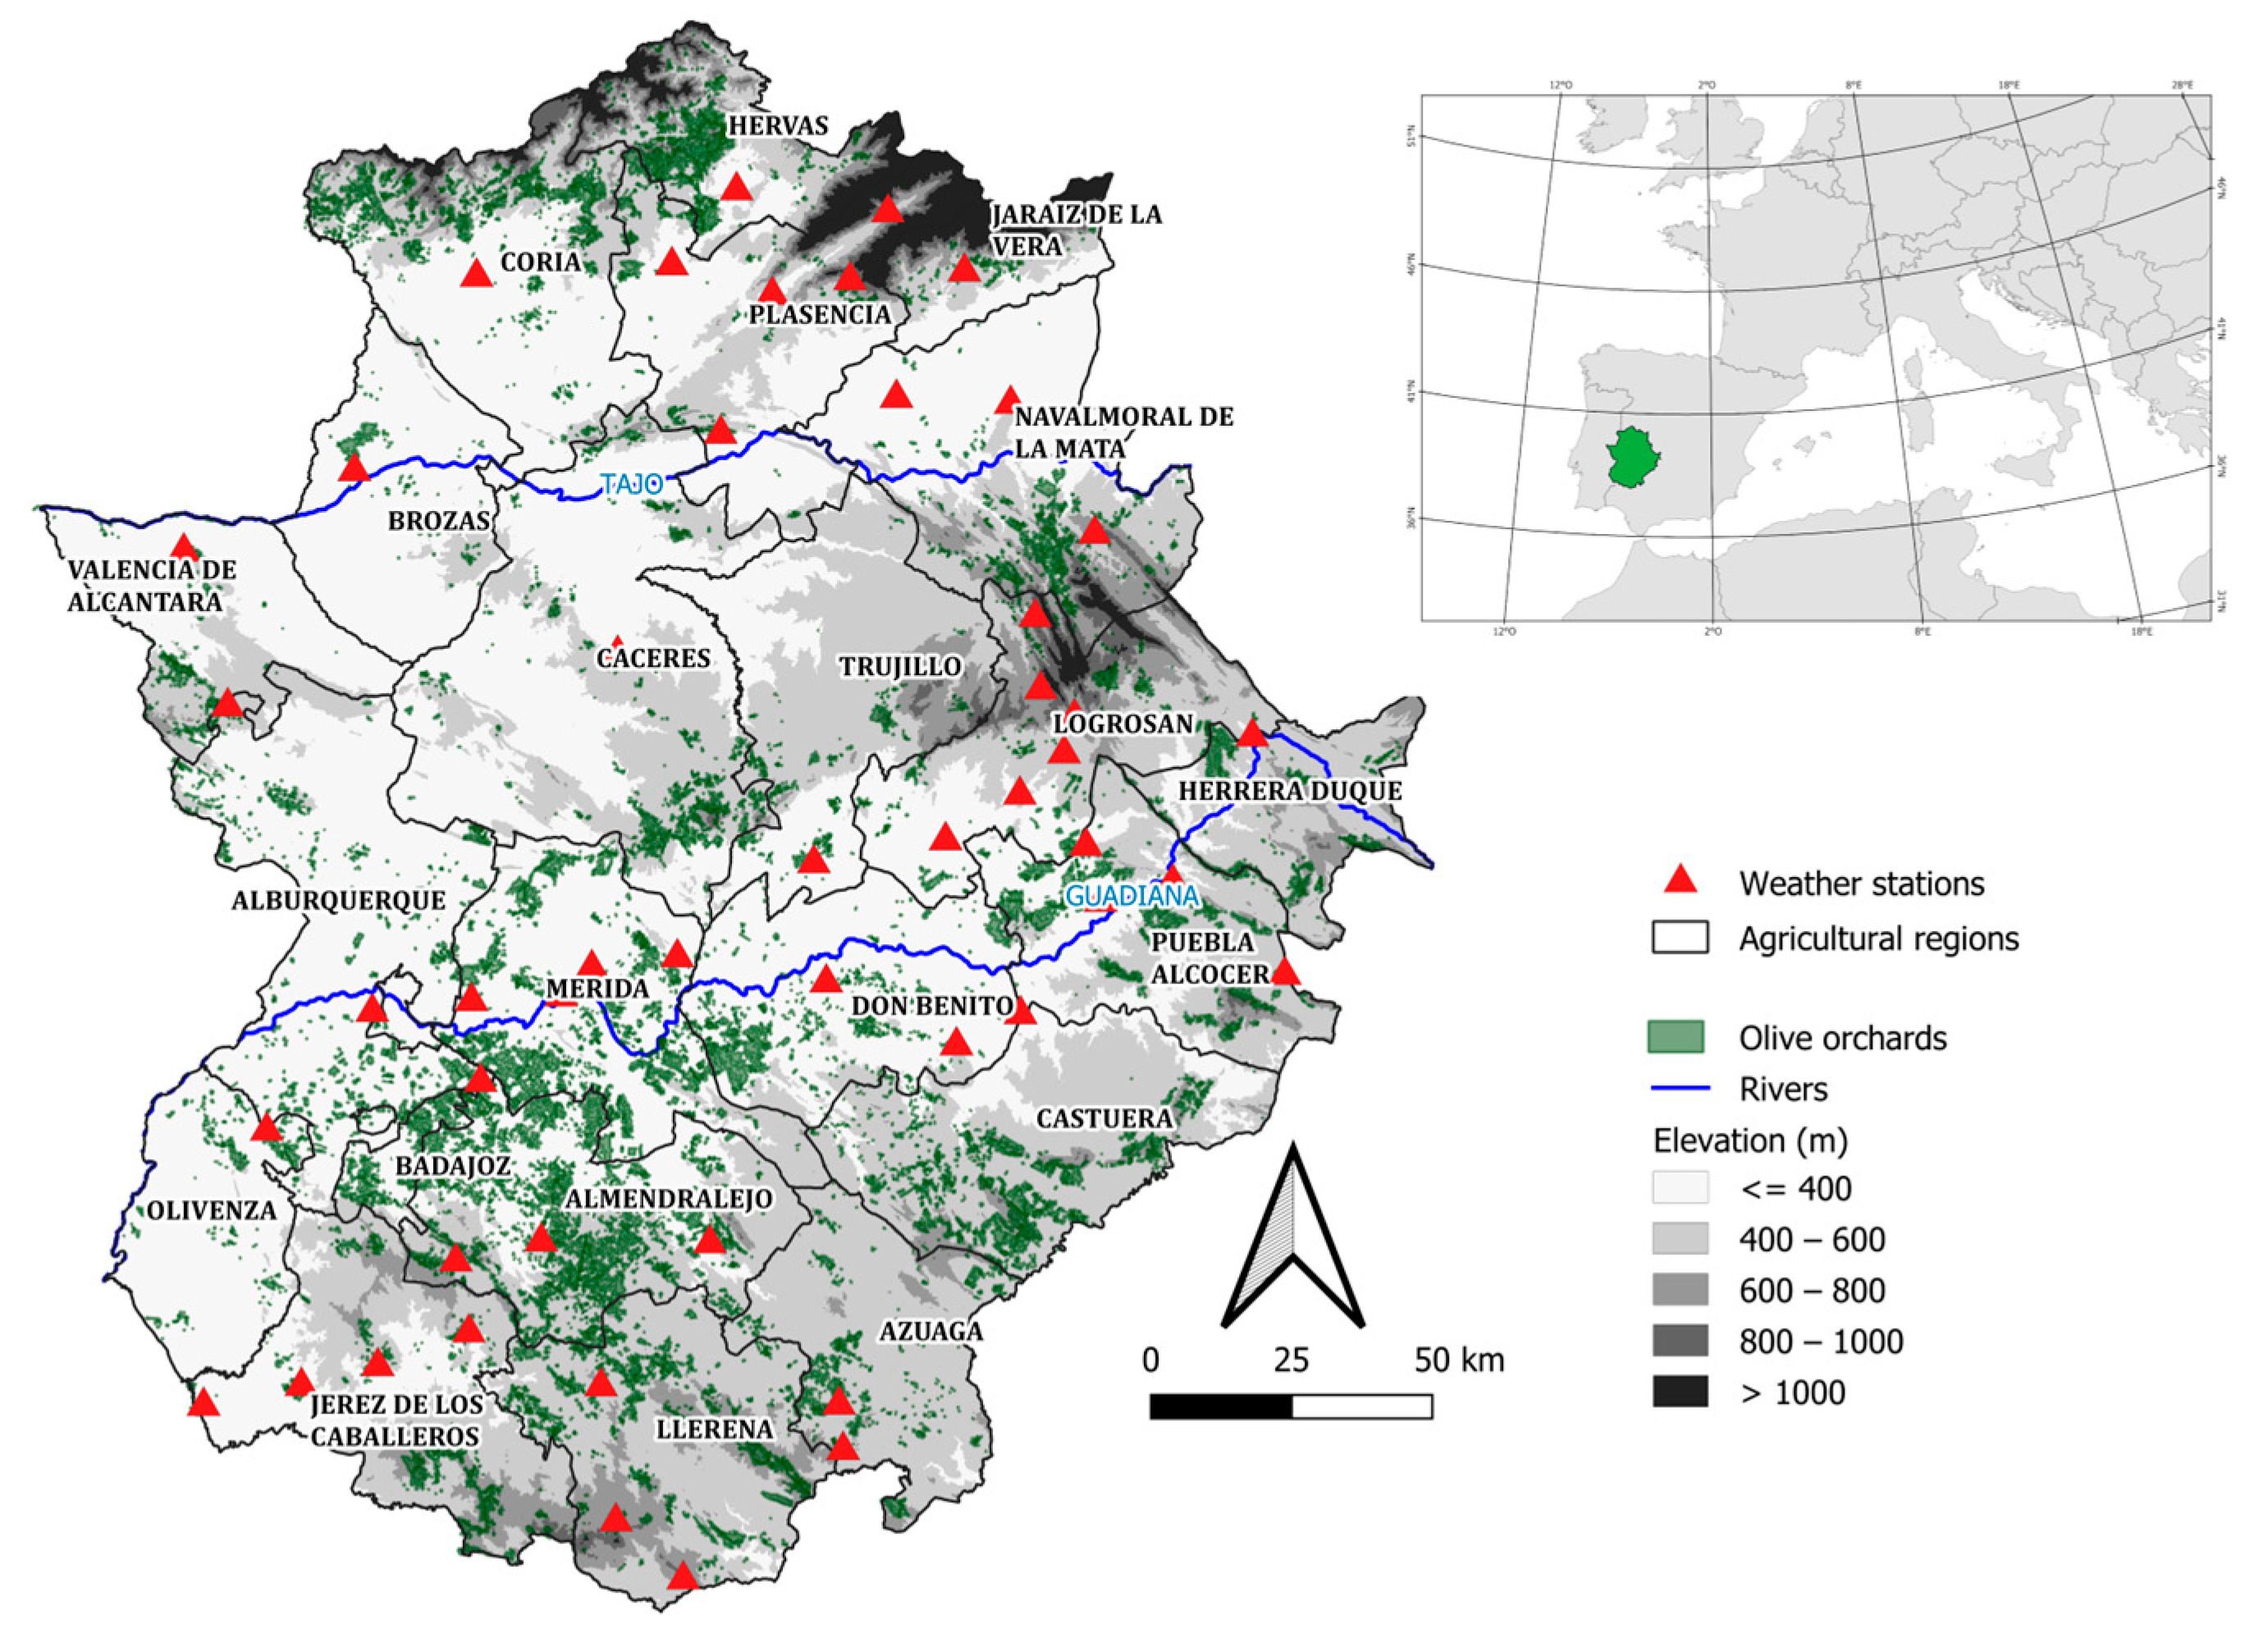
2.1. Study Area and Climatic Data
2.2. Bioclimatic Indices
2.3. Multivariate Statistical Analysis
3. Results and Discussion
3.1. Descriptive Analysis of Data
3.2. Principal Component and Clustering Analyses. Definition of Climatic Groups
3.3. Trends of Principal Components
4. Conclusions
Author Contributions
Funding
Data Availability Statement
Acknowledgments
Conflicts of Interest
References
- Giorgi. F.. Lionello. P. (2008). Climate change projections for the Mediterranean region. Glob. Planet Chang. 2008. 63. 90–104.
- Braudel. F. (1979). La Mediterranée et le monde mediterranéena l’époque de Philippe II. tome premier. 4th edn.. Paris.
- Böhm. J.. Antunes. M.T. (2013). A evolução da espécie olea europaea. In O Grande Livro da Oliveira e do Azeite; Dinalivro; Lisboa. Portugal. 2013; pp 89-175.
- Di Vaio. C.; Nocerino. S.; Paduano. A.; Sacchi. R. Influence of Some Environmental Factors on Drupe Maturation and Olive Oil Composition. J. Sci. Food Agric. 2013. 93. 1134–1139.
- Andrade. C.; Fonseca. A.; Santos. J.A.; Bois. B.; Jones. G.V. Historic Changes and Future Projections in Köppen–Geiger Climate Classifications in Major Wine Regions Worldwide. Climate 2024. 12. 94. [CrossRef]
- Malheiro A.C.. Santos J.A.. Fraga H. and Pinto J.G. Climate change scenarios applied to viticultural zoning in Europe. Climate Research 2010. 43. 163-177.
- Tscholl1. S.; Candiago. S.; Marsoner. T.; Fraga. H.; Giupponi. C. and Egarter. L. Assessing the climate change vulnerability of European winegrowing regions by combining exposure. sensitivity and adaptative capacity indicators. In Proceedings of the terclim 2022. XIVth International Terroir Congress and Climate Wine Symposium. Bordeaux. France. July 3-8. 2022.
- Honorio. F.; García-Martín. A.; Moral. F.J.; Paniagua. L.L.; Rebollo. F.J. Spanish Vineyard Classification According to Bioclimatic Indexes. Australian Journal of Grape and Wine Research. 2018. 24. 335–344.
- Fraga. H; Santos. JA; Moutinho-Pereira. J; et al. Statistical modelling of grapevine phenology in Portuguese wine regions: observed trends and climate change projections. The Journal of Agricultural Science 2016;154(5):795-811. [CrossRef]
- Malheiro. A.C.; Campos. R.; Fraga. H; Eiras-Dias. J; Silvestre. J; and Santos. J.A. Winegrape phenology and temperature relationships in the Lisbon wine region. Portugal. Journal International des Sciences de la Vigne et du Vin. 2013. 47. n°4. 287-299.
- Adão. F.; Fraga. H.; Fonseca.A.; Malheiro. A.C.; Santos. J.A. The Relationship between Land Surface Temperature and Air Temperature in the Douro Demarcated Region. Portugal. Remote Sens. 2023. 15. 5373. [CrossRef]
- Fraga. H.; Guimarães. N.; Freitas. T.R.; Malheiro. A.C.; Santos. J.A. Future Scenarios for Olive Tree and Grapevine Potential Yields in the World Heritage Côa Region. Portugal. Agronomy 2022. 12. 350. [CrossRef]
- Honorio. F.; Aguirado. C.; Paniagua. L.L.; García-Martín. A.; Rebollo. L.; Rebollo. F.J. Exploring the Climate and Topography of Olive Orchards in Extremadura. Southwestern Spain. Land 2024. 13. 495. [CrossRef]
- Moral. F.J.; Rebollo. F.J.; García-Martín. A.; Paniagua. L.L.; Honorio. F. Spatial and Temporal Analysis of Water Resources in the Olive-Growing Areas of Extremadura. Southwestern Spain. Land 2024. 13. 1294. [CrossRef]
- López-Bernal. Á; Morales. A; García-Tejera. O; Testi. L; Orgaz. F; De Melo-Abreu. J.P. and Villalobos F.J. OliveCan: A Process-Based Model of Development. Growth and Yield of Olive Orchards. Frontiers in Plant Science. 2018. 9:632. [CrossRef]
- Masmoudi-Charfi. C.. Ben Mechlia. N. Changes in olive tree height growth during the first years of cultivation. Advances in Horticultural Science . 2008.
- Krishna. K.R. (2013). Agroecosystems: Soils. Climate. Crops. Nutrient Dynamics and Productivity (1st ed.). Apple Academic Press. New York. EE.UU. 2013. [CrossRef]
- Therios. I.N. Climatic and soil conditions. In Olives: Crop Production Science in Horticulture 18. CABI Publishing. Wallingford. UK: 2009. pp 51-80. [CrossRef]
- Tombesi A.. Tombesi S. Orchard planning and planting. In: Sbitri M.O.. Serafini F.. editors. Production Techniques in Olive Growing. International Olive Council; Madrid. Spain 2007 pp. 17–40.
- Larcher. W. Temperature stress and survival ability of Mediterranean sclerophyllous plants. Plant Biosyst.2000 134 (2000). pp. 279-295.
- Bartolozzi. F.. Cerquaglia. L.. Coppari. G.. Fontanazza. G. (2002). Frost tolerance induced by cold acclimation in olive (Olea europaea L.) (ISHS Acta Horticulturae 586: IV International Symposium on Olive Growing). [CrossRef]
- Petruccelli. R.. Bartolini. G.. Ganino. T.. Zelasco. S.. Lombardo. L.. Perri. E.. et al. Cold stress. freezing adaptation. varietal susceptibility of olea europaea L.: A review. Plants 2022, 11. 1367. [CrossRef]
- Morettini. A.. Olivicoltura. Ramo Editoriale degli Agricoltori. Eds.. Roma. 1972.
- Griggs. W. H.. Hartmann. H. T.. Bradley. M. V.. Iwakini. B. T. and Whisler. J. Olive pollination in California. Calif. Agric. Exp.. Stn. Bull. 1975,869..
- Guerrero A. Nueva Olivicultura. 5th ed. Ediciones Mundi-Prensa; Madrid. Spain: 2002. [Google Scholar].
- Ponti L.. Gutierrez A.P.. Basso B.. Neteler M.. Ruti P.M.. Dell’Aquila A.. Iannetta M. Olive agroecosystems in the Mediterranean Basin: Multitrophic analysis of climate effects with process-based representation of soil water balance. Procedia Environ. Sci. 2013;19:122–131. [CrossRef]
- Hueso. A.; Tentacoste. E.R.; Ruiz. C.; De la Rosa. J.M.; Gómez-del-Campo. M. Effect of deficit irrigation during the oil synthesis period on carbohydrate content in olive “Arbequina” hedgerows. Acta Horticulturae. 2018. Vol. 1199. pp 75-79.
- García. J.M.; Hueso. A.; Gómez-del- Campo. M. Deficit irrigation during the oil synthesis period affects olive oil quality in high-density orchards (cv. Arbequina). Agricultural Water Management.2020. Volume 230. ISSN 0378-3774. [CrossRef]
- Tanasijevic. L.; Todorovic. M.; Pereira. L.S.; Pizzigalli. C.; Lionello. P. Impacts of Climate Change on Olive Crop Evapotranspirationand Irrigation Requirements in the Mediterranean Region. Agric. Water Manag. 2014. 144. 54–68.
- Greven M.. Neal S.. Green S.. Dichio B.. Clothier B. The effects of drought on the water use. fruit development and oil yield from young olive trees. Agric. Water Manag. 2009;96:1525–1531. [CrossRef]
- Fernandes-Silva A.A.. Ferreira T.C.. Correia C.M.. Malheiro A.. Villalobos F.J. Influence of different irrigation regimes on crop yield and water use efficiency of olive. Plant Soil. 2010;333:35–47. [CrossRef]
- Van der Schoot.C; P.L. Rinne Dormancy cycling at the shoot apical meristem: transitioning between self-organization and self-arrest Plant Sci. 180 (1) (2011). pp. 120-131.
- Lopez-Bernal. A.; Garcia-Tejera. O.; Testi. L.; Orgaz. F.; Villalobos. F.J. Studying and modelling winter dormancy in olive trees. Agricultural and Forest Meteorology. 2020. 280. 107776. [CrossRef]
- Paniagua. L.L.; García-Martín. A.; Aguirado. C.; Honorio. F.; Moral. F.J. and Rebollo. F.J. (2023). Temperature trends of the olive tree cultivation period in the producing areas of Spain (1981-2019). Acta Hortic. 1372. 209-214. [CrossRef]
- Pérez-López. D.; Ribas. F.; Moriana. A.; Rapoport. H.F.; De Juan. A. Influence of Temperature on the Growth and Development of Olive (Olea europaea L.) Trees. J. Hortic. Sci. Biotechnol. 2008. 83. 171–176.
- Ballesteros. R.; Ortega. J.F.; Hernandez. D.; del Campo. A.; Moreno. M.A. Combined Use of Agro-Climatic and Very High-Resolution Remote Sensing Information for Crop Monitoring. Int. J. Appl. Earth Obs. Geoinformation 2018. 72. 66–75.
- Qian. B.; Zhang. X.; Chen. K.; Feng. Y.; O’Brien. T. Observed Long-Term Trends for Agroclimatic Conditions in Canada. J. Appl. Meteorol. Climatol. 2010. 49. 604–618.
- Kenealy. L.; Reighard. G.; Rauh. B.; Bridges. W.. Jr. Predicting Peach Maturity Dates in South Carolina with a Growing Degree Day Model. Acta Hortic. 2015. 1084. 479–752.
- Asseng. S.; Ewert. F.; Martre. P.; Rötter. R.P.; Lobell. D.B.; Cammarano. D.; Kimball. B.A.; Ottman. M.J.; Wall. G.W.; White. J.W.; et al. Rising Temperatures Reduce Global Wheat Production. Nat. Clim. Change 2015. 5. 143–147.
- Zhang. S.; Tao. F.; Zhang. Z. Changes in Extreme Temperatures and Their Impacts on Rice Yields in Southern China from 1981 to 2009. Field Crops Res. 2016, 189, 43–50.
- Liu. Y.; Su. L.; Wang. Q.; Zhang. J.; Shan. Y.; Deng. M. Chapter Six—Comprehensive and Quantitative Analysis of Growth Characteristics of Winter Wheat in China Based on Growing Degree Days. In Advances in Agronomy; Sparks. D.L.. Ed.; Academic Press: Cambridge. MA. USA. 2020; Volume 159. pp. 237–273. [Google Scholar].
- Anandhi. A. Growing Degree Days—Ecosystem Indicator for Changing Diurnal Temperatures and Their Impact on Corn Growth Stages in Kansas. Ecol. Indic. 2016, 61, 149–158.
- Haralampopoulos, I.; Polychroni. I.; Droulia. F.; Nastos. P.T. The Spatiotemporal Evolution of the Growing Degree Days Agroclimatic Index for Viticulture over the Northern Mediterranean Basin. Atmosphere 2024. 15. 485. [CrossRef]
- Bonofiglio, T.; Orlandi. F.: Sgromo. C.; Romano. B. & Fornaciari. M. Influence of temperature and rainfall on timing of olive (Olea europaea) flowering in southern Italy. New Zealand journal of crop and horticultural science. 2008. 36, 59-69.
- Lombardo, L.; Fila, G.; Lombardo, N.; Epifani, C.; Duffy, D.H., III; Godino, G.; Salimonti, A.; Zelasco, S. Uncovering Olive Biodiversity through Analysis of Floral and Fruiting Biology and Assessment of Genetic Diversity of 120 Italian Cultivars with Minor or Marginal Diffusion. Biology 2019, 8, 62. [CrossRef]
- Orlandi, F.; Lanari, D.; Romano, B. & Fornaciari, M. New model to predict the timing of olive (Olea europaea) flowering: A case study in central Italy. New Zealand Journal of Crop and Horticultural Science, 2006 34(1), 93–99. [CrossRef]
- Orlandi, F.; Avolio, E.; Bonofiglio, T.; Federico, S.; Romano, B.; Fornaciari, M. Potential shifts in olive flowering according to climate variations in Southern Italy. Meteorol. Appl. 2013, 20, 497–503. [CrossRef]
- Orlandi, F.; Vazquez Ezquerra, L.; Ruga, L.; Bonofiglio, T.; Fornaciari, M.; Garcia Mozo, H.; Dominquez, E.; Romano, B.; Galán, C. Bio climatic requirements for olive flowering in two Mediterranean regions located at the same latitude (Andalucia. Spain and Sicily. Italy). Ann Agric Environ Med 2005 12:47–52.
- De Melo-Abreu, J.P.; Barranco, D.; Cordeiro, A. M.; Tous, J.; Rogado, B. M. & Villalobos, F. J. Modelling olive flowering date using chilling for dormancy release and thermal time. Agricultural and Forest Meteorology 2004, 125(1-2). 117-127. [CrossRef]
- Alcalá, A.R.; and Barranco, D. Prediction of flowering time in olive for the Cordoba olive collection. American Society for Horticultural Science 1992. 27(11). 1205-1207. [CrossRef]
- Hackett. W. P. & Hartmann. H. T. Inflorescence formation in olive as influenced by low temperature. photoperiod. and leaf area. Botanical Gazette 1964. 125(1). 65-72.
- Aguilera. F.; Ruiz. L.; Fornaciari. M.; Romano. B.; Galán C.; Oteros. J.; Dhiab. A.; Msallen. M.; Orlandi. F. Heat accumulation period in the Mediterranean region: phenological response of the olive in different climate areas (Spain. Italy and Tunisia). International journal of biometeorology. 2014.58. 867-876.
- Hidalgo Fernandez-Cano. L; Hidalgo Togores. J. Tratado de viticultura. 5rd ed; Mundiprensa: Madrid. Spain. 2019; pp135-176.
- Jolliffe. I. T.. & Cadima. J. Principal component analysis: A review and recent developments. Philosophical Transactions of the Royal Society A: Mathematical. Physical and Engineering Sciences. 2016. 374(2065). 20150202.
- Ringnér. M. (2008). What is principal component analysis? Nature Biotechnology. 26(3). 303-304.
- Zou. H.. Hastie. T.. & Tibshirani. R. Sparse principal component analysis. Journal of Computational and Graphical Statistics. 2006. 15(2). 265-286.
- Moral. F.J.; Rebollo. F.J.; García-Martín. A.; Paniagua. L.L.; Honorio. F. Spatial and Temporal Analysis of Water Resources in the Olive-Growing Areas of Extremadura. Southwestern Spain. Land 2024. 13. 1294. [CrossRef]
- Moral. F.J.; Rebollo. F.J.; Paniagua. L.L.; García Martín. A.; Honorio. F. Spatial distribution and comparison of aridity indices in Extremadura. southwestern Spain. Theor Appl Climatol 2016. 126. 801–814. [CrossRef]
- SNCZI. S.N. de C. y Z.I. Inventario de Presas y Embalses Available online: https://www.sig.mapama.gob.es/snczi/index.html?herramienta=EstadisticasPresas (accessed on 29 May 2024).
- Ministerio para la Transición Ecológica y el Reto Demográfico, MITECO. Evaluación de los recursos hídricos. Boletín Hidrológico Available online: https://www.miteco.gob.es/es/agua/temas/evaluacion-de-los-recursos-hidricos/boletin-hidrologico.html.
- Ministerio de agricultura pesca y alimentación. Anuario de Estadística. Available online: https://www.mapa.gob.es/es/estadistica/temas/publicaciones/anuario-de-estadistica/2023/default.aspx?parte=3&capitulo=07 (accessed on 29 May 2024).
- Ministerio para la Transición Ecológica y el Reto Demográfico, MITECO. Caracterización de las comarcas agrarias de España Avaible online: hHttps://www.miteco.gob.es/en/ministerio/servicios/publicaciones/comarcas_agrarias-tomos.html.
- Honorio. F.; Aguirado. C.; Paniagua. L.L.; García-Martín. A.; Rebollo. L.; Rebollo. F.J. Exploring the Climate and Topography of Olive Orchards in Extremadura. Southwestern Spain. Land 2024. 13. 495. [CrossRef]
- Tombesi. A.; Tombesi. S.; Sbitri. M.O.; Serafini. F. Orchard Planning and Planting. In Production Tecniques in Olive Growing. International Olive Council. Madrid-Spain 2007. 17–40.
- AEMET Agencia Estatal de Meteorología (AEMET) Available online: https://www.aemet.es/es/portada (accessed on 16 February 2024).
- WMO. World Meteorological Organization Annual Report of the World Meteorological Organization 1966; WMO; Geneva. Switzerland. 1967.
- KNMI Royal Netherlands Meteorological Institute; ECAD European Climate Assessment & Dataset. Algorithm Theoretical Basis Document; Royal Netherlands Meteorological Institute KNMI: Utrecht. The Netherlands. 2013.
- Guijarro. J. Homogenization of Climatic Series with Climatol; CLIMATOL. AEMET: Balearic Islands. Spain. 2018; Available online: https://climatol.eu/ (accessed on 8 April 2024).
- Sistema de Información sobre Ocupación del Suelo de España, SIOSE (2014). In http://www.siose.es/web/guest/descargar (accessed on 16 October 2024).
- Lodolini. E.M.; Alfei. B.; Cioccolanti. T.; Zucchini. M.; Neri. D. Comparison of Frost Damages in Eleven Olive Cultivars after Two Freezing Events in Central Italy. Acta Hortic 2022. 161–168. [CrossRef]
- Hargreaves. G.H.; Samani. Z.A. Reference crop evapotranspiration from temperature. Appl. Eng. Agric. 1985. 1. 96–99.
- United States Department of Agriculture. USDA. National Engineering Handbook. Irrigation Guide. Available online: https://www.nrcs.usda.gov/sites/default/files/2022-11/WA-Irrigation-Guide_4.pdf (accessed on 14 October 2024).
- Pérez-Rodríguez. J.M.; Parras. J.; Lara. E.; Prieto. M.H. Manual Práctico de Riego Olivar de Almazara; Centro de Investigaciones Científicas y Tecnológicas de Extremadura. CICYTEX: Badajoz. Spain. 2014. https://cicytex.juntaex.es/manuales.
- McMaster. G.S.; Wilhelm. W.W. Growing degree-days: one equation. two interpretations. Agricultural and Forest Meteorology. 1997. 87. 4. 291-300. 68-1923. [CrossRef]
- Bretherton CS. Smith C. Wallace JM. An intercomparison of methods for finding coupled patterns in climate data. Journal of Climate 1992. 5: 541–560. [CrossRef]
- Moral. F.J.. Rebollo. F.J.. Paniagua. L.L.; García. A.; Martínez de Salazar. E. Application of climatic indices to analyse viticultural suitability in Extremadura. south-western Spain. Theor Appl Climatol 2016. 123. 277–289. [CrossRef]
- World Meteorological Organization. WMO. Guide to Hydrological Practices. Volume II—Management of Water Resources and Application of Hydrological Practices. 6th ed.; WMO-No. 168; World Meteorological Organization: Geneva. Switzerland. 2009.
- Sen. P.K. Estimates of the Regression Coefficient Based on Kendall’s Tau. J. Am. Stat. Assoc. 1968. 63. 1379–1389.
- García-Martín. A.; Paniagua. L.L.; Moral. F.J.; Rebollo. F.J.; Rozas. M.A. Spatiotemporal Analysis of the Frost Regime in the Iberian Peninsula in the Context of Climate Change (1975–2018). Sustainability 2021. 13. 8491.
- Ayton, J.: Mailer, R. J.; Robards, K.; Orchard, B. and M. Vonarx. Oil concentration and composition of olives during fruit maturation in south-western New South Wales. Australian Journal of Experimental Agriculture 2001. 41(6) 815 – 821. [CrossRef]
- Mousa, M. Y.; Gerasopoulos, D.; Metzidakis, I.; Kiritsakis, A. Effect of Altitude on Fruit and Oil Quality Characteristics of ‘Mastoides’ Olives. Journal of the Sciencie of Food and Agricture 1996, 71, 345–350. [CrossRef]

| Variables | Definition of variables | Source |
| Tx (°C) | Average maximum temperature | AEMET [65] |
| Tn (°C) | Average minimum temperature | AEMET [65] |
| Tavg (°C) | Average temperature for the period | AEMET [65] |
| Rr (mm) | Average annual precipitation for the period | AEMET [65] |
| FD (n° day) | Number of frost days: number of days with minimum temperature below 0 °C | García-Martín et al. [79] |
| SF (n° day) | Number of severe frost days: No. of days with minimum temperature below -4.7 °C | Lodolini et al. [70] |
| AWR (mm) | Annual water requirement | (USDA) [71] |
| ETO | Potential evapotranspiration | Hargreaves method [71] |
| NDRep14.4 | Number of days at rest, with average daily temperature below 14.4 °C |
López-Bernal et al. [33] |
| (n° day) | ||
| TavgRep14.4 | Average temperature of the number of days at rest | López-Bernal et al. [33] |
| (n° day) | ||
| NOGST14.4 | Number of days of active growth, with average daily temperature above 14.4 °C | Paniagua et al. [34] |
| (n° day) | ||
| TavgOGS14.4 | Average temperature of the number of days in active growth | Paniagua et al. [34] |
| (°C) | ||
| GDD14.4 | Degree days during the olive tree growth period above 14.4 °C | McMaster et al. [74] |
| (degree days) | ||
| NDCHS | Number of days with optimal temperatures for carbohydrate synthesis in leaves during the active growth period when the average daily temperature is between 20 °C and 30 °C | Tombesi et al. [64] |
| (n° day) |
| Variable | Mean | Median | SD | Min | Max | CV (%) | Skewness | Kurtosis |
| Tn | 10.43 | 10.47 | 0.92 | 7.15 | 12.19 | 8.78 | -0.88 | 2.28 |
| Tx | 22.57 | 22.84 | 1.23 | 19.17 | 24.28 | 5.45 | -1.09 | 1.02 |
| Tavg | 16.50 | 16.68 | 0.92 | 13.26 | 17.96 | 5.55 | -1.43 | 2.63 |
| Rr | 604.23 | 556.97 | 185.19 | 389.53 | 1304.77 | 30.65 | 1.97 | 4.72 |
| FD | 15.93 | 16.06 | 9.32 | 3.44 | 48.66 | 58.48 | 1.33 | 2.66 |
| SF | 3.07 | 2.47 | 3.34 | 0.19 | 17.47 | 108.93 | 2.74 | 8.93 |
| AWR | 241.38 | 297.73 | 201.34 | -426.13 | 475.02 | 83.41 | 1.65 | 2.90 |
| ETO | 3.54 | 3.55 | 0.22 | 2.90 | 3.88 | 6.17 | -0.68 | 0.26 |
| NDRep14.4 | 162.72 | 159.00 | 15.04 | 133.97 | 210.84 | 9.24 | 1.11 | 1.52 |
| TavgRep14.4 | 9.76 | 9.89 | 0.50 | 8.29 | 11.01 | 5.13 | -0.90 | 1.67 |
| NOGST14.4 | 202.53 | 206.25 | 15.04 | 154.41 | 231.28 | 7.43 | -1.11 | 1.52 |
| TavgOGS14.4 | 21.94 | 21.97 | 0.49 | 20.08 | 22.87 | 2.22 | -1.06 | 3.47 |
| GDD14.4 | 1529.67 | 1564.15 | 188.51 | 870.98 | 1808.54 | 12.32 | -1.19 | 2.14 |
| NDCHS | 112.22 | 113.69 | 10.48 | 70.81 | 130.66 | 9.34 | -1.65 | 4.63 |
| Index | Tavg | Rr | AWR | GDD14.4 | NDCHS |
| Tavg | 1 | ||||
| Rr | -0.587** | 1 | |||
| AWR | 0.681** | -0,974** | 1 | ||
| GDD14.4 | 0.976** | -0.562** | 0.655** | 1 | |
| NDCHS | 0.942** | -0.577** | 0.677** | 0.901** | 1 |
| Principal component | Eigenvalue | Component loading | Cumulative loading | ||
| PC1 | 4.02 | 80.42 | 80.42 | ||
| PC2 | 0.84 | 16.82 | 97.24 | ||
| PC3 | 0.10 | 2.07 | 99.31 | ||
| PC4 | 0.02 | 0.37 | 99.68 | ||
| PC5 | 0.02 | 0.32 | 100.00 | ||
| PC loadings for each variable | |||||
| Tavg | Rr | AWR | GDD14,4 | NDCHS | |
| PC1 | 0.934 | -0.282 | 0.402 | 0.929 | 0.904 |
| PC2 | 0.337 | -0.955 | 0.910 | 0.310 | 0.342 |
| Group | Elevation | Tavg | Rr | ||||||
| Mean | Min | Max | Mean | Min | Max | Mean | Min | Max | |
| G1 | 526.0 ab | 261.0 | 750.0 | 15.7 a | 14.6 | 16.6 | 694.4 a | 555.08 | 908,7 |
| G2 | 365.7 a | 185.0 | 573.0 | 16.9 b | 16.1 | 18.0 | 524.3 b | 389,5 | 730,5 |
| G3 | 680.0 b | 515.0 | 796.0 | 14.8 c | 13.2 | 16.2 | 1153.0 c | 1006,7 | 1304,8 |
| Group | GDD14.4 | NDCHS | AWR | ||||||
| Mean | Min | Max | Mean | Min | Max | Mean | Min | Max | |
| G1 | 1339.7 a | 1156.8 | 1489.5 | 103.5 a | 90.3 | 113.7 | 114.4 a | -104,3 | 274,7 |
| G2 | 1623.2 b | 1455.5 | 1808.5 | 116.9 b | 106.9 | 130.7 | 335.6 b | 106.8 | 475,0 |
| G3 | 1197.5 a | 8701.0 | 1464.5 | 93.0 c | 70.8 | 111.0 | -329.5 c | -426,1 | -209,7 |
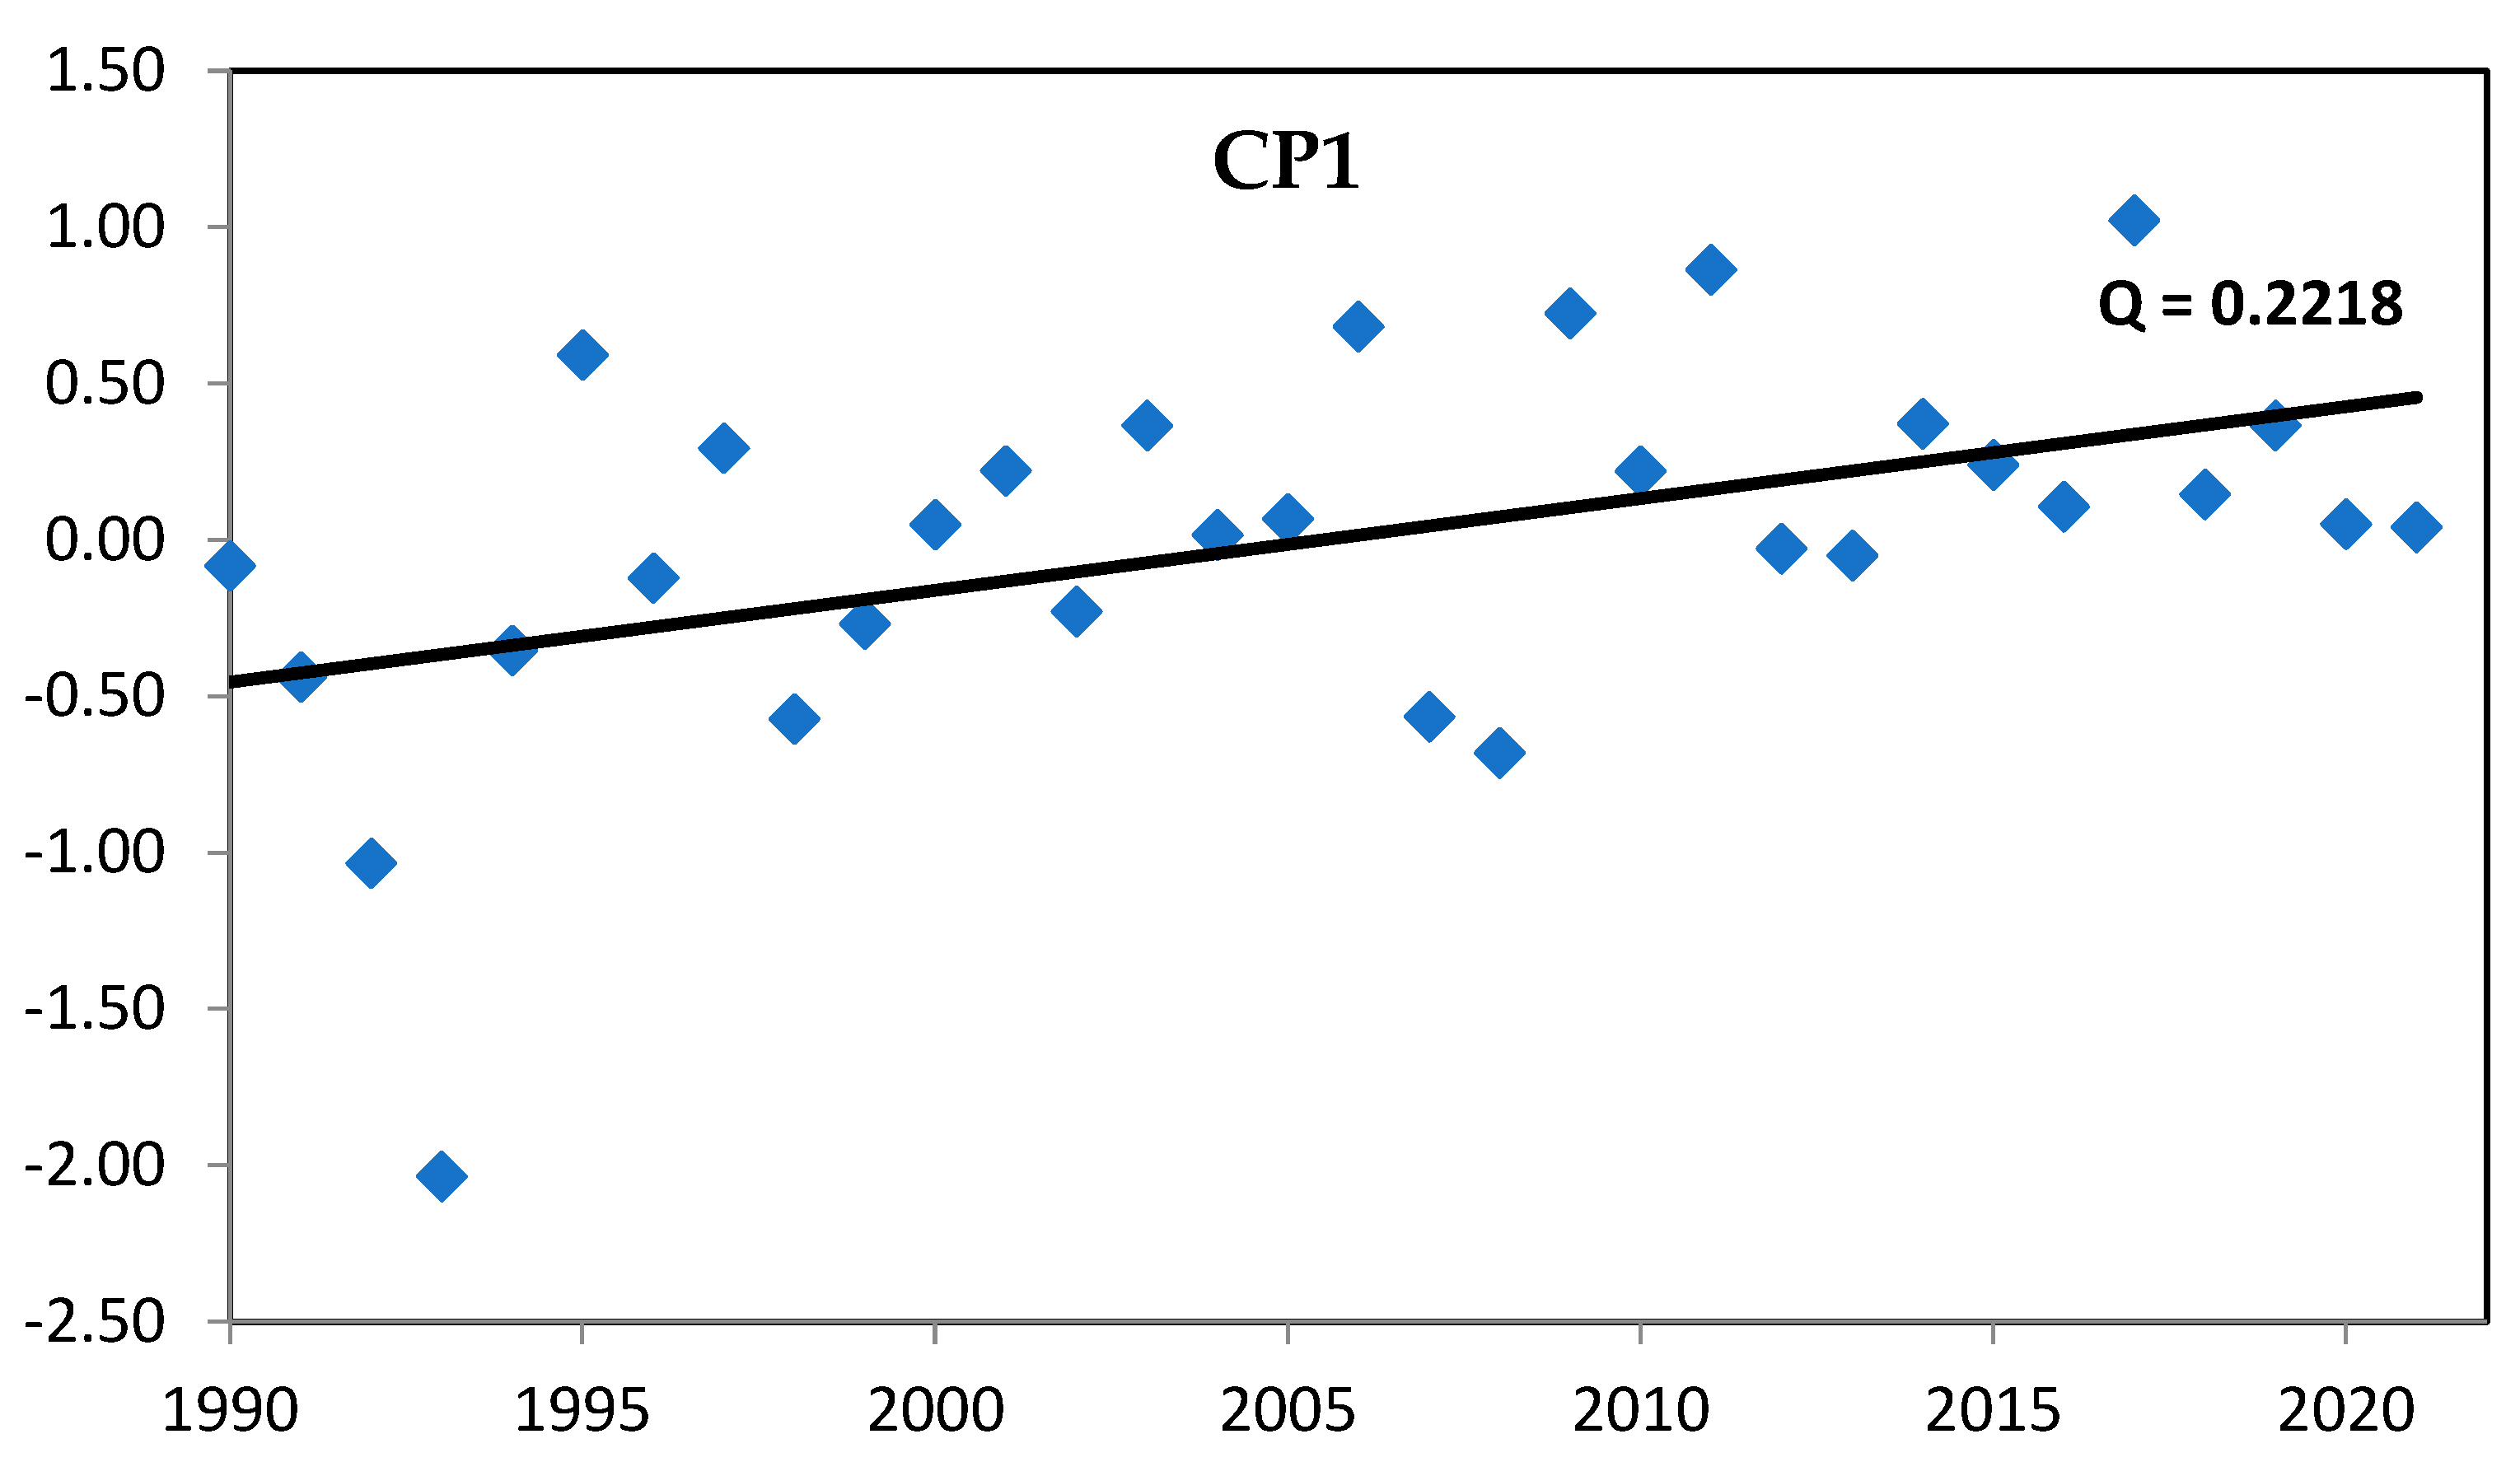
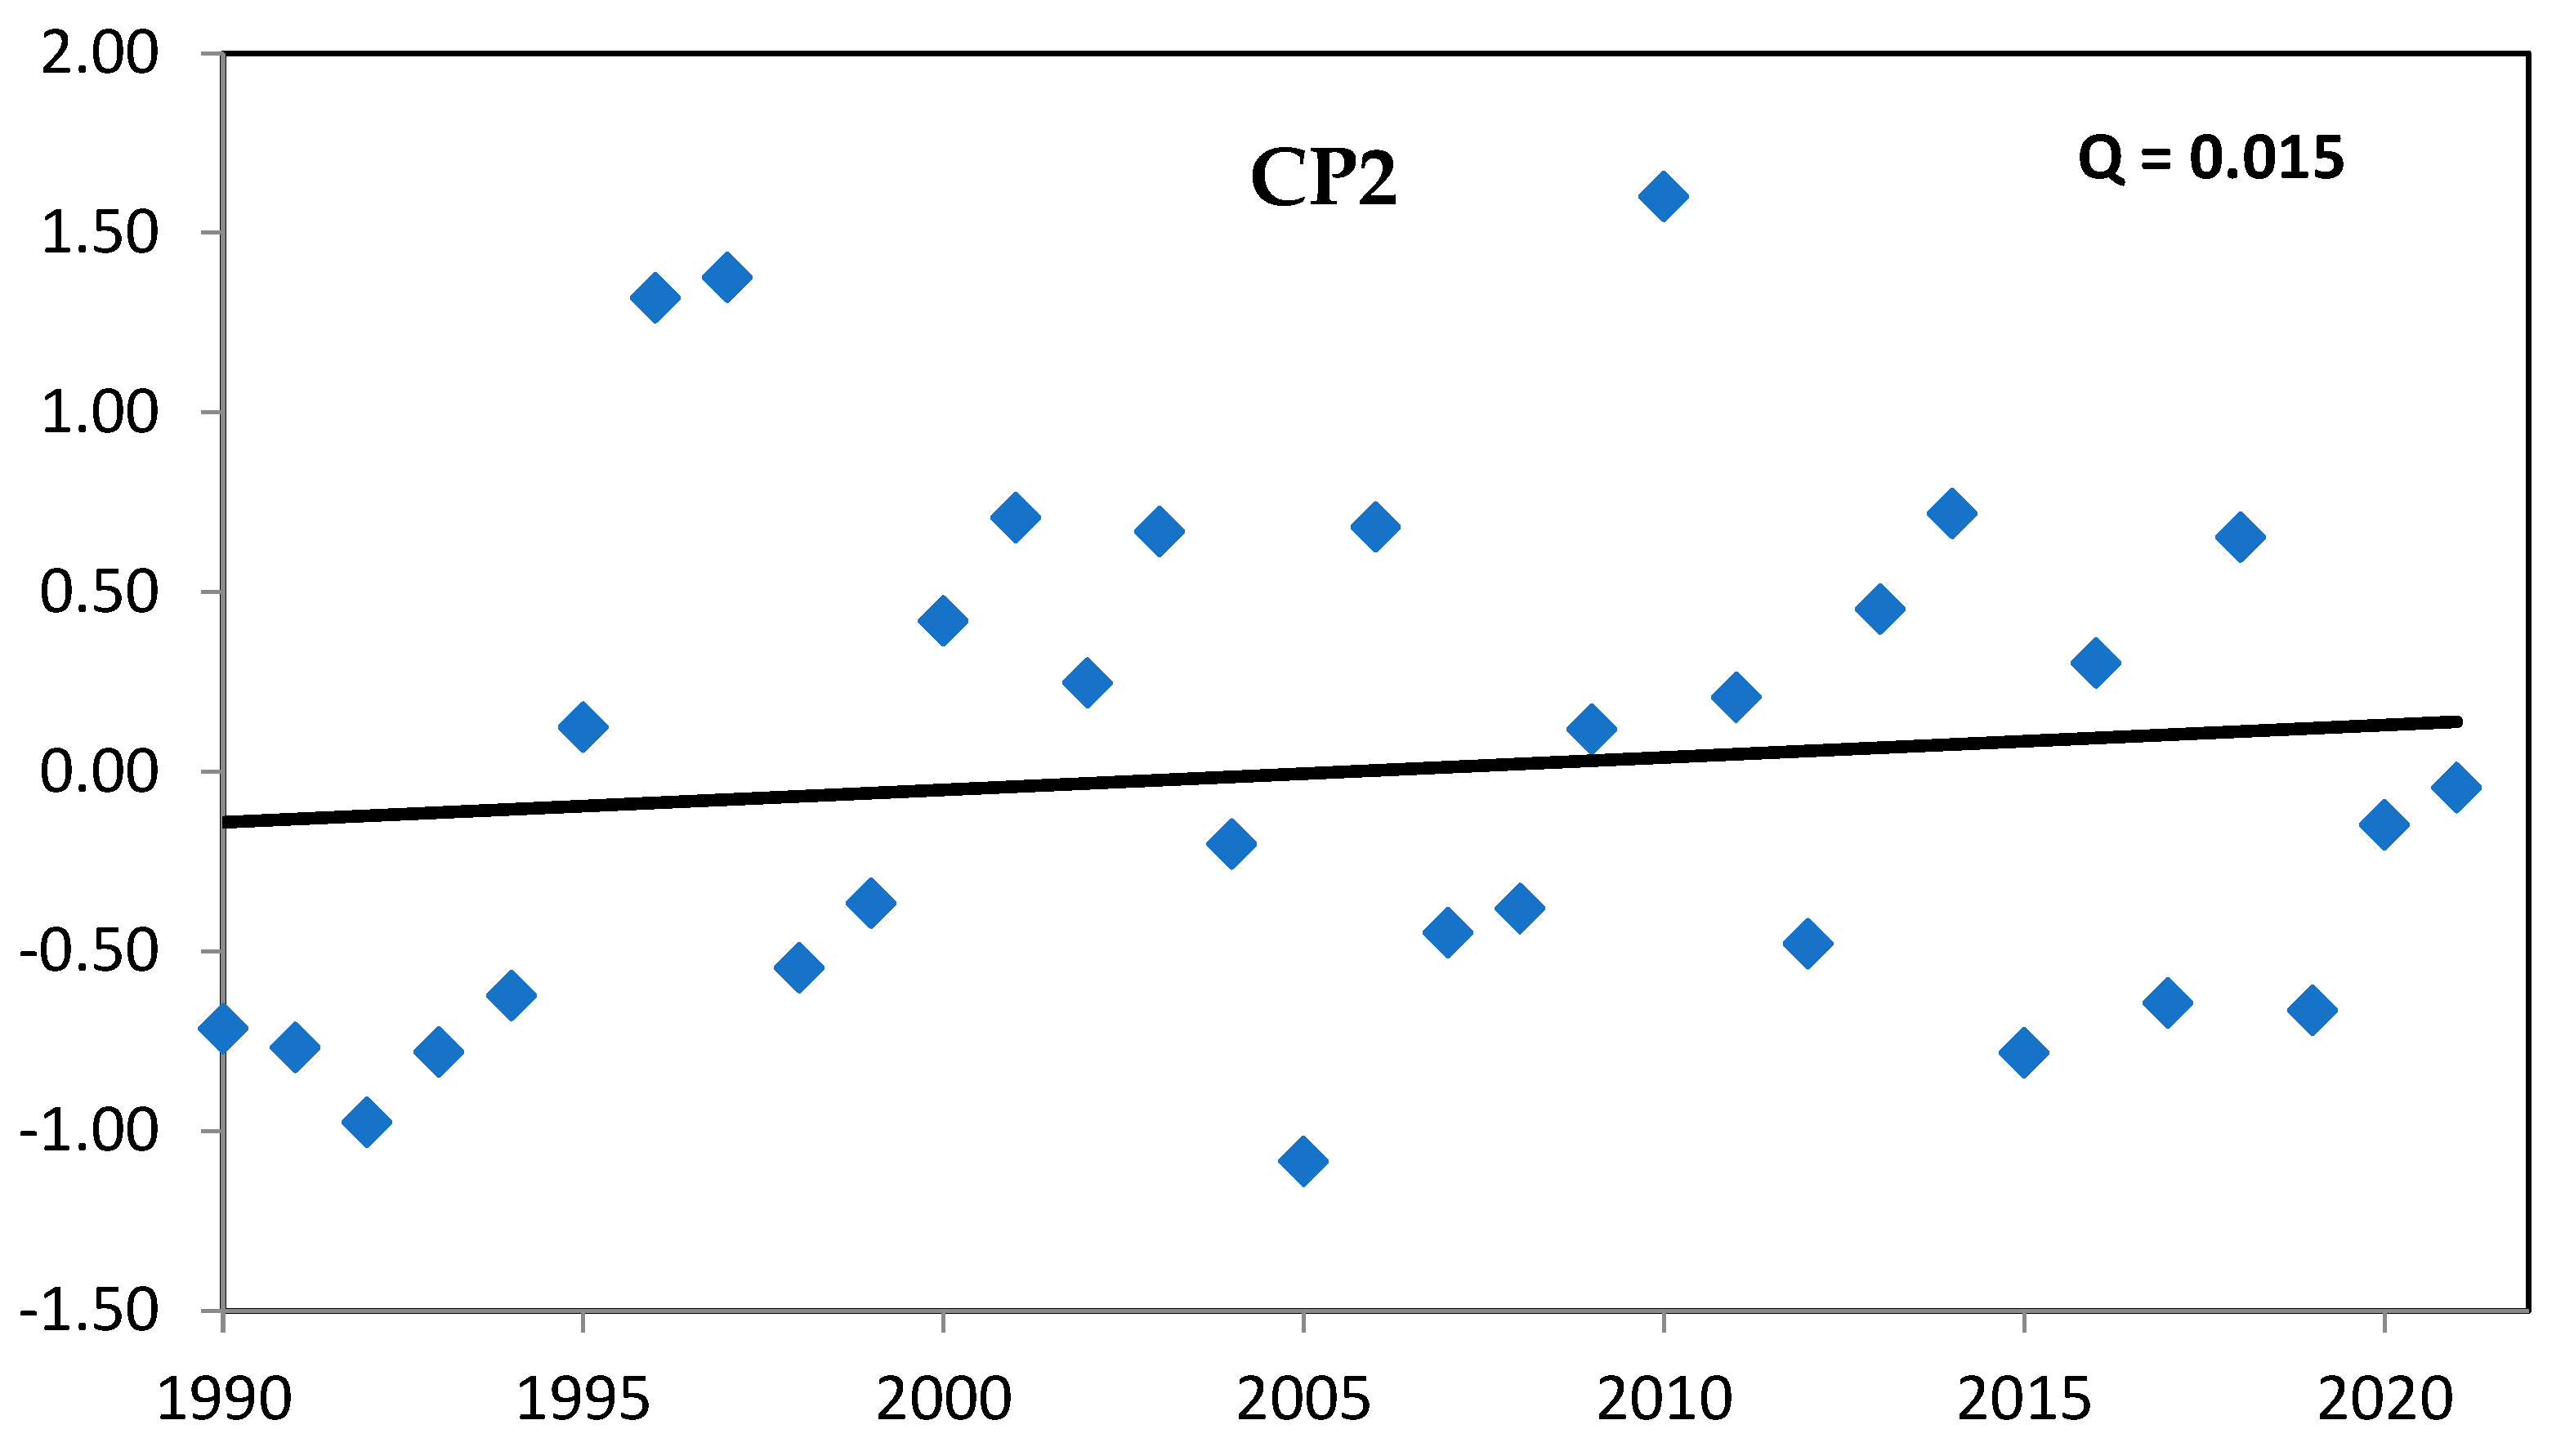
| Principal | Mann-Kendall trend | Sen's slope estimate | |
| component | Test Z | Signific. | Q |
| PC1 | 2.51 | ** | 0.021 |
| PC2 | 0.89 | 0.015 |
Disclaimer/Publisher’s Note: The statements, opinions and data contained in all publications are solely those of the individual author(s) and contributor(s) and not of MDPI and/or the editor(s). MDPI and/or the editor(s) disclaim responsibility for any injury to people or property resulting from any ideas, methods, instructions or products referred to in the content. |
© 2025 by the authors. Licensee MDPI, Basel, Switzerland. This article is an open access article distributed under the terms and conditions of the Creative Commons Attribution (CC BY) license (http://creativecommons.org/licenses/by/4.0/).


