1. Introduction
Proton exchange membrane fuel Cells (PEMFCs) have become the focus of energy research due to their high-efficiency operation and zero-pollution emissions. These characteristics make PEMFCs a promising option in the search for sustainable energy alternatives. However, the online measurement of PEMFCs remains a hard challenge. The complex reaction mechanisms occurring inside the cells, combined with their closed-structure design, pose significant obstacles to accurate in-situ monitoring. Printed Circuit Board (PCB) technology, as an in-situ segmented-cell measurement method, has received extensive attention in the research of PEMFCs. It enables researchers to explore the current density distribution and internal polarization processes within fuel cells. This technology provides unique insights into the spatial variations of key parameters, which is crucial for a comprehensive understanding of the performance of PEMFCs. At present, according to the different principles by which current sensors acquire and convert current signals, the current - measurement technologies related to PCBs can be classified into several categories: Ohm's law [
1,
2], Hall's principle [
3,
4], and the magnetization of soft magnets [
5]. Each of these methods has its own advantages and disadvantages, and researchers are constantly exploring ways to improve their accuracy and applicability in the measurement of PEMFCs.
Among the above current measurement methods, the principle of the Voltage division method is simple. However, it will cause output voltage loss and PCB process complexity. And the signal of the Hall method is easy to be disturbed. The magnetization method also has problems such as the PCB embedding resistance process and thickness increase. Consequently, it is necessary to take some measurement means to amplify the weak voltage signal for acquisition to reduce transmission loss and interference.
Jiao et al. [
6,
7] employed the PCB surface-mount technology and the method of external resistors to achieve the integration of the PCB sensor inside the fuel cell. They investigated the influence of the water state on cold start by means of distributed parameters, thus offering a specific optimization approach for the cold start process. However, due to the weak distributed signals, a 100mΩ sampling resistor was selected for this system. Although this improved anti-interference ability and reduced transmission losses, it also increased the voltage drop in the segmented circuit, making it difficult to effectively ensure the reliability of the system. Based on this, the paper focuses on developing distributed signal amplification sensors based on PCB to further acquire the distribution of distributed current density.
2. PCB Signal Amplification Sensor Design
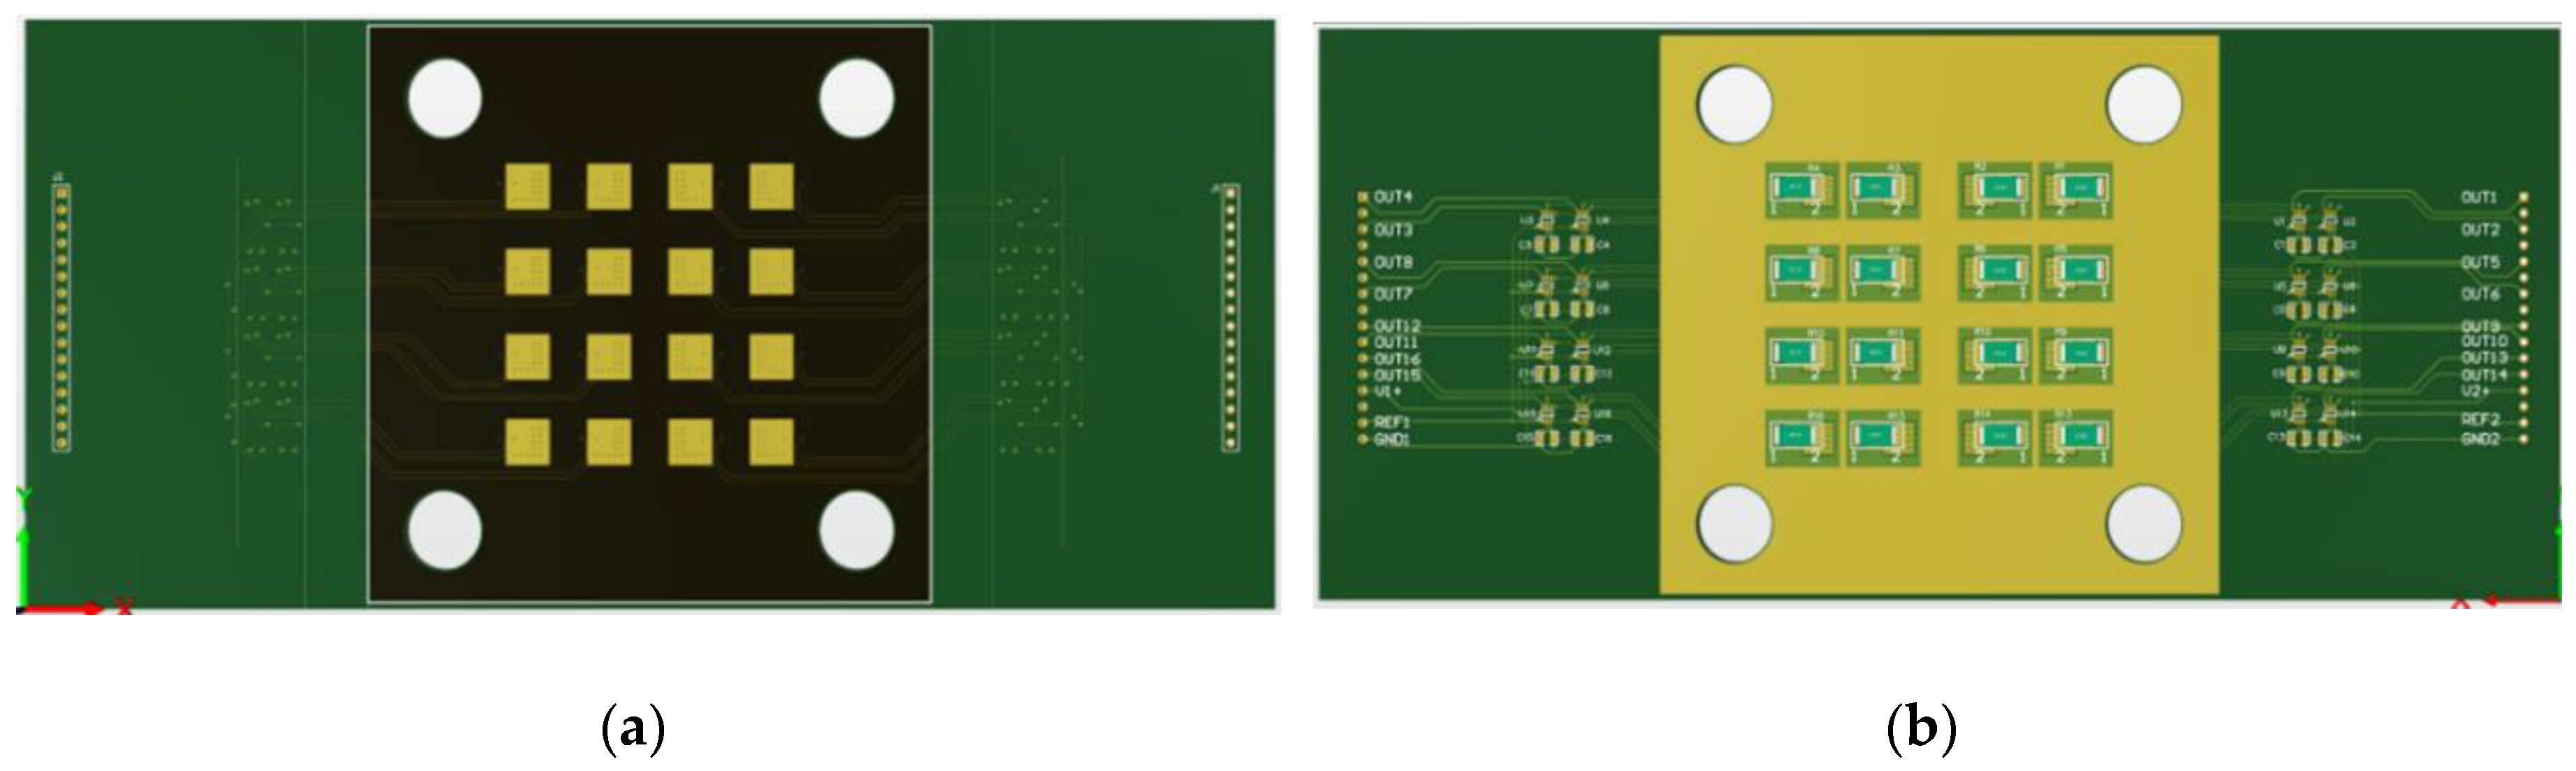
Ohm's law provides the theoretical basis for the calculation of segmented current. By measuring the Voltage drop across the sampling resistor, the segmented current can be calculated according to the law. The obtained voltage signal is relatively weak and needs to be amplified by a current sensing amplifier for subsequent analysis and application. To achieve more effective detection and processing of current, with the help of Altium Designer software, a laminated structure PCB with a 4◊4 segment distributed signal amplification function is carefully designed and successfully fabricated. Its specific structure is shown in
Figure 1. In the design of the PCB, to achieve the current collection function, gold-plated insulating pads are specifically set on the back of the PCB. The current is guided to the back through some vias on the PCB. On the back, the current is directly connected to the corresponding shunt resistors. The signals generated after connection are processed to form voltage signals. These signal lines transmit the voltage signals into the amplifier for amplification, and the amplified signals are directly output by the PCB connector. Through the above-mentioned series of designs and operations, the PCB has successfully realized the functions of current segmentation, current collection, and amplification, providing strong support for subsequent related circuit analysis and applications.
This design, relying on the innovative and unique concept of the PCB structure, has significantly strengthened the anti-interference performance of distributed signals without the slightest impact on the structure of the core reaction area inside the cell. Meanwhile, the design ensures a high degree of integration of the sensor, enabling the cell structure to be compactly installed, and lays a solid foundation for stabilizing the performance and stability of the cell assembly.
3. Experiment
3.1. Experiment Setups
This experiment is conducted based on the Hephas Scribner 850e fuel cell test bench, and the experiments on the collection and amplification of distributed voltage signals are completed. The process is progressive, gradually achieving accurate and stable collection and amplification of these signals.
Table 1 details the information of the measuring devices related to this experiment, covering aspects such as device models and parameters, providing a basis for the analysis and research of the experimental results.
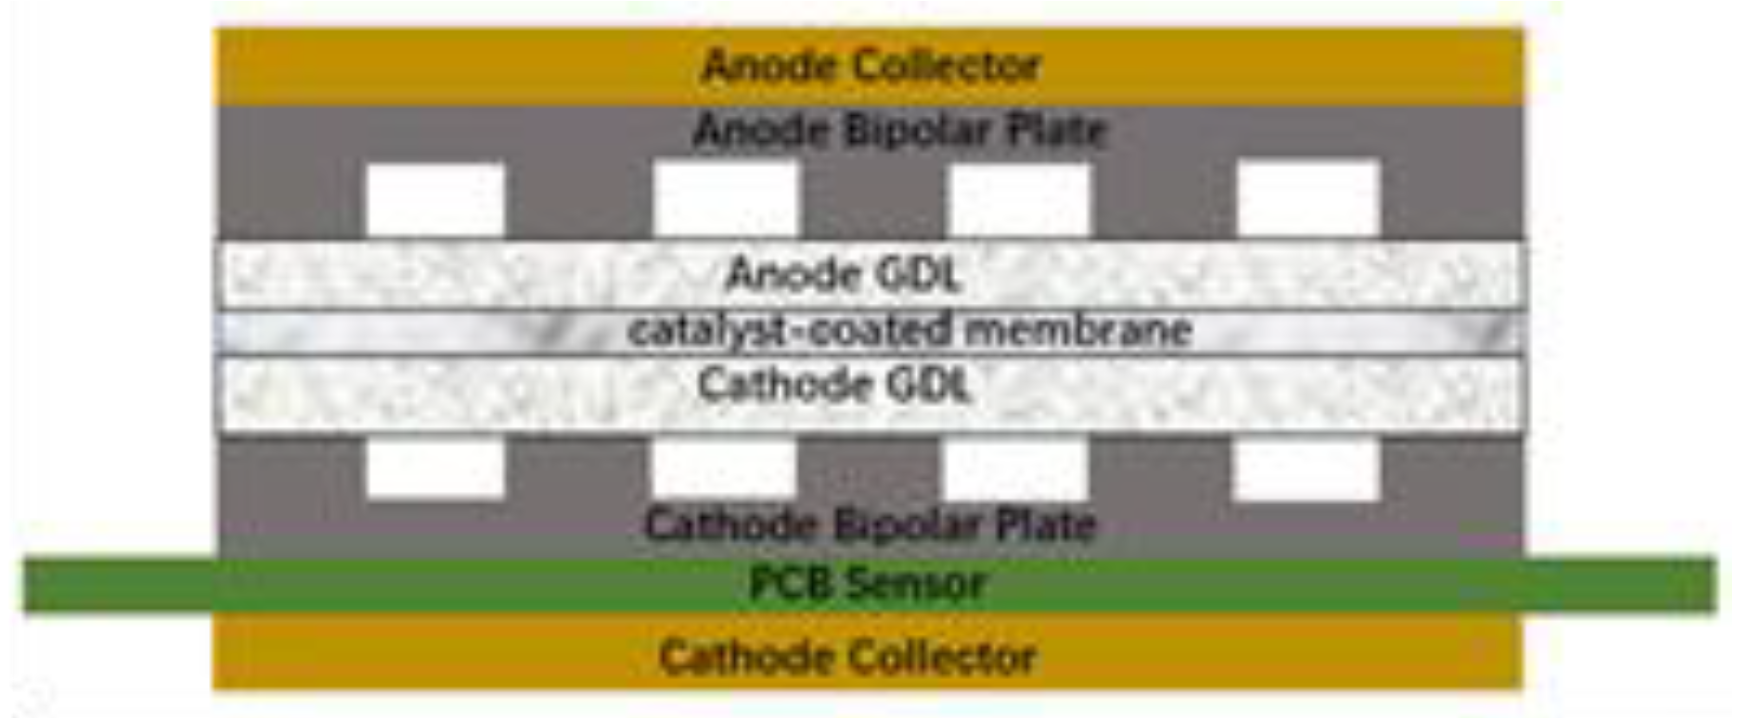
In this study, to effectively monitor and analyze the performance of the fuel cell, the key components are designed and arranged. As shown in
Figure 2, the PCB distributed signal amplification sensor is placed between the cathode-side bipolar plate and the current collector [
8,
9,
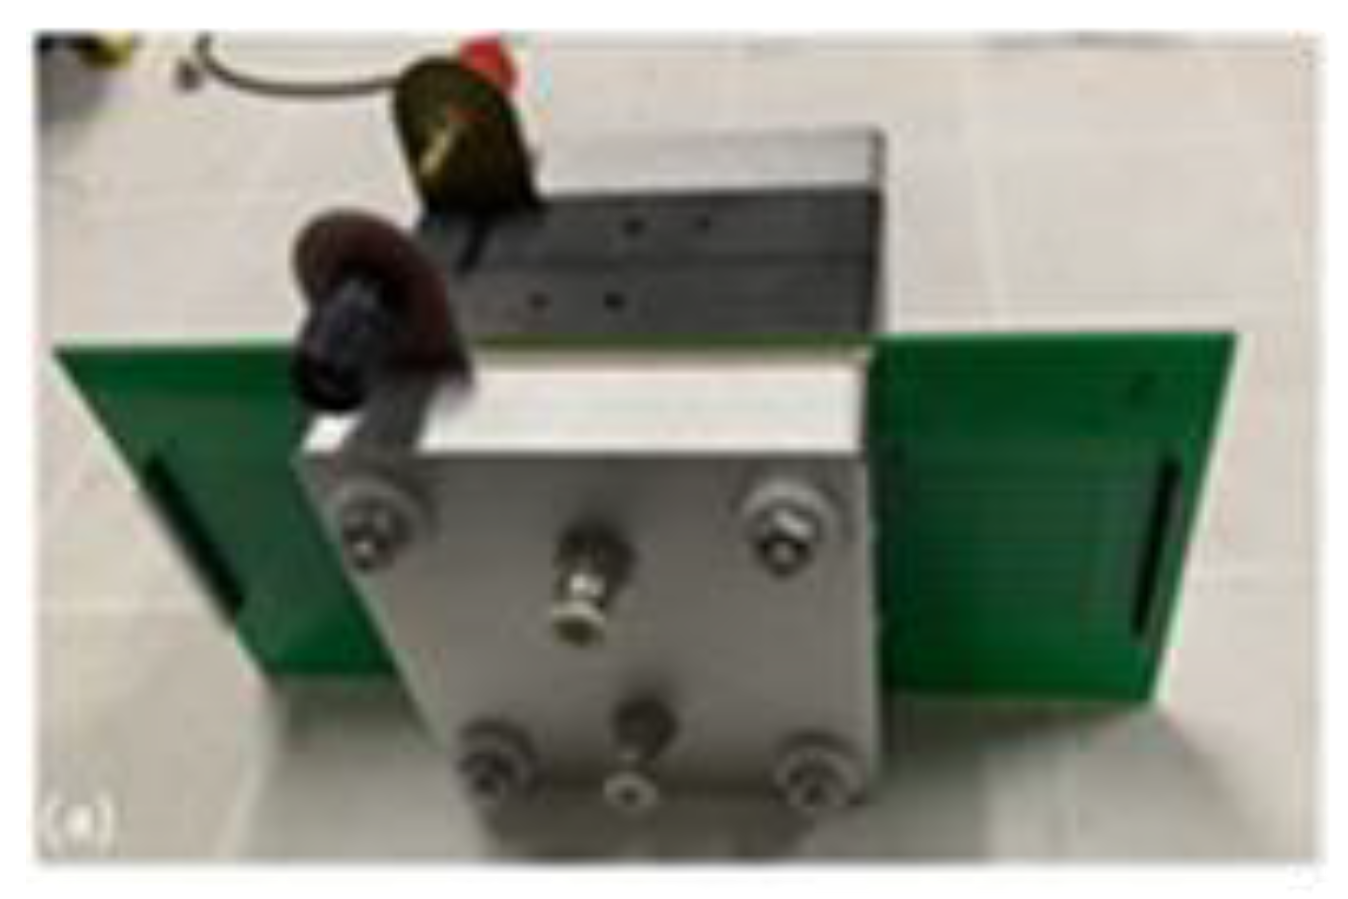
10]. Subsequently, these components are further assembled into a single cell, and the assembled structure is presented in
Figure 3. This approach of placing the PCB between the cathode-side bipolar plate and the collector can effectively prevent interference with the internal structure of the cell, ensuring that the core reaction area within the cell remains unaffected and guaranteeing the normal operation of the single cell assembly.
The PCB sensor features a unique four-layer stacked structure, enabling it to collect and amplify distributed voltage signals, thus providing a stable and reliable signal source for subsequent data analysis. Meanwhile, through the design method of structural avoidance, the current collector can achieve compact installation with other components without disturbing the internal structure of the cell. In the data collection process, the voltage drop across the sampling resistor is accurately acquired using NI USB-6218 driven by LabVIEW (National Instruments Corporation), thereby providing an accurate data foundation for subsequent analysis and research based on voltage signals.
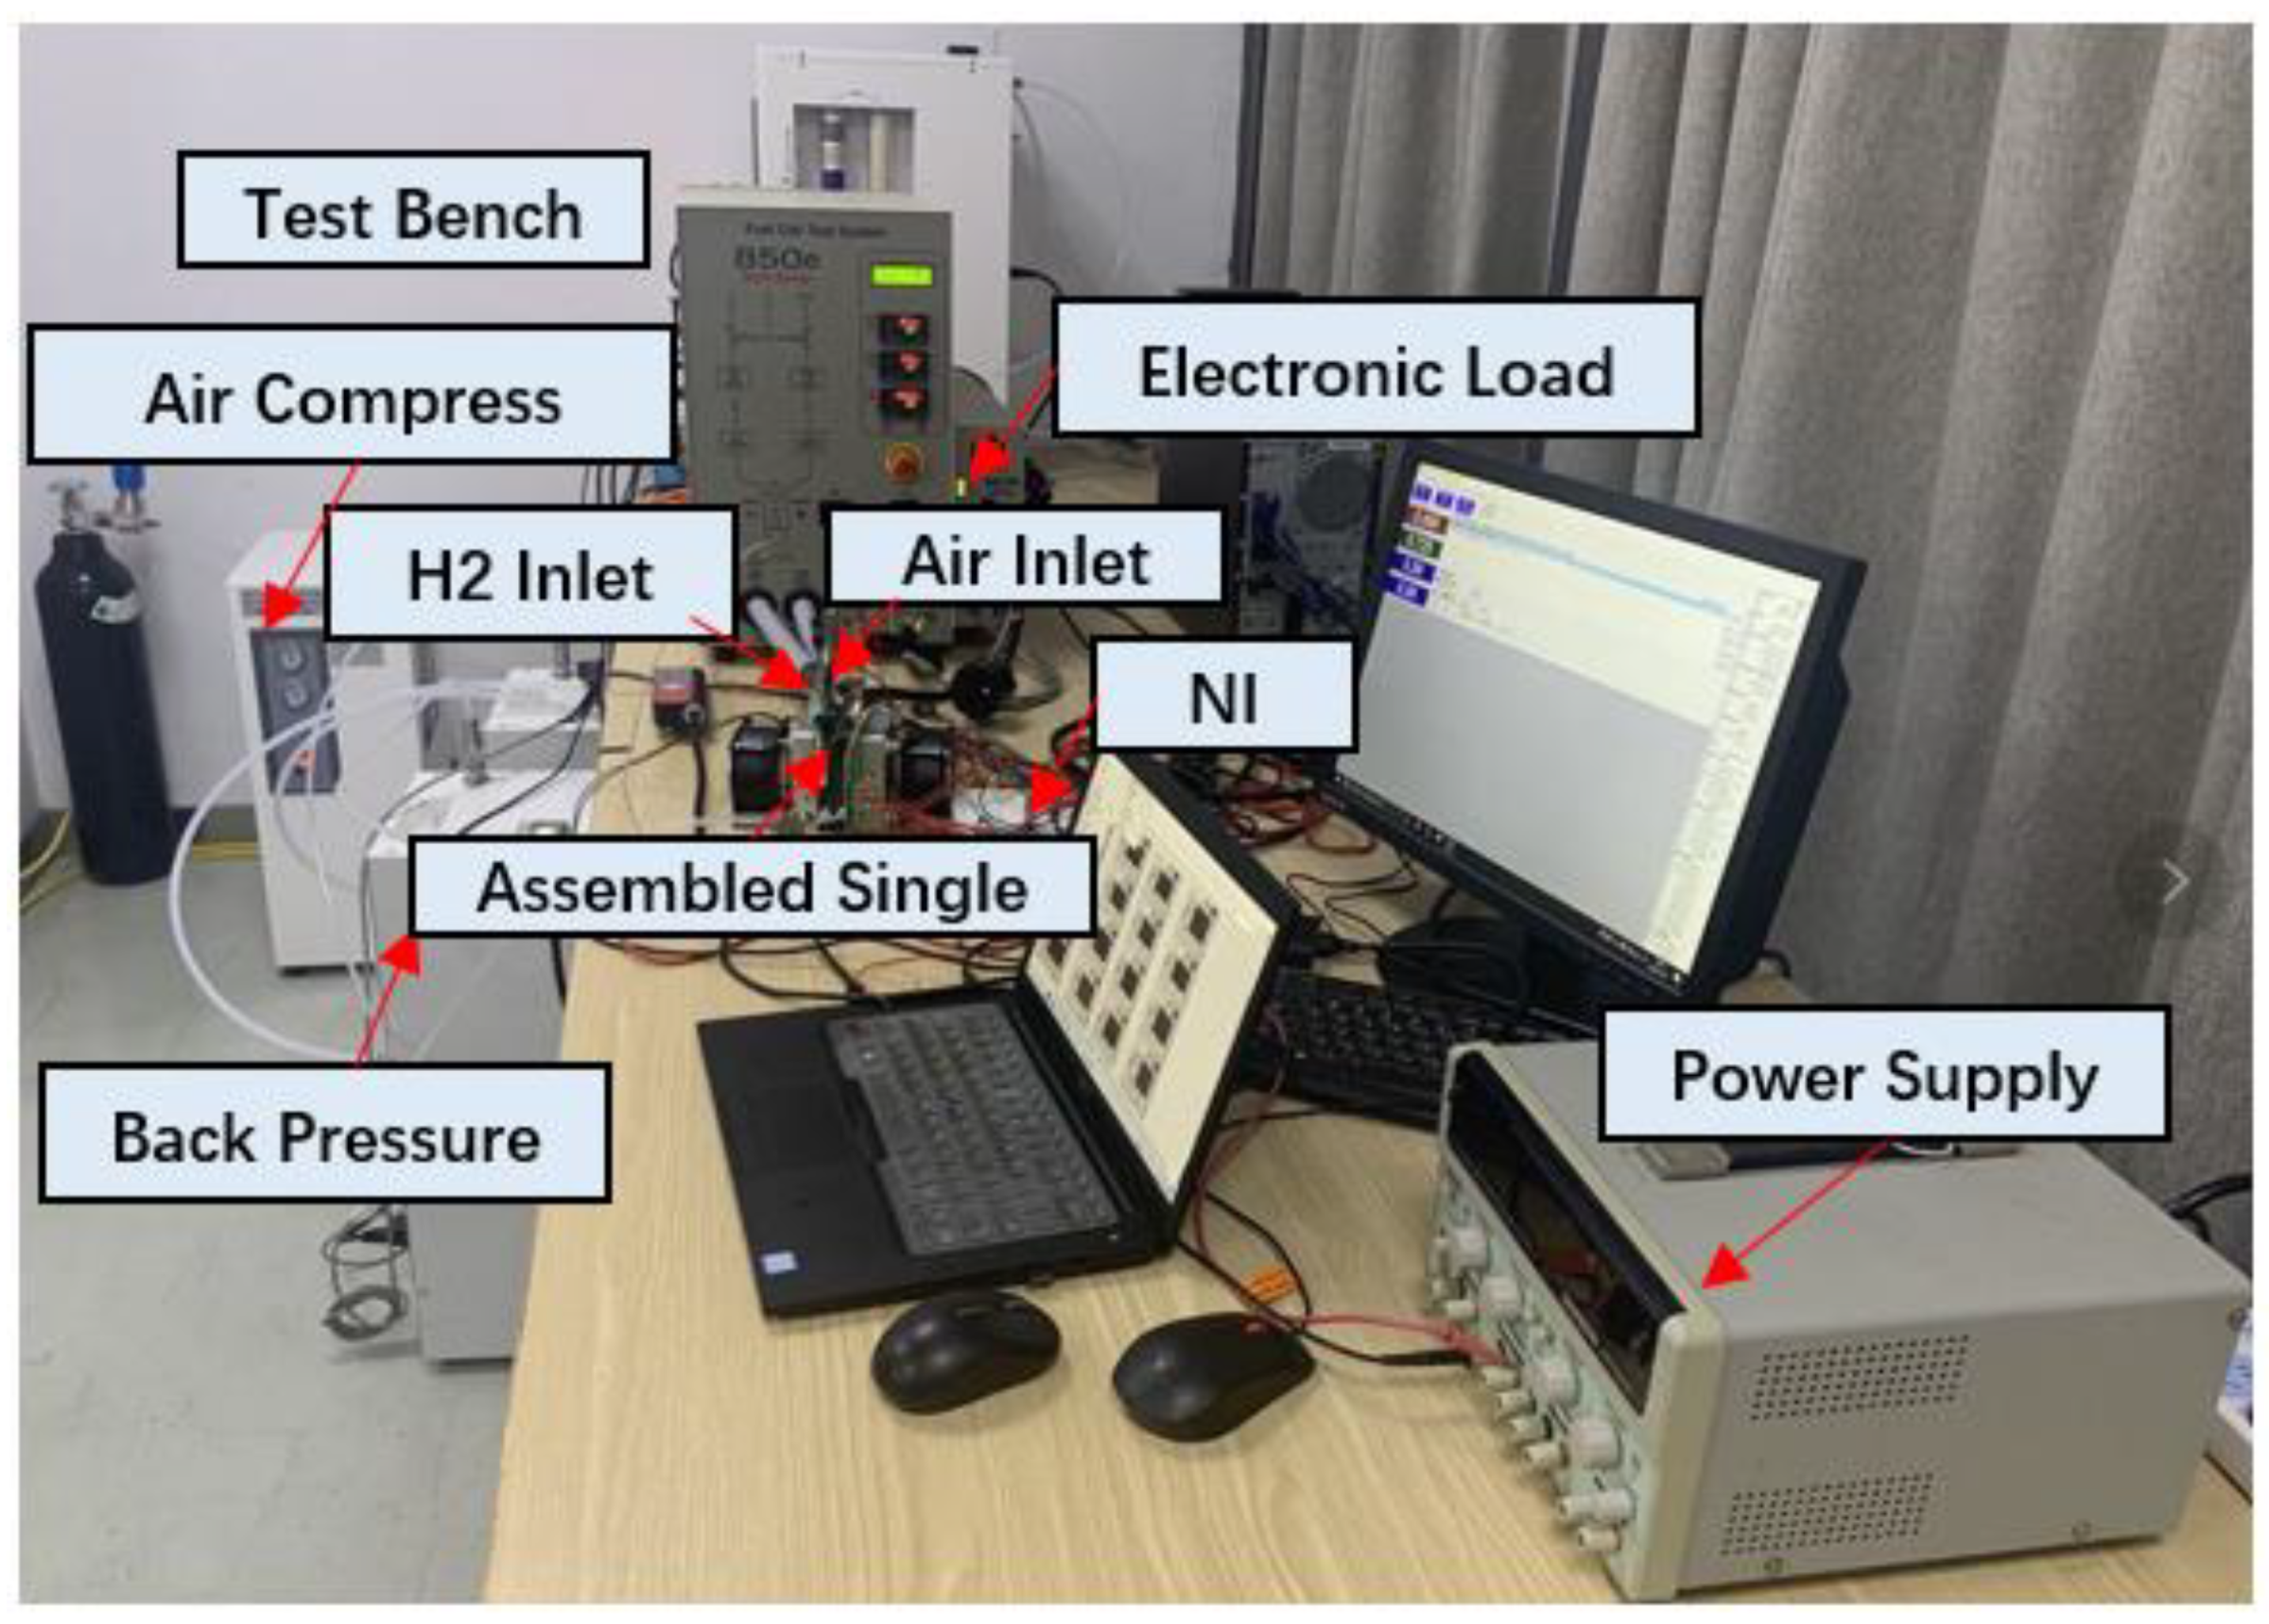
In this experimental system, all devices are connected to the test bench in sequence, as shown in
Figure 4. A high-precision mass flow controller is used to regulate the flow rates of air and hydrogen, ensuring that the flow rates of the reactive gases entering the fuel cell are accurate and stable, and meeting the gas supply requirements under different experimental conditions. The back-pressure module is responsible for adjusting the inlet pressure. By precisely controlling the pressure parameters, it provides a suitable pressure environment for the stable operation of the fuel cell. An electronic load is also integrated into the test bench, which is used to simulate different power consumption demands, to test the performance of the fuel cell under different load conditions. In addition, the system uses two heating columns to heat the fuel cell, and at the same time, a thermocouple is used to measure the fuel cell temperature in real-time.
3.2. Experiment Principle
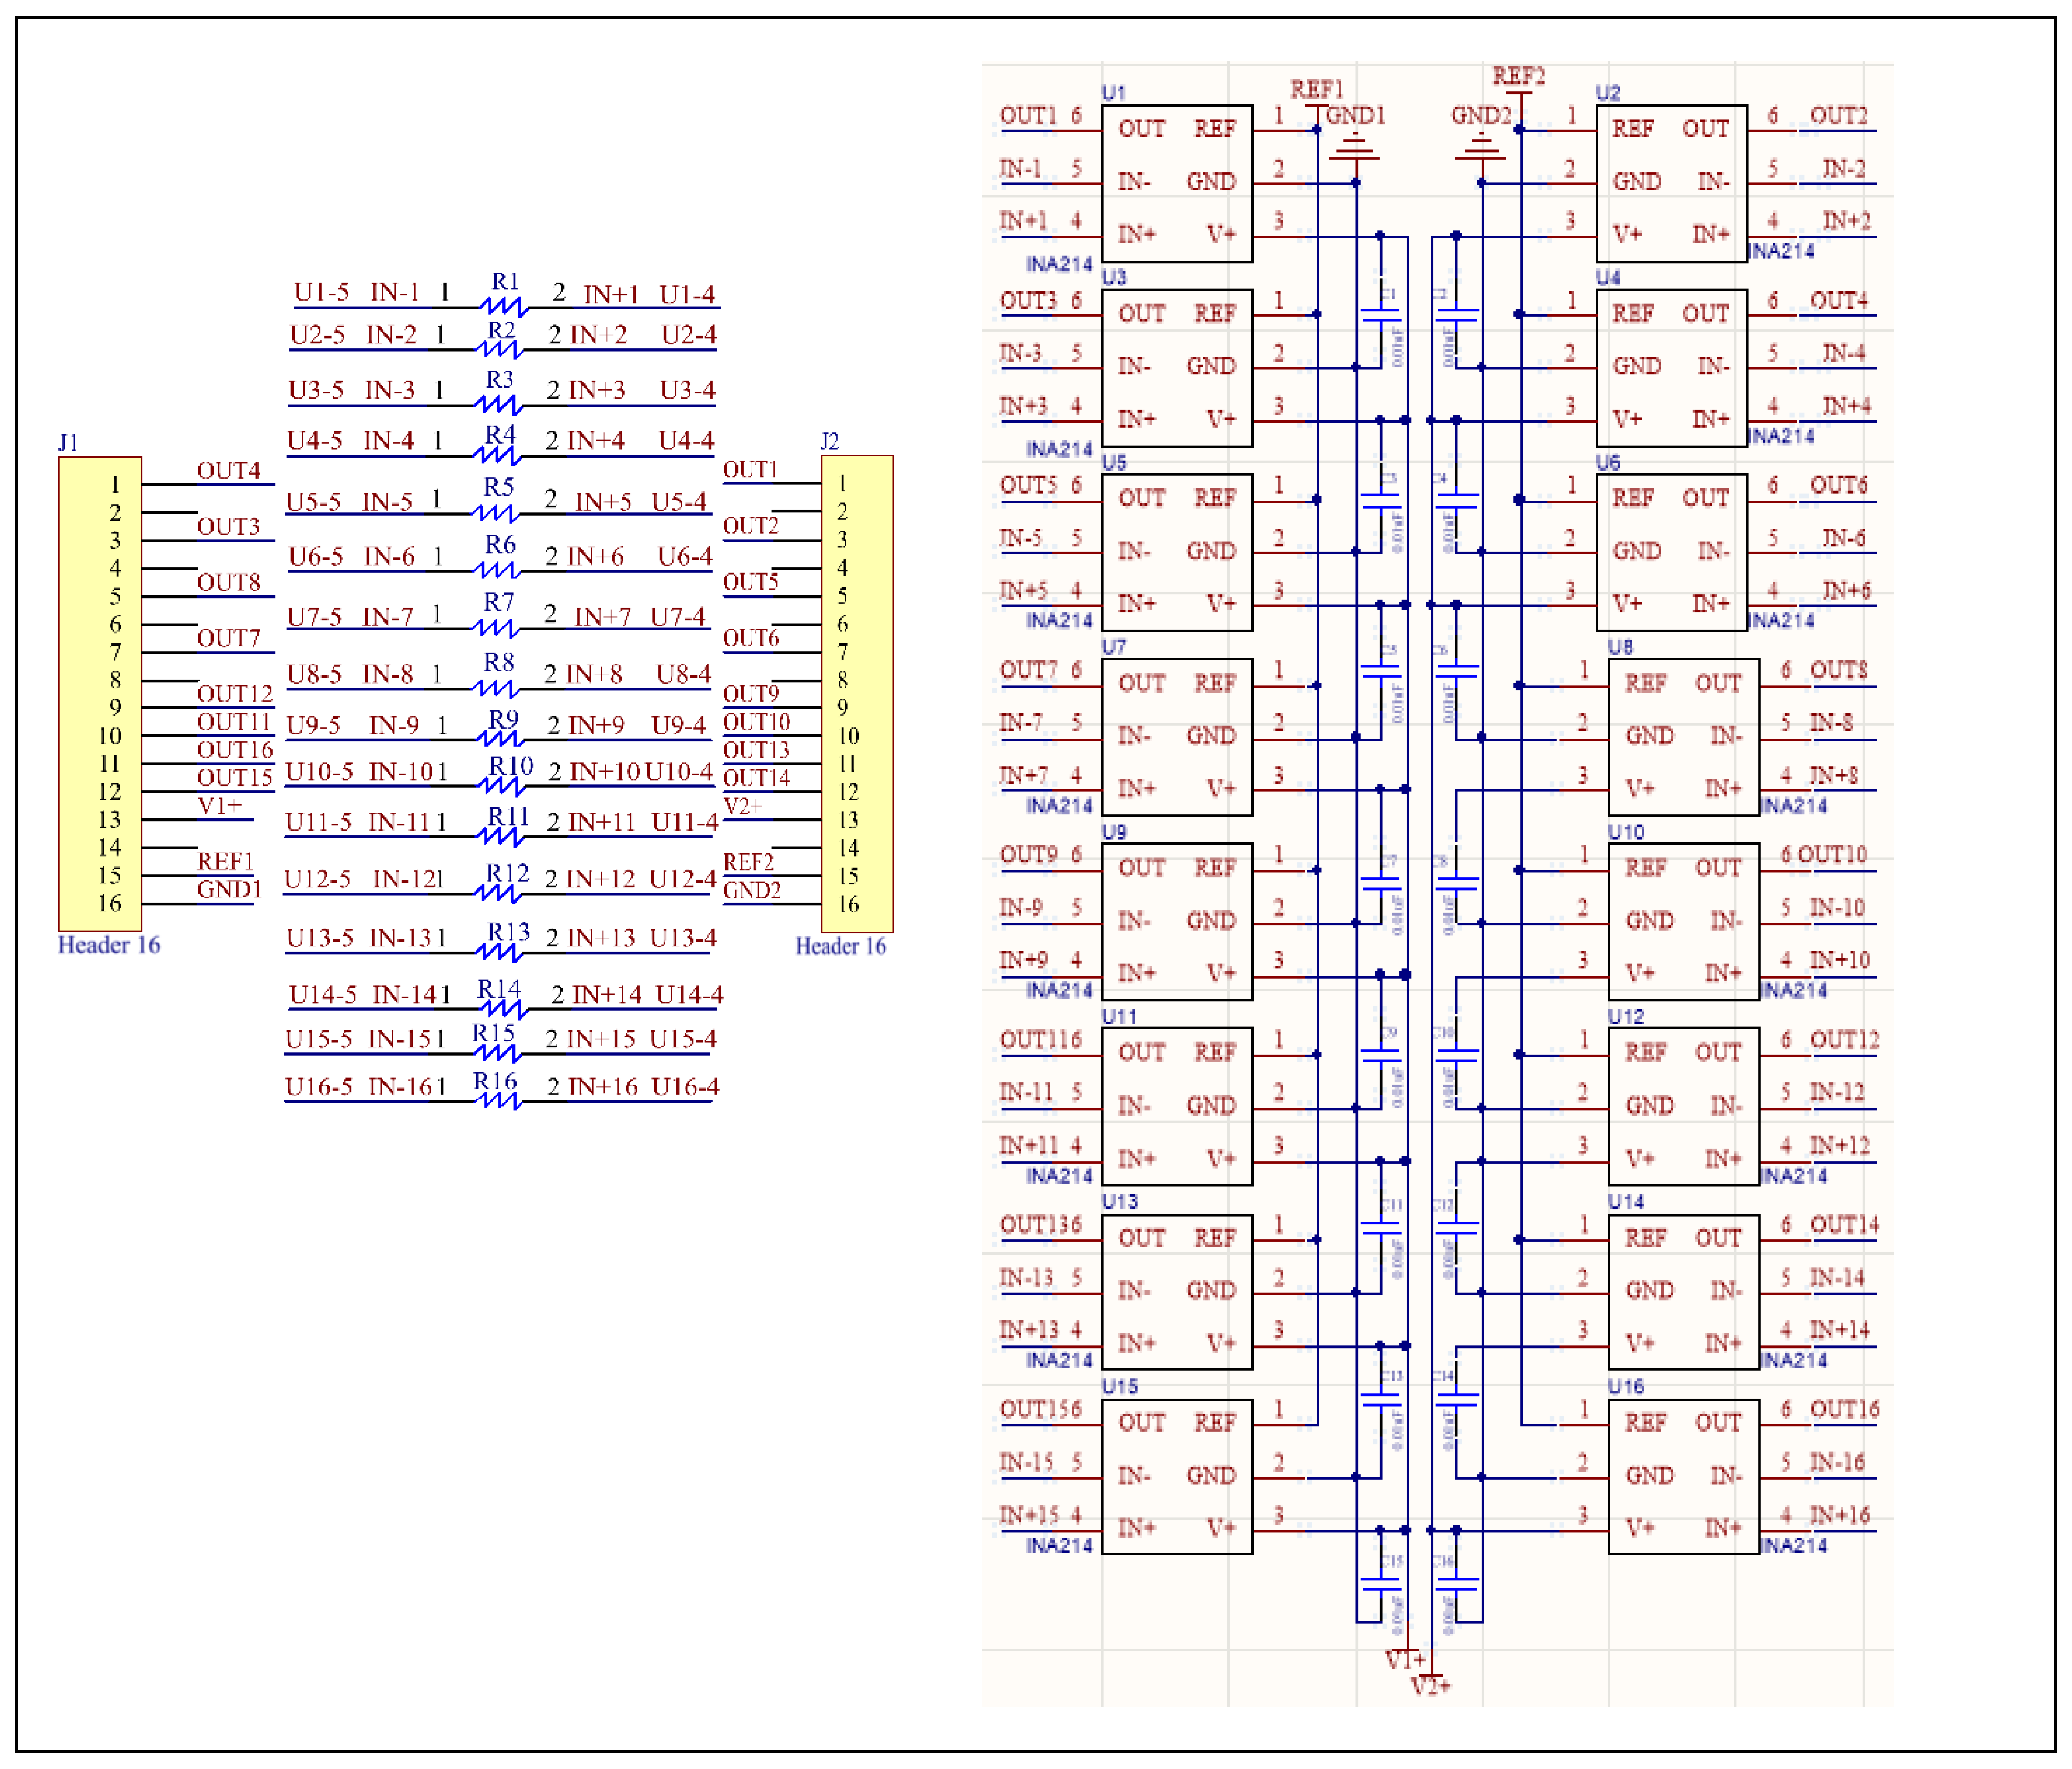
The back of the cathode-side bipolar plate is closely fitted to the flat pads of the PCB. On the top layer of the PCB, 4×4 mutually-insulated pads are designed to be used as current segments The current is led to the bottom of the PCB through the vias on the pads, and these vias are respectively connected to 16 identical shunt resistors. All components are integrated into the bottom layer of the PCB. After the current passes through the resistors, it converges on the gold-plated surface of the bottom layer of the PCB and is then led out by the current collector. The voltage signal acquisition lines at both ends of the resistors are connected to the segment amplifier. The amplified signals are led out from the connectors at both ends of the PCB. The schematic diagram of the PCB signal-amplification sensor is designed with the help of Altium Designer 19 software (as shown in
Figure 5). Node 1 and Node 2 at both ends of the shunt resistor are connected to IN- and IN+ of the amplifier respectively. Then, the amplified signals are output to the J1 and J2 connectors.
3.3. Experiment Procedures
The accurate measurement accuracy of the PCB sensor is the basis for obtaining reliable data. When studying the in-plane current distribution of the fuel cell under different operating conditions, the measurement accuracy of the PCB sensor after signal amplification is a key factor that must be considered. The experimental procedures are listed in
Table 2.
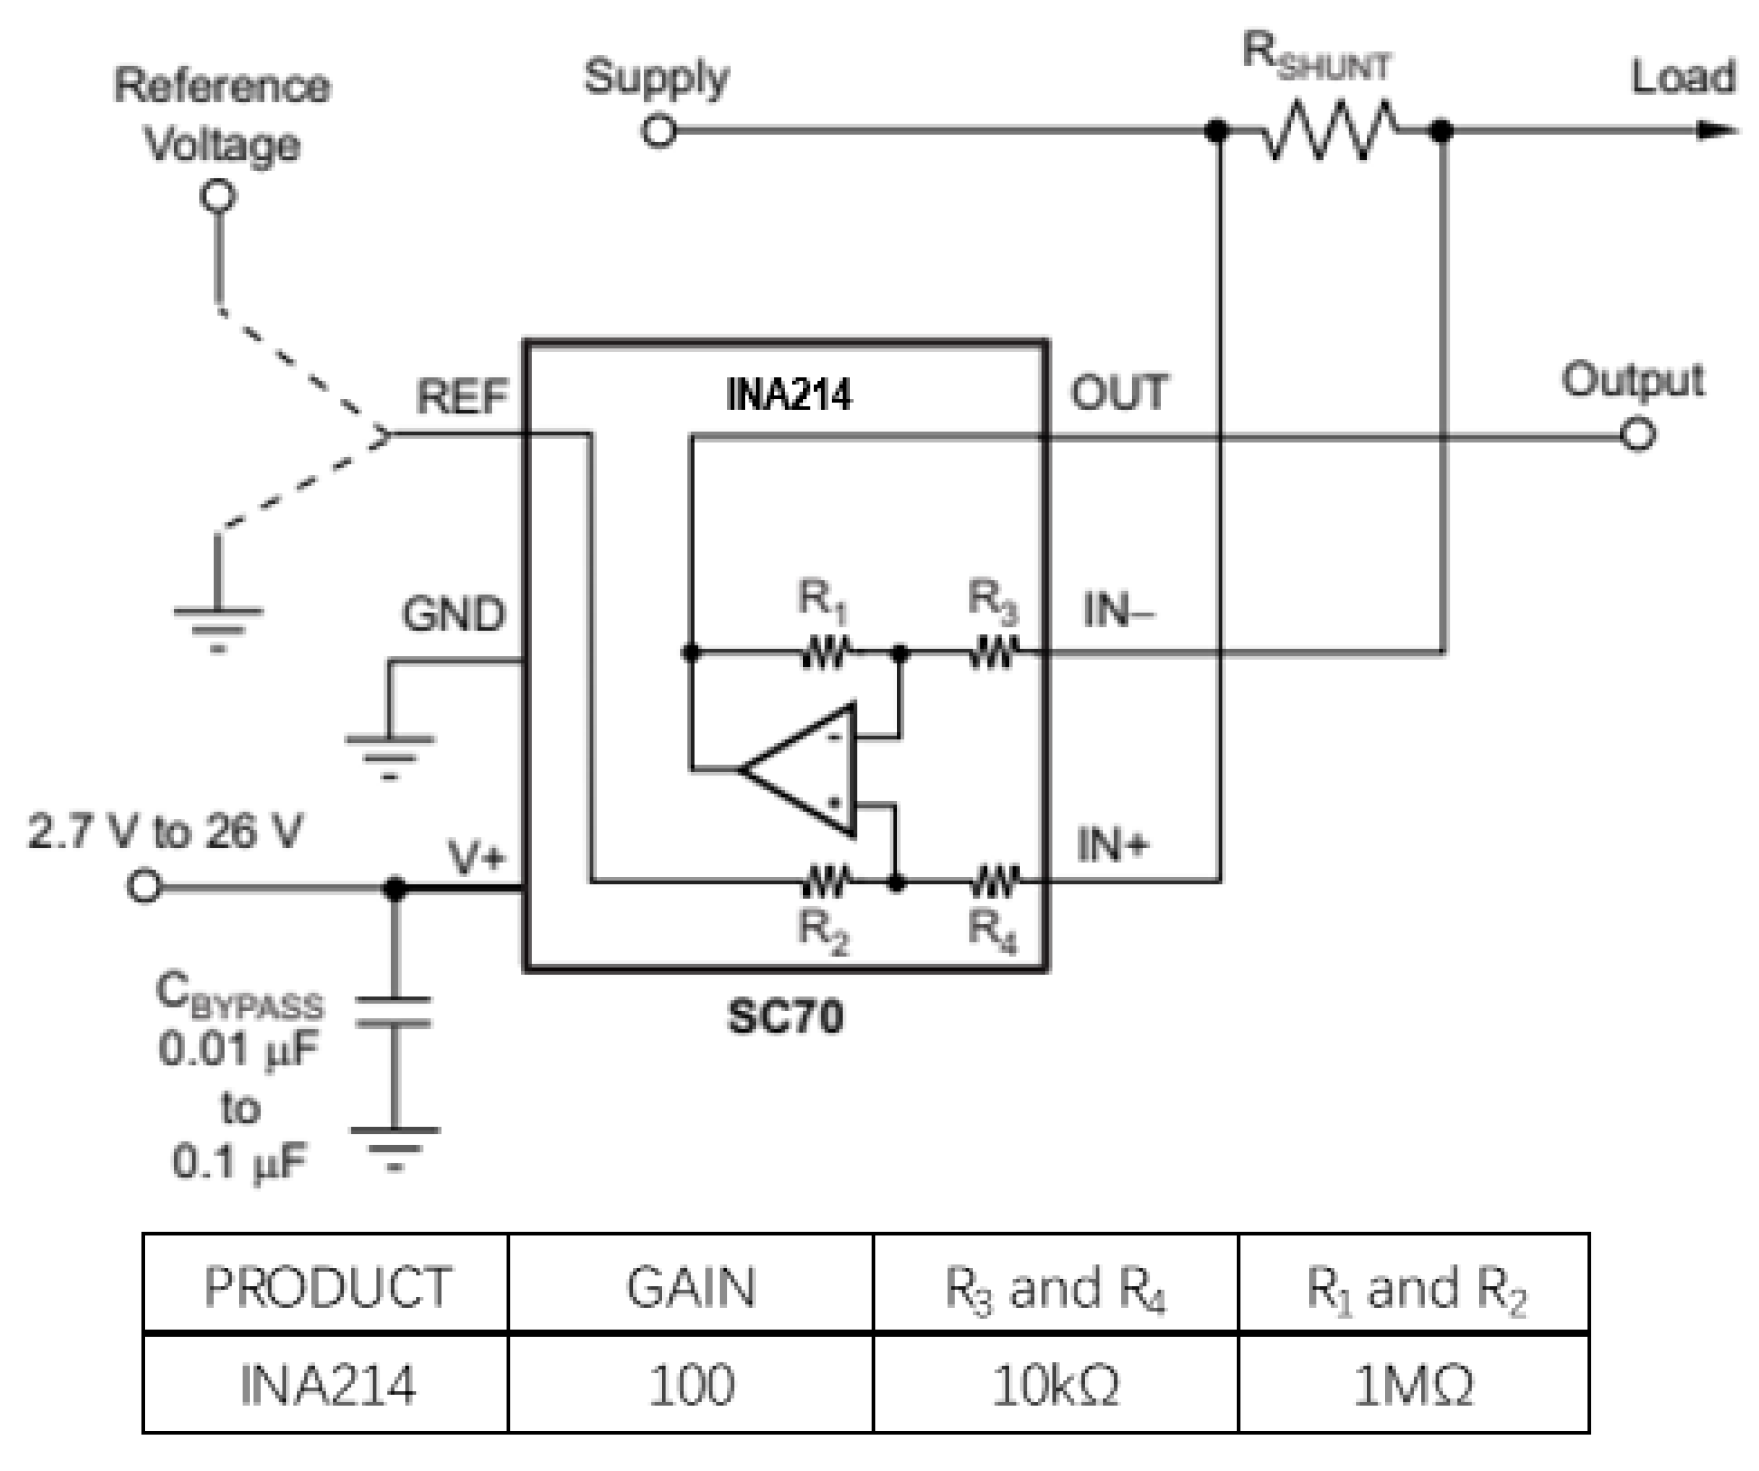
Distributed voltage can be obtained through theoretical calculation based on Ohm's Law (Formula 1) and combined with the amplifier principle corresponding to Formula 2. The simple schematic diagram of the amplifier is shown in
Figure 6.
Here, n represents the segment array number (11…44); In is terminal passing current [A]; Vn is shunt voltage [V]; Rn is shunt resistor [Ω]. Vout represents the amplified segment voltage, gain is the amplification factor, and Vref represents the reference voltage.
In the experiment, we gradually apply different load currents. Simultaneously, the NI acquisition device synchronously collects the amplified voltage drops across the in-plane sampling resistors. The operating conditions associated with the experiment are presented in
Table 3.
To investigate the amplification effect of the distributed amplification sensor on the voltage drop of the shunt in-plane, it is necessary to ensure the stable operation of the fuel cell under the set conditions. Experimental studies have shown that the fuel cell needs to operate continuously for more than 10 minutes to reach a stable performance state. During the experiment, the fuel cell is operated successively under load currents of 10A, 20A, 30A, and 40A. Simultaneously, the NI acquisition device is used to record the corresponding amplified signals under each load condition in real-time.
4. Results and Discussion
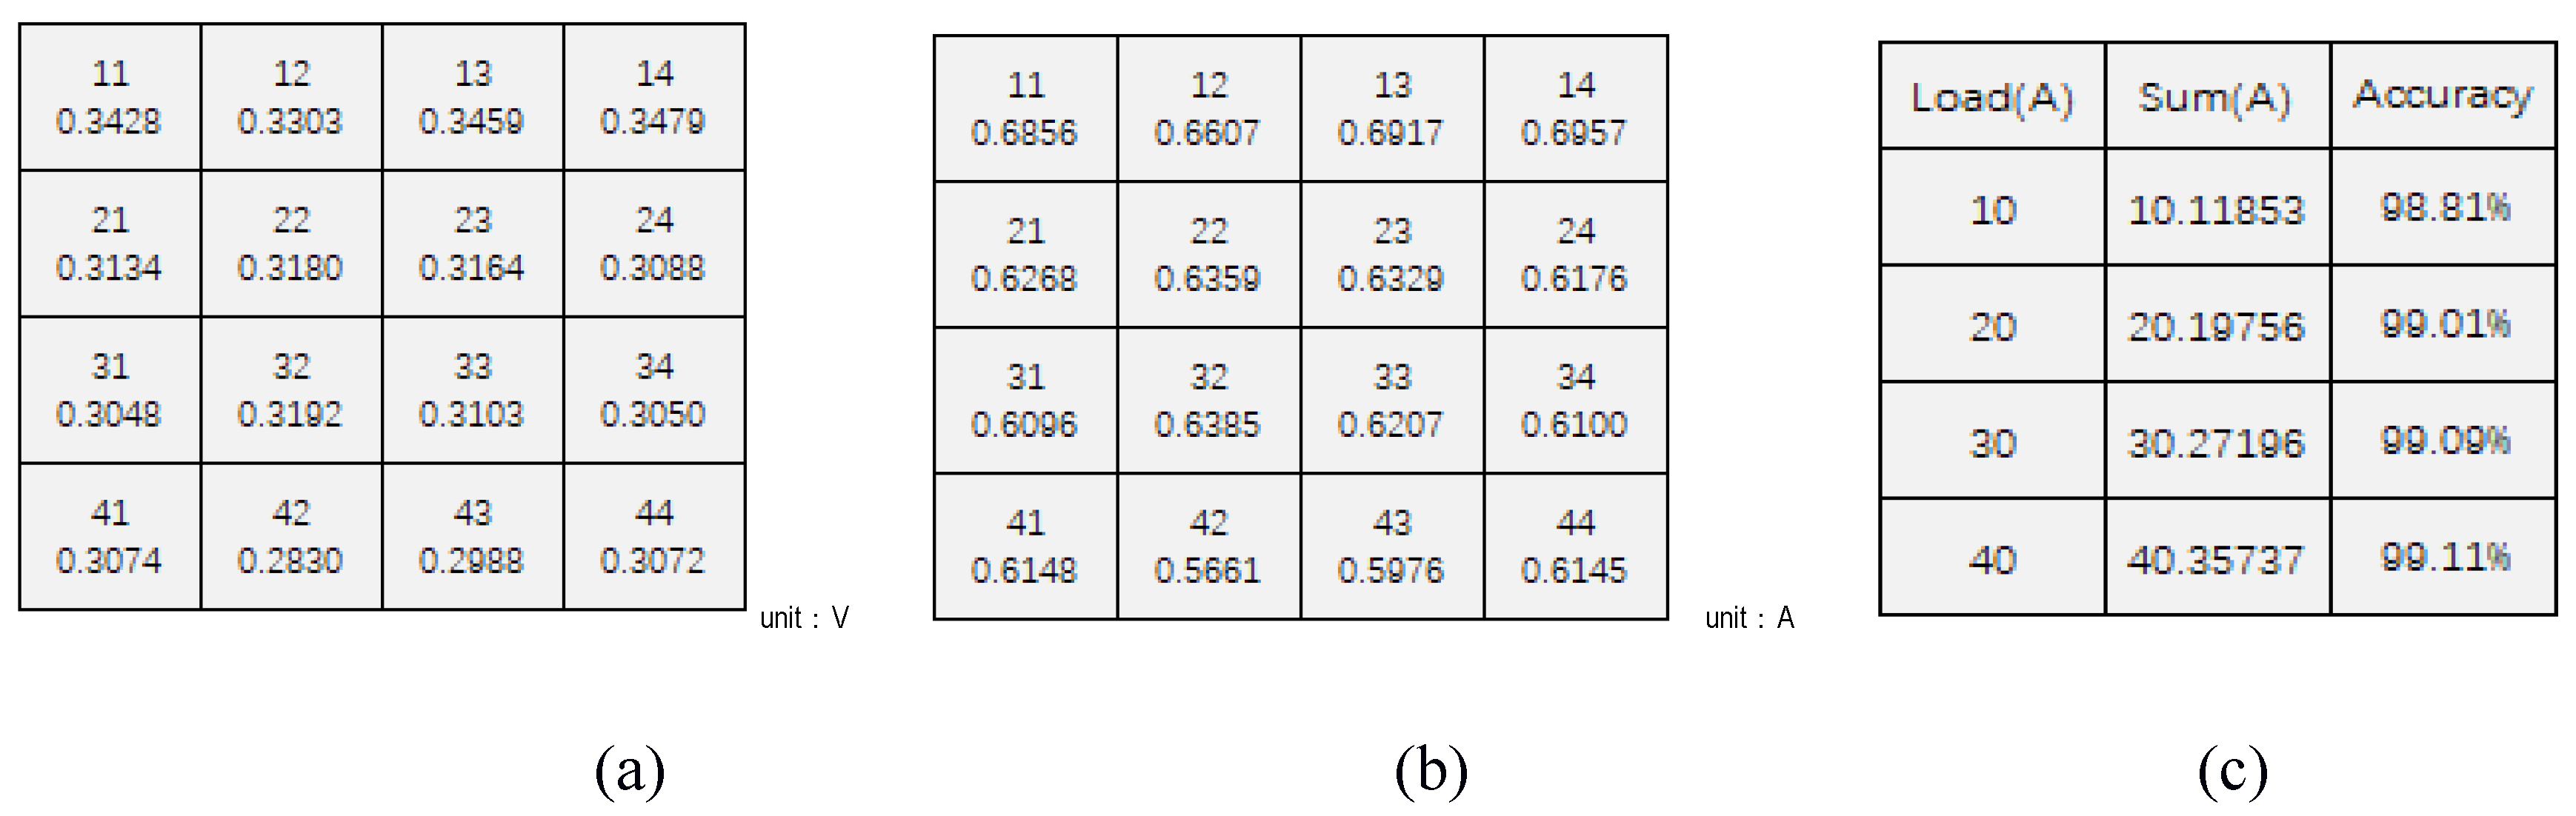
Figure 7(a) presents the measured values of the amplified segment voltage under a 10A load condition. By combining Formula (1) and Formula (2), the segment current is calculated, as shown in
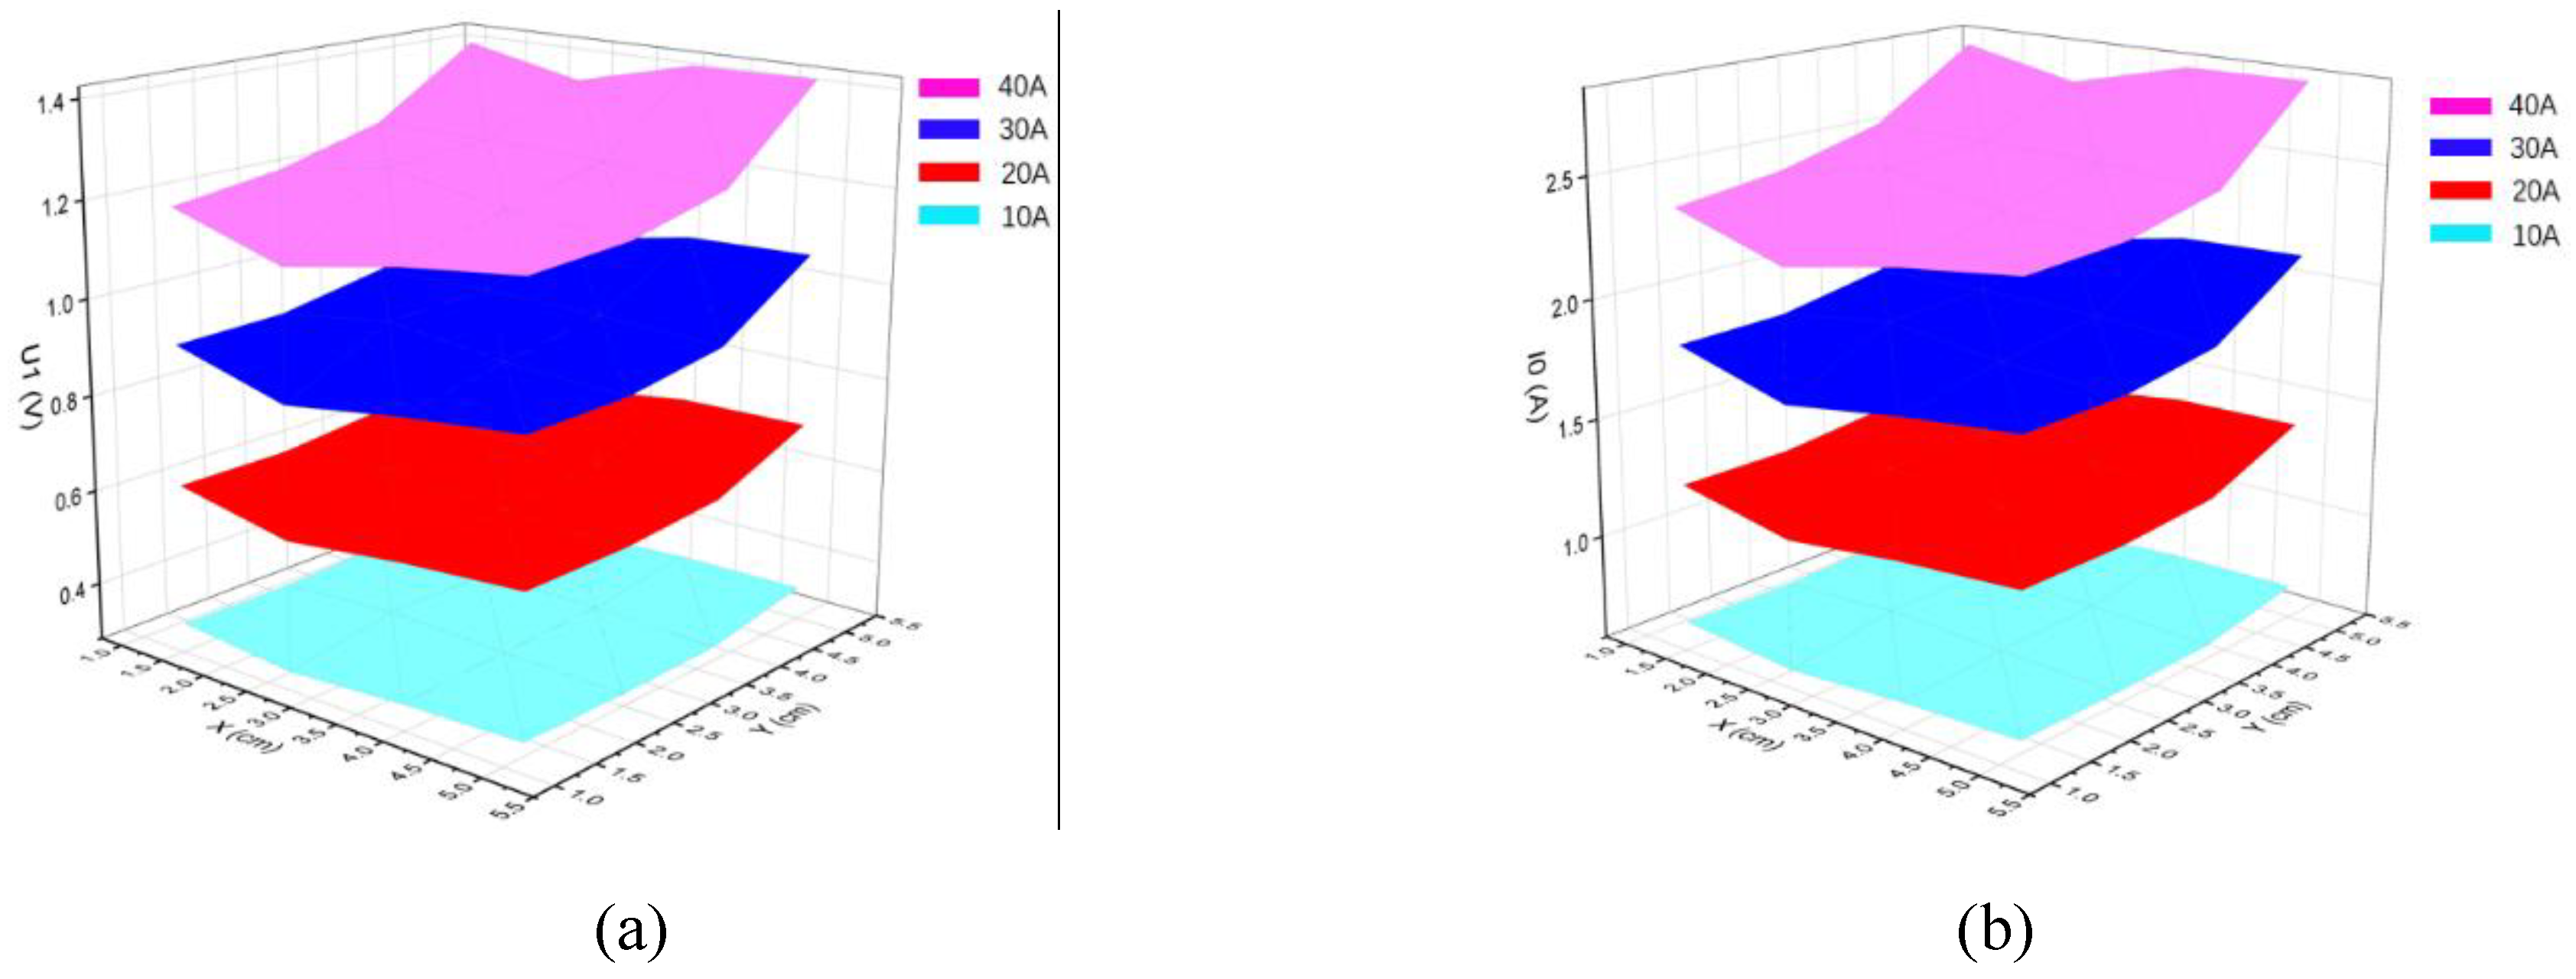
Figure 7(b). Their corresponding spatial distributions are shown in
Figure 8. Furthermore,
Figure 7(c) evaluates the current measurement accuracy under different loads. Through a comprehensive comparison and analysis of the load and corresponding measured values, the results reveal that the current measurement accuracy of the distributed signal amplification sensor system is not less than 98%. This result indicates that there is a high degree of consistency between the theoretical calculation and the experimental measurement, and the two are in excellent agreement.
5. Conclusions
This study fully takes into account that the measurement of in-plane current distribution is significantly limited by transmission losses and interference. These are mainly caused by weak voltage signals, which make accurate measurement very difficult. To effectively address this issue, this research focuses on the distributed voltage signal amplification measurement of PEMFCs. We use the PCB segmented measurement technology to successfully design and fabricate a single-cell distributed signal amplification sensor. Meanwhile, the structure of the current collector is specially designed to ensure the close installation of all components and avoid the influence of the sensor on the core reaction area, laying a solid foundation for the stable operation of the distributed measurement system. This distributed measurement system can effectively amplify and obtain the voltage drop across the sampling resistors in-plane of the fuel cell. Through the distributed amplifier and NI acquisition device, the voltage drop across the sampling resistors under various load conditions can be monitored online. On this basis, the actual measurement accuracy of the sensor is also evaluated, and experiments verify that its measurement accuracy is not less than 98%. In summary, this study has achieved a series of breakthrough results in the design, implementation, and performance optimization of distributed signal measurement technology for fuel cells. These results provide a promising solution for the distributed signal detection technology inside PEMFCs and are expected to promote the further development of this field.
Acknowledgments
This work was supported by National Key Research and Development Program of China (2024YFB4007301-1) and China Postdoctoral Science Foundation (BX20240265).
References
- Kui Jiao. Experimental and Modelling Studies of Cold Start Processes in Proton Exchange Membrane Fuel Cells[D]. Waterloo: The University of Waterloo, 2011.
- Shintaro Tanaka, et al. Fuel cell system for Honda CLARITY fuel cell[J]. eTransportation 3 (2020) 100046. [CrossRef]
- Guangsheng Zhang, et al. Comparison of current distributions in proton exchange membrane fuel cells with interdigitated and serpentine flow fields [J]. Journal of Power Sources 188 (2009) 213–219. [CrossRef]
- Ch. wieser, et al. A new technique for two-dimensional current distribution measurements in electrochemical cells [J]. Journal of Applied Electrochemistry 30: 803-807, 2000. [CrossRef]
- R. Kraume, German Patent No. DE 10,213,479 A 1 (2003) (in German). Available online: http://www.splusplus.com/measurement/en/cslin.html.
- JIAO K, et al. Simultaneous measurement of current and temperature distributions in a proton exchange membrane fuel cell during cold start processes [J]. Electrochimica Acta, 2011, 56(8): 2967-2982. [CrossRef]
- JINQIAO L, et al. Cold start mode classification based on the water state for proton exchange membrane fuel cells [J]. Journal of Materials Chemistry A, 2022: 10(38): 20254-20264. [CrossRef]
- R. Eckl, et al. Current distribution mapping in polymer electrolyte fuel cells—A finite element analysis of measurement uncertainty imposed by lateral currents [J]. Journal of Power Sources 154 (2006) 171–179. [CrossRef]
- R. Lin, et al. Rapid cold start of proton exchange membrane fuel cells by the printed circuit board technology[J].International Journal of Hydrogen Energy 39 (2014) 18369-18378. [CrossRef]
- Wenchao Tang, et al.The effects of operating temperature on current density distribution and impedance spectroscopy by segmented fuel cell [J]. International Journal of Hydrogen Energy 38 (2013) 10985 -10991. [CrossRef]
|
Disclaimer/Publisher’s Note: The statements, opinions and data contained in all publications are solely those of the individual author(s) and contributor(s) and not of MDPI and/or the editor(s). MDPI and/or the editor(s) disclaim responsibility for any injury to people or property resulting from any ideas, methods, instructions or products referred to in the content. |
© 2025 by the authors. Licensee MDPI, Basel, Switzerland. This article is an open access article distributed under the terms and conditions of the Creative Commons Attribution (CC BY) license (http://creativecommons.org/licenses/by/4.0/).