Submitted:
16 February 2025
Posted:
17 February 2025
You are already at the latest version
Abstract
Solid oxide fuel cells (SOFCs) have become promising devices for converting chemical energy into electrical energy. Altering the microstructure of cathode materials to enhance the activity and stability of the oxygen reduction reaction is particularly important. Herein, Pr0.5Ba0.5Co1-XNiXO3+δ with a tetragonal perovskite structure was synthesized through the sol–gel method. The polarization resistance of the symmetrical half-cell with Pr0.5Ba0.5Co0.9Ni0.1O3+δ as the cathode was 0.041 Ω·cm2 at 800 °C and 0.118 Ω·cm2 lower than that of the symmetrical cell with Pr0.5Ba0.5CoO3+δ as the cathode, indicating that the Pr0.5Ba0.5Co1-XNiXO3+δ cathode material has high catalytic activity during the electrochemical reaction. The results of electron paramagnetic resonance revealed that the concentration of oxygen vacancies increased as the Ni doping amount increased to 0.15. As a result of the increase in the Ni doping amount, the thermal expansion coefficient of the Pr0.5Ba0.5CoO3+δ cathode material effectively reduced, resulting in improved matching between the cathode and electrolyte material. The power density of the single cell increased by 69 mW/cm2. Therefore, Pr0.5Ba0.5Co1-XNiXO3+δ is a promising candidate cathode material for high-performance SOFCs.
Keywords:
Solid oxide fuel cell
; Ni doping
; Cathode material
; Electrochemistry
1. Introduction
Solid oxide fuel cells (SOFCs) can directly convert chemical energy into electrical energy and are promising energy conversion devices [1]. A SOFC single cell consists of an electrolyte, a cathode, and an anode. Among various factors, the polarization resistance of the cathode, which is the energy required to overcome the oxygen reduction reaction (ORR), has the greatest effect on reaction activity. Therefore, reducing cathode polarization resistance and improving cathode performance are effective ways to increase the power generation efficiency of SOFCs [2]. Exploring new cathode materials with high catalytic activity will become a research hotspot in the field of SOFCs.
Given their excellent electrochemical properties and mixed ion–electron conductivity, perovskite oxides are attracting considerable attention as a new type of mixed ion–electron conductor (MIEC) [3]. Extending the ORR region to the entire electrode surface beyond the electrolyte–electrode–gas three-phase boundary is beneficial to improve electrode performance and has high research value in the field of SOFC cathode materials. Woo et al. [4] found that the conductivity of SOFC cathode materials with Pr and La at the A site is higher than that of compounds with Sm and Gd, and the conductivity of Co-based compound at the B site is considerably higher than that of Fe-based materials [5,6]. Jiang et al. [7] showed that the electrical conductivity of Pr1+xBa1-xCo2O5+δ as a SOFC cathode material is generally above 550 S/cm. Co-based materials have become a hot topic in the research on SOFC cathode materials due to their excellent electrical conductivity and power density [8,9]. However, given their high thermal expansion coefficient, they have poor thermal matching with electrolyte materials [10]. Doping Ta [11], Ni [12], Nb [13], and Cu [14] at the B site of Co-based materials can promote the ORR at the electrode and improve electrochemical performance and catalytic activity. Ni doping at the B site can reduce proton migration capacity, increase oxygen vacancy concentration, and improve proton absorption and ORR catalytic activity [15]. Zhu et al. [12] demonstrated that the Pr0.7Ba0.3Co0.6Fe0.2Ni0.2O3+δ material has good ORR activity in dry and wet air.
In this study, PrBaCo1-XNiXO3+δ (PBCNix, X = 0, 0.05, 0.1, 0.15) cathode materials were prepared through the sol–gel method with Ni as the doping element. The synthesized perovskite PBCNiX cathode material was characterized by using X-ray diffraction (XRD), X-ray photoelectron spectroscopy (XPS), scanning electron microscopy (SEM), transmission electron microscopy (TEM) and energy disperse spectroscopy (EDS). The effects of Ni content on the microstructure and electrochemical properties of the PBC cathode materials were investigated.
2. Preparation and Characterization
2.1. Experimental Preparation
PrBaCo1-XNiXO3+δ (X = 0, 0.05, 0.1, 0.15) was prepared by using the sol–gel method with the reagents Pr(NO3)3·6H2O (AR, Aladdin), Ba(NO3)2 (AR, Aladdin), Co(NO3)2·6H2O (AR, Aladdin), Ni(NO3)2·6H2O (AR, Aladdin), C6H8O7·H2O (AR, Aladdin), and C10H16N2O8 (AR, Aladdin). The raw materials were dissolved in deionized water in accordance with the metal ion:C6H8O7·H2O (CA):C10H16N2O8 (EDTA) ratio of 1:1:1.5. The mixed solution was added with ammonia water, and its pH was adjusted to 7–8. It was then placed in a water bath at a constant temperature of 80 °C and stirred until it formed a transparent purplish-red colloid. Subsequently, it was heated in a resistance furnace until the self-propagating reaction occurred. The prepared precursor was calcined at 1200 °C in a muffle furnace for 5 h at a heating rate of 3 °C /min to obtain the cathode powder PBCNiX. Each cathode powder was named as PBCNiX (X= 0, 0.05, 0.1, 0.15) in accordance with different Ni doping amounts.
The electrolyte material SDC powder was sourced from Aladdin. The SDC electrolyte powder was pressed into a sheet with a diameter of 15 mm at 300 MPa. An SDC electrolyte sheet with a diameter of 15 mm and thickness of 0.6 mm was obtained after heating it at 1450 °C in a muffle furnace for 5 h.
The cathode material powder, terpinol, and ethyl cellulose were weighed in accordance with the mass ratio of 100:94:6 then mixed and ground into a paste. The prepared cathode paste was uniformly coated on both sides of the electrolyte sheet through screen printing to form two symmetric cathodes. The resulting symmetric cell was then sintered in a high-temperature furnace to obtain the symmetric cell required for the electrochemical impedance (EIS) test. The NiO–SDC composite anode was employed as the anode material of the cell (40% SDC electrolyte powder was added to the NiO powder). The NiO–SDC mixed powder and soluble starch (pore-creating agent) were placed in a ball mill tank in accordance with the mass ratio of 4:1, and an appropriate amount of alcohol was added for ball milling. A mixed slurry was obtained after 15 h of mixing. The required NiO–SDC composite anode powder was obtained after drying it.
2.2. Characterization
An X-ray diffractometer (Malvern Panalytical, Empyrean) was used to analyze the crystal structure and phase composition of the synthesized samples. XPS (Thermofisher Scienticfic, ThermoESCALAB250XI) was employed to analyze the valence state of each element in the materials. A high-resolution transmission electron microscope (HR-TEM, FEI, TecnaiF20) was utilized to analyze the diffraction fringe width of the materials. An energy dispersive spectrometer (FEI, TecnaiF20) was employed to detect the distribution of each element. The cross-section morphology of the symmetric cells was investigated with a scanning electron microscope (TESCAN, CAIA3). The TEC of the cathode materials was tested with a thermal dilatometer (TEC, NETZSCH, DIL402C). The test atmosphere was high-purity air. The temperature range was 30 °C–750 °C, and the heating rate was 5 °C/min.
2.3. Electrochemical Test
A PGSTAT302N-type electrochemical workstation was used to test conductivity. The two voltage ends in the middle of the strip sample were connected to the induction and reference electrodes of the workstation, and the two outer current sections were connected to the working and auxiliary electrodes of the workstation. The sample was placed in a tube furnace equipped with the electrochemical workstation to test the conductivity of the strip samples. The test temperature range was 400 °C–800 °C with an interval of 50 °C. The conductivity of the samples at different temperatures was measured. The symmetrical cell was prepared for EIS. The test temperature range was 600 °C–800 °C with an interval of 50 °C in an air atmosphere. The test frequency range was 100 kHz–0.1 Hz, and the amplitude was 10 mV. The test was conducted in RMS mode. The output power of a single cell was tested by using SDC as an electrolyte and NIO–SDC as an anode. The anode side was fed with wet hydrogen (H2 + 3% H2O) as a fuel gas at a rate of 30 mL/min, and the cathode side was directly in contact with air. The output power density of the single cell was tested with a range of 600 °C–800 °C and an interval of 50 °C.
3. Results and Discussion
The XRD pattern of PBCNiX (X = 0, 0.05, 0.1, 0.15) is provided in Figure 1(a). The diffraction peaks are narrow and sharp, and the main diffraction peak position of the Ni-doped sample is consistent with the structure of Pr0.5Ba0.5CoO3+δ (PBC, PDF#53-0131), showing a typical quartet-phase perovskite structure [16]. These results demonstrate that perovskite PBCNiX materials have been prepared successfully and no secondary phase has formed. Figure 1(b) presents an enlarged cross-section of 2θ = 32°–33.5°. The characteristic peaks of the PBCNiX materials have shifted to a low angle with the doping of Ni. Given that the radius of the Ni2+ ion is greater than that of the Co3+ ion, the XRD diffraction peak caused by lattice expansion shifts to a low angle, and the deviation of the diffraction peak gradually increases with the increase in doping amount. The Rietveld method was used to refine the XRD pattern of PBC to study the effect of Ni ion doping on the crystal structure of PBC further. Figure S1 shows the Rietveld-refined pattern of PBCNiX, which is consistent with the XRD patterns. Table S1 shows that materials with high Ni doping amounts have large cell volumes, indicating that Ni ions have successfully entered the lattice of the PBC cathode materials. The results show that the prepared PBCNiX has the same spatial structure as the undoped PBC, indicating that Ni doping does not change the original crystal structure and has a simple tetragonal structure (P4/mmm).
Figure 2 shows the SEM images of the symmetrical cells of PBC and the PBCNiX cathode materials after calcination at 1100 °C and subsequent electrochemical performance tests. The results indicate that Ni doping has no discernible effect on the structure of PBC. The prepared cathode materials are loose and porous and therefore have relatively high porosity. The formation of a porous structure in the cathode is conducive to providing additional active sites for ORR and offering supplemental gas diffusion channels, which are beneficial for gas exchange and diffusion. The adhesion between the cathode material and SDC electrolyte is good, and no delamination or fracture is observed, indicating that the cathode and SDC electrolyte have good thermal compatibility.
Figure 3(b–f) show the element distribution maps of PBC and PBCNi0.1, as well as the corresponding energy dispersion spectra, to illustrate the distribution of elements in the cathode materials doped with Ni ions. The results show that all elements in the synthesized materials are uniformly distributed, no element agglomeration has occurred, and the peaks of all elements are detectable. These findings further prove that Ni ions are effectively doped into the PBC materials.
Figure 4 shows the HR-TEM and locally amplified images. Figure 4(a) depicts that the diffraction fringe width of the substrate material (PBC) is 3.860 Å. Figure 4(b) illustrates that the diffraction fringe width of the cathode material with doping amount X = 0.1 is 3.866 Å. The TEM result is consistent with the refined XRD data. The synthesized PBCNi0.1 material is further shown to be centrosymmetric and has a simple tetragonal structure (P4/mmm).
XPS was used for characterization to determine the surface composition of the PBCNiX materials. The XPS spectral data of the O1s and Co2p orbitals in the PBCNiX samples were fitted, and the corresponding spectra are provided in Figure 5. Figure 5(a) shows that the O element exists in three forms: lattice oxygen (Olattice, 528.54 eV), oxygen vacancy (Ovacancy, 529.07 eV), and adsorbed oxygen (Oadsorbed, 531.34 eV). As shown in Table S2, the concentration of Ovacancy in the Ni-doped samples is higher than that in PBC, indicating that Ni doping can increase the concentration of oxygen vacancies on the material surface. The PBCNiX cathode materials were tested through electron paramagnetic resonance, as illustrated in Figure S2. The oxygen vacancy signal increases with Ni doping, indicating that Ni doping can increase the concentration of oxygen vacancies in the material and enhance the catalytic activity of oxygen [17]. As shown in Figure 5(b), low-valent Ni ions are doped into the PBC materials to replace Co. Co is induced to change from low valence to high valence, generating additional Co3+, as shown in Table S3, to maintain charge balance. Given that the ionic radius of Ni2+ ions is larger than that of Co3+ ions, additional oxygen vacancies are produced. This result is consistent with the findings of the previous analysis of the O1s orbital. In summary, Ni-doped samples can increase the oxygen vacancy content of the materials and are expected to become cathode materials with excellent electrical performance.
Figure 6 shows that the average TEC values of the PBCNiX (X = 0, 0.05, 0.1, 0.15) series cathode materials within the temperature range of 30 °C–800 °C are 22.0474 × 10⁻⁶ K−1 (X = 0), 19.598 × 10⁻⁶ K−1 (X = 0.05), 19.4837 × 10⁻⁶ K−1 (X = 0.1), and 18.0548 × 10⁻⁶ K−1 (X = 0.15). The TEC of SDC is 12.14 × 10⁻⁶ K−1 [18]. The doping of Ni reduces the average TEC of the PBC materials, making it close to that of SDC, indicating good thermal matching between the PBCNiX cathode materials and SDC electrolyte. It thus minimizes the risk of fracture caused by TEC mismatch between the electrolyte and cathode material and confers the cell with good stability and a long service life.
Figure 7(a) shows the relationship between temperature and the electrical conductivity (σ) of the PBCNiX materials in an air atmosphere within the temperature range of 400 °C–800 °C. As the temperature increases, the conductivity of the sample decreases. The conductivity of the PBC and PBCNiX series cathode materials decreases in the range of 400 °C–800 °C. At the same temperature, the electrical conductivity of the PBCNiX series materials is lower than that of PBC because electron transfer between Co2+ and Co3+ enhances electronic conductivity. With the increase in Ni doping content, the concentration of high-valent Co ions in the PBCNiX cathode materials decreases, whereas that of oxygen vacancies increases, resulting in a decrease in the electrical conductivity of the materials. Figure 7(b) presents the Arrhenius plot of the electrical conductivity of the PBCNiX cathode materials versus temperature within the temperature range of 400 °C–800 °C. The activation energy Ea of the PBCNiX cathode materials with different Ni ion doping amounts was calculated by using the Arrhenius formula, as shown in Figure 7(b) [19].
Where k is the reaction rate constant at temperature T, which is 8.617 × 10⁻⁵; σ is the electrical conductivity; A is the pre-exponential factor; and Ea is the conductivity activation energy. Consistent with the trend of the change in electrical conductivity, the conductivity activation energy of the PBCNiX cathode materials continues to increase with the increase in the doping amount of Ni ions. Although electrical conductivity decreases due to the doping of Ni, it can still reach 900 S/cm at 400 °C, meeting the requirements for the electrical conductivity of cathode material samples [20].
The electrochemical characteristics of the PBCNiX cathodes with a symmetrical cell structure and SDC electrolyte were investigated through AC impedance spectroscopy. Figure 8(a) shows that the polarization resistance (Rp) of PBC at 800 °C is approximately 0.159 Ω·cm², whereas the corresponding resistances of the PBCNiX materials with X = 0.05, 0.10, 0.15 are only approximately 0.146, 0.041, and 0.103 Ω·cm², respectively. Ni ion doping remarkably reduces the polarization resistance at the cathode interface. As the Ni doping amount increases to 0.1, Rp gradually decreases. Figure 8(b) provides the impedance spectra of the PBCNiX series cathodes at 600 °C–800 °C. After Ni is doped at the B site of PBCNiX, Rp initially decreases then increases. As illustrated in Figure 8(c), when the Ni doping amount is 0.1, impedance continuously increases with the decrease in working temperature, reaching a minimum value of 0.041 Ω·cm² at 800 °C. This finding indicates that Ni doping has a substantial effect on the electrochemical performance of the PBC cathode materials. The overall performance of SOFC cathodes has been found to depend mainly on O ion transport performance and the catalytic performance of ORR [21]. Excessive Co content can lead to a decrease in the oxygen vacancy coefficient δ. By doping Ni to improve the stoichiometry of Co in the cathode material, the oxygen vacancy coefficient can be increased and electrochemical impedance can be reduced. The performance of the PBC and PBCNiX cathode materials depends not only on cathode conductivity, it also depends on the catalytic activity of the cathode surface and gas transport rate through the porous cathode. Brunauer–Emmett–Teller (BET) pore size distribution tests were conducted to explore the catalytic activity of the cathode surface and gas transport rate through the porous cathode, and the results are provided in Figure 8(d). With the doping of Ni ions, the specific surface area of the cathode materials gradually increases. This effect would enhance the exchange of the cathode with air oxygen, increase reaction activity, and reduce impedance. When the Ni doping amount is greater than 0.1, the polarization impedance shows an increasing trend again because with the continuous increase in doping amount, the excessively high oxygen vacancy concentration would cause the association of defects in the cathode material and lead to the localization of oxygen vacancies [22], thereby reducing the O ion transport rate and increasing Rp. As shown in Table 1, the polarization impedance of PBCNi0.1 is already lower than that of most Co-based materials. In summary, the PBCNi0.1 material can be considered as a potential and promising cathode material with prospects for SOFCs.
The electrolyte-supported single cell has excellent performance in terms of heat resistance and mechanical strength because of its relatively hard electrolyte layer. It was chosen to construct and evaluate the output performance of PBCNX as the cathode of SOFCs because of its simple preparation and flexible selection of electrode materials. Figure 9(a) and (b) show the power densities of PBC and PBCN0.1 at 650 °C–800 °C in a hydrogen atmosphere. The results indicate that power density increases with the rise in temperature. At 650 °C, the open-circuit voltages (OCVs) are 0.99 and 1.0 V, which are lower than the theoretical voltage of 1.1 V [27]. These low OCVs are attributed to the partial reduction of Ce4+ in the SDC electrolyte into Ce3+ under the reducing atmosphere. This phenomenon leads to electronic conductivity and internal short circuits [28]. At 800 °C, the power density of the single cell prepared with PBC is 161.1 mW/cm2 and that of the single cell prepared with PBCNi0.1 has increased by 69.5 mW/cm2 to 230.6 mW/cm2. This result indicates that Ni doping enhances the output power density of the PBC cell and improves its catalytic activity.
4. Conclusions
In PBCNiX materials, oxygen vacancy concentration and ORR activity increase with the increase in Ni substitution. TEC decreases with the increase in Ni. When the doped amount of Ni is 0.15, the TEC is 18.0548 × 10⁻⁶ K−1, which is a low value for Co-based cathode materials. Although Ni doping can effectively reduce the polarization resistance of Pr0.5Ba0.5Co1−XNiXO3+δ cathode materials, excessive doping has adverse effects, and the doping amount of 0.1 has the best effect among all tested doping amounts. At 800 °C, the polarization resistance of the Pr0.5Ba0.5Co0.9Ni0.1O3+δ cathode material is 0.041 Ω·cm2. The output power density of Pr0.5Ba0.5Co0.9Ni0.1O3+δ increases by 69.5 mW/cm2 at 800 °C. Therefore, the doping of the Ni element can effectively improve the oxygen vacancy concentration of the material. Subsequently, it can improve the electrochemical performance of the cathode material PBC, which is expected to become a candidate cathode material with prospects for development.
Supplementary Materials
The following supporting information can be downloaded at the website of this paper posted on Preprints.org.
Acknowledgments
The work was supported by Inner Mongolia Autonomous Region universities basic scientific research project (2023CXPT002), Baotou Science and Technology Bureau project (YF2022014), Open Research Project for Innovation Center of New Rare Earth Materials Technology (CXZX-D-202409-0020) and Integrated Research Platform of Novel and Important Energy Comprehensive Utilization Technology in Inner MongoliaAutonomous Region.
References
- Y. Teng, J. Li, P. Wang, Y. Yang, Y. Zhai, F. Jin, Journal of the Chinese Ceramic Society, 51 (2023) 1007-1014.
- P. Jin-hua, S.U.N. Ke-ning, L. Shi-jun, Chinese Journal of Power Sources, 33 (2009) 725-729.
- Y. Dong, Z. Li, A. Wang, S. Hua, Chinese Journal of Engineering, 44 (2022) 1014-1019.
- S.H. Woo, S. Baek, Y. Kim, Materials Letters, 370 (2024) 136868.
- Y. Zhang, D. Zhou, X. Zhu, N. Wang, J. Bai, L. Hu, H. Gong, B. Zhao, W. Yan, International Journal of Hydrogen Energy, 50 (2024) 992-1003.
- C. Zhu, C. Yi, L. Chao, Journal of Rare Earths, 29 (2011) 1070-1074.
- L. Jiang, F. Li, T. Wei, R. Zeng, Y. Huang, Electrochim. Acta, 133 (2014) 364-372.
- W. Zhang, Y. Gao, J. Zhang, A. Zhao, F. Liu, K. Zheng, F. Jin, Y. Ling, Journal of Power Sources, 602 (2024) 234344.
- L. Zhao, B. He, B. Lin, H. Ding, S. Wang, Y. Ling, R. Peng, G. Meng, X. Liu, Journal of Power Sources, 194 (2009) 835-837.
- Y. Liu, F. Han, H. Xia, Z. Zhang, Q. Zhou, B. Xu, H. Shi, Ceramics International, 50 (2024) 52904-52916.
- D. Wang, Y. Xia, H. Lv, L. Miao, L. Bi, W. Liu, International Journal of Hydrogen Energy, 45 (2020) 31017-31026.
- W. Zhu, H. Wang, L. Xu, J. Yuan, J. Gong, X. Liu, International Journal of Hydrogen Energy, 48 (2023) 33633-33643.
- M. Saccoccio, C. Jiang, Y. Gao, D. Chen, F. Ciucci, International Journal of Hydrogen Energy, 42 (2017) 19204-19215.
- F. Zhang, S. Li, S. An, X. Cheng, Modern Chemical Industry, 41 (2021) 99-102.
- X. Che, Y. Shen, H. Li, T. He, Journal of Power Sources, 222 (2013) 288-293.
- D. Garcés, A.G. Leyva, L.V. Mogni, Solid State Ionics, 347 (2020).
- Z. Zhang, C. Yao, H. Zhang, W. Zhang, H. Wang, Y. Liu, H. Bian, X. Lang, K. Cai, Journal of Colloid and Interface Science, 680 (2025) 365-374.
- S. Yin, M. Li, Y. Zeng, C. Li, X. Chen, Z. Ye, Journal of Rare Earths, 32 (2014) 767-771.
- S. Presto, P. Kumar, S. Varma, M. Viviani, P. Singh, International Journal of Hydrogen Energy, 43 (2018) 4528-4533.
- J. Zhao, C. Li, L. Kong, X. Wu, Y. Ma, Journal of Rare Earths, 29 (2011) 1066-1069.
- Y.N. Kim, J.H. Kim, A. Manthiram, Journal of Power Sources, 195 (2010) 6411-6419.
- .
- F. Jin, H. Xu, W. Long, Y. Shen, T. He, Journal of Power Sources, 243 (2013) 10-18.
- W. Xia, X. Liu, F. Jin, X. Jia, Y. Shen, J. Li, Electrochim. Acta, 364 (2020).
- C. Yao, H. Zhang, X. Liu, J. Meng, X. Zhang, F. Meng, J. Meng, Journal of Solid State Chemistry, 265 (2018) 72-78.
- X. Liu, F. Jin, N. Sun, J. Li, Y. Shen, F. Wang, J. Li, Ceramics International, 47 (2021) 33886-33896.
- Z. Han, J. Bai, X. Chen, X. Zhu, D. Zhou, International Journal of Hydrogen Energy, 46 (2021) 11894-11907.
- Q. Zhou, L. Xu, Y. Guo, D. Jia, Y. Li, W.C.J. Wei, International Journal of Hydrogen Energy, 37 (2012) 11963-11968.
Figure 1.
(a) XRD patterns of cathode materials PBCNiX (b) local magnification image.
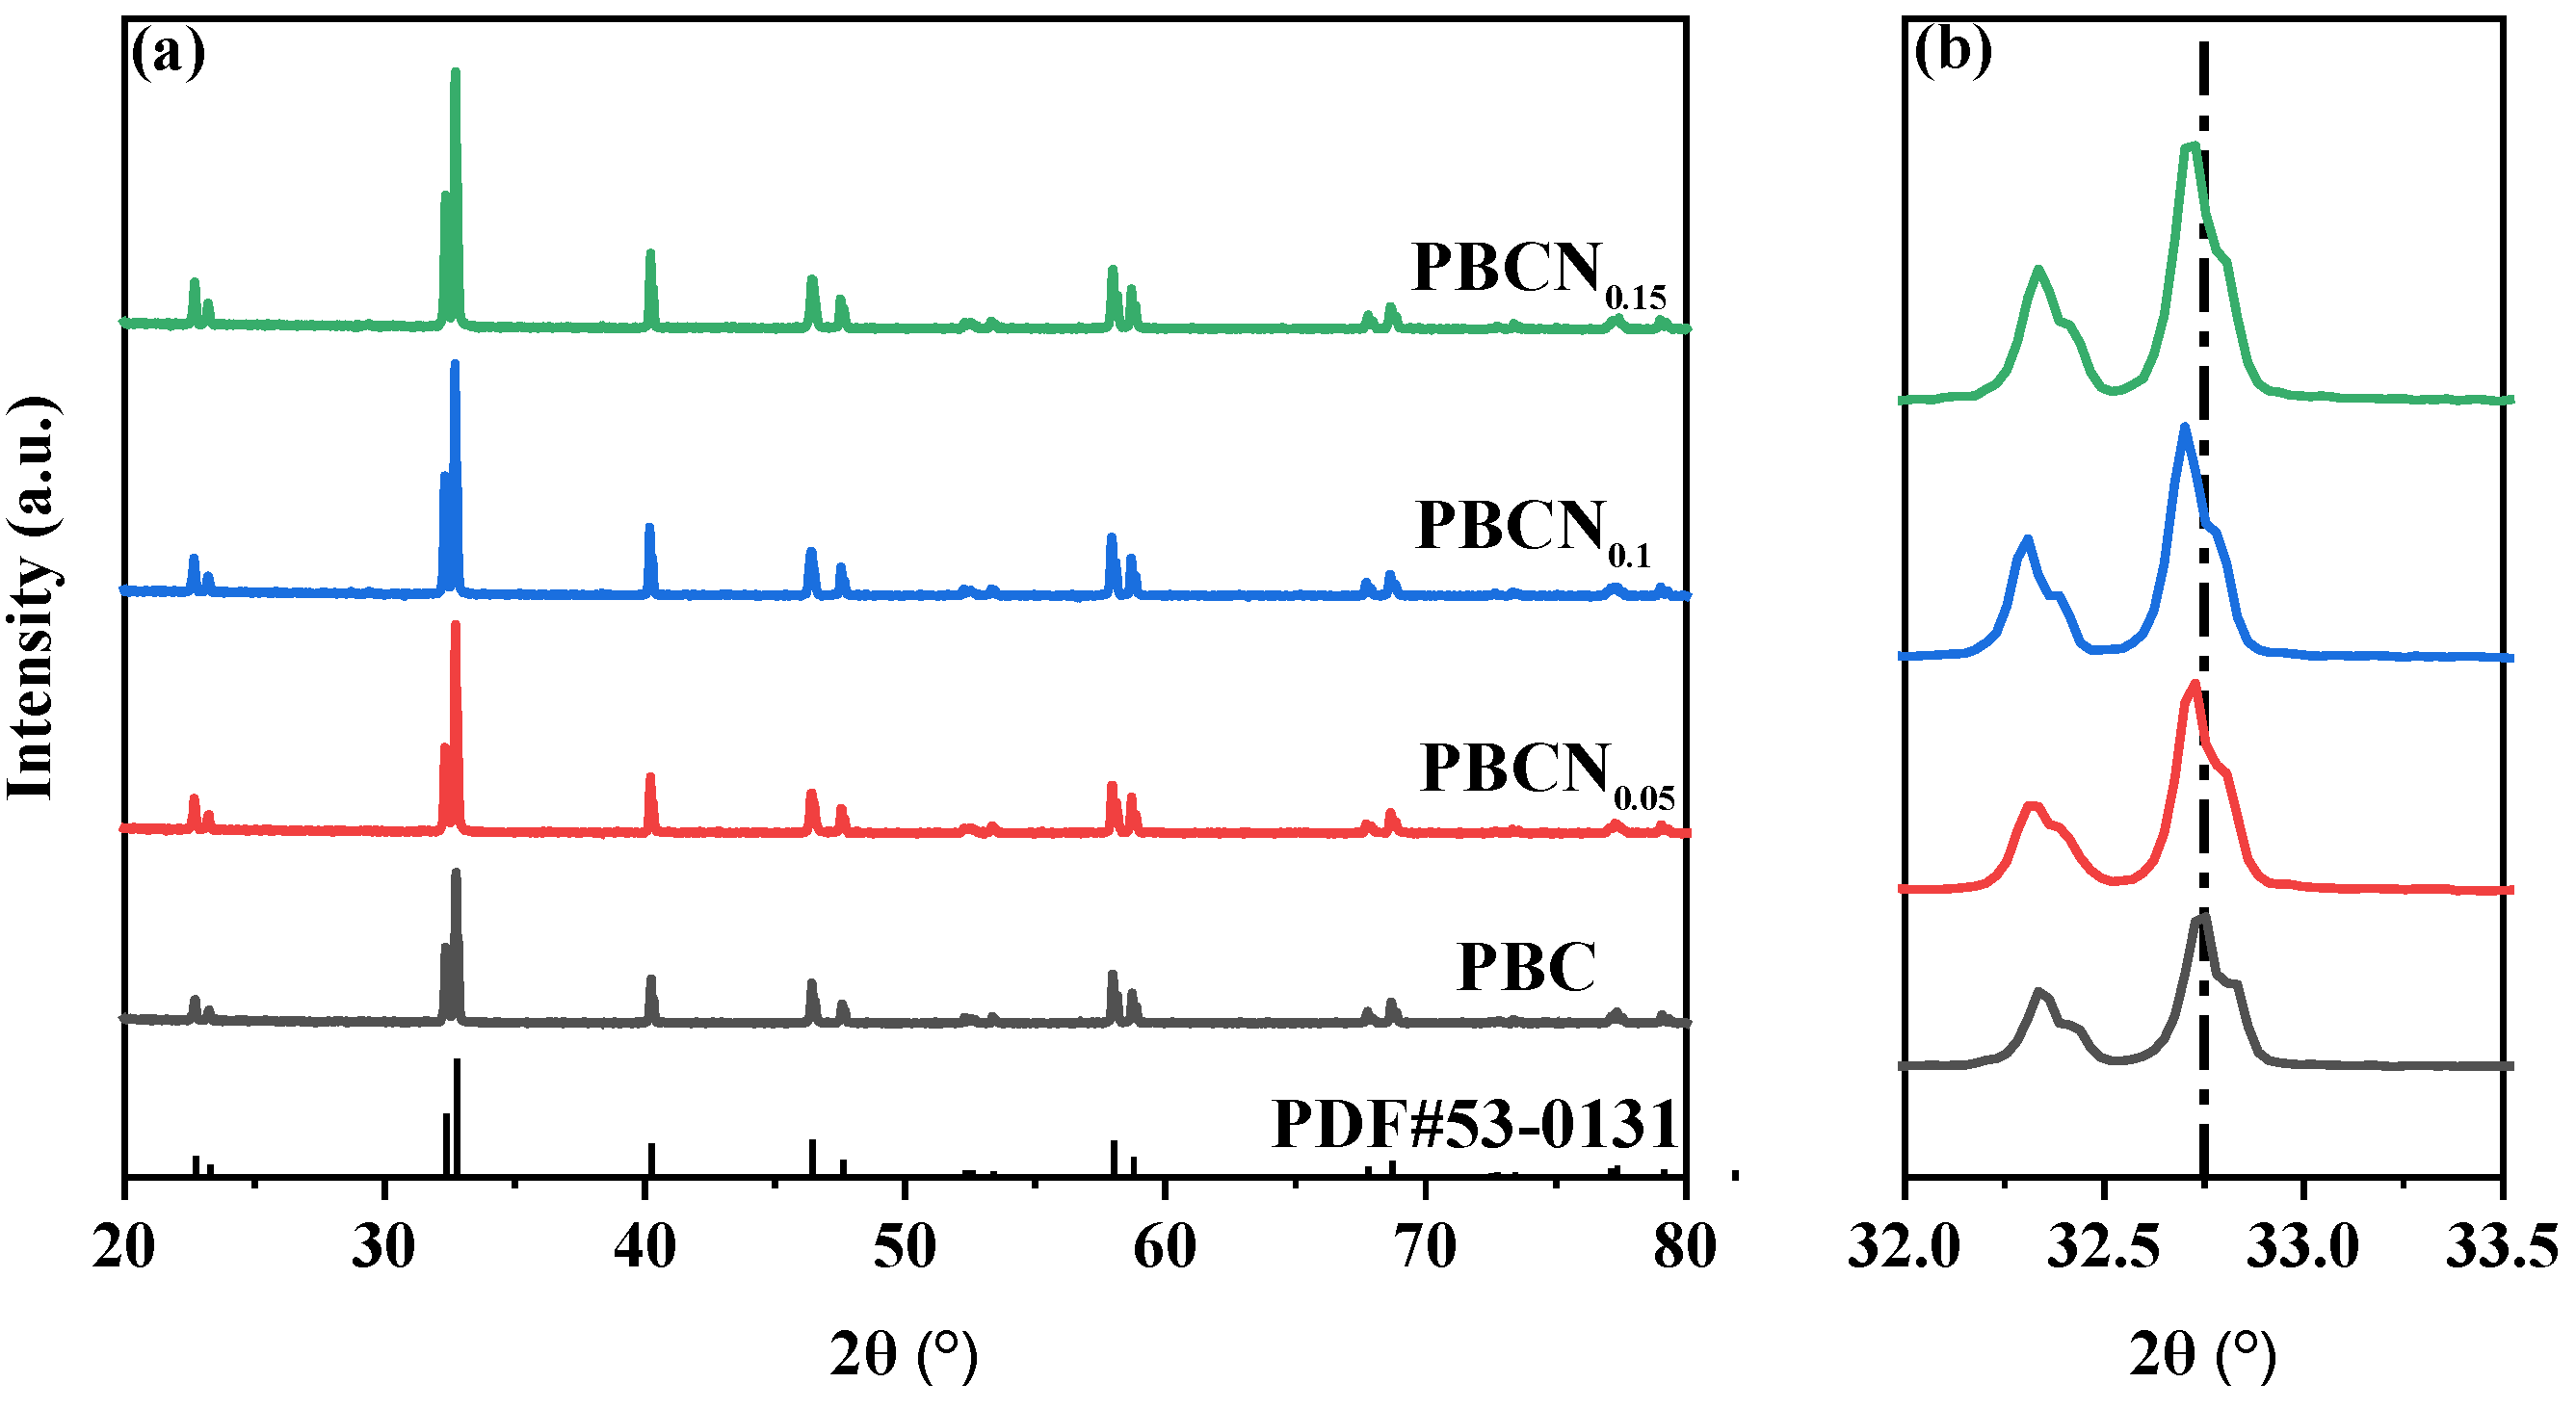
Figure 2.
SEM images of symmetric cell with cathode material PBCNiX (a)PBC; (b)PBCNi0.05; (c)PBCNi0.1; (d)PBCNi0.15.
Figure 2.
SEM images of symmetric cell with cathode material PBCNiX (a)PBC; (b)PBCNi0.05; (c)PBCNi0.1; (d)PBCNi0.15.
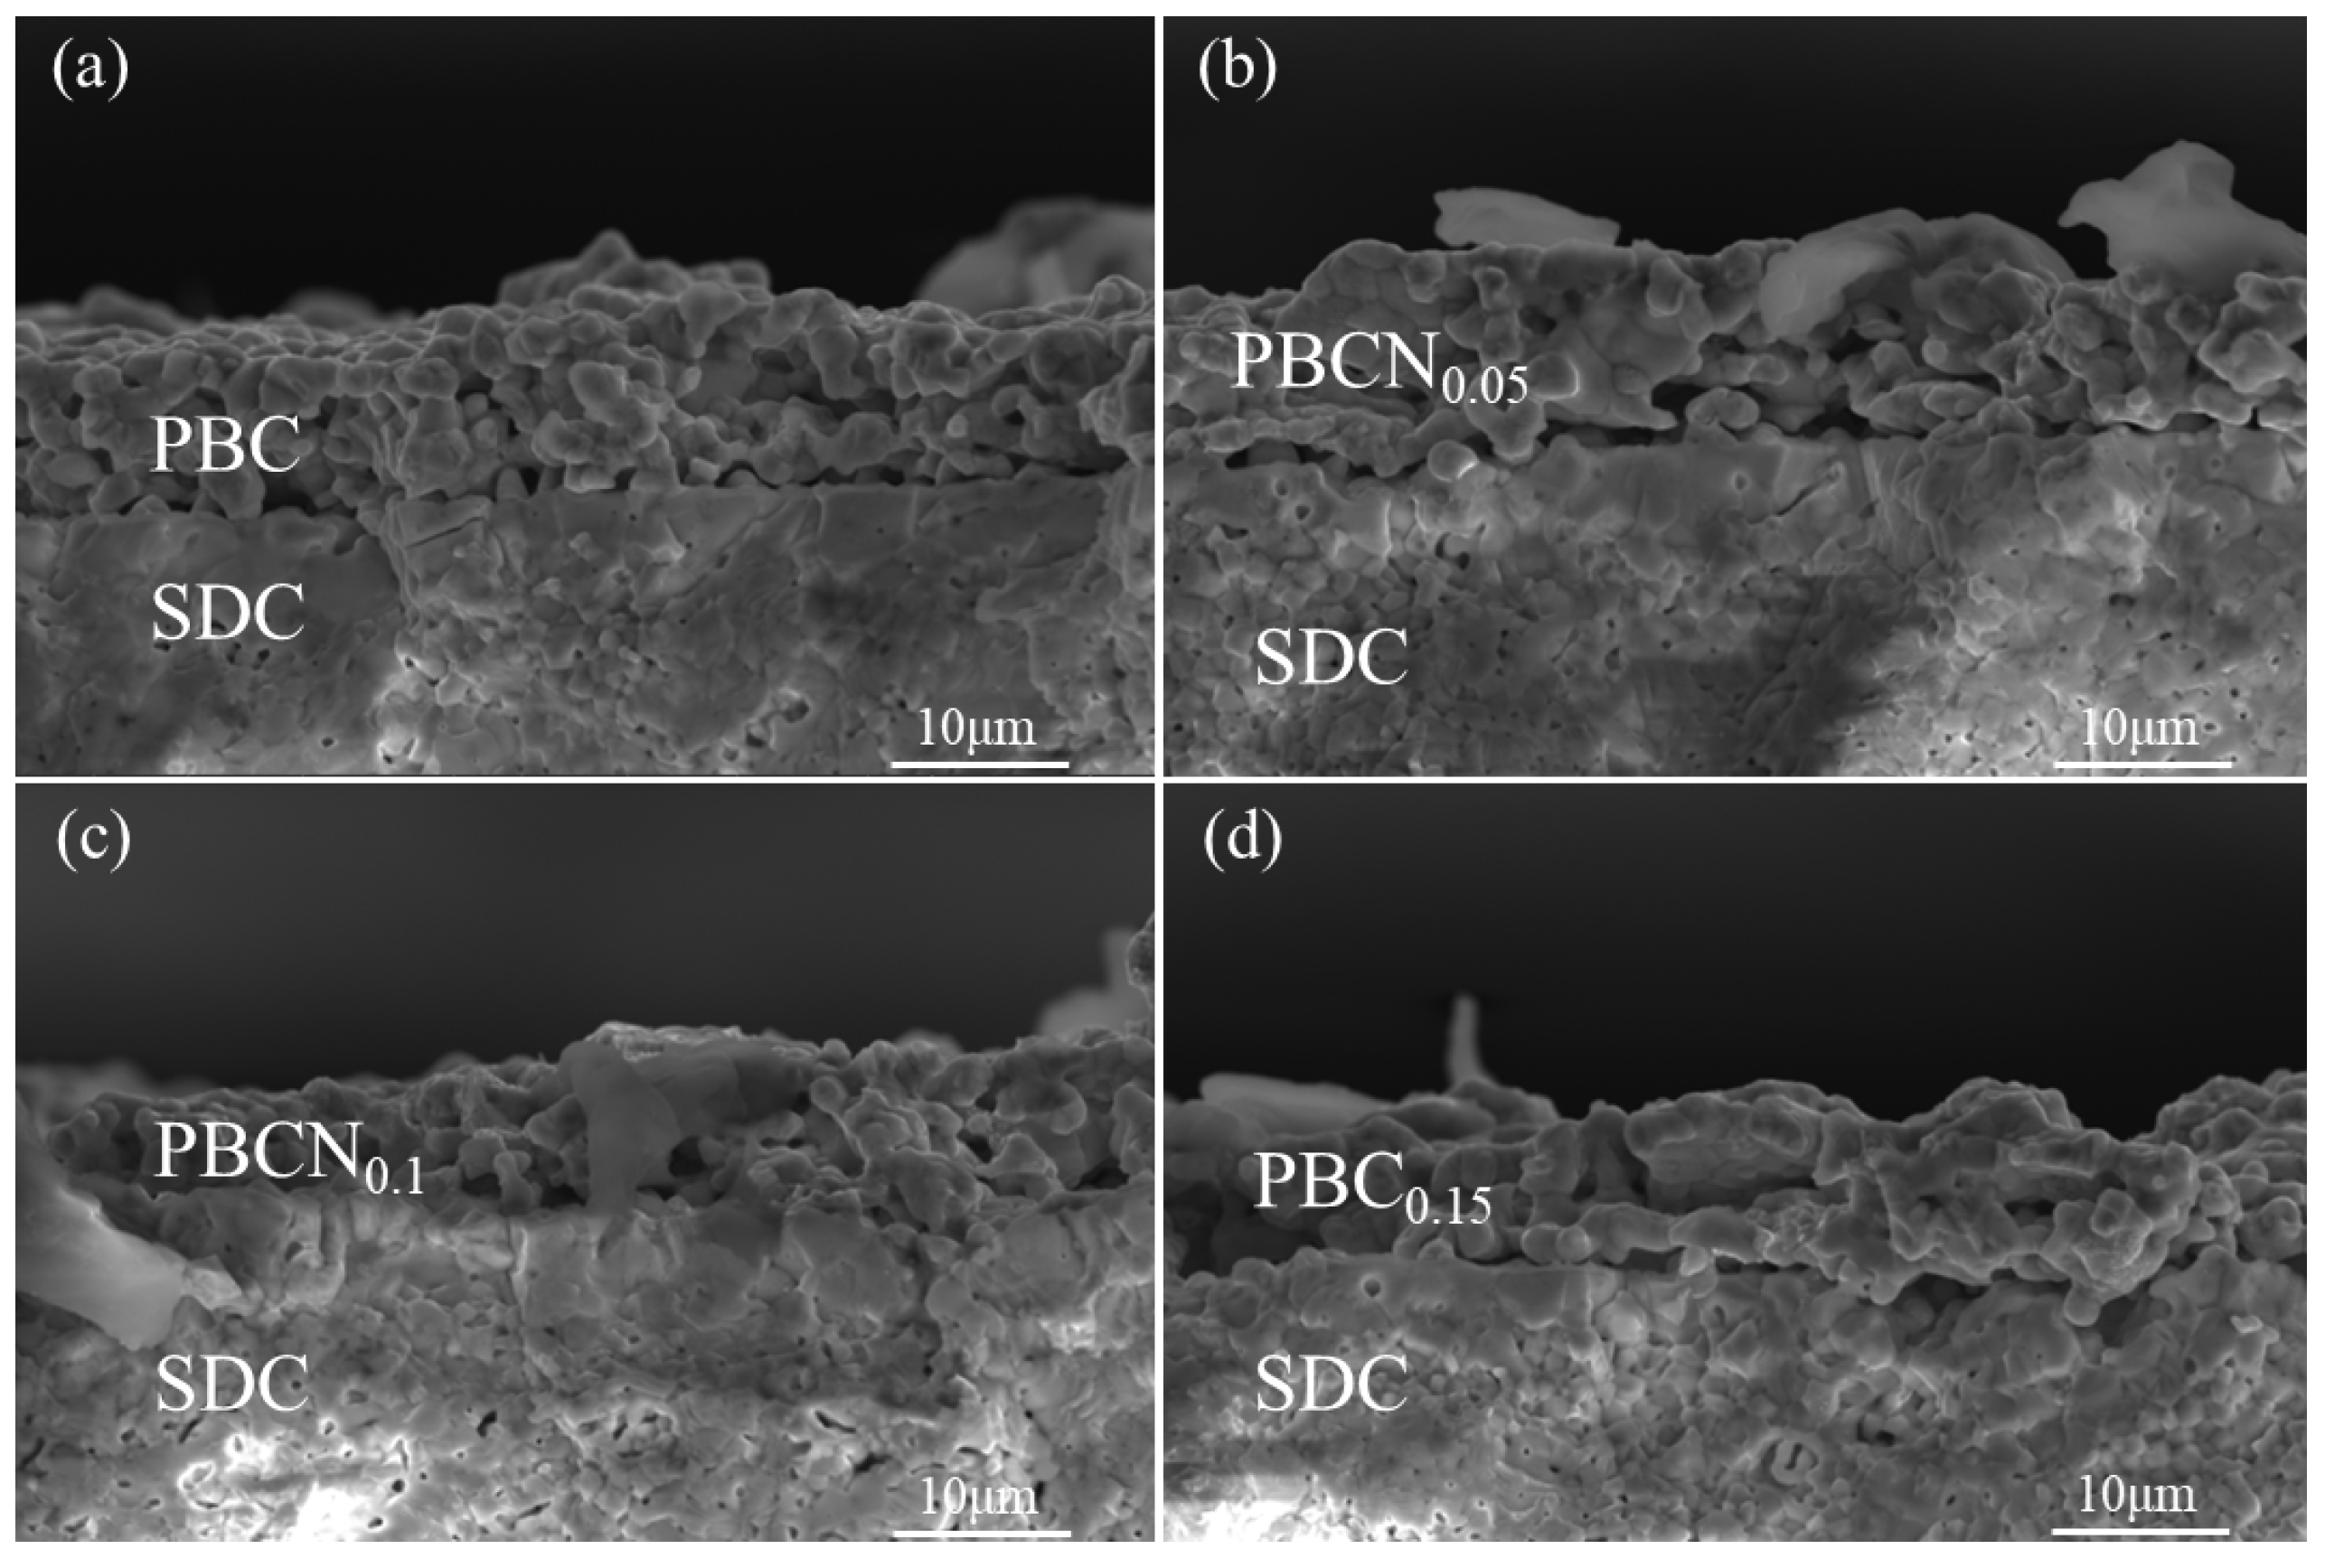
Figure 3.
(a) EDS of PBCNi0.1 cathode surface; (b-f) elements distribution.
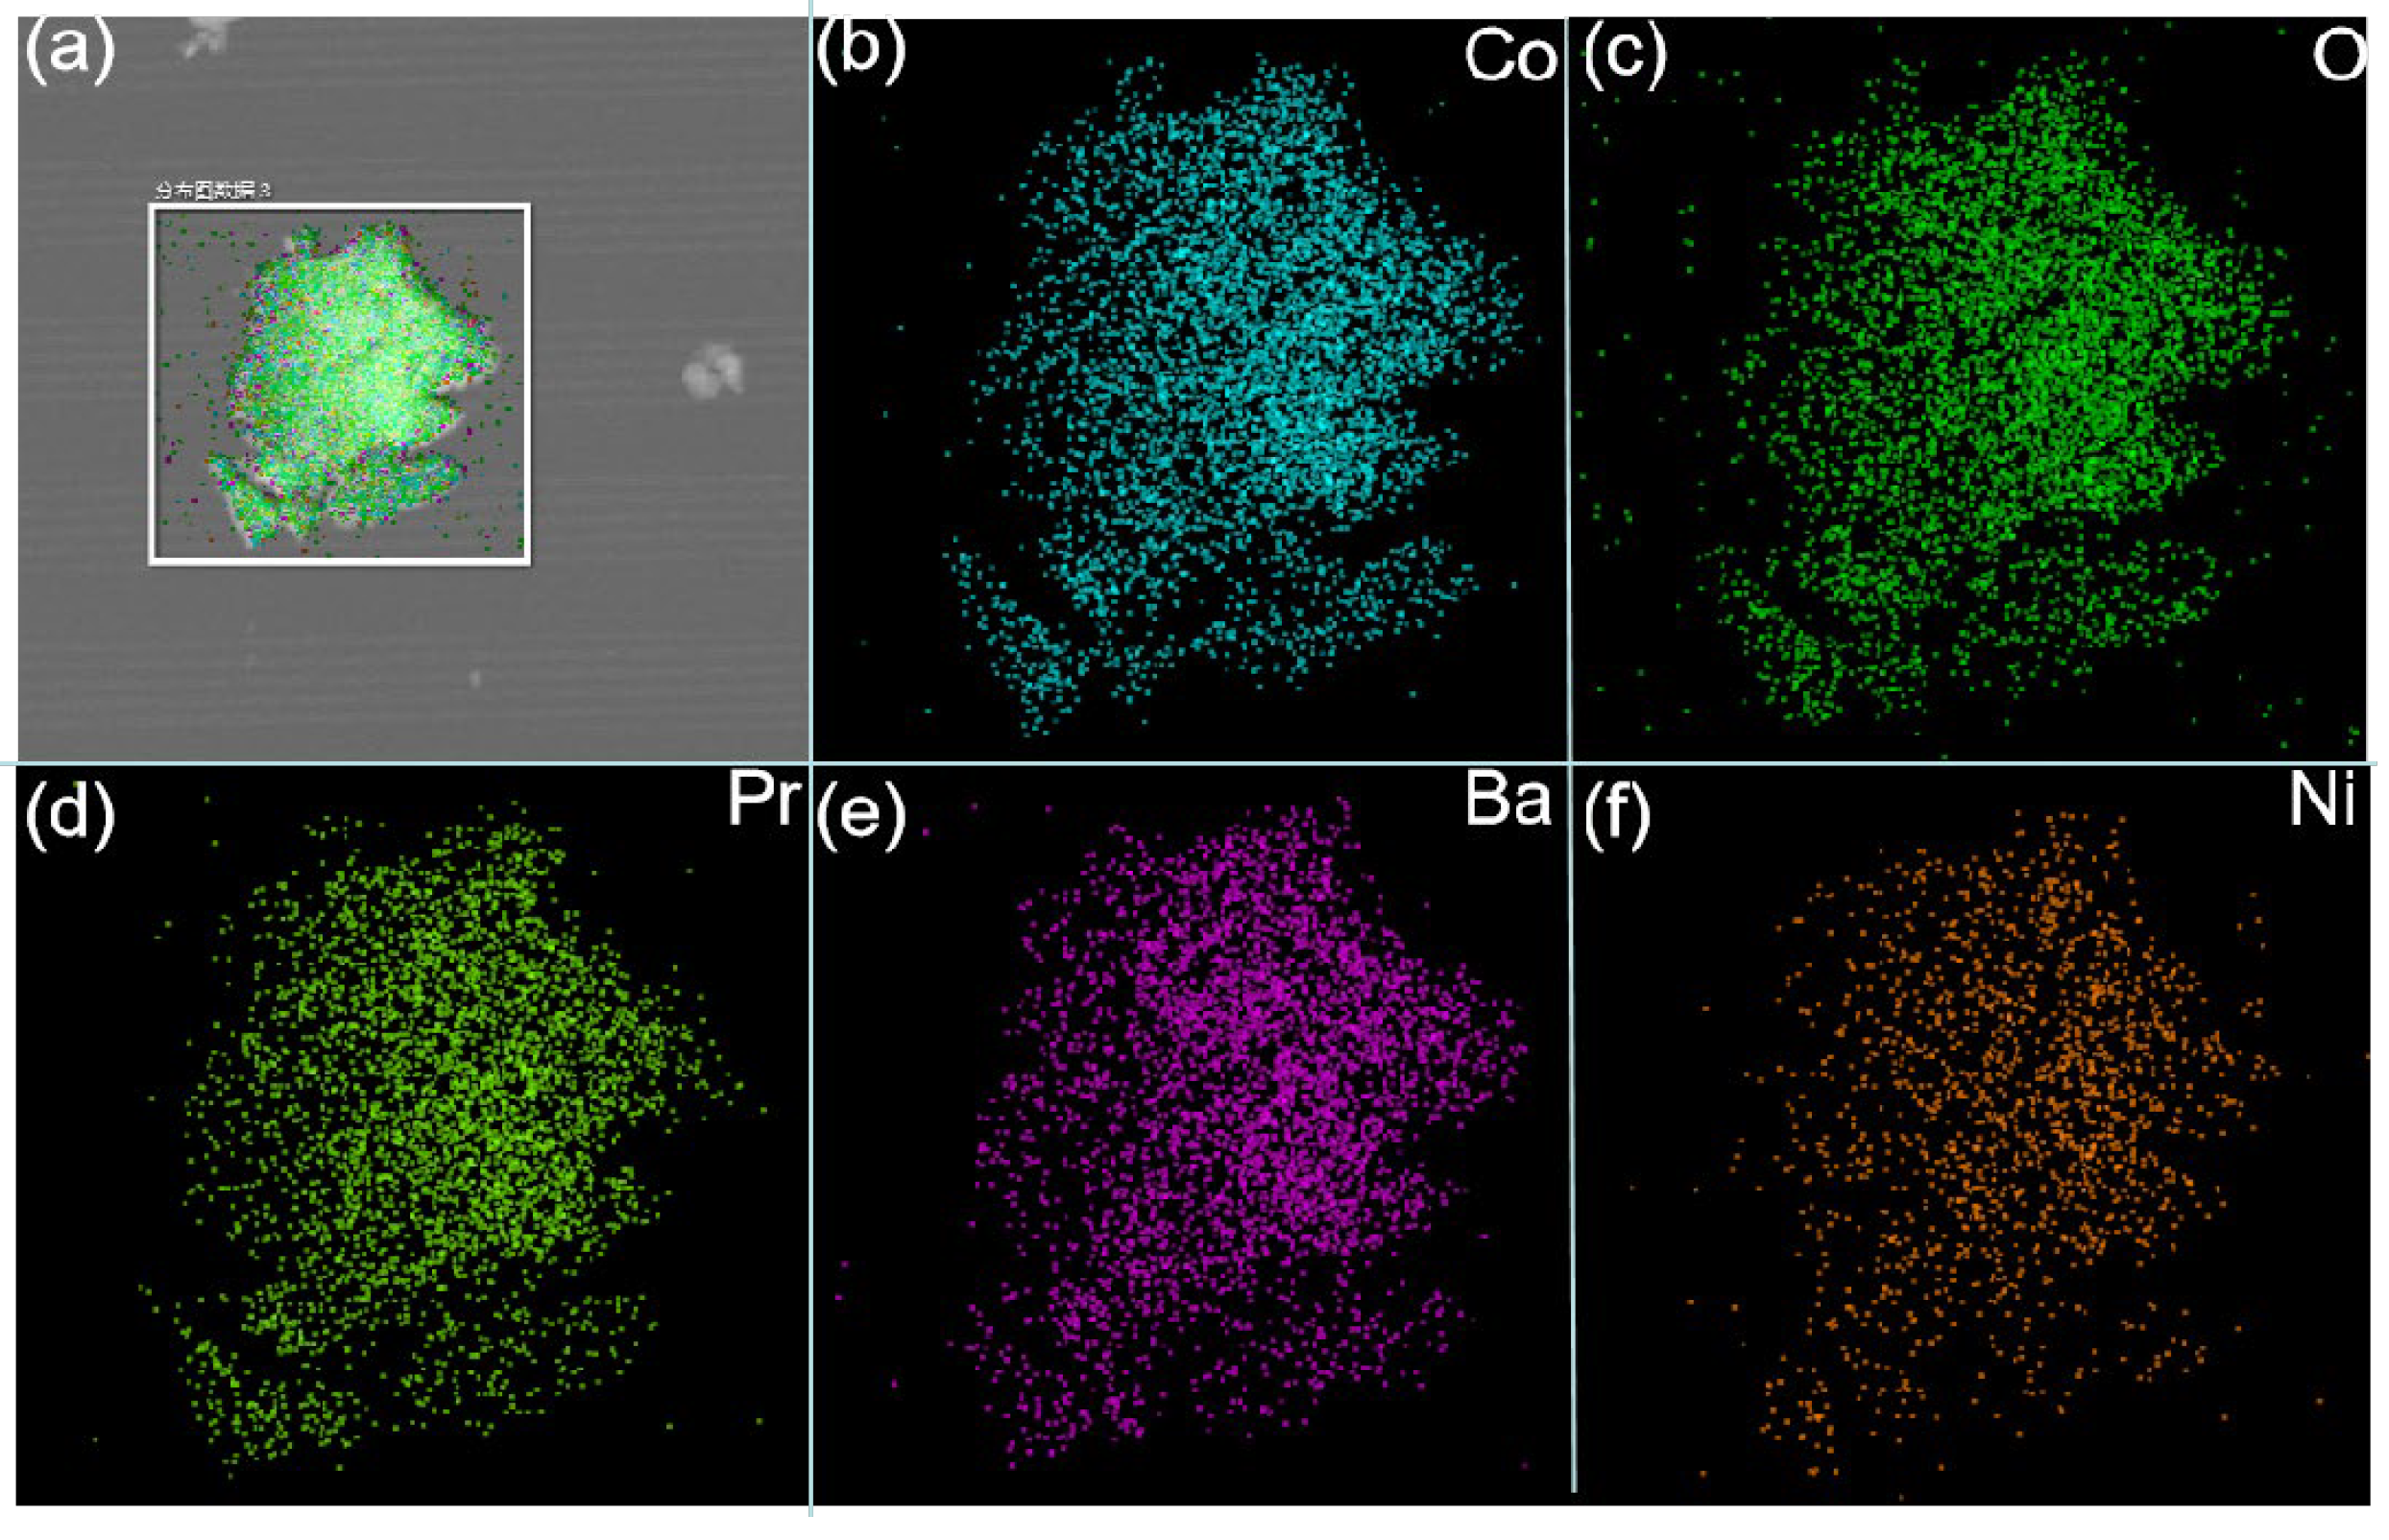
Figure 4.
(a) TEM of PBC; (b) TEM of PBCNi0.1 cathode material.
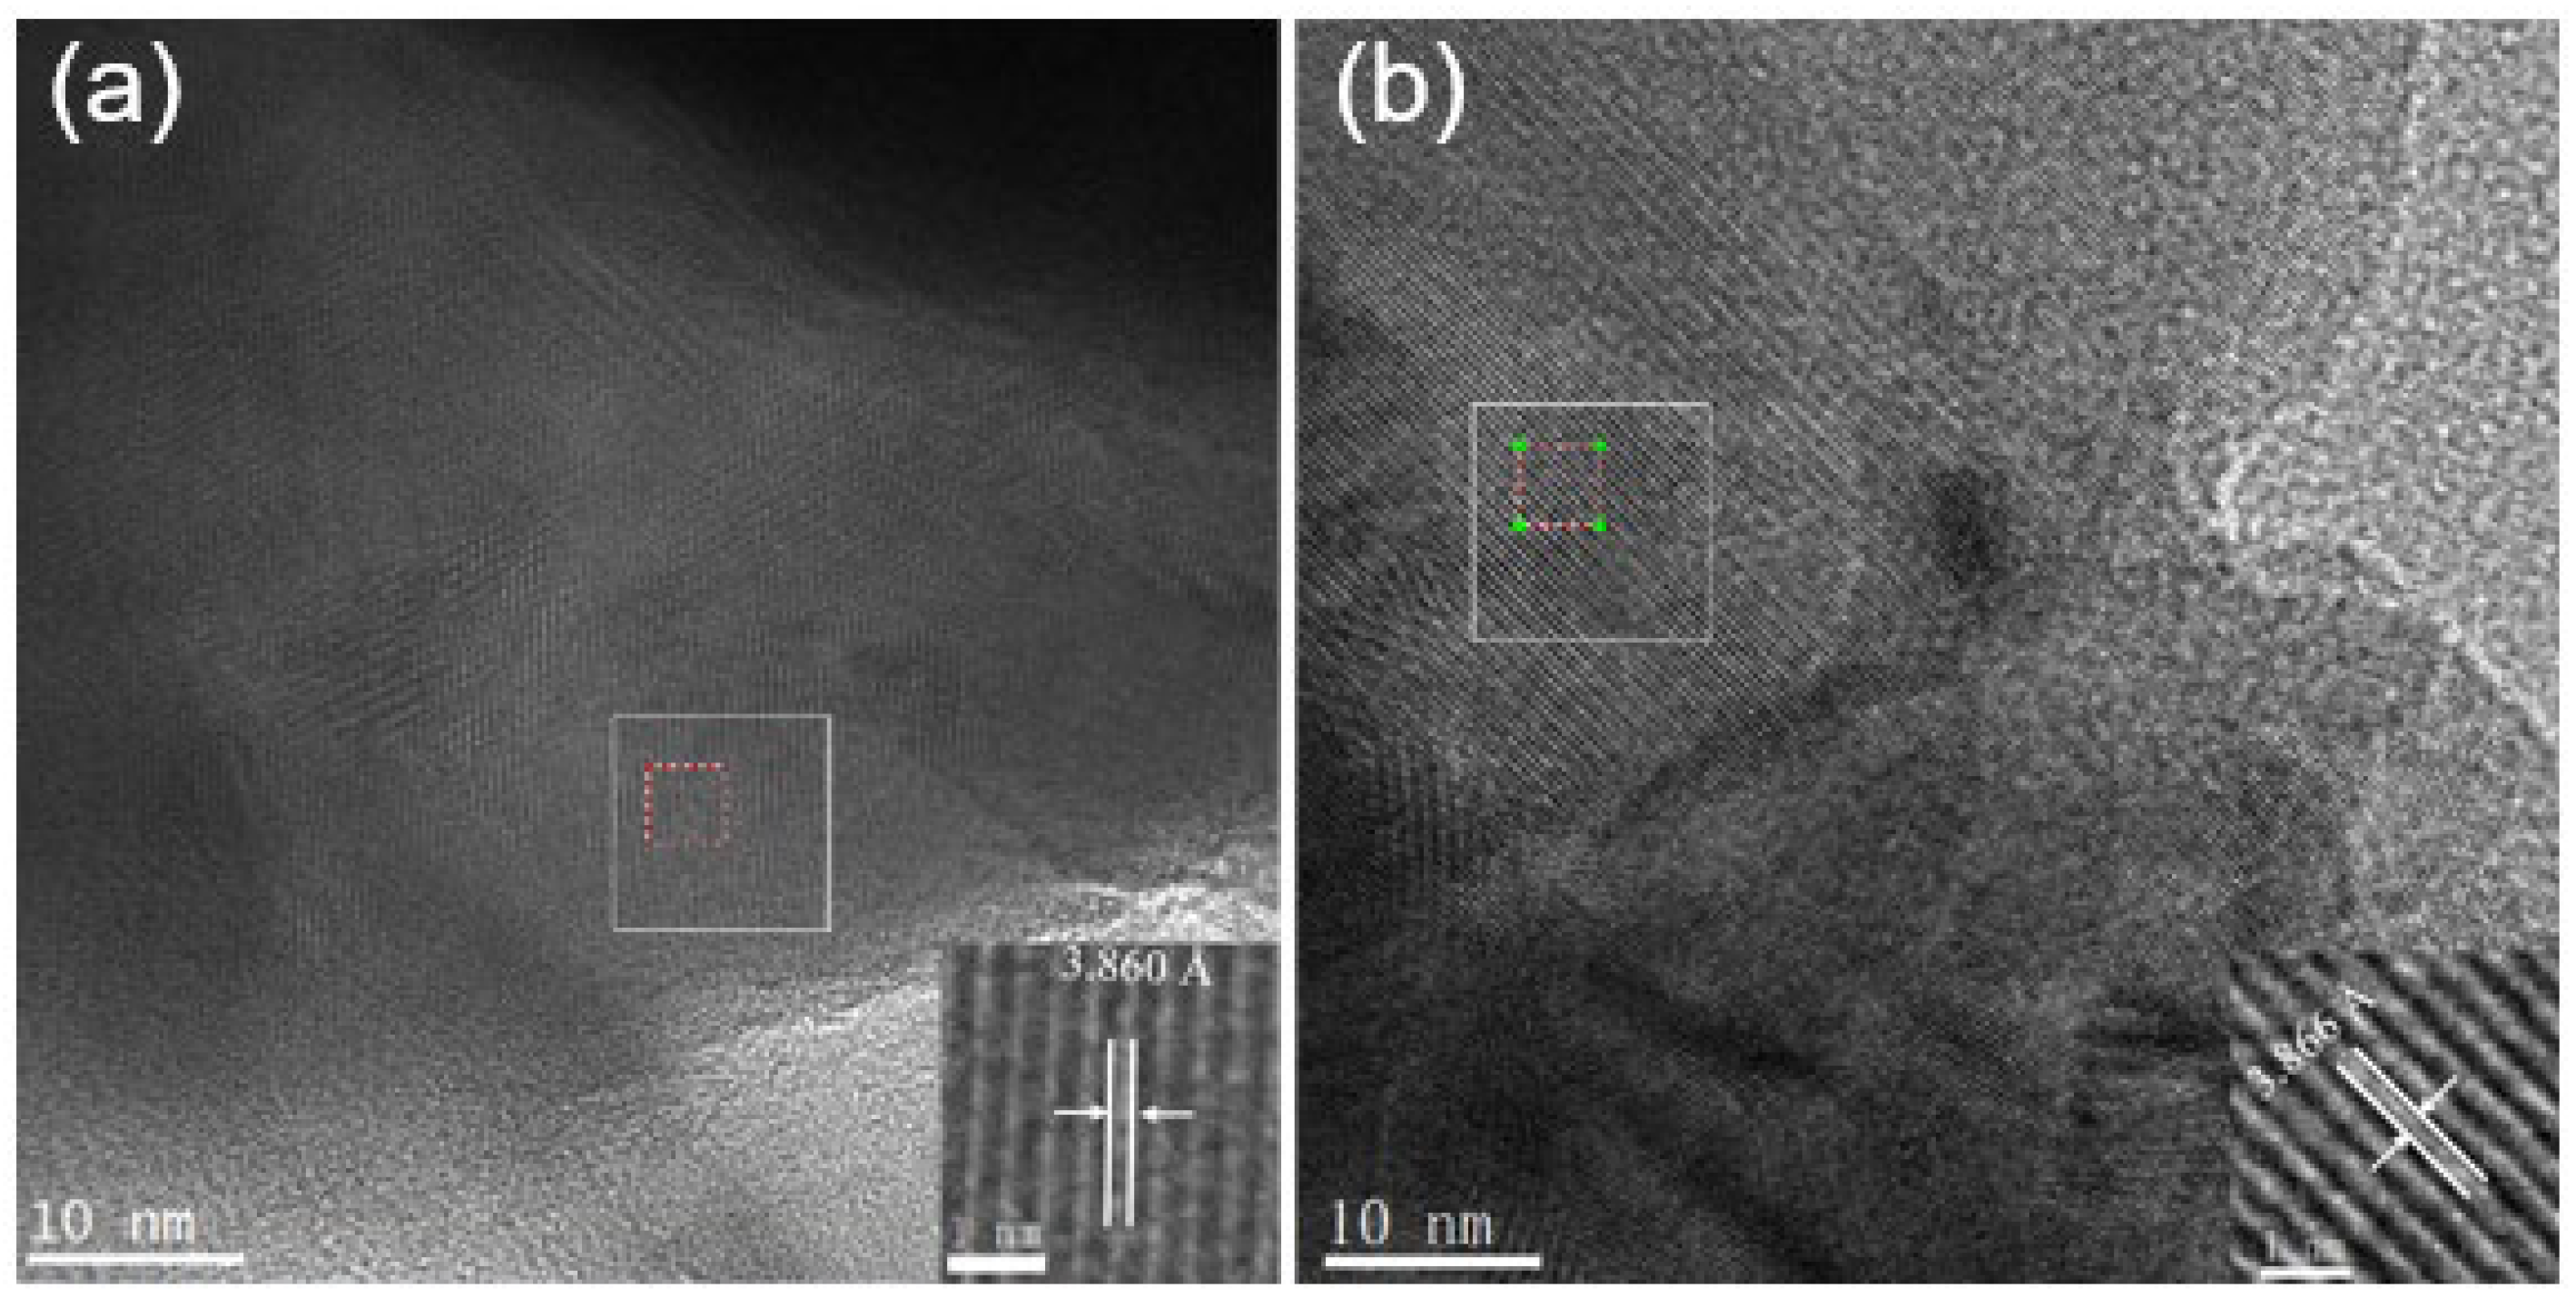
Figure 5.
(a) XPS patterns of PBCNiX O 1s orbit (b) PBCNiX Co 2p orbit.
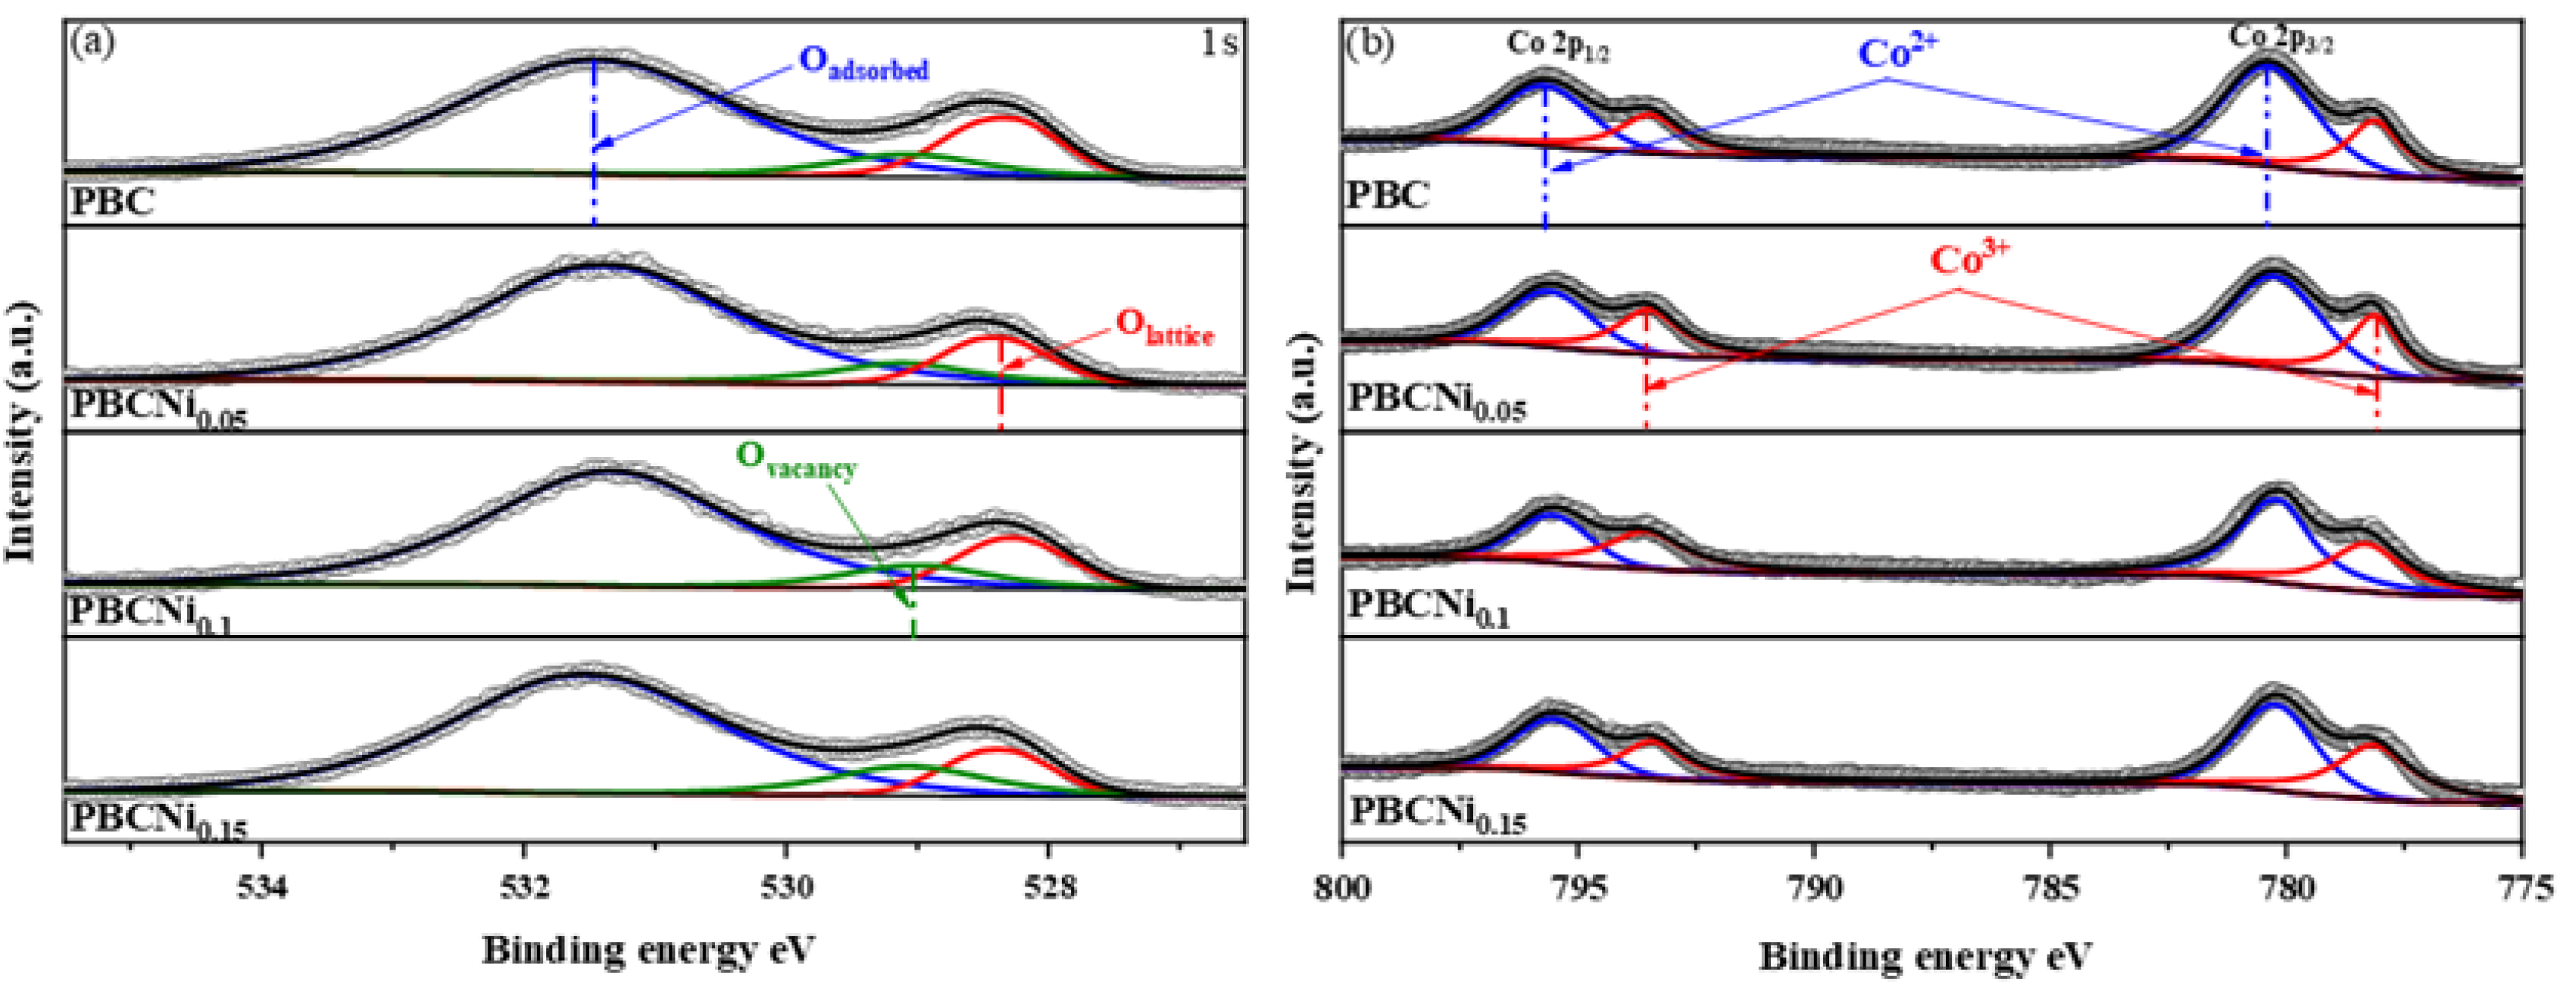
Figure 6.
Thermal expansion diagram of PBCNiX at 30-800 °C.
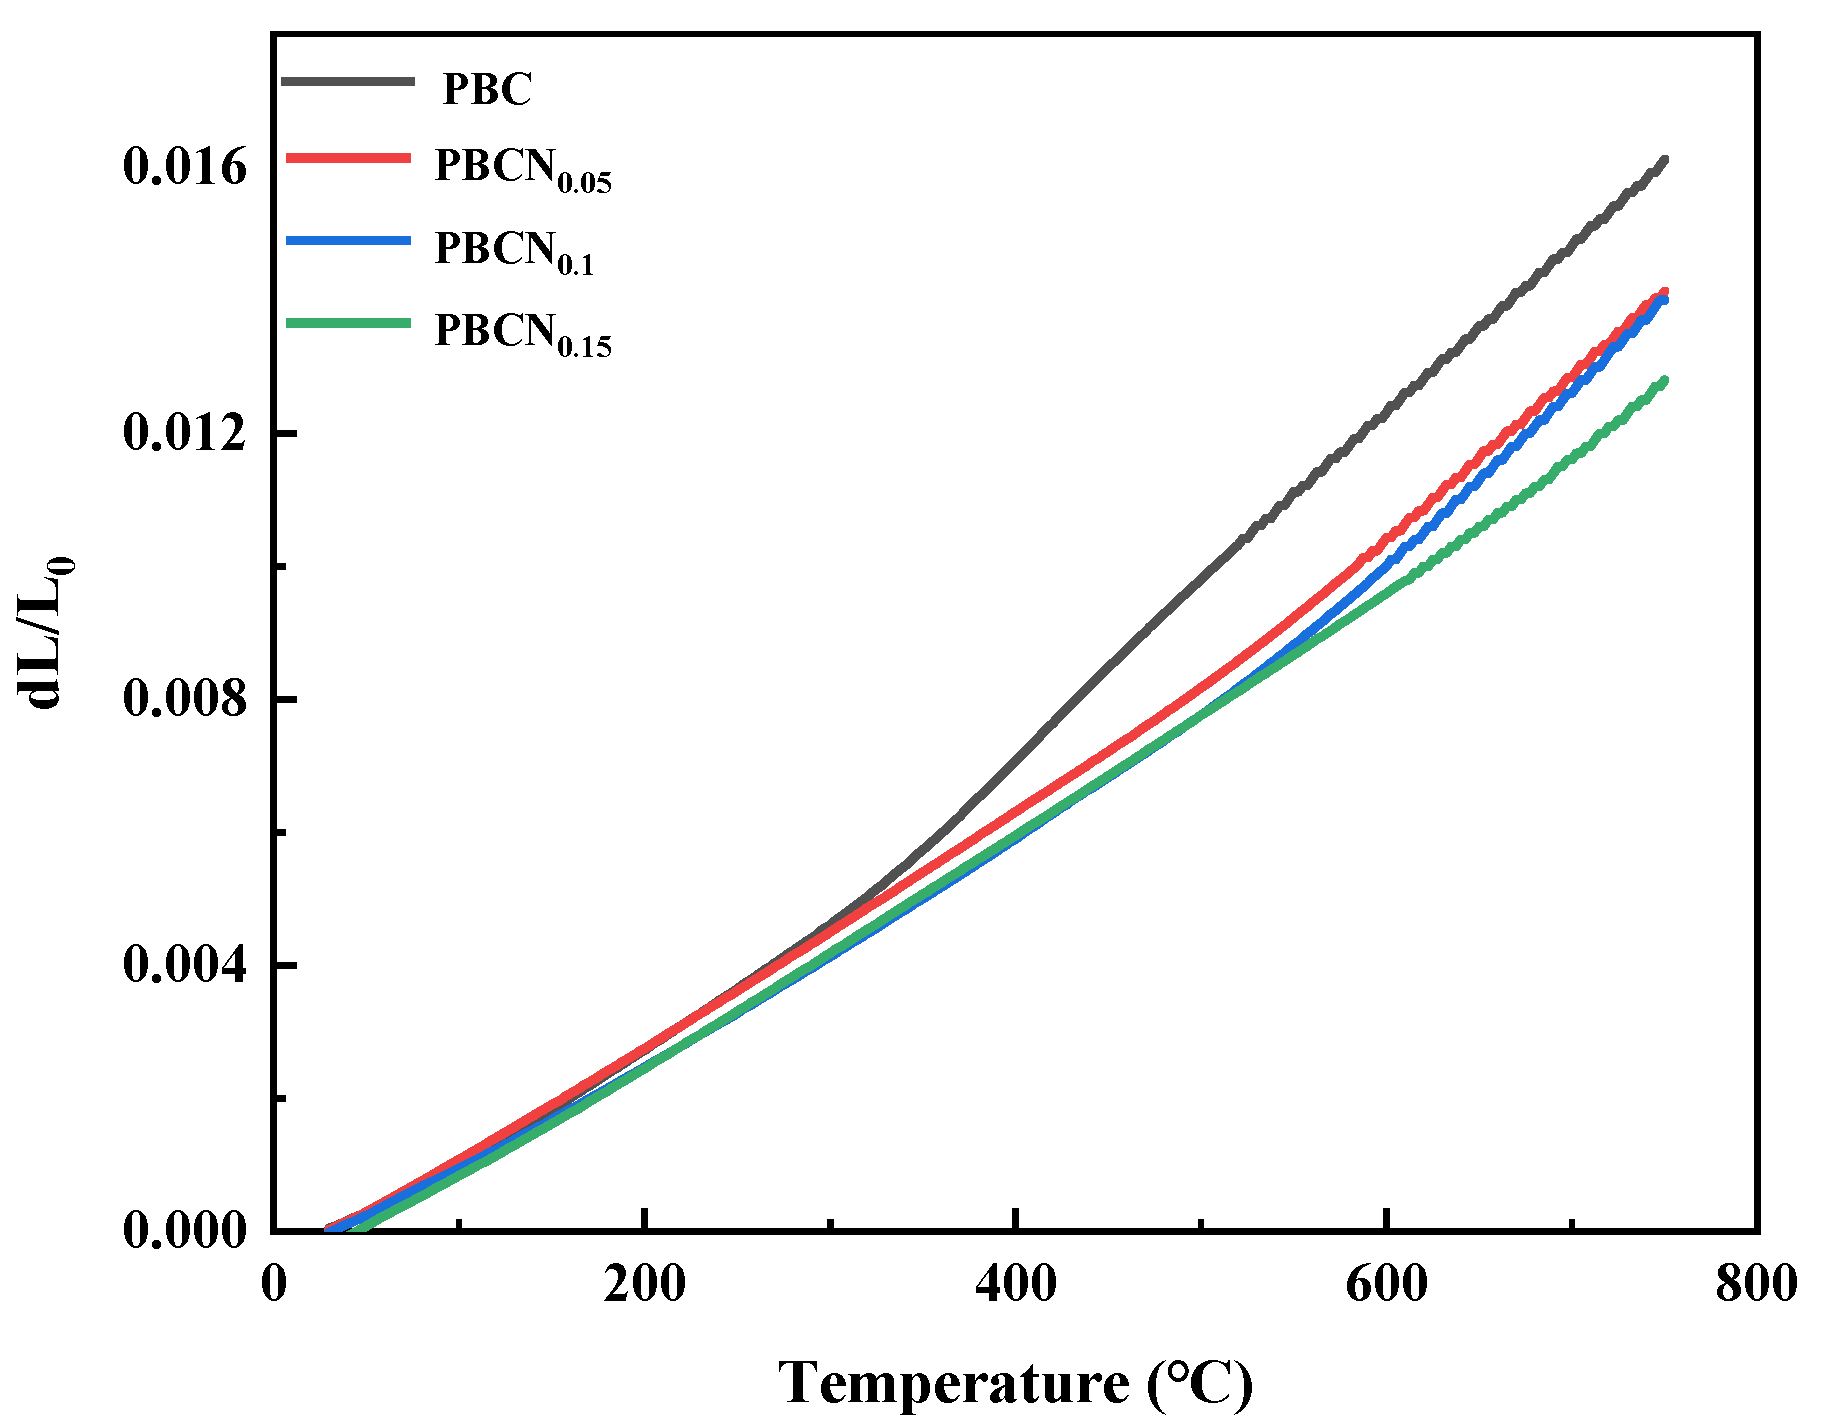
Figure 7.
(a) The relationship between the conductivity of PBCNiX and temperature; (b)Arrhenius curve of conductivity and temperature of PBCNiX.
Figure 7.
(a) The relationship between the conductivity of PBCNiX and temperature; (b)Arrhenius curve of conductivity and temperature of PBCNiX.
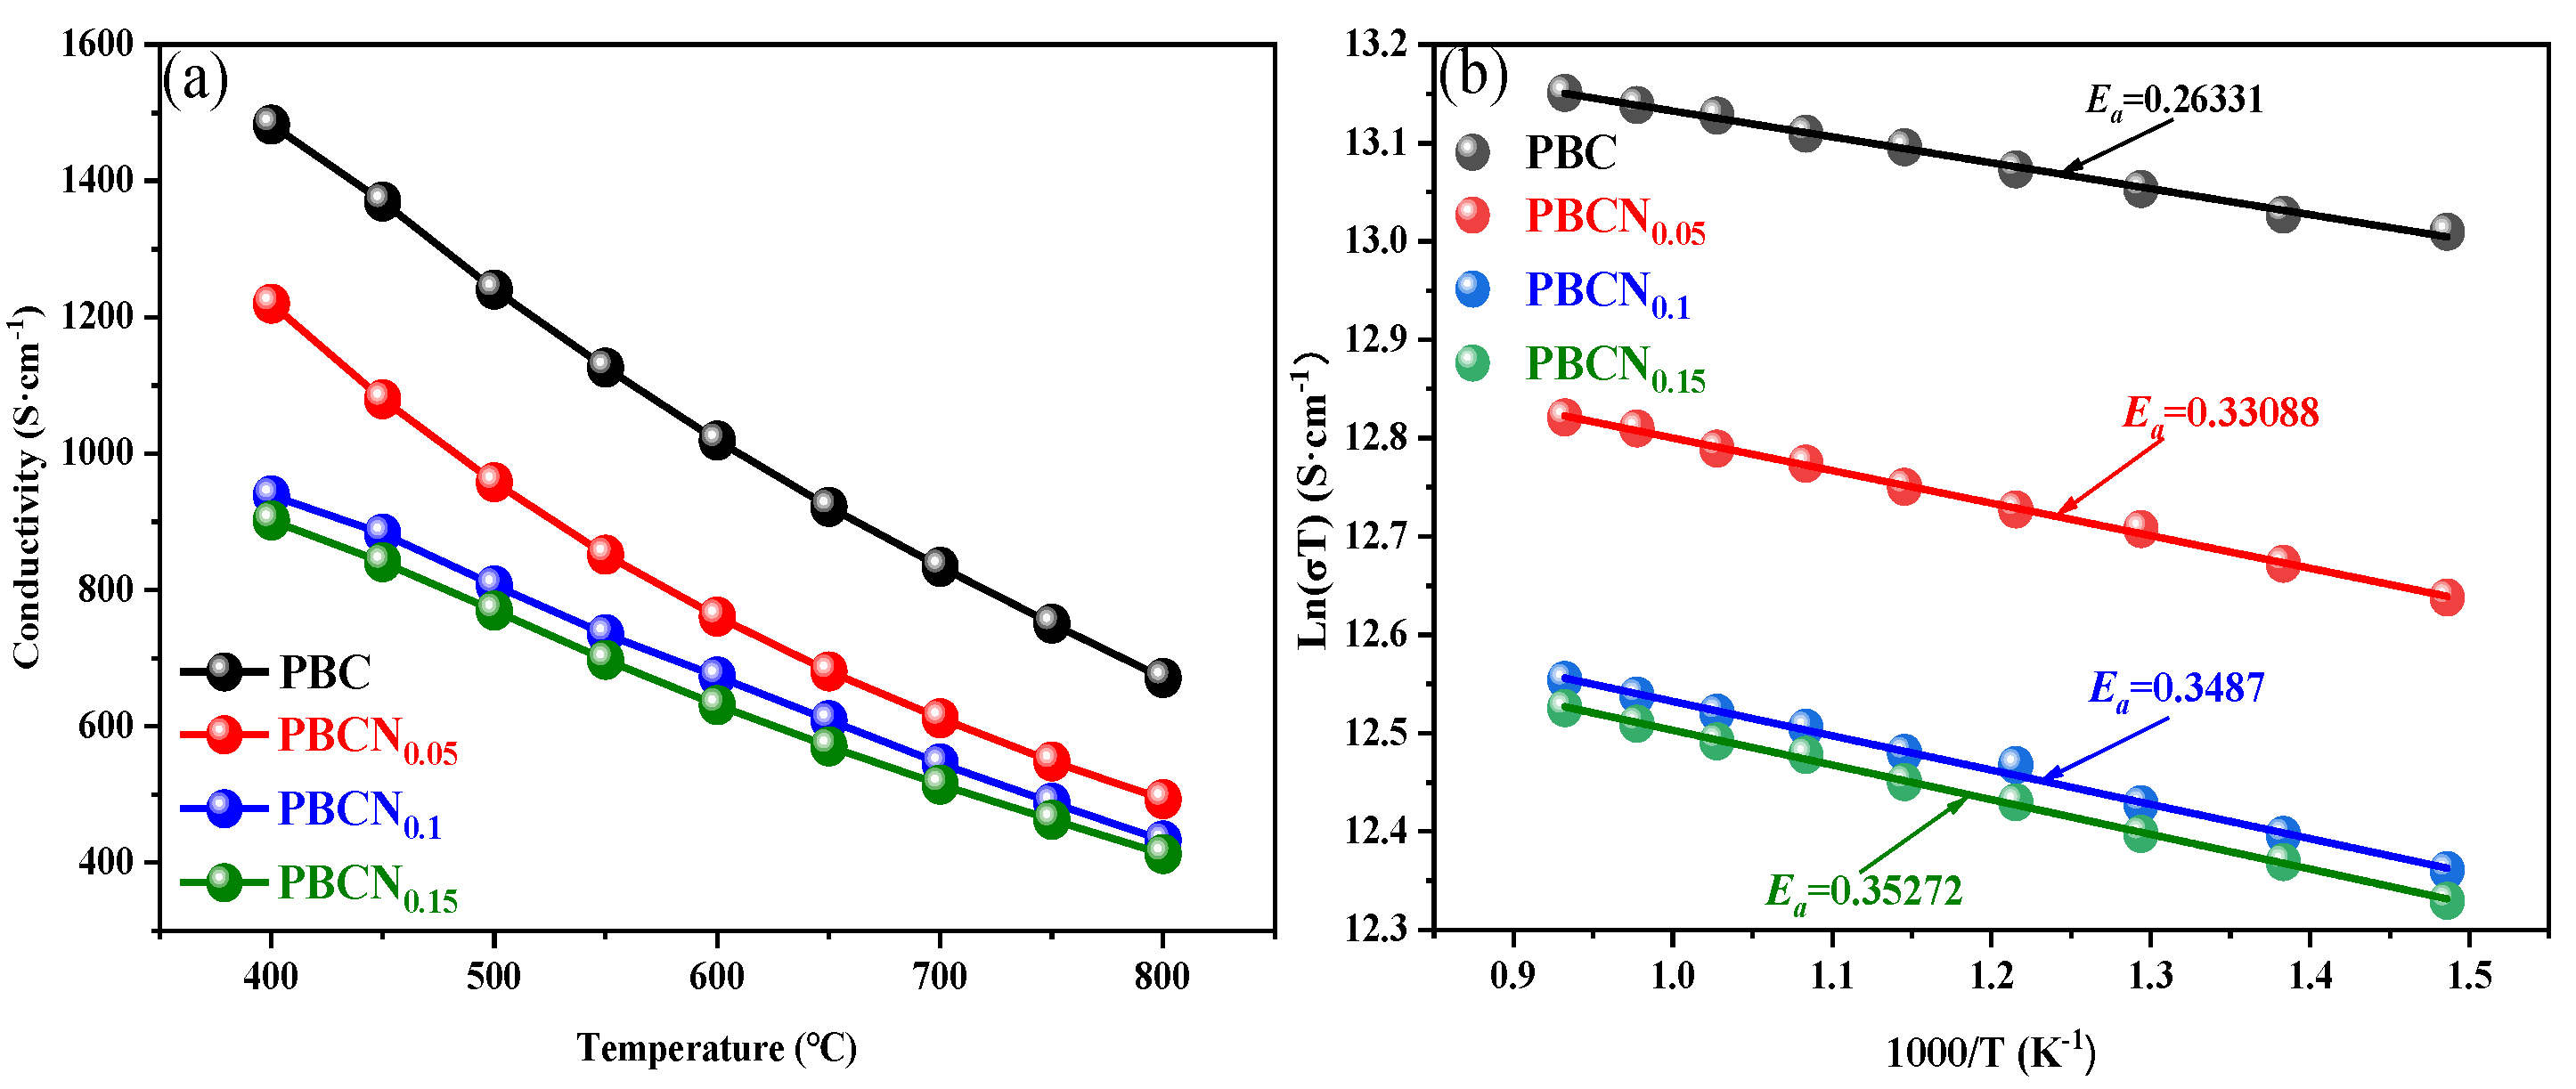
Figure 8.
(a) Impedance diagram of different components at 800 °C; (b)impedance line diagram of PBCNiX series cathode material; (c) Impedance diagram of PBCNi0.1 at different temperatures; (d) BET diagram of PBCNiX.
Figure 8.
(a) Impedance diagram of different components at 800 °C; (b)impedance line diagram of PBCNiX series cathode material; (c) Impedance diagram of PBCNi0.1 at different temperatures; (d) BET diagram of PBCNiX.
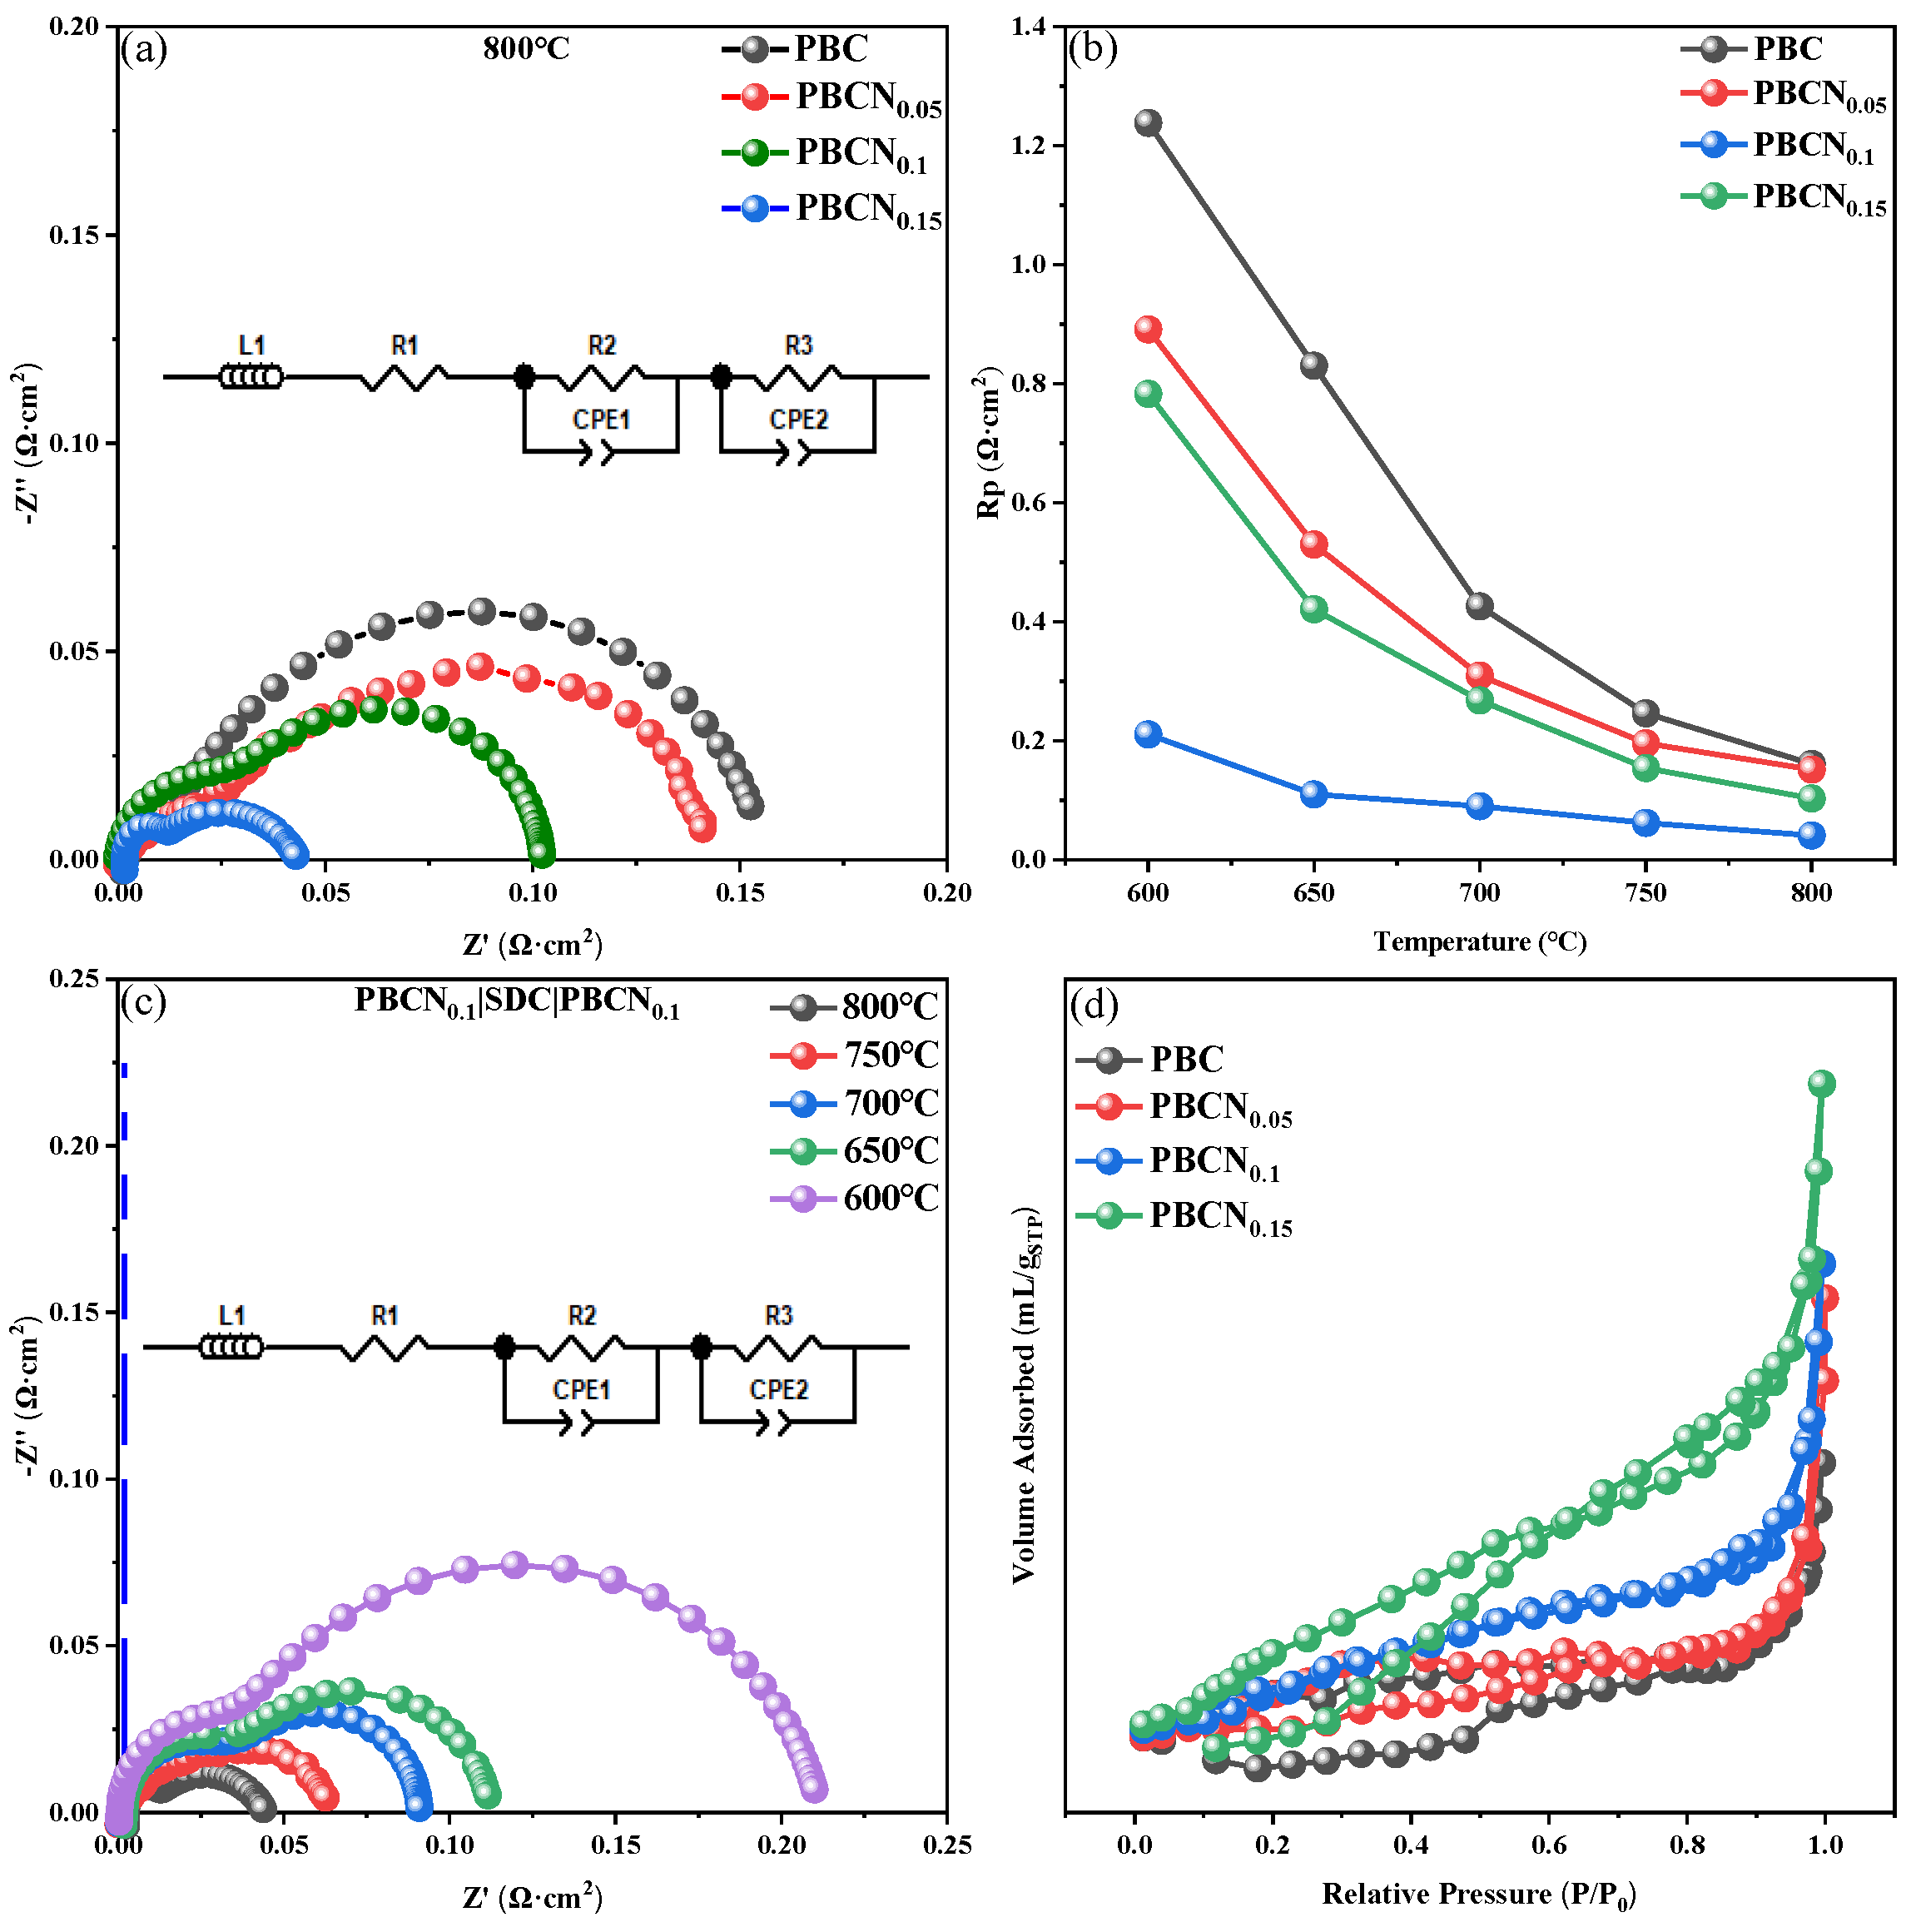
Figure 9.
I-V-P curve of a single cell composed of (a) PBC; (b) PBCNi0.1 as cathode at 650-800 °C.
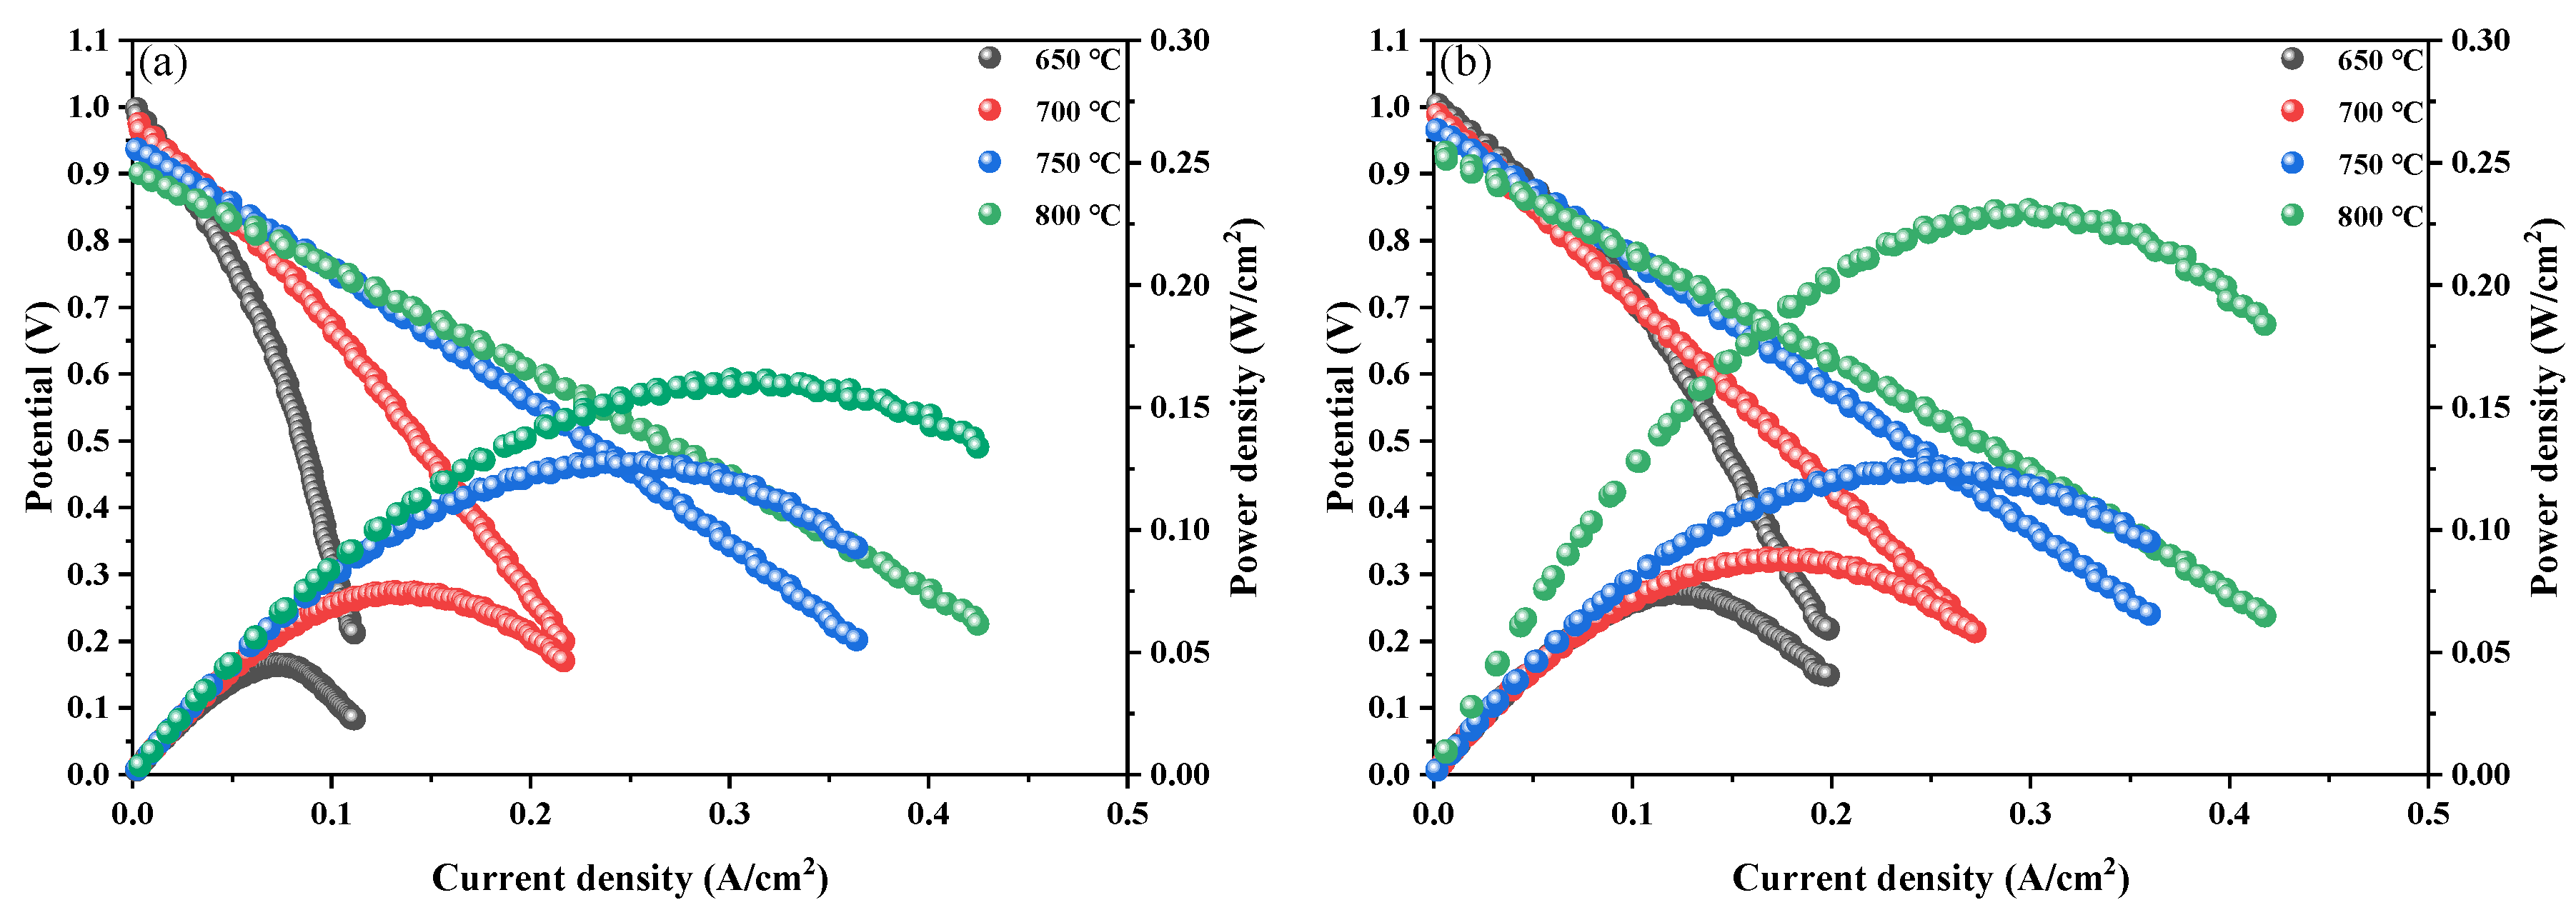

Table 1.
The polarization impedance Rp of PBCNiX cathode material and other Co-based materials.
| Sample | Electrode | Temperature(°C) | Rp(Ω·cm2) | Reference |
|---|---|---|---|---|
| PBCF | LSGM | 700 | 0.221 | [23] |
| PBC | LSGM | 700 | 0.07 | [24] |
| LBSC | SDC | 800 | 0.081 | [25] |
| NBC | LSGM | 800 | 0.078 | [26] |
| PBCNi0.1 | SDC | 700 | 0.09 | This Work |
| PBCNi0.1 | SDC | 800 | 0.041 | This Work |
Disclaimer/Publisher’s Note: The statements, opinions and data contained in all publications are solely those of the individual author(s) and contributor(s) and not of MDPI and/or the editor(s). MDPI and/or the editor(s) disclaim responsibility for any injury to people or property resulting from any ideas, methods, instructions or products referred to in the content. |
© 2025 by the authors. Licensee MDPI, Basel, Switzerland. This article is an open access article distributed under the terms and conditions of the Creative Commons Attribution (CC BY) license (http://creativecommons.org/licenses/by/4.0/).
Copyright: This open access article is published under a Creative Commons CC BY 4.0 license, which permit the free download, distribution, and reuse, provided that the author and preprint are cited in any reuse.


