
Submitted:
14 February 2025
Posted:
17 February 2025
You are already at the latest version
Abstract
The effects of RF-EMR from 5G on red blood cell (RBC) morphometric parameters and complete blood count (CBC) in pigs are unknown. Exposure of human and laboratory animal blood to RF-EMR from 4G and older technologies has been shown to have deleterious effects on blood cells and changes in CBC. This study aimed to determine the effect of 5G RF-EMR at different frequencies on RBC morphometry and CBC after short-term in vitro exposure of sow blood. Blood samples were taken from 16 sows aged 1 to 2 years. Three ethylenediaminetetraacetic acid (EDTA) tubes per sow were labelled as experimental tubes and three as control tubes. Experimental sam-ples were placed in a Half-cone gigahertz transversal electromagnetic cell and exposed for 2 hours to three different frequencies of 5G network, i.e. 700 MHz, 2500 MHz and 3500 MHz with an electric field strength of 10 V/m. The morphometric parameters of the erythrocytes were determined using the computer-assisted programme SFORM, while the CBC value was determined using a haematology analyser. The effect of 5G RF-EMR exposure on sow RBC morphometry in exposed blood was frequency dependent. The most detrimental effect was observed after exposure at 700 MHz, which resulted in significantly elongated and irregularly bordered sow RBCs. These results suggest that in vitro exposure of blood to 5G RF-EMR may im-pact the RBCs shape, as well as their mechanical properties or integrity, which could have serious effects on cell function.
Keywords:
5G electromagnetic radiation
; in vitro blood exposure
; haematology indicators
; erythrocyte morphometry
; erythrocyte subpopulations
; pigs
1. Introduction
The widespread use of radiofrequency electromagnetic radiation (RF-EMR), especially with the introduction of 5G networks, raises public concern about possible negative effects on human and animal health [1,2,3]. Current research includes the bio-logical effects of RF-EMR on genotoxicity, cell proliferation, gene expression, cell signalling, and membrane function [4], as well as on the immune, hematopoietic [5], and reproductive systems [6]. Due to the lack of studies, especially long-term studies, on the effects of 5G technology on the health of humans and other living beings, it is necessary to begin researching the effects of 5G technology on different organ systems and cells under as many different exposure conditions as possible. This is especially important given the possible harmful effects observed with previous generations of wire-less technologies [2,3,6,7,8]. Additionally, there is very little information in the available literature on the effects of 5G RF-EMR on blood and blood cells, as the new generation of wireless technology uses different frequencies than those previously utilised and is only just being introduced with a tendency to expand.
Exposure of humans and laboratory animals to 4G RF-EMR emitted from cell phones and other devices has been shown to have deleterious effects on blood cells and induce changes in the complete blood count (CBC). The effects are dependent on the type of organism exposed, the physical characteristics of the radiation (frequency, modulation, electric field strength), and the duration of exposure [5]. In humans, for example, RF-EMR from cell phones has been shown to cause adverse effects on blood cells and changes in CBC parameters after prolonged (1 hour) in vitro exposure of blood to different exposure frequencies. [5,9,10]. However, no studies on the effects of RF-EMR on CBC indicators in domestic animals have been found in the available literature. The complete blood count is a basic haematology laboratory analysis used to assess general health, monitor disease progression, and detect various disorders [11]. This analysis includes determining the number of red blood cells (RBC), leukocytes, and platelets per litre of blood, as well as assessing some of their morphological characteristics [12].
Further, morphometry is the simplest form of imaging cytometry and refers to the assessment of cells or tissues/blood by measuring various cellular features in a two-dimensional view [26]. Recent research uses more advanced and sophisticated measurements of RBCs with the help of computer programs [27,28,29]. Namely, it is known that RF-EMR can damage cellular organelles such as the cell membrane, mitochondria, and DNA [13]. After exposure to RF-EMR, cell membranes may become “shocked,” leading to electroporation that creates pores in the membrane for water transport (aquaporins), disrupting the ion balance inside and outside the cell [14,15,16]. Furthermore, mechanical disturbances caused by RF-EMR can also increase cell membrane permeability [4]. The transformation of the RBC from a biconcave (thermodynamically more favourable) to a spherical shape [17], aside from aging, may result from conformational changes in RBC membrane proteins and the redistribution of membrane phospholipids, with the separation of one phospholipid layer from the other [18,19]. Finally, RF-EMR leads to cell necrosis, apoptosis, or autophagy [20], changes in the functionality of membrane receptors [21] the generation of excessive amounts of free radicals [22,23,24] and the weakening of the cell’s antioxidant system, creating conditions conducive to oxidative stress [25]. Data on RBC morphometric indicators after in vitro exposure of human and pig blood to RF-EMR are currently unknown.
Understanding the effects of RF-EMR on blood following in vitro exposure is of particular importance because, on the one hand, blood and blood products are stored and used in transfusion medicine [4,30] and, on the other hand, blood samples are often exposed to numerous and different sources of RF-EMR during routine processing on the premises, e.g., mobile devices, wireless routers and instruments using wireless technology. In addition, since pigs are considered the best model whose results can not only be extrapolated to humans but also used for future clinical transfusion of porcine red blood cells to humans [31], we believe that this research has practical significance. The hypothesis of this research is that the RF-EMR from 5G networks leads to changes in CBC levels and RBC morphometry in sow blood after short-term in vitro exposure. Therefore, the aim of this study was to determine the effects of 5G RF-EMR at frequencies of 700 MHz, 2500 MHz, and 3500 MHz on CBC levels and RBC morphometry in sow blood following short-term in vitro exposure.
2. Materials and Methods
2.1. Animals, Housing and Feeding
The study was conducted at two family farms in Ludbreg, Varaždin County, Croatia. The study included 16 German Landrace sows, 1 to 2 years old, ~170 kg (8 sows from each farm). The sows were neither pregnant nor lactating. They were kept in a group in enclosed pens under the same housing conditions, in accordance with the Council Directive 2008/120/EC [32]. Sows were fed twice daily with a complete feed mixture containing maize, barley, bran (wheat) and sunflower meal, and a supplementary feed mixture (mineral mixture for sows) (Table 1 and Table 2). Access to water was ad libitum.
2.2. Blood Collection
The study was carried out on freshly drawn sow blood samples. Blood samples were collected in accordance with the national Regulation on animal health protection measures against infectious and invasive diseases and their financing in 2022 (OG 145/2021) [33] and the remaining blood was used for the study.
Blood was collected once from the cranial vena cava of sows using vacuum tubes with a needle with the addition of the anticoagulant ethylenediaminetetraacetic acid (EDTA). The venepuncture site was disinfected before the procedure in accordance with professional regulations. The remaining blood samples were distributed in six test tubes (BD Microtainer® Tube, K2EDTA), with approximately 1000 µL of blood in each tube.
2.3. Exposure of Blood Samples to 5G Radiofrequency Electromagnetic Radiation under Laboratory Conditions
Experimental blood samples (three test tubes) from each sow were exposed to continuous 5G RF-EMR at different frequencies using a Half-Cone gigahertz transversal electromagnetic cell (H-CTEM) made in the Department of Radio Communication and Radio Frequency Electronics, Faculty of Electrical Engineering and Computing, University of Zagreb, Zagreb, Croatia [34]. The experimental blood samples were exposed to H-CTEM at a frequency of 700 MHz (one test tube per sow), 2500 MHz (one test tube per sow) and 3500 MHz (one test tube per sow) at an electric field strength of 10 V/m for 2 hours. The remaining three samples/tubes were kept under identical conditions, in a metal box of the same material as the H-CTEM cell and in the same room, without exposure to 5G RF-EMR (control group).
The CBC indicators were determined in the experimental and control samples of the sow whole blood, the morphometric characteristics/properties of RBCs were analysed.
2.4. Analysis of Hematologic Indicators in the Blood
Haematology analyses (a total of 96 whole blood samples, i.e., 1728 analyses) were performed at the Department of Physiology and Radiobiology, Faculty of Veterinary Medicine, University of Zagreb, Zagreb, Croatia, using the Abacus Junior Vet Haematology Analyser (Diatron, Táblás u., Hungary) [28,35]. Prior to analysis, blood samples were mixed in automatic mixers for 30 minutes at room temperature (20 °C). All analyses were performed twice with a maximum error of <4%. The sampling procedure was performed with the manufacturer’s reagents (Diatro Lyse_DIFF, Diatro Cleaner and Diatro-Rinse, Hungary) in four steps. In addition to the haematology indicators analysed with a blood cell counter, a differential blood count was analysed manually to determine the ratio of the different types of leukocytes in the blood. The haematology counter analysed: total number of leukocytes, number of lymphocytes, number of RBCs, haemoglobin, haematocrit, average RBC volume per litre of blood (MCV), average amount of haemoglobin in RBCs (MCH), average concentration of haemoglobin in RBCs (MCHC), width of distribution of RBCs, number of platelets, plateletcrit, average platelet volume, and width of distribution of platelets.
2.5. Morphometric Analysis of Red Blood Cells
Blood smears were prepared from sow blood samples (experimental and control) and stained according to Pappenheim (May Grünwald and Giemsa solutions). The stained blood smears were then subjected to computer analysis (basic morphometric features/characteristics of RBC) on a personal computer using the SFORM program (VAMSTEC, Zagreb, Croatia) [28]. The system consists of a high-resolution colour camera (Donpisha 3CCD), which digitises the image under the 100x magnification lens of the Olympus BX 41 light microscope and transfers it to a personal computer. The primary morphometric indicators i.e., indicators of RBC size and indicators of RBC shape, were then determined. A total of 96 stained blood smears of sow RBCs were analysed. More than 100 RBCs were measured for each stained smear. Only RBCs that did not overlap were analysed. A total of 13,482 RBCs were measured from control (unexposed) and experimental (exposed) blood samples from 16 sows. RBCs were measured in 48 control (non-exposed) and 48 experimental samples/smears (samples exposed to 5G at frequency of 700 MHz, 2500 MHz and 3500 MHz). RBC boundaries were marked interactively (initially with an automatic RBC rounding command) with manual correction using a computer mouse. The following was determined for RBC cytoplasm: area (μm2), outline (μm), convex area or convexity (μm2), minimum and maximum radius (μm), length and width (μm). Shape indicators for RBCs were calculated using primary indicators (length, width, area and outline): roundness = (4 x area)/[π x (maximum radius)2], form factor (rugosity; 4π x area/outline2), ellipticity (length/width) and elongation (length − width)/(length + width), solidity = area/ convex area, contour index = outline/√area.
2.6. Statistical Data Processing
The blood samples from sows were analysed in this study. Statistical analysis was performed using the SAS 9.4 software package (Statistical Analysis Software 2002-2012, SAS Institute Inc., Cary, USA).
Descriptive statistics were performed using the PROC MEANS and PROC FREQ modules. The normal distribution of the data was tested using the PROC TRANSREG module. If the assumptions of normal distribution of the dependent variables were violated and in the case of heterogeneity of variances, transformation of variables was performed using the BOX-COX transformation, usually by logarithmic or exponential transformation.
A quick test of the dependent variable was performed by multivariate analysis of variance (MANOVA) based on the Wilks’ lambda criterion using the GLM procedure to gain insight into the possible statistical significance of the differences between the groups. The main analysis model was conducted using the GLIMMIX procedure and included the fixed effect of group. Results are presented as least squares means (LSM) and 95% confidence intervals. The Tukey-Kramer method of multiple comparisons at the level of statistical significance p<0.05 was used to compare mean values. If a transformation was performed after the analysis, the data were transformed back to the original values and are presented as such in the tables and figures.
In addition to analysing the values of each morphometric indicator individually, multivariate data clustering analyses (CLUSTERS) were also performed in several steps to obtain RBC subpopulations based on the data of the main morphometric indicators. The first analysis performed was the principal components analysis to obtain the characteristic values (eigenvalues) of the morphometric indicators using the Kaiser criterion (λ≥ 1) to determine the number of principal components. The second analysis performed was the grouping of the data using a non-hierarchical analysis (K-means and Euclidean distance) of the principal indicators for each component from the previous analysis using the PROC FASTCLUS module. In determining the number of subpopulations, the output statistics of the FASTCLUS procedure were used. The test for differences in the distribution of RBC subpopulations between the groups was performed using the chi-square test. The diagrams were created with a resolution of 300 dpi using the SGPLOT method.
3. Results
3.1. Indicators of the Complete Blood Count after Blood Exposure at 700 MHz, 2500 MHz and 3500 MHz
Table 3 and Table 4 shows the values of CBC indicators of sow blood of the three independent experimental groups (exposed to 5G at frequency of 700 MHz, 2500 MHz or 3500 MHz) and control groups. The experimental and control samples differed significantly in the mean values for only three CBC indicators: the number of neutrophils was significantly lower (p<0.01) in the experimental group exposed to 5G at 3500 MHz (Table 3), the RBC count was significantly lower (p<0.05) in the experimental group exposed to 5G at 3500 MHz, and MCV was significantly higher (p<0.05) in the experimental group exposed to 5G at 3500 MHz compared with the control group (Table 4).
3.2. Morphometric Indicators of the Size and Shape of Red Blood Cells Depending on the Frequency of 5G Radiofrequency Electromagnetic Radiation
Table 5 shows the values of various morphometric indicators for the size and shape of sow RBCs, in the three independent experimental groups (exposed to 5G RF-EMR at frequency of 700 MHz, 2500 MHz or 3500 MHz) and control groups.
The mean values of the individual morphometric indicators for the size and shape of sow RBCs differed significantly between control and experimental samples exposed to 5G at a frequency of 700 MHz. Thus, the values of maximum RBC radius and elongation were significantly higher (p<0.05), while the values of solidity, form factor and roundness were significantly lower (p<0.001) in the experimental group exposed to 5G at frequency of 700 MHz compared to the control. The mean values of area, outline, minimum radius, convex area, length and contour index were higher in the same experimental group, though these differences were not significant (p>0.05) (Table 5).
The mean values of individual morphometric indicators for RBC size and shape differed significantly between the control and experimental samples exposed to 5G at a frequency of 3500 MHz. A significantly higher value (p<0.001) was recorded for the solidity and form factor, while outline and contour index were significantly lower (p<0.001) in this group compared to the control.
There were no significant differences (p>0.05) in the morphometric indicators for RBC size and shape between the control and experimental samples exposed to 5G at a frequency of 2500 MHz.
3.3. Distribution of Subpopulations of Red Blood Cells in Groups Categorised According to Morphometric Indicators
When analysing the principal components before grouping sow RBCs, three components (factors 1, 2 and 3) were retained (λ≥ 1). All three components together explained 94.2% of the variance in morphometric indicators of sow RBC size and shape (Table 6).
The first factor was RBC size (outline, convex area, area, length, and width), and the most important value for this factor was the outline. The second and third factors focused on RBC shape (roundness, form factor, contour index, elongation, ellipticity, and solidity), and the most significant value for the second factor was roundness, and the most significant value for the third factor was the contour index (Table 6). The final number of RBC subpopulations was determined based on the value of the “aligned box criteria”, which revealed that the two subpopulations are the most optimal, as the “aligned box criteria” value is the highest (Figure 1).
The cluster analysis resulted in two well-defined subpopulations of sow RBCs based on morphometric indicators of size and shape (Table 7). The first RBC subpopulation (ES 1) consisted of smaller and mostly circular, solid and compactly shaped RBCs with smoother boundaries (81.1%), while the second subpopulation (ES 2) consisted of larger RBCs with more irregular boundaries (18.9%).
Figure 2 shows that the experimental group exposed to 5G RF-EMR at 700 MHz had a higher proportion of RBCs in subpopulation ES2 (17.0% vs. 15.9%) and a lower proportion in subpopulation ES1 (83.0% vs. 84.1%), though the differences were not significant (p=0.30). The proportion of subpopulations ES1 and ES2 of sow RBCs between the control and experimental groups exposed to 5G RF-EMR at 2500 MHz was nearly identical (ES1 = 79.7% vs. 79.6%; ES2 = 20.3% vs. 20.4%). The experimental group exposed to 5G RF-EMR at 3500 MHz had a higher proportion of RBCs in subpopulation ES1 (80.5% vs. 79.3%) and a lower proportion in subpopulation ES2 (20.7% vs. 19.5%), though the differences were not significant (p=0.34).
4. Discussion
This study was conducted to analyse the effect of 5G RF-EMR on RBC morphometry and CBC values in sow blood exposed in vitro. Exposure of sow blood to 5G RF-EMR at three frequencies (700 MHz, 2500 MHz or 3500 MHz) had an effect on RBC morphometry and only on certain CBC indicators.
In the available literature, there are no data on the effect of 5G RF-EMR on in vitro exposed human and animal blood samples. The only available data on in vitro exposed human blood samples with RF-EMR, though with 3G and 4G technology, on haematology indicators are the studies by Kumari et al. [9] and Christopher et al. [9,10].
In the present study, the values of CBC indicators in sow blood exposed in vitro to 5G RF-EMR did not change significantly in exposed samples to 700 MHz and 2500 MHz compared to control samples. However, the values of three CBC indicators changed significantly in blood exposed to 3500 MHz compared to the control, so that the number of RBCs and neutrophils was significantly lower and the MCV value was significantly higher in the experimental samples. Since the MCV value is calculated by dividing the haematocrit value by the number of RBCs, i.e., the MCV value, and the number of RBCs is inversely proportional, the MCV value increased due to the lower number of RBCs. Similar results were obtained by Kumari et al. [9]. Namely, Kumari et al. [9] found a significant decrease in the number of RBCs and leukocytes in humans after exposing the blood of volunteers to continuous RF-EMR generated by a mobile phone (Dual-band EGSM at a frequency of 900/1800 MHz) for 1 hour in vitro. However, it should be noted that Kumari et al. [9] exposed human blood samples to different frequencies of mobile phone technologies (4G) and used different methods.
It is currently difficult to say what the real cause of the decrease in erythrocytes and neutrophils is, but based on the known facts, it can be assumed that the cause could be oxidative stress or apoptosis. It is known that in vivo and in vitro exposure to RF-EMR can cause apoptosis of cells with organelles, which is a possible cause of the decrease in neutrophils [38,39]. On the other side, the significantly lower number of RBCs and neutrophils in sow blood exposed at 3500 MHz may also be a consequence of the negative effect of a greater amount of reactive oxygen species (ROS) created by exposure to RF-EMR and the resulting oxidative stress [23,40,41,42]. Furthermore, the results of this study confirm the fact that the effects of RF-EMR on body systems/cells depend on the frequency, field strength and duration of exposure [11,41,42,43].
In a meta-analysis of data from studies in which human and animal cells were exposed in vitro to RF-EMR generated by cell phones, Halgamuge et al. [43] found that exposed human cells, including blood cells, are less susceptible to the adverse effect of RF-EMR compared to rat cells and mice. Certain subtypes of cells also show different susceptibility to the negative non-thermal effects of RF-EMR generated by a cell phone [43]. For example, human spermatozoa and epithelial cells have been reported to be more sensitive to RF-EMR exposure, while lymphocytes show relatively less susceptibility [43]. This shows that there is a major difference in sensitivity to the radiation in question, as well as a difference in sensitivity in the cell subtype. It can therefore be deduced from this study that some RBCs and neutrophil granulocytes from sows were lysed and therefore were significantly more sensitive to 5G RF-EMR compared to other blood cells exposed at 3500 MHz.
However, the findings of Christopher et al. [10]are not in line with the results presented here. Those authors found that exposure of human blood samples for 1 hour to continuous RF-EMR generated by a 4G cell phone at a frequency of 2300 to 2400 MHz resulted in a significant decrease in platelet count and increase in the leukocyte count and haemoglobin concentration. In this study, exposure of pig blood samples to 5G RF-EMF at a frequency of 2500 MHz, an approximate frequency used by Christopher et al. [10], did not lead to a change in the values of the CBC indicators investigated. The research results of Christopher et al. [10] who found an increase in the number of leukocytes and haemoglobin concentration are difficult to explain because leukocytes and RBCs (which contain haemoglobin, which is released into the plasma during lysis) do not divide under in vitro conditions, i.e., in the blood, but the reduced number of platelets could be a consequence of the effect of a greater amount of ROS (oxidative stress) resulting from exposure to RF-EMR, or one of the harmful mechanisms of action of RF-EMR [10,41,42,44].
In this study, 2-hour in vitro exposure of sow blood to continuous 5G RF-EMR was found to have an effect on RBC morphometry. In the available literature, there are no data on the effect of RF-EMR on the RBC morphometric indicators in pigs, and therefore the results of this study are not comparable. In this study, 5G RF-EMR had an effect on RBC morphometry in in vitro exposed blood, though this was frequency-dependent. 5G RF-EMR at 700 MHz had the most detrimental effect on sow RBC morphometry, followed by 3500 MHz, while 2500 MHz had no significant effect. The results obtained can be interpreted according to the fact that the effects of RF-EMR on body systems/cells depend on frequency and other factors [11,45,46,47]. In this study, exposure of sow blood to 5G RF-EMR at 700 MHz led to a significant increase in RBC membrane roughness and a significant change in RBC shape, particularly in elongation, and the effect of 5G RF-EMR at 3500 MHz was manifested in significantly less membrane roughness and a significantly smaller RBC size. Cell membrane roughness is an indicator of the “healthy state” of the cell. It has been proven that changes in lipid composition and asymmetry of the phospholipid bilayer influence RBC shape and cell deformability. Changes in the cytoskeletal proteins that link the phospholipid bilayer and the spectrin network particularly influence the integrity of the RBC membrane. Changes in the shape, mechanical properties or integrity of RBCs have serious effects on cell functionality, regardless of whether they are caused by environmental influences, heredity or disease. The integrity of the cytoskeleton, measured as surface folds, correlates with the functional status of the cell [48,49]. The significantly elongated and irregularly bordered RBCs observed in sows after exposure to 5G RF-EMR at 700 MHz in this study can be compared to similar changes in RBC seen in individuals with type II diabetes and hypercholesterolemia [48,50,51]. This suggests a significant difference in the properties of blood cells between species, particularly under specific disease conditions, as seen here with humans and pigs.
The presence of RBC subpopulations in sows based on their morphometric indicators was also determined in this study after in vitro exposure of blood to 5G RF-EMR at all investigated frequencies using the same statistical methods (computer image analysis based on RBC morphometry and multivariate statistical methods, including principal component analysis and cluster analysis) as in the study by [28]. Namely, 5G RF-EMR of all investigated frequencies had no effect on the proportion of obtained subpopulations of RBCs in in vitro exposed sow blood.
In this study the results obtained by morphometry can be related to one of the mechanisms of cell death such as necrosis, apoptosis, autophagy induced by RF-EMR [20] or eryptosis (apoptosis-like changes) due to external or internal factors [50].
Accordingly, it appears that exposure of sow RBCs to 5G RF-EMR at 3500 MHz was manifested with significantly less RBC membrane roughness and a significantly smaller RBC size as a result of a process similar to apoptosis/programmed cell death, which was reflected also in the significantly lower number of RBCs in exposed sow blood at the same frequency band.
5. Conclusions
Exposure of sow blood to 5G RF-EMR at a frequency of 3500 MHz only affects a change in the values of certain parameters of the CBC. The effect of 5G RF-EMR exposure on the morphometry of sow RBCs in in vitro exposed blood was frequency-dependent. The most detrimental effect on sow RBC morphometry was observed after exposure to 5G RF-EMR at 700 MHz, which resulted in the significant elongation and irregular borders of RBCs. Based on the results, it can be concluded that in vitro exposure of blood to 5G RF-EMR, especially at 700 MHz, may increase membrane roughness and RBC membrane permeability, cause significant changes in sow RBC shape, which warrants further study.
Author Contributions
Conceptualization, N.Ž., S.V., A.S.V., M.V., P.P. and I.Ž.Ž.; methodology, N.Ž., S.V., A.S.V., J.M., J.P.H., I.Ž.Ž.; software, N.Ž., S.V., S.M.T., N.P.M., M.S. and I.Ž.Ž.; investigation N.Ž., S.V., S.M., M.O., M.P. and I.Ž.Ž.; data curation, N.Ž., S.V., P.P. and I.Ž.Ž., writing-original draft preparation N.Ž., S.V., M.V., P.P., S.M., M.P. and I.Ž.Ž.; writing—review and editing, N.Ž., A.S.V., S.M.T., N.P.M., M.S., M.O. and I.Ž.Ž.; validation, A.S.V., K.M. and I.Ž.Ž. All authors have read and agreed to the published version of the manuscript.
Funding
Not applicable.
Institutional Review Board Statement
This research was approved by the Ethics Committee in Veterinary Medicine, Faculty of Veterinary Medicine, University of Zagreb, Zagreb, Croatia (record No.: 640-01/23-17/01; file No.: 251-61-55-23-03), approval date: 16 January 2022.
Informed Consent Statement
Not applicable.
Data Availability Statement
The data presented in this study are available on reasonable request from the corresponding author. The data are not publicly available due to planned research in the future.
Acknowledgments
The authors would like to thank Sead Džubur, Vams Tec d.o.o., Zagreb, Croatia for his help and assistance with SFORM Software. Furthermore, the authors would also like to thank Velimir Berta, Saša Androci and Krešimir Tomašić, veterinarians from the Ludbreg Veterinary Station, Varaždin County, Croatia, for their help in cooperating with the owners of the family farms and collecting blood samples from the sows.
Conflicts of Interest
The authors declare no conflicts of interest.
References
- Saliev, T.; Begimbetova, D.; Masoud, A.-R.; Matkarimov, B. Biological Effects of Non-Ionizing Electromagnetic Fields: Two Sides of a Coin. Prog Biophys Mol Biol 2019, 141, 25–36. [Google Scholar] [CrossRef] [PubMed]
- Hardell, L.; Carlberg, M. Health Risks from Radiofrequency Radiation, Including 5G, Should Be Assessed by Experts with No Conflicts of Interest. Oncol Lett 2020, 20, 1–15. [Google Scholar] [CrossRef] [PubMed]
- Karipidis, K.; Mate, R.; Urban, D.; Tinker, R.; Wood, A. 5G Mobile Networks and Health—a State-of-the-Science Review of the Research into Low-Level RF Fields above 6 GHz. J Expo Sci Environ Epidemiol 2021, 31, 585–605. [Google Scholar] [CrossRef] [PubMed]
- Nguyen, T.H.P.; Pham, V.T.H.; Baulin, V.; Croft, R.J.; Crawford, R.J.; Ivanova, E.P. The Effect of a High Frequency Electromagnetic Field in the Microwave Range on Red Blood Cells. Sci Rep 2017, 7, 10798. [Google Scholar] [CrossRef]
- Jbireal, J.; Elsayed Azab, A.; Ibrahim Elsayed, A.S. Disturbance in Haematological Parameters Induced by Exposure to Electromagnetic Fields. Hematol. Transfus. Int. J. 2018, 6, 242–251. [Google Scholar] [CrossRef]
- Simkó, M.; Mattsson, M.-O. 5G Wireless Communication and Health Effects—A Pragmatic Review Based on Available Studies Regarding 6 to 100 GHz. Int J Environ Res Public Health 2019, 16, 3406. [Google Scholar] [CrossRef]
- Banik, S.; Bandyopadhyay, S.; Ganguly, S. Bioeffects of Microwave––a Brief Review. Bioresour Technol 2003, 87, 155–159. [Google Scholar] [CrossRef]
- Elzanaty, A.; Chiaraviglio, L.; Alouini, M.-S. 5G and EMF Exposure: Misinformation, Open Questions, and Potential Solutions. Front Comms Net 2021, 2, 635–716. [Google Scholar] [CrossRef]
- Kumari, P.; Manjula, S.D.; Gautham, K. In Vitro Study of Effect of Radiation Emitted by Mobile Phone on Osmotic Fragility and Other Blood Parameters. Res J Pharm Biol Chem Sci 2016, 7, 1283–1292. [Google Scholar]
- Christopher, B.; Sheena Mary, Y.; Khandaker, M.U.; Bradley, D.A.; Chew, M.T.; Jojo, P.J. Effects of Mobile Phone Radiation on Certain Hematological Parameters. Radiat Phys Chem 2020, 166, 108443. [Google Scholar] [CrossRef]
- Alghamdi, M.S.; El-Ghazaly, N.A. Effects of Exposure to Electromagnetic Field on of Some Hematological Parameters in Mice. Open J Med Chem 2012, 02, 30–42. [Google Scholar] [CrossRef]
- Abdolmaleki, A.; Sanginabadi, F. : Rajabi A.; Saberi R. The Effect of Electromagnetic Waves Exposure on Blood Parameters. Int J Hematol Oncol Stem Cell Res, 2012, 13–16.
- La Vignera, S.; Condorelli, R.A.; Vicari, E.; D’Agata, R.; Calogero, A.E. Effects of the Exposure to Mobile Phones on Male Reproduction: A Review of the Literature. J Androl 2012, 33, 350–356. [Google Scholar] [CrossRef] [PubMed]
- Ha, B.-Y. Stabilization and Destabilization of Cell Membranes by Multivalent Ions. Phys Rev E 2001, 64, 051902. [Google Scholar] [CrossRef] [PubMed]
- Iorio, R.; Delle Monache, S.; Bennato, F.; Di Bartolomeo, C.; Scrimaglio, R.; Cinque, B.; Colonna, R.C. Involvement of Mitochondrial Activity in Mediating ELF-EMF Stimulatory Effect on Human Sperm Motility. Bioelectromagn 2011, 32, 15–27. [Google Scholar] [CrossRef]
- Koohestanidehaghi, Y.; Khalili, M.A.; Fesahat, F.; Seify, M.; Mangoli, E.; Kalantar, S.M.; Annarita Nottola, S.; Macchiarelli, G.; Grazia Palmerini, M. Detrimental Effects of Radiofrequency Electromagnetic Waves Emitted by Mobile Phones on Morphokinetics, Oxidative Stress, and Apoptosis in Mouse Preimplantation Embryos. Environ Pollut 2023, 336, 122411. [Google Scholar] [CrossRef]
- Nowakowski, R.; Luckham, P.; Winlove, P. Imaging Erythrocytes under Physiological Conditions by Atomic Force Microscopy. Biochim Biophys Acta (BBA) - Biomembr 2001, 1514, 170–176. [Google Scholar] [CrossRef]
- Deuticke, B. Membrane Lipids and Proteins as a Basis of Red Cell Shape and Its Alterations. In Red Cell Membrane Transport in Health and Disease; Bernhardt, I., Ellory, J.C., Eds.; Springer Berlin Heidelberg: Berlin; Heildeberg, 2003; pp. 27–60.
- Betz, T.; Bakowsky, U.; Müller, M.R.; Lehr, C.-M.; Bernhardt, I. Conformational Change of Membrane Proteins Leads to Shape Changes of Red Blood Cells. Bioelectrochem, 2007, 70, 122–126. [Google Scholar] [CrossRef]
- Manna, D.; Ghosh, R. Effect of Radiofrequency Radiation in Cultured Mammalian Cells: A Review. Electromagn Biol Med 2016, 35, 265–301. [Google Scholar] [CrossRef]
- De Mattei, M.; Varani, K.; Masieri, F.F.; Pellati, A.; Ongaro, A.; Fini, M.; Cadossi, R.; Vincenzi, F.; Borea, P.A.; Caruso, A. Adenosine Analogs and Electromagnetic Fields Inhibit Prostaglandin E2 Release in Bovine Synovial Fibroblasts. Osteoarthr Cartil, 2009, 17, 252–262. [Google Scholar] [CrossRef]
- Simko, M. Cell Type Specific Redox Status Is Responsible for Diverse Electromagnetic Field Effects. Curr Med Chem 2007, 14, 1141–1152. [Google Scholar] [CrossRef]
- Adebayo, E.A.; Adeeyo, A.O.; Ogundiran, M.A.; Olabisi, O. Bio-Physical Effects of Radiofrequency Electromagnetic Radiation (RF-EMR) on Blood Parameters, Spermatozoa, Liver, Kidney and Heart of Albino Rats. J King Saud Univ Sci 2019, 31, 813–821. [Google Scholar] [CrossRef]
- Di Loreto, S.; Falone, S.; Caracciolo, V.; Sebastiani, P.; D’Alessandro, A.; Mirabilio, A.; Zimmitti, V.; Amicarelli, F. Fifty Hertz Extremely Low-frequency Magnetic Field Exposure Elicits Redox and Trophic Response in Rat-cortical Neurons. J Cell Physiol 2009, 219, 334–343. [Google Scholar] [CrossRef]
- Alchalabi, A.S.H.; Aklilu, E.; Aziz, A.R.; Malek, F.; Ronald, S.H.; Khan, M.A. Exposure to 1800 MHz GSM- like Radiofrequency Electromagnetic Field Reduces Follicular Development and Overall Fertility of Female Rats. South Asian J Exp Biol 2015, 5, 127–136. [Google Scholar] [CrossRef]
- Poljičak-Milas, N.; Kardum-Skelin, I.; Vuđan, M.; Terezija, T.; Marenjak, S.; Ballarin-Perharić, A.; Milas, Z. Blood Cell Count Analyses and Erythrocyte Morphometry in New Blood Cell Count Analyses and Erythrocyte Morphometry in New Zealand White Rabbits Zealand White Rabbits. Vet Arh 2009, 79, 561–571. [Google Scholar]
- Adili, N.; Melizi, M.; Belabbas, H.; Bala, A.; Merad, S.; Bouali, F.; Bennoune, O. Morphometric Study of Red Blood Cells in Sloughi and German Shepherd Dogs. Bulg J Vet Med 2017, 20, 125–130. [Google Scholar] [CrossRef]
- Žura Žaja, I.; Vince, S.; Poljičak Milas, N.; Lobpreis, I.R.A.; Špoljarić, B.; Shek Vugrovečki, A.; Milinković-Tur, S.; Šimpraga, M.; Pajurin, L.; Mikuš, T.; et al. A New Method of Assessing Sheep Red Blood Cell Types from Their Morphology. Animals 2019, 9, 1130. [Google Scholar] [CrossRef]
- Ahmed, I.; Balestrieri, E.; Tudosa, I.; Lamonaca, F. Morphometric Measurements of Blood Cell. Meas: Sens 2021, 18, 100294. [Google Scholar] [CrossRef]
- Stoll, C.; Wolkers, W.F. Membrane Stability during Biopreservation of Blood Cells. Transfus Med Hemother 2011, 38, 89–97. [Google Scholar] [CrossRef]
- Chornenkyy, Y.; Yamamoto, T.; Hara, H.; Stowell, S.R.; Ghiran, I.; Robson, S.C.; Cooper, D.K.C. Future Prospects for the Clinical Transfusion of Pig Red Blood Cells. Blood Rev 2023, 61, 101113. [Google Scholar] [CrossRef]
- Council of the European Union Council Directive 2008/120/EC of 18 December 2008 laying down minimum standards for the protection of pigs (Codified version). Available online: https://faolex.fao.org/docs/pdf/eur85554.pdf (accessed on 14 November 2024).
- Ministry of Agriculture Regulation on animal health protection measures against infectious and invasive diseases and their financing in 2022 . Available online: https://narodne-novine.nn.hr/clanci/sluzbeni/2021_12_145_2506.html (accessed on 14 November 2024).
- Žura Žaja, I.; Vilić, M.; Perić, P.; Malarić, K.; Milinković Tur, S.; Poljičak Milas, N.; Rimac, V.; Pejaković Hlede, J.; Kunštek, S.; Pećin, M.; et al. Effects of Radiofrequency Electromagnetic Radiation with a Focus on Haematology Parameters. Vet stanica 2024, 56, 375–387. [Google Scholar] [CrossRef]
- Jurica, K.; Brčić Karačonji, I.; Kopjar, N.; Shek-Vugrovečki, A.; Cikač, T.; Benković, V. The Effects of Strawberry Tree Water Leaf Extract, Arbutin and Hydroquinone on Haematological Parameters and Levels of Primary DNA Damage in White Blood Cells of Rats. J Ethnopharmacol 2018, 215, 83–90. [Google Scholar] [CrossRef] [PubMed]
- Yinhui, P.; Hui, G.; Lin, L.; Xin, A.; Qinyou, T. Effect of Cell Phone Radiation on Neutrophil of Mice. Int J Radiat Biol 2019, 95, 1178–1184. [Google Scholar] [CrossRef] [PubMed]
- Li, D.-Y.; Song, J.-D.; Liang, Z.-Y.; Oskouei, K.; Xiao, X.-Q.; Hou, W.-Z.; Li, J.-T.; Yang, Y.-S.; Wang, M.-L.; Murbach, M. Apoptotic Effect of 1800 MHz Electromagnetic Radiation on NIH/3T3 Cells. Int J Environ Res Public Health 2020, 17, 819. [Google Scholar] [CrossRef] [PubMed]
- Kazemi, E.; Mortazavi S. M., J.; Alighanbari, A.; Sharifzadeh, S.; Ranjbaran, R.; Mostafavipour, Z.; Zal, F.; Haghani, M. Effect of 900 MHz Electromagnetic Radiation on the Induction of ROS in human peripheral blood mononuclear cells. J Biomed Phys Eng 2015, 5, 105–114. [Google Scholar]
- Masoumi, A.; Karbalaei, N.; Mortazavi, S.M.J.; Shabani, M. Radiofrequency Radiation Emitted from Wi-Fi (2.4 GHz) Causes Impaired Insulin Secretion and Increased Oxidative Stress in Rat Pancreatic Islets. Int J Radiat Biol 2018, 94, 850–857. [Google Scholar] [CrossRef]
- Zosangzuali, M.; Lalremruati, M.; Lalmuansangi, C.; Nghakliana, F.; Pachuau, L.; Bandara, P. ; Zothan Siama Effects of Radiofrequency Electromagnetic Radiation Emitted from a Mobile Phone Base Station on the Redox Homeostasis in Different Organs of Swiss Albino Mice. Electromagn Biol Med 2021, 40, 393–407. [Google Scholar] [CrossRef]
- Challis, L.J. Mechanisms for Interaction between RF Fields and Biological Tissue. Bioelectromagnetics 2005, 26, S98–S106. [Google Scholar] [CrossRef]
- Hu, C.; Zuo, H.; Li, Y. Effects of Radiofrequency Electromagnetic Radiation on Neurotransmitters in the Brain. Front Public Health 2021, 9. [Google Scholar] [CrossRef]
- Karipidis, K.; Brzozek, C.; Bhatt, C.R.; Loughran, S.; Wood, A. What Evidence Exists on the Impact of Anthropogenic Radiofrequency Electromagnetic Fields on Animals and Plants in the Environment? A Systematic Map Protocol. Environ Evid 2021, 10, 39. [Google Scholar] [CrossRef]
- Halgamuge, M.N.; Skafidas, E.; Davis, D. A Meta-Analysis of in Vitro Exposures to Weak Radiofrequency Radiation Exposure from Mobile Phones (1990–2015). Environ Res 2020, 184, 109227. [Google Scholar] [CrossRef]
- Kazemi, E.; Mortazavi, S.M.J.; Ali-Ghanbari, A.; Sharifzadeh, S.; Ranjbaran, R.; Mostafavi-Pour, Z.; Zal, F.; Haghani, M. Effect of 900 MHz Electromagnetic Radiation on the Induction of ROS in Human Peripheral Blood Mononuclear Cells. J Biomed Phys Eng 2015, 5, 105–114. [Google Scholar] [PubMed]
- Buys, A. V; Van Rooy, M.-J.; Soma, P.; Van Papendorp, D.; Lipinski, B.; Pretorius, E. Changes in Red Blood Cell Membrane Structure in Type 2 Diabetes: A Scanning Electron and Atomic Force Microscopy Study. Cardiovasc Diabetol 2013, 12, 25. [Google Scholar] [CrossRef] [PubMed]
- Geekiyanage, N.; Sauret, E.; Saha, S.; Flower, R.; Gu, Y. Modelling of Red Blood Cell Morphological and Deformability Changes during In-Vitro Storage. Appl Sci, 2020, 10, 3209. [Google Scholar] [CrossRef]
- Cooper, R.A.; Arner, E.C.; Wiley, J.S.; Shattil, S.J. Modification of Red Cell Membrane Structure by Cholesterol-Rich Lipid Dispersions. A Model for the Primary Spur Cell Defect. J Clin Invest 1975, 55, 115–126. [Google Scholar] [CrossRef]
- Strijkova-Kenderova, V.; Todinova, S.; Andreeva, T.; Bogdanova, D.; Langari, A.; Danailova, A.; Krumova, S.; Zlatareva, E.; Kalaydzhiev, N.; Milanov, I.; et al. Morphometry and Stiffness of Red Blood Cells—Signatures of Neurodegenerative Diseases and Aging. Int J Mol Sci 2021, 23, 227. [Google Scholar] [CrossRef]
- Alghareeb, S.A.; Alfhili, M.A.; Fatima, S. Molecular Mechanisms and Pathophysiological Significance of Eryptosis. Int J Mol Sci 2023, 24, 5079. [Google Scholar] [CrossRef]
Figure 1.
Optimal number of subpopulations based on the highest value of the aligned box criteria.
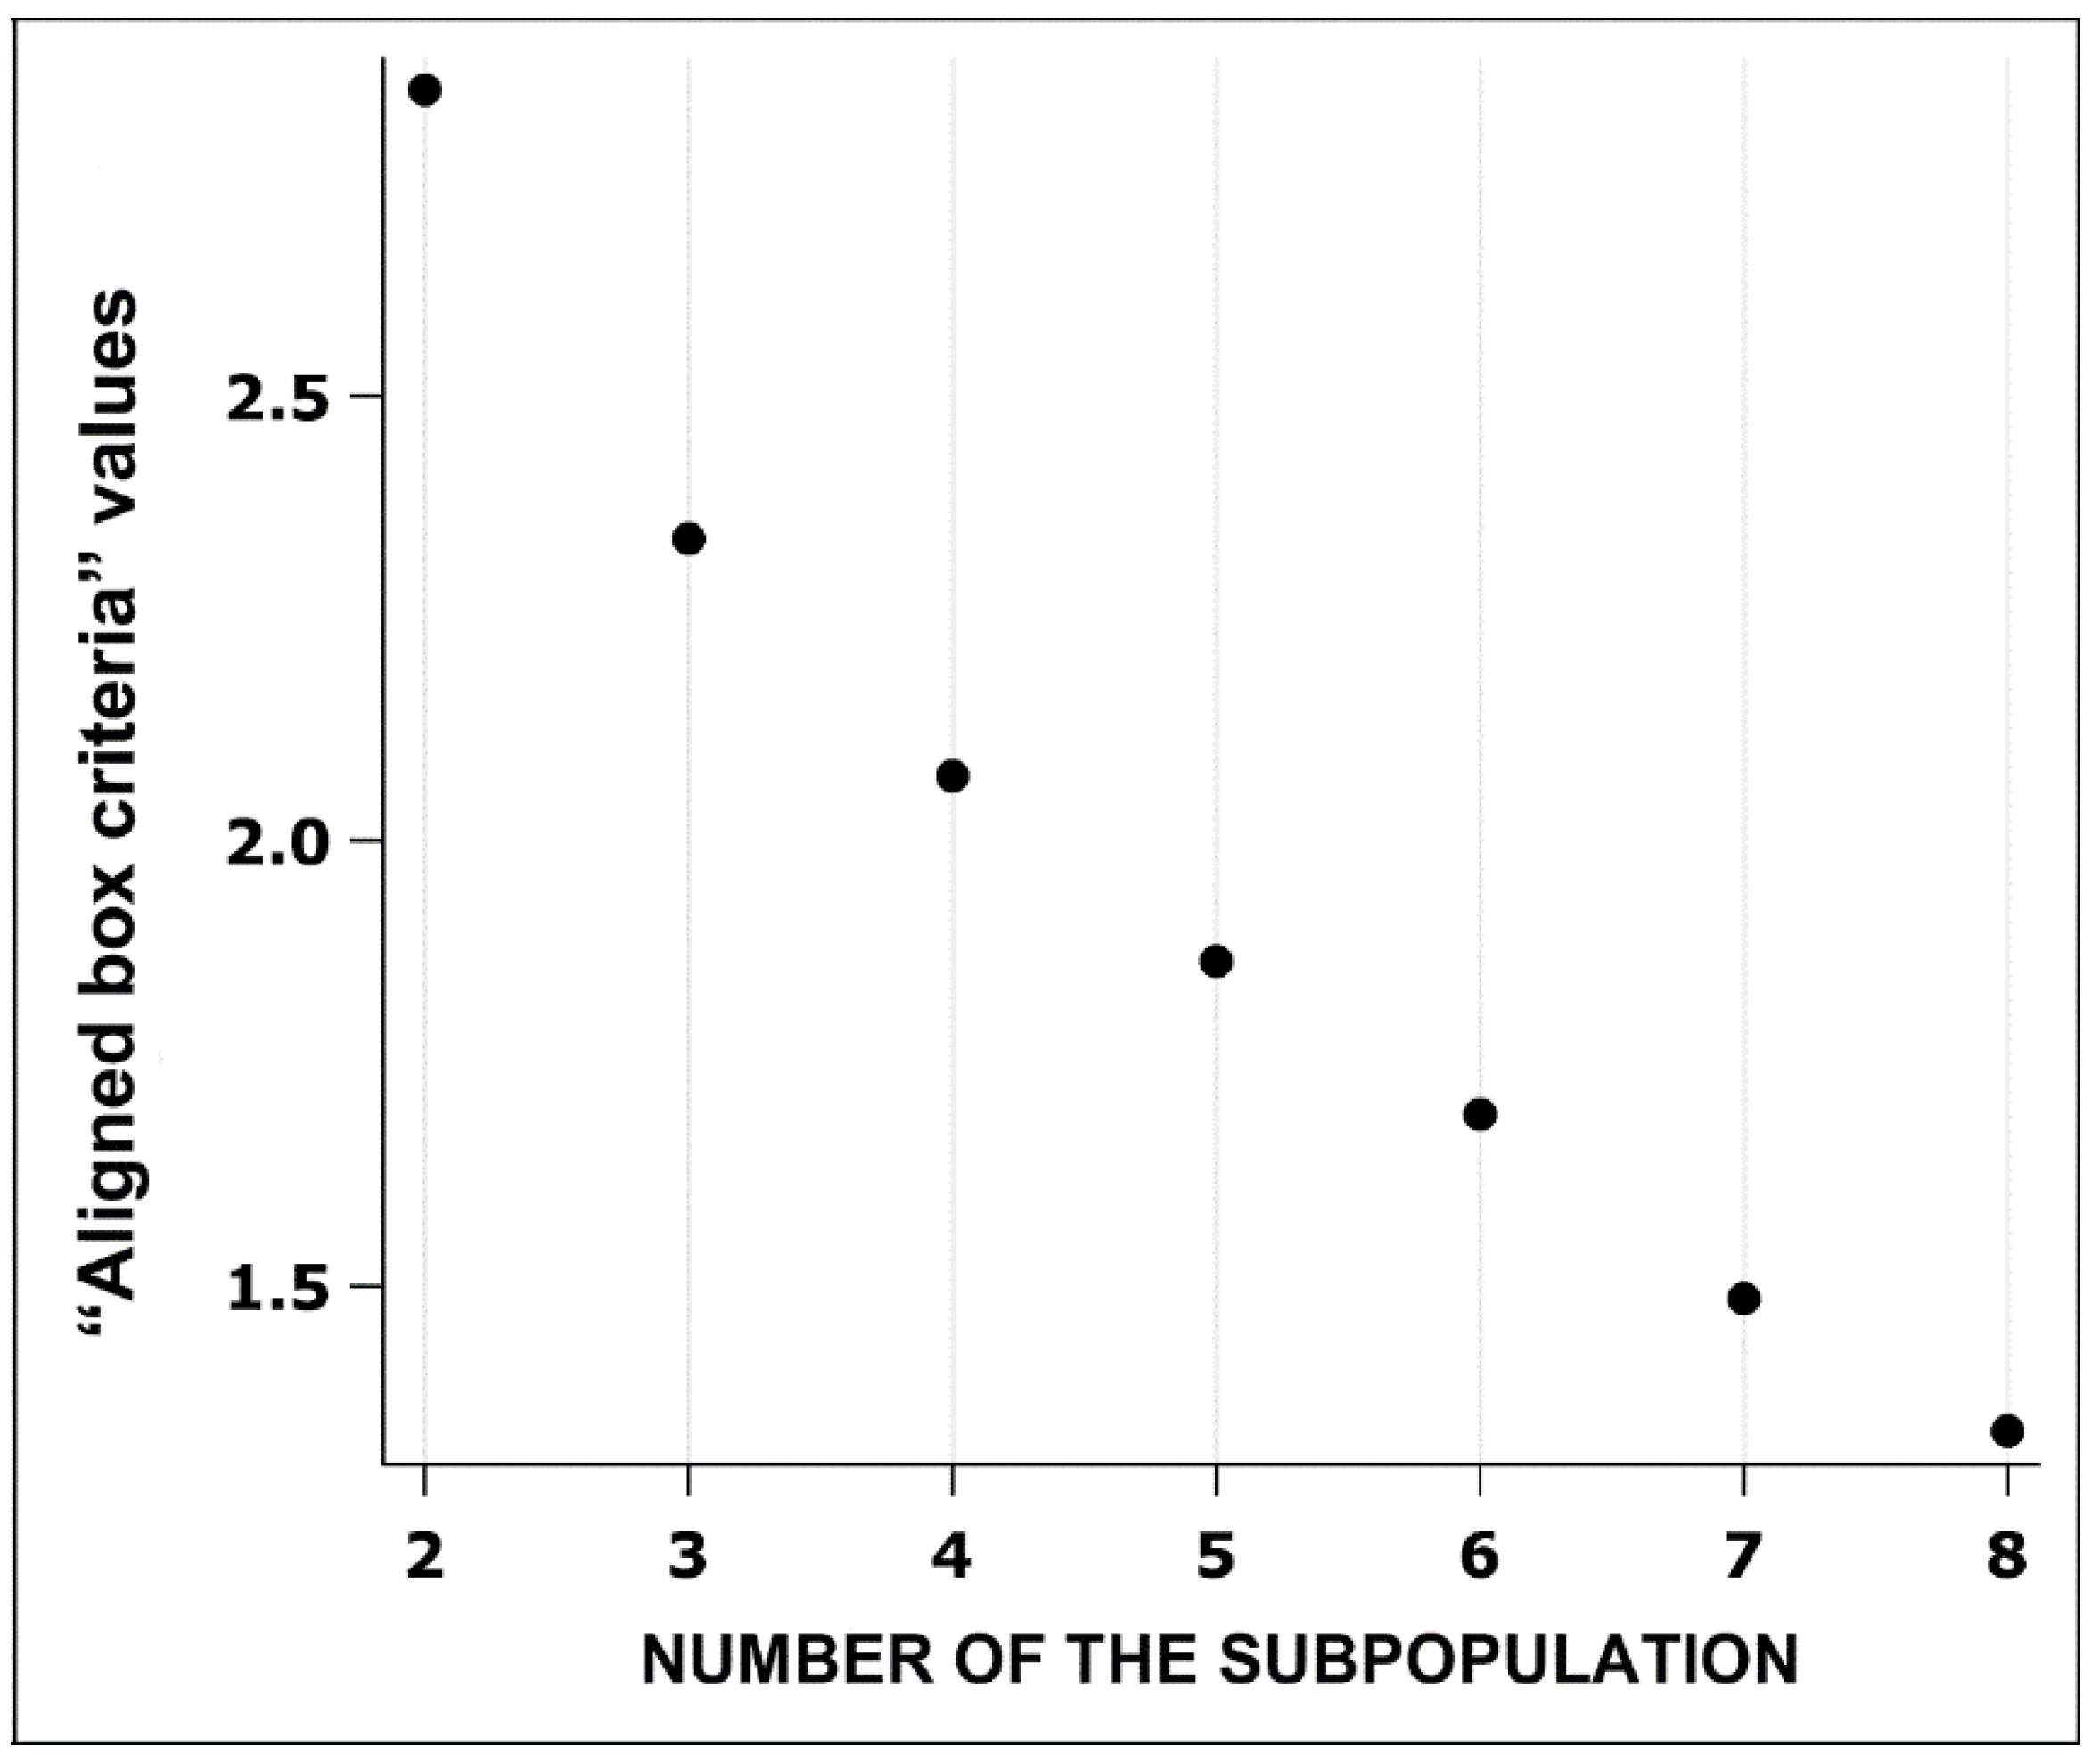
Figure 2.
Proportion of erythrocyte/red blood cell subpopulations of sows between the control and experimental groups depending on the frequency of 5G radiofrequency electromagnetic radiation (700 MHz, 2500 MHz or 3500 MHz). ES 1—erythrocyte/red blood cell subpopulation with smaller and rounder RBCs, and more regular/smoother boundaries; ES 2—erythrocyte/red blood cell subpopulation with larger RBCs and more irregular boundaries.
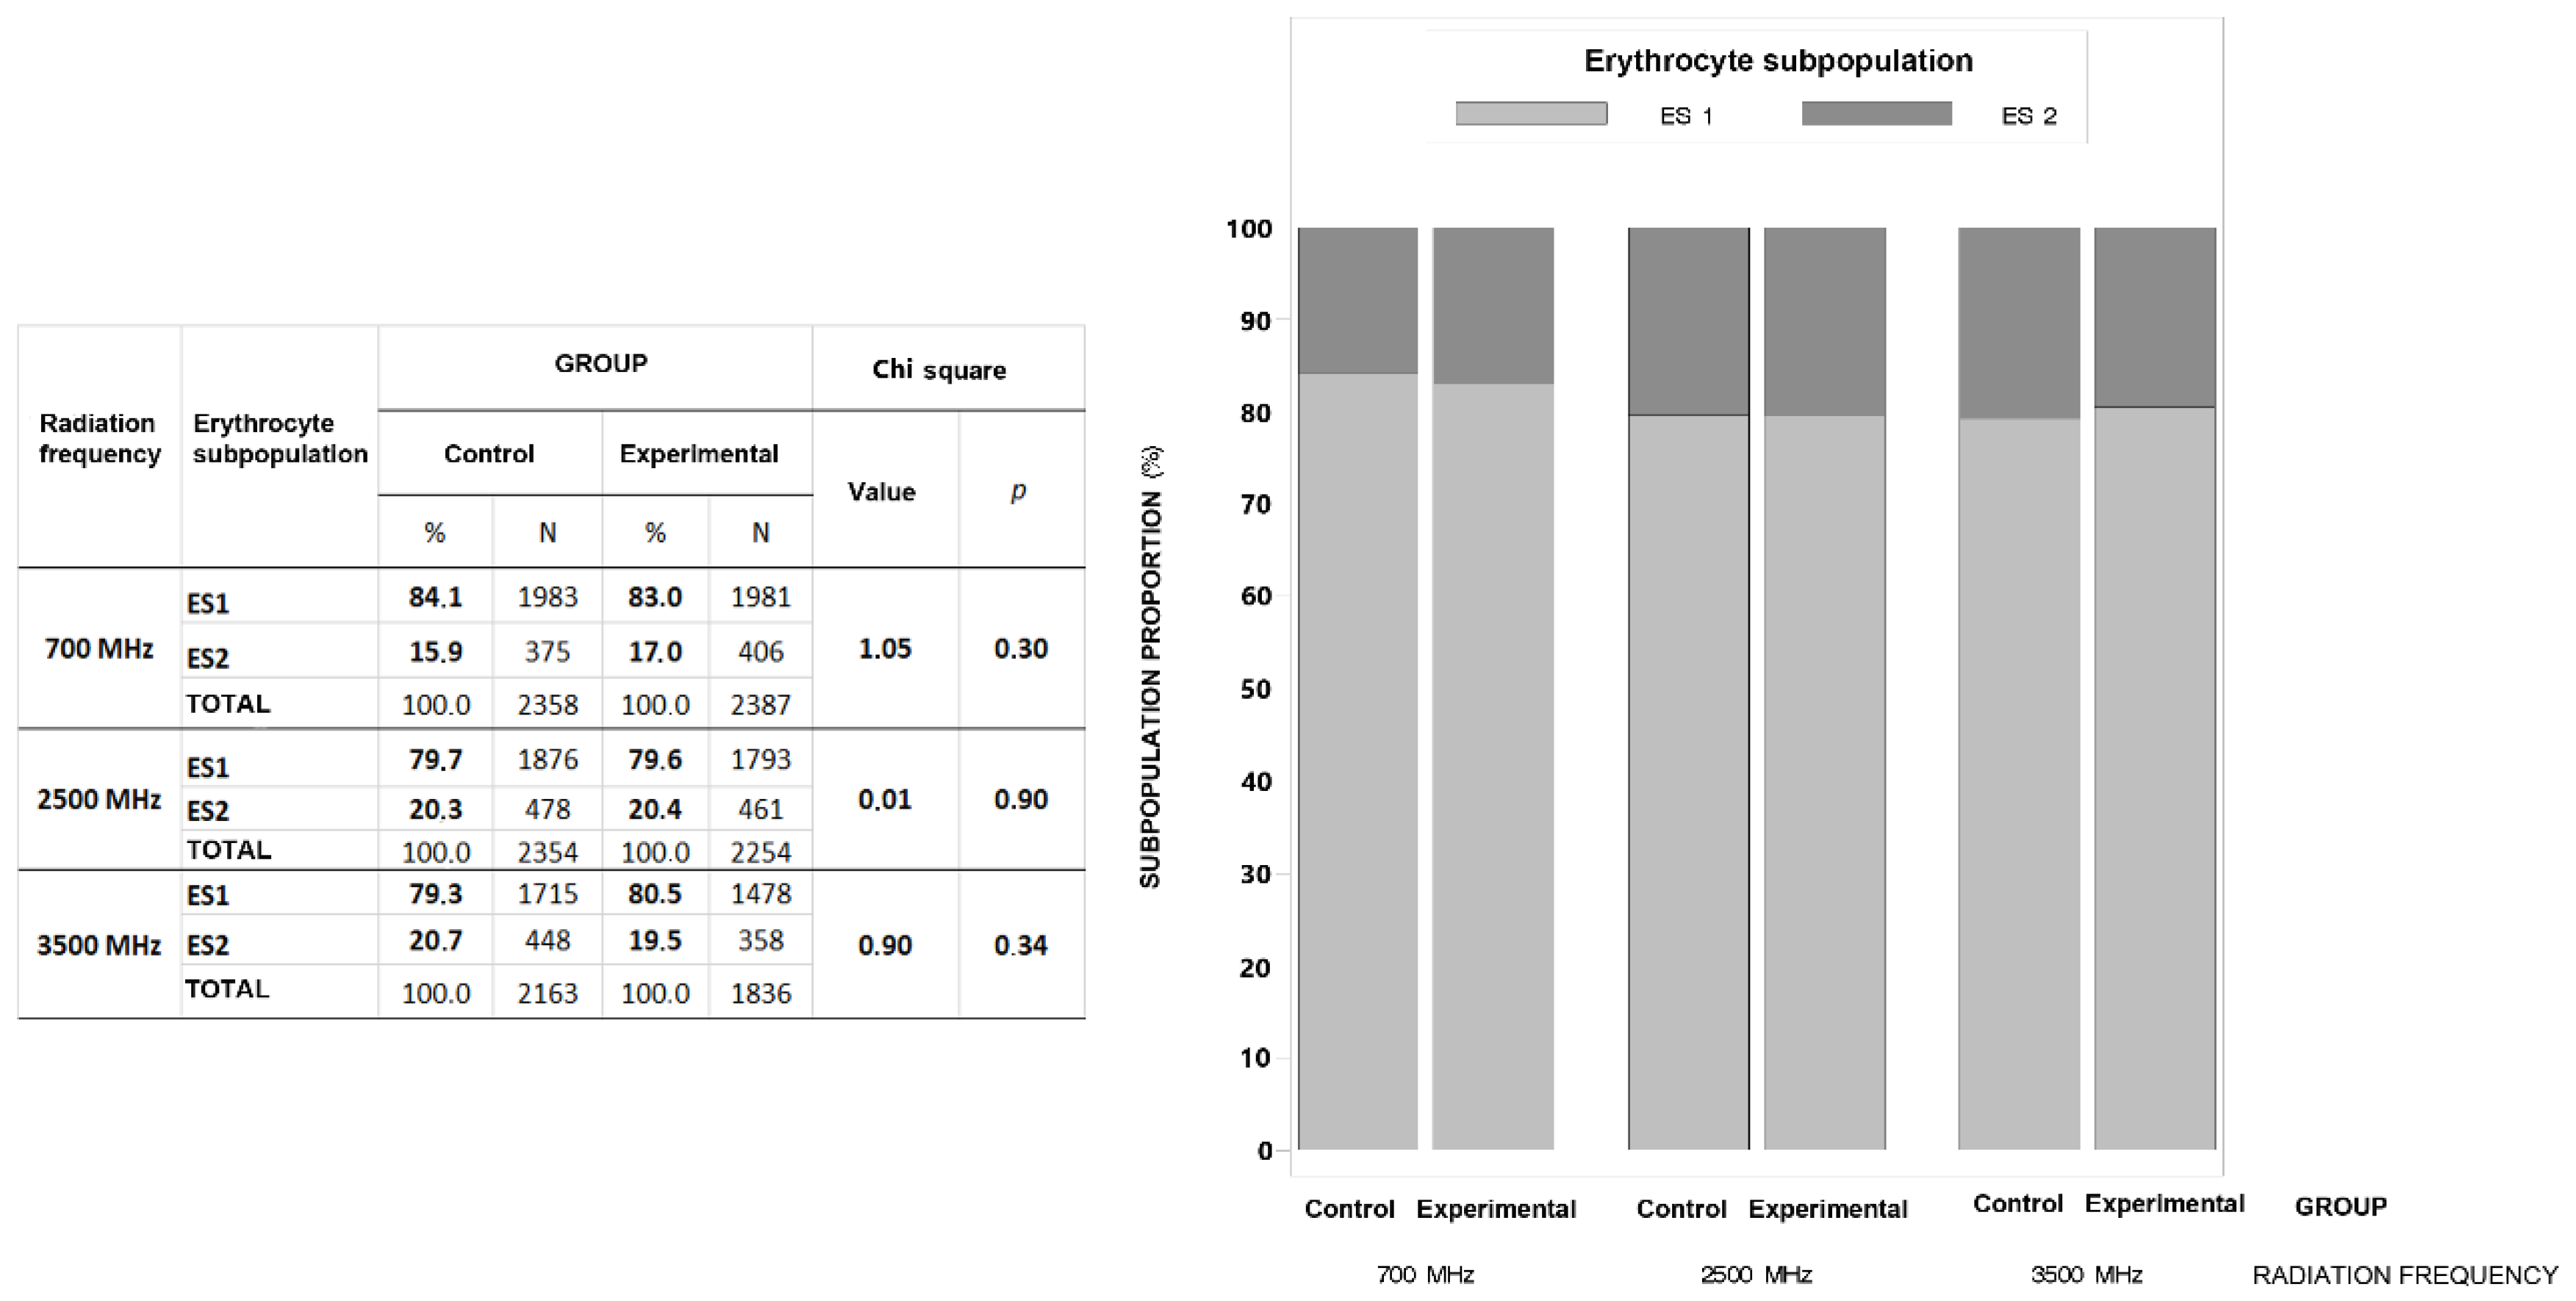

Table 1.
Raw material composition of the complete feed mixture (expressed in dry matter) for the sows used in the study (family farm 1).
Table 1.
Raw material composition of the complete feed mixture (expressed in dry matter) for the sows used in the study (family farm 1).
| Item | Amount |
|---|---|
| Corn | 60% |
| Barley | 20% |
| Bran (wheat) | 15% |
| Sunflower meal | 3.5% |
| Premix * | 1.5% |
* Composition of the vitamin-mineral supplement (per kg mixture): phosphorus 3.0%, calcium 18.0%, sodium 5.5%, magnesium 1.5%, lysine 7.0%, methionine 2.3%, threonine 3.0%, HCl—insoluble ash 4.7%, vitamin A 300,000 IJ/kg, vitamin D 50,000 IJ/kg, vitamin E 4,000 mg, iron (ferrous sulphate) 2.205 mg, iron (glycine iron chelate) 375 mg, iodine 50 mg, copper (copper (II) sulphate) 130 mg, copper (copper bilizinate) 125 mg, manganese (manganese (II) oxide) 1025 mg, manganese (glycinemanganate chelate) 375 mg, zinc (zinc oxide) 1675 mg, zinc (zinc bilizinate) 625 mg, selenium (sodium selenite) 10.5 mg, Selen (selenomethionine) 2 mg (natural pig ZL 70, Schaumann Agri Austria GmbH&Co. KG, Brunn am Gebirge, Austria).
Table 2.
Raw material composition of the complete feed mixture (expressed in dry matter) for the sows used in the study (family farm 2).
Table 2.
Raw material composition of the complete feed mixture (expressed in dry matter) for the sows used in the study (family farm 2).
| Item | Amount |
|---|---|
| Corn | 70% |
| Barley | 16% |
| Bran (wheat) | 6% |
| Sunflower meal | 7% |
| Premix * | 1% |
* Composition of the vitamin-mineral supplement (per kg mixture): phosphorus 3.5%, calcium 20.5%, sodium 6.5%, magnesium (magnesium oxide) 20 g, lysine 3.0%, methionine 1.5%, threonine 0.5%, vitamin A 400,000 IJ/kg, vitamin D 63,000 IJ/kg, vitamin E 2,000 mg, iron (ferrous sulphate) 7,950 mg, iodine (calcium iodate) 82 mg, copper (copper (II) sulphate) 750 mg, manganese (manganese (II) oxide) 2440 mg, zinc (zinc oxide) 4269 mg, selenium (sodium selenite) 15 mg, sodium chloride (NaCl) 170 g, calcium carbonate (CaCO3) 435 g, phosphorus (monopotassium phosphate) 180 g (Supramin Z3/T—3%, Likra Tierenährung GmbH, Linz, Austria).
Table 3.
Differential blood count and leukogram indicators in sows. Mean values and 95% confidence interval of three independent experimental groups (in each group 16 samples were exposed to 5G RF-EMR at frequency of 700 MHz, 2500 MHz or 3500 MHz) and the control group.
Table 3.
Differential blood count and leukogram indicators in sows. Mean values and 95% confidence interval of three independent experimental groups (in each group 16 samples were exposed to 5G RF-EMR at frequency of 700 MHz, 2500 MHz or 3500 MHz) and the control group.
| 5G radiofrequency electromagnetic radiation (5G RF-EMR) frequencies | ||||||
|---|---|---|---|---|---|---|
| 700 MHz | 2500 MHz | 3500 MHz | ||||
| Number of sows | 16 | 16 | 16 | 16 | 16 | 16 |
| Group | Control | Experimental | Control | Experimental | Control | Experimental |
| Neutrophils (%) | 43.75(38.60-49.04) | 43.50 (38.35-48.49) |
45.31 (40.12-50.60) |
45.75 (40.55-51.04) |
48.75 (43.50-54.03) |
42.38 (37.26-47.66) |
| Immature neutrphils (%) | 1.81(1.11-2.94) | 3.06 (2.11-4.43) |
1.25 (0.69-2.24) |
1.69 (1.02-2.79) |
1.94 (1.21-3.09) |
3.35 (2.26-4.65) |
| Basophils (%) | 1.69(0.97-2.92) | 1.31 (0.70-2.45) |
0.75 (0.33-1.71) |
1.19 (0.61-2.29) |
1.06 (0.53-2.12) |
1.75 (1.02-2.99) |
| Eosinophils (%) | 5.19(3.90-6.87) | 3.94 (2.84-5.44) |
4.50 (3.31-6.09) |
4.31 (3.15-5.87) |
3.31 (2.31-4.72) |
4.00 (2.89-5.52) |
| Lymphocytes (%) | 43.75(38.25-49.41) | 44.56 (39.04-50.23) |
42.81 (37.33-48.47) |
42.19 (36.73-47.85) |
40.25 (34.85-45.89) |
41.50 (36.06-47.15) |
| Monocytes (%) | 3.69(2.78-4.88) | 3.94 (2.99-5.16) |
5.13 (4.04-6.49) |
4.81 (3.76-6.14) |
5.19 (4.09-6.56) |
6.13 (4.93-7.59) |
| Total leukocytes (109/L) | 17.33(15.25-19.69) | 17.32 (15.25-19.68) |
17.33 (15.26-19.69) |
17.15 (15.08-19.51) |
17.83 (15.76-20.18) |
17.15 (15.08-19.51) |
| Neutrophils (109/L) | 7.38(6.41-8.51) | 7.25 (6.27-8.37) |
7.73 (6.75-8.85) |
7.69 (6.71-8.81) |
8.49* (7.51-9.60) |
7.21* (6.23-8.33) |
| Basophils (109/L) | 0.31 (0.15-0.48) |
0.25 (0.08-0.41) |
0.15 (0.01-0.32) |
0.24 (0.07-0.40) |
0.19 (0.03-0.35) |
0.31 (0.15-0.47) |
| Eosinophils (109/L) | 0.88(0.65-1.11) | 0.65 (0.42-0.89) |
0.73 (0.50-0.97) |
0.72 (0.48-0.95) |
0.61 (0.38-0.84) |
0.66 (0.42-0.89) |
| Lymphocytes (109/L) | 7.84(6.33-9.70) | 8.05 (6.54-9.91) |
7.56 (6.06-9.43) |
7.42 (5.93-9.30) |
7.35 (5.86-9.23) |
7.20 (5.71-9.08) |
| Monocytes (109/L) | 0.61(0.41-0.84) | 0.65 (0.45-0.88) |
0.89 (0.69-1.12) |
0.80 (0.60-1.03) |
0.92 (0.72-1.15) |
1.05 (0.85-1.28) |
Table 4.
Erythrogram and leukogram indicators in sows. Mean values and 95% confidence interval of three independent experimental groups (in each group 16 samples were exposed to 5G RF-EMR at frequency of 700 MHz, 2500 MHz or 3500 MHz) and the control group.
Table 4.
Erythrogram and leukogram indicators in sows. Mean values and 95% confidence interval of three independent experimental groups (in each group 16 samples were exposed to 5G RF-EMR at frequency of 700 MHz, 2500 MHz or 3500 MHz) and the control group.
| 5G radiofrequency electromagnetic radiation (5G RF-EMR) frequencies | ||||||
|---|---|---|---|---|---|---|
| 700 MHz | 2500 MHz | 3500 MHz | ||||
| Number of sows | 16 | 16 | 16 | 16 | 16 | 16 |
| Group | Control | Experimental | Control | Experimental | Control | Experimental |
| Total RBCs (1012/L) | 6.81(6.33-7.32) | 6.76 (6.28-7.27) |
6.74 (6.26-7.25) |
6.80 (6.33-7.31) |
7.02* (6.54-7.53) |
6.77* (6.29-7.28) |
| Haemoglobin (g/L) | 128(123-135) | 127 (122-134) |
126 (120-133) |
127 (122-134) |
126 (130-133) |
127 (121-133) |
| Haematocrit (L/L) | 0.48(0.46-0.50) | 0.48 (0.45-0.50) |
0.49 (0.46-0.51) |
0.49 (0.46-0.51) |
0.51 (0.49-0.53) |
0.49 (0.47-0.52) |
| MCV (fL) | 71.03 (68.32-73.74) |
71.22 (68.51-73.93) |
72.70 (69.99-75.41) |
72.31 (69.60-75.02) |
72.47* (69.76-75.18) |
73.66* (7.95-76.37) |
| MCH (pg) | 19.24(18.61-19.84) | 19.20 (18.57-19.80) |
19.07 (18.44-19.67) |
19.05 (18.42-19.64) |
19.08 (18.45-19.67) |
19.00 (18.37-19.60) |
| MCHC (g/L) | 267(263-272) | 264 (259-269) |
259 (254-264) |
262 (257-266) |
257 (252-261) |
256 (252-261) |
| RDW (%) | 18.52 (17.88-19.18) |
18.47 (17.83-19.12) |
18.69 (18.05-19.35) |
18.62 (17.98-19.27) |
18.86 (18.21-19.52) |
18.90 (18.26-19.56) |
| Platelets (109/L) | 250(191-327) | 255 (196-332) |
249 (190-326) |
253 (194-330) |
273 (213-349) |
284 (224-360) |
| PCT (%) | 0.003(0.002-0.003) | 0.003 (0.002-0.003) |
0.003 (0.002-0.003) |
0.003 (0.002-0.003) |
0.003 (0.002-0.003) |
0.003 (0.002-0.004) |
| MPV (fL) | 10.25(9.68-10.81) | 10.50 (9.93-11.07) |
10.52 (9.95-11.09) |
10.42 (9.85-10.99) |
10.08 (9.51-10.65) |
10.24 (9.67-10.81) |
| PDW (%) | 43.93 (42.87-45.00) |
43.61 (42.55-44.68) |
44.03 (42.96-45.09) |
43.85 (42.79-44.92) |
42.37 (41.31-43.43) |
43.07 (42.01-44.14) |
MCV (Mean Cell Volume)—average volume of red blood cells (RBC); MCH (Mean Cell Haemoglobin)—average haemoglobin concentration in RBCs; MCHC (Mean Cell Haemoglobin Concentration)—average haemoglobin concentration in one litre of RBCs; RDW (Red Blood Cell Distribution Width)—average haemoglobin concentration in one litre of RBCs; RBC Distribution Width (RDW)—distribution of RBCs by volume; PCT (Plateletcrit)—volume fraction of platelets per unit of whole blood; MPV (Mean Platelet Volume)—average volume of platelets in blood; PDW (Platelet Distribution Width)—distribution of platelets by volume. Asterisks indicate statistically significant differences between control and experimental sample groups (values in the same row and adjacent column are statistically significantly different * p<0.05). Note: All indicators in the table are within the physiological range for pigs [36,37].
Table 5.
Morphometric indicators of the size and shape of sow red blood cells. Mean values and 95% confidence interval of three independent experimental groups (in each group 16 samples were exposed to 5G RF-EMR at frequency of 700 MHz, 2500 MHz or 3500 MHz) and the control groups.
Table 5.
Morphometric indicators of the size and shape of sow red blood cells. Mean values and 95% confidence interval of three independent experimental groups (in each group 16 samples were exposed to 5G RF-EMR at frequency of 700 MHz, 2500 MHz or 3500 MHz) and the control groups.
| 5G radiofrequency electromagnetic radiation (5G RF-EMR) frequencies | |||||||
|---|---|---|---|---|---|---|---|
| 700 MHz | 2500 MHz | 3500 MHz | |||||
| Number of sows | 16 | 16 | 16 | 16 | 16 | 16 | |
| Group | Control | Experimental | Control | Experimental | Control | Experimental | |
| Red blood cell size indicators | Area (μm2) | 33.44(33.26-33.64) | 33.62(33.42-33.82) | 33.87(33.67-34.08) | 33.83(33.62-34.04) | 33.84(33.63-34.06) | 33.61(33.39-33.84) |
| Outline (μm) | 23.16(23.05-23.27) | 23.36 (23.25-23.47) |
24.23(24.12-24.35) | 24.30(24.19-24.42) | 24.45**(24.34-24.57) | 24.00**(23.88-24.12) | |
| Minimum radius (μm) | 3.00(2.99-3.01) | 2.99(2.98-3.00) | 2.96(2.95-2.97) | 2.97(2.96-2.98) | 2.97(2.96-2.98) | 2.95 (2.93-2.96) |
|
| Maximum radius (μm) | 3.48*(3.46-3.49) | 3.50*(3.49-3.52) | 3.56(3.55-3.57) | 3.55(3.54-3.57) | 3.57(3.55-3.58) | 3.56(3.54-3.57) | |
| Convex area (μm2) | 33.83(33.62-34.04) | 34.05(33.84-34.26) | 34.40(34.19-34.61) | 34.37(34.15-34.58) | 34.43(34.21-34.65) | 34.14(33.91-34.37) | |
| Length (µm) | 6.82(6.79-6.84) | 6.86(6.83-6.88) | 6.96(6.93-6.98) | 6.94(6.92-6.97) | 6.94(6.92-6.97) | 6.93 (6.91-6.96) |
|
| Width (µm) | 6.28(6.26-6.30) | 6.28(6.26-6.30) | 6.27(6.24-6.29) | 6.27(6.25-6.29) | 6.29(6.27-6.31) | 6.25(6.23-6.27) | |
| Red blood cell shape indicators | Contour index | 4.01(4.00-4.03) | 4.04(4.03-4.05) | 4.17(4.16-4.18) | 4.18(4.17-4.19) | 4.21**(4.20-4.22) | 4.15**(4.13-4.16) |
| Solidity | 0.9884**(0.9880-0.9887) | 0.9875**(0.9872-0.9878) | 0.9848(0.9845-0.9851) | 0.9846(0.9843-0.9850) | 0.9831**(0.9828-0.9835) | 0.9848**(0.9845-0.9852) | |
| Roundness | 0.878**(0.875-0.880) | 0.870**(0.868-0.873) | 0.850(0.847-0.853) | 0.853(0.850-0.855) | 0.847(0.844-0.850) | 0.844(0.841-0.847) | |
| Ellipticity | 1.09(1.08-1.09) | 1.09(1.09-1.10) | 1.11(1.11-1.12) | 1.11(1.11-1.11) | 1.11(1.11-1.11) | 1.11(1.11-1.12) | |
| Elongation | 0.041*(0.039-0.042) | 0.044*(0.042-0.045) | 0.052(0.050-0.053) | 0.051(0.049-0.052) | 0.049(0.048-0.051) | 0.052(0.050-0.053) | |
| Form factor | 0.784**(0.780-0.787) | 0.775**(0.771-0.778) | 0.732(0.729-0.735) | 0.729(0.725-0.732) | 0.722**(0.719-0.726) | 0.740**(0.736-0.743) | |
Ellipticity = length / width; Elongation = (length − width)/(length + width); Solidity = area/convex area; Roundness = (4 x area)/[ π x (maximum radius)2 ]; Form factor = 4π x area/outline2; Contour index = outline/√area. Asterisks indicate statistically significant differences between control and experimental groups (values in the same row and adjacent column are statistically significantly different * p<0.05; ** p<0.001).
Table 6.
Eigenvalues of individual morphometric size and shape indicators of sow red blood cells (RBC) for the three principal components (factors) of the principal component analysis. Three factors (1, 2, 3) with a characteristic root λ≥ 1 were retained—Kaiser’s criterion.
Table 6.
Eigenvalues of individual morphometric size and shape indicators of sow red blood cells (RBC) for the three principal components (factors) of the principal component analysis. Three factors (1, 2, 3) with a characteristic root λ≥ 1 were retained—Kaiser’s criterion.
| Morphometric size and shape indicators of RBC | RBC size | RBC shape | |
|---|---|---|---|
| Factor 1 | Factor 2 | Factor 3 | |
| Outline (µm) | *0.95 | ||
| Convex area (µm2) | 0.92 | ||
| Area (µm2) | 0.90 | ||
| Length (µm) | 0.90 | ||
| Width (µm) | 0.79 | ||
| Roundness | *0.85 | ||
| Form factor | 0.61 | ||
| Contour index | *-0.64 | ||
| Elongation | -0.84 | ||
| Ellipticity | -0.80 | ||
| Solidity | 0.62 | ||
| Characteristic root (λ) and explained variance (%) | 6.33 (48.7) | 3.79 (29.1) | 2.12 (16.4) |
| Cumulative variance (%) | 48.7 | 77.8 | 94.2 |
Ellipticity = length / width; Elongation = (length − width)/(length + width); Solidity = area/convex area; Roundness = (4 x area)/[π x (maximum radius)2]; Form factor = 4π x area/outline2; Contour index = outline/√area. *Asterisks indicate the most important value for each factor (only values greater than 0.60 are shown for each factor).
Table 7.
Red blood cell (RBC) subpopulations based on the most important RBC values for each factor (data are expressed as mean and standard deviation) in sows.
Table 7.
Red blood cell (RBC) subpopulations based on the most important RBC values for each factor (data are expressed as mean and standard deviation) in sows.
| RBC subpopulations | RBC size | ||||||
|---|---|---|---|---|---|---|---|
| N (%) | Outline (µm) | Convex area (µm2) | Area (µm2) | Length (µm) | Width (µm) | ||
| ES 1 | 10,826 (81.1) | 23.0±1.93 | 32.3±3.62 | 31.9±3.57 | 6.72±0.45 | 6.10±0.41 | |
| ES 2 | 2526 (18.9) | 27.5±3.30 | 41.9±3.54 | 41.2±3.31 | 7.66±0.45 | 6.97±0.34 | |
| RBC shape | |||||||
| Roundness | Ellipticity | Elongation | Solidity | Form factor | Contour index | ||
| ES 1 | 10,826 (81.1) | 0.859±0.066 | 1.105±0.102 | 0.048±0.035 | 0.986±0.006 | 0.758±0.070 | 4.08±0.233 |
| ES 2 | 2526 (18.9) | 0.852±0.068 | 1.101±0.082 | 0.046±0.034 | 0.982±0.012 | 0.702±0.114 | 4.28±0.484 |
Ellipticity = length / width; Elongation = (length − width)/(length + width); Solidity = area/convex area; roundness = (4 x area)/[π x (maximum radius)2]; Form factor = 4π x area/outline2; Contour index = outline/√area. ES 1—smaller and rounder RBCs, with more regular/smoother boundaries; ES 2—larger RBCs with more irregular boundaries.
Disclaimer/Publisher’s Note: The statements, opinions and data contained in all publications are solely those of the individual author(s) and contributor(s) and not of MDPI and/or the editor(s). MDPI and/or the editor(s) disclaim responsibility for any injury to people or property resulting from any ideas, methods, instructions or products referred to in the content. |
© 2025 by the authors. Licensee MDPI, Basel, Switzerland. This article is an open access article distributed under the terms and conditions of the Creative Commons Attribution (CC BY) license (http://creativecommons.org/licenses/by/4.0/).
Copyright: This open access article is published under a Creative Commons CC BY 4.0 license, which permit the free download, distribution, and reuse, provided that the author and preprint are cited in any reuse.


