Submitted:
17 February 2025
Posted:
17 February 2025
You are already at the latest version
Abstract
Loss of a city’s agricultural lands due to land use change through urban development is a global problem, as local food production is an essential green infrastructure for intergenerational sustainability. Like many cities, much of Sydney’s rapid urban development occurs on land previously used for food production. Sydney has one of the highest rates of urban growth among Western cities and a planning strategy that marginalises its agricultural productivity. To better understand and advocate for Sydney’s capacity for food production we explore the best available datasets containing agricultural capacity using a critical GIS approach. Employing various spatial-data visualisations to contextualise agricultural production, we examine agricultural capacity in Sydney and comparable regions along the eastern coast of NSW. Through this approach we interrogate the notion that Sydney’s metropolitan landscape is unsuited to agriculture, thereby challenging current development and planning orthodoxy and policy. In doing so we ask the question “what is Sydney’s inherent capacity for agriculture?”. We find that despite current arguments, Sydney is well suited for agriculture and comparable with other coastal regions in the state. While acknowledging the complexities of metropolitan land use dynamics, we argue for better use and promotion of existing agricultural datasets to guide future planning policy and to advance food security in the region and to ensure long term sustainability.
Keywords:
critical GIS
; urban development
; peri-urban agriculture
; land-use change
; green infrastructure
; open data
; local food supply
; food security
; food production
; landscape planning
1. Introduction
Food production in direct proximity to populations—herein urban agriculture [1]—is an essential green infrastructure and vital living system helping underpin intergenerational sustainability, food supply security and regulating life support ecosystem services [2,3,4]. Ongoing loss of peri-urban agricultural landscapes from urban development represents a critical challenge for urban sustainability and metropolitan planning worldwide [5,6,7]. As urban areas increase their population and physical footprints, they regularly encroach on agricultural lands adjacent to, or interspersed, within metropolitan regions [8,9]. Within urban contexts, agricultural land is frequently evaluated using short term perspectives and a view to potential quick financial returns from residential subdivision and associated land uses. Land speculation ahead of residential, industrial and mixed use subdivisions can further trigger a holding pattern causing agricultural land to fall fallow [10] resulting in an accelerated process that strips agricultural capacity from cities. Prioritisation of short-term economic gains over long term sustainability can serve to justify the rezoning of urban agricultural land for urban development [11]. This phenomena, sometimes understood through the lens of "urban growth machine" theory [12,13], posits that various stakeholders, including developers, state and local governments, and consultants, form coalitions to prioritise immediate economic gains, often at the expense of long-term sustainability and the intrinsic value of landuses such as urban agriculture.
If left unchecked, urban economies that inherently rely on global investment, construction and housing development, can become trapped in a pattern of short-term economic activities, generated through property development and supply chains involving significant material use in construction sectors [14,15]. Moreover, globalisation and neo-liberal capital flows further exacerbate this trend, with policymakers catering to related financial economic pressures rather than local sustainable developmental goals [16]. In the urban growth machine model professional consultants generate narratives “across places that can mistakenly be taken as evidence of economic necessity” [12]. Such narratives can promote the conversion of agricultural land to urban uses, undermining the critical role that such land plays in food security and environmental health. [17,18].
In this paper we analyse Sydney within this theoretical context. In doing so we dispute the constructed notion that Sydney’s metropolitan landscape is unsuited to agriculture, thereby challenging current planning orthodoxy. To do this we ask the question “what is Sydney’s inherent capacity for agriculture?”. Our paper seeks to answer this by utilising a Critical Geographic Information Systems (Critical GIS) approach [19], in which we use the best available datasets and present them for quantitative and qualitative evaluation using spatial comparisons, graphs and a range of visual techniques. By considering inherent soil fertility and agricultural capacity, alongside questions of urban governance, we explore how these underappreciated factors interact in order to present a more constructive and balanced narrative around metropolitan agriculture in Sydney and its surrounding coastal regions.
The paper is structured according to four subsequent sections. The Background provides an outline of the history and planning of Sydney with respect to urban agriculture. Methods and Materials outlines the approach to determining boundary areas for Sydney and the six comparison cases, as well as datasets used and analyses completed. The Results visually presents the mapping and data generated, based on seven case regions, the two boundary methods, four datasets, and the visual results. The Discussion critically unpacks implications of our visual results relating to Sydney’s metropolitan planning, sustainability policy and regional identities. The Conclusion summarises the novelty and significance of findings for Sydney, NSW, and more widely. By demonstrating how agriculture can be broadly analysed and compared, we aim to generate discussion on this marginalised system as an integral component of sustainable urban planning and food supply security.
2. Background
Sydney is one of the fastest growing urban regions in the Western world and faces many of the pressures described using the growth machine theory [20,21]. Within the city a combination of rapid urban growth and weak protections for agricultural landuses continues to place extreme pressure on metropolitan agricultural production [22]. Agriculture has been an integral part of Sydney's history, stretching back to Indigenous roots and early colonial days, and continuing throughout the twentieth century [20,23,24,25,26]. It has therefore contributed significantly to the city's success and cultural identity. However, agriculture has also been entangled in a culture of financial speculation and has faced challenges due to tensions with alternative land uses such as housing [20]. While some planners and urban visionaries have portrayed this shift as inevitable [27], it has been forcibly shaped by concrete planning policies and methods that have not prioritised agriculture in the same manner as housing, transportation and a range of other land uses [28]. Consequently, agriculture has not been recognised as a vital "city system" within the planning of the urban future of Sydney [20,29].
Since 1948, nine metropolitan-scale planning strategies have been produced to guide Sydney’s development and all of them have intentionally or inadvertently marginalised agriculture. Zeunert & Freestone published a recent analysis of the nine plans based on their integration of agriculture and found that each planning vision offered urban agriculture “lip service at best, and complete disregard at worst” [29] (p. 247). Other researchers such as Budge [30] have noted the marginalisation and disregard for urban agriculture in specific metropolitan plans; pointing to a range of factors driving the erosion of agriculture including urban growth ‘planned’ on key intensive food production lands [31]; suggestions that conversion of agriculture is necessary and inevitable [32]; highly variable engagement between planning and the agricultural sector [32]; tensions between state and local government perspectives [33]; corruption in political-planning processes involving rezoning of important agricultural lands [34]; and, conflicts between top-down and bottom-up agricultural land protection policies and practices [28].
Planning policy in Sydney has historically favoured developers, with urban development following short-term financial drivers rather than principles of sustainability, resilience, and health [20]. Sydney’s development history is replete with examples of pro-development scandals and biased planning policies [35,36]. Within this context, urban agriculture has been characterised as unviable and of marginal use so much so that planning officials have suggested “there is no place for agriculture in the Sydney region. Agriculture belongs over the Great Dividing Range, and any agricultural land in Sydney is land awaiting higher economic development” [37]. This perspective reflects a broader trend in Sydney, where market-driven determinants have facilitated the conversion of agricultural land to what is deemed ‘higher and better uses’ [30,38]. In this context, land is often viewed as ‘suburbs in waiting’ [32], reinforcing the notion that agricultural spaces are expendable in favour of urban expansion. This phenomenon mirrors prevalent global patterns of embedded power, governance and capital systems that are oriented toward urban property development [39]. The implications of such a planning paradigm are significant, as they not only undermine the potential contributions of urban agriculture to food security and community resilience, but also perpetuate a cycle of unsustainable urban growth.
Sydney’s ninth and most recent metropolitan plan, A Metropolis of Three Cities and its associated district plans were released by the Greater Sydney Commission in 2018 [40,41] (herein GSC, which was recast as the ‘Greater Cities Commission’ in late 2021). Zeunert & Freestone, [29] (p.267) characterised the GSC’s strategy as a “supercharged” neoliberal approach to land use and development, accelerating the trajectories of the eight prior metropolitan plans. The 2018 strategy’s rapid population growth necessitates substantial urban development: 725,000 new dwellings by 2036 [27]. The report claims “little change in [Sydney’s] outward spread” will result [27] (p.31). This is despite specifying that 81% [41] of the earmarked 184,500 dwellings for the ‘Western City District’ will be detached housing [27] (p.62). Recent spatial-mapping of Sydney’s development counters this claim, demonstrating the city’s continued outward spread, with agriculture the primary land use disappearing under urban development [20].
Prior to their release of A Metropolis of Three Cities, the GSC commissioned a study titled Values of the Metropolitan Rural Area of the Greater Sydney Region [17]. This report presented twelve ‘values’ for consideration in Sydney’s metropolitan land use planning, including agriculture, biodiversity; water quality; air quality; mining and extractive industries; scenic landscape values; tourism and recreation; waste management; rural lifestyle; rural towns and villages; European and Aboriginal Heritage; and ‘Other’. The report also divided Greater Sydney into five districts, each examined across: agriculture, biodiversity; water quality; mining and extractive industries; landscapes, tourism; and ‘Other’ values. The study’s agricultural analysis utilised Land and Soil Capability (LSC) and Biophysical Strategic Agricultural Lands (BSAL) datasets (two of the four used in this study) to present its spatial and statistical assessment of Sydney’s inherent soil capacity and agricultural industry. Clarke’s [17] analysis of Sydney evaluates agriculture in relation to short-term economic considerations, utilising the term ‘market’ (e.g. market forces, market value) in economic contexts 35 times. However, similar consideration is not given to the other 11 urban values which include biodiversity, scenic landscape values, tourism and recreation or heritage. This one-eyed planning assessment of agriculture is consistent with the way this system has been treated in consecutive policies and plans.
Our paper therefore addresses this oversight, with regards to metropolitan agriculture, to consider it using a broader, analytic contextual lens.
3. Materials and Methods
In this paper we reflect on how urban agriculture has been diminished by uncritical mainstream Sydney planning establishment and to do this we apply a critical GIS method. Rather than applying spatial mapping practices to reveal a single definitive answer to the question “what is Sydney’s inherent capacity for urban agriculture?” we use critical GIS approaches to expand current siloed thinking to catalyse debate and draw “new lines” and connections, as GIS scholar Wilson might say [42]. Unlike conventional geographic information systems that treat spatial data as objective and neutral, critical GIS recognises input mapping and data as deeply contextual and inherently political processes [43,44]. By interrogating how spatial information is created and represented, critical GIS reveals how conventional mapping techniques can reproduce existing social hierarchies and power structures.
Critical GIS methodologies challenge what Pavlovskaya [19,45] identifies as the problematic "always-assumed alignment of GIS with quantitative research." Instead, it uncovers deeper historical processes, power dynamics, and development patterns that shape contemporary landscapes, while embracing both qualitative and quantitative methods. This hybrid approach transforms maps from passive documents into dynamic tools for understanding historical spatial political relationships, social justice, and community empowerment, ultimately helping researchers and planners develop more equitable and contextually sensitive strategies for spatial development [46]. In our case we make what has been invisible, visible, representing existing data to shape conversations on urban agriculture as an equal and valuable system in our cities.
Our research builds upon Clarke’s [17] 2017 Greater Sydney Commission study which also uses agricultural datasets to assess Sydney’s inherent land capacity for agricultural production. However, unlike Clarke et al we contextualise and compare our study of Sydney with other relevant urban regions along the coast of NSW. We also draw on more diverse datasets and apply a greater range of analyses.
Defining and Questioning Spatial Frameworks: what’s in a boundary?
To analyse a region’s agricultural capacity a bounded spatial area is helpful, and in many respects essential. The boundary area or footprint can have a significant influence on the results of the analysis and provoke alternative insights depending on how it is drawn. In relation to the agricultural landscape and urban definition of Sydney, widely varying boundaries have been used and referred to in the literature [20]. To interrogate this variation, we completed a sieve mapping exercise [47] overlaying and comparing ten historical boundaries that have previously been used to describe the extent of ‘Sydney’ or ‘Sydney Basin’ in agricultural and metropolitan planning literature (Figure 1). These vary in size, by as much as 17.5 times.
Whilst all boundaries have their utility, for our research we select the boundary of 5,340km2 used by Zeunert and Daroy [20] (Figure 2). We employ this for its usefulness in capturing Sydney’s existing agricultural areas and metropolitan municipalities (local government areas) without overreaching into neighbouring urban centres Wollongong and Newcastle (and beyond)—an issue with most boundaries shown in Figure 1. Our selected area and boundary relates to Sydney’s topography, which has been shaped over geological time scales by water catchments, incised river valleys and is bordered by the Pacific Ocean. Although Sydney’s urban form and population has grown considerably since the 1950’s, its metropolitan context and local agricultural capacity remains defined and constrained by prominent geographic barriers of sandstone geology, topography, rivers and coastline, and these are encompassed by Zeunert and Daroy’s boundary [20].
Selecting Neighbouring Agricultural Regions as Comparison Cases
To gain a better understanding of Sydney’s inherent capacity for agriculture, six regions have been selected as comparison cases with Sydney. Together, our seven cases were visualised and analysed with respect to their agricultural capacity. This approach reveals the variation in agricultural capacity along the coastal region of NSW. Selected regions are all within the State of NSW for reasons of dataset availability and consistency. In selecting comparison cases we sought geographic areas with broadly similar characteristics to Sydney. We used four criteria to select the case studies. Our criteria include coastal proximity and climate, presence of distinct local government areas, river(s) within catchment systems, and landforms including gradients permitting agricultural activities.
Based on these criteria we selected the seven regions (Table 1) that between them provide a relatively even sampling of agricultural areas along the eastern seaboard of NSW. Cases span this region from north (near the Queensland border) to south (the Victorian border) and include the Byron; Coffs; Port Macquarie; Lower Hunter; Sydney; Shoalhaven; and Bega agricultural regions (Figure 3).
Approaches to Evaluate the Seven Regions and Their Agricultural Capacity
Drawing on critical GIS theory we completed an exploratory spatial analysis through the application of two distinct footprints. Drawing inspiration from visual analytic landscape architecture approaches, particularly the work of Weller and Bolleter [52], the method superimposes standardised footprints or Areas of Interest (AOI) across different coastal contexts to reveal spatial relationships and patterns that might otherwise remain hidden. The dual-footprint approach, combining what we term method 1 and method 2, enables alternative visualisation and analysis of the datasets, creating opportunities for comparative spatial investigation and reflection.
Method 1 superimposed the Sydney Metropolitan Boundary defined by Zeunert and Daroy [20] (Figure 2) as a repeated unit of analysis, adjusted only for each individual case’s coastline to exclude ocean. Method 2 individually applies the technique used to determine Sydney’s boundary. Namely, it accounts for the nexus of political boundaries of the Local and State Government Areas [51] with local topographic conditions, water catchments and drainage basins.
Rather than pursuing definitive conclusions, this methodology serves as a generative analytical tool that promotes critical engagement with spatial data. By maintaining consistent boundary extents and methods across different case regions our approach facilitates direct comparison of spatial qualities, scale relationships, and morphological characteristics. This comparative framework allows researchers to challenge conventional interpretations of urban form and spatial relationships.
Datasets Used in the Study
Four official agricultural datasets with sufficient spatial coverage were used in this research and these are listed in Table 2 and visualised in Figure 4. These are: Land and Soil Capability (LSC); Inherent Soil Fertility (ISF); Biophysical Strategic Agricultural Land (BSAL) and (draft) State Significant Agricultural Land (SSAL). LSC and ISF classify for the entire spatial extent of metropolitan Sydney and NSW (i.e. polygons providing full state land-area coverage), whereas BSAL and SSAL provide statewide coverage identifying only agriculturally significant land patches (isolated polygons). The SSAL dataset is currently in draft state but useful as a comparative dataset. Datasets that did not provide sufficient coverage were excluded from the study.
Data Processessing and Visual Analyses
Data preparation was completed by clipping the four datasets for the seven cases and the two boundaries for each case in ArcGIS software. This generated forty-two maps (BSAL and SSAL analyses for the two boundary conditions were completed on the same map). The results are tabulated and displayed as vertical bar graphs (total land in km2 for each classification) for all comparison maps and also presented in tables. For the LSC and ISF, the results are also shown as proportions (percentages of each ranking of the total boundary area) in pie charts (%) and these are ranked out of seven (according to the seven cases examined), with 1 being the greatest proportion of land area and 7 the least.
The pie charts’ describing percentages (rather than the total land area) are used to communicate the ratio of land suitable for agriculture in each study region. The vertical bar graphs do not account for boundary variations between the cases, rather, they convey the total land area (km2) in each ranking for an individual region and dataset in isolation. Pie charts are not used for BSAL and SSAL as these datasets consist of one class only. The visual maps and graphs were set out to provide accessible understanding of the distribution and quantity of agricultural lands described within each dataset in relation to the seven regions.
4. Results
Four sets of analyses, one for each agricultural dataset, were completed and these are presented below. The first dataset visualised was the Land and Soil Capability (LSC) and this is shown in Figure 5 (Method 1) and 6 (Method 2) and Table 3 (Method 1) and Table 4 (Method 2).
The second dataset visualised is the ISF: Estimated Inherent Soil Fertility of NSW [54] and this is shown in Figure 7 (Method 1) and 8 (Method 2) and Table 5 (Method 1) and Table 6 (Method 2).
The Biophysical Strategic Agricultural Land (BSAL) results are shown in Figure 9 and Table 7, with both Methods’ areas shown concurrently (Method 1–red, Method 2–blue). Similarly, the State Significant Agricultural Land (SSAL) results are shown in Figure 10 and Table 8.
The final analysis completed is shown in Figure 11, which shows the two highest classifications in LSC (Class 3 and 4) and ISF (Class 5 and Class 4) and the proportions of these in each of the cases. Results are next discussed.
5. Discussion
We next present findings based on our results. Initially, with respect to insights generated through the visualisation of the four NSW Government datasets, and lastly, through a short discussion on the lack of integration of this data into mainstream planning reports and portals. Through visualising the best available datasets related to agricultural capacity in relation to key urban centres along the NSW coast, various patterns are apparent, and we present these as six distinct findings.
Firstly, we can immediately see the precarious nature of quality agriculture land in each context, emphasising a need to appreciate the importance of conserving what is left. Sydney possesses significant agricultural lands and related capacity, even if not presently fully utilised. We aim to present the data so that remnant and unprotected metropolitan, peri-urban and urban agricultural landscapes can form the basis of a new push to conserve, enhance and expand agricultural capacity within Sydney and other urban coastal regions. Researchers such as McDougald [57] suggest there is potential to expand food production within the city of Sydney to provide as much as 15% of required food supply through adapting current marginalised urban spaces such as street verges. However, a much better approach is to conserve and support greater use of existing agricultural lands and their soils within the metropolitan region. Soils which have already been transformed through intense urban landuses are not easily converted back into agricultural lands due to potential contaminations, fragmentation of parcels and unsuitable adjacent landuses [20].
Secondly, wider spatial-data contextualisation and comparison of Sydney with other NSW coastal regions reveals the city’s agricultural capacity, based on all four viable government datasets, is broadly comparable with five regions: Coffs, Port Macquarie, Lower Hunter; Shoalhaven and Bega—and undoubtedly superior to the last two. Most of these regions possess agricultural identity: Coffs (subtropical fruits); Hunter (wine), and Bega (and to a lesser degree Shoalhaven) (dairy products). As an overall appraisal, therefore, the results may be surprising in quantifying Sydney as a comparatively capable agricultural region—and indeed, deeper historical analysis of the city reveals this rich legacy [20,58]. Sydney’s most noteworthy result is its greatest area of Class 4 LSC lands amongst all seven cases—the second highest-ranked agricultural classification east of NSW’s Great Dividing Range. Sydney also has the largest total area of agriculturally-capable land falling within the highest two Land and Soil Capability classifications (Class 3 and 4), albeit only 2.5–8% more than the Byron region, which has considerably more Class-3 lands (19.6–23.1%) and is emphatically the superior region of the seven cases across all four datasets.
Our third finding, resulting from the visualisation for the Land and Soil Capability Land (LSC), is that Class 3 needs to be given much greater emphasis and protection against urban development. Class 3 land is suitable for agriculture and possess few limitations in regard to water erosion, wind erosion, salinity, topsoil acidification, shallow soils/rockiness, soil structure decline, waterlogging and mass movement. While class 3 LSC lands constitute a small total proportion of overall area of each case: Coffs 4.8–7.1%; 7.2–10% for Port Macquarie; Lower Hunter 4.9–4.5%; Shoalhaven 3.4–4.4%; Sydney 2.3%; and Bega 1% they present precious opportunities for agricultural production in proximity to consumer bases. Despite this, areas of Class 3 lands in Sydney, such as in the Hawkesbury and Richmond regions, continue to be lost to agricultural production through rezonings for urban development [20]. This is especially concerning seeing that these agricultural lands are frequently susceptible to flooding, which poses a significant risk for housing and other forms of habitation and urban development. Sydney performs very well in terms of class 4 LSC areas, possessing the highest area of such lands (41.3%).
Our fourth finding is that both correlations and variations exist between the LSC and Inherent Soil Fertility datasets, which is consistent with their data statements [59]. For the ISF dataset, the Byron region unsurprisingly is the clear winner. Sydney does not fare as well in the ISF as the LSC. Other case regions have larger proportions of class 4 (Moderately high) ISF lands, with Sydney ranking fifth (Method 1) and sixth (Method 2). This is clearly evident in the expression of key results in Figure 11. Overall, however, the ISF emphasises the importance of protecting lands in the two highest classes from urban development.
Fifth, the Biophysical Strategic Agricultural Lands and State Significant Agricultural Lands (Figure 9 and Figure 10 and Table 8) show the Byron region containing by far the best agricultural production lands of the seven cases, containing over three times any other case. BSAL and SSAL results for the other six cases are more comparable, ranging between 1–10% of total area. Like the LSC and ISF, BSAL and SSAL lands are crucial for protection against urban development. However, we suggest such datasets might be further developed to take into consideration other types of values beyond the set used. Social or economic values such as proximity to markets and populations might be used to alter outcomes for the strategic agricultural lands. It is worth noting that all four datasets are culturally oriented to broadscale agriculture, cropping, livestock grazing rather than metropolitan contexts and, for example intensive production such as market gardening. They do not necessarily account for the dynamics of metropolitan agriculture, such as how proximity to markets can benefit production potential both increasing and decreasing economic viability of particular lands and practices. Likewise the LSC dataset is noted as “less applicable for high intensity [agricultural] land use”, being “suitable for broadscale assessment of land capability, particularly for assessment of lower intensity, dry-land agricultural land use” [59].
Our sixth finding is related to the lack of consideration of urban agriculture within policy and consultant reports at a state and national level. Clarke’s [17] dismissal of Sydney’s agricultural capacity—largely based on the LSC dataset – can be attributed to a narrow focus on a single urban region and set of financial values. This analysis gave legitimacy for the Greater Sydney Commission to execute their concept of a 3rd city for Sydney, the ‘Western Parkland City’ (WPC). Its 184,500 new dwellings, 81% as detached housing, continue to encroach on the Sydney region’s remnant food production lands [20]. Much of the WPC area is beset by a range of urban growth and human-health habitability challenges including flood prone lands, acid-sulphate soils, poor air quality and a hot climate. The WPC is not currently well serviced by existing or planned transport networks, especially public transport [60,61], equating to heavy private vehicle dependence. This reflects NSW and Sydney urban planning agendas geared to transport- and embodied energy-intensive national and global food systems that eschew metropolitan-scale food production. Despite all the advantages of the area for urban agriculture and the disadvantages for urban habitation, the urban growth machine mentality excludes consideration of more balanced development approaches that retain food production.
Recent official planning efforts regarding Sydney’s agricultural production capacity demonstrate selective data bias, particularly highlighted in the 2018 Sydney Metropolitan Strategy through Clarke et al’s report [17]. This key report [17] fails to adequately contextualise its findings, notably failing to mention the complete absence of Class 1 Land and Soil Capability (LSC) lands throughout NSW and the minimal 1.8% of the entire state classified as Class 2 (with 99.97% of this occurring west of the Great Diving Range and thus disconnected from the vast majority of the State’s population base). When considered in this light the relative value of the Class 3 and 4 LSC lands visualised and presented in this paper are apparent. Consequently, for the vast majority of NSW, and particularly in the eastern seaboard where the majority of the population resides, Class 4 LSC lands emerge as significant agricultural production lands proximate to consumer bases.
Our analysis reveals that Sydney possesses a significant proportion of these Class 4 lands, accounting for 41.3% of the total area, which is markedly higher than other regions such as Lower Hunter (25.4–29.9%), Coffs (15.5–17.6%), Byron (19.2–10.2%), Shoalhaven (11–12.9%), Port Macquarie (11.3–4.2%), and Bega (6.7–1.5%). This indicates that if agriculture is regarded as a culturally valuable practice in the areas east of the Great Dividing Range, Sydney represents a significant region for agricultural production based on its inherent capacity.
The implications of such analyses and findings are critical for future land-use planning and agricultural policy, as they emphasise the importance of recognising the agricultural potential of Sydney in the context of urban development and population density, which if planned carefully, can coexist through prudent medium and high density development models to conserve agricultural landscapes.
6. Conclusion
The global loss of farmland to urban development highlights the need for balanced land-use policies that promote sustainable urban development and preserve agricultural land to ensure food security for future generations. While this is true globally it is particularly true for Sydney where recent development have seen large areas rezoned to mixed use centres, industrial estates and residential development [20,58]. This transition has not been inevitable, but manufactured through Sydney’s growth machine coalition of developers, consultants, state planners and resulting visions and policy. Through our discussion and subsequent analysis we have developed an evidence based counter narrative to this idea. Our findings, from critical GIS approaches, are contrary to the agricultural infertility narrative promulgated in expert and policy reports: Sydney's land is quite capable of supporting agriculture, there is a significant amount of land that can do so, and this reflects a long legacy of the city [20].
In assessing metropolitan Sydney’s inherent capacity for agricultural production we demonstrated how datasets can either provide contextual insights or obscure understanding; as in the case of recent policy documents [17]. Such divergent outcomes are of vital consequence for the way they shape city growth trajectories. We used the same dataset as used in Sydney’s most recent planning documents to draw markedly different conclusions regions for agriculture. While many factors affect agricultural production dynamics—the Clarke [17] report asserts that Sydney’s agricultural lands are of low, marginal or unworthy-of-protection in their agricultural capability. Our contextual analysis of the LSC dataset—the most respected and highest quality NSW Government dataset for agricultural capacity—reveals this notion as false. This makes a crucial difference informing decision-making for long–term metropolitan planning for Australia’s largest city, as well as the agricultural interests of its inhabitants and their local food-supply security. Our research demonstrates the importance of utilising multiple datasets and case comparisons to contextualise datasets to help avoid data bias and inappropriate conclusions [62].
In metropolitan contexts such as Sydney, short-term and narrowly focused economic policies have reduced agricultural capacity and urban sustainability [20,63,64]. We argue that broader economic values and analyses be used to assess metropolitan agriculture as a land use—as with biodiversity conservation, drinking water catchments, resources, infrastructures, heritage elements, scenic qualities, parks and recreation, sports and other land uses—as it contributes cultural, environmental, social and strategic values extending well beyond short-term economic measures.
Author Contributions
Conceptualization, J.Z., S.H. and J.G; methodology, J.Z., S.H and J.G.; software, J.G.; validation, J.Z., S.H. and J.G; formal analysis, J.Z. and J.G.; data curation, J.G.; writing—original draft preparation, J.Z. SH.; writing—review and editing, J.Z, S.H. and JG; visualisation, J.G., J.Z.; supervision, J.Z., funding acquisition, J.Z.. All authors have read and agreed to the published version of the manuscript.
Funding
This research is an offshoot of various related funded projects from the UNSW School of Built Environment, UNSW Scientia Program, and an Australian Research Council DECRA project DE200100529.
Acknowledgements
With thanks to Stephanie Stankiewicz for help on the wider research associated with this project and specifically for Figure 1. We also acknowledge and thank Dr Sara Shirowzhan for her review of an earlier version of the paper. We note that Quillbot software was used by Hawken to proof read selected sections of the paper as permitted by the journal guidelines.
Conflicts of Interest
The authors declare no conflict of interest.
References
- Zeunert, J. Dimensions of Urban Agriculture. In Routledge Handbook of Landscape and Food; Zeunert, J., Waterman, T., Eds.; London: Routledge, 2018; pp. 160–184. [Google Scholar]
- Langemeyer, J.; Madrid-Lopez, C.; Mendoza Beltran, A.; Villalba Mendez, G. Urban Agriculture — A Necessary Pathway towards Urban Resilience and Global Sustainability? Landsc. Urban Plan. 2021, 210, 104055. [Google Scholar] [CrossRef]
- Morris, R.; Davis, S.; Grelet, G.-A.; Gregorini, P. Agroecology for the City—Spatialising ES-Based Design in Peri-Urban Contexts. Land 2024, 13, 1589. [Google Scholar] [CrossRef]
- Hawken, S.; Rahmat, H.; Sepasgozar, S.M.; Zhang, K. The SDGs, Ecosystem Services and Cities: A Network Analysis of Current Research Innovation for Implementing Urban Sustainability. Sustainability 2021, 13, 14057. [Google Scholar] [CrossRef]
- Bren d’Amour, C.; Reitsma, F.; Baiocchi, G.; Barthel, S.; Güneralp, B.; Erb, K.-H.; Haberl, H.; Creutzig, F.; Seto, K.C. Future Urban Land Expansion and Implications for Global Croplands. Proc. Natl. Acad. Sci. 2017, 114, 8939–8944. [Google Scholar] [CrossRef]
- Klusáček, P.; Martinát, S.; Charvátová, K.; Navrátil, J. Transforming the Use of Agricultural Premises under Urbanization Pressures: A Story from a Second-Tier Post-Socialist City. Land 2022, 11, 866. [Google Scholar] [CrossRef]
- Živanović Miljković, J.; Popović, V.; Gajić, A. Land Take Processes and Challenges for Urban Agriculture: A Spatial Analysis for Novi Sad, Serbia. Land 2022, 11, 769. [Google Scholar] [CrossRef]
- Carey, R.; James, S. Zeunert, J., Waterman, T., Eds.; Peri-Urban Agriculture in Australia: Pressure on the Urban Fringe. In Routledge Handbook of Landscape and Food; Routledge: London, UK, 2018; pp. 213–227. [Google Scholar]
- Houston, P. Re-Valuing the Fringe: Some Findings on the Value of Agricultural Production in Australia’s Peri-Urban Regions. Geogr. Res. 2005, 43, 209–223. [Google Scholar] [CrossRef]
- Mason, D.; Knowd, I. The Emergence of Urban Agriculture: Sydney, Australia. Int. J. Agric. Sustain. 8 2010, 1, 62–71. [Google Scholar] [CrossRef]
- Hawken, S.; Isendahl, C.; Strickland, K.; Barthel, S. Towards Intergenerational Neutrality in Urban Planning and Governance: Reflections on Temporality in Sustainability Transitions Research. Urban Stud. 2025, 62, 435–451. [Google Scholar] [CrossRef]
- Molotch, H. The Political Economy of Growth Machines. J. Urban Aff. 1993, 15, 29–53. [Google Scholar] [CrossRef]
- Ley, D. A Regional Growth Ecology, a Great Wall of Capital and a Metropolitan Housing Market. Urban Stud. 2021, 58, 297–315. [Google Scholar] [CrossRef]
- Steinberger, J.; Krausmann, F.; Getzner, M.; Schandl, H.; West, J. Development and Dematerialization: An International Study. Plos One 2013, 8, e70385. [Google Scholar] [CrossRef] [PubMed]
- Cleave, E.; Arku, G. Place Branding and Growth Machines: Implications for Spatial Planning and Urban Development. J. Urban Aff. 2022, 44, 949–966. [Google Scholar] [CrossRef]
- Hellwig, T. Globalization and Perceptions of Policy Maker Competence. Polit. Res. Q. 2007, 60, 146–158. [Google Scholar] [CrossRef]
- Clarke, M. Values of the Metropolitan Rural Area of the Greater Sydney Region, AgEconPlus Consulting for the NSW Department of Planning and Environment and Greater Sydney Commission 2017.
- Kimelberg, S.M. Inside the Growth Machine: Real Estate Professionals on the Perceived Challenges of Urban Development. City Community 2011, 10, 76–99. [Google Scholar] [CrossRef]
- Pavlovskaya, M. Theorizing with GIS: A Tool for Critical Geographies? Environ. Plan. A 2006, 38, 2003–2020. [Google Scholar] [CrossRef]
- Zeunert, J.; Daroy, A. Sydney’s Food Landscapes: Agriculture, Planning, Sustainability; Palgrave Macmillan, 2025; ISBN 978-981-96-0709-9.
- Farrelly, E. Killing Sydney: The fight for a city’s soul; Pan Macmillan: Sydney, 2021. [Google Scholar]
- James, S.; O’Neill, P. Planning for Peri-Urban Agriculture – a Geographically-Specific, Evidence Based Approach from Sydney. Aust. Geogr. 2016, 47, 173–194. [Google Scholar] [CrossRef]
- Gerritsen, R. Australia and the Origins of Agriculture; BAR Publishing: Oxford, England, 2008. [Google Scholar]
- Pascoe, B.; Gammage, B. First Knowledges Country: Future Fire, Future Farming; Thames & Hudson Australia, 2021.
- Gammage, B. The Biggest Estate on Earth: How Aborigines Made Australia; Allen & Unwin: Crows Nest, N.S.W, 2012; ISBN 9781743311325. [Google Scholar]
- Karskens, G. The Colony: A History of Early Sydney; Allen & Unwin: Sydney, 2010. [Google Scholar]
- G.S.C. Greater Sydney Region Plan: A Metropolis of Three Cities : Connecting People; Greater Sydney Commission: Parramatta NSW, 2018; ISBN 978-0-6482729-5-3.
- James, S. Protecting Sydney’s Peri-Urban Agriculture: Moving beyond a Housing/Farming Dichotomy. Geogr. Res. 2014, 52, 377–386. [Google Scholar] [CrossRef]
- Zeunert, J.; Freestone, R. Brisotto, C., Lemes de Oliveira, F., Eds.; From Rural Lands to Agribusiness Precincts: Agriculture in Metropolitan Sydney 1948–2018. In Re-Imagining Resilient Productive Landscapes: Perspectives from Planning History; Cities and Nature; Springer International Publishing: Cham, 2022; ISBN 978-3-030-90445-6. [Google Scholar]
- Budge, T. Is Food a Missing Ingredient in Australia’s Metropolitan Planning Strategies. In Food security in Australia: Challenges and prospects for the future; Farmar-Bowers, Q., Higgins, V., Millar, J., Eds.; Springer: New York, 2013; pp. 367–380. [Google Scholar]
- Malcolm, P.; Fahd, R. Ground Truthing of Sydney Vegetable Industry in 2008; Horticulture Australia Limited, NSW Department of Primary Industries: Sydney, 2009. [Google Scholar]
- Wynne, L.; Ruoso, L.-E.; Cordell, D.; Jacobs, B. Locationally Disadvantaged’: Planning Governmentalities and Peri-Urban Agricultural Futures. Aust. Geogr. 2020, 51, 377–397. [Google Scholar] [CrossRef]
- Lawton, A.; Morrison, N. The Loss of Peri-Urban Agricultural Land and the State-Local Tensions in Managing Its Demise: The Case of Greater Western Sydney, Australia. Land Use Policy 2022, 120, 106265. [Google Scholar] [CrossRef]
- Ihlein, L. A Heritage Vision for Sustainable Housing Goes to ICAC, The Conversation 2014.
- Lucertini, G.; Di Giustino, G. Urban and Peri-Urban Agriculture as a Tool for Food Security and Climate Change Mitigation and Adaptation: The Case of Mestre. Sustainability 2021, 13, 5999. [Google Scholar] [CrossRef]
- Dubbeling, M.; Zeeuw, H. de Urban Agriculture and Climate Change Adaptation: Ensuring Food Security Through Adaptation. In Resilient Cities; Otto-Zimmermann, K., Ed.; Local Sustainability; Springer Netherlands, 2011; pp. 441–449 ISBN 978-94-007-0784-9.
- Mason, D.; Knowd, I. The Emergence of Urban Agriculture: Sydney, Australia. Int. J. Agric. Sustain. 2010, 8, 62–71. [Google Scholar] [CrossRef]
- Buxton, M.; Tieman, G.; Bekessy, S.; Budge, T.; Mercer, D.; Coote, M.; Morcombe, J. Change and Continuity in Peri-Urban Australia, State of the Peri-Urban Regions: A Review of the Literature. RMIT Univ. Melb. 2006. [Google Scholar]
- Sorensen, A. Institutions and Urban Space: Land, Infrastructure, and Governance in the Production of Urban Property. Plan. Theory Pract. 2017, 19, 21–38. [Google Scholar] [CrossRef]
- G.S.C. Greater Sydney Region Plan: A Metropolis of Three Cities; Greater Sydney Commission: NSW Government, 2018.
- G.S.C. Western City District Plan; Greater Sydney Commission: NSW Government, 2018. [Google Scholar]
- Wilson, M.W. New Lines: Critical GIS and the Trouble of the Map. Trans. GIS 2019, 23, 177–179. [Google Scholar] [CrossRef]
- Hawken, S.; Han, H.; Pettit, C. Open Cities | Open Data: Collaborative Cities in the Information Era; Palgrave Macmillan: Singapore, 2020; ISBN 978-981-13-6604-8. [Google Scholar]
- The Iconography of Landscape: Essays on the Symbolic Representation, Design, and Use of Past Environments; Cosgrove, D.E., Daniels, S., Eds.; Cambridge studies in historical geography; Cambridge University Press: Cambridge [England], 1988. ISBN 0-521-32437-8.
- Pavlovskaya, M. Critical GIS as a Tool for Social Transformation. Can. Geogr. Géographies Can. 2018, 62, 40–54. [Google Scholar] [CrossRef]
- Thatcher, J.E.; Imaoka, L.B. The Poverty of GIS Theory: Continuing the Debates around the Political Economy of GISystems. Can. Geogr. Géographies Can. 2018, 62, 27–34. [Google Scholar] [CrossRef]
- McHarg, I. Design with Nature; John Wiley: New York, 1995; ISBN 978-0-471-11460-4. [Google Scholar]
- Geoscience Australia Surface Geology of Sydney Basin, 1:1 000 000 Scale, 2012 Edition 2012.
- UTS Food Maps | Sydney’s Food Futures. Syd. Food Futur. 2025.
- NSW Government County of Cumberland Planning Scheme Presentation Copy with Signatures / | SLNSW Collection Viewer. Available online: https://digital-stream.sl.nsw.gov.au/ie_viewer.php?is_mobile=false&is_rtl=false&dps_dvs=1739496402580~236&dps_pid=IE3744611 (accessed on 14 February 2025).
- Australian Bureau of Statistics Digital Boundary Files. Available online: https://www.abs.gov.au/statistics/standards/australian-statistical-geography-standard-asgs-edition-3/jul2021-jun2026/access-and-downloads/digital-boundary-files (accessed on 14 February 2025).
- Weller, R.; Bolleter, J. Made in Australia: The Future of Australian Cities; UWA Publishing: Perth, 2013; ISBN 978-1-74258-492-8. [Google Scholar]
- Department of Planning, Industry and Environment Land and Soil Capability Mapping for NSW. Available online: https://datasets.seed.nsw.gov.au/dataset/land-and-soil-capability-mapping-for-nsw4bc12 (accessed on 11 February 2025).
- NSW State Government of NSW and NSW Department of Climate Change, Energy, the Environment and Water Estimated Inherent Soil Fertility of NSW - SEED. Available online: https://datasets.seed.nsw.gov.au/dataset/estimated-inherent-soil-fertility-of-nswd793e (accessed on 11 February 2025).
- NSW Department of Planning, Housing and Infrastructure Biophysical Strategic Agricultural Land. Available online: https://datasets.seed.nsw.gov.au/dataset/srlup-salbiophysical (accessed on 11 February 2025).
- NSW Department of Primary Industries Draft State Significant Agricultural Land Map. Available online: https://nswdpi.mysocialpinpoint.com/ssal/map (accessed on 11 February 2025).
- McDougall, R.; Rader, R.; Kristiansen, P. Urban Agriculture Could Provide 15% of Food Supply to Sydney, Australia, Under Expanded Land Use Scenarios. Land Use Policy 2020, 94, 104554. [Google Scholar] [CrossRef]
- Lawton, A.; Morrison, N. The Loss of Peri-Urban Agricultural Land and the State-Local Tensions in Managing Its Demise: The Case of Greater Western Sydney, Australia. Land Use Policy 2022, 120, 106265. [Google Scholar] [CrossRef]
- Squires, H. Agricultural Land Use Mapping Resources in NSW - User’s Guide, NSW Department of Primary Industries, February 2017 Primefact 1538 2017.
- Pinnegar, S.; Randolph, B.; Troy, L. Decoupling Growth From Growth-Dependent Planning Paradigms: Contesting Prevailing Urban Renewal Futures in Sydney, Australia. Urban Policy Res. 2020, 38, 321–337. [Google Scholar] [CrossRef]
- Cowie, C.T.; Ding, D.; Rolfe, M.; Mayne, D.J.; Jalaludin, B.; Bauman, A.; Morgan, G. Neighbourhood Walkability, Road Density and Socio-Economic Status in Sydney, Australia. Environ. Health 2016, 15. [Google Scholar] [CrossRef]
- Zeunert, J. A Multidimensional Sustainability Framework for Landscape Architecture: Are Diverse Outcomes Being Realised in Design Practice. In Routledge Handbook of Urban Landscape Research; Bishop, K., Corkery, L., Eds.; Oxon: Routledge, 2023; pp. 280–295. [Google Scholar]
- Budge, T. Is Food a Missing Ingredient in Australia’s Metropolitan Planning Strategies. In Food Security in Australia: Challenges and Prospects for the Future; Farmar-Bowers, Q., Higgins, V., Millar, J., Eds.; Springer US: Boston, MA, 2013; ISBN 978-1-4614-4484-8. [Google Scholar]
- Cordell, D.; Nelson, J.; Atherton, A.; Gadhoke, P. Who Is Responsible for Ensuring Food Security in NSW? A Brief Review of Risks, Opportunities, and Policies for Creating Resilient Food Systems and Healthy Communities in Greater Sydney.; Institute for Sustainable Futures, University of Technology Sydney: Sydney, 2022. [Google Scholar]
Figure 1.
Varying boundaries termed ‘Sydney’ or ‘Sydney Basin’ in agricultural and planning literature, largest to smallest: Sydney Geological Terrestrial Basin (1) [48]; Sydney Basin Bioregion (2) [49]; 1948 County of Cumberland (3) [50]; 2018 GSC Metro Rural Area (4) [40]; 2018 GSC Region Boundary (5) [40]; 2018 GSC Urban Area (6) [40]; This Research (7) [20]; ABS Greater Capital City Statistical Area (8) [51]; Figure by Stephanie Stankiewicz, Josh Gowers and Joshua Zeunert. Data Sources: Australian and NSW Government and the agencies and authors noted in the caption.
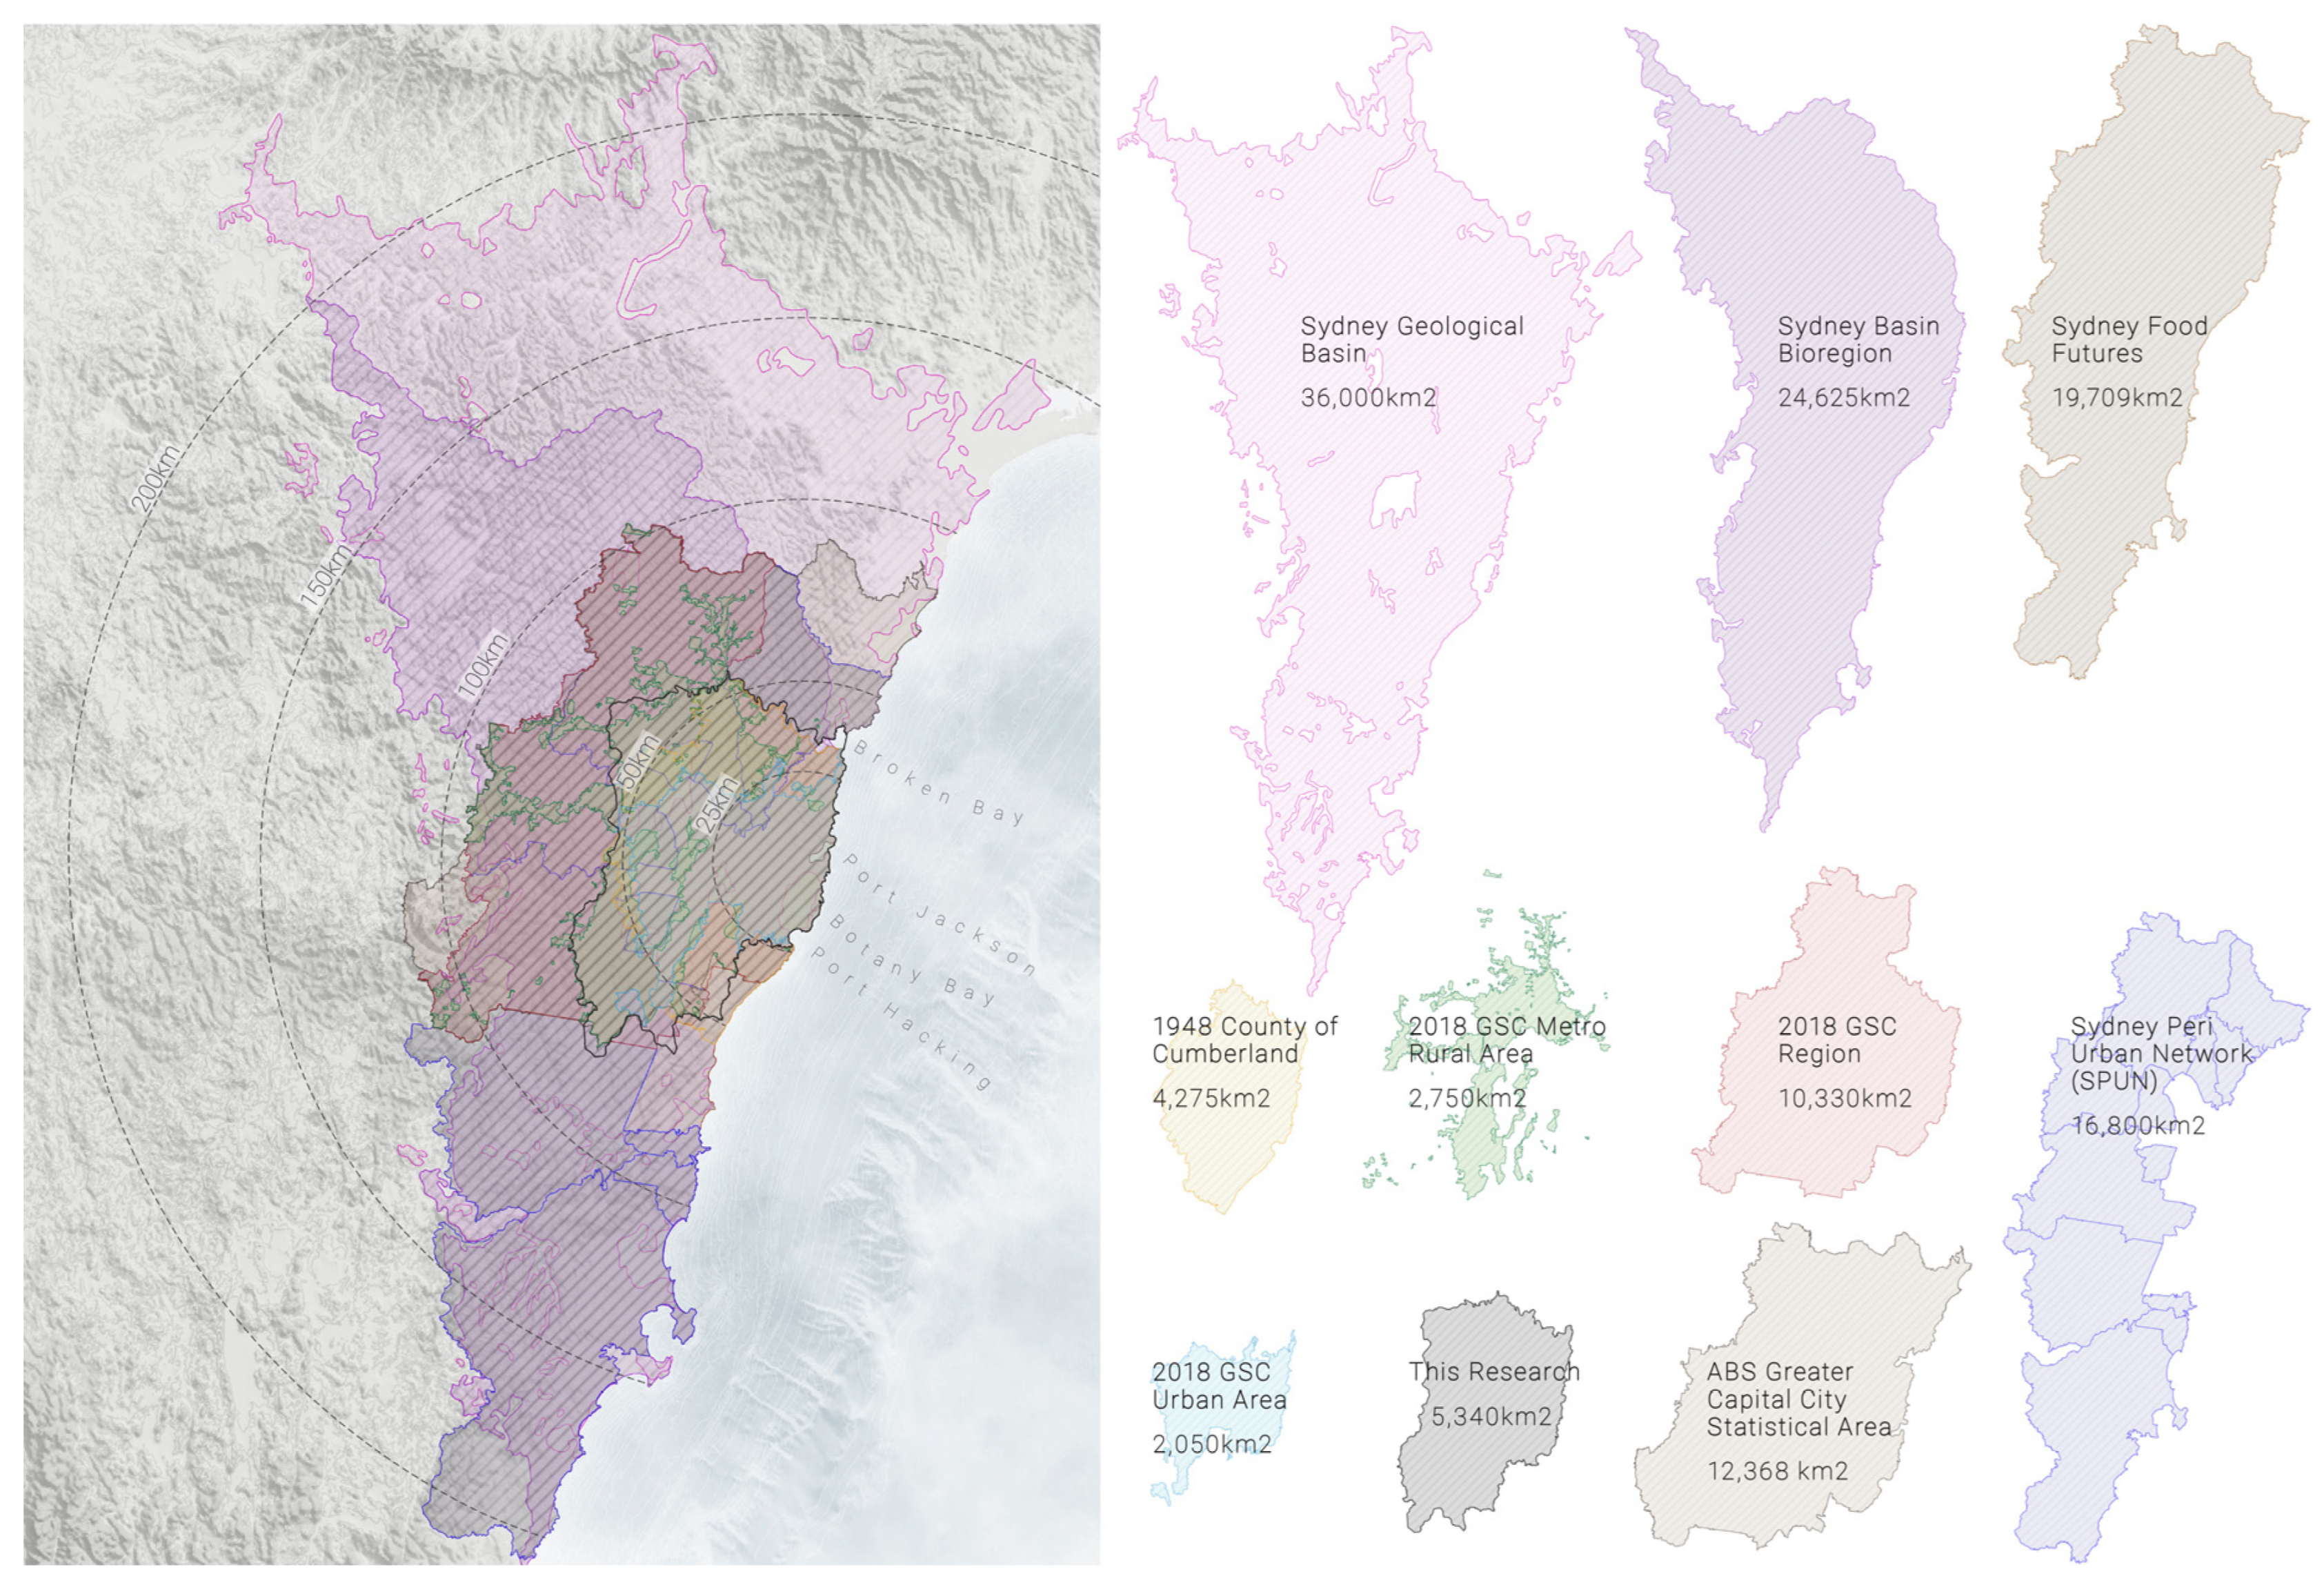
Figure 2.
Sydney’s boundary area of 5,340 square kilometres (in white) used in this study (adapted from Zeunert & Daroy [20]). The wider context (left) shows how Sydney’s ‘basin’ is encircled by topographic and hydrological barriers. This greatly limits where agriculture can be practised in direct proximity to Sydney. Data sources: NSW Foundation Spatial Data Framework: Elevation and Depth Theme, and the Australian Bathymetry and Topography Grid, 2009. Figure by: Josh Gowers and Joshua Zeunert.
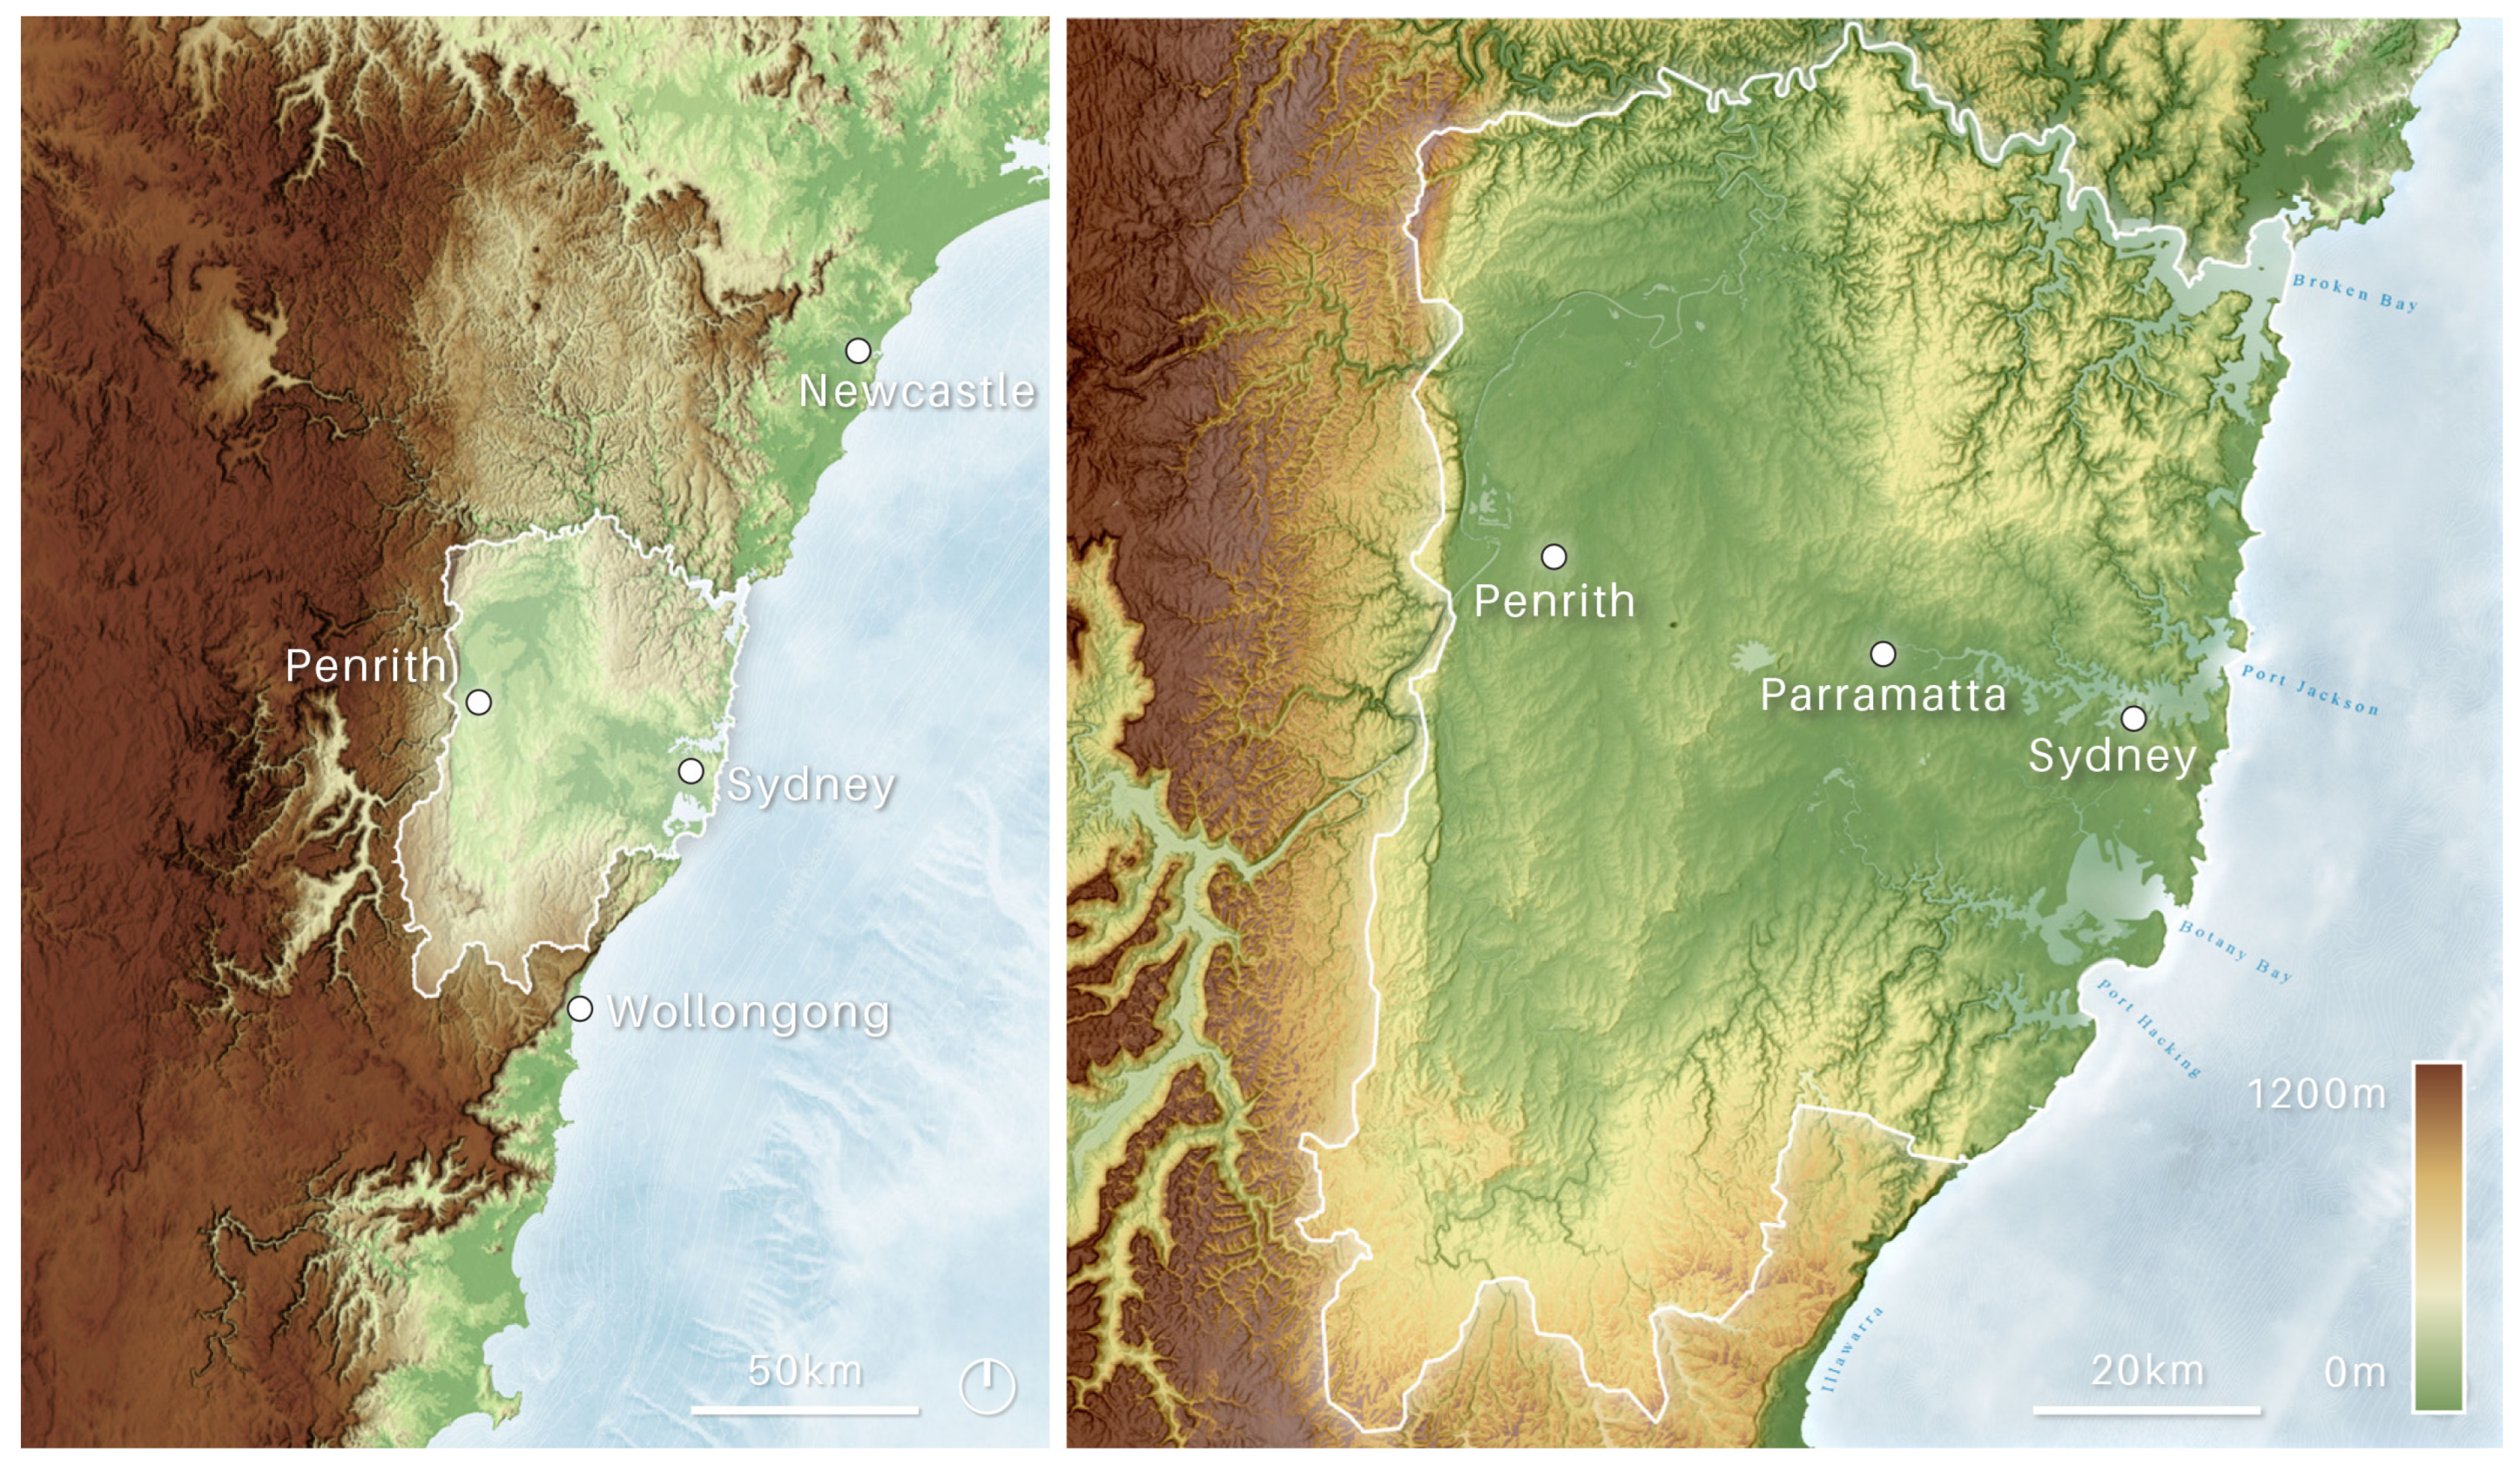
Figure 3.
Sydney and six comparison sites. Method 1, left, applies Sydney’s boundary area to each site, adjusting only for the coastline. Method 2, right, utilises an identical approach for all cases using local government areas, topographic and water catchment analysis and state boundaries. Figure by Josh Gowers and Joshua Zeunert.
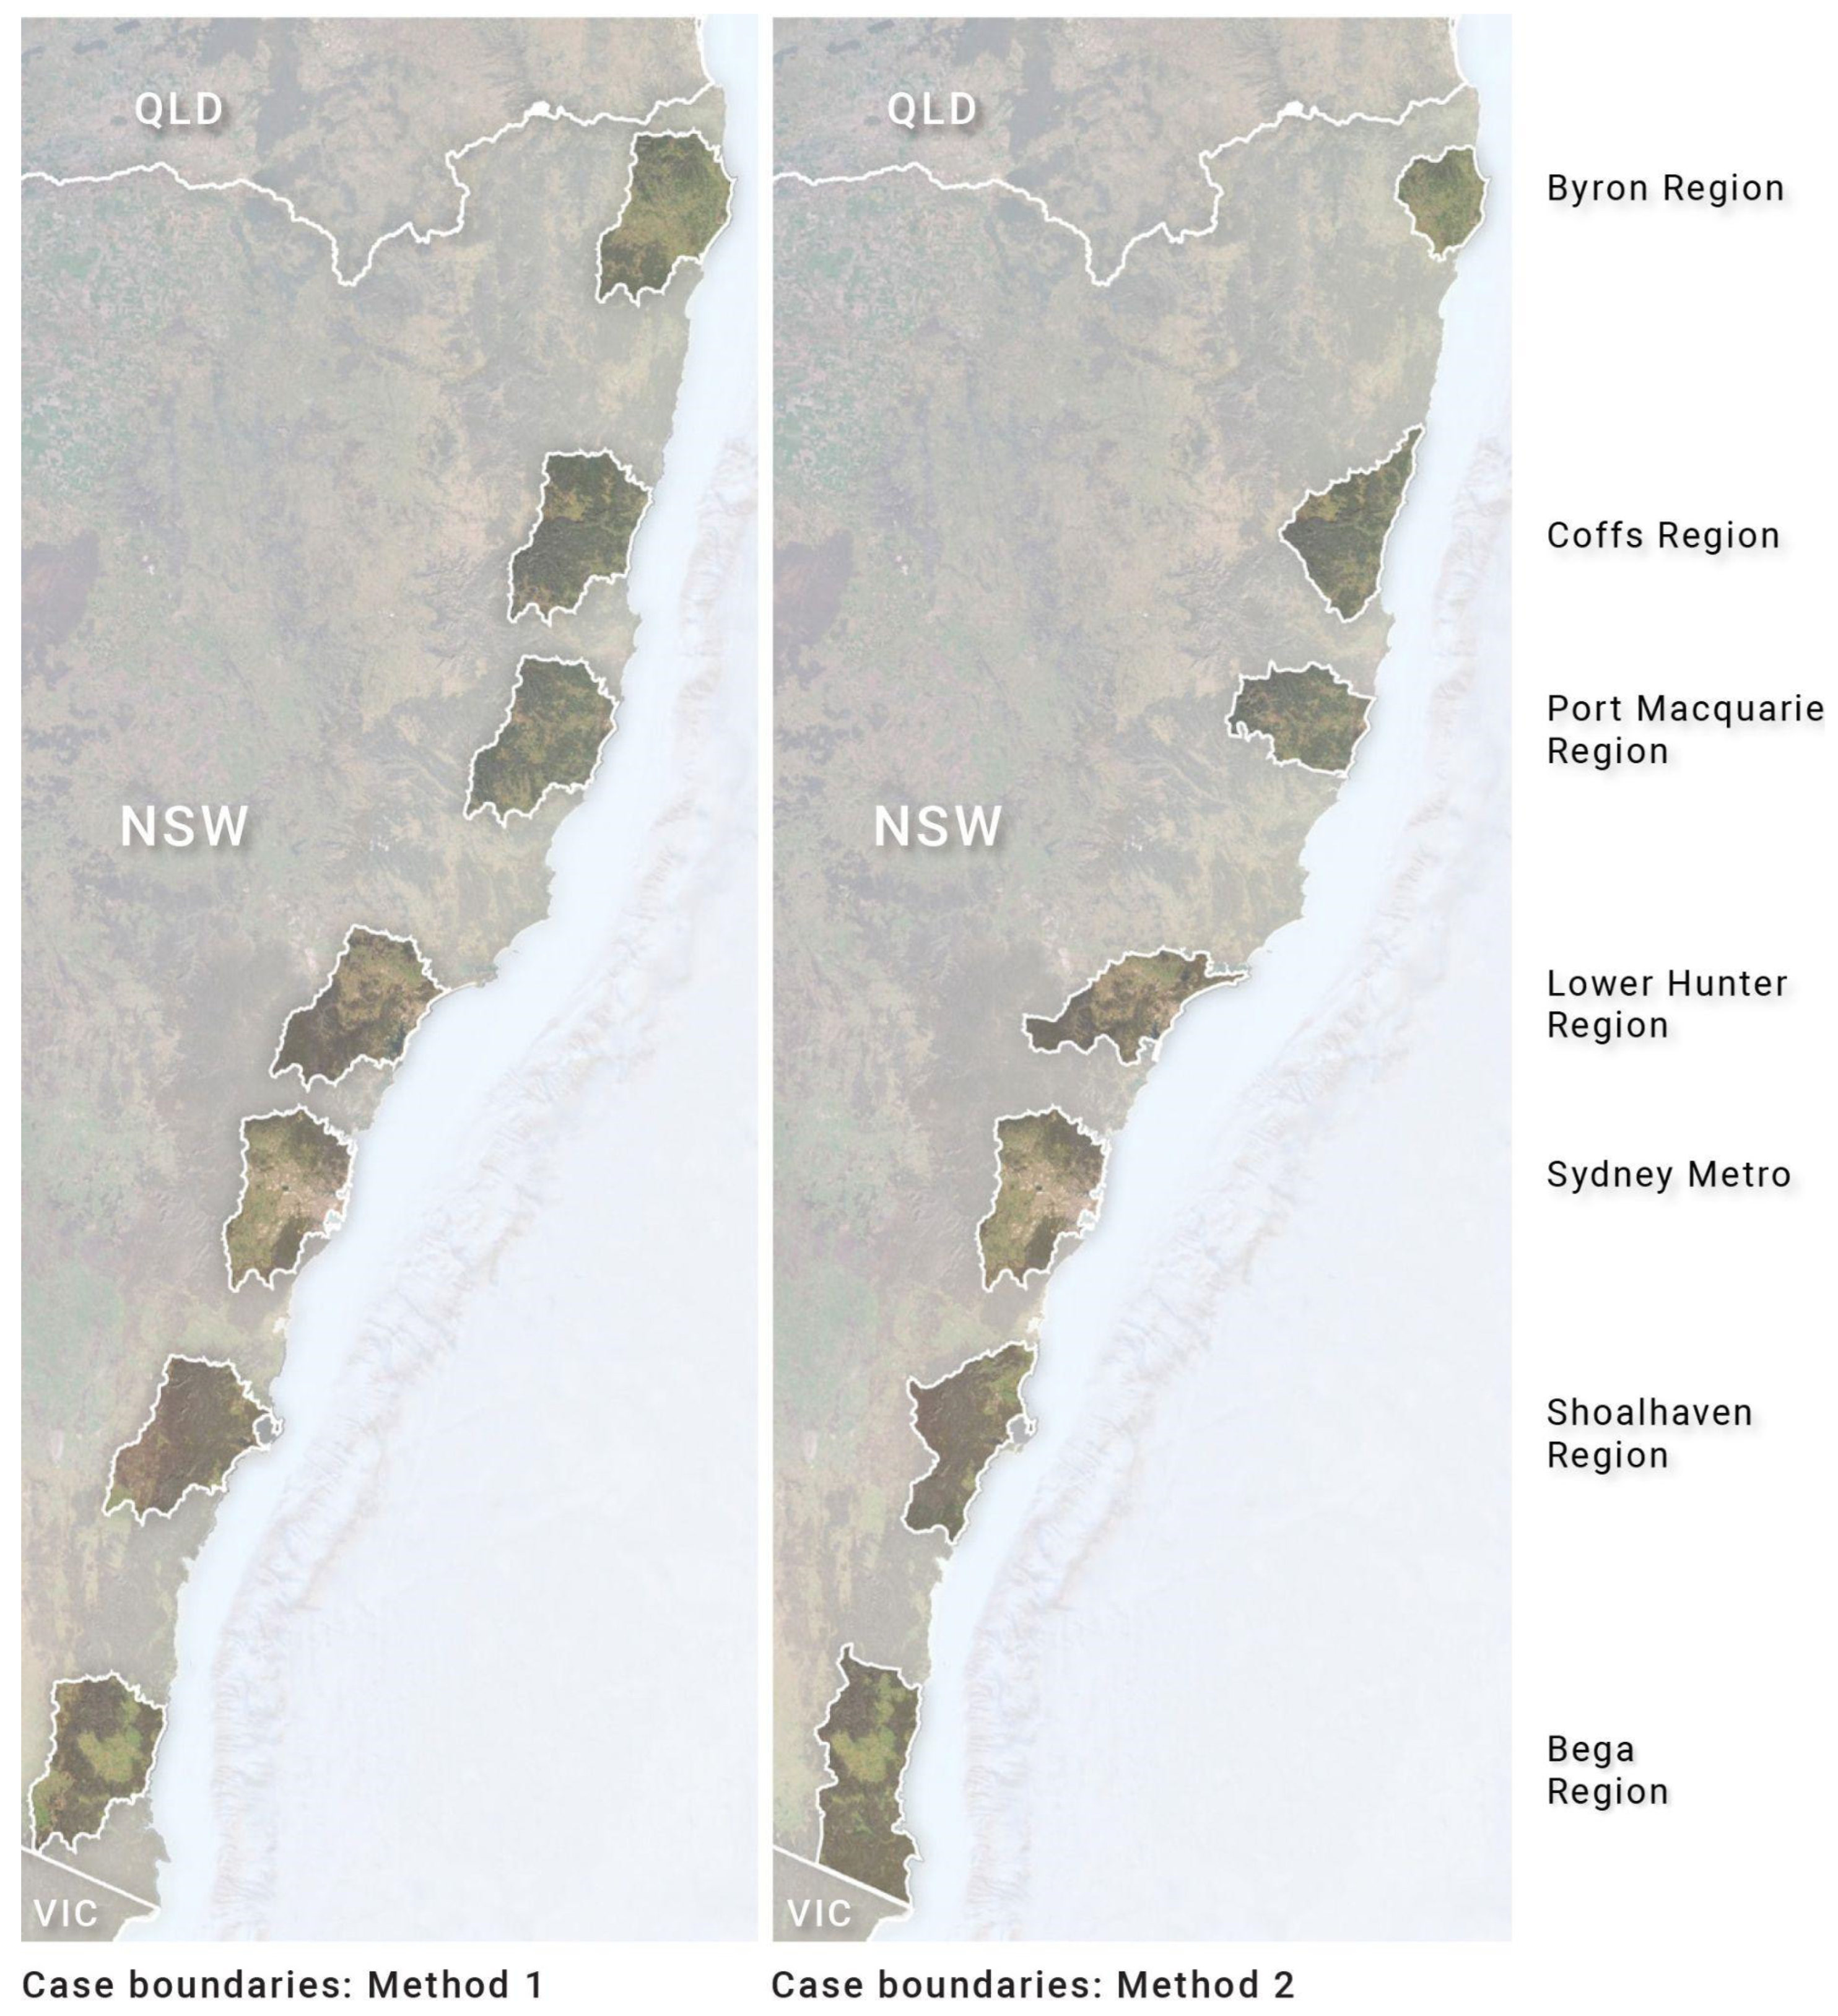
Figure 4.
The four NSW agricultural datasets that provide data covering metropolitan Sydney and all of NSW: LSC, ISF, BSAL and (draft) SSAL. LSC and ISF colour codes are shown in subsequent Figure 5, Figure 6, Figure 7 and Figure 8 and Table 3, Table 4, Table 5 and Table 6. Figure: by Josh Gowers and Joshua Zeunert. Data sources: by NSW Government noted in Table 2.
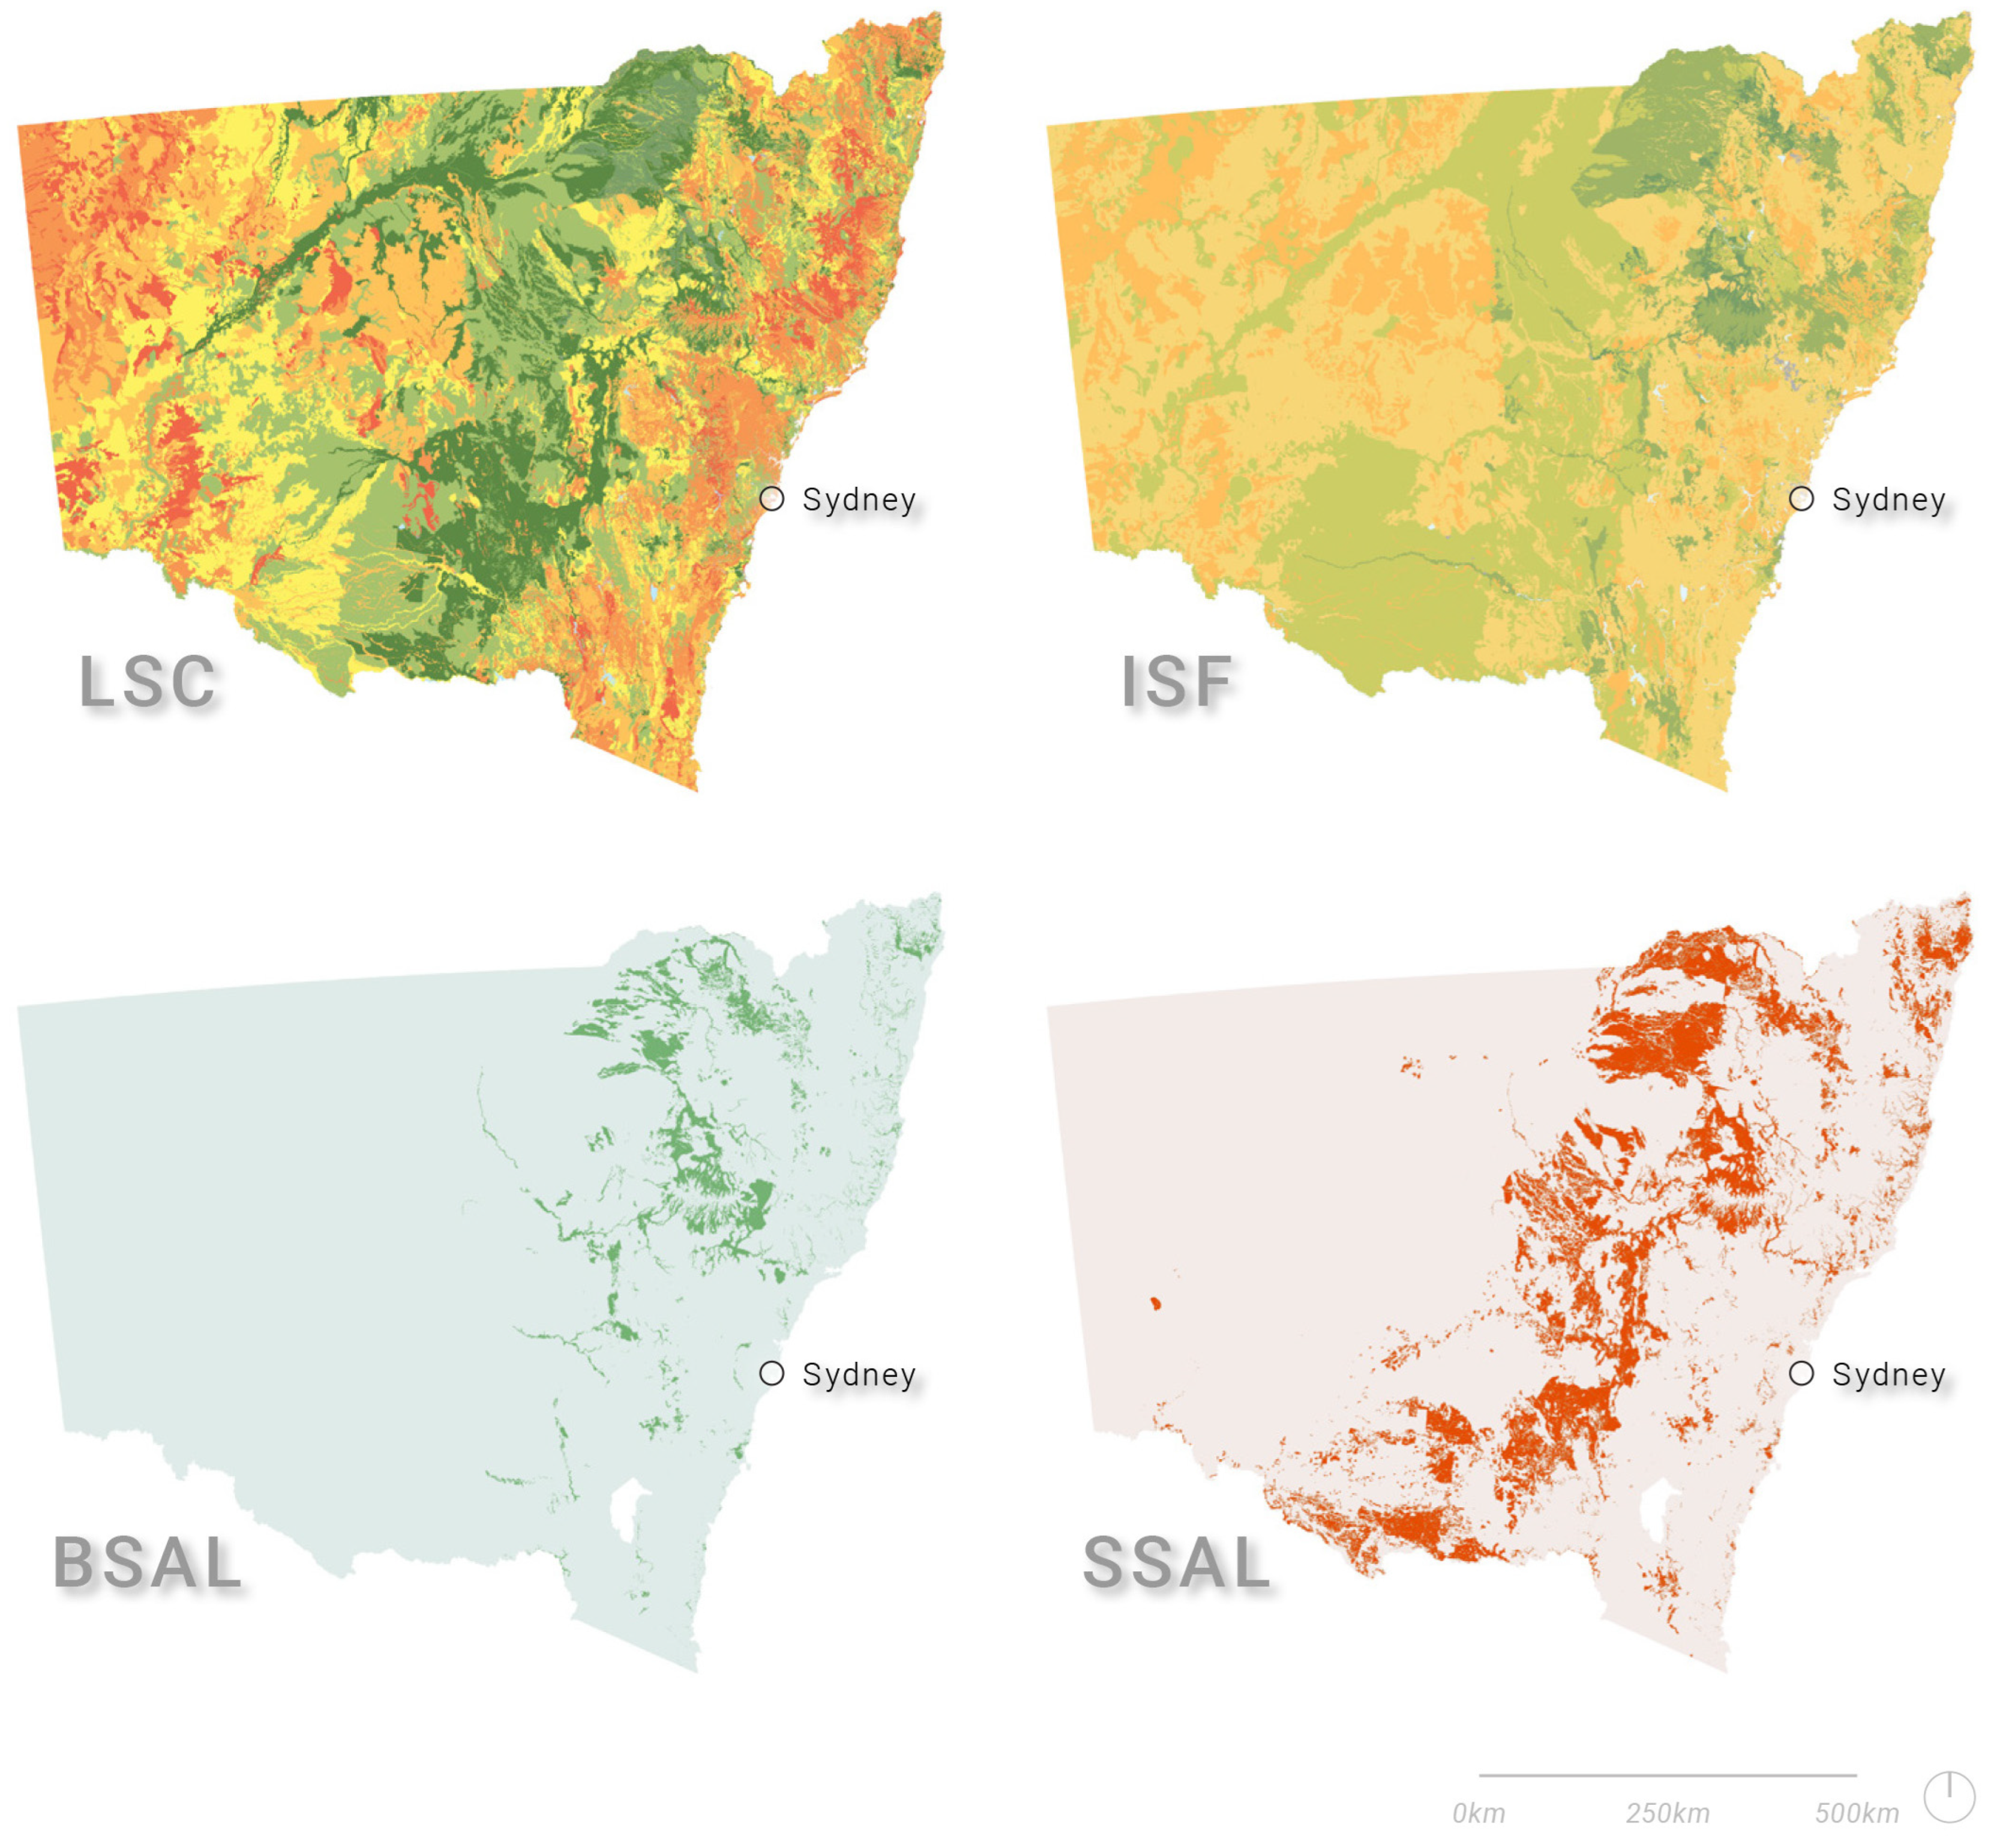
Figure 5.
Land and Soil Capability (LSC) Dataset comparisons for Method 1’s boundaries. Figure by Josh Gowers and Joshua Zeunert. Data sources: NSW Government noted in Table 2.
Figure 5.
Land and Soil Capability (LSC) Dataset comparisons for Method 1’s boundaries. Figure by Josh Gowers and Joshua Zeunert. Data sources: NSW Government noted in Table 2.
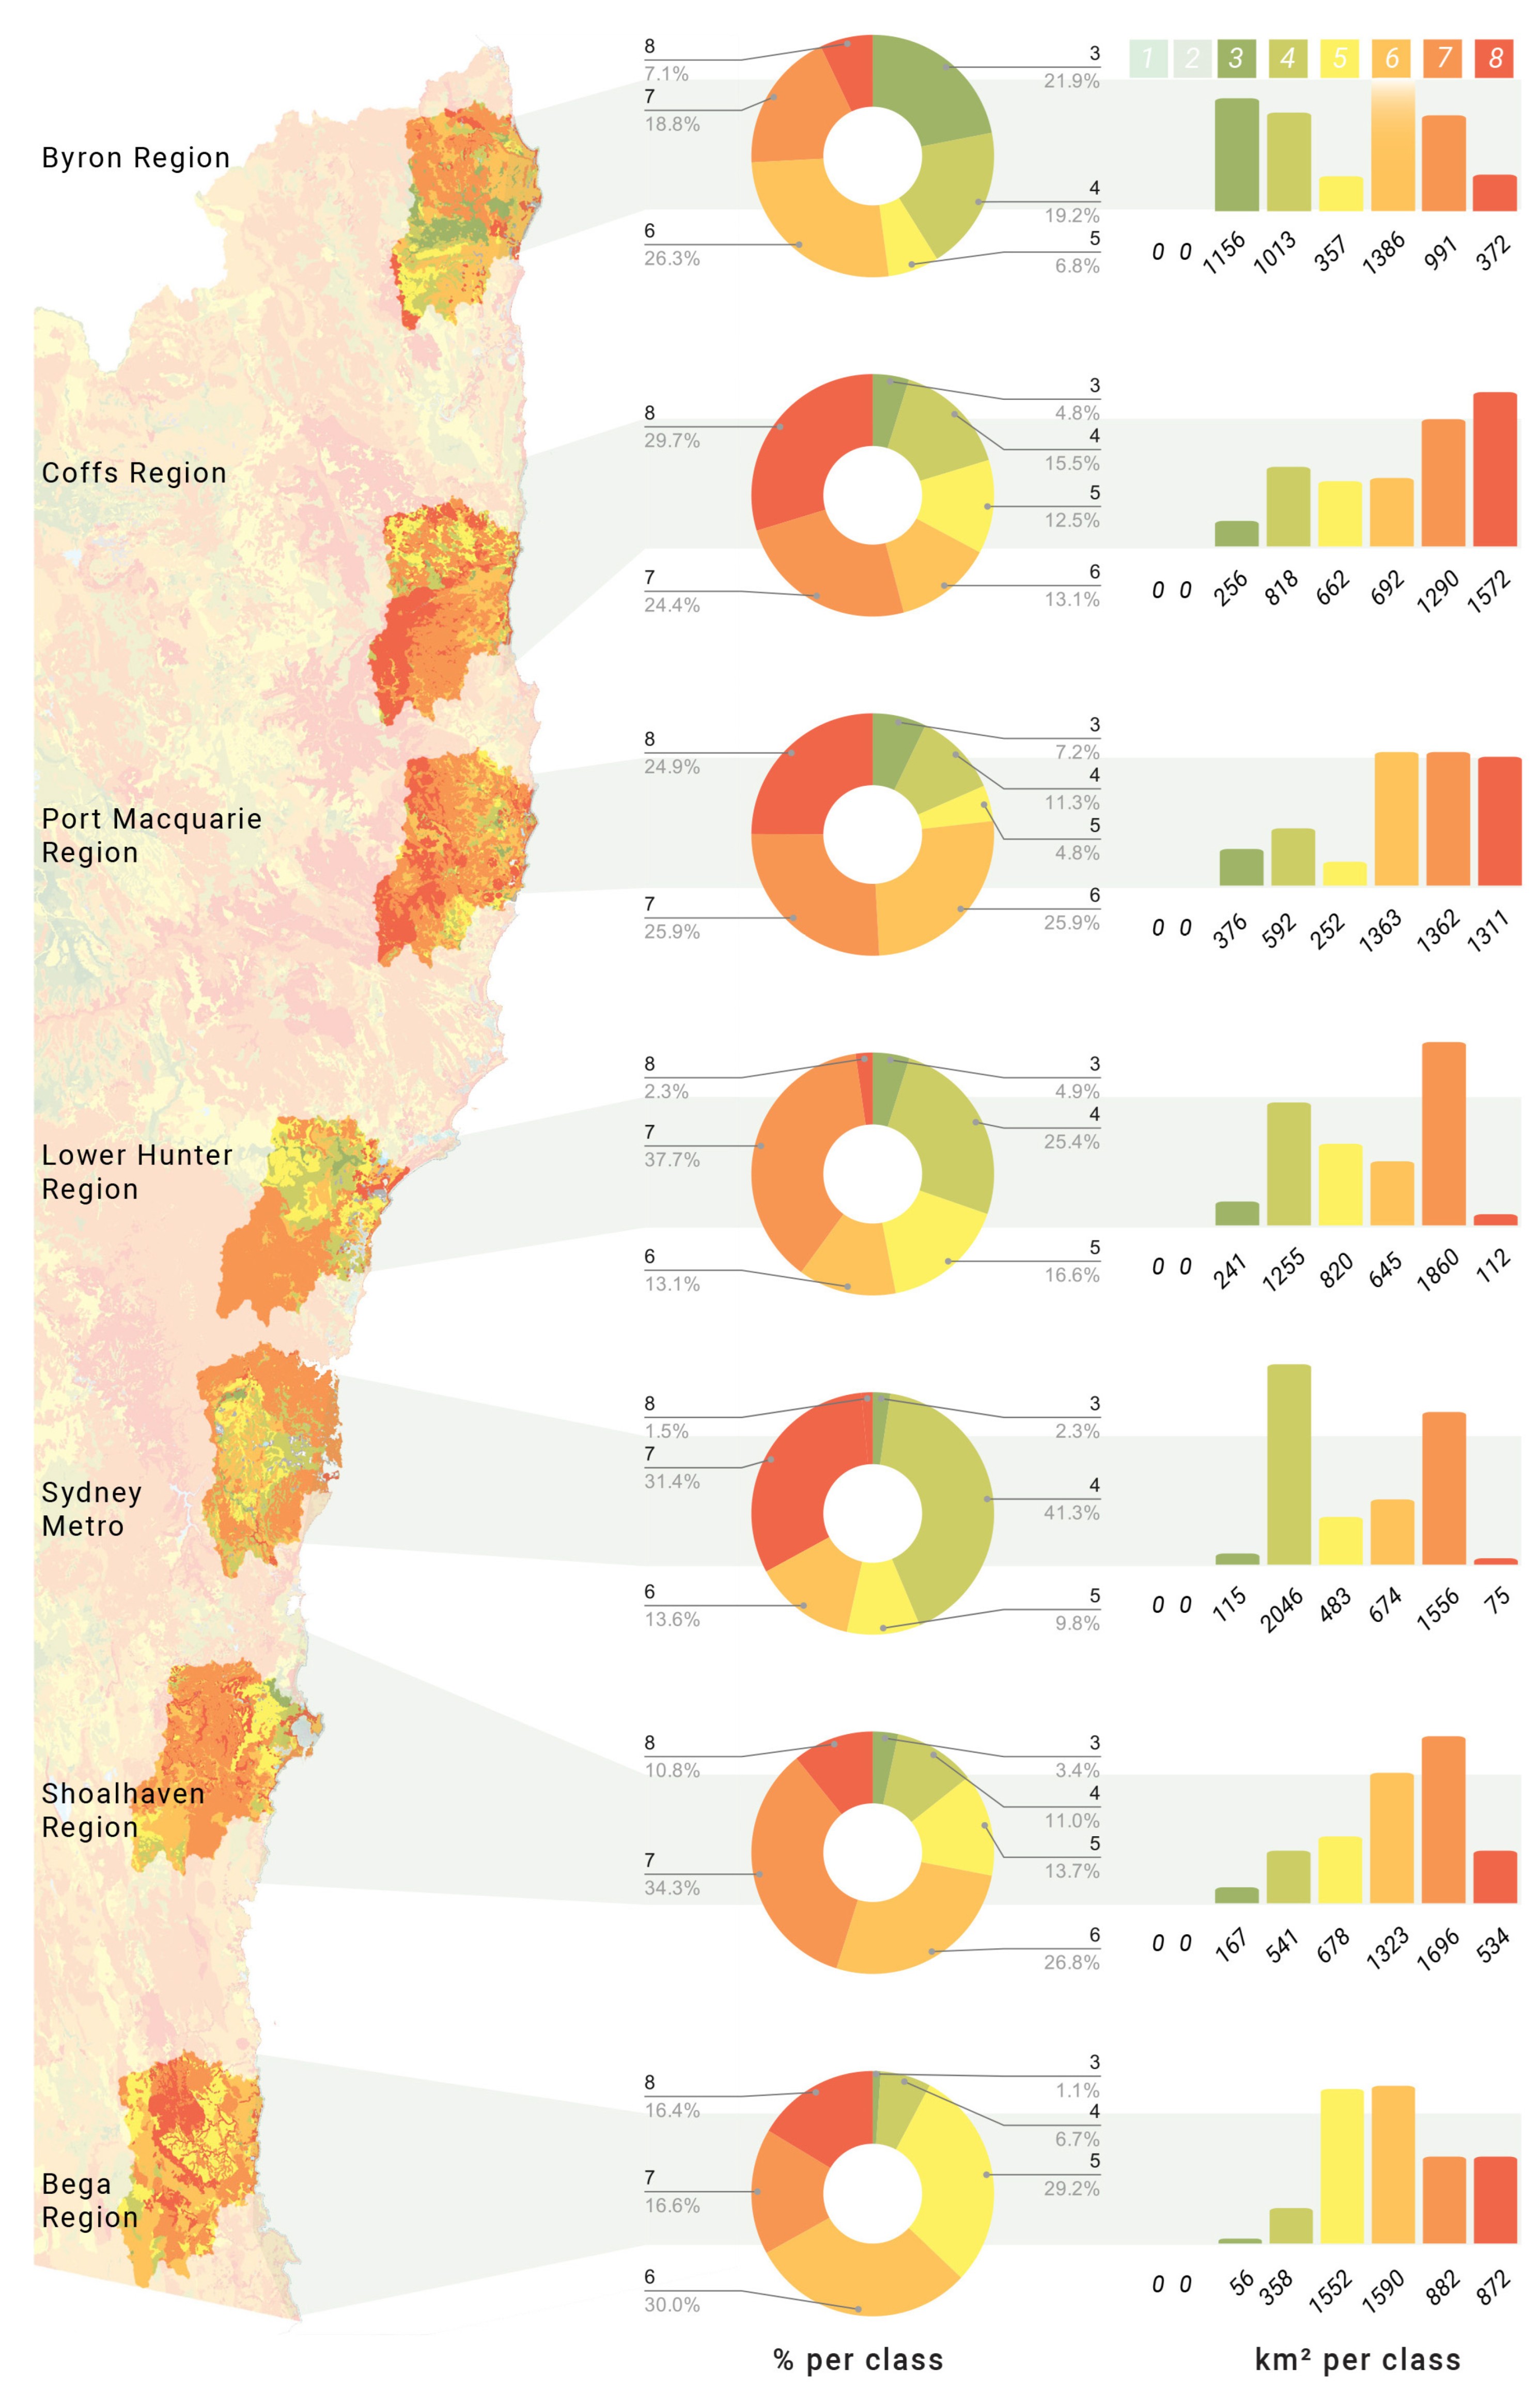
Figure 6.
This Land and Soil Capability (LSC) Dataset comparisons for Method 2’s boundaries, from class 1 (best) to 8 (worst). Figure by Josh Gowers and Joshua Zeunert. Data sources: NSW Government noted in Table 2.
Figure 6.
This Land and Soil Capability (LSC) Dataset comparisons for Method 2’s boundaries, from class 1 (best) to 8 (worst). Figure by Josh Gowers and Joshua Zeunert. Data sources: NSW Government noted in Table 2.
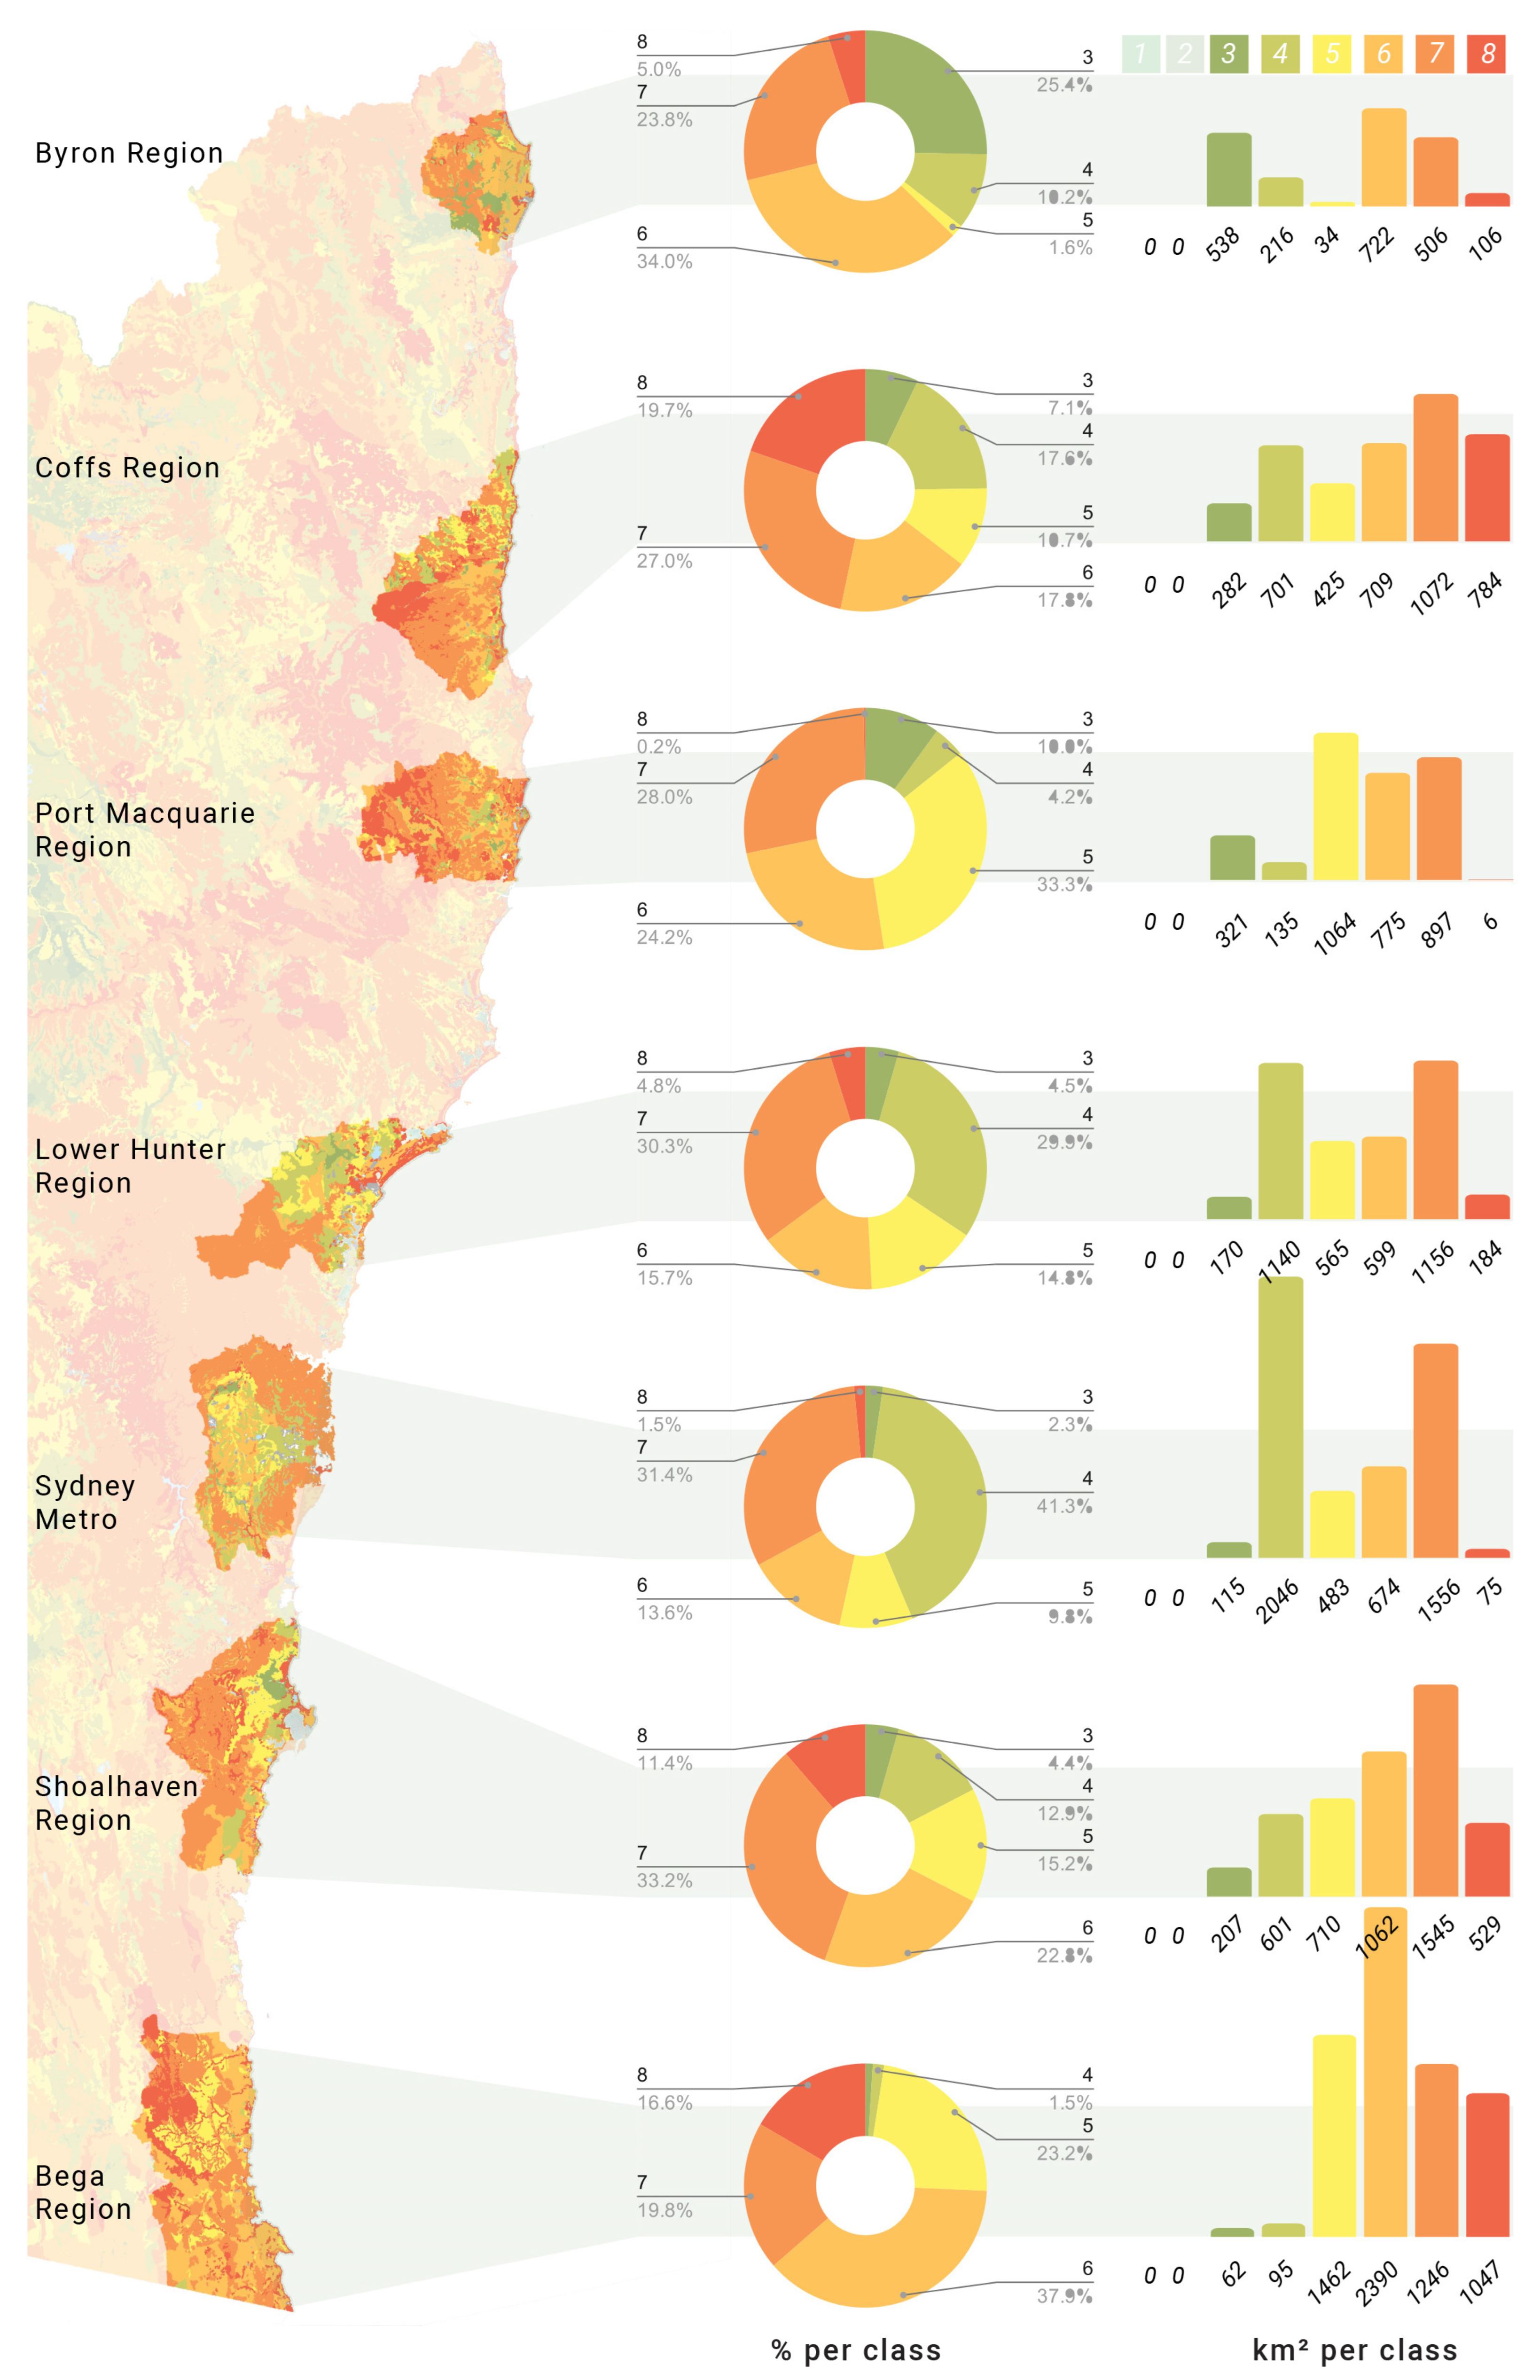
Figure 7.
Inherent Soil Fertility (ISF) dataset comparisons for Method 1’s boundaries, from Class 5 (best) to 1 (worst). Figure by Josh Gowers and Joshua Zeunert. Data sources: NSW Government noted in Table 2.
Figure 7.
Inherent Soil Fertility (ISF) dataset comparisons for Method 1’s boundaries, from Class 5 (best) to 1 (worst). Figure by Josh Gowers and Joshua Zeunert. Data sources: NSW Government noted in Table 2.
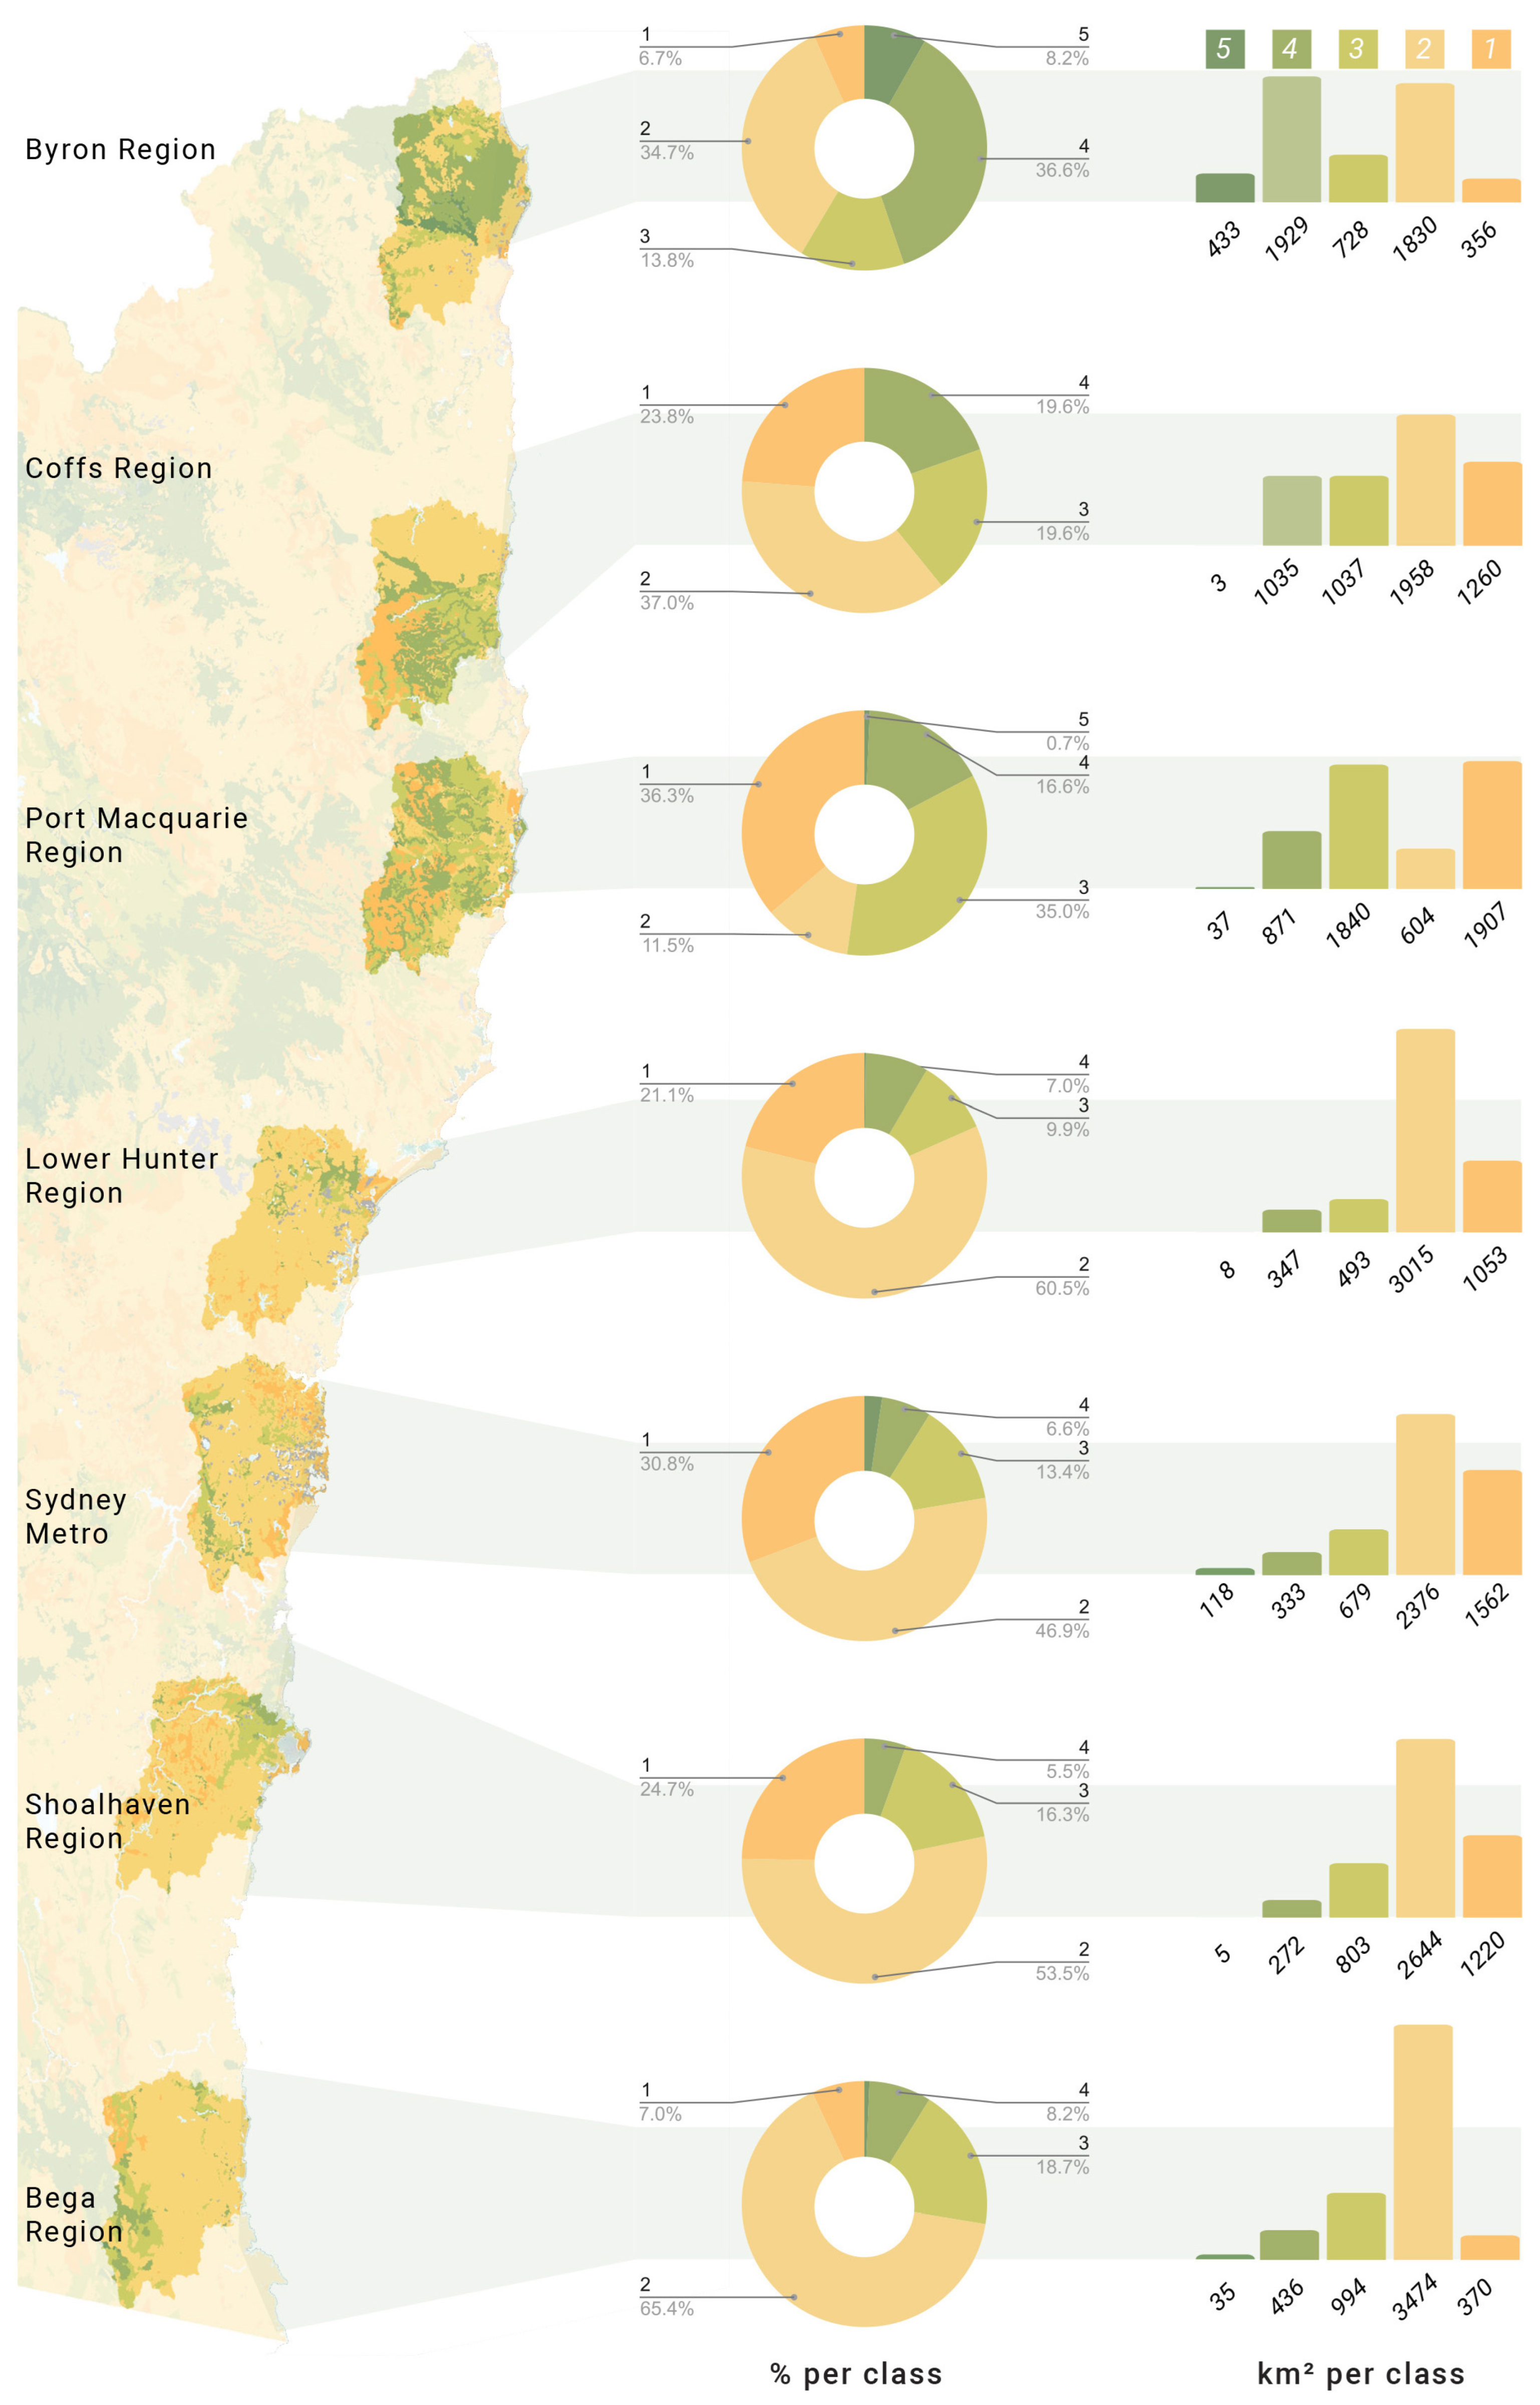
Figure 8.
Inherent Soil Fertility (ISF) dataset comparisons for Method 2’s boundaries. Figure by Josh Gowers and Joshua Zeunert. Data sources: NSW Government noted in Table 2.
Figure 8.
Inherent Soil Fertility (ISF) dataset comparisons for Method 2’s boundaries. Figure by Josh Gowers and Joshua Zeunert. Data sources: NSW Government noted in Table 2.
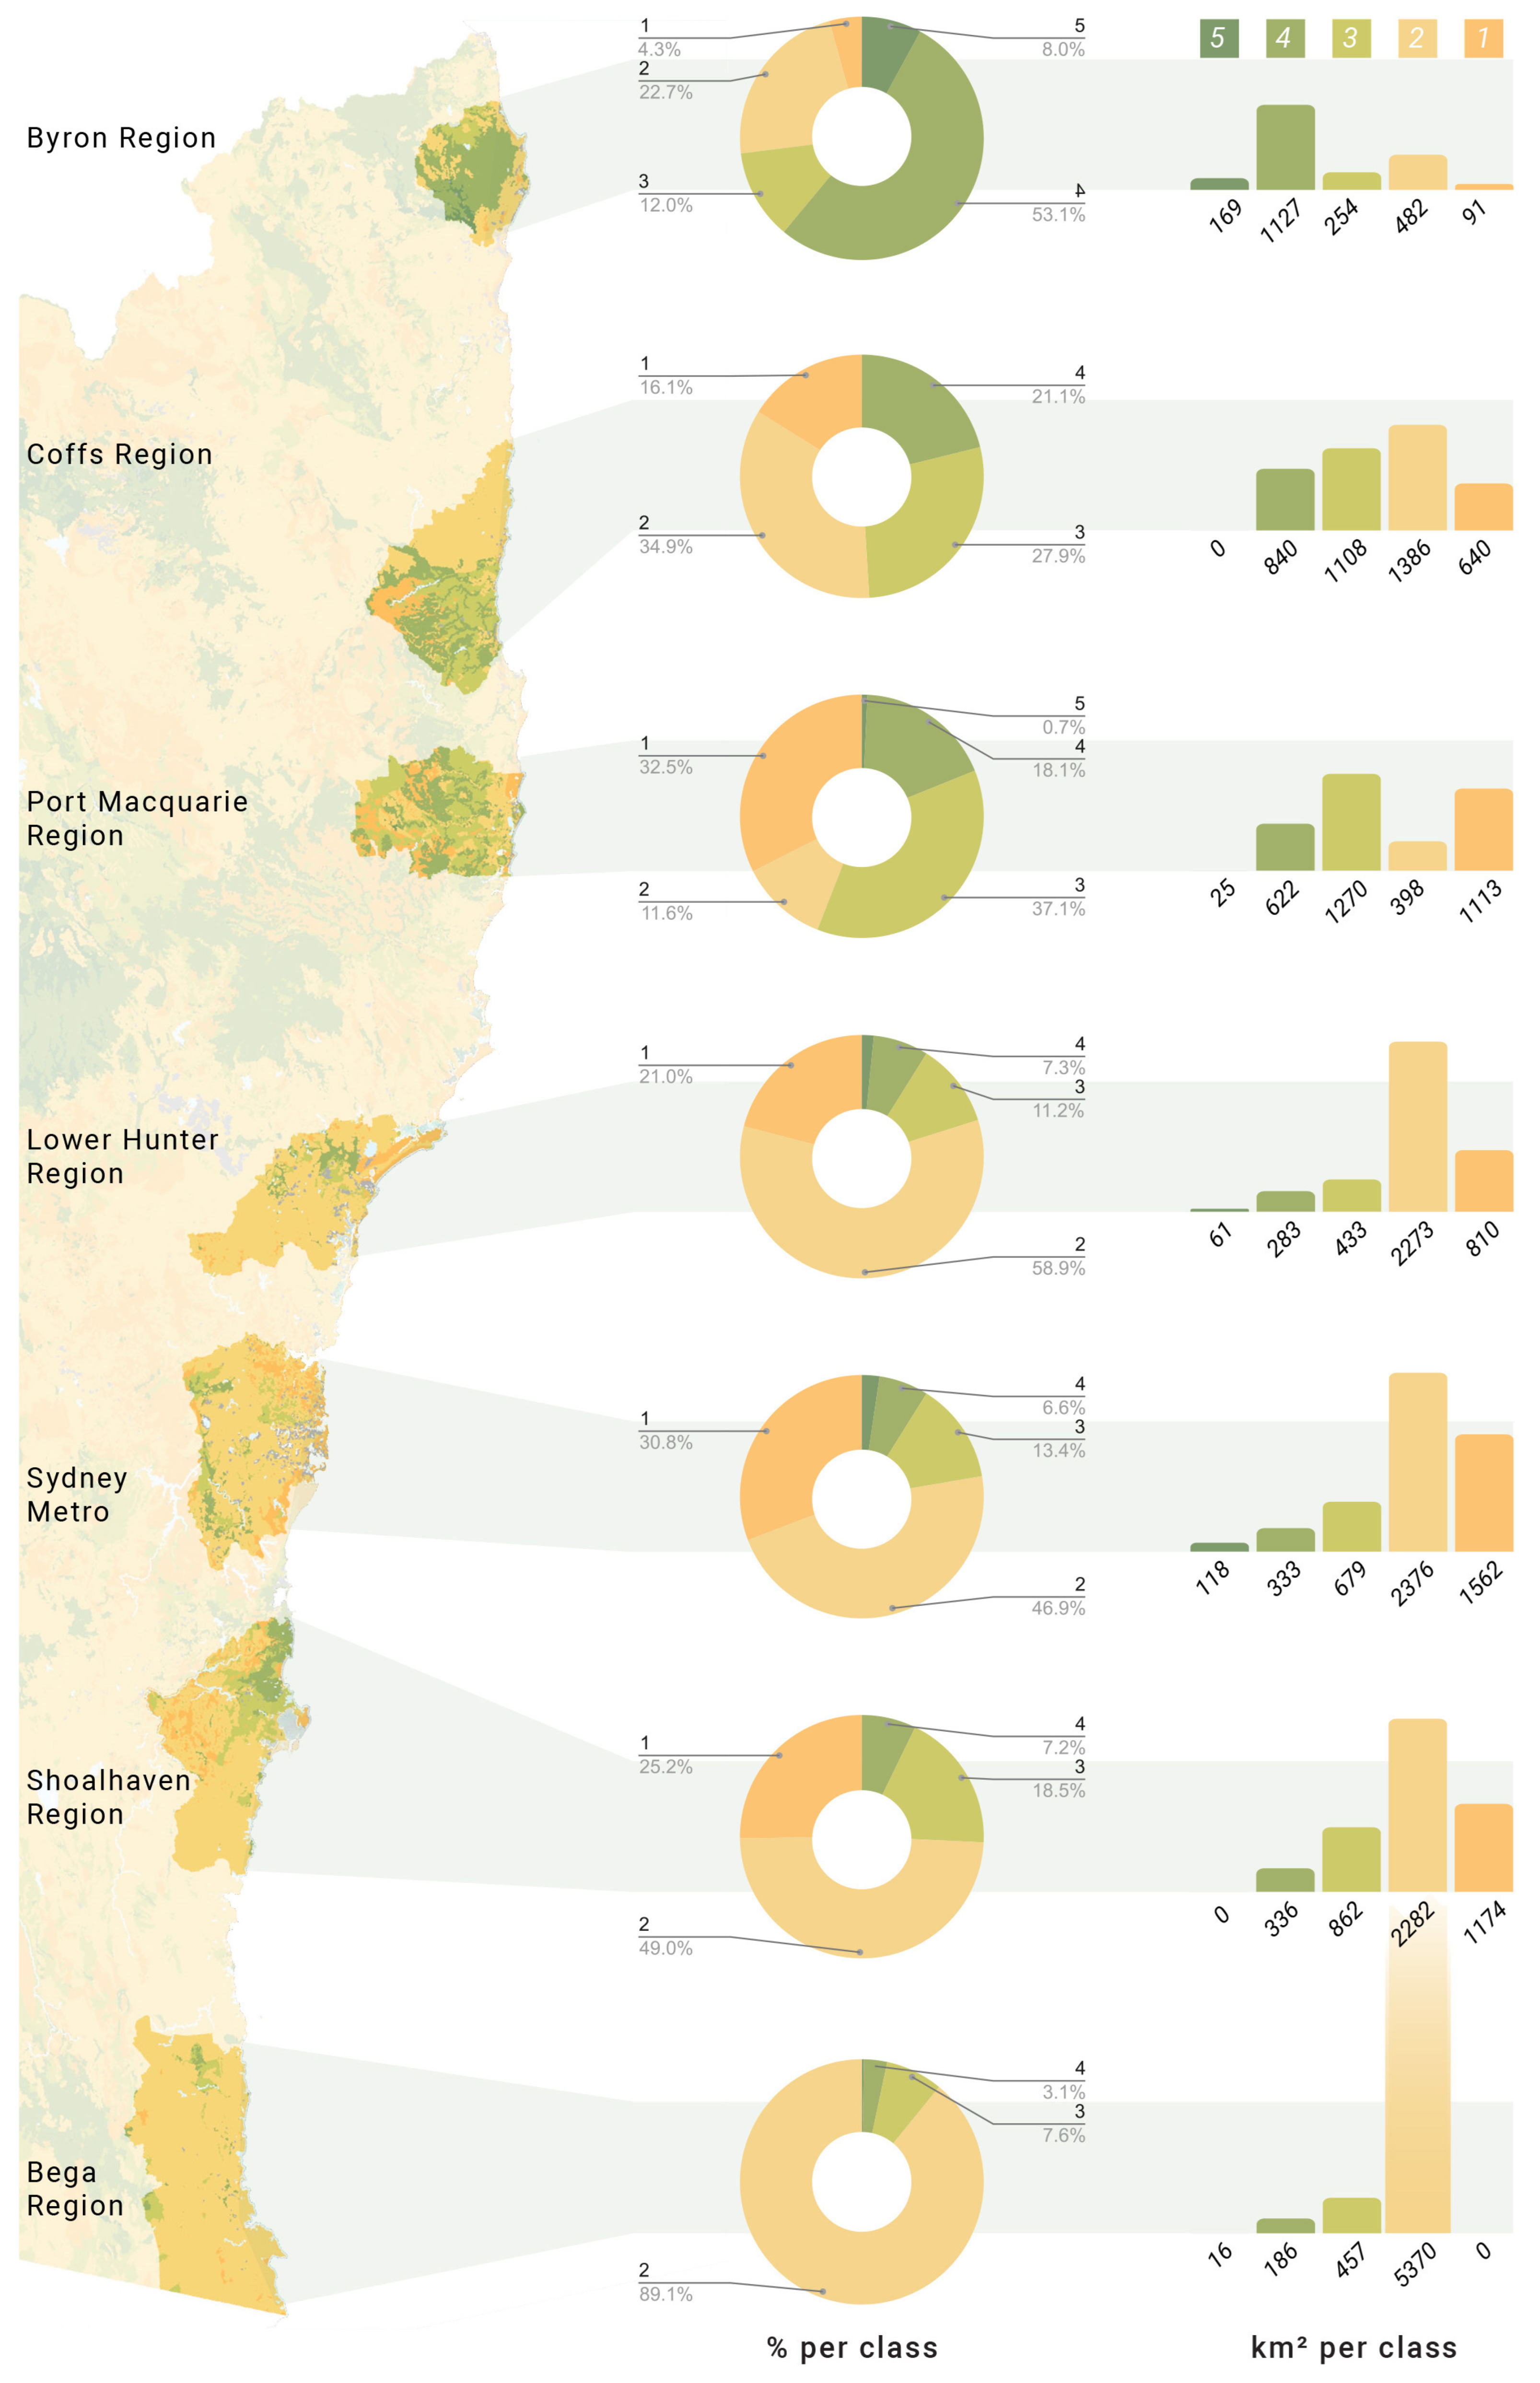
Figure 9.
Biophysical Strategic Agricultural Land (BSAL) comparisons for both Methods, as percentages of total region area, and total km2 for each region. Figure by Josh Gowers and Joshua Zeunert. Data sources: NSW Government noted in Table 2.
Figure 9.
Biophysical Strategic Agricultural Land (BSAL) comparisons for both Methods, as percentages of total region area, and total km2 for each region. Figure by Josh Gowers and Joshua Zeunert. Data sources: NSW Government noted in Table 2.
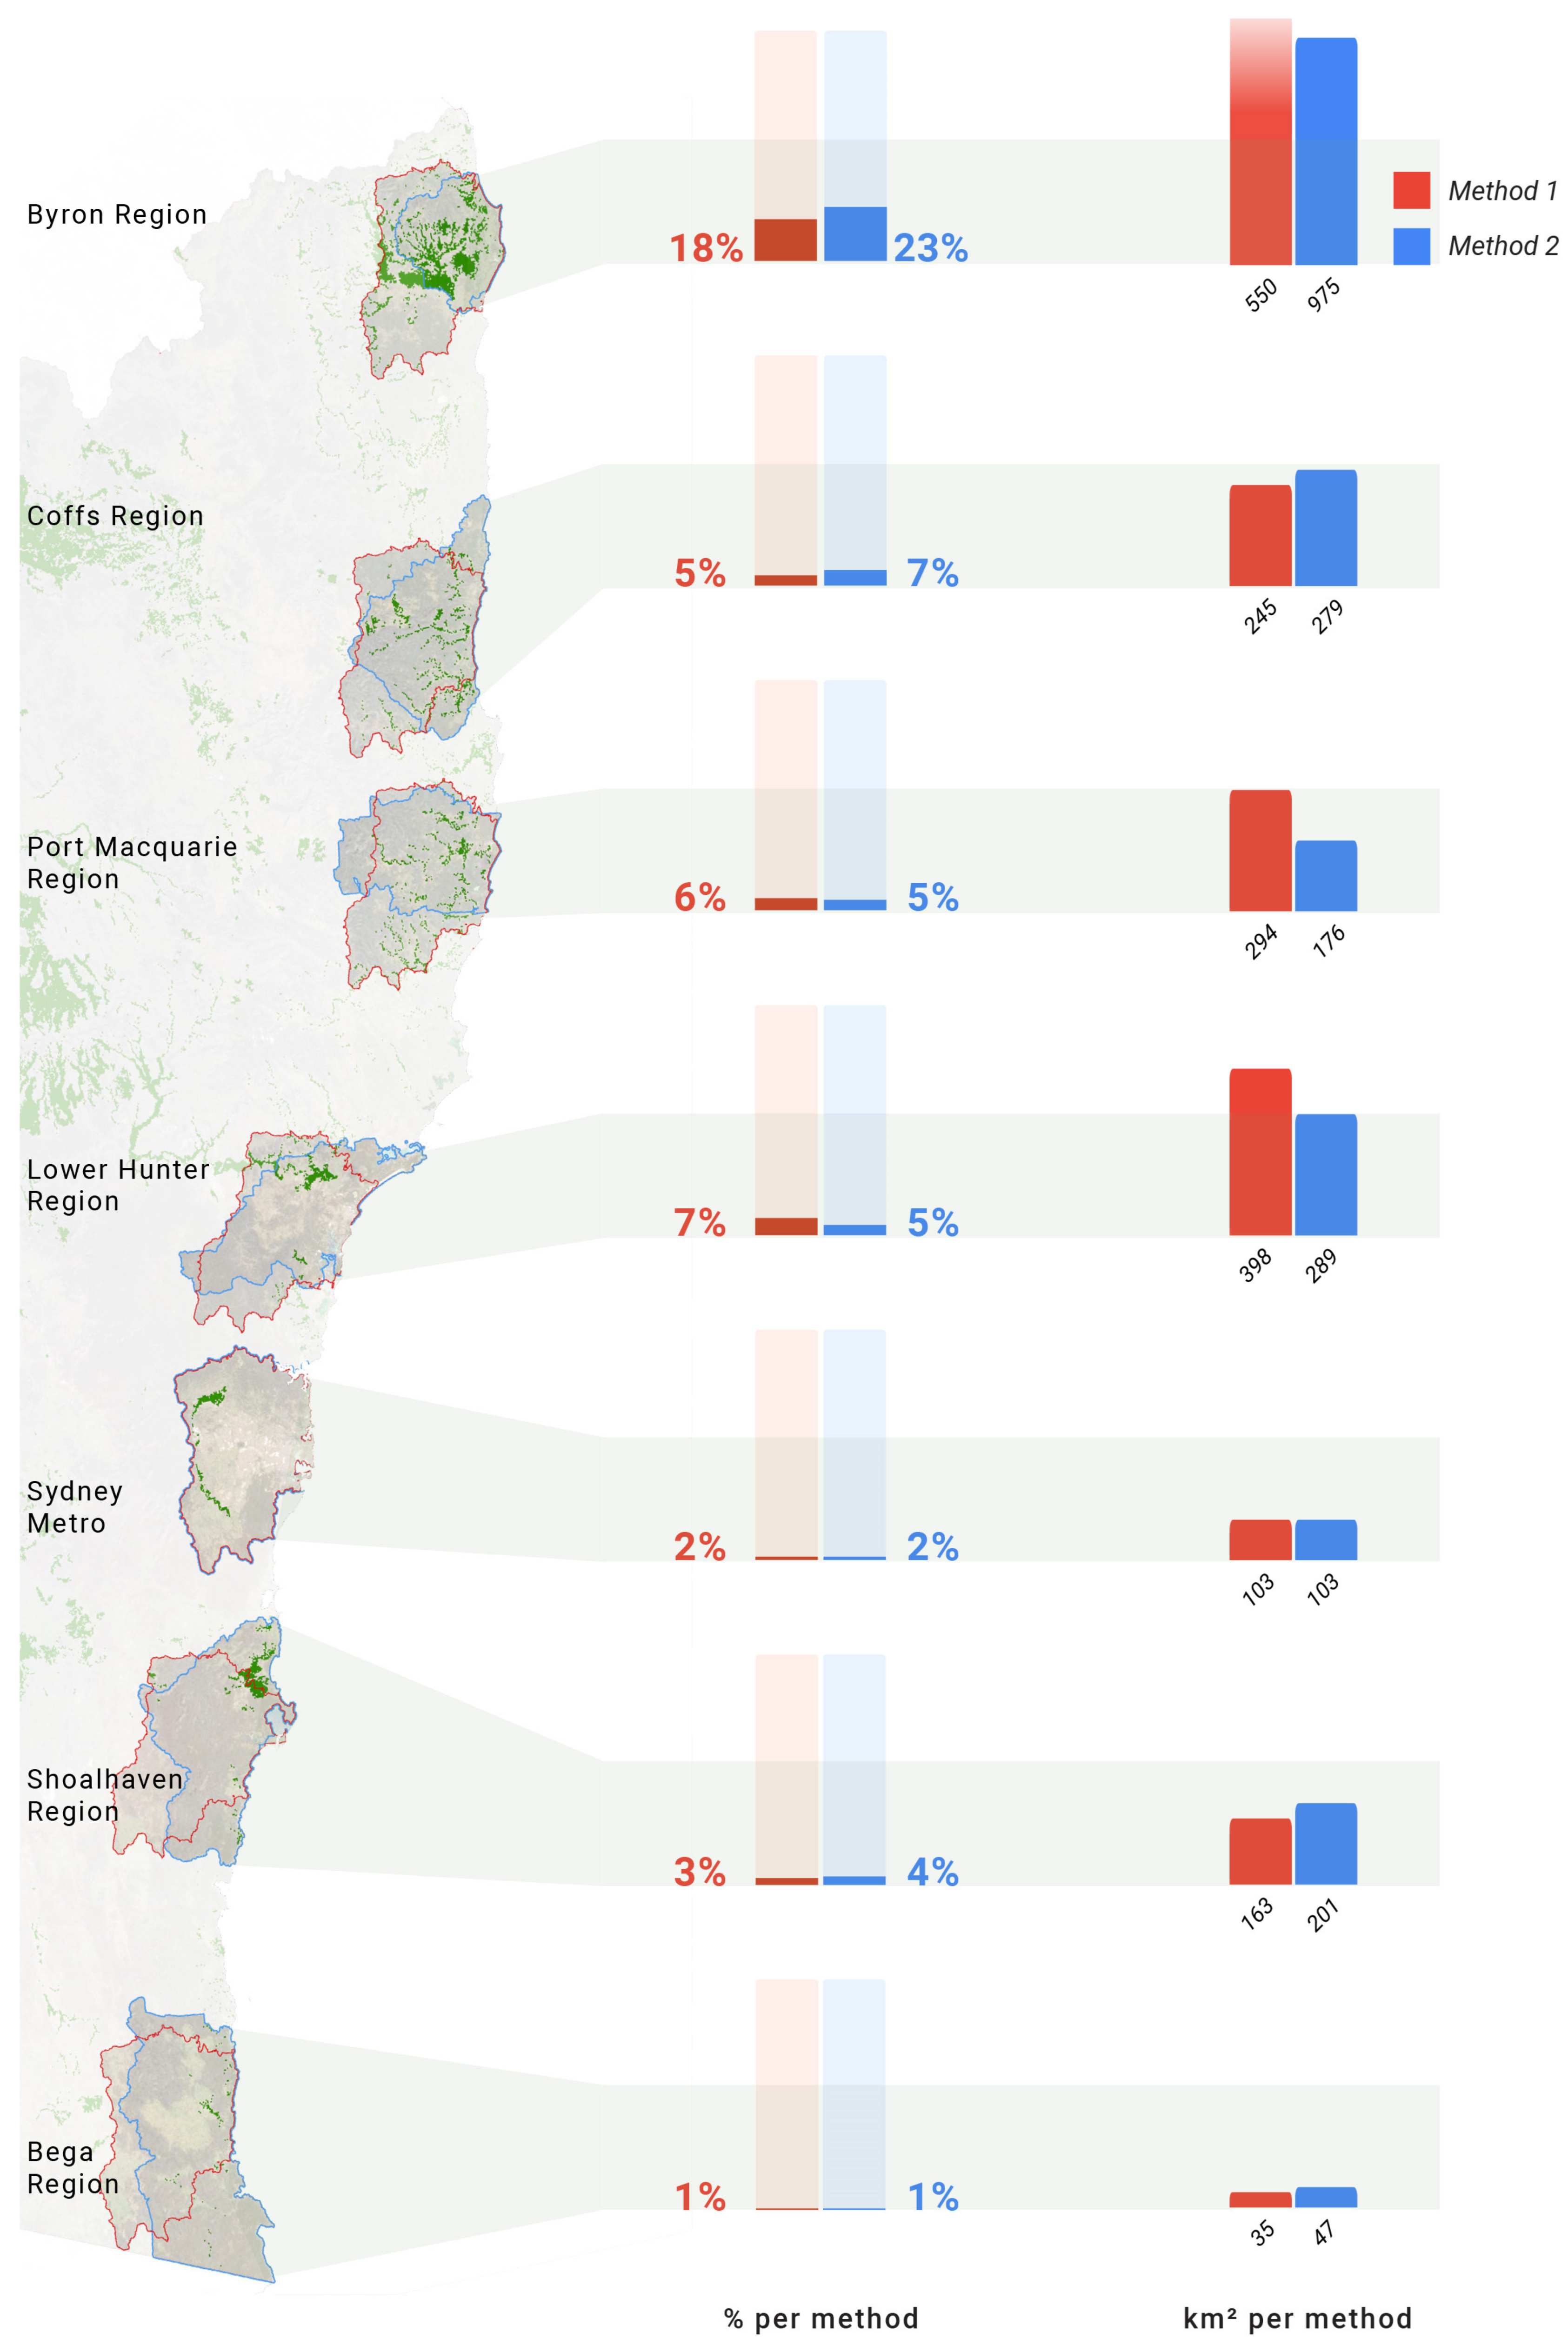
Figure 10.
State Significant Agricultural Land (SSAL) comparisons for both Methods, as percentages of total region area, and total km2 for each region. Figure by Josh Gowers and Joshua Zeunert. Data sources: NSW Government noted in Table 2.
Figure 10.
State Significant Agricultural Land (SSAL) comparisons for both Methods, as percentages of total region area, and total km2 for each region. Figure by Josh Gowers and Joshua Zeunert. Data sources: NSW Government noted in Table 2.
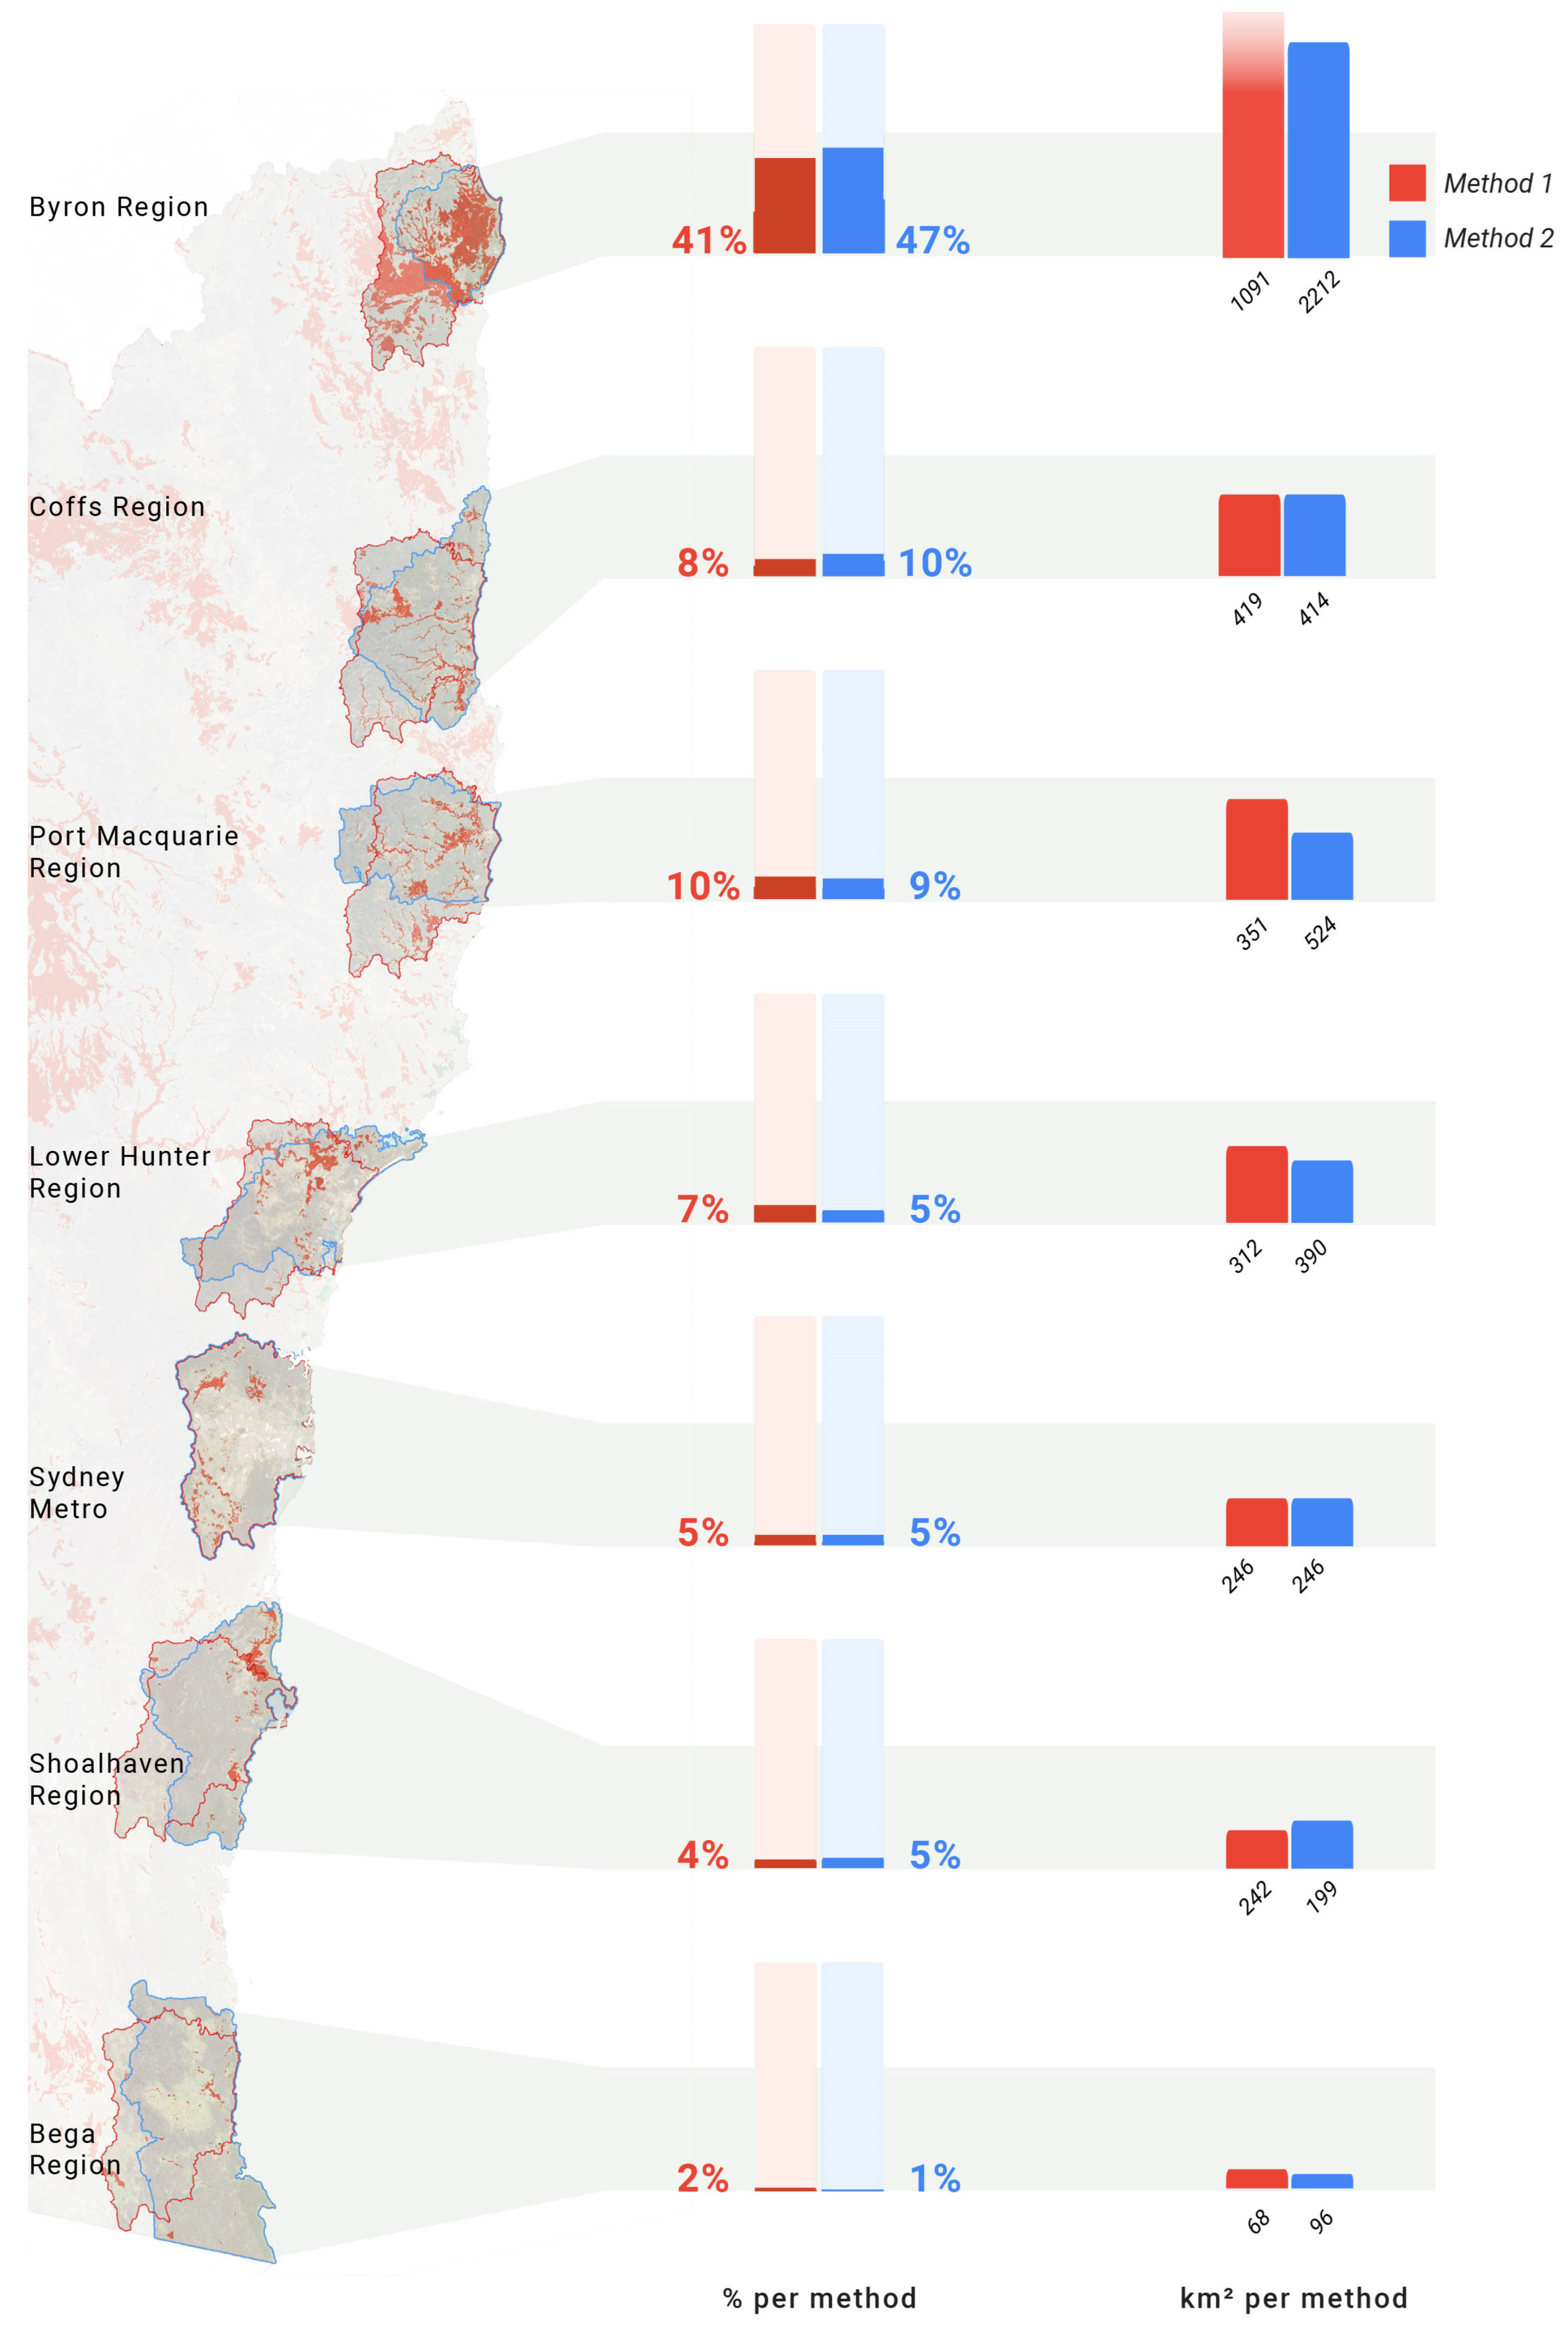
Figure 11.
This figure shows the area proportion (%) of land in the study regions for the two highest ranked classifications in Land and Soil Capability (LSC) (Class 3 and 4) and Inherent Soil Fertility (ISF) (Class 5 and Class 4), for both Methods. Figure by Josh Gowers and Joshua Zeunert. Data sources: NSW Government noted in Table 2.
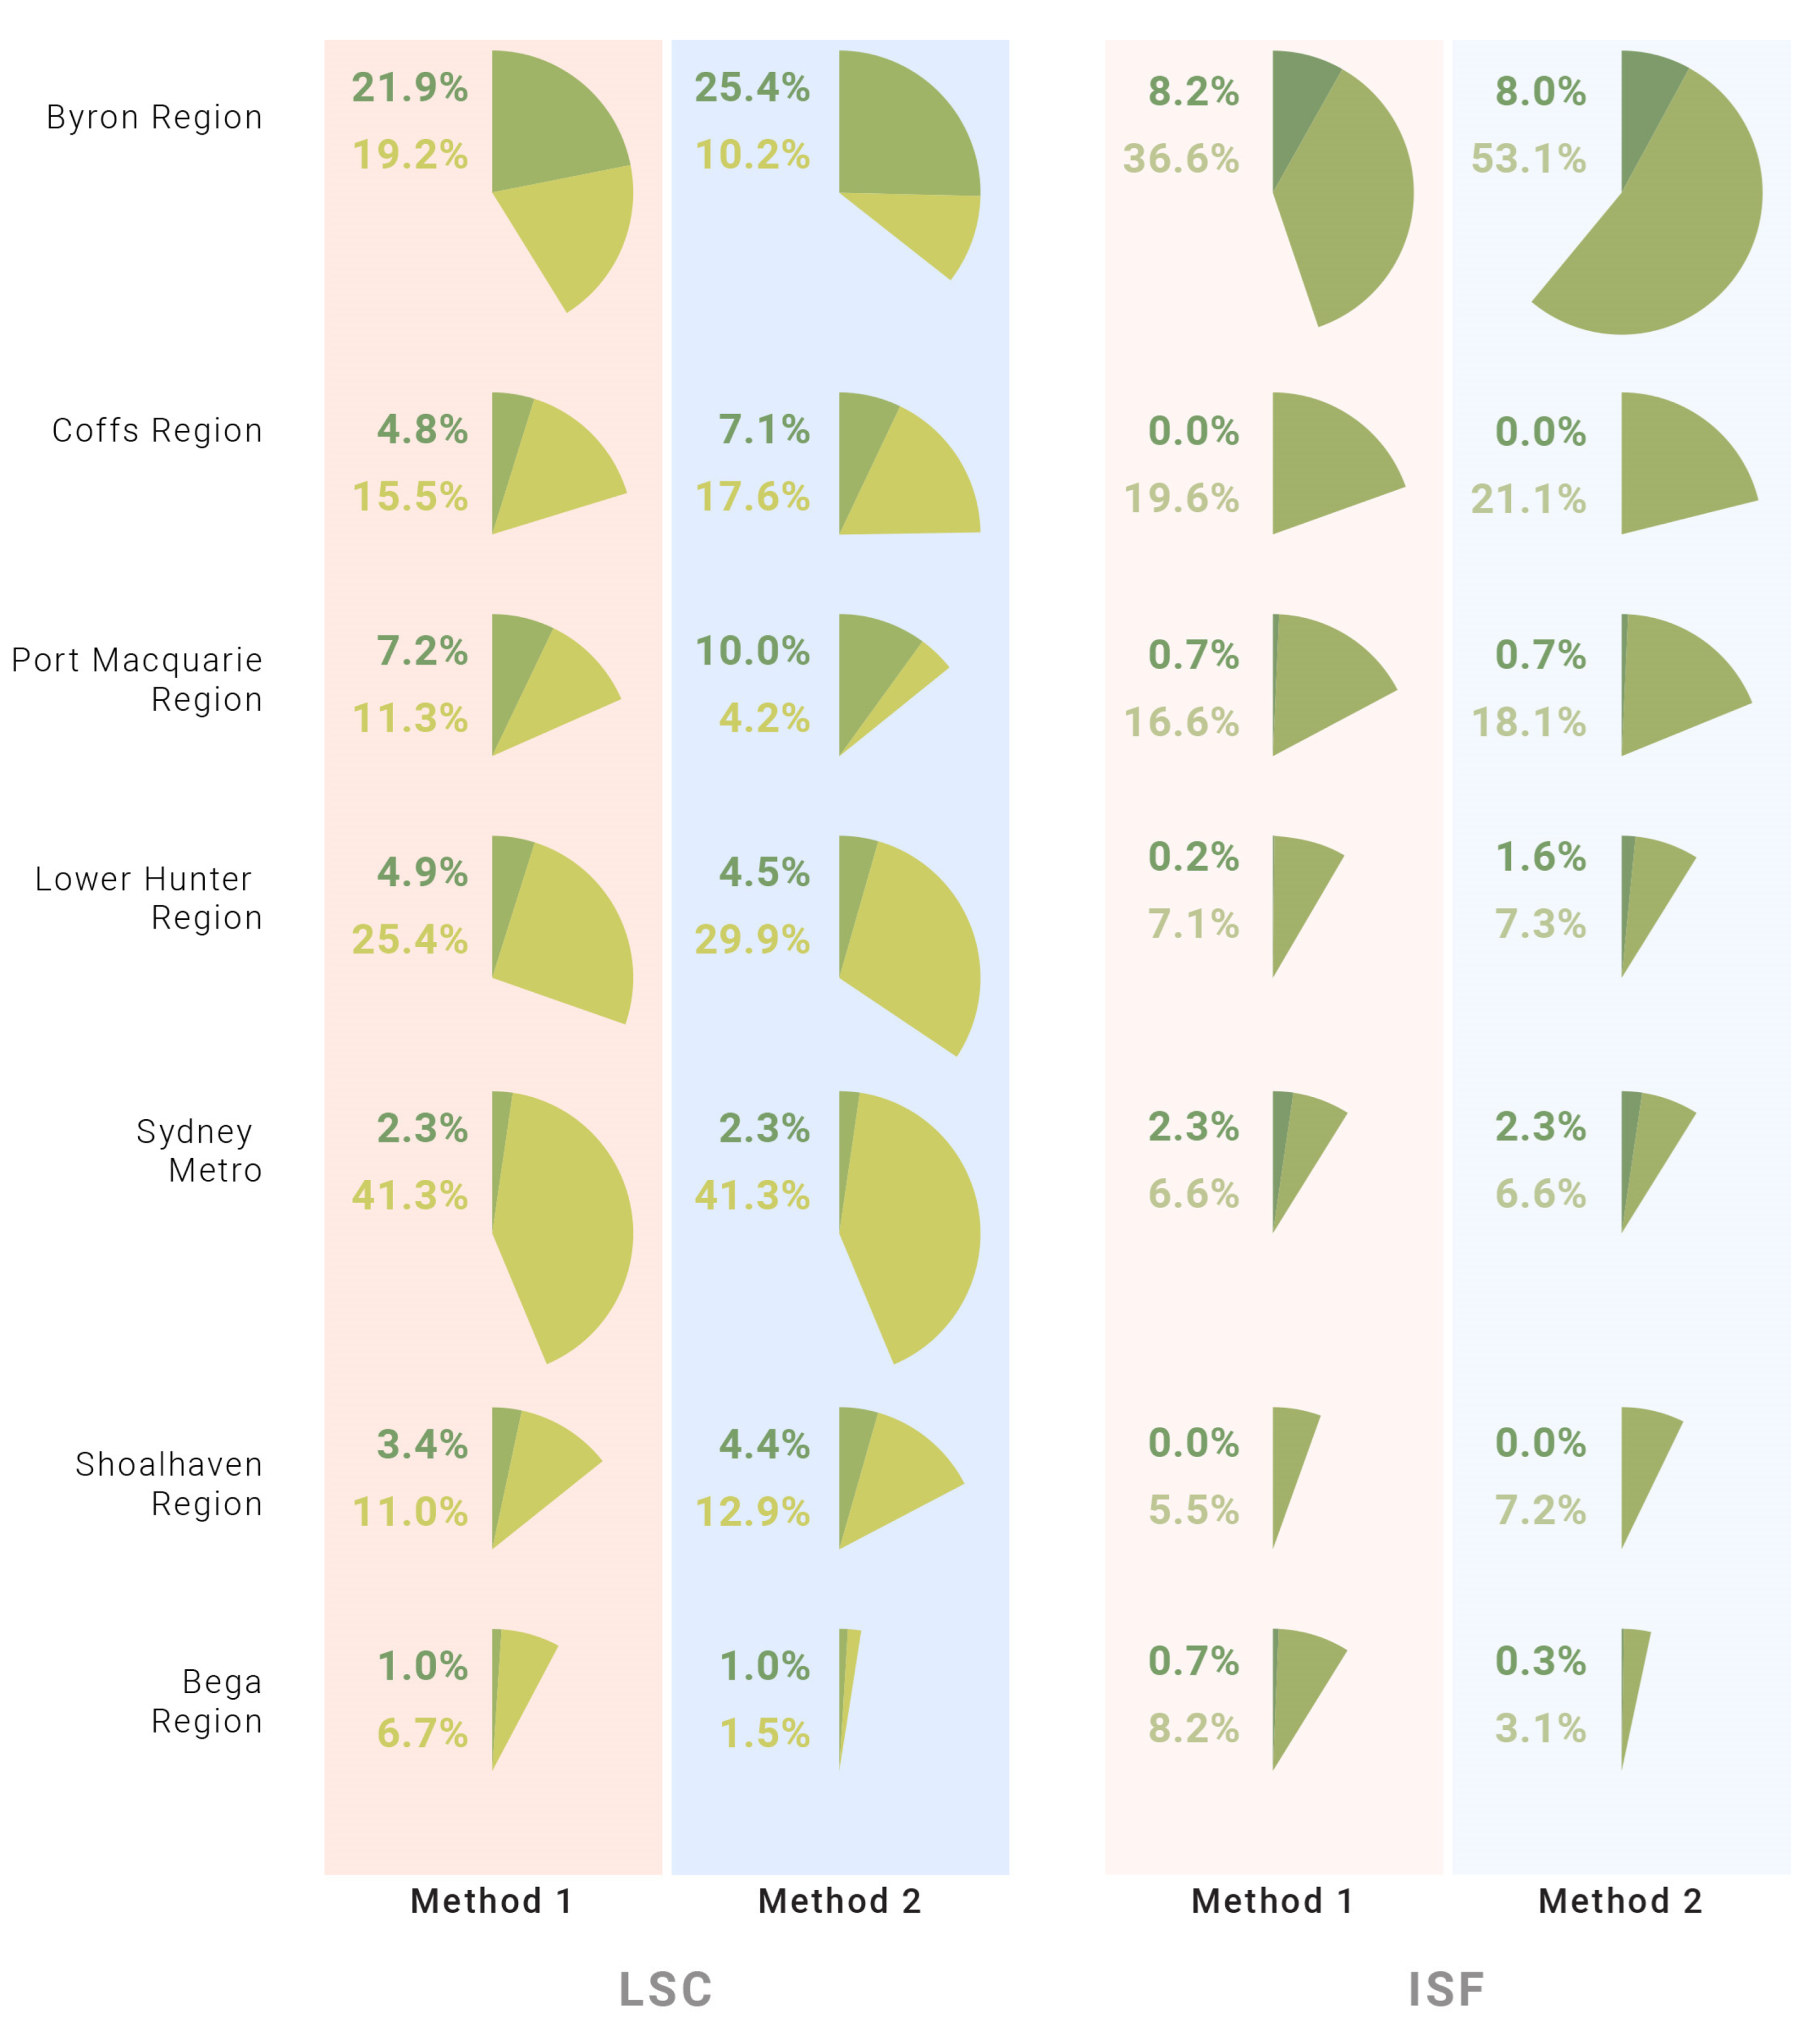

Table 1.
Areas in square kilometres for the seven sites for both methods of boundary determination.
| REGION | Method 1 Sydney Boundary (km2) |
Method 2 LGA Boundary (km2) |
|---|---|---|
| Byron | 5293 | 2142 |
| Coffs | 5297 | 3983 |
| Port Macquarie | 5275 | 3443 |
| Lower Hunter | 5012 | 3885 |
| Sydney | 5340 | 5340 |
| Nowra | 4974 | 4696 |
| Bega | 5318 | 6313 |
| MEAN | 5215 | 4258 |
Table 2.
Datasets used in this study.
| Dataset Name | Classes | Notes |
|---|---|---|
| LSC: Land and Soil Capability Mapping for NSW [53] | 1 - Very slight to negligible limitations 2 - Slight but significant limitations 3 - Moderate limitations 4 - Moderate to severe limitations 5 - Severe limitations 6 - Very severe limitations 7 - Extremely severe limitations 8 - Extreme limitations |
“The LSC spatially ranks land as a class between 1-8, the higher the number the "decreasing capability of the land to sustain [agricultural] landuse”, whereby “Class 1 represents land capable of sustaining most land uses including those that have a high impact on the soil (e.g., regular cultivation), whilst class 8 represents land that can only sustain very low impact landuses (e.g., nature conservation)" |
|
ISF: Estimated Inherent Soil Fertility of NSW [54] |
1 - Low 2 - Moderately low 3 - Moderate 4 - Moderately high 5 - High |
“This map provides an estimation of the inherent fertility of soils in NSW. It uses the best available soils and natural resource mapping developed for the Land and Soil Capability (LSC) dataset.” |
| BSAL: Biophysical Strategic Agricultural Land [55] | 1 - Biophysical Strategic Agricultural Land | “Biophysical Strategic Agricultural Land (BSAL) is land with high quality soil and water resources capable of sustaining high levels of productivity. BSAL plays a critical role sustaining the State’s $12 billion agricultural industry. A polygon dataset that estimates the Biophysical Strategic Agricultural Land (BSAL) within New South Wales. These lands intrinsically have the best quality landforms, soil and water resources which are naturally capable of sustaining high levels of productivity and require minimal management practices to maintain this high quality.” |
|
SSAL: Draft State Significant Agricultural Land [56] |
1 - State Significant Agricultural Land |
“The mapping is in an early draft stage. The layers used to build this map are constrained and of variable quality. This exhibition process will help collect information about what aspects of the preliminary draft map are right, and where we need to make changes”. |
Table 3.
Land Soil and Capability results for Method 1’s boundaries by region (and NSW total). Each region shows three rows of data: land area for each class of land (1-8) in km2; the percentage of each class within the total area of each region (km2); and, comparative rankings /7 for each region based on the percentages.
| Class /Case | (best) 1 |
2 | 3 | 4 | 5 | 6 | 7 | (worst) 8 |
Total km2 |
|---|---|---|---|---|---|---|---|---|---|
| Byron (km2) | 0 | 0 | 1156 | 1013 | 357 | 1386 | 991 | 372 | 4119 |
| % | 0% | 0% | 21.9% | 19.2% | 6.8% | 26.3% | 18.8% | 7.1% | 100% |
| Rank/7 | 1 | 3 | 6 | 2 | 6 | 5 | |||
| Coffs | 0 | 0 | 256 | 818 | 662 | 692 | 1290 | 1572 | 5034 |
| % | 0% | 0% | 4.8% | 15.5% | 12.5% | 13.1% | 24.4% | 29.7% | 100% |
| Rank/7 | 3 | 4 | 4 | 5 | 5 | 1 | |||
| P. Macquarie | 0 | 0 | 376 | 592 | 252 | 1363 | 1362 | 1311 | 4880 |
| % | 0% | 0% | 7.2% | 11.3% | 4.8% | 25.9% | 25.9% | 24.9% | 100% |
| Rank/7 | 2 | 5 | 7 | 3 | 4 | 2 | |||
| L.Hunter | 0 | 0 | 241 | 1255 | 820 | 645 | 1860 | 112 | 4693 |
| % | 0% | 0% | 4.9% | 25.4% | 16.6% | 13.1% | 37.7% | 2.3% | 100% |
| Rank/7 | 4 | 2 | 2 | 7 | 1 | 6 | |||
| Sydney | 0 | 0 | 115 | 2046 | 483 | 674 | 1556 | 75 | 4834 |
| % | 0% | 0% | 2.3% | 41.3% | 9.8% | 13.6% | 31.4% | 1.5% | 100% |
| Rank/7 | 6 | 1 | 5 | 6 | 3 | 7 | |||
| Shoalhaven | 0 | 0 | 167 | 541 | 678 | 1323 | 1696 | 534 | 4772 |
| % | 0% | 0% | 3.4% | 11.0% | 13.7% | 26.8% | 34.3% | 10.8% | 100% |
| Rank/7 | 7 | 6 | 3 | 4 | 2 | 4 | |||
| Bega | 0 | 0 | 56 | 358 | 1552 | 1590 | 882 | 872 | 5254 |
| % | 0% | 0% | 1.1% | 6.7% | 29.2% | 30.0% | 16.6% | 16.4% | 100% |
| Rank/7 | 7 | 7 | 1 | 1 | 7 | 3 | |||
| NSW | 0 | 14659 | 116025 | 190846 | 154928 | 174023 | 108783 | 48889 | 677469 |
| % | 0% | 1.8% | 14.4% | 23.6% | 19.2% | 21.5% | 13.5% | 6.0% | 100% |
Table 4.
This shows Land Soil and Capability results based on Method 2 boundary areas for each region (and NSW total). Each region shows three rows of data: land area for each class of land (1-8) in km2; the percentage of each class within the total area of each region (km2); and, comparative rankings /7 for each region based on percentages.
| Class /Case | (best) 1 |
2 | 3 | 4 | 5 | 6 | 7 | (worst) 8 |
Total km2 |
|---|---|---|---|---|---|---|---|---|---|
| Byron (km2) | 0 | 0 | 538 | 216 | 34 | 722 | 506 | 106 | 2123 |
| % | 0% | 0% | 25.4% | 10.2% | 1.6% | 24.2% | 28.0% | 0.2% | 100% |
| Rank/7 | 1 | 5 | 7 | =2 | =4 | =6 | |||
| Coffs | 0 | 0 | 282 | 701 | 425 | 709 | 1072 | 784 | 3974 |
| % | 0% | 0% | 7.1% | 17.6% | 10.7% | 17.8% | 27.0% | 19.7% | 100% |
| Rank/7 | 3 | 3 | 5 | 5 | 6 | 1 | |||
| P. Macq | 0 | 0 | 321 | 135 | 1064 | 775 | 897 | 6 | 3198 |
| % | 0% | 0% | 10.0% | 4.2% | 33.3% | 24.2% | 28.0% | 0.2% | 100% |
| Rank/7 | 2 | 6 | 1 | =2 | =4 | =6 | |||
| L.Hunter | 0 | 0 | 170 | 1140 | 565 | 599 | 1156 | 184 | 3814 |
| % | 0% | 0% | 4.5% | 29.9% | 14.8% | 15.7% | 30.3% | 4.8% | 100% |
| Rank/7 | 4 | 2 | 4 | 6 | 3 | 4 | |||
| Sydney | 0 | 0 | 115 | 2046 | 483 | 674 | 1556 | 75 | 4949 |
| % | 0% | 0% | 2.3% | 41.3% | 9.8% | 13.6% | 31.4% | 1.5% | 100% |
| Rank/7 | 6 | 1 | 6 | 7 | 2 | 5 | |||
| Shoalhaven | 0 | 0 | 207 | 601 | 710 | 1062 | 1545 | 529 | 4654 |
| % | 0% | 0% | 4.4% | 12.9% | 15.2% | 22.8% | 33.2% | 11.4% | 100% |
| Rank/7 | 5 | 4 | 3 | 4 | 1 | 3 | |||
| Bega | 0 | 0 | 62 | 95 | 1462 | 2390 | 1246 | 1047 | 6302 |
| % | 0% | 0% | 1.0% | 1.5% | 23.2% | 37.9% | 19.8% | 16.6% | 100% |
| Rank/7 | 7 | 7 | 2 | 1 | 7 | 2 | |||
| NSW | 0 | 14659 | 116025 | 190846 | 154928 | 174023 | 108783 | 48889 | 808153 |
| % | 0% | 1.8% | 14.4% | 23.6% | 19.2% | 21.5% | 13.5% | 6.0% | 100% |
Table 5.
Inherent Soil Fertility results based on Method 1 boundary areas for each region (and NSW total). Each region shows three rows of data: land area for each class of land (1-8) in km2; the percentage of each class within the total area of each region (km2); and, comparative rankings /7 for each region based on percentages.
| Class / Case | (best) 5 |
4 | 3 | 2 | (worst) 1 |
Total km |
|---|---|---|---|---|---|---|
| Byron (km2) | 433 | 1929 | 728 | 1830 | 356 | 5275 |
| % | 8.2% | 36.6% | 13.8% | 34.7% | 6.7% | 100% |
| Rank/7 | 1 | 1 | 5 | 6 | 7 | |
| Coffs | 0 | 1035 | 1037 | 1958 | 1260 | 5290 |
| % | 0% | 19.6% | 19.6% | 37.0 | 23.8% | 100% |
| Rank/7 | =6 | 2 | 2 | 5 | 3 | |
| P. Macq | 37 | 871 | 1840 | 604 | 1907 | 5259 |
| % | 0.7% | 16.6% | 35.0% | 11.5% | 36.3% | 100% |
| Rank/7 | 3 | 3 | 1 | 7 | 1 | |
| L.Hunter | 8 | 347 | 493 | 3015 | 1053 | 4917 |
| % | 0.2% | 7.0% | 9.9% | 60.5% | 21.1.% | 100% |
| Rank/7 | 5 | 5 | 7 | 2 | 5 | |
| Sydney | 118 | 333 | 679 | 2376 | 1562 | 5068 |
| % | 2.3% | 6.6% | 13.4% | 46.9% | 30.8% | 100% |
| Rank/7 | 2 | 6 | 6 | 4 | 2 | |
| Shoalhaven | 0 | 272 | 803 | 2644 | 1220 | 4939 |
| % | 0% | 5.5% | 16.3% | 53.5% | 24.7% | 100% |
| Rank/7 | =6 | 7 | 4 | 3 | 4 | |
| Bega | 35 | 436 | 994 | 3474 | 370 | 5310 |
| % | 0.7% | 8.2% | 18.7% | 65.4% | 7.0% | 100% |
| Rank/7 | 4 | 4 | 3 | 1 | 6 | |
| NSW | 12343 | 62812 | 247824 | 275313 | 167239 | 765531 |
| 1.6% | 8.2% | 32.4% | 36.0% | 21.8% | 100% |
Table 6.
This shows Inherent Soil Fertility results based on Method 2 boundary areas for each region (and NSW total). Each region shows three rows of data: land area for each class of land (1-8) in km2; the percentage of each class within the total area of each region (km2); and, comparative rankings /7 for each region based on percentages.
| Class / Case | (best) 5 |
4 | 3 | 2 | (worst) 1 |
Total km |
|---|---|---|---|---|---|---|
| Byron (km2) | 169 | 1127 | 254 | 482 | 91 | 2123 |
| % | 8.0% | 53.1% | 12.0% | 22.7% | 4.3% | 100% |
| Rank/7 | 1 | 1 | 5 | 6 | 6 | |
| Coffs | 0 | 840 | 1108 | 1386 | 640 | 3974 |
| % | 0% | 21.1% | 27.9% | 34.9% | 16.1% | 100% |
| Rank/7 | =6 | 2 | 2 | 5 | 5 | |
| P. Macq | 25 | 622 | 1270 | 398 | 1113 | 3428 |
| % | 0.7% | 18.1% | 37.1% | 11.6% | 32.5% | 100% |
| Rank/7 | 4 | 3 | 1 | 7 | 1 | |
| L.Hunter | 61 | 283 | 433 | 2273 | 810 | 3859 |
| % | 1.6% | 7.3% | 11.2% | 58.9% | 21.0% | 100% |
| Rank/7 | 3 | 4 | 6 | 2 | 4 | |
| Sydney | 118 | 333 | 679 | 2376 | 1562 | 5068 |
| % | 2.3% | 6.6% | 13.4% | 46.9% | 30.8% | 100% |
| Rank/7 | 2 | 6 | 4 | 4 | 2 | |
| Shoalhaven | 0 | 336 | 862 | 2282 | 1174 | 4654 |
| % | 0% | 7.2% | 18.5% | 49.0% | 25.2% | 100% |
| Rank/7 | =6 | 5 | 3 | 3 | 3 | |
| Bega | 16 | 186 | 457 | 5370 | 0 | 6029 |
| % | 0.3% | 3.1% | 7.6% | 89.1% | 0% | 100% |
| Rank/7 | 5 | 7 | 7 | 1 | 7 | |
| NSW | 12343 | 62812 | 247824 | 275313 | 167239 | 765531 |
| 1.6% | 8.2% | 32.4% | 36.0% | 21.8% | 100% |
Table 7.
Biophysical Strategic Agricultural Land (BSAL) for Method’s 1 and 2.
| BSAL | Method 1 | Method 2 | ||||
|---|---|---|---|---|---|---|
| BSAL km2 | Boundary area km2 | % of area | BSAL km2 | Boundary area km2 | % of area | |
| Byron | 975 | 5293 | 18.4 % | 550 | 2346 | 23.5 % |
| Coffs | 245 | 5297 | 4.6 % | 279 | 4264 | 6.5 % |
| Port Mac | 294 | 5275 | 5.6 % | 176 | 3681 | 4.8 % |
| LH | 398 | 5012 | 7.9 % | 289 | 5794 | 5.0 % |
| SYD | 103 | 5340 | 1.9 % | 103 | 5340 | 1.9 % |
| Nowra | 163 | 4974 | 3.3 % | 201 | 4947 | 4.1 % |
| Bega | 35 | 5318 | 0.7 % | 47 | 6294 | 0.8 % |
| NSW | 30945 | 810213 | 3.8 % | |||
Table 8.
State Significant Agricultural Land (SSAL, draft dataset) for Method’s 1 and 2.
| SSAL | Method 1 | Method 2 | ||||
|---|---|---|---|---|---|---|
| SSAL km2 | Boundary area km2 | % of area | SSAL km2 | Boundary area km2 | % of area | |
| Byron | 2212 | 5293 | 41.8 % | 1091 | 2346 | 46.5 |
| Coffs | 414 | 5297 | 7.8 % | 419 | 4264 | 9.8 |
| Port Mac | 524 | 5275 | 9.9 % | 351 | 3681 | 9.5 |
| LH | 390 | 5012 | 7.8 % | 312 | 5794 | 5.4 |
| SYD | 246 | 5340 | 4.6 % | 246 | 5340 | 4.6 |
| Nowra | 199 | 4974 | 4.0 % | 242 | 4947 | 4.9 |
| Bega | 96 | 5318 | 1.8 % | 68 | 6294 | 1.1 |
| NSW | 94914 | 810213 | 11.7 % | |||
Disclaimer/Publisher’s Note: The statements, opinions and data contained in all publications are solely those of the individual author(s) and contributor(s) and not of MDPI and/or the editor(s). MDPI and/or the editor(s) disclaim responsibility for any injury to people or property resulting from any ideas, methods, instructions or products referred to in the content. |
© 2025 by the authors. Licensee MDPI, Basel, Switzerland. This article is an open access article distributed under the terms and conditions of the Creative Commons Attribution (CC BY) license (http://creativecommons.org/licenses/by/4.0/).
Copyright: This open access article is published under a Creative Commons CC BY 4.0 license, which permit the free download, distribution, and reuse, provided that the author and preprint are cited in any reuse.


