Preprint
Article

This version is not peer-reviewed.

Geospatial Analysis of Regional Disparities in Non-Grain Cultivation: Spatiotemporal Patterns and Driving Mechanisms in Jiangsu, China

A peer-reviewed article of this preprint also exists.

Submitted:

15 February 2025

Posted:

18 February 2025

You are already at the latest version

Abstract

Balancing regional disparities in non-grainization at the prefecture level is vital for stable grain production and sustainable urbanization. This study employs geospatial analysis to examine the spatiotemporal patterns and driver factors of non-grainization in Jiangsu Province from 2001 to 2020. By integrating geospatial data from 77 county-level units and employing spatial autocorrelation analysis, multiple linear regression, and Mixed Geographically Weighted Regression (MGWR), this study reveals the spatial heterogeneity and key driving factors of non-grainization. The results indicate that despite cyclical fluctuations in the provincial non-grainization rate, significant regional differences persist. High–high clusters are evident in economically developed southern and coastal areas, while low–low clusters are observed in less developed northern regions, indicating strong spatial dependence. Furthermore, the analysis reveals that rural residents' per capita disposable income and total agricultural output contribute to the process of non-grainization, emphasizing the impact of economic development on land use decisions. These findings highlight the importance of geoinformation tools in managing regional disparities. Integrating spatial and socioeconomic analysis offers practical insights for policymakers to develop targeted strategies that balance food security with agricultural diversification. This study provides valuable insights for policymakers seeking to optimize land-use planning in rapidly urbanizing agricultural regions.

Keywords: 
;  ;  ;  ;  

1. Introduction

Food security is a fundamental human right and a cornerstone of both national political stability and sustainable socio-economic development [1]. As one of the most populous countries in the world, China faces immense challenges in maintaining food security, particularly in the context of rapid urbanization and industrialization [2]. The accelerated growth of China’s economy, coupled with increasing demands for industrial and commercial land, has exerted considerable pressure on agricultural land, especially in highly urbanized regions. Despite the boom in staple crop production [3], the reduction in arable land presents significant challenges, including farmland conversion, abandonment, and a shift from grain production to non-grain production (NGP). These trends have raised concerns among policymakers, researchers, and the public.
The NGP of cropland impacts not only food security but also introduces significant risks such as rural social imbalances, agricultural landscape fragmentation, and eco-system degradation [4]. These challenges collectively undermine the sustainable development of regional economies. Currently, extensive research is being conducted on the non-grain production of cultivated land (NGPCL), focusing primarily on the identification of NGPCL through remote sensing imagery [5,6,7], identification of non-grain sensitive factors [8], analysis of the relationship between NGPCL and the intensive utilization of cultivated land [9], spatial analysis of NGPCL [10], and the impact of factors such as the stability of land contracting and management rights on NGPCL [11]. Re-search on NGP has been conducted at various scales, including at the national [12], regional[4,10], provincial [6], county [13], village [12], and household levels [11].
In response to these pressures, the Chinese government has implemented a series of policy measures aimed at safeguarding arable land and stabilizing grain production. The 2021 revision of China's Land Management Law reinforces the prioritization of grain crops over other agricultural land uses, while policy initiatives such as the State Council's 2020 Directive and the Central Committee’s No. 1 Document of 2021 have been enacted to curb non-grainization trends. Despite these measures, the balancing act between promoting grain production and addressing the growing demand for other agricultural products remains a formidable challenge. This issue is particularly pressing for rapidly urbanizing regions, where competition for land resources is intense, and agricultural profitability is increasingly influenced by market dynamics.
Jiangsu Province, as one of China’s most economically advanced and urbanized coastal regions, offers a unique context for studying the interplay between economic development, urbanization, and agricultural land use [14]. The grain output in Jiangsu Province has increased from 31.06 to 37.29 million tons, while the grain sown area only grew from 5,304 to 5,405.64 thousand hectares over the same period. The primary contribution to the increase in grain output comes from improvements in the yield per unit of cultivated area. However, changes in the grain sown area vary significantly across different regions within Jiangsu Province. Examining regional disparities in grain and non-grain crop cultivation is essential for optimizing agricultural resource allocation and ensuring sustainable land use. As economic transformations and market demands drive shifts in crop choices, significant regional differences in crop allocation have emerged, impacting food security and agricultural resilience. Analyzing these spatial patterns provides critical insights into the drivers of agricultural land use and will enable tailored policy interventions for diverse regions. The outcomes of this study will aid sustainable agriculture and address regional food production needs in a way that sup-ports global food security.
This study investigated the spatiotemporal changes in grain and non-food crop cultivation across 77 counties and cities in Jiangsu Province. The socio-economic, environmental, and policy factors influencing land use decisions in the region were investigated using spatial analysis techniques and statistical modeling. The findings provide valuable insights into the regional disparities in agricultural land use and offer poli-cy-relevant conclusions for addressing the challenges of non-grainization in other regions undergoing similar transformations. Moreover, this study contributes to the broader discourse on sustainable land use management in rapidly urbanizing areas, with implications for national and global food security strategies.

2. Materials and Methods
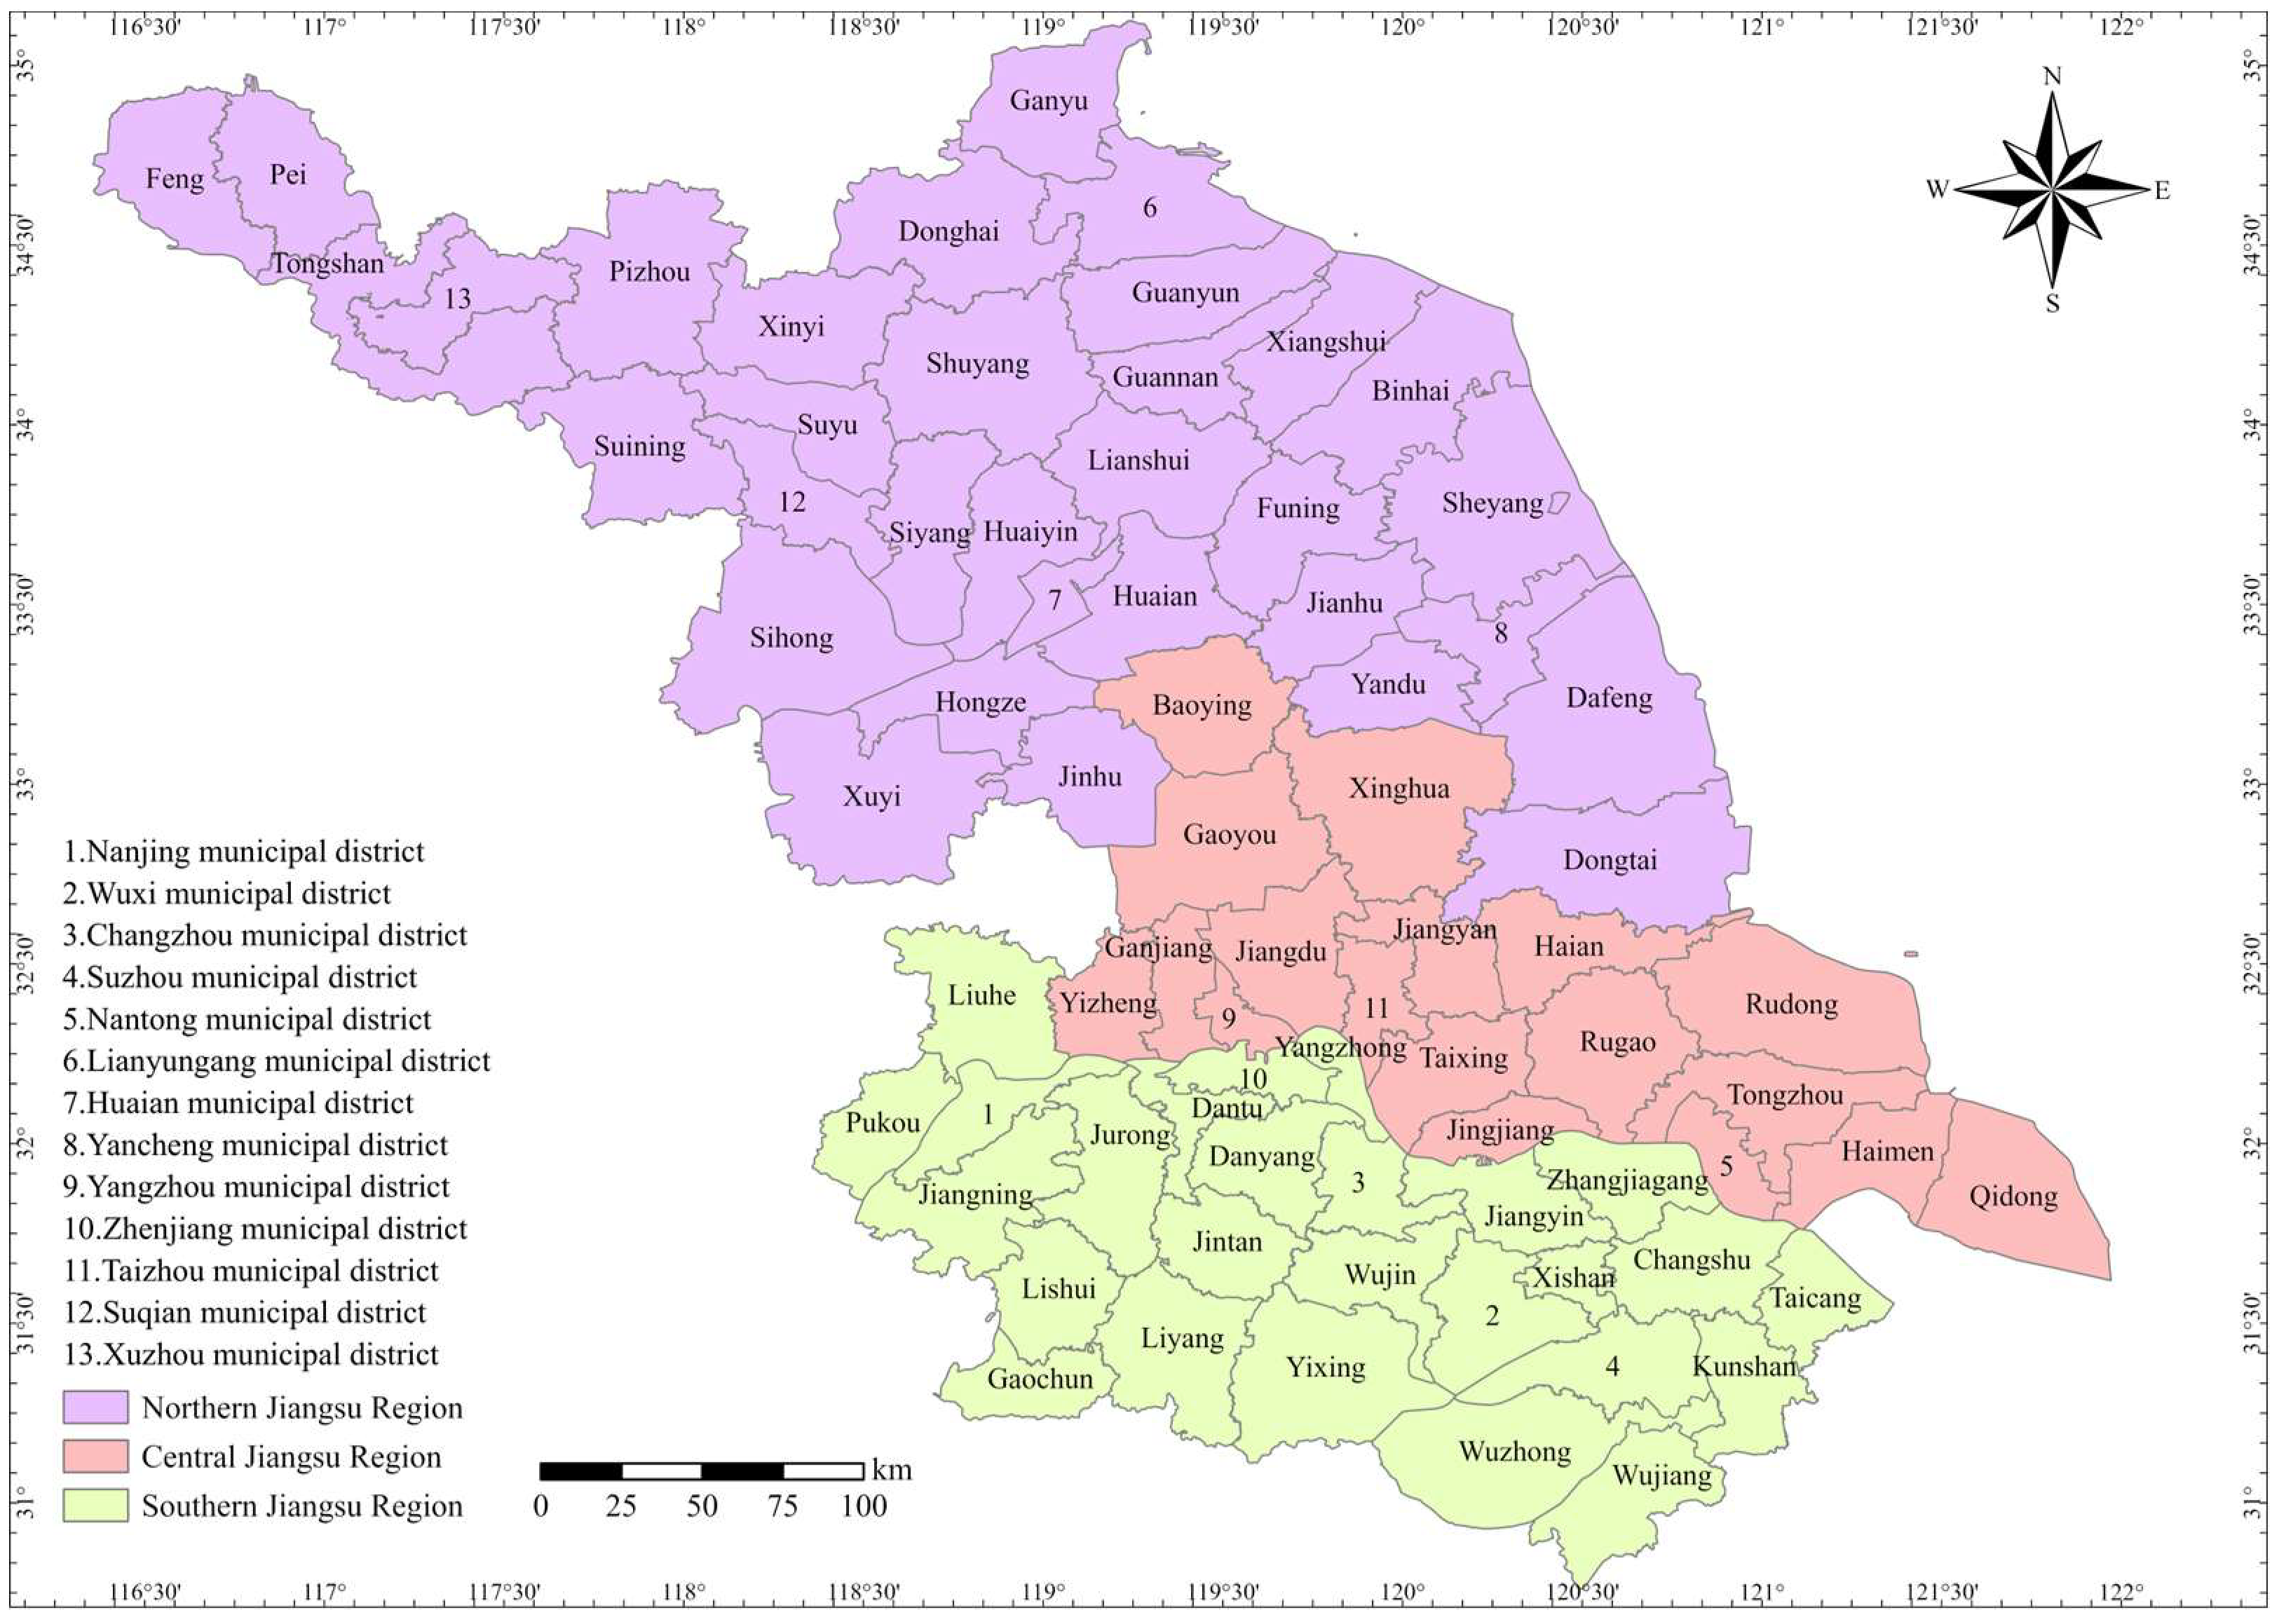
2.1. Study Area

Jiangsu Province covers a land area of 107,200 km² and is divided into 13 prefecture-level cities. The region spans a transition zone from a warm temperate to subtropical climate, with a temperate monsoon climate in northern Jiangsu and a subtropical monsoon climate in the central and southern regions. These climatic variations create favorable conditions for a wide variety of agricultural practices, earning Jiangsu the title of the "land of fish and rice." The province's terrain is predominantly flat, with extensive arable land resources and fertile soils, offering an excellent environment for agricultural production.
As one of China's most economically developed regions, Jiangsu is characterized by concentrated economic activity and a high population density. As of 2020, the province's arable land area was 70,400 km². However, the rapid industrialization and urbanization occurring in the early 21st century has led to changes in land-use patterns within the province. Both the total and per capita cultivated land areas have subsequently declined with urbanization. This study focused on the 77 counties within Jiangsu Province (Figure 1), analyzing the spatiotemporal characteristics and driving factors of non-grain cultivation at the county level.

2.2. Data Resources

The data used in this study were collected from several authoritative sources. Population, gross domestic product (GDP), and per capita disposable income of rural residents were sourced from the China Statistical Yearbooks, Jiangsu Provincial Statistical Yearbooks, and various statistical yearbooks of Jiangsu's prefecture-level cities (2002–2021). The cultivated land areas for the 77 county-level units were derived from the annual land cover dataset produced by the research team led by Professors Jie Yang and Xin Huang at Wuhan University. Additionally, data on total agricultural machinery power, rural employment, total agricultural output value, village groups, rural electricity consumption, agricultural chemical fertilizer application, and pesticide usage were sourced from the Jiangsu Provincial Rural Statistical Yearbooks (2002–2021), the Third National Agricultural Census of Jiangsu Province, and the statistical bulletins on the national economic and social development of relevant county-level cities.

2.3. Methods

2.3.1. Measurement of the "Non-grainization" Level

Defining the concept of "non-grainization" is crucial to ensuring the reliability and precision of research on this phenomenon in cultivated land. Based on existing studies, the degree of non-grainization is often measured from a macro perspective at the county level, using planting structure as an indicator. Specifically, it is typically defined and measured as the proportion of non-grain crop sown area to the total sown area of all crops. This ratio plays a key role in depicting the planting structure and trends in non-grainization for a given region. In this study, we considered Jiangsu Province as a case study to explore the characteristics of non-grainization by measuring the non-grain crop sown area relative to the total sown area of crops across county-level units. The calculation was as follows:
R n f = A n f A f × 100 %
where Rnf represents the non-grainization rate and Anf is the sown area of non-grain crops, i.e., all crops except for grains. Grains are defined as rice, wheat, and corn. Af represents the total sown area of crops.
To better understand the long-term evolution of influencing factors, the socio-economic factors driving non-grainization at the county level were selected from three dimensions: the degree of social development, the level of economic development, and rural infrastructure (Table 1). In Table 1, X1–X4 represent social structure, demographic characteristics, and rural employment; X5–X7 represent the overall level of regional economic development and agricultural economic performance; and X8–X11 represent rural infrastructure and resource inputs, respectively.

2.3.2. Spatial Autocorrelation

Spatial autocorrelation refers to the dependency of a variable at a given observation point on other data points within the same spatial distribution. It therefore measures the degree of correlation in spatial distribution patterns and helps to analyze the characteristics of spatial phenomena [15]. Because the global Moran's I index can only reflect the overall distribution characteristics and does not identify areas of element clustering, the local Moran's I was used for the analysis in this study. It was implemented using GeoDa software [16]. The formula is as follows:
I i = Z i S 2 j i n W i j Z j
Z i = x i x ¯
Z j = x j x ¯
S 2 = 1 n ( x i x ¯ ) 2
In Equations 2–5, Ii represents the local Moran's I for region i. The value of S2 is always positive, so the sign of Ii depends on and ​. When Ii > 0, high-value spatial units are surrounded by similarly high-value areas (H–H), and when Ii < 0, low-value spatial units are surrounded by similarly low-value areas (L–L).

2.3.3. Multiple Linear Regression and Mixed Geographically Weighted Regression

Multiple linear regression (MLR) is a global regression method used to describe the linear relationship between a dependent variable and two or more independent variables, predicting the trends in the dependent variable based on multiple independent variables without considering the spatial location of the study units [17]. This analysis was performed using SPSS software, and the multicollinearity among the factors was initially tested; factors with a variance inflation factor (VIF) > 10.0, indicating significant colinearity, were excluded.
Geographically weighted regression (GWR) incorporates the spatial location of the study units into the model, allowing the relationships between variables to vary with geographic location. The mixed geographically weighted regression (MGWR) model is an extension of the GWR model [18]. In ordinary GWR, the relationship between the independent and dependent variables changes with the geographic location of the observation points, making it difficult for the results to reflect the local characteristics of each variable. However, MGWR effectively addresses spatial non-stationarity, reflecting the true attributes of spatial data and improving the model fit. The model divides the coefficients into two parts: one part remains constant (the global coefficients), while the other varies with the spatial coordinates (the local coefficients). The model was implemented using the MGWR 2.2 software developed by Arizona State University. The model formula is as follows:
y i = j = 0 q β j x i j + j = q + 1 p β j ( u i , v i ) x i j + ε i
In Equation 6, i = 1, 2, …,n;j = 1, 2, …,q;βj are unknown constants, and βj(ui,vi)(j = q + 1,q + 2,…,p)are unknown parameters at observation point (ui,vi), which are functions of the spatial coordinates (ui,vi).

3. Results

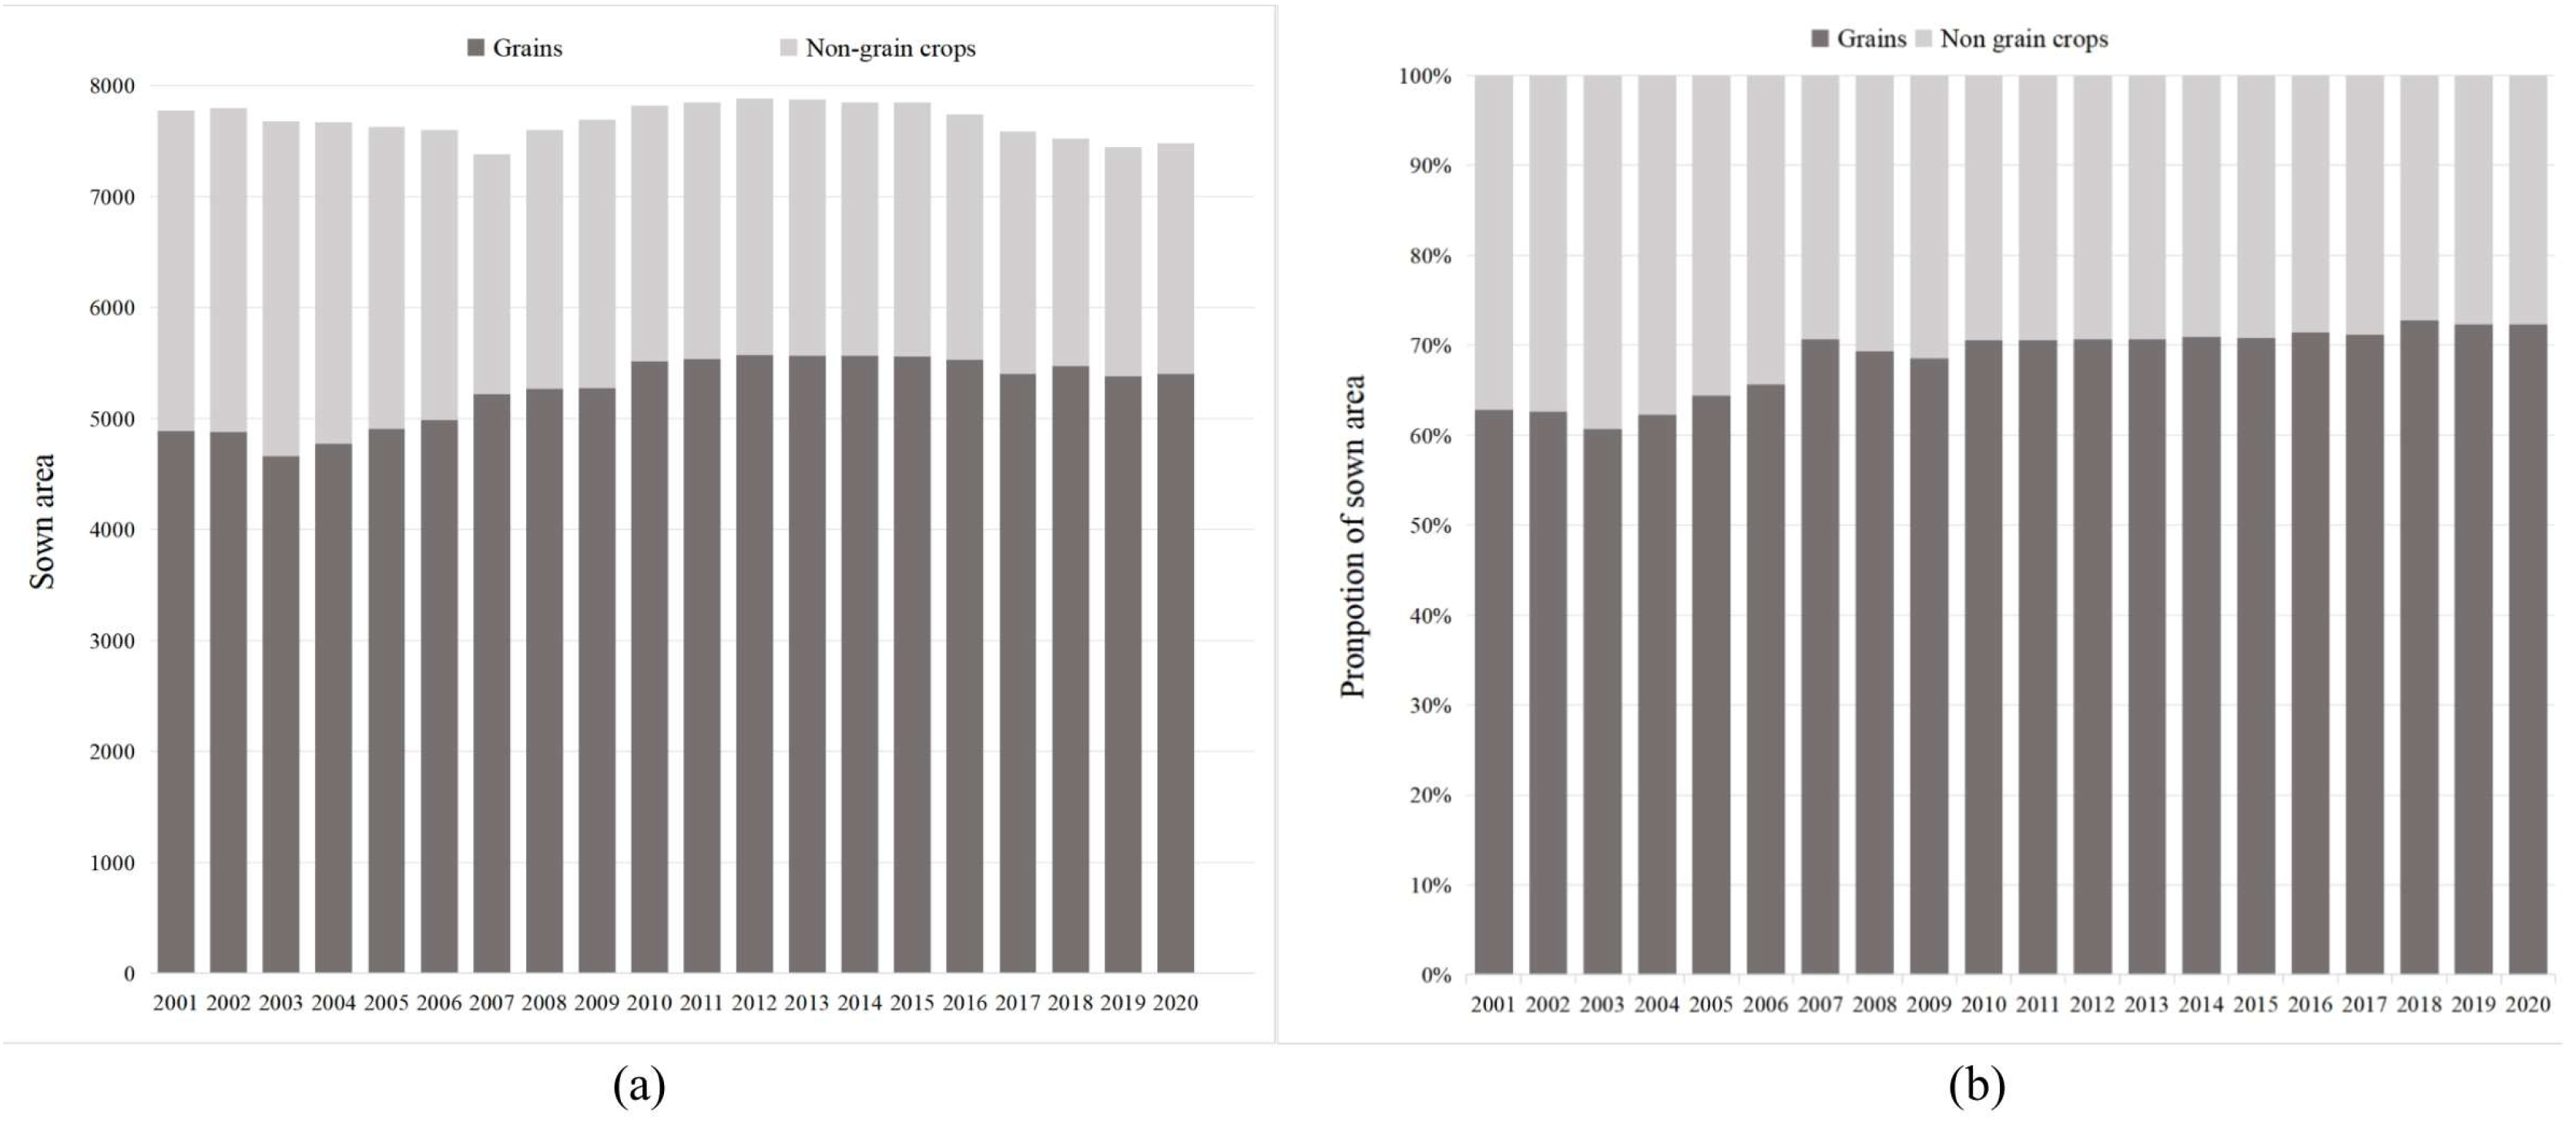
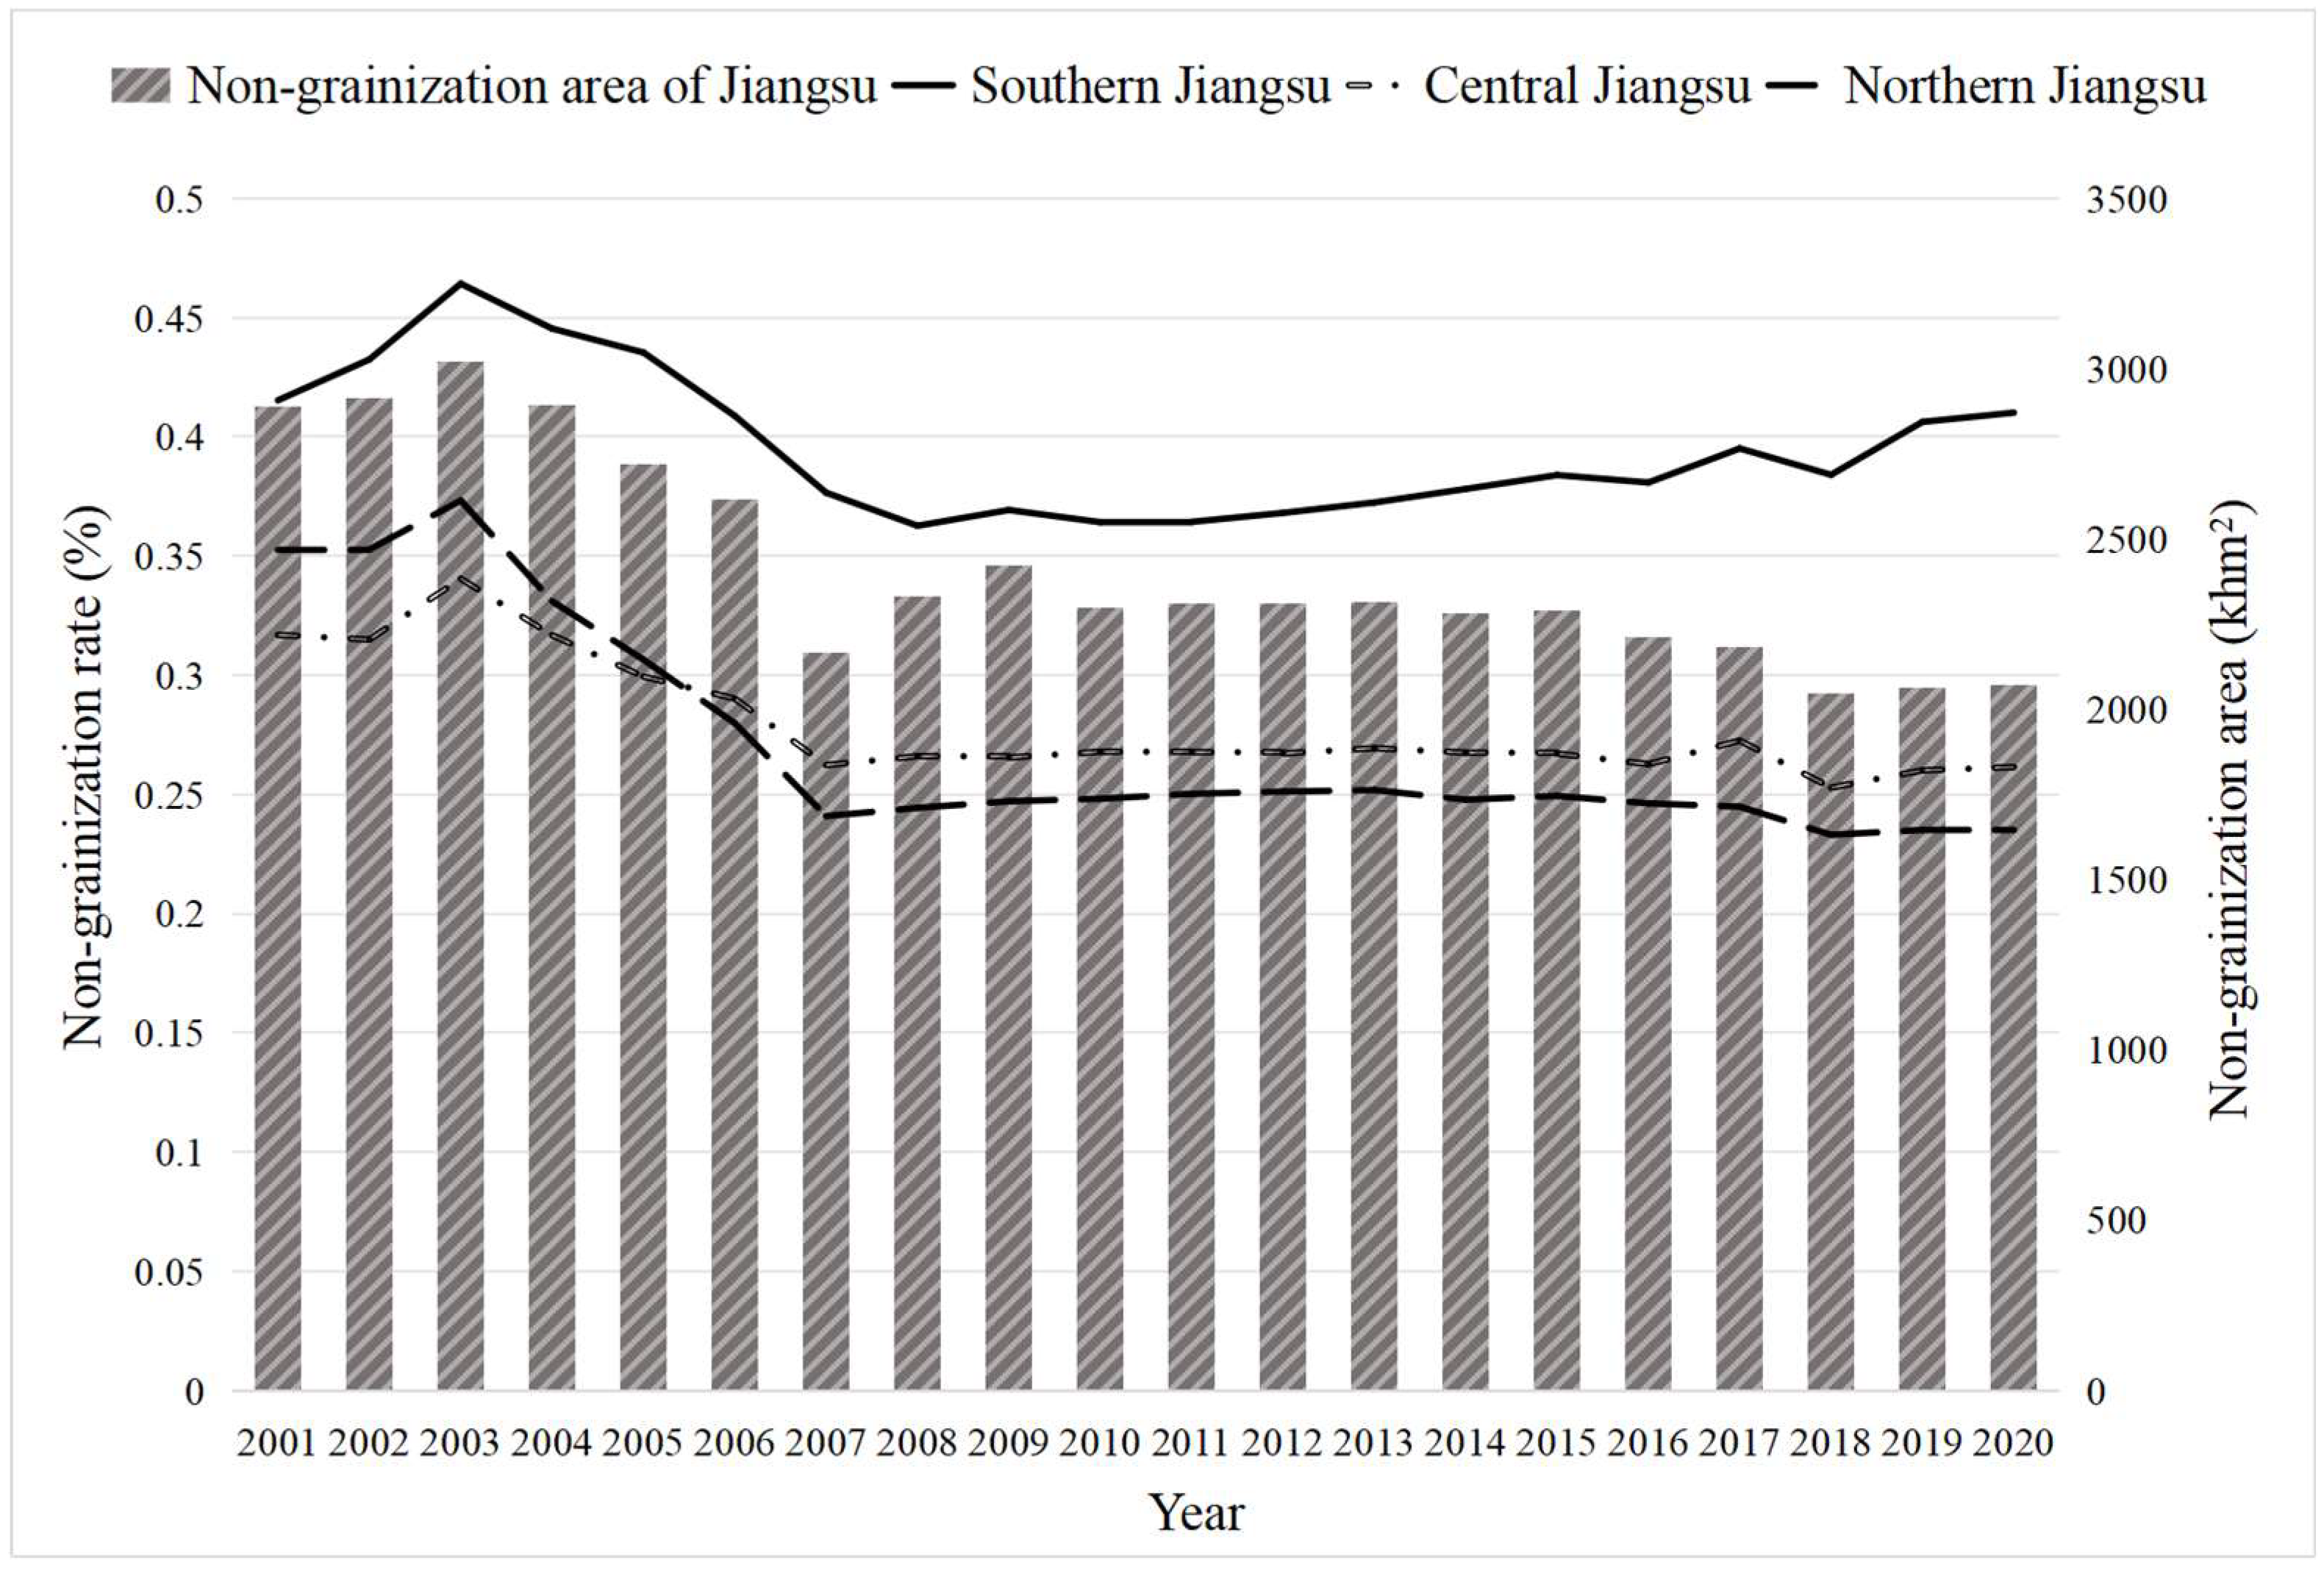
3.1. Temporal Characteristics of Non-grainization in Jiangsu Province's Cultivated Land

From 2001 to 2007, the total sown area of crops in Jiangsu Province exhibited a decreasing trend. However, during the period 2000–2003, the area of non-grain cultivation increased, while the grain sown area decreased (Figure 2a), a trend consistent with national patterns. From 2000 to 2003, the non-grainization rate of cultivated land in Jiangsu Province continuously increased, reaching 39.34%. In 2003, the nationwide grain sown area reached its lowest point. This was mainly due to urbanization, industrialization, the migration of rural laborers, and the abandonment of arable land, which reduced incentives for farmers to grow grain. Starting in 2003, China began to implement agricultural tax reforms and various grain production subsidies, significantly increasing farmers' enthusiasm for grain cultivation. As a result, from 2003 to 2007, the area of non-grain cultivation decreased, and the grain sown area increased. From 2007 to 2015, the total sown area of crops in Jiangsu displayed a general upward trend, with both non-grain cultivation and grain sown areas slowly increasing. Between 2003 and 2007, the non-grainization rate decreased continuously. However, from 2007 to 2020, the non-grainization rate only gradually declined, dropping to 27.72% (Figure 2b).
The non-grainization rate of cultivated land in southern Jiangsu was significantly higher than in central and northern Jiangsu (Figure 3). In southern Jiangsu, the non-grainization rate rose rapidly from 2001 to 2003, reaching 46.42%, and then gradually decreased to 36.27% between 2004 and 2008. From 2008 to 2020, the non-grainization rate rose steadily by 5%, and was largely influenced by the agricultural market and rural revitalization efforts in the region, which reduced the grain sown area. In central Jiangsu, the non-grainization rate increased to 34.05% from 2001 to 2003, decreased to 26.23% between 2003 and 2007, and then entered a period of stability. In northern Jiangsu, the non-grainization rate rose to 37.33% from 2001 to 2003, decreased to 24.09% between 2003 and 2007, and then stabilized. The trends in the non-grainization rate in central and northern Jiangsu were largely consistent, with northern Jiangsu having slightly lower rates than central Jiangsu after 2005.
At the county level, the trends in the non-grainization rate of cultivated land in Jiangsu's counties from 2001 to 2020 could be categorized into five types: "increase–decrease–increase," "continuous increase," "stable," "increase–decrease–stable," and "continuous decrease" (Figure 4). The fluctuations in the non-grainization rate from 2001 to 2020 could be summarized as follows:
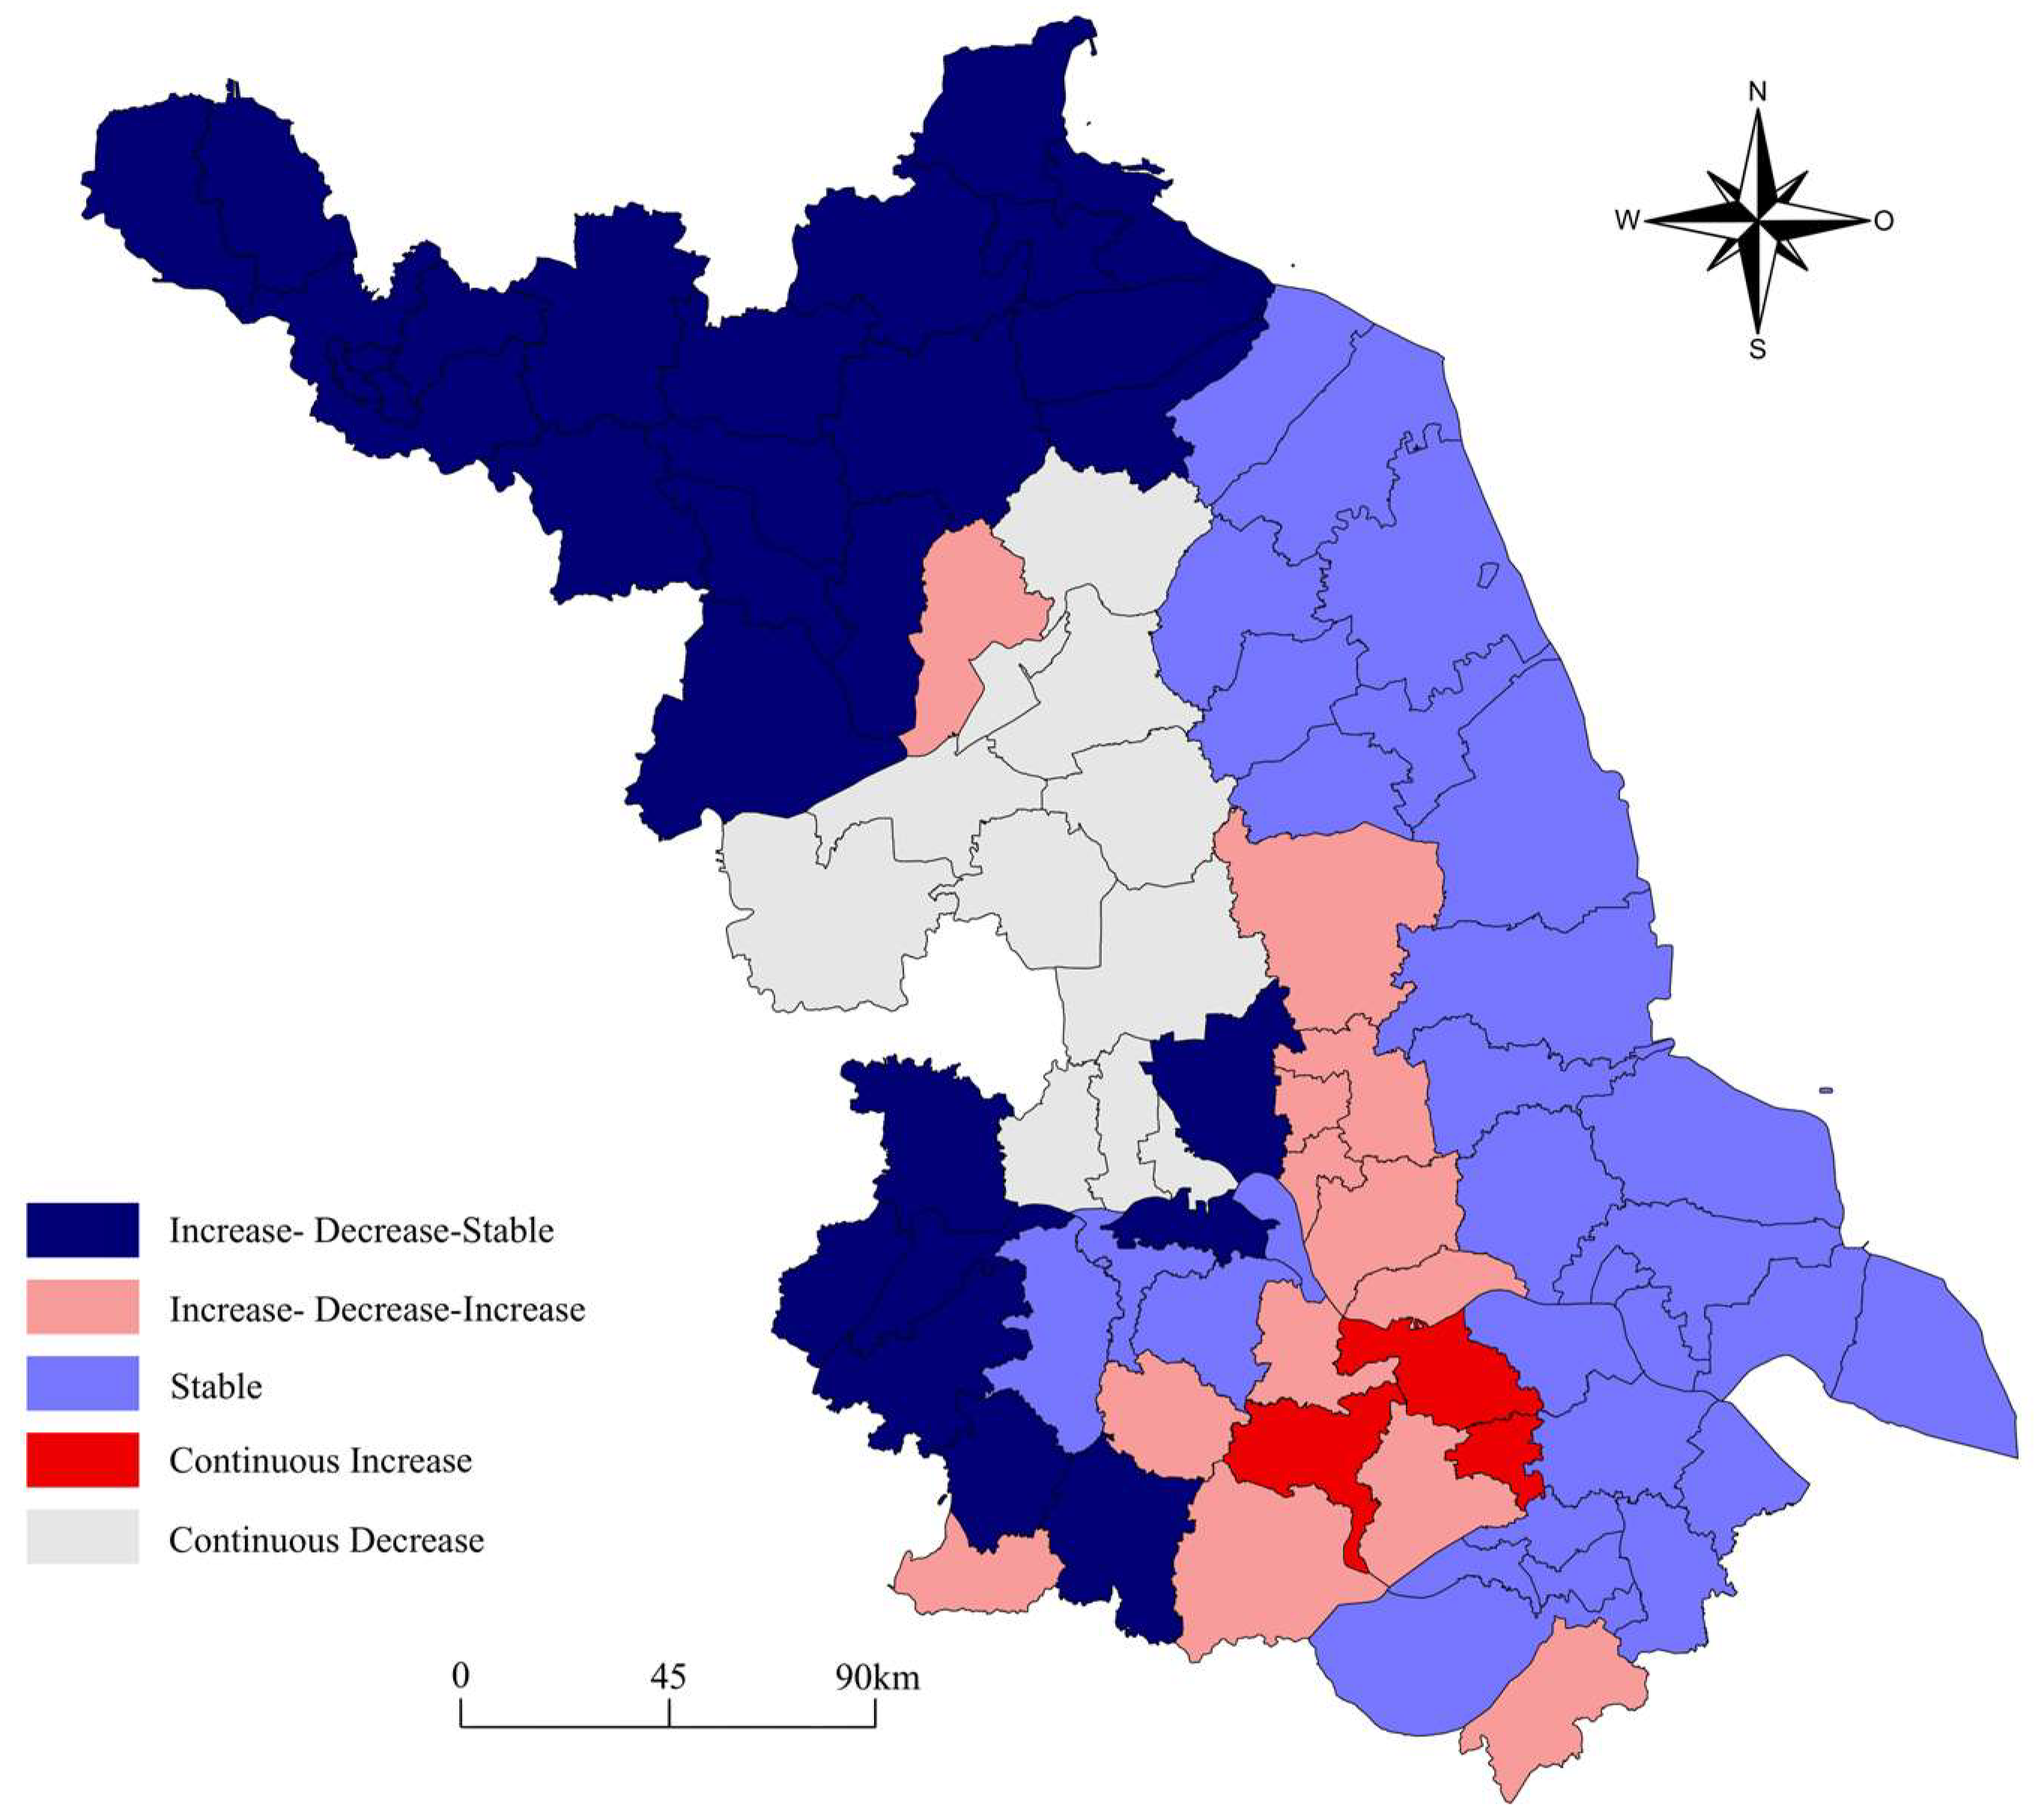
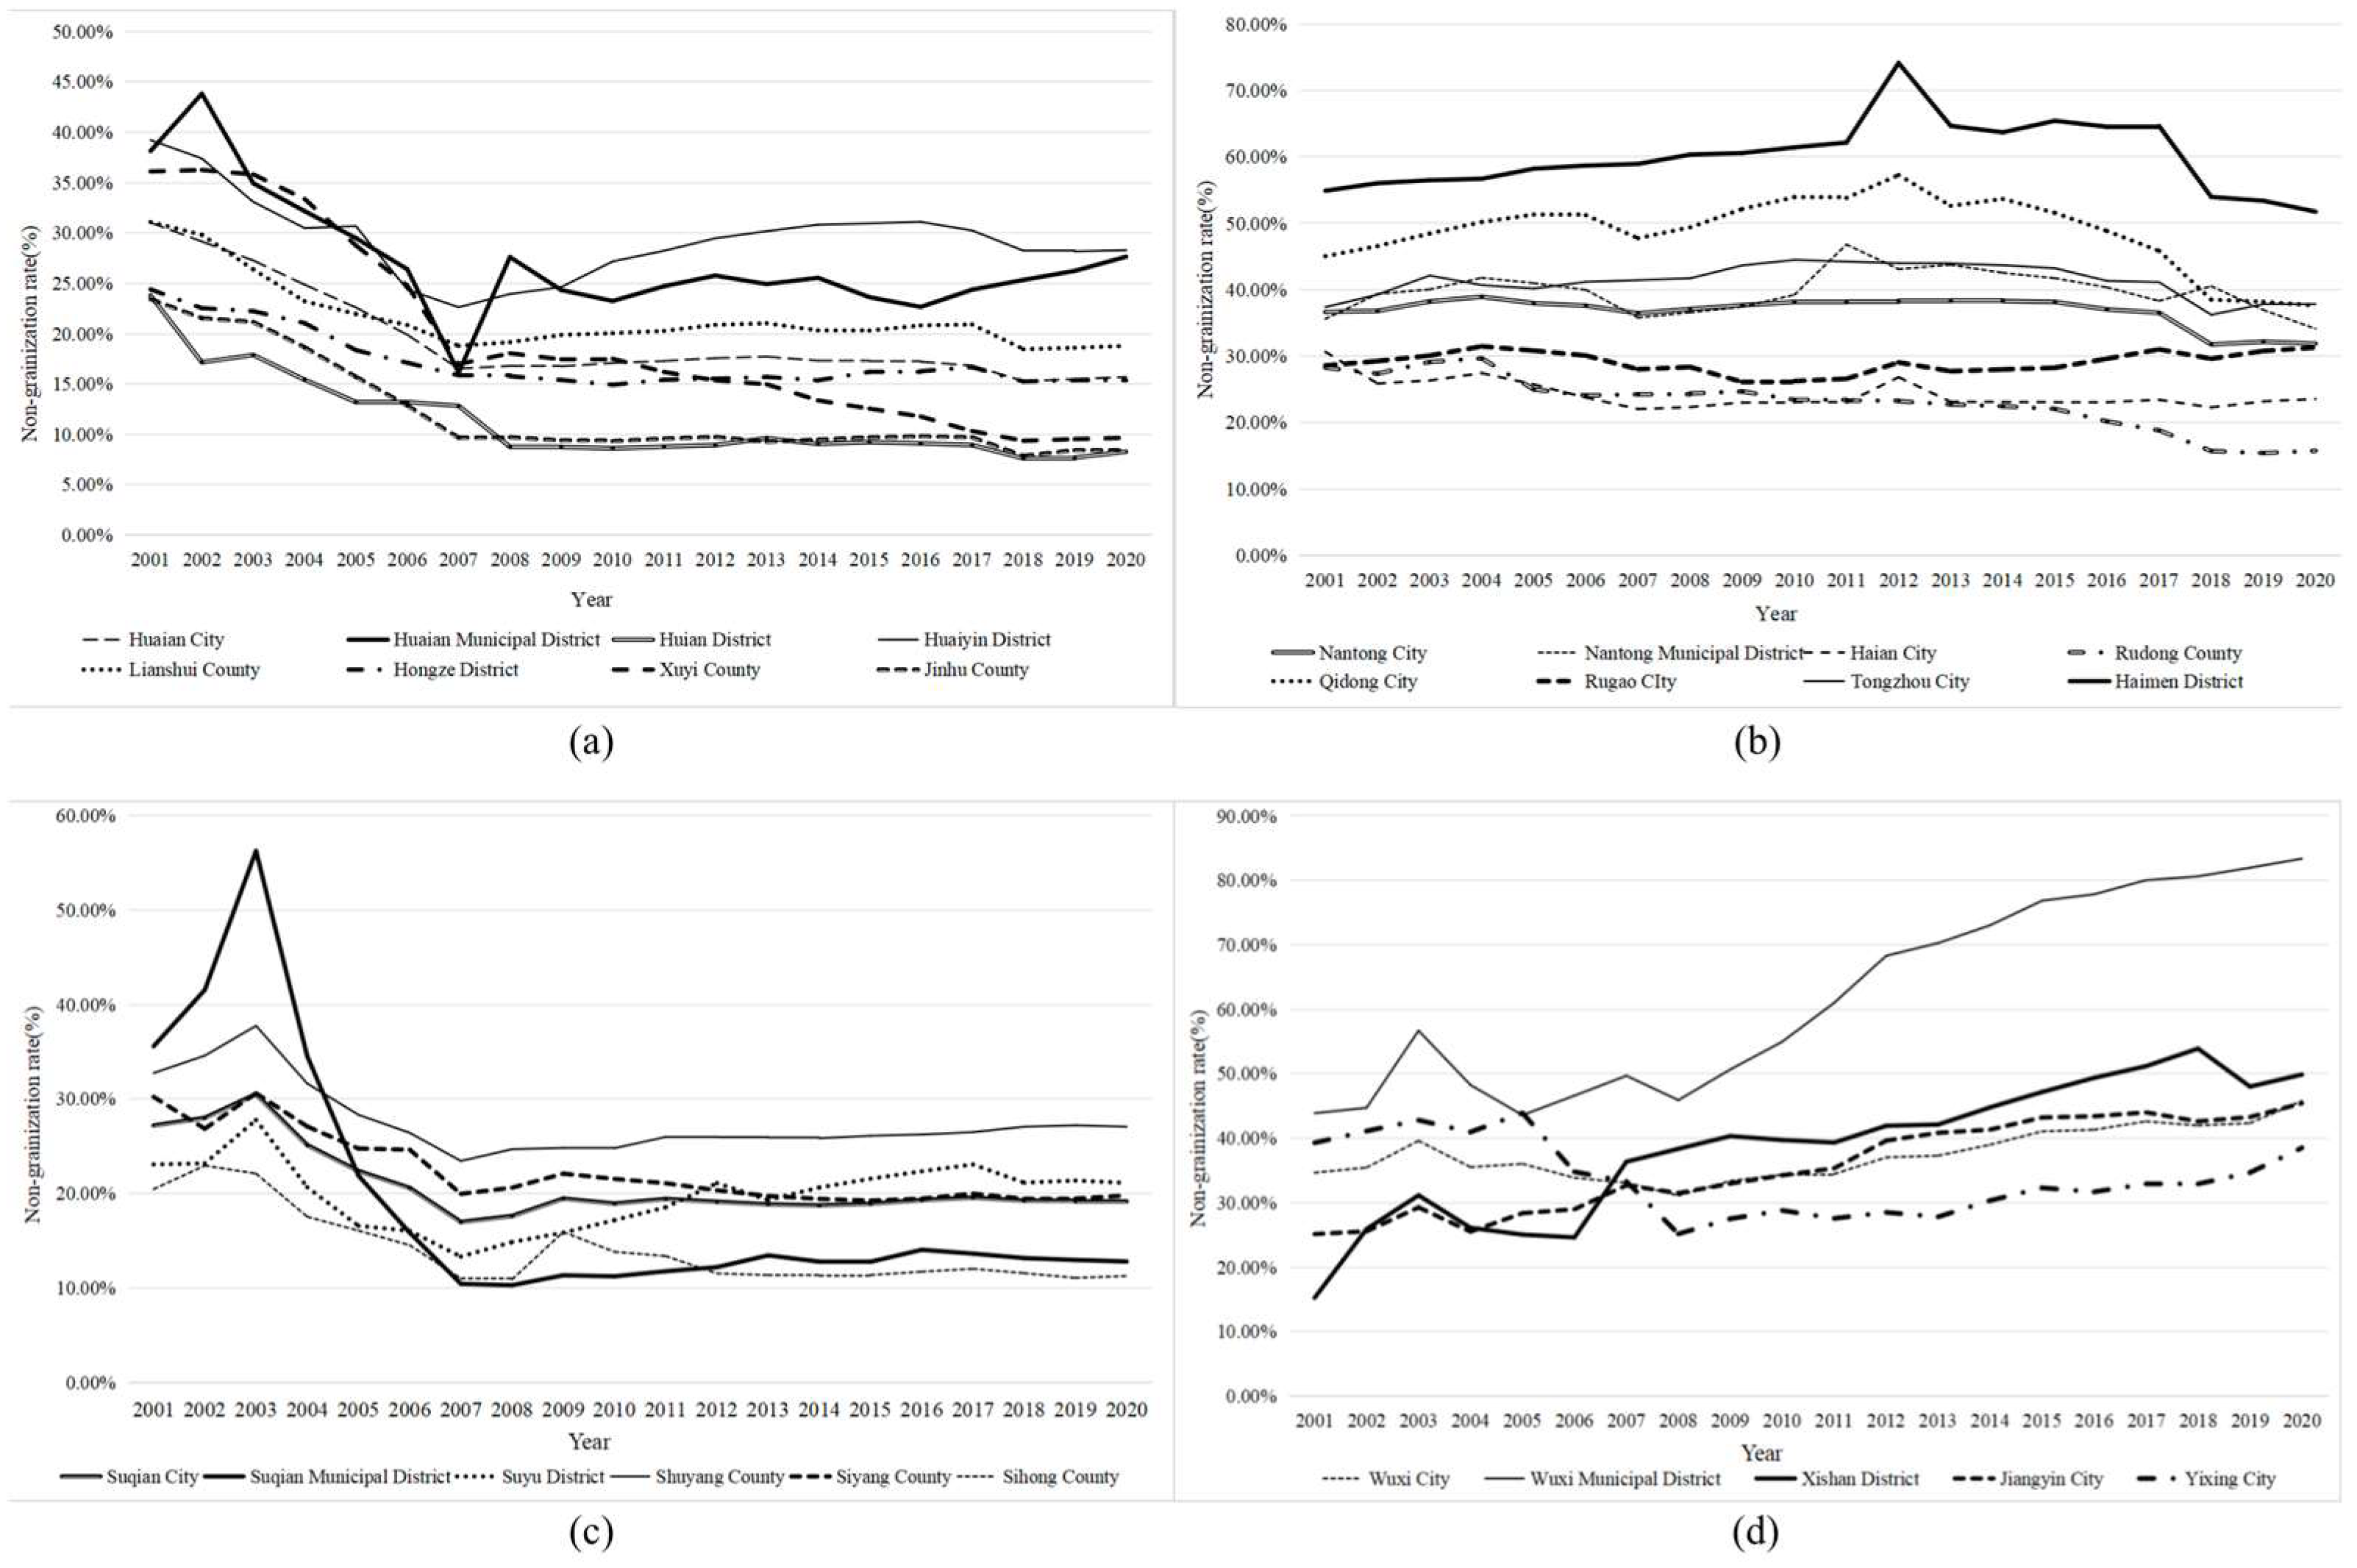
  • Increase–Decrease–Increase: Counties such as Wuxi and Taizhou had a pattern of rising, falling, and then rising non-grainization rates. For example, Wuxi’s non-grainization rate increased significantly to 56.69% between 2001 and 2003, then gradually decreased from 2003 to 2005, and finally increased rapidly to 83.35% by 2020 (Figure 5a).
  • Continuous Increase: This pattern was mainly concentrated in southern Jiangsu, including Xishan District in Wuxi, Jiangyin, and Wujin District in Changzhou. Jiangyin’s non-grainization rate increased by 20.2% from 2001 to 2020 (Figure 5a).
  • Stable: Some counties, such as Hai’an, Dongtai, and Danyang, experienced relatively stable non-grainization rates from 2001 to 2020 (Figure 5b).
  • Increase–Decrease–Stable: Some counties, such as Suqian, Zhenjiang, and Lianyungang, had a rapid rise in non-grainization rates between 2001 and 2003, reaching a peak of 56.29% followed by a decline to 10.29% by 2008, with little variation thereafter (Figure 5c).
  • Continuous Decrease: Some counties, such as Xuyi, Lianshui, and Hongze in Huai'an, showed a continuous decline in non-grainization rates, with Xuyi’s rate falling by 26.46% from 2001 to 2020 (Figure 5d).

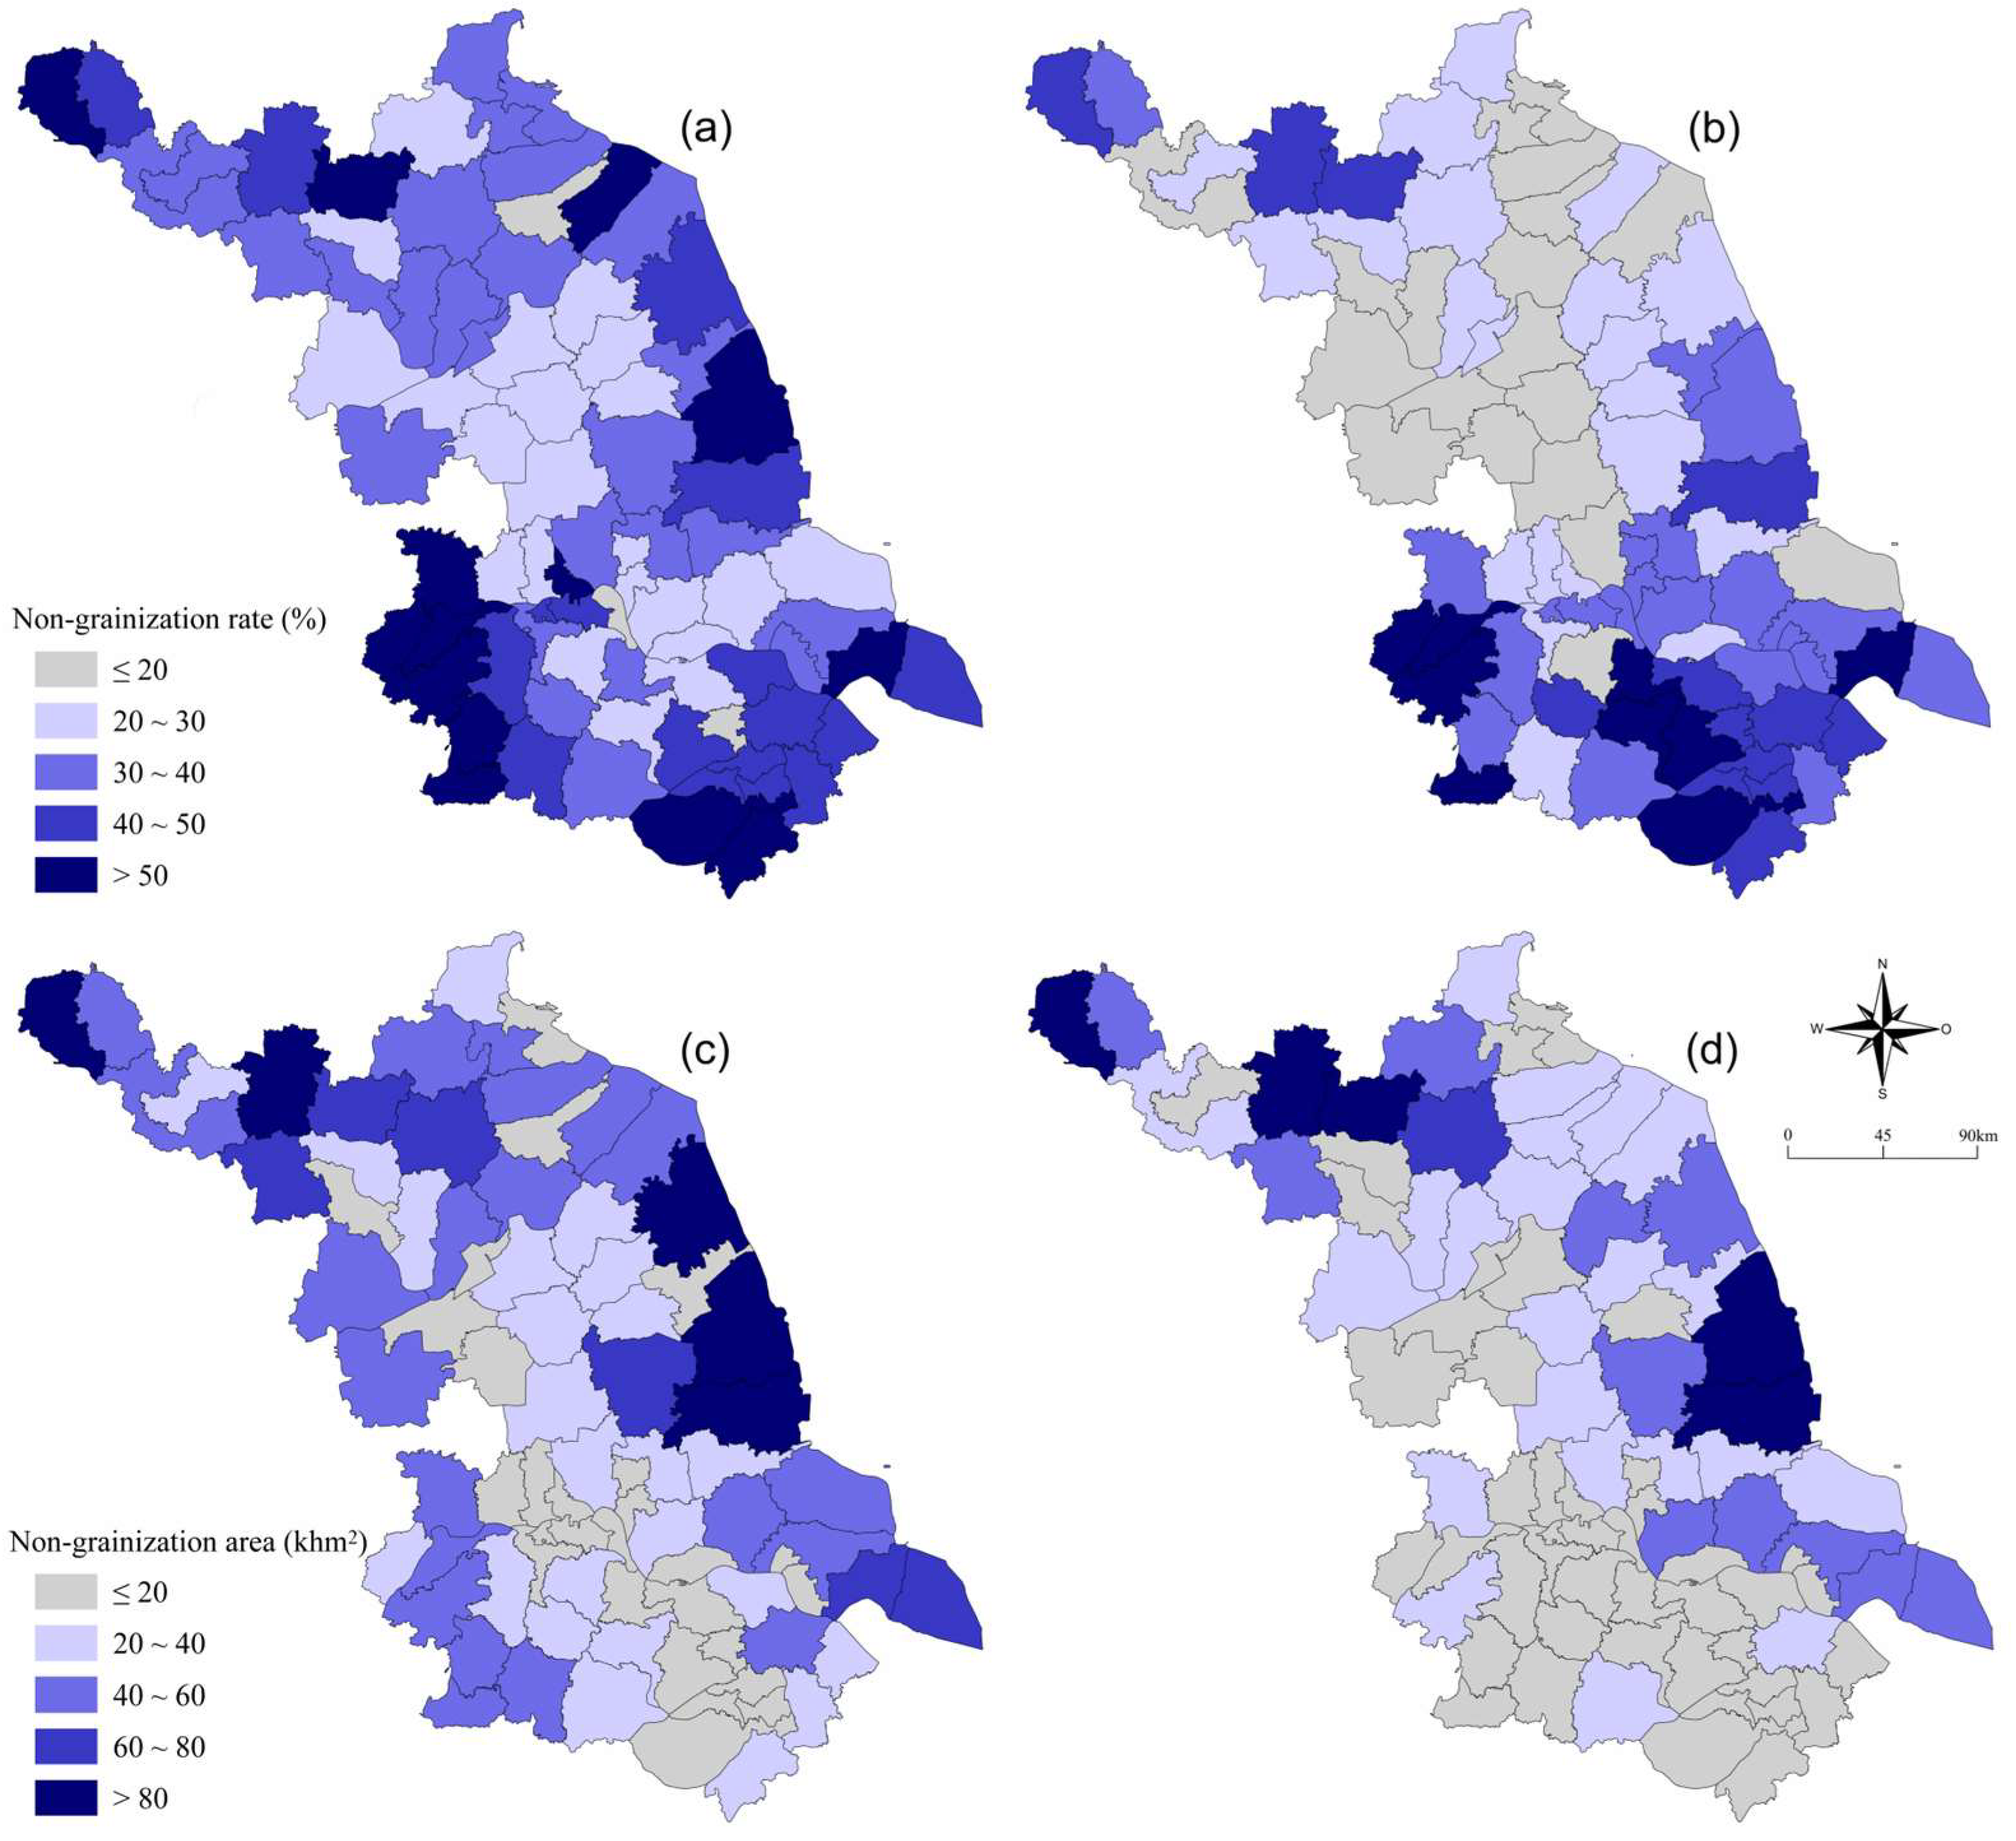
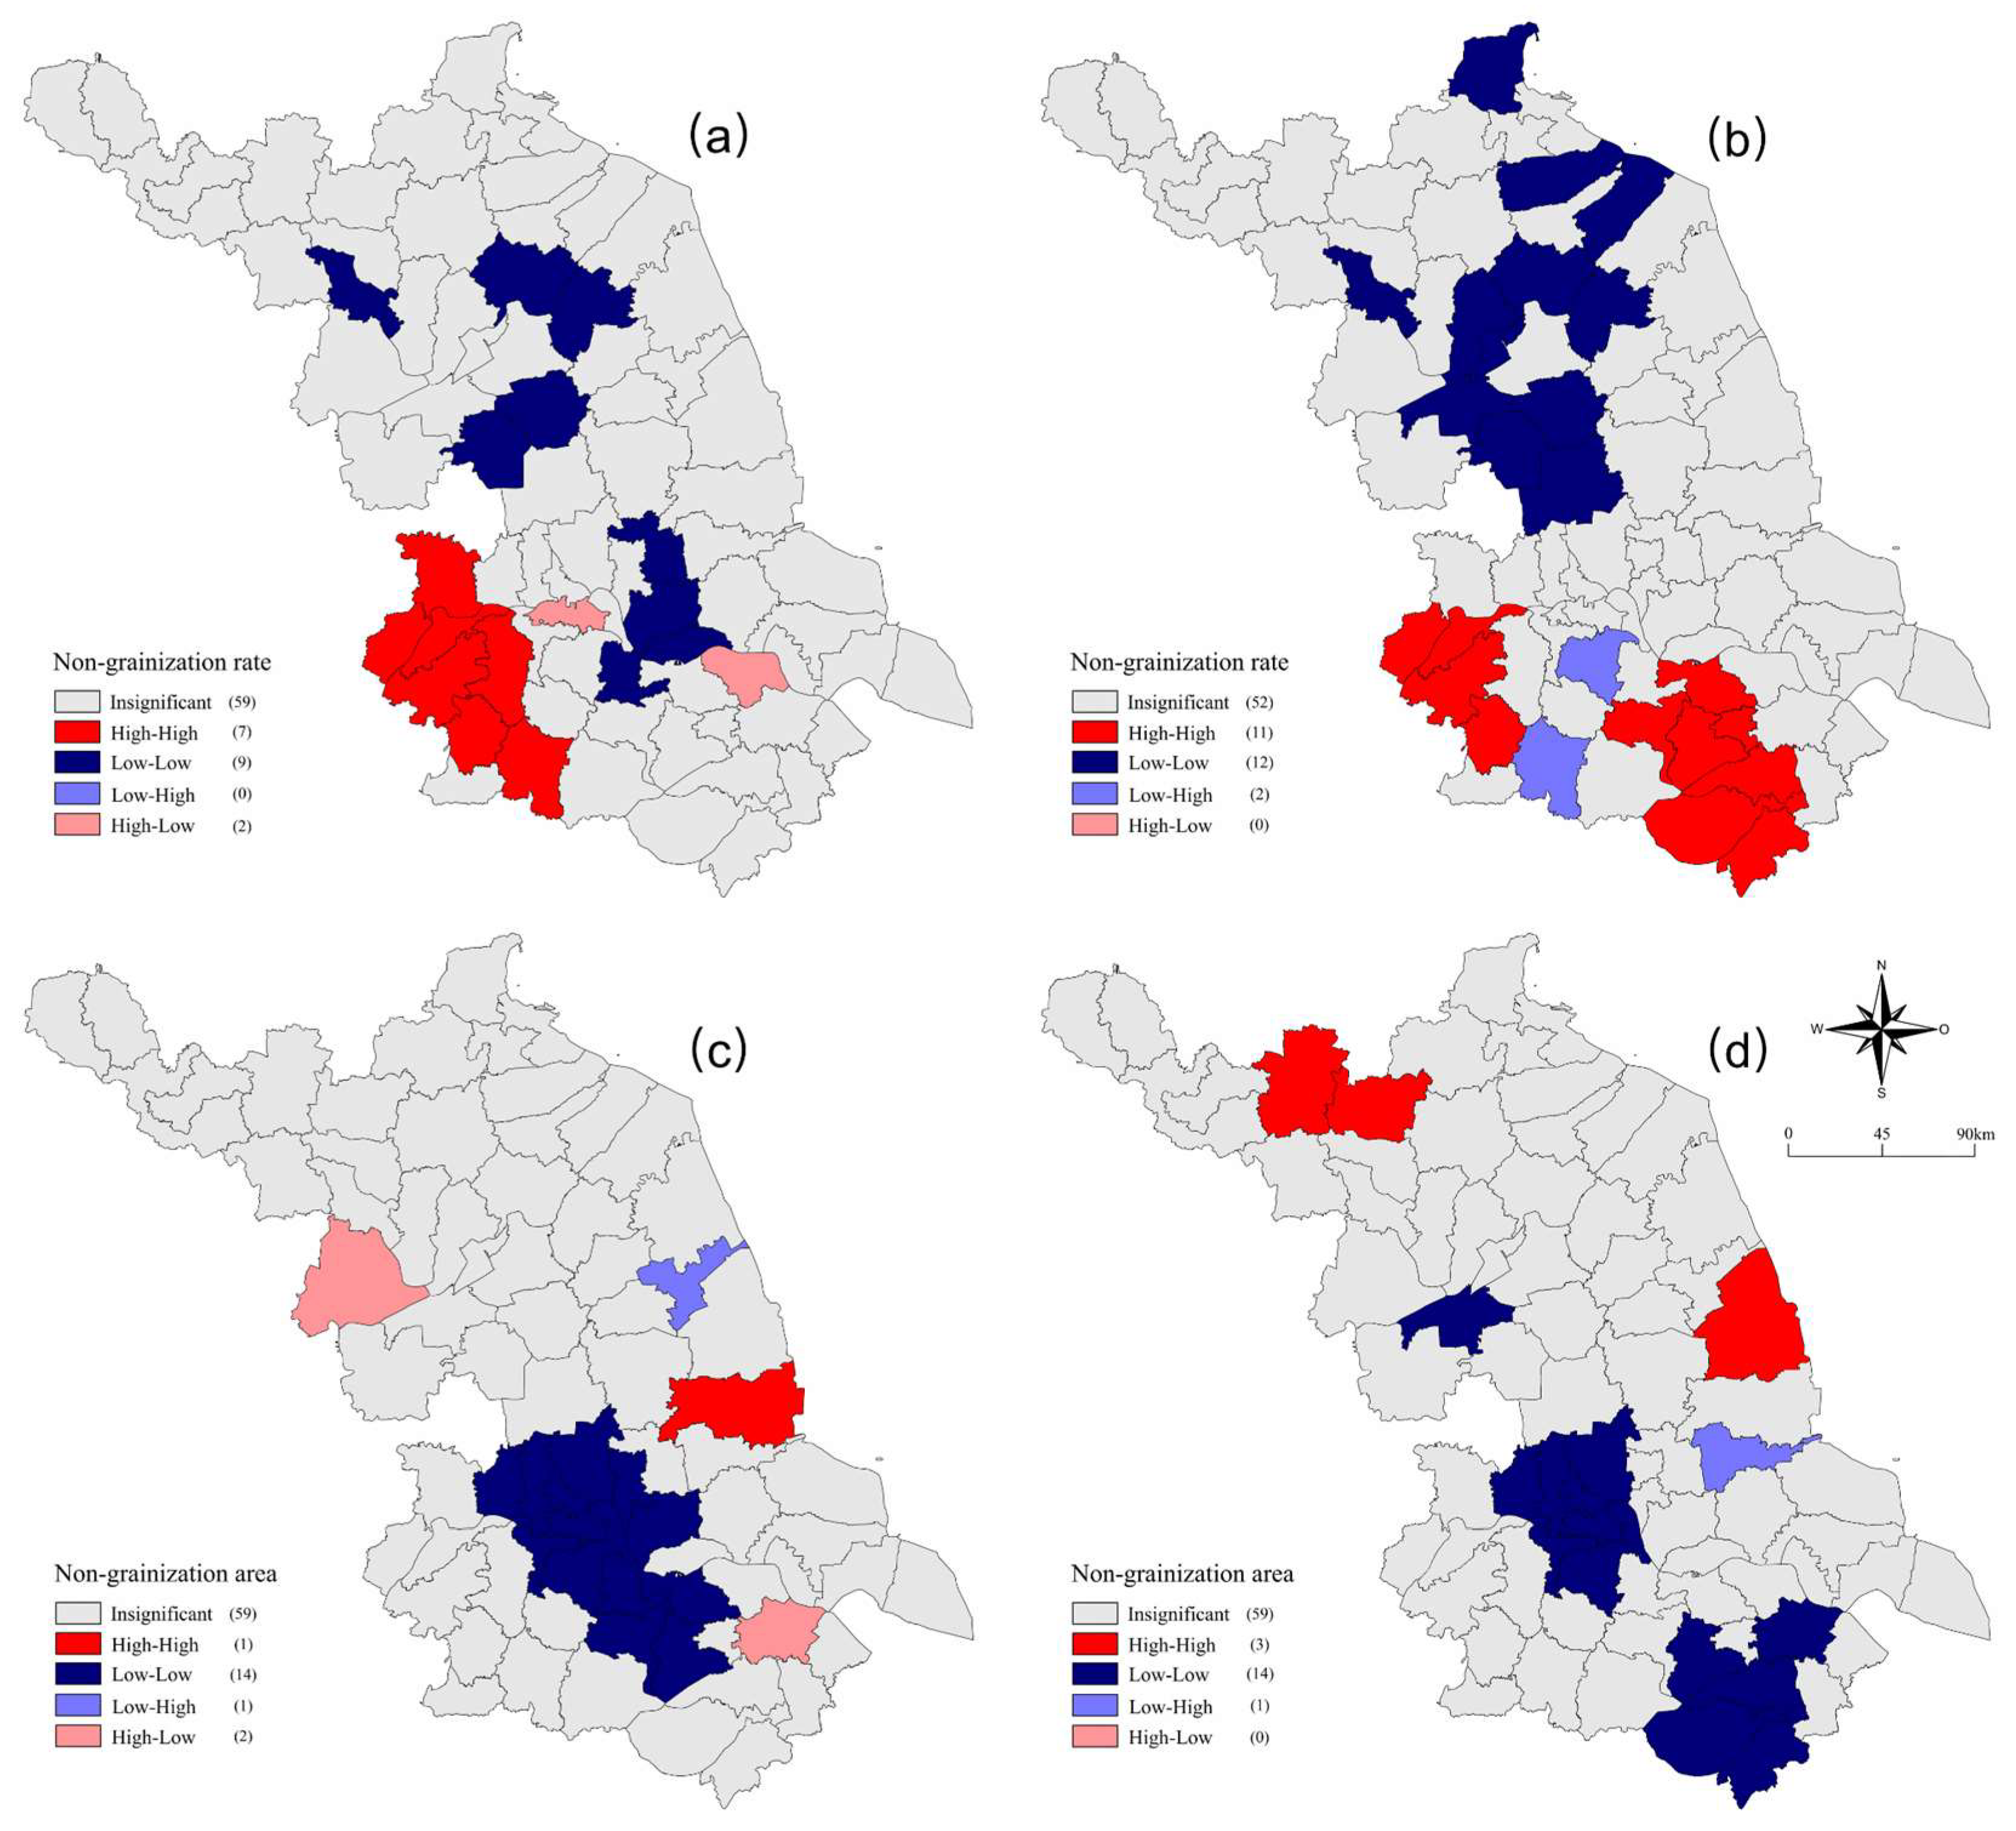
3.2. Spatial Characteristics of Non-grainization in Jiangsu Province

In 2000, the counties with high non-grainization rates were primarily located in southern Jiangsu, coastal regions, and the Xuzhou metropolitan area (Figure 6). By 2020, the counties with high non-grainization rates were mainly concentrated in southern Jiangsu, within a narrowing gap between central and northern Jiangsu. In 2001, the areas of non-grain cultivation were primarily distributed in central and northern Jiangsu, as well as Nanjing and Zhenjiang in southern Jiangsu. By 2020, the non-grainization areas were primarily located in northern Jiangsu and the coastal areas of central Jiangsu. A spatial autocorrelation analysis showed that in 2001, 2010, and 2020, the local Moran's I index for non-grainization rates was > 0, with a significance level of p < 0.05, indicating spatial clustering. The high–high (H–H) clusters were concentrated in southern Jiangsu, while the low–low (L–L) clusters were located in central and northern Jiangsu. From 2001 to 2020, the L–L clusters displayed a northward shift (Figure 7).

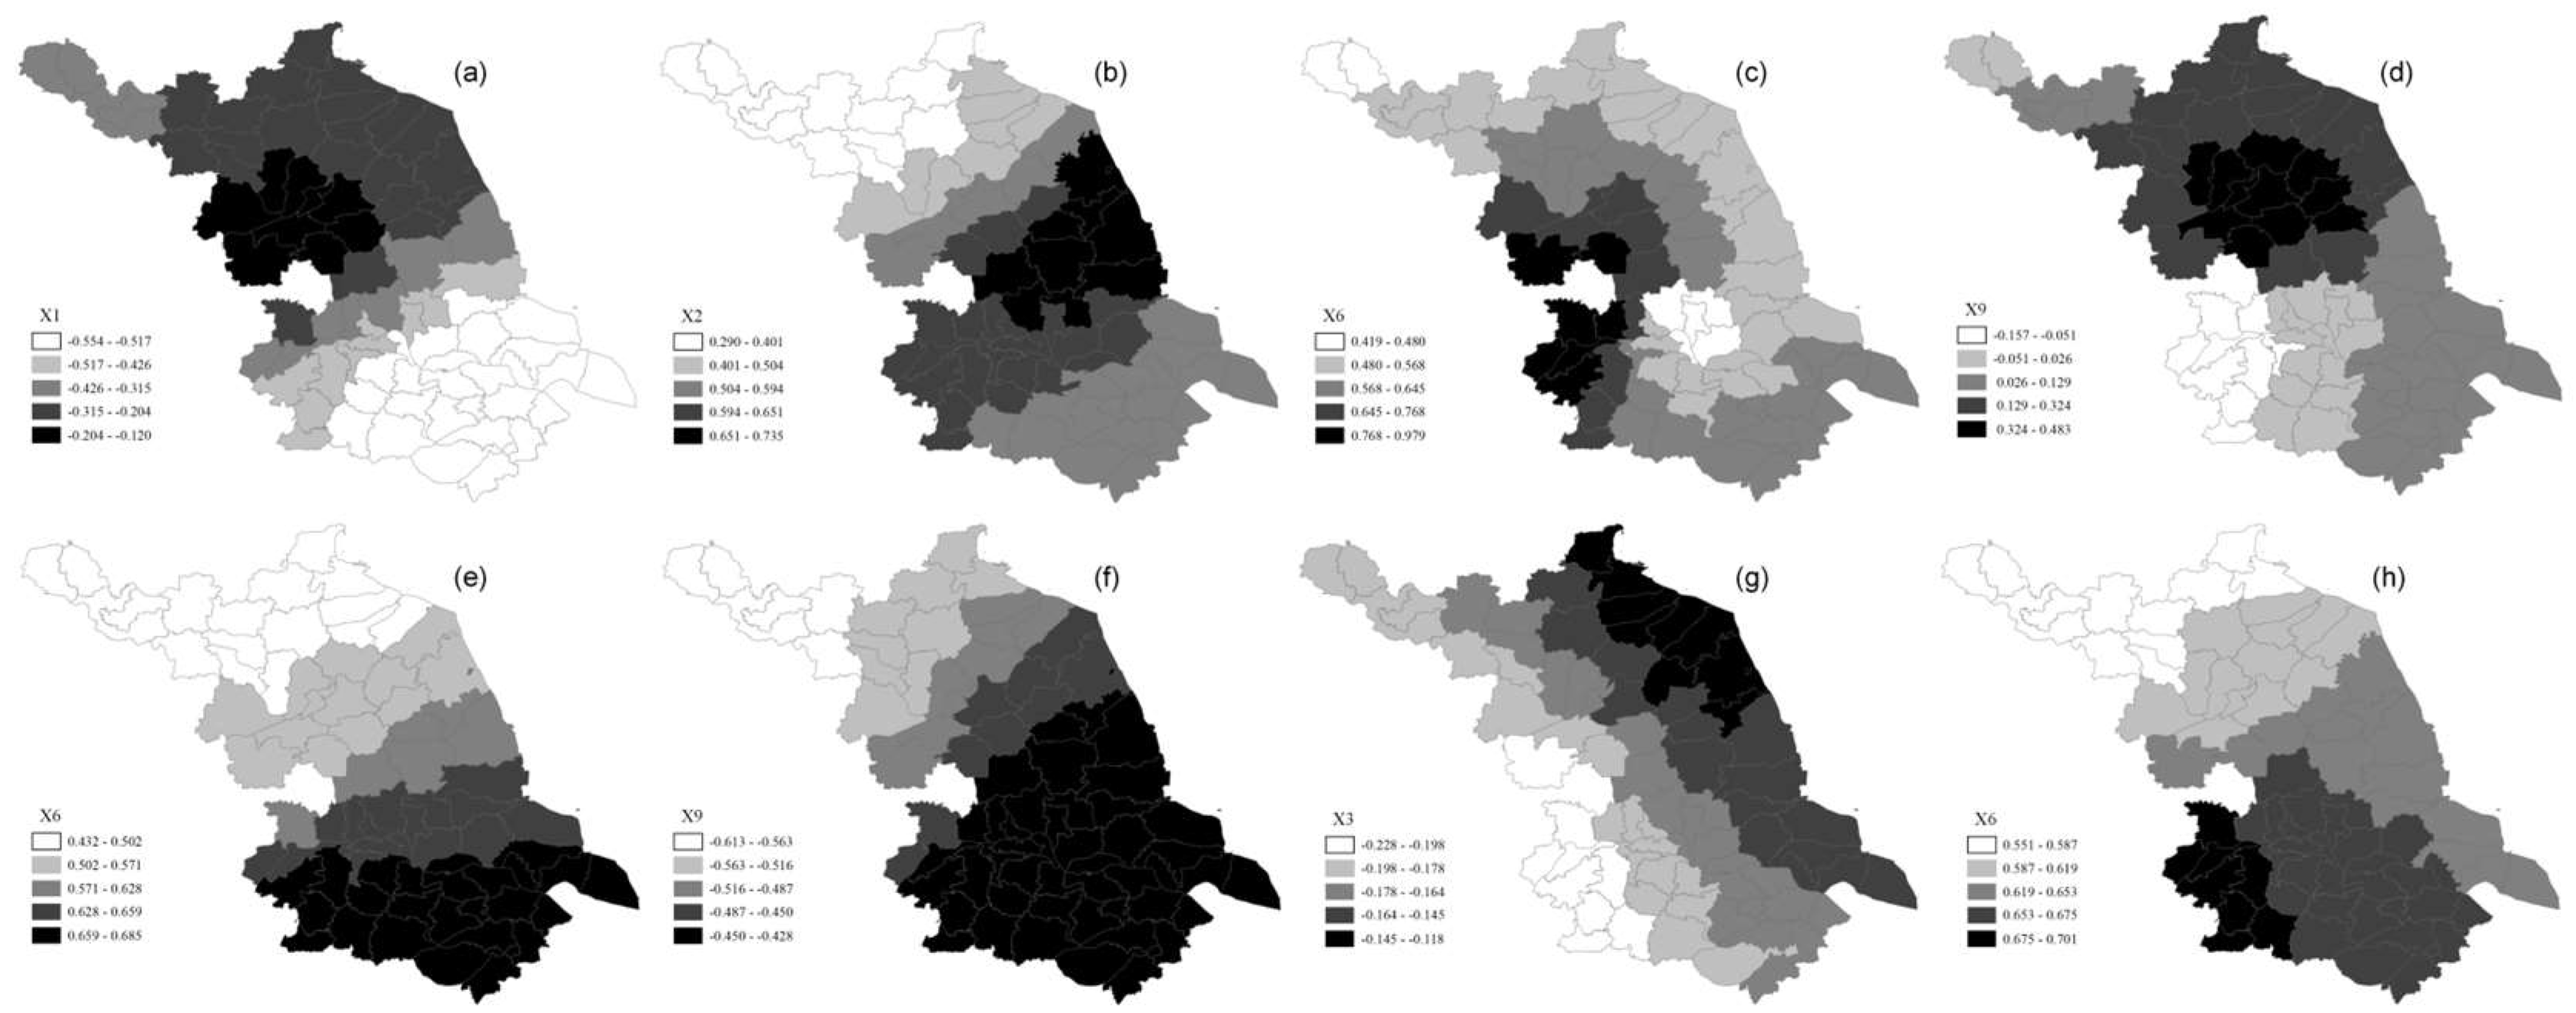
3.3. Analysis of the Factors Influencing the Non-grainization of Cultivated Land in Jiangsu Province

Based on the regression model fitting results (Table 2 and Table 3), the R² value of the geographically weighted regression was significantly higher than that in the MLR analysis due to the consideration of the geographical location of the study units. The relationships between the dependent variables, namely the non-grainization rate of cultivated land and the non-grainization area of cultivated land, and the independent variables displayed temporal variations.
There were both common and unique factors influencing the non-grainization rate of cultivated land in 2001, 2010, and 2020 (Table 2). In 2001, non-agricultural employment and agricultural modernization tendencies reduced the non-grainization rate of cultivated land, whereas urbanization and the growth of rural incomes promoted its increase. This was because increases in non-agricultural employment opportunities reduced the size of the agricultural labor force, leading farmers to reduce investment in non-grain crops and instead opt for grain crops that required less labor and had higher efficiency (i.e., output per unit of input) to ensure a basic food supply. Urban expansion results in the reallocation of agricultural land or its conversion to industrial and residential use, with an increase in the cultivation of high-value economic crops, thereby driving up the non-grainization rate of cultivated land[19]. The increased income for farmers enabled greater investment in high-value non-grain crops[20], enhancing agricultural diversification and overall income. The widespread availability of electricity and mechanization improved the production efficiency of grain crops, reducing dependence on non-grain crops. Simultaneously, modern agricultural technologies have ensured the stability of grain production, inhibiting the trend toward non-grainization.
In 2010, rural income and agricultural modernization (electricity consumption) were the main factors influencing the non-grainization rate of cultivated land[21]. The increase in rural incomes promoted agricultural diversification, while agricultural modernization suppressed the non-grainization trend. Although non-agricultural employment and urbanization significantly impacted the non-grainization rate of cultivated land in 2001, the influence of these factors diminished by 2010, possibly due to the stabilization of labor transfer and urban expansion. Alternatively, this could have occurred as a result of policy and economic structural adjustments. Across the three time points of 2001, 2010, and 2020, rural residents' per capita disposable income was consistently significantly positively correlated with the non-grainization rate of cultivated land, indicating that rising income levels continuously influenced farmers' ability and willingness to adjust their planting structures and choose high-yield non-grain crops[22]. Additionally, in 2020, a notable negative correlation with the per capita cultivated land area emerged, indicating that large-scale farming practices and improved land allocation strategies played a crucial role in curbing the trend toward converting cultivated land from non-grain to grain crops[23].
The factors influencing the non-grainization area of cultivated land in Jiangsu Province (Table 3) exhibited a significant dynamic evolution between 2001 and 2020, reflecting the profound changes in regional economic development, agricultural structural adjustments, and policy orientations. In 2001, the significant factors affecting the non-grainization area of cultivated land were the total agricultural output, rural residents' per capita disposable income, and the application of agricultural fertilizers. The growth in total agricultural output indicated that the expansion of the agricultural economy promoted non-grainization. The increase in rural incomes improved farmers' ability to adjust their planting structures and select high-yield non-grain crops. The increase in fertilizer application may reflect an intensification of agricultural production[24], thereby promoting the cultivation of non-grain crops.
By 2010, the factors significantly influencing the non-grainization area had changed to primarily include total agricultural output, the proportion of non-agricultural income, total agricultural machinery power, rural electricity consumption, and agricultural fertilizer application. Total agricultural output remained a core factor driving non-grainization. The increase in the proportion of non-agricultural income reflected the development of the secondary and tertiary industries, further promoting non-grain cultivation. Improvements in agricultural mechanization and electrification significantly enhanced the production efficiency of grain crops[25], suppressing the trend of non-grainization. Meanwhile, the continued increase in fertilizer use further promoted the cultivation of non-grain crops.
In 2020, the only factor significantly influencing the non-grainization area of cultivated land was total agricultural output. The sustained growth in total agricultural output indicates that the expansion of the agricultural economy remained the primary driver of the non-grainization of cultivated land. This phenomenon indicates that, in pursuit of higher economic efficiency and market competitiveness, Jiangsu Province's agriculture consistently shifted toward high-value non-grain crops, such as fruits, vegetables, and other economically significant crops, to meet the diversified market demand and enhance overall agricultural output. The other factors no longer produced significant correlations with the non-grainization rate in 2020, indicating that the influences of income growth, the proportion of non-agricultural income, agricultural mechanization, and electricity consumption had stabilized or been effectively controlled. This could be attributed to policy regulation and the optimization of the agricultural structure, such as government support policies for grain production, the mature application of agricultural technologies, and improved land management measures, which diminished the impact of these factors on the non-grainization of cultivated land. Furthermore, with the intensification of the agricultural modernization process, agricultural production methods became more efficient and sustainable, further consolidating the dominant role of total agricultural output in the non-grainization of cultivated land.
The significantly correlated factors from the regression analysis were selected to analyze the spatial heterogeneity of each factor influencing the non-grainization rate and non-grainization area of cultivated land[26]. The coefficients of each factor were visualized using the natural breaks classification method (Figure 8 and Figure 9).
As shown in Figure 8, in 2001, the proportion of non-agricultural employment exhibited a spatially decreasing trend from the central and western regions toward the southeast, while the urbanization rate increased from both the northern and southern areas toward the central region. Between 2001 and 2010, rural electricity consumption displayed substantial spatial variation. In 2001, it was higher in the central and eastern regions and lower in the southwest, whereas by 2010 this pattern shifted to a decreasing trend from the southeast to the northwest. In 2020, the per capita cultivated land area displayed a spatially increasing trend from the southwest to the northeast. The spatial distribution of rural residents' per capita disposable income also changed from 2001 to 2020. In 2001, it exhibited a gradually increasing trend from west to east, with some regions in the central area having lower GWR coefficients. Subsequently, by 2010, this trend evolved into a north-to-south progression. In 2020, the distribution persisted with lower levels in the north and elevated levels in the south, although the southwest region exhibited slightly higher GWR coefficients compared to the southeast.
As shown in Figure 9, in 2001, rural residents' per capita disposable income displayed a gradually increasing spatial trend from the central region toward the northwest and southeast. In 2010, the proportion of non-agricultural income displayed a gradually increasing spatial trend from the north to the south, while the total power of agricultural machinery displayed a gradually increasing trend from the northeast to the southwest. Rural electricity consumption exhibited a gradually decreasing spatial distribution from the southeast to the northwest. Between 2001 and 2010, there was a consistently decreasing trend in the application of agricultural fertilizers from the northwest to the southeast and southwest regions. Total agricultural output displayed spatial differences from 2001 to 2020. In 2001, total agricultural output exhibited a gradually decreasing spatial trend from the northeast to southwest. By 2010, the spatial trend shifted to a gradual decrease from the northwest to the southeast and southwest. In 2020, it displayed a gradually decreasing trend from the northwest to southern regions.

4. Discussion

Significant spatiotemporal variations were identified in the non-grainization of cultivated land in Jiangsu Province over the past two decades[27]. These variations were shaped by a complex interplay of socio-economic, agricultural, and environmental factors. The results provide important insights into land use dynamics in the context of rapid urbanization and agricultural modernization.

4.1. Analysis of the Factors Affecting the Non-grainization Rate of Cultivated Land in Jiangsu Province and Regional Differences

From 2001 to 2020, the non-grainization rate of cultivated land in Jiangsu Province exhibited an increasing–decreasing–stabilizing trend. In the southern Jiangsu region, the non-grainization rate followed an increasing–decreasing–increasing pattern, whereas the central and northern regions displayed an increasing–decreasing–stabilizing trend. The non-grainization rate was significantly higher in southern Jiangsu than in the central and northern regions. The non-grainization of cultivated land displayed a spatial dependence and was closely related to urban economic development and regional functional planning[28]. Areas with higher levels of economic development were more prone to non-grainization practices. As a more economically developed region, industrialization and urbanization processes are more advanced southern Jiangsu than elsewhere in the study area, which has promoted the cultivation of high-value non-grain crops and driven the non-grainization of cultivated land.
In terms of spatial autocorrelation, the H–H clusters of the non-grainization rate of cultivated land in Jiangsu Province were primarily located in the Nanjing metropolitan area but gradually expanded to the Su-Xi-Chang region. The L–L clusters were mainly situated in the central and northern regions, with a gradual northward shift. The H–H clusters of the non-grainization area of cultivated land were mainly found in Dongtai City, Pizhou, and Xinyi City. The L–L clusters of the non-grainization area of cultivated land were distributed in the Yangzhong region but gradually expanded to the Su-Xi region [29].
The non-grainization of cultivated land is primarily influenced by the level of economic development. Previous studies have indicated that an increase in rural economic income increases the ability and willingness of farmers to choose high-yield non-grain crops. With the development of the rural economy, farmers have more resources and risk-bearing capacity, enabling them to invest in high-value economic crops. Vegetable and fruit production is more likely to occur in regions with higher levels of economic development and sufficient labor [30]. This is because traditional grain crops yield lower profits compared to high-value non-grain crops. As farmers derive a higher income from planting fruits, medicinal materials, and other non-grain crops, the proportion and scale of non-grain crop cultivation gradually expands, directly leading to large areas of existing cultivated land being used for non-grain crops and intensifying the degree of non-grainization of cultivated land [31].
The per capita disposable income of rural residents has continuously and significantly affected the non-grainization rate of cultivated land over the past 20 years, while the total agricultural output value has consistently and significantly influenced the non-grainization area of cultivated land. Although changes in both the non-grainization rate and non-grainization area involve corresponding changes in land use, they differ fundamentally in their driving factors. The total agricultural output value primarily reflects economic-level driving factors, such as market demand and economic benefits[32], whereas the per capita disposable income of rural residents reflects individual farmers' behavioral driving factors [33], such as their investment willingness and risk-bearing capacity. As farmers' income levels continue to rise, they are more likely to choose high-yield non-grain crops to maximize personal income, thereby increasing the non-grainization rate of cultivated land. Concurrently, as the total agricultural output value continues to rise, the market demand for high-value non-grain products also expands, leading to an increase in the non-grainization area of cultivated land [34].

4.2. Potential Impact of the Non-grainization of Cultivated Land on China's Food Security

The trend of non-grainization of cultivated land partly reflects the transformation of the agricultural economy toward higher efficiency and sustainable development. However, excessive non-grainization may pose a threat to food security, especially in the context of global climate change and population growth [35]. Over the past two decades, rapid urbanization and industrialization in China's coastal regions have exerted significant pressure on agricultural land use, resulting in the widespread non-grainization of cultivated land and severely threatening the protection of high-quality farmland and national food security. In 2018, the non-grainization area of cultivated land in the 11 coastal provinces and regions of China was approximately 15.82 × 10⁶ ha, accounting for 33.65% of the national total cultivated land area. Jiangsu Province, as a coastal province with a high GDP, had a non-grainization area of cultivated land exceeding 1.2 × 10⁶ ha and a non-grainization rate of approximately 30%, second only to Guangdong Province (50%) and Guangxi Zhuang Autonomous Region (45%) [28]. The high non-grainization rates in Guangdong and Guangxi are primarily due to their highly developed economies, frequent foreign trade, and diversified agricultural structures. Although the non-grainization of cultivated land has promoted agricultural diversification and economic development, it has also introduced several potential risks to food security.
First, the conversion of cultivated land to non-grain crops directly reduces the area available for grain crop cultivation, potentially leading to a decrease in total grain production. This may increase reliance on grain imports and weaken the stability of the national food supply chain. Additionally, during the non-grainization process, farmers tend to plant high-value crops, which not only alters the agricultural production structure but may also disrupt long-term planting plans and overlook the technological improvements made in cultivating grain crops, affecting the stability of their yield and quality[36]. Furthermore, non-grainization is accompanied by the transfer of agricultural labor to non-agricultural sectors, resulting in a shortage of agricultural labor and further impacting the management and harvesting efficiency of grain crops. It is also important to note that high-value economic crops typically require more water resources and increased use of fertilizers and pesticides[37], which may exacerbate soil degradation, water scarcity, and environmental deterioration, thereby negatively affecting the sustainable production of grain crops [38]. The imbalance in food production across regions also exacerbates the vulnerability of national food security. As an important grain-producing region, the non-grainization of cultivated land in Jiangsu Province may increase the dependence on other major grain-producing areas, creating weak links in the supply chain [39].
Therefore, to balance the promotion of agricultural diversification with the safeguarding of food security, it is essential to optimize land use structures through policy regulation and structural adjustments in agriculture, ensuring that the area and yield of grain crops do not significantly decline due to non-grainization. Simultaneously, promoting agricultural technological innovation and enhancing the production efficiency of grain crops to improve their resilience to risks are key measures to ensure the stability and sustainable development of grain production. The government should formulate policy measures to support grain production, such as agricultural subsidies, technology dissemination, and the construction of grain reserves. These measures are essential to prevent the excessive substitution of grain crops and to maintain their cultivation.

4.3. Policy Implications

4.3.1. Cross-regional Allocation of Food and Cash Crops, and the Establishment of a Provincial Compensation Mechanism

To optimize the regional distribution of food and cash crops in Jiangsu Province, a compensation mechanism for grain production between regions should be established under the premise of ensuring a red line for grain cultivation. This mechanism should take into account local grain consumption demand, soil conditions, water resources, and other planting conditions to delineate areas for grain cultivation and non-grain crops such as vegetables and fruits. A compensation mechanism should be implemented across Jiangsu Province to facilitate cross-regional circulation, incentivize grain production through market mechanisms, and control the non-grainization rate of cultivated land through market policy adjustments while ensuring grain crop yields, thereby optimizing the crop structure.

4.3.2. Ensure Basic Reserves of Grain Fields, Strictly Control the Increase in the Non-grainization Rate, and Avoid a "One-size-fits-all" Approach

Farmers often favor non-grain crops over grain cultivation due to the limited economic benefits associated with growing grains and the potential for higher profits from non-grain crops. As an economically developed province, Jiangsu's non-grainization rate of cultivated land is higher than the national average. Under the premise of implementing special protection for permanent basic farmland, it is essential to ensure basic reserves of grain fields, strictly control the total non-grainization area of cultivated land, and prevent the disorderly spread of non-grainization. Farmers engaged in cultivating non-grain crops should adhere to a principle of classified treatment, and scientific management should be adopted to ensure reasonable cultivation while safeguarding grain field security.

4.3.3. Accelerate Land Transfer and Promote the Large-scale Cultivation of Arable Land

The rapid industrialization and urbanization of Jiangsu Province have accelerated the transfer of rural labor to cities, promoting the development of land transfer. Although the scale of land transfer in Jiangsu is large, the proportion of transferred land used for grain cultivation by farmers is relatively small, with a significant non-grainization area of cultivated land. In the rural areas of Jiangsu, new agricultural business entities are now widely engaged in agricultural operations. In response to these entities, the government should continue to improve the land transfer system to ensure the centralized and contiguous characteristics of arable land, and further increase support for large-scale grain production. However, various measures should also be taken to enhance rural agricultural infrastructure, optimize grain production layouts, and ensure the sustainable development of grain production.

4.3.4. Accelerate Land Transfer and Promote the Large-scale Cultivation of Arable Land

As an economically developed coastal province, Jiangsu exhibits significant regional differences in culture, economic development levels, and the mindset of farmers. The factors driving non-grainization also vary significantly across counties. Taking counties as units, the fluctuating trends in the non-grainization rate of cultivated land from 2001 to 2020 in Jiangsu can be classified into five types. Differentiated governance measures can be adopted at the county level for each of these five types:
  • Increase–decrease–increase: Mainly concentrated in southern Jiangsu, with some areas in central Jiangsu. The non-grainization rate during the increase phase is generally much higher than the provincial average. Vigilance is required to curb the further spread of non-grainization. Measures such as the grain security responsibility system should be implemented to protect grain cultivation areas and strengthen the surveillance of "grain fields" converted to "non-grain fields" to ensure food security. A high standard of farmland construction should be promoted to maintain the cultivation area and improve farmland management. This would prevent farmers from abandoning grain for economic benefits.
  • Continuous increase: Primarily in southern Jiangsu, where the proportion of grain-sown areas is generally below 60%. High-quality grain crop varieties should be promoted, with priority given to arable land use. In this region, high-quality arable land should be used for grain production.
  • Increase–decrease–stable: Mainly occurs in municipal districts, which are the core components of urban areas and the centers of regional economic development. While developing tertiary industry, modern agriculture should also be vigorously developed to establish concentrated and contiguous high-yield grain production areas. This would ensure an effective supply of the major agricultural products, continuous income growth for farmers, and sustainable agricultural development.
  • Stable: Classified treatment and scientific planning are required in these regions. For areas with non-grainization rates below the provincial average (e.g., Suqian and Lianyungang municipal districts), which have a strong foundation in grain production and a significant impact on food security, stable production rates and supply should be maintained. The production capacity of important agricultural products should be gradually improved. For areas with non-grainization rates above the provincial average, existing farmland planning should be adjusted, and the Party and government should take joint responsibility for food security.
  • Continuous decrease: Most districts and counties in Huai'an displayed an overall decreasing trend. In 2022, 10.4% of Jiangsu's arable land produced 12.9% of its grain. Therefore, all regions must resolutely reduce the unauthorized use of arable land, implement various strategies to enhance food security, and consistently enhance mechanisms for high-quality farmland construction.

5. Conclusions

This study conducted an in-depth analysis of the spatiotemporal evolution and driving factors of non-grainization in Jiangsu Province over the past two decades. By applying a spatial autocorrelation analysis and MGWR, it was found that the total agricultural output value and the per capita disposable income of rural residents were the most significant factors influencing the shift from grain crops to non-grain crops in the region. Although the optimization of rural infrastructure has limited non-grainization due to the priority given to grain production, urbanization has made it possible to cultivate more profitable non-grain crops in economically developed areas, such as southern Jiangsu. The study identified significant regional disparities, with southern Jiangsu transitioning to non-grainization more rapidly than central and northern Jiangsu, partly due to the stronger economic incentives and better access to agricultural infrastructure. The results highlight the importance of formulating balanced land-use policies that not only support economic diversification but also ensure food security. Future policies should focus on improving agricultural infrastructure, such as irrigation, while ensuring that the economic benefits of non-grain crops do not undermine grain production capacity. The experience of Jiangsu Province offers a valuable case study for other rapidly urbanizing regions facing similar challenges in balancing agricultural modernization, land-use pressures, and food security.

References

  1. Prosekov; Alexander, Y.; Ivanova; etc. Food security: The challenge of the present. Geoforum 2018, 91, 73-77. [CrossRef]
  2. Beddington, J.R.; Crute, I.R.; Godfray, H.C.J. Food security: the challenge of feeding 9 billion people. Science (New York, N.Y.) 2010, 327, 812-818. [CrossRef]
  3. Zhai, J.; Pu, L.; Lu, Y.; etc. Is the boom in staple crop production attributed to expanded cropland or improved yield? A comparative analysis between China and India. Sci Total Environ 2024, 933, 173151. [CrossRef]
  4. Zeng, K.; Zhai, Y.; Wang, L.; etc. Spatio-Temporal Differentiation of Non-Grain Production of Cropland and Its Influencing Factors: Evidence from the Yangtze River Economic Belt, China. Sustainability (2071-1050) 2024, 16. [CrossRef]
  5. He, T.T.; Jiang, S.Q.; Xiao, W.; etc. A non-grain production on cropland spatiotemporal change detection method based on Landsat time-series data. Land Degrad Dev 2024, 35, 3031-3047. [CrossRef]
  6. Zhang, D.; Yang, W.; Kang, D.; etc. Spatial-temporal characteristics and policy implication for non-grain production of cultivated land in Guanzhong Region. Land Use Policy 2023, 125. [CrossRef]
  7. Bhullar, A.; Nadeem, K.; Ali, R.A. Simultaneous multi-crop land suitability prediction from remote sensing data using semi-supervised learning. Sci Rep-Uk 2023, 13. [CrossRef]
  8. Hao, Q.; Zhang, T.; Cheng, X.; etc. GIS-based non-grain cultivated land susceptibility prediction using data mining methods. Sci Rep-Uk 2024, 14. [CrossRef]
  9. Wu, Y.; Yuan, C.; Wei, W.X. Decoupling relationship between the non-grain production and intensification of cultivated land in China based on Tapio decoupling model. J Clean Prod 2023, 424, 138800-138801. [CrossRef]
  10. Zhu, Z.Y.; Duan, J.J.; Li, S.L.; etc. Phenomenon of Non-Grain Production of Cultivated Land Has Become Increasingly Prominent over the Last 20 Years: Evidence from Guanzhong Plain, China. Agriculture-Basel 2022, 12. [CrossRef]
  11. Zhang, J.; Li, X.; Xie, S.; etc. Research on the Influence Mechanism of Land Tenure Security on Farmers’ Cultivated Land Non-Grain Behavior. In Agriculture, 2022; Vol. 12. [CrossRef]
  12. Chen, S.C.; Zhang, Y.N.; Zhu, Y.L.; etc. The battle of crops: unveiling the shift from grain to non-grain use of farmland in China? Int J Agr Sustain 2023, 21. [CrossRef]
  13. Li, Y.F.; Zhao, B.C.; Huang, A.; etc. Characteristics and Driving Forces of Non-Grain Production of Cultivated Land from the Perspective of Food Security. Sustainability-Basel 2021, 13. [CrossRef]
  14. Xu, J.L.; Ding, Y. Research on Early Warning of Food Security Using a System Dynamics Model: Evidence from Jiangsu Province in China. J Food Sci 2015, 80, R1-R9. [CrossRef]
  15. Yang, J.; Liu, Q.L.; Deng, M. Spatial hotspot detection in the presence of global spatial autocorrelation. Int J Geogr Inf Sci 2023, 37, 1787-1817. [CrossRef]
  16. Hughey, S.M.; Kaczynski, A.T.; Porter, D.E.; etc. Spatial clustering patterns of child weight status in a southeastern US county. Applied Geography (Sevenoaks, England) 2018, 99, 12-21. [CrossRef]
  17. Bashir, A.; Shehzad, M.A.; Hussain, I.; etc. Reservoir Inflow Prediction by Ensembling Wavelet and Bootstrap Techniques to Multiple Linear Regression Model. Water Resour Manag 2019, 33, 5121-5136. [CrossRef]
  18. Kamarianakis, Y.; Feidas, H.; Kokolatos, G.; etc. Evaluating remotely sensed rainfall estimates using nonlinear mixed models and geographically weighted regression. Environ Modell Softw 2008, 23, 1438-1447. [CrossRef]
  19. Su, Y.; Qian, K.; Lin, L.; etc. Identifying the driving forces of non-grain production expansion in rural China and its implications for policies on cultivated land protection. Land Use Policy 2020, 92, 104435. [CrossRef]
  20. Song, J.R.; Hu, S.G.; Frazier, A.E.; etc. Will industrial structure changes promote or reduce non-grain production? Evidence from the Yangtze River Economic Belt. J Clean Prod 2024, 466. [CrossRef]
  21. Wu, Z.L.; Chen, H.; Zeng, T.; etc. Risk preference and rural livelihood transitions in the hilly and mountainous region of southern China: a case study in Ruijin City. Sci Rep-Uk 2024, 14. [CrossRef]
  22. Pfeiffer, L.; López-Feldman, A.; Taylor, J.E. Is off-farm income reforming the farm? Evidence from Mexico. Agr Econ-Blackwell 2009, 40, 125-138. [CrossRef]
  23. Oduol, J.; Tsuji, M. The effect of farm size on agricultural intensification and resource allocation decisions: Evidence from smallholder farms in Embu District, Kenya. J Fac Agr Kyushu U 2005, 50, 727-742. [CrossRef]
  24. Ritzema, R.S.; Frelat, R.; Douxchamps, S.; etc. Is production intensification likely to make farm households food-adequate? A simple food availability analysis across smallholder farming systems from East and West Africa. Food Secur 2017, 9, 115-131. [CrossRef]
  25. Zou, B.L.; Chen, Y.D.; Mishra, A.K.; etc. Agricultural mechanization and the performance of the local Chinese economy. Food Policy 2024, 125. [CrossRef]
  26. Zhao, S.X.; Xiao, D.Y.; Yin, M.M. Spatiotemporal Patterns and Driving Factors of Non-Grain Cultivated Land in China's Three Main Functional Grain Areas. Sustainability-Basel 2023, 15. [CrossRef]
  27. Su, Y.; Li, C.; Wang, K.; etc. Quantifying the spatiotemporal dynamics and multi-aspect performance of non-grain production during 2000–2015 at a fine scale. Ecol Indic 2019, 101, 410-419. [CrossRef]
  28. Yan, S.; Yuanyuan, C.; Junna, L.; etc. Spatial Differentiation of Non-Grain Production on Cultivated Land and Its Driving Factors in Coastal China. Sustainability-Basel 2021, 13, 13064. [CrossRef]
  29. Xu, C.; Guo, J.; Yi, J.; et al. Analysis on the Evolution of Spatiotemporal Pattern and Driving Factors of Non-grain Cultivated land in Jiangsu Province from 1996 to 2020. Resources and Environment in the Yangtze Basin 2024, 33, 436–447.
  30. Liu, H.; Chen, S. Empirical analysis of factors influencing farmers’ willingness to participate in small-scale farmland water conservancy construction—Based on a survey of 475 farmers in major grain-producing areas of Hunan Province. China Rural Survey 2012, 02, 54–66.
  31. Xia, L. Study on the Relationship between Non-Grain Production of Cultivated Land and Rural Household Income under the background of the Rural Revitalization Strategy: Based on on-site Research and Analysis in Xuanwei City, Yunnan Province. Master’s Thesis, Yunnan University of Finance and Economics, China, 2023.6.5.
  32. Liu, K.; Li, Y.; Wu, Q.; etc. Driving force analysis of land use change in the developed area based on Probit regression model: A case study of Nanjing City, China. Ying Yong Sheng Tai Xue Bao = the Journal of Applied Ecology 2015, 26, 2131-2138.
  33. Diana, M.; Zulkepli, N.A.; Ern, L.K.; etc. Factors affecting behavioral intentions of farmers in Southeast Asia to technology adoption: A systematic review analysis. J Environ Manage 2024, 367. [CrossRef]
  34. Zang, H. Research on Factors Affecting Farmers' Non-grain Planting Behavior and Scale in the Process of Land Rent-al——Based on Survey Data of Farmers in Xiayi County, Henan Province. Master’s Thesis, Southwestern University of Fi-nance and Economics, China, 2020.5.18.
  35. Dai, C.; Liu, Y.; Wang, J. Revealing the process and mechanism of non-grain production of cropland in rapidly urbanized deqing County of China. J Environ Manage 2025, 374, 123948. [CrossRef]
  36. Lou, S. What determines the investment intention of Chinese farmers in green grain production? Environ Dev Sustain 2024, 26, 11217-11242. [CrossRef]
  37. Xiong, C.J.; Zhao, X.H. Impacts of chemical fertilizer reduction on grain yield: A case study of China. Plos One 2024, 19. [CrossRef]
  38. Xie, Y.; Wang, Z.; Wang, Y.; et al. Spatial-temporal variation and driving types of non-grain cultivated land in hilly and mountainous areas of Chongqing. Journal of Agricultural Resources and Environment 2024, 41, 15–26.
  39. Zheng, T.; Zhao, G.Q.; Chu, S.W. A Study on the Impact of External Shocks on the Resilience of China's Grain Supply Chain. Sustainability-Basel 2024, 16. [CrossRef]
Figure 1. The administrative regions and subregions of the study area.
Preprints 149453 g001
Figure 2. Changes in the non-grainization area (a) and non-grainization rate (b) of cropland in Jiangsu Province.
Preprints 149453 g002
Figure 3. Changes in the 20-year non-grainization rate in southern, central, and northern Jiangsu.
Preprints 149453 g003
Figure 4. Classification of the trends in the non-grainization rate in the counties of Jiangsu Province from 2001 to 2020.
Preprints 149453 g004
Figure 5. Changes in the 20-year non-grainization rate in various cities in Jiangsu Province.
Preprints 149453 g005
Figure 6. The non-grainization rate of cultivated land and the spatial distribution of non-grainization area of cultivated land in Jiangsu Province in 2001(a-b) and 2020(c-d).
Preprints 149453 g006
Figure 7. The non-grainization rate of cultivated land and the spatial distribution of non-grainization area of cultivated land in Jiangsu Province in 2001(a-b) and 2020(c-d).
Preprints 149453 g007
Figure 8. Spatial distribution of the geographically weighted regression coefficient of the non-grainization rate. (a−d) Proportion of non-agricultural employment, urbanization rate, rural residents' per capita disposable income, and rural electricity consumption in 2001; (e−f) rural residents' per capita disposable income and rural electricity consumption in 2010; (g−h) per capita cultivated land area and rural residents' per capita disposable income in 2020.
Preprints 149453 g008
Figure 9. Spatial distribution of the geographical weighted regression coefficient of the non-grainization area of cultivated land. (a−c) Total agricultural output, rural residents' per capita disposable income, and agricultural fertilizer application in 2001; (e−h) total agricultural output, proportion of non-agricultural income, total power of agricultural machinery, rural electricity consumption, and agricultural fertilizer application in 2010; (i) total agricultural output in 2020.
Preprints 149453 g009
Table 1. The factors driving the preliminary selection of arable land.
Driving factor Variable description Unit Predicted relationship
Social development
Non-agricultural employment ratio (X1) Non-agricultural employed labor in rural areas/Total employed labor in rural areas % +
Urbanization rate (X2) Urban population as a proportion of the total population % +
Per capita cultivated land area (X3) Total cultivated land area in the county/Total rural population Khm2 ±
Villager group (X4) Number of villager groups in the county during a specific time period Number of groups -
Economic factors
Total agricultural output value (X5) Total agricultural output value, forestry, animal husbandry, and fisheries Million CNY +
Per capita disposable income of rural residents (X6) Income obtained by rural residents in the county after initial distribution and redistribution CNY per capita ±
Proportion of non-agricultural income (X7) Non-agricultural income/Disposable income of rural residents % +
Production conditions
Total agricultural machinery power (X8) Total power of the machinery used in agriculture, forestry, animal husbandry, and fisheries in the county MW -
Rural electricity consumption (X9) Total electricity consumption in rural areas of the county during a specific time period MWh ±
Agricultural fertilizer usage (X10) Total amount of fertilizer used in agricultural production in the county during a specific time period Tons +
Pesticide usage (X11) Total amount of pesticides used in agricultural production in the county during a specific time period Tons -
Table 2. Comparison of the MLR and MGWR results for the factors driving the non-grainization rate of cultivated land.
Dependent variable Non-grainization rate of cultivated land
Year Independent variable MLR MGWR
Coefficient T value VIF Mean Minimum Maximum
2001 Constant 31.6 0.0 -0.2 0.4
X1 -0.5* -2.1 5.5 -0.4 -0.6 -0.1
X2 0.4** 3.2 2.0 0.6 0.3 0.7
X3 0.1 0.7 1.6 0.2 -0.0 0.4
X4 0.1 0.7 3.0 0.1 0.0 0.1
X5 -0.2 -1.2 3.9 0.0 -0.1 0.1
X6 1.1** 4.7 5.6 0.6 0.4 1.0
X7 -0.1 -0.4 6.9 -0.2 -0.3 -0.2
X8 -0.2 -1.2 2.3 -0.3 -0.3 -0.2
X9 -0.5** -2.7 4.5 0.2 -0.2 0.5
X10 0.2 1.0 4.3 0.2 0.2 0.2
X11 0.3 1.6 2.8 0.0 -0.0 0.2
Adj.R2 0.33 0.58
AIC 182.2
Function Gaussian
2010 Constant 23.7 -0.4 -0.6 -0.1
X1 -0.2 -1.4 3.9 -0.0 -0.1 0.0
X2 0.2 1.8 2.2 0.2 -0.1 0.6
X3 -0.1 -0.7 2.1 0.0 -0.0 0.1
X4 0.1 1.1 2.3 0.1 -0.1 0.3
X5 0.4 2.2 4.6 0.4 0.4 0.5
X6 0.9*** 4.3 6.0 0.6 0.4 0.7
X7 0.1 0.2 7.6 0.1 -0.1 0.2
X8 -0.2 -1.3 3.8 -0.2 -0.2 -0.2
X9 -0.5** -3.3 2.9 -0.5 -0.6 -0.4
X10 0.1 0.8 4.5 0.0 -0.2 0.1
X11 -0.1 -0.9 1.6 -0.1 -0.4 0.1
Adj.R2 0.41 0.59
AIC 170.6
Function Gaussian
2020 Constant 25.4 -0.2 -0.4 -0.0
X1 -0.0 -0.1 3.2 -0.1 -0.1 -0.0
X2 0.1 1.1 2.3 0.2 0.1 0.2
X3 -0.3* -2.3 2.3 -0.2 -0.2 -0.1
X4 -0.0 -0.4 2.7 -0.1 -0.2 -0.0
X5 0.4 2.0 6.5 0.4 0.4 0.5
X6 0.9*** 4.6 5.4 0.6 0.6 0.7
X7 -0.2 -0.8 7.0 0.0 -0.1 0.0
X8 0.1 0.4 7.8 0.1 0.1 0.1
X9 -0.2 -1.3 2.7 -0.1 -0.1 -0.1
X10 -0.2 -1.1 4.3 -0.2 -0.4 -0.1
X11 -0.2 -1.1 2.8 -0.2 -0.3 -0.1
Adj.R2 0.51 0.56
AIC 170.6
Function Gaussian
Table 3. Comparison of the MLR and MGWR results for the factors driving the non-grainization area of cultivated land.
Dependent variable Non-grainization area of cultivated land
Year Independent variable MLR MGWR
Coefficient T value VIF Mean Minimum Maximum
2001 Constant 24.2 -0.1 -0.1 0.1
X1 -0.2 -1.7 5.5 -0.2 -0.2 -0.1
X2 0.1 0.9 2.0 0.1 0.1 0.1
X3 0.1 2.0 1.6 0.2 0.0 0.5
X4 0.2 1.6 3.0 0.2 0.1 0.2
X5 0.3** 2.9 3.9 0.4 0.4 0.5
X6 0.4** 2.7 5.6 0.2 0.2 0.2
X7 -0.0 -0.0 6.9 -0.1 -0.2 -0.1
X8 -0.1 -1.4 2.3 -0.2 -0.2 -0.2
X9 -0.2 -1.8 4.5 -0.0 -0.2 0.1
X10 0.5*** 4.3 4.3 0.4 0.4 0.5
X11 0.0 0.0 2.8 -0.1 -0.2 0.1
Adj.R2 0.74 0.83
AIC 105.1
Function Gaussian
2010 Constant 17.4 -0.2 -0.2 -0.1
X1 -0.2 -1.3 3.9 -0.0 -0.1 -0.0
X2 -0.0 -0.4 2.2 0.0 -0.0 0.1
X3 0.2 1.9 2.1 0.3 0.2 0.3
X4 0.2 2.0 2.3 0.1 0.0 0.3
X5 0.7*** 5.2 4.6 0.8 0.8 0.8
X6 0.2 1.0 6.0 0.0 -0.1 0.1
X7 0.4* 2.1 7.6 0.4 0.4 0.5
X8 -0.4** -2.8 3.8 -0.3 -0.3 -0.2
X9 -0.3* -2.4 2.9 -0.3 -0.4 -0.3
X10 0.5** 3.4 4.5 0.4 0.3 0.4
X11 -0.0 -0.5 1.6 -0.1 -0.1 0.0
Adj.R2 0.67 0.70
AIC 141.4
Function Gaussian
2020 Constant 15.8 -0.1 -0.2 0.0
X1 -0.0 -0.3 3.2 -0.0 -0.1 -0.0
X2 -0.0 -0.1 2.3 0.0 -0.0 0.0
X3 -0.0 -0.1 2.3 0.1 -0.1 0.3
X4 -0.0 -0.1 2.7 -0.1 -0.3 0.1
X5 0.9*** 4.5 6.5 0.9 0.8 0.9
X6 0.1 0.6 5.4 0.1 0.0 0.1
X7 0.2 0.9 7.0 0.3 0.2 0.4
X8 -0.0 -0.2 7.8 0.2 0.1 0.2
X9 -0.0 -0.2 2.7 -0.1 -0.1 -0.0
X10 0.1 0.9 4.3 0.1 0.1 0.1
X11 -0.0 -0.2 2.8 -0.1 -0.1 -0.1
Adj.R2 0.56 0.63
AIC 152.5
Function Gaussian
Note: * denotes P < 0.05, ** denotes P < 0.01, and *** denotes P < 0.001.
Disclaimer/Publisher’s Note: The statements, opinions and data contained in all publications are solely those of the individual author(s) and contributor(s) and not of MDPI and/or the editor(s). MDPI and/or the editor(s) disclaim responsibility for any injury to people or property resulting from any ideas, methods, instructions or products referred to in the content.
Copyright: This open access article is published under a Creative Commons CC BY 4.0 license, which permit the free download, distribution, and reuse, provided that the author and preprint are cited in any reuse.
Prerpints.org logo

Preprints.org is a free preprint server supported by MDPI in Basel, Switzerland.

Subscribe

Disclaimer

Terms of Use

Privacy Policy

Privacy Settings

© 2025 MDPI (Basel, Switzerland) unless otherwise stated