Submitted:
15 February 2025
Posted:
18 February 2025
Read the latest preprint version here
Abstract
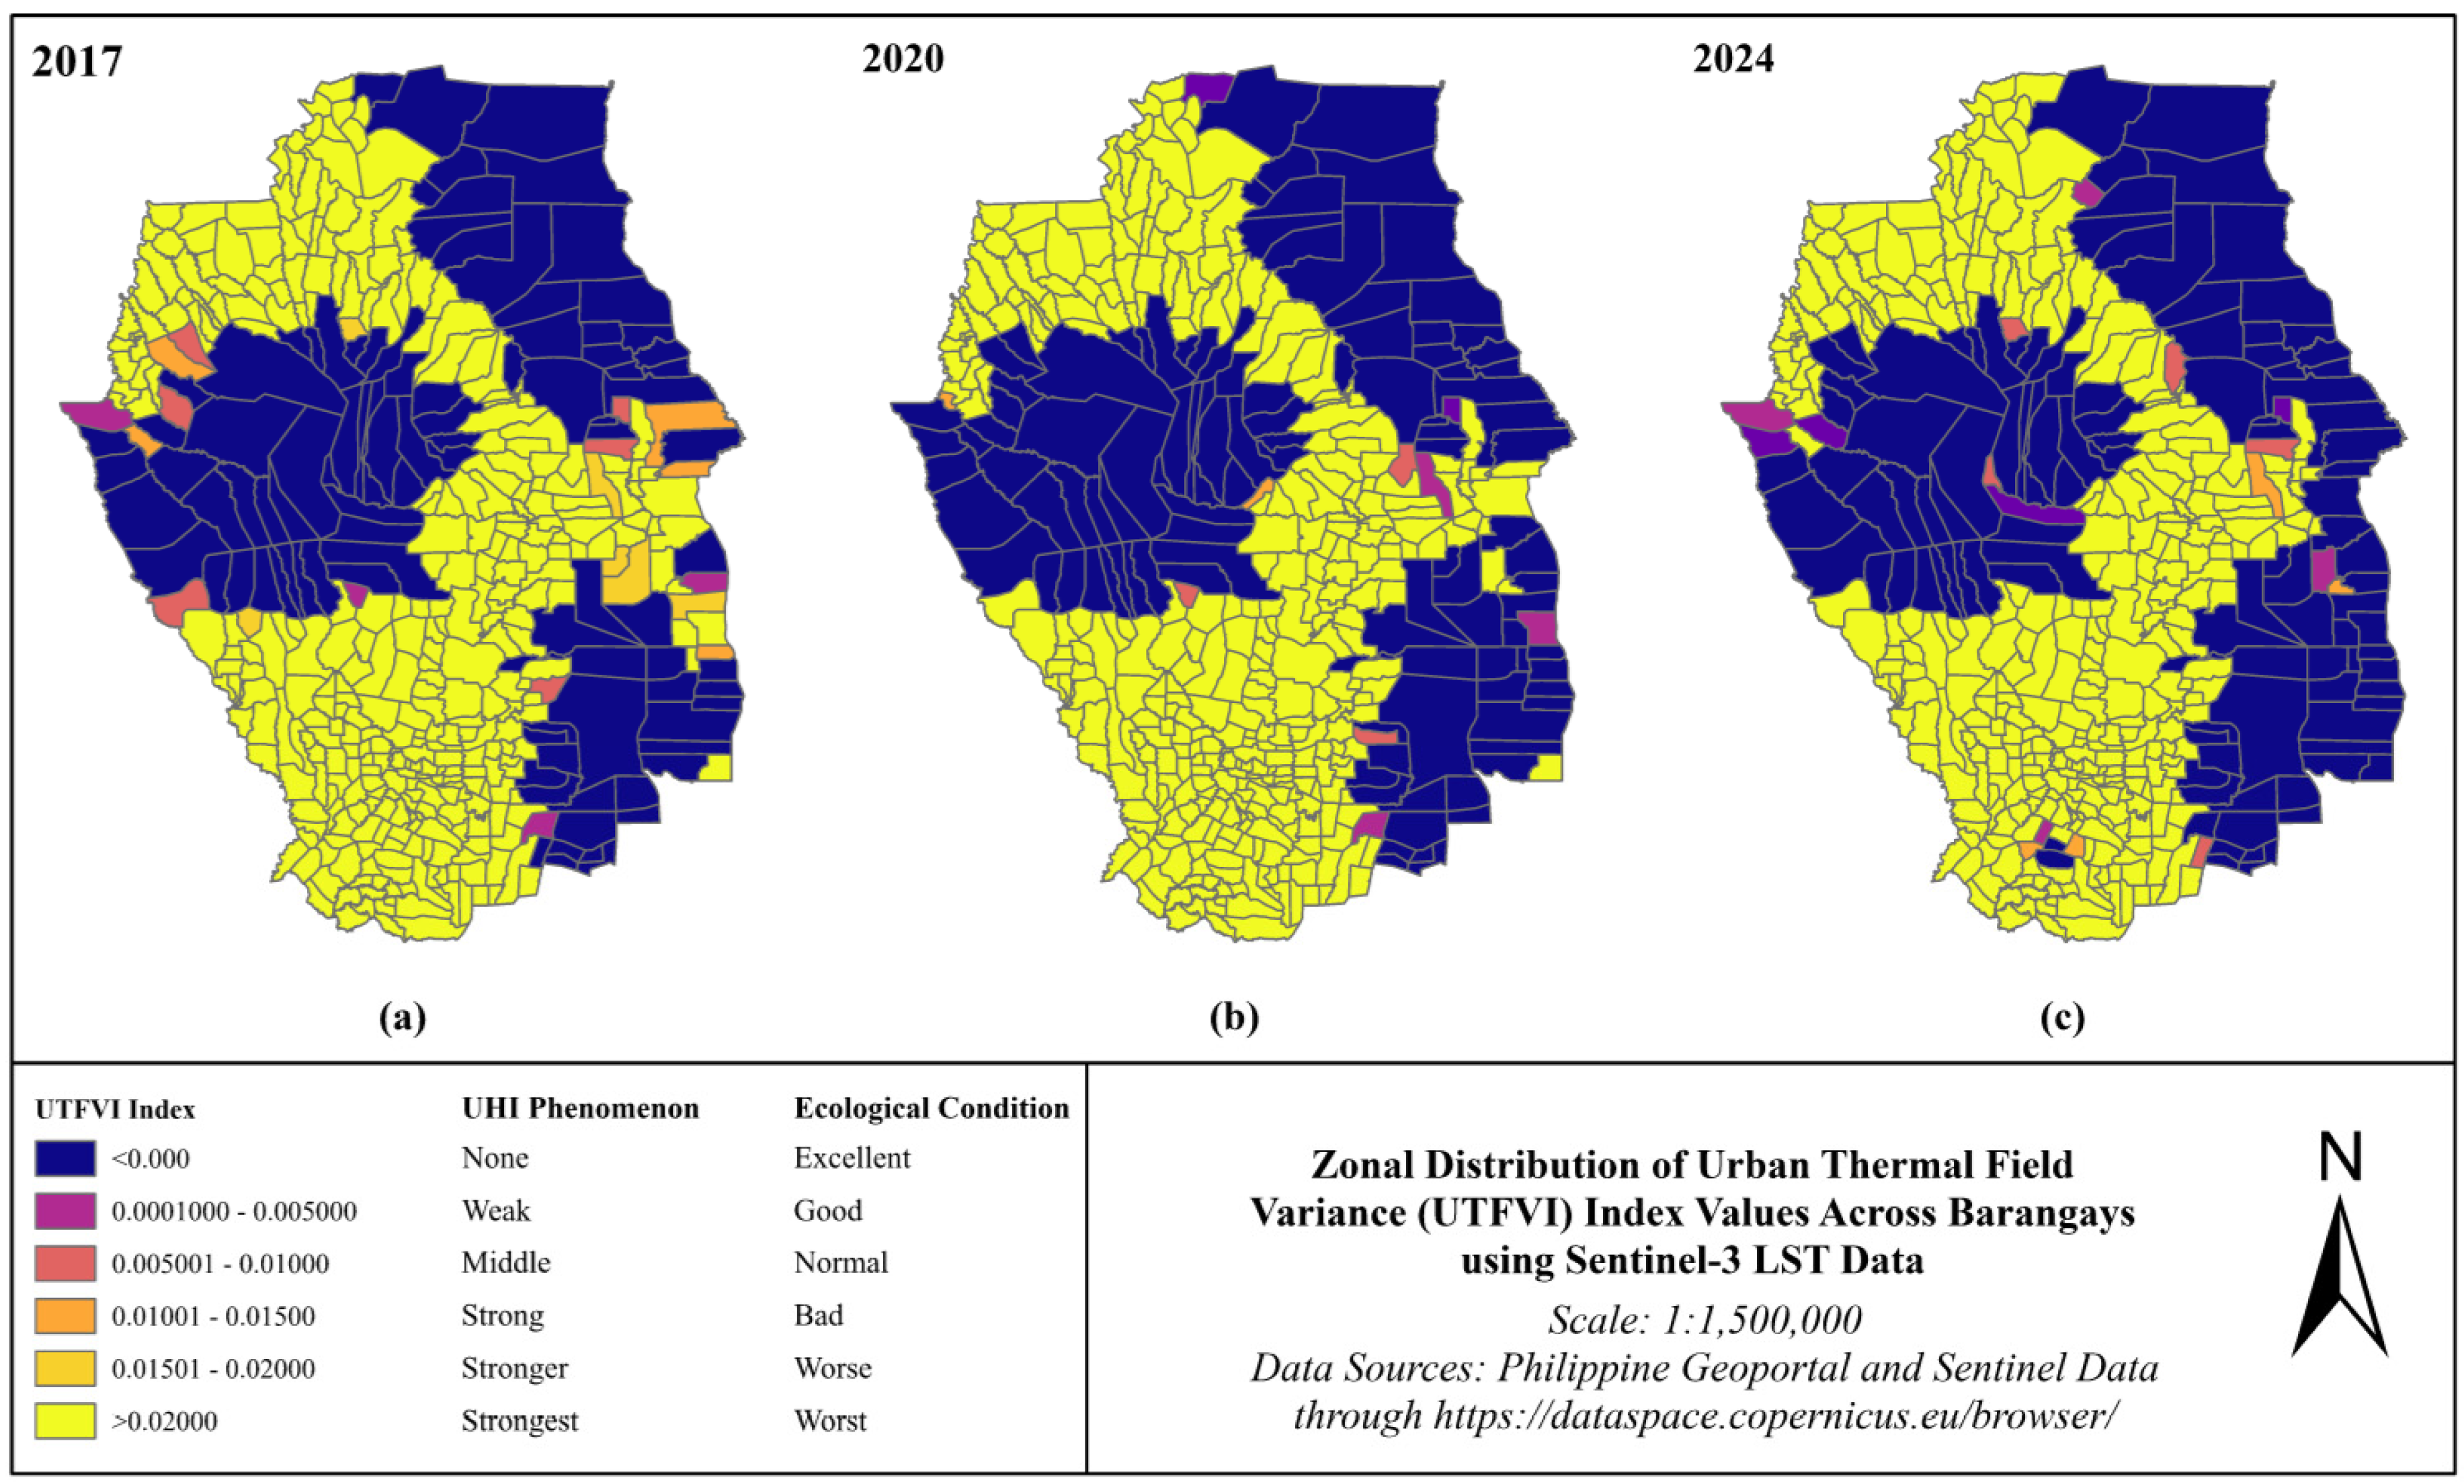
Urbanization has transformed natural landscapes, resulting in increased land surface temperatures and the intensification of Urban Heat Island (UHI) effects. This study explores the relationship between land use/land cover (LULC) changes and land surface temperature (LST) from 2017 to 2024, using satellite data from Landsat and Sentinel. Results from supervised classification reveal a 50.9% increase in built-up land, from 21,256 hectares in 2017 to 32,099 hectares in 2024, accompanied by a 6.3% decline in woodland. Analysis of LST data highlights rising temperatures in urbanized and deforested areas, with LST peaking at 36.96 °C in 2020 before slightly decreasing to 31.03 °C in 2024, potentially influenced by increased rainfall. However, hotspots of elevated LST persist, indicating sustained thermal stress. The Urban Thermal Field Variance Index (UTFVI) showed worsening ecological conditions, particularly in densely urbanized zones. The study highlights the pressing need for integrating Urban Heat Island (UHI) considerations into urban planning, as elevated urban temperatures threaten public health and escalated energy consumption. Additionally, the research aligns with Sustainable Development Goal 11 (SDG 11), emphasizing the creation of inclusive, safe, resilient, and sustainable cities. By providing policymakers with key UHI indices, this study contributes to climate-resilient urban environments, mitigating heat risks through green infrastructure and sustainable urban design.
Keywords:
1. Introduction
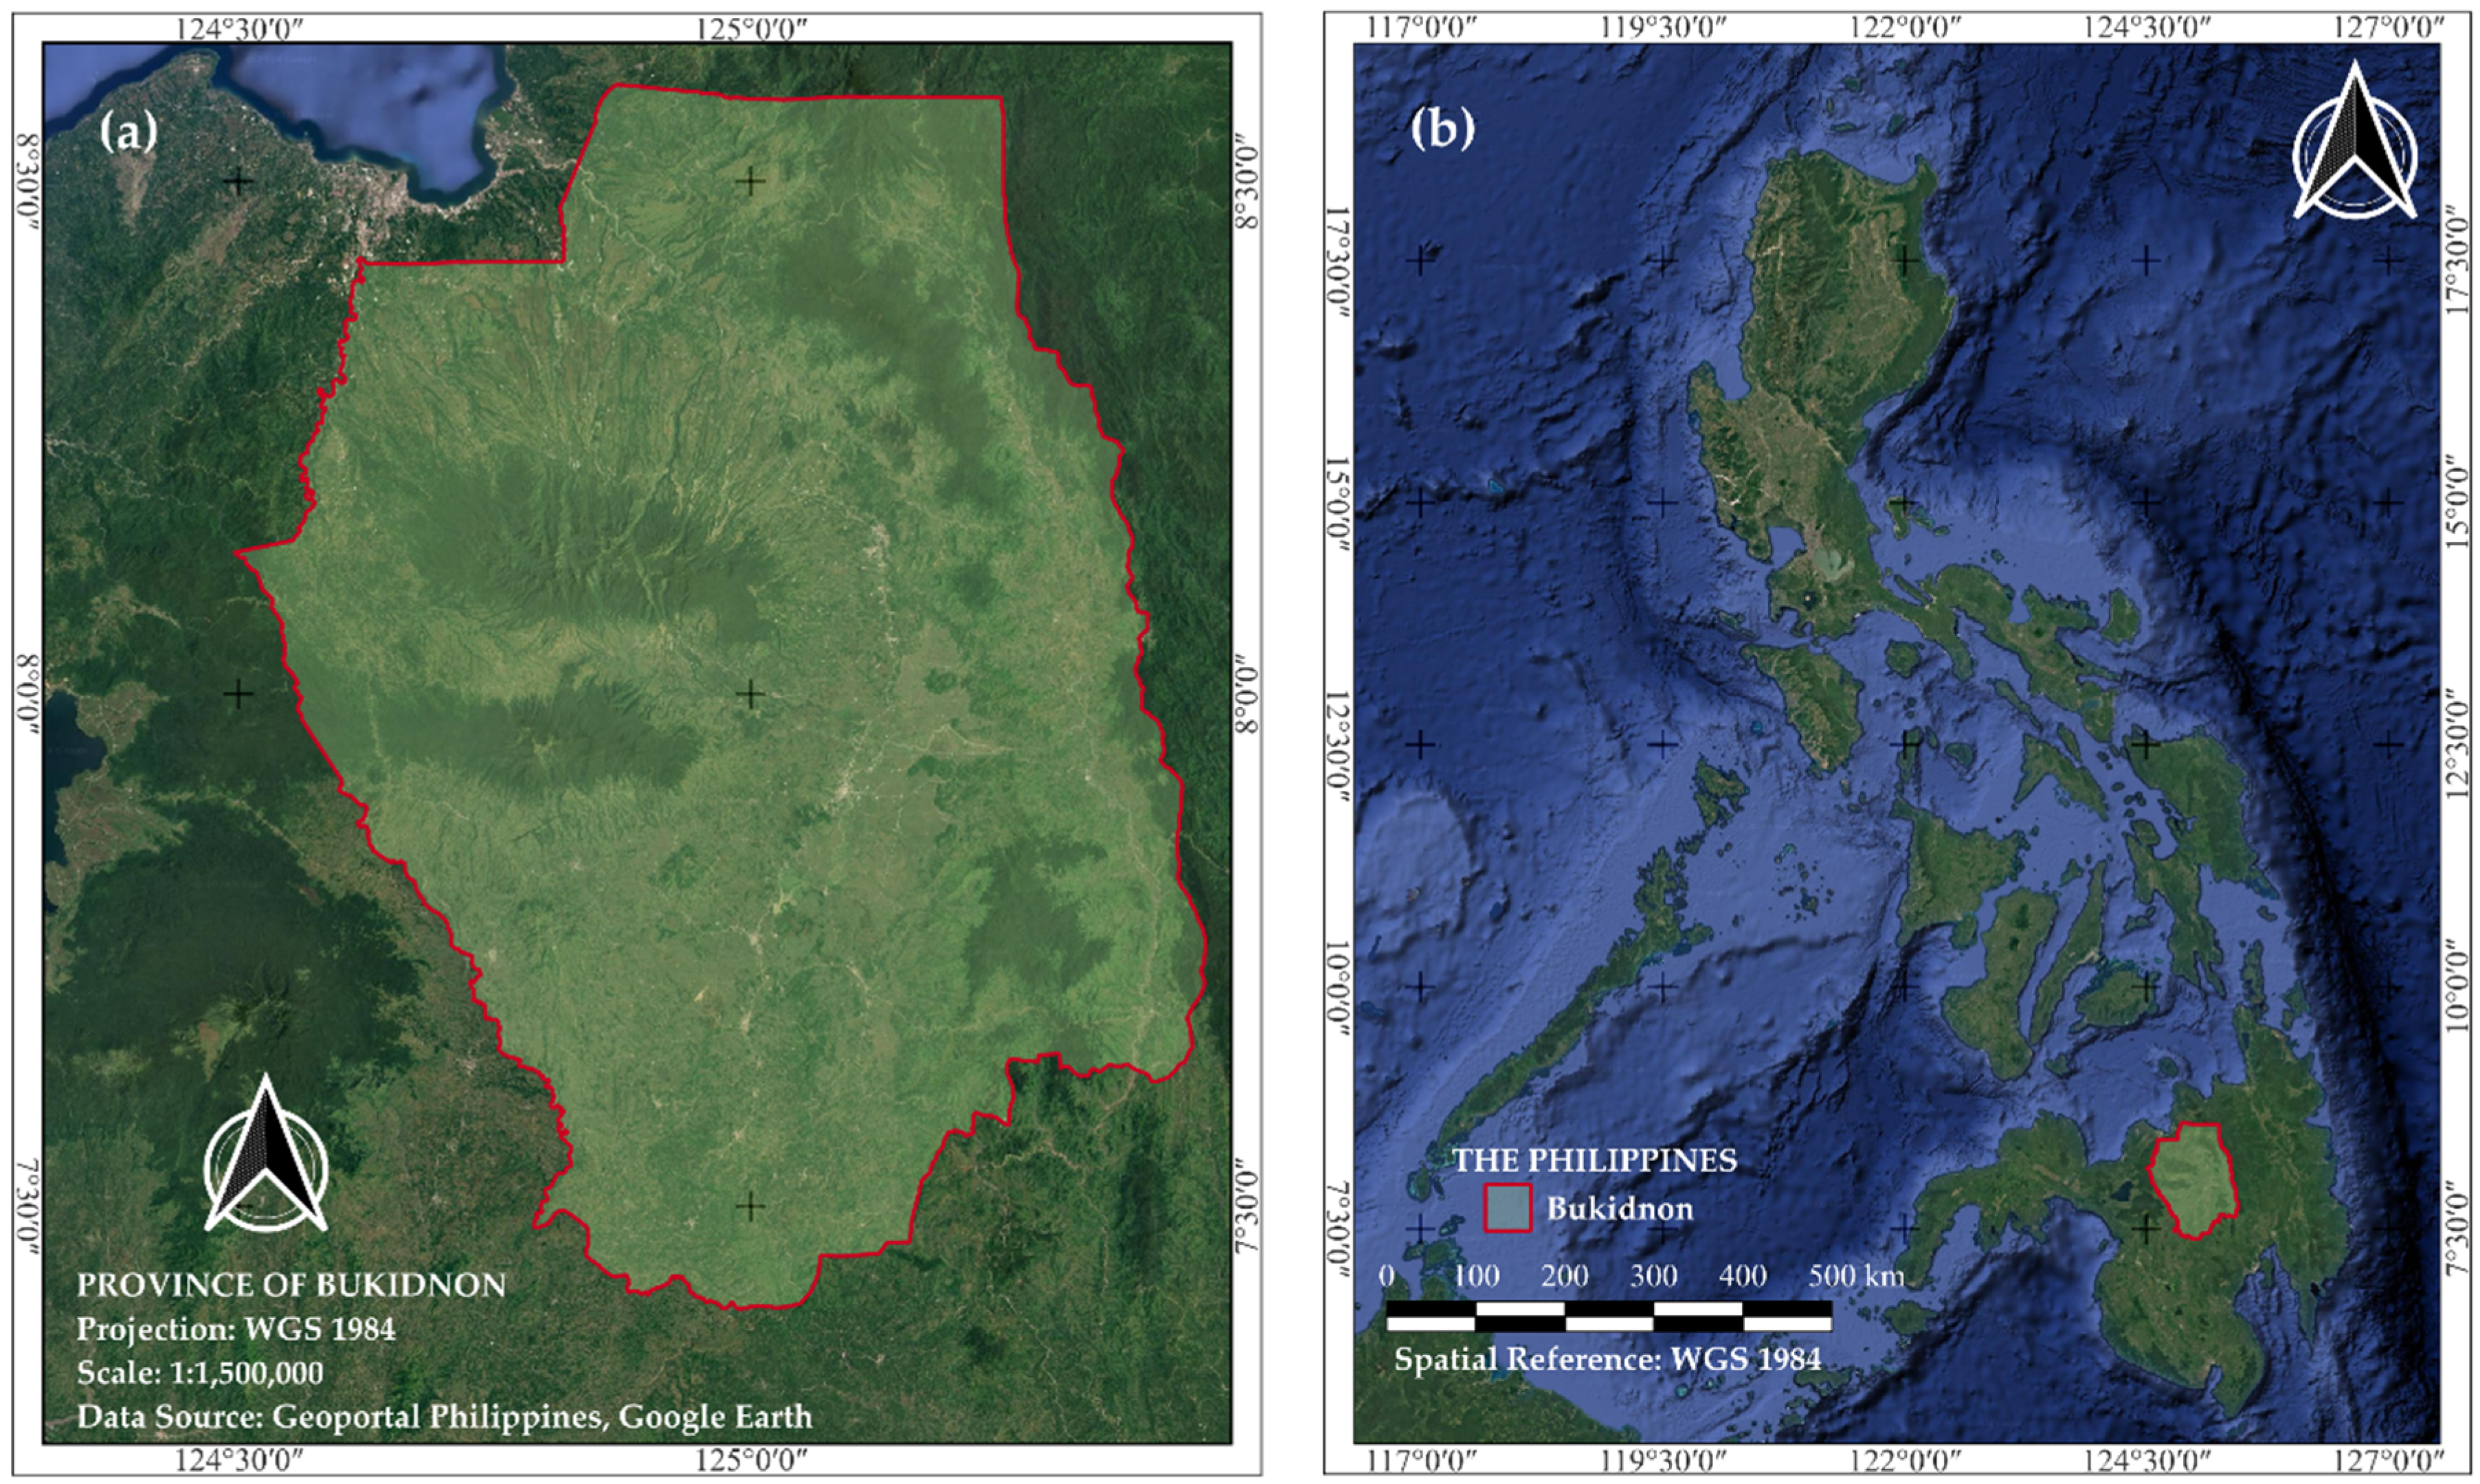
2. Study Area
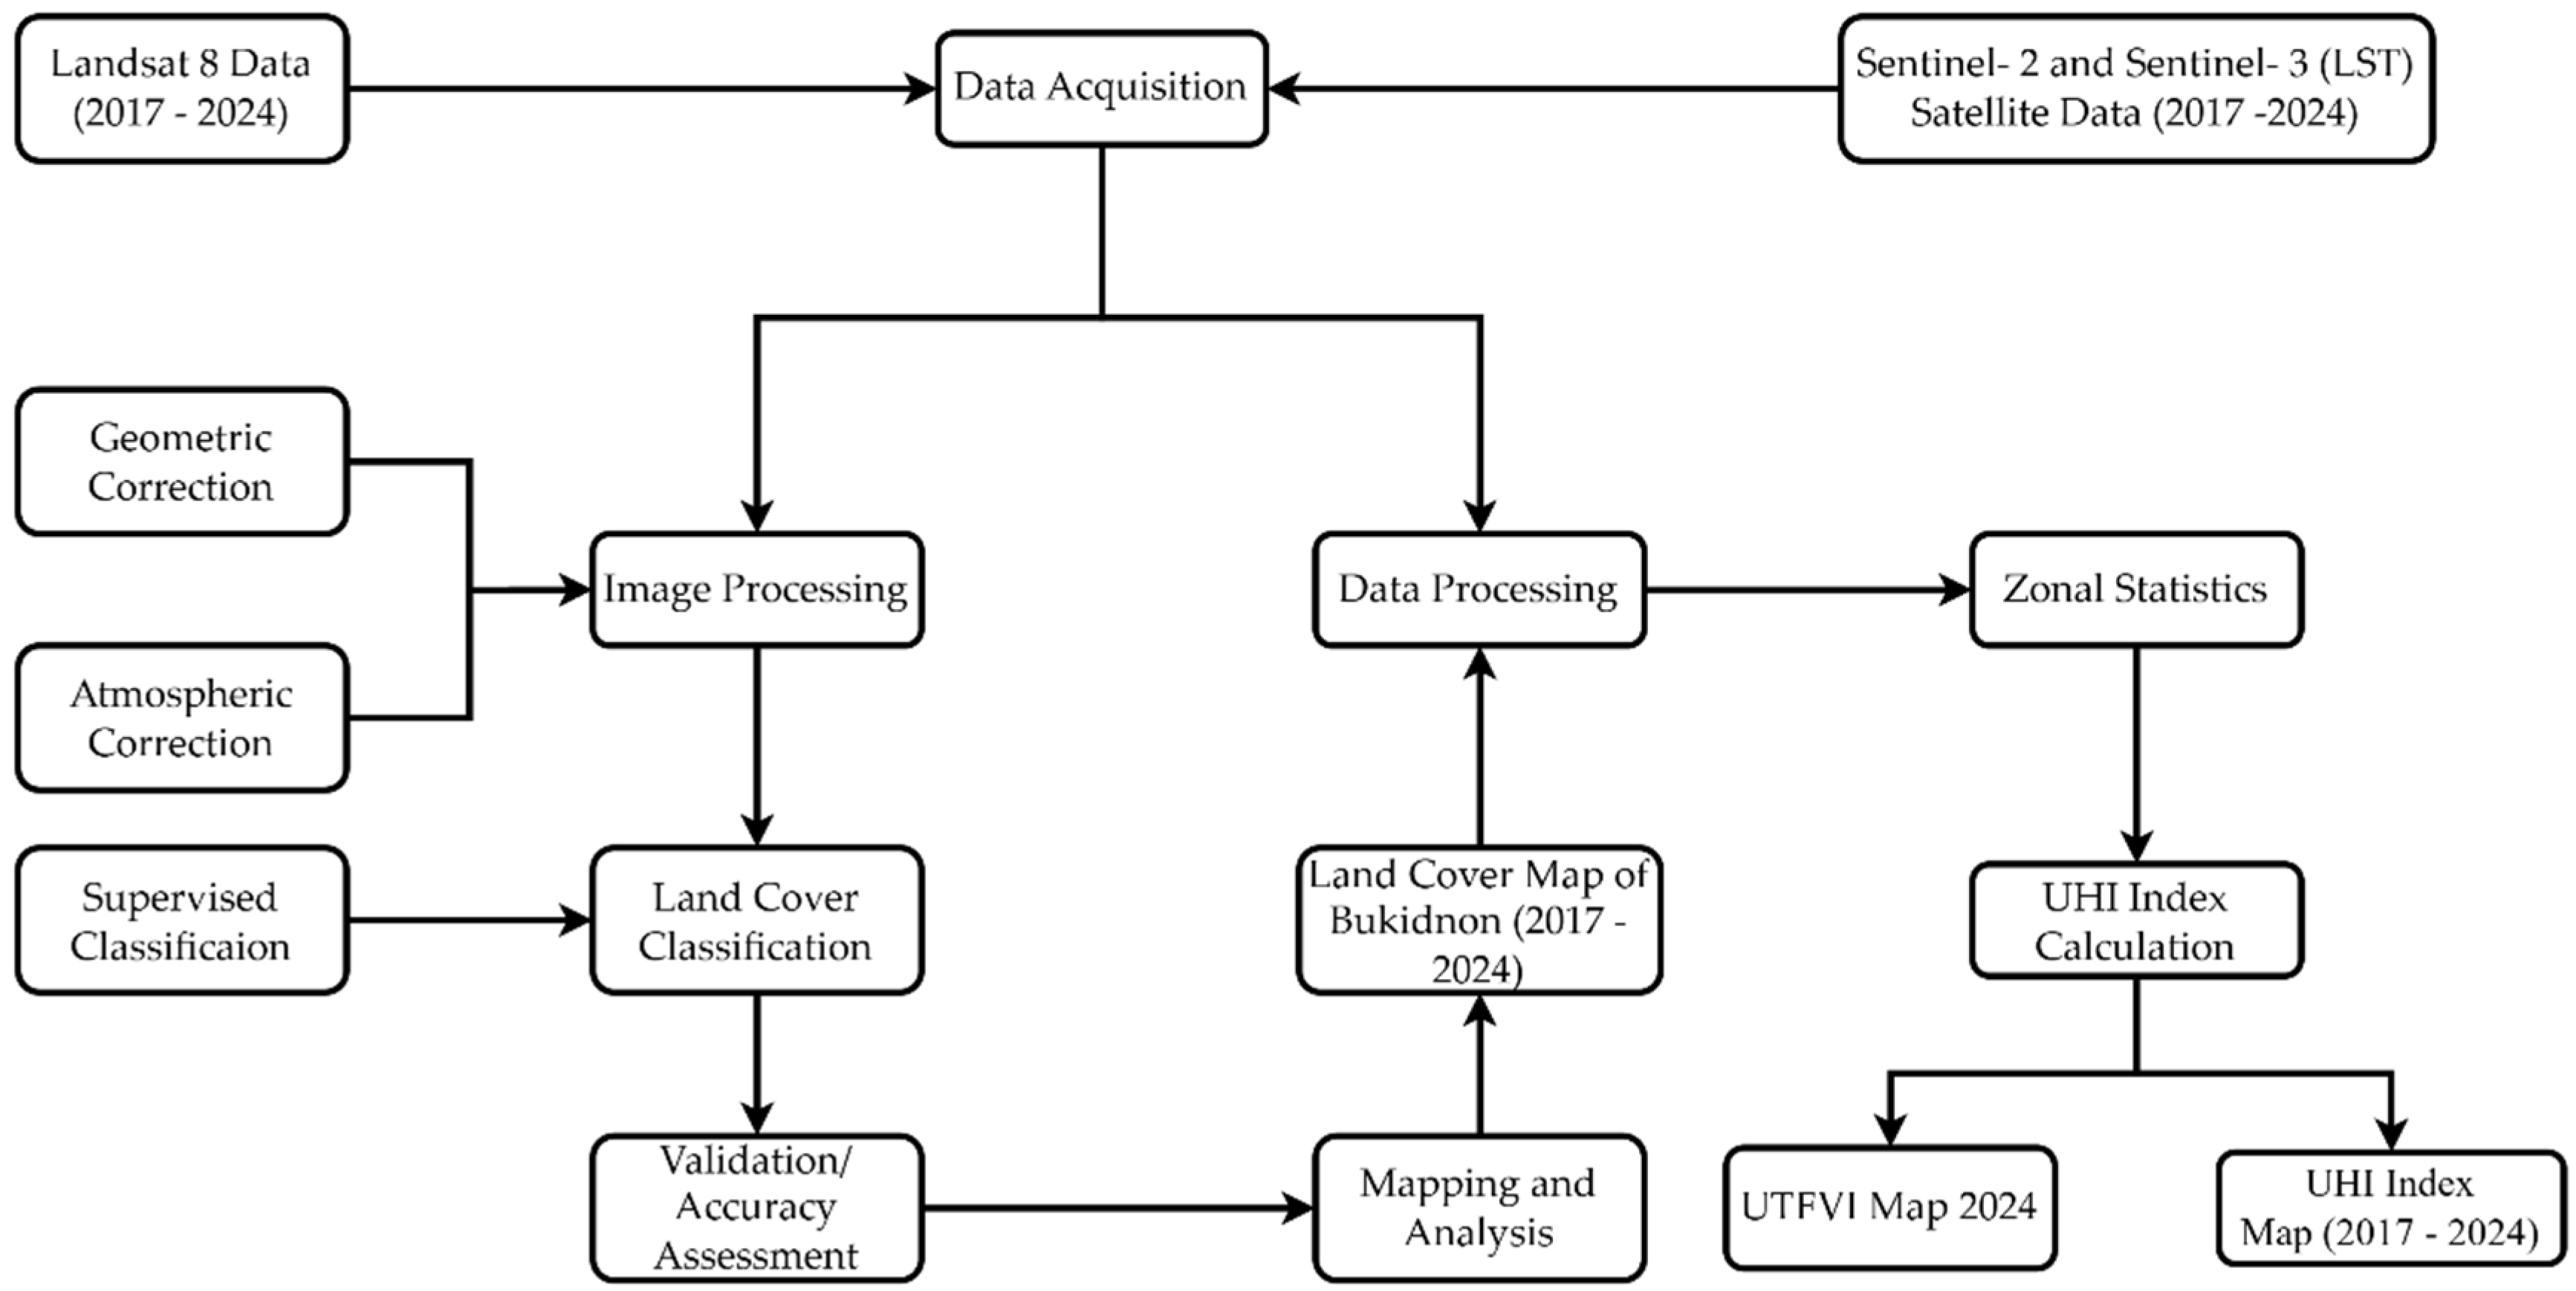
3. Materials and Methods
3.1. Land Cover Classification
3.2. Land Surface Temperature Retrieval
3.3. Urban Heat Island Index Calculation

| Urban Thermal Field Variance Index Threshold | Urban Heat Island Phenomenon | Ecological Conditions Evaluation |
|---|---|---|
| < 0 | None | Excellent |
| 0.000–0.005 | Weak | Good |
| 0.005–0.010 | Middle | Normal |
| 0.010–0.015 | Strong | Bad |
| 0.015–0.020 | Stronger | Worse |
| >0.020 | Strongest | Worst |
3.3. Urban Thermal Field Variance Index Calculation
4. Results
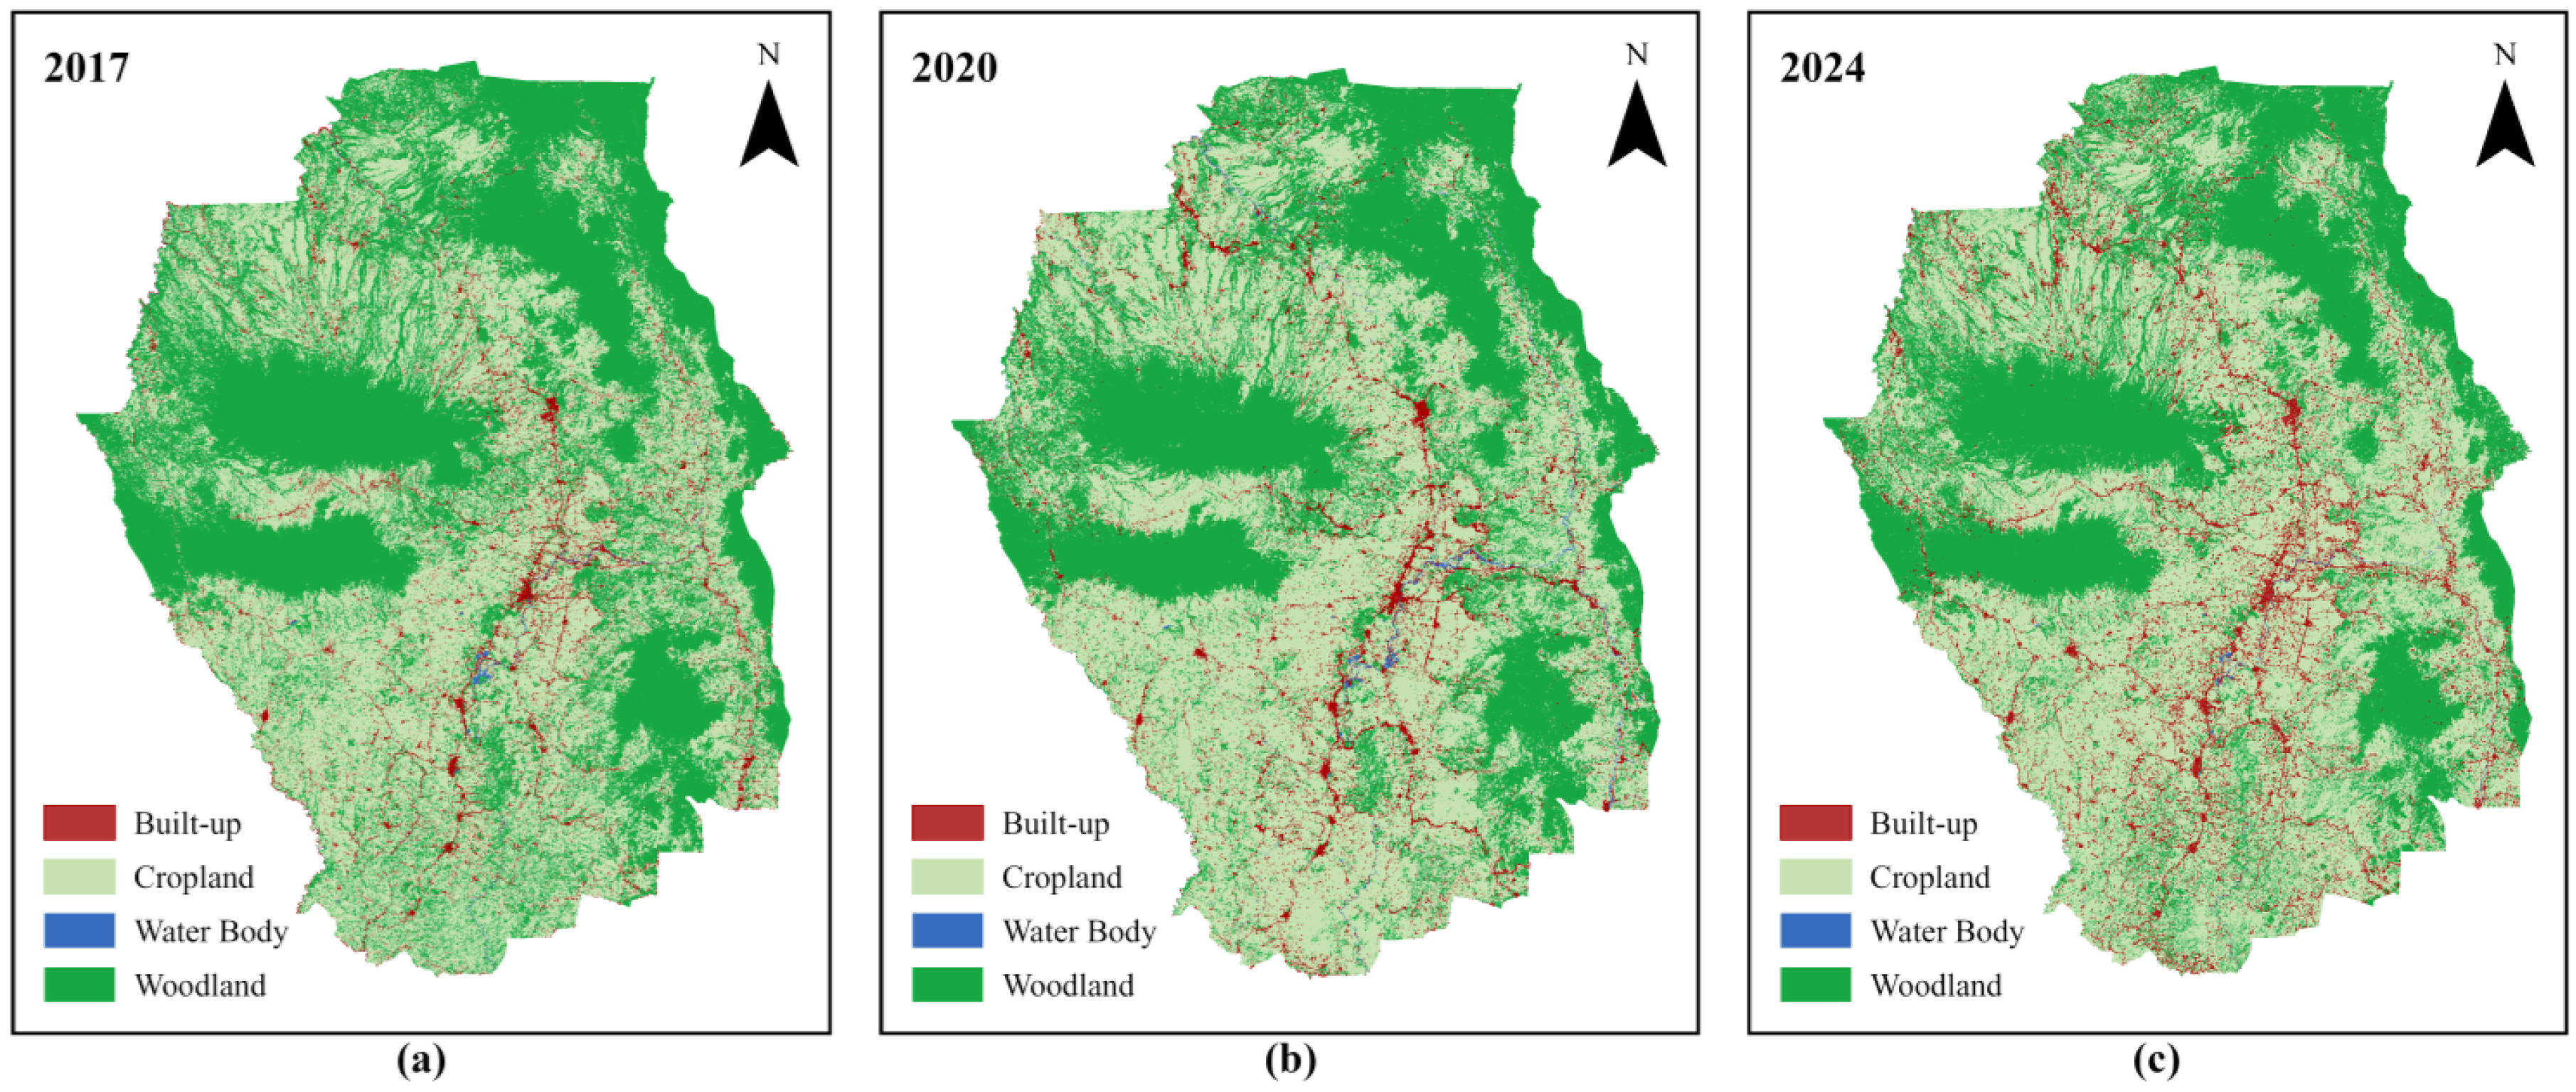
4.1. Land Cover Classification and Analysis
| Classes | Description |
|---|---|
| Cropland | Lands used for agriculture, horticulture, and gardens, including paddy fields and irrigated and dry farmland and vegetation. Lands covered with wetland plants and water. |
| Woodland | Lands covered with trees, including deciduous and coniferous woodlands and sparse woodland. |
| Water Body | Water bodies in the land area, including rivers, lakes, reservoirs, and fish ponds. |
| Built-up Land | Lands modified by human activities, including all kinds of habitation, industrial and mining areas, transportation facilities, and interior urban green zones and water bodies. |
| 2017 | 2020 | 2024 | ||
|---|---|---|---|---|
| User’s Accuracy | Cropland | 0.810084 | 0.858716 | 0.815466 |
| Built-up | 0.769231 | 0.619048 | 0.720000 | |
| Woodand | 0.840426 | 0.777518 | 0.823383 | |
| Wate Body | 1.000000 | 0.700000 | 0.714286 | |
| Producer’s Accuracy | 0.821535 | 0.817547 | 0.815553 | |
| Kappa | 0.654973 | 0.648250 | 0.647020 |
| Land cover class | 2017 | 2020 | 2024 |
|---|---|---|---|
| Built-up Land | 21,256 | 26,321 | 32,099 |
| Woodland | 392,463 | 381,339 | 367,737 |
| Cropland | 513,212 | 521,200 | 532,008 |
| Waterbody | 3,111 | 5,315 | 3,586 |
4.2. Land Surface Temperature Analysis

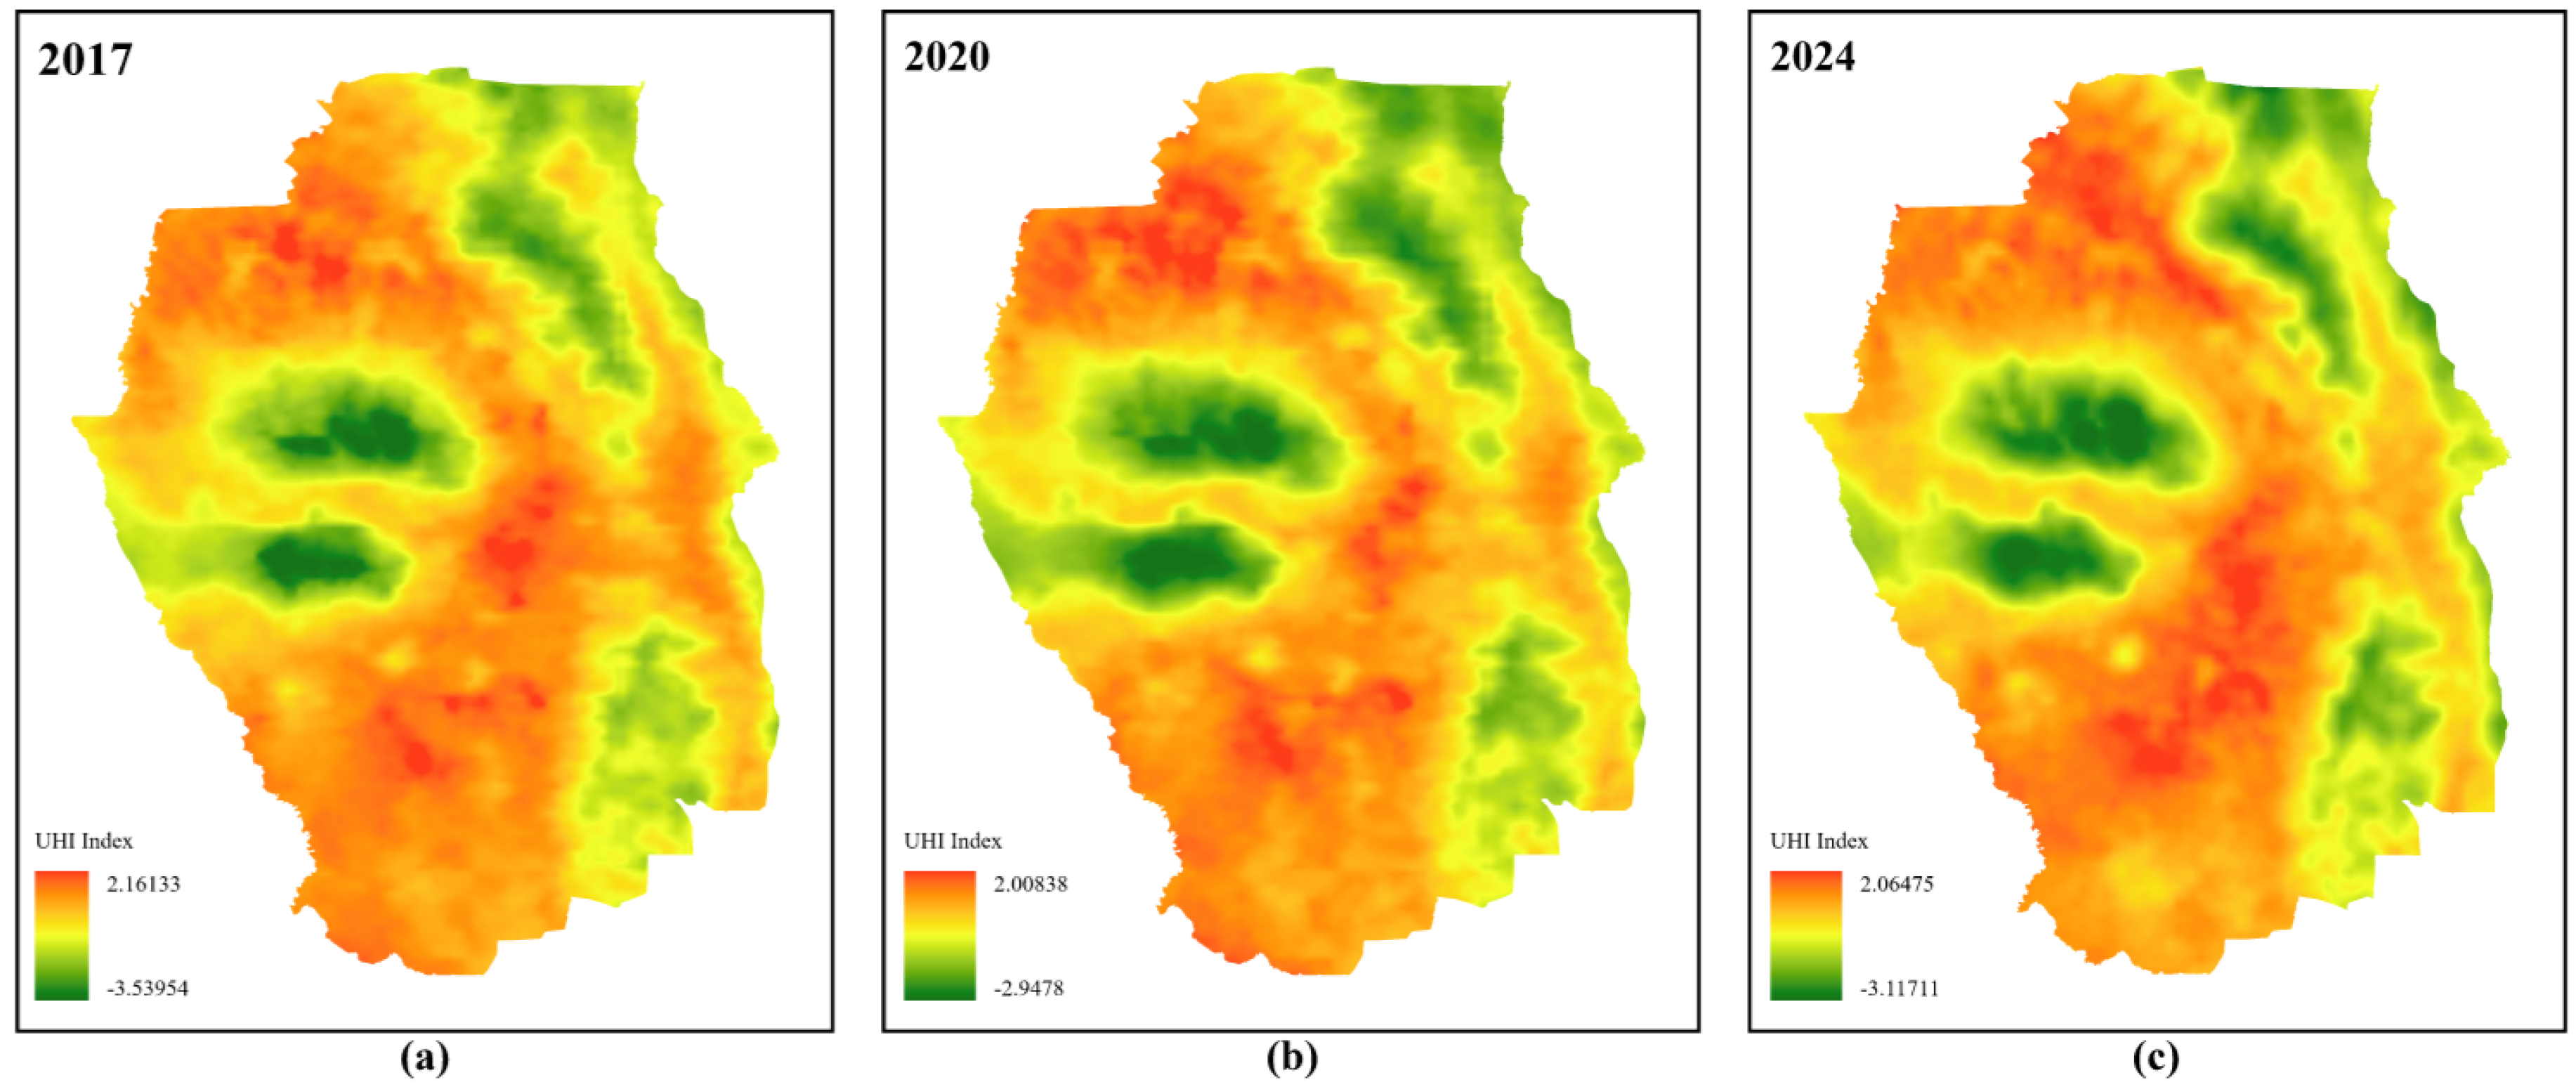
4.3. Urban Heat Island Index and Urban Thermal Field Variance Index Analysis
4.3. Correlation between LandCover Classes and Land Surface Temperature (LST)
| LST Average | Elevation | Population | Built-Up | Cropland | Water Body | |
|---|---|---|---|---|---|---|
| Elevation | -0.817 | |||||
| Population | 0.165 | -0.008 | ||||
| Built-Up | 0.283 | -0.078 | 0.120 | |||
| Cropland | 0.521 | -0.454 | -0.006 | -0.288 | ||
| Water Body | 0.233 | -0.322 | 0.119 | 0.014 | 0.136 | |
| Woodland | -0.683 | 0.514 | -0.063 | -0.232 | -0.864 | -0.198 |
| LST Average | Elevation | Population | Built-up | Cropland | Water Body | |
|---|---|---|---|---|---|---|
| Elevation | -0.775 | |||||
| Population | 0.152 | 0.018 | ||||
| Built-up | 0.197 | -0.101 | 0.109 | |||
| Cropland | 0.667 | -0.498 | 0.060 | -0.320 | ||
| Water Body | 0.109 | -0.217 | 0.035 | 0.141 | -0.012 | |
| Woodland | -0.794 | 0.582 | -0.117 | -0.163 | -0.880 | -0.134 |
| LST Average | Elevation | Population | Built-up | Cropland | Waterbody | |
|---|---|---|---|---|---|---|
| Elevation | -0.761 | |||||
| Population | 0.190 | -0.009 | ||||
| Built-up | 0.243 | -0.083 | 0.165 | |||
| Cropland | 0.551 | -0.433 | 0.049 | -0.286 | ||
| Waterbody | 0.167 | -0.223 | 0.113 | 0.167 | -0.018 | |
| Woodland | -0.697 | 0.486 | -0.156 | -0.346 | -0.798 | -0.140 |
5. Discussions
6. Conclusions
Author Contributions
Funding
Institutional Review Board Statement
Informed Consent Statement
Data Availability Statement
Acknowledgments
Conflicts of Interest
Abbreviations
| DOST-ERDT | Department of Science and Technology – Engineering Research development for Technology |
| GIS | Geographic Information System |
| GVA | Gross Value Added |
| JHCSC | Josefina H. Cerilles State College |
| LST | Land Surface Temperature |
| LULC | Land Use/Land Cover |
| MSU-IIT | Mindanao State University - Iligan Institute of Technology |
| NASA | National Aeronautics and Space Administration |
| PAGASA | Philippine Astronomical, Geophysical and Astronomical Services Administration |
| PSA | Philippine Statistics Authority |
| SD | Standard Deviation |
| SDG | Sustainable Development Goals |
| SLSTR | Sea and Land Surface Temperature Radiometer |
| UHI | Urban Heat Island |
| UHII | Urban Heat Island Index |
| UTFVI | Urban Thermal Field Variance Index |
| USGS | United States Geological Survey |
References
- Adeleke, S.O.; Monshood, F.J. Impact of Urbanization on Land Cover Changes and Land Surface Temperature in Iseyin Local Government Area, Oyo State, Nigeria. Journal of Tropical Forestry and Environment 2022, 12, 33–43. [Google Scholar] [CrossRef]
- Akomolafe, G. F.; Rosazlina, R. Land use and land cover changes influence the land surface temperature and vegetation in Penang Island, Peninsular Malaysia. Scientific Reports 2022, 12. Springer Science and Business Media LLC. [Google Scholar] [CrossRef]
- Dharani, M.; Sreenivasulu, G. Land Use and Land Cover Change Detection Using Principal Component Analysis and Morphological Operations in Remote Sensing Applications. International Journal of Remote Sensing Applications 2019, 8, 98–109. [Google Scholar] [CrossRef]
- Zargari, H.; Esmaili, A.; Mahmoudi, R. Assessing Urban Heat Island Intensity and Mitigation Strategies: A Comprehensive Review. Urban Climate 2024, 42, 101337. [Google Scholar] [CrossRef]
- Malik, Z.; Kalotra, S. Urbanization and LST Variations: A Study Us- ing Landsat and Sentinel Data. Sustainable Development and Climate Change 2024, 30, 54–65. [Google Scholar]
- Munsyi, K.; Huang, Y.; Tang, B. Comparative Analysis of Urban Heat Islands Using Landsat and Sentinel Data in Southeast Asia. Environmental Monitoring and Assessment 2024, 196, 1169. [Google Scholar] [CrossRef]
- Ifreey, A.; Alwi, M.; Wahid, T. Sustainable Mitigation Strategies for Urban Heat Island Effects in Urban Areas. International Journal of Urban Sustainable Development 2023, 15, 343–357. [Google Scholar] [CrossRef]
- Shi, J.; Li, Y.; Chen, X. Urban Heat Island Intensity Variability Using Sentinel-2 and Landsat-8. Remote Sensing Applications 2021, 25, 512–526. [Google Scholar] [CrossRef]
- Todeschi, V.; Pappalardo, S. E.; Zanetti, C.; Peroni, F.; Marchi, M. D. Climate Justice in the City: Mapping Heat-Related Risk for Climate Change Mitigation of the Urban and Peri-Urban Area of Padua (Italy). ISPRS International Journal of Geo-Information 2022, 11, 490. [Google Scholar] [CrossRef]
- Qiao, Z.; Wang, Y.J.; Huang, J.; Zhou, X. Impact of Urbanization on Urban Heat Island Intensity and Mitigation Strategies. Environmental Research Letters 2020, 15, 105005. [Google Scholar] [CrossRef]
- Imran, H.M.; Habib, S.; Niazi, Z. Impact of land cover changes on land surface temperature and human thermal comfort in Dhaka City, Bangladesh. Urban Forestry and Urban Greening 2021, 59, 126846. [Google Scholar] [CrossRef]
- Alkaradaghi, K.; Ali, S.S.; Al-Ansari, N.; Laue, J. Land Use Classification and Change Detection Using Multi-temporal Landsat Imagery in Sulaimaniyah Governorate, Iraq. Advances in Science, Technology & Innovation 2018, 117–120. [Google Scholar] [CrossRef]
- Rashid, A.; Mehmood, S.; Khan, T. Investigating the urban heat island effect using Landsat data: A case study of Islamabad, Pakistan. Remote Sensing Letters 2020, 11(3), 243–251. [Google Scholar] [CrossRef]
- Tian, L.; Li, Y.; Lu, J.; Wang, J. Review on Urban Heat Island in China: Methods, Its Impact on Buildings Energy Demand and Mitigation Strategies. Sustainability 2021, 13, 762. [Google Scholar] [CrossRef]
- He, T.; Wang, N.; Chen, J.; Wu, F.; Xu, X.; Liu, L.; Han, D.; Sun, Z.; Lu, Y.; Hao, Y.; Qiao, Z. Direct and indirect impacts of land use/cover change on urban heat environment: a 15-year panel data study across 365 Chinese cities during summer daytime and nighttime. Landscape Ecology 2024, 39. Springer Science and Business Media LLC.. [Google Scholar] [CrossRef]
- Hou, X.; Fan, J.; Zhang, P. Remote sensing analysis of urban thermal patterns in response to land use dynamics. Urban Environment 2022, 19, 123–140. [Google Scholar] [CrossRef]
- Al-Taei, A. I.; Alesheikh, A. A.; Darvishi Boloorani, A. Land Use/Land Cover Change Analysis Using Multi-Temporal Remote Sensing Data: A Case Study of Tigris and Euphrates Rivers Basin. Land 2023. [CrossRef]
- Guo, X.; Ye, J.; Hu, Y. Analysis of Land Use Change and Driving Mechanisms in Vietnam during the Period 2000–2020. Remote Sensing 2022, 14, 1600. [Google Scholar] [CrossRef]
- Jamei, Y.; Seyedmahmoudian, M.; Jamei, E.; Horan, B.; Mekhilef, S.; Stojcevski, A. Investigating the Relationship between Land Use/Land Cover Change and Land Surface Temperature Using Google Earth Engine; Case Study: Melbourne, Australia. Sustainability 2022, 14, 14868. [Google Scholar] [CrossRef]
- Benaomar, K.; Outzourhit, A. Exploring the Complexities of Urban Forms and Urban Heat Islands: Insights from the Literature, Methodologies, and Current Status in Morocco. Atmosphere 2024, 15, 822. [Google Scholar] [CrossRef]
- Mao, X.; Tang, G.; Du, J.; Tian, X. Biophysical Effects of Land Cover Changes on Land Surface Temperature on the Sichuan Basin and Surrounding Regions. Land 2023, 12, 1959. [Google Scholar] [CrossRef]
- Wellman, K.; White, M.; Robinson, P. Urbanization and its impact on local climates: A review of global trends. Environmental Sustainability 2020, 14, 233–245. [Google Scholar] [CrossRef]
- Choudhury, U.; Singh, S.K.; Kumar, A.; Meraj, G.; Kumar, P.; Kanga, S. Assessing land use/land cover changes and urban heat island intensification: A case study of Kamrup Metropolitan District, Northeast India (2000–2032). Earth 2023, 4(3), 503–521. [Google Scholar] [CrossRef]
- Gislason, P. O.; Benediktsson, J. A.; Sveinsson, J. R. Random Forests for land cover classification. Pattern Recognition Letters 2006, 27, 294–300, Elsevier BV. [Google Scholar] [CrossRef]
- Xian, G.; Shi, H.; Auch, R.; Gallo, K.; Zhou, Q.; Wu, Z.; Kolian, M. The effects of urban land cover dynamics on urban heat Island intensity and temporal trends. GIScience & Remote Sensing 2021, 4, 501–515. [Google Scholar] [CrossRef]
- Salman, Md. A.; Nomaan, Md. S. S.; Sayed, S.; Saha, A.; Rafiq, M. R. Land Use and Land Cover Change Detection by Using Remote Sensing and GIS Technology in Barishal District, Bangladesh. Earth Science Malaysia 2020, 5, 33–40. [Google Scholar] [CrossRef]
- Seyam, M. M. H.; Haque, M. R.; Rahman, M. M. Identifying the land use land cover (LULC) changes using remote sensing and GIS approach: A case study at Bhaluka in Mymensingh, Bangladesh. Case Studies in Chemical and Environmental Engineering 2023, 7, 100293, Elsevier BV. [Google Scholar] [CrossRef]
- Suharyanto, A.; Maulana, A.; Suprayogo, D.; Devia, Y.; Kurniawan, S. Global Journal of Environmental Science and Management Land surface temperature changes caused by land cover/ land use properties and their impact on rainfall characteristics. Serial #35 Global J. Environ. Sci. Manage 2023, 9, 35. [Google Scholar] [CrossRef]
- Gu, Z.; Zeng, M. The Use of Artificial Intelligence and Satellite Remote Sensing in Land Cover Change Detection: Review and Perspectives. Sustainability 2023, 16, 274. [Google Scholar] [CrossRef]
- Alonzo, M.; Van Den Hoek, J.; Murillo-Sandoval, P. J.; Steger, C. E.; Zinda, J. A. Mapping and quantifying land cover dynamics using dense remote sensing time series with the user-friendly pyNITA software. Environmental Modelling & Software, 2021. [Google Scholar] [CrossRef]
- Wang, X.; Jiang, W.; Deng, Y.; Yin, X.; Peng, K.; Rao, P.; Li, Z. Contribution of Land Cover Classification Results Based on Sentinel-1 and 2 to the Accreditation of Wetland Cities. Remote Sensing 2023, 15, 1275. [Google Scholar] [CrossRef]
- Imran, H.M.; Habib, S.; Niazi, Z. Impact of land cover changes on land surface temperature and human thermal comfort in Dhaka City, Bangladesh. Urban Forestry and Urban Greening 2021, 59, 126846. [Google Scholar] [CrossRef]
- Khan, M.S.; Ullah, S.; Sun, T.; Rehman, A.U.; Chen, L. Land-Use/Land-Cover Changes and Its Contribution to Urban Heat Island: A Case Study of Islamabad, Pakistan. Sustainability 2020, 12, 3861; [Google Scholar] [CrossRef]
- Lo, C.P.; Quattrochi, D.A. Land-use and land-cover change, urban heat island phenomenon, and the global climate system. Photogrammetric Engineering and Remote Sensing 2023, 69(9), 911–921. [Google Scholar]
- Rashid, A.; Mehmood, S.; Khan, T. Investigating the urban heat island effect using Landsat data: A case study of Islamabad, Pakistan. Remote Sensing Letters 2020, 11(3), 243–251. [Google Scholar] [CrossRef]
- Purio, M. A.; Yoshitake, T.; Cho, M. Assessment of Intra-Urban Heat Island in a Densely Populated City Using Remote Sensing: A Case Study for Manila City. Remote Sensing 2022, 14, 5573. [Google Scholar] [CrossRef]
- Onačillová, K.; Gallay, M.; Paluba, D.; Péliová, A.; Tokarčík, O.; Laubertová, D. (2022). Combining Landsat 8 and Sentinel-2 Data in Google Earth Engine to Derive Higher Resolution Land Surface Temperature Maps in Urban Environment. Remote Sensing 2022, 14, 4076. [Google Scholar] [CrossRef]
- Igun, E.; Williams, M. Impact of urban land cover change on land surface temperature. Journal of Urban Ecology 2018, 12, 23–37. [Google Scholar] [CrossRef]
- Van Thong, D.; Tuan Cuong, H.; Ha Phuong, T.; Lam, N.T.N.; Nguyen, T.P.C.; Lap Xuan, T.T.; Le Quang, T. . Analysis of urban heat islands combining Sentinel-2 and Landsat 8 satellite images in Ho Chi Minh City. IOP Conference Series: Earth and Environmental Science 2024, 1349, 012032. [Google Scholar] [CrossRef]
- Sadiq Khan, M.; Ullah, S.; Sun, T.; Rehman, A.; Chen, L. Land-Use/Land-Cover Changes and Its Contribution to Urban Heat Island: A Case Study of Islamabad, Pakistan. Sustainability 2020, 12, 3861. [Google Scholar] [CrossRef]
- Mas’uddin, M.; Karlinasari, L.; Pertiwi, S.; Erizal, E. Urban Heat Island Index Change Detection Based on Land Surface Temperature, Normalized Difference Vegetation Index, and Normalized Difference Built-Up Index: A Case Study. Journal of Ecological Engineering 2023, 24, 91–107. [Google Scholar] [CrossRef]
- Sahoo, S.; Majumder, A.; Swain, S.; Pateriya, B.; Al-Ansari, N.; Gareema. Analysis of Decadal Land Use Changes and Its Impacts on Urban Heat Island (UHI) Using Remote Sensing-Based Approach: A Smart City Perspective. Sustainability 2022, 14, 11892. [Google Scholar] [CrossRef]
- Damayanti, A.; Hartati, K.; Widodo, W. Impacts of land cover changes on land surface temperature using Landsat imagery with the supervised classification method. International Journal of Remote Sensing 2023, 44(7), 1203–1218. [Google Scholar] [CrossRef]
- Rousta, I.; Sarif, M. O.; Gupta, R. D.; Olafsson, H.; Ranagalage, M.; Murayama, Y.; Zhang, H.; Mushore, T. D. Spatiotemporal Analysis of Land Use/Land Cover and Its Effects on Surface Urban Heat Island Using Landsat Data: A Case Study of Metropolitan City Tehran (1988–2018). Sustainability 2018, 10, 4433. [Google Scholar] [CrossRef]
- Traore, M.; Lee, M. S.; Rasul, A.; Balew, A. Assessment of land use/land cover changes and their impacts on land surface temperature in Bangui (the capital of Central African Republic). Environmental Challenges 2021, 4, 100114. [Google Scholar] [CrossRef]
- Jabbar, K.L.; Hamoodi, M.N.; Al-Hameedawi, A.N. Urban heat islands: a review of contributing factors, effects and data. IOP Conf. Series: Earth and Environmental Science 2023, 1129, 012038. [Google Scholar] [CrossRef]
- Garcia, D.H. Analysis of urban heat island and heat waves using Sentinel-3 images: A study of Andalusian cities in Spain. Journal of Environmental Management 2021, 296, 113234. [Google Scholar] [CrossRef]
- Guo, X.; Ye, J.; Hu, Y. Analysis of Land Use Change and Driving Mechanisms in Vietnam during the Period 2000–2020. Remote Sensing 2022, 14, 1600. [Google Scholar] [CrossRef]
- Rahman, Md. N.; Rony, Md. R. H.; Jannat, F. A.; Chandra Pal, S.; Islam, Md. S.; Alam, E.; Islam, A. R. Md. T. Impact of Urbanization on Urban Heat Island Intensity in Major Districts of Bangladesh Using Remote Sensing and Geo-Spatial Tools. Climate 2022, 10, 3. [Google Scholar] [CrossRef]
- Sharma, U.; Jalan, S.; Kant, Y.; Vyas, A. Spatio-Temporal Dynamics of Urban Thermal Environment in Udaipur City, Rajasthan, India. The International Archives of the Photogrammetry, Remote Sensing and Spatial Information Sciences 2023, XLVIII-1. [Google Scholar] [CrossRef]
- Hassan, T.; Zhang, J.; Prodhan, F. A.; Pangali Sharma, T. P.; Bashir, B. Surface Urban Heat Islands Dynamics in Response to LULC and Vegetation across South Asia (2000–2019). Remote Sensing 2021, 13, 3177. [Google Scholar] [CrossRef]
- Landis, J.; Koch, G. The measurement of observer agreement for categorical data. Biometrics 1977, 33, 159–174. [Google Scholar] [CrossRef] [PubMed]
Disclaimer/Publisher’s Note: The statements, opinions and data contained in all publications are solely those of the individual author(s) and contributor(s) and not of MDPI and/or the editor(s). MDPI and/or the editor(s) disclaim responsibility for any injury to people or property resulting from any ideas, methods, instructions or products referred to in the content. |
© 2025 by the authors. Licensee MDPI, Basel, Switzerland. This article is an open access article distributed under the terms and conditions of the Creative Commons Attribution (CC BY) license (http://creativecommons.org/licenses/by/4.0/).


