
Submitted:
13 February 2025
Posted:
17 February 2025
You are already at the latest version
Abstract
Impellers are critical components in industrial applications, requiring smooth surfaces and precise di-mensions. Traditional investment casting methods are often time-consuming and costly. Fused Deposition Modeling (FDM), an additive manufacturing (AM) technology, offers a faster, more cost-effective alter-native. FDM produces 3D-printed sacrificial patterns directly from a CAD file, making it ideal for low-volume and complex patterns. Unlike wax patterns, which can shrink or distort, 3D-printed patterns offer precise tolerances and allow for thin-walled geometries. FDM also eliminates the need for tooling, reducing capital investment. However, achieving the desired surface finish and accuracy remains a challenge. In this study, a semi-open impeller for a centrifugal pump was printed using FDM with Acrylonitrile Butadiene Styrene (ABS) material. The Taguchi Design of Experiment (DoE) method was used to evaluate the impact of printing parameters layer thickness, extrusion temperature, and infill density on dimensional accuracy and surface roughness. Dimensional accuracy was assessed for features like inner and outer diameters, blade thickness, and height. Surface quality was evaluated across geometries like thin sections, curvatures, and surfaces (parallel to the XY/XZ, and YZ planes). Descriptive statistical analysis was performed to provide a comprehensive overview of the results, aiding further decision-making in the research.
Keywords:
deposition modeling (FDM)
; investment casting (IC)
; additive manufacturing (AM)
; acrylonitrile butadiene styrene (ABS)
; taguchi method
; dimensional accuracy
; surface roughness
; impeller
1. Introduction
Centrifugal pump is widely used for various applications due to its low initial cost and better performance at high speed. An impeller is one of the main components of the centrifugal pump. The impeller is a rotating part of a centrifugal pump, and its performance depends on the quality of the impeller [1]. The surface quality of the impeller affects the efficiency and output of the centrifugal pump. As surface roughness increases, the efficiency of a pump decreases [2]. Also, pump overall efficiency is influenced by impeller dimensions like blade height, blade angle, number of blades, and impeller diameter [3]. So, dimensional accuracy and surface quality are key quality indicators for an impeller.
Investment casting (IC) is appropriate for manufacturing parts like impellers, which have intricate shapes, complex geometry, and thin sections. These parts have high dimensional accuracy and good surface finish, which negates the necessity of further finishing. This process involves several steps, i.e., fabrication of metal die called master mould, wax pattern development through wax injection, construction of a gating system, slurry, and stucco coating to produce a ceramic mold of required thickness, dewaxing, sintering of ceramic mold, metal pouring, cooling, and breaking of ceramic mold to get final casting [4]. Figure 1 shows the step-by-step procedure of the conventional IC process.
Figure 1.
Step-by-step procedure of conventional investment casting process.
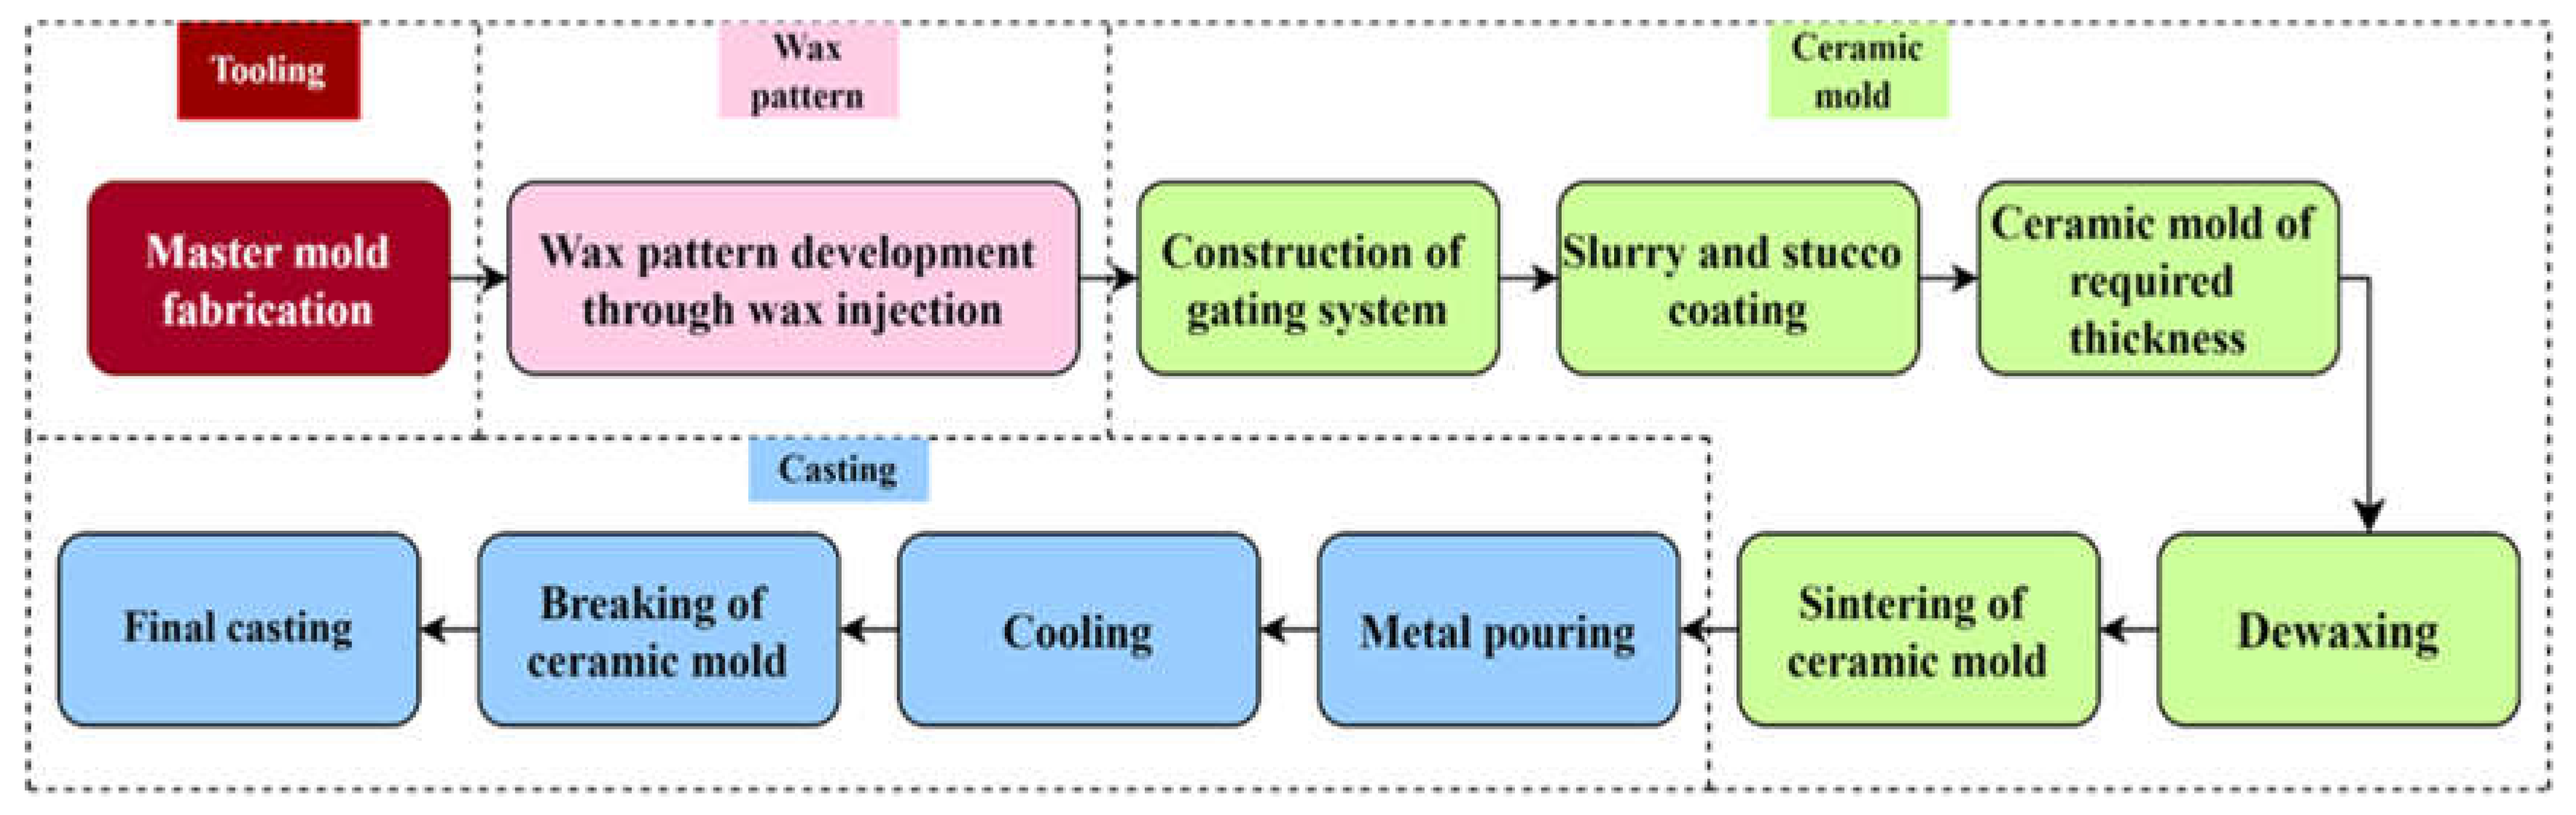
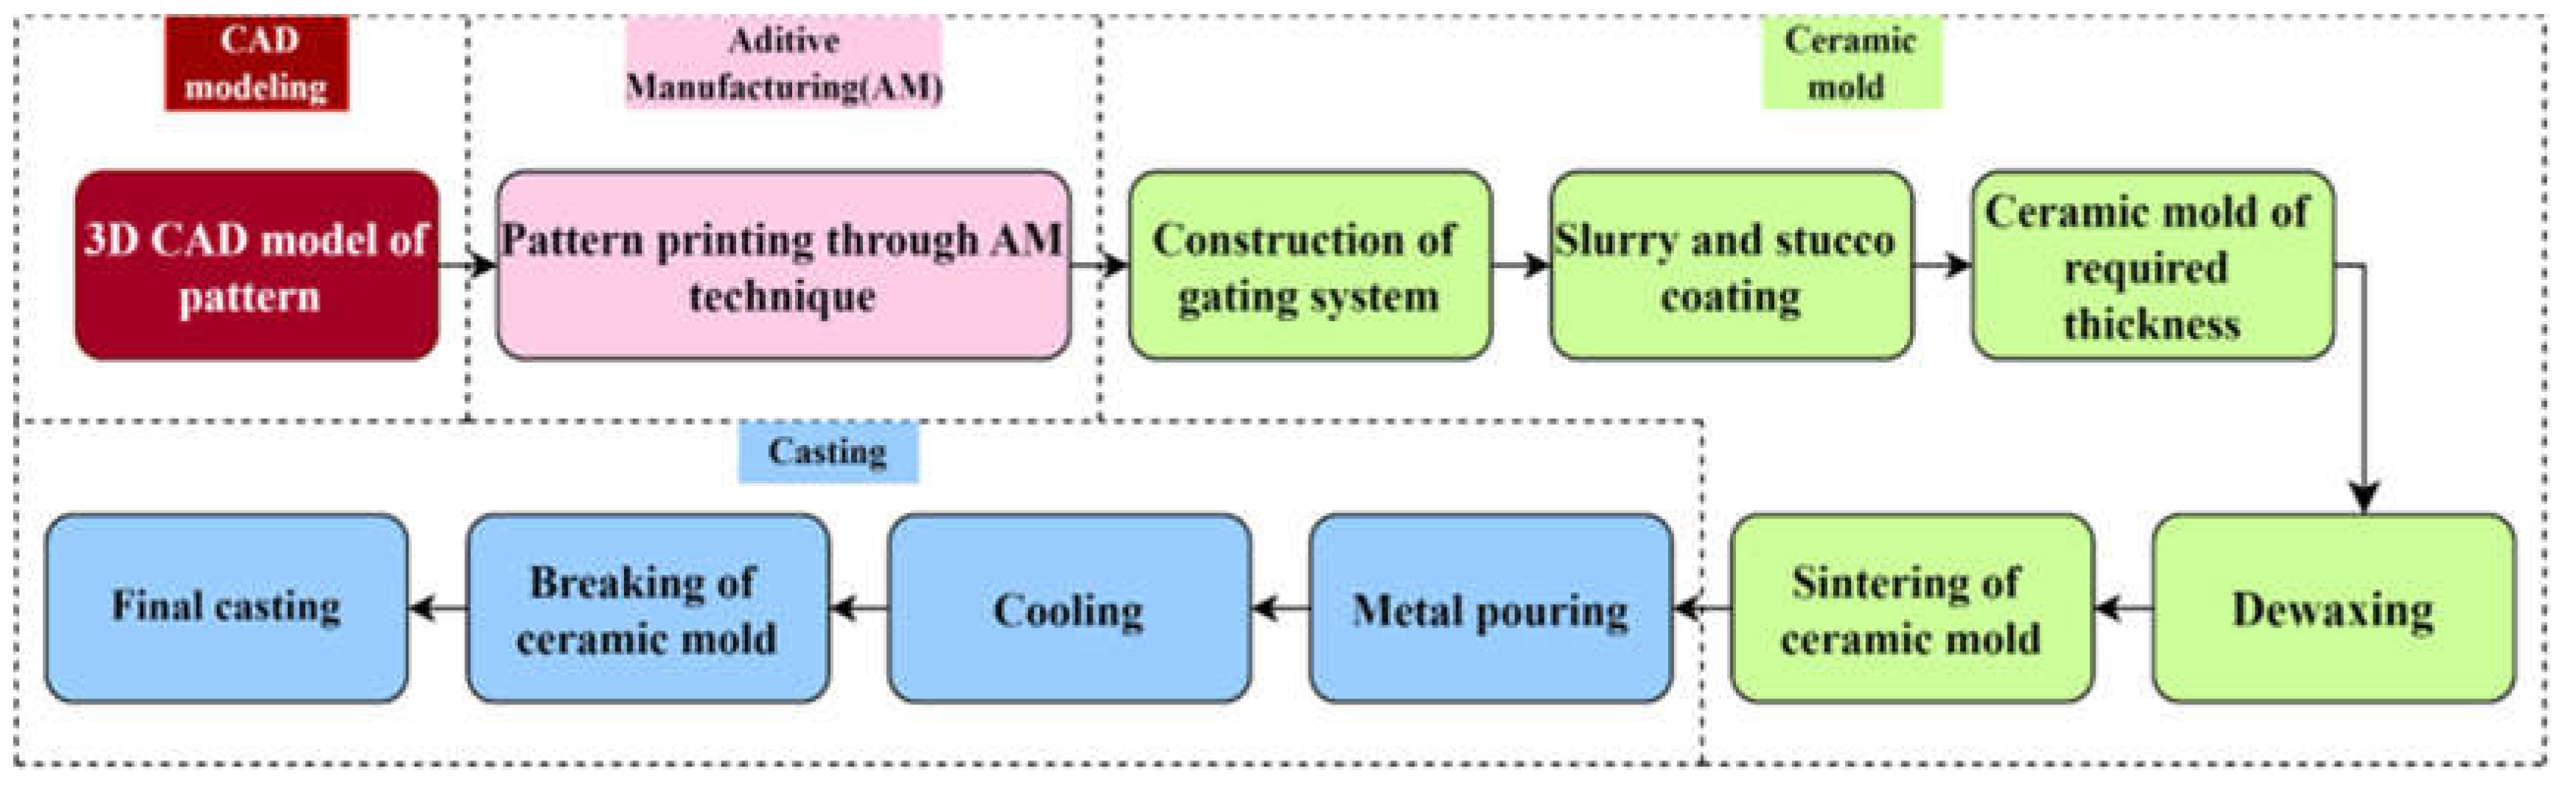
Figure 2.
Step-by-step procedure of rapid investment casting process-Direct tooling method.
This process has some snags, which include a long product development cycle time, higher specific energy depletion, continual human capital requirements, environmental effects, etc. A major cause for these is the tooling required for patterns. It includes manufacturing aluminum die through a series of conventional and non-conventional machining processes based on the complexity level. This results in high lead time and cost [5]. So, conventional investment casting is the most cost-effective option for mass production but is not apt for customized or batch production.
Lead time reduction is possible through a rapid investment casting (RIC) process. This process allows us to eliminate long and expensive tooling processes. Research shows that 60 to 80 percent lead time reduction can be achieved through Additive Manufacturing (AM) assisted RIC. In this process, the conventional wax pattern is replaced by a 3D printed pattern called the direct tooling method, or the aluminum die is replaced by a 3D printed mold called the indirect tooling method. Figure 2 shows a step-by-step procedure for the direct tooling RIC method [5,6,7]. Conventional wax pattern development has some issues like high cost of tooling, shrinkage at wide sections, trouble in injection molding of complex shapes, warping, and poor dimensional accuracy at slim features. The use of the 3D printed pattern by AM technique provides better flexibility, strength, and dimensional accuracy compared to this conventional wax pattern [8]. The most popular AM technique is the Fused Deposition Modeling (FDM) method due to its economical and simple operation, flexibility, fast printing, and low tooling cost [9]. This method is suited to 3D printing of material having low melting point temperature, which matches the material properties requirements for sacrificial patterns used in investment casting.
Acrylonitrile butadiene styrene (ABS) plastic proves its suitability for FDM printed patterns used as sacrificial patterns in investment casting. Research shows that FDM-printed ABS patterns give good dimensional stability and clean burnout [10]. The dimensional accuracy of the FDM printed ABS part was studied by several researchers for the shapes like holes, slots having different sections, solid and hollow cylinders, spheres, inclined faces, various prisms, cuboids, thin features, etc. It is observed that small features show more dimensional variations and warping compared to larger ones [11]. Another research shows that FDM-printed square parts with flat surfaces have better dimensional accuracy compared to cylindrical and elliptical-shaped parts. Also, as the wall thickness of a part increases, its dimensional accuracy will decrease due to the shrinkage of print material, and wall thickness accuracy will increase. It shows that parts with curved and thin features need more focus while printing to achieve better dimensional accuracy [12]. It is preferable to set the nominal value of the curved feature in the 3D CAD model higher than its actual value to balance the negative dimensional deviation that occurred in the final part print. The compensation applied on nominal dimensions depends on the size and shape of the individual feature [13]. Table 2 shows various FDM-printed ABS parts used as sacrificial patterns in investment casting. Casting and FDM printing parameters are studied to understand their effect on the quality of FDM printed patterns and final casting. From the literature survey, we can conclude that many experiments have been done to find optimum process parameter values to achieve better quality of FDM printed pattern and final cast through the RIC process [14]-[20].
Experimental results of literature show that the surface roughness of FDM printed ABS parts is influenced by controllable printing parameters, i.e., layer thickness [21,22,25], orientation [21], number of shells [21], infill percentage [21,22], print speed [22,25], nozzle temperature [22,24,25], nozzle cross-section [23].

Table 1.
FDM printed ABS parts as a sacrificial pattern for investment casting.
| FDM Printed Pattern Geometry |
Work Done | Parameter Studied |
Suggested/ Optimum Parameter Value |
Key Findings | Ref. |
|---|---|---|---|---|---|
| H-shape | Hollow and solid patterns were analyzed for dimensional accuracy, surface roughness, cleanliness of mold, pattern collapsibility, and shell cracking. | Infill density, burnout temperature | Minimum Dimensional Deviation: hollow pattern Shell Cracking: hollow pattern, Burnout temperature 550°C-700 °C Minimum Distortion: Solid pattern |
A hollow pattern shows better performance compared to a solid pattern. No significant change was observed in surface roughness. | [14] |
| Hip joint | Wax, ABS, and Wax coated ABS patterns were analyzed for the microhardness of cast components. | Number of slurry layers, pattern material | Maximize Micro hardness: wax pattern, eight number of slurry layers | Process capability: Cp and Cpk are greater than 1 for all three pattern materials. | [15] |
| Hip prostheses | Pattern density increased after the VS process, which increased heat input and complexity in ash removal during the burnout stage of investment casting. Pattern analyzed for change in density after post-processing by vapour smoothing (VS) method. |
FDM parameter: Orientation, density post-processing parameters: Pre- and post-cooling time, smoothing time, number of cycles. |
Minimize Pattern density: orientation angle (90°), Density(high), precooling time(15min), smoothing time(10s), post-cooling time(20min), number of cycle (1) | Initial density, orientation, and precooling time have negligible influences on the increase in density after the VS process. | [16] |
| Dental crown for strategic dog teeth | Part density, post-treatment temperature, and orientation are used for DoE. Multifactor Optimization has been performed. Optimum parameter settings are found to get optimum dimensional deviation and hardness. | Pattern density, orientation angle, and post-treatment temperature | Multifactor optimization gives 70% and 30% weightage to dimensional deviation and surface hardness, respectively. Optimum values: Pattern density: low, Orientation: 180 ° post-treatment temperature: 80 °C |
Only part density affects the dimensional deviation and hardness of the part. Other parameters are found ineffective. | [17] |
| A sample having faces at different angles between 0° to 128.4° in the step of 12.86°. | Dimensional accuracy and surface roughness of 3D printed patterns and corresponding investment castings are compared for three different materials. ABS, PLA and PVB for different burnout temperatures ie. 700°C ,900°C and 1100°C. | Pattern material, burnout temperature, surface angle | Minimize surface roughness: Pattern material: ABS, Surface angle 90 ° Minimize dimensional deviation: ABS |
More dimensional deviation is observed in the case of PVB than in ABS and PLA. On the other hand, shell cracking, shell erosion, and residual ash are observed only in the ABS and PLA cases. | [18] |
Also, experimental studies proved that nozzle size [26], layer height [26,27], build orientation [27], infill density [27,29], raster angle [28], print material [28], infill pattern [29], wall thickness [29], number of shells [29] are influencing the dimensional accuracy of FDM printed ABS parts.
From the previous research work, it can be concluded that influencing printing parameters and their optimum values depend on part geometry, shapes, and complexity [26,27,29]. No generalized optimum parameter value was found applicable to all geometrical shapes and features, so experimentation for required parts is necessary to obtain accurate results.
The basic steps involved in experimental design are understanding the behavior of the process, selecting controllable and uncontrollable factors, and selecting the number of levels and level values. The traditional way of experimenting is the one factor at a time (OFAT) method, which allows us to change only one factor, keeping other factors constant in a single experimental run. This method helps in screening the critical factors amongst all other factors, but it requires many runs to find the optimum value of critical factors. This issue can be solved using the Design of Experiment (DoE) method. This method allows us to change multiple factors in a single experimental run, and with the help of a smaller number of experimental runs, optimum values of critical factors can be achieved [30]. Researchers compared the most popular DoE methods like Response Surface Methodology (RSM), Full Factorial Design, Screening Design, and Taguchi Design, which concluded that Taguchi Design is the most efficient and adaptable DoE method for researchers and scientists. This method works on an orthogonal array design, which distributes all factor levels in a balanced way over the number of experimental runs. This feature reduces the number of experimental runs required in DoE without compromising the accuracy of the results [31].
- Several experimental investigations have been done by researchers to understand the impact of FDM printing parameters on dimensional accuracy and surface roughness of ABS parts and to find optimum parameter values for optimal quality.
- Optimum parameter values are different for different materials, shapes, sizes, and geometry. There is no generalized set of optimum parameter values which apply to a wide range of applications.
- Researchers must perform their experimental study to find optimal print parameter values for FDM printed parts having medium to high complexity level geometry.
- Very little research has been done for FDM printing of sacrificial patterns of an impeller used in RIC.
- Taguchi Design is the most efficient method for screening the factors with fewer experimental runs.
A single shrouded, semi-open type impeller of a centrifugal pump has been selected for this experimental study. The impeller geometry includes several critical geometrical features, such as thin walls (blade thickness), curved surfaces (blades), and varying dimensions (inner and outer diameters). ABS was selected as the printing material, and impeller patterns were printed on the FDM machine according to the Taguchi Design of Experiment (DoE) method. Dimensional deviation and surface roughness measurements were performed, and a detailed analysis of the results was conducted to understand the influence of printing parameters on part quality at various geometrical features of the impeller.
2. Materials and Methods
2.1. 3D CAD Modeling of an Impeller
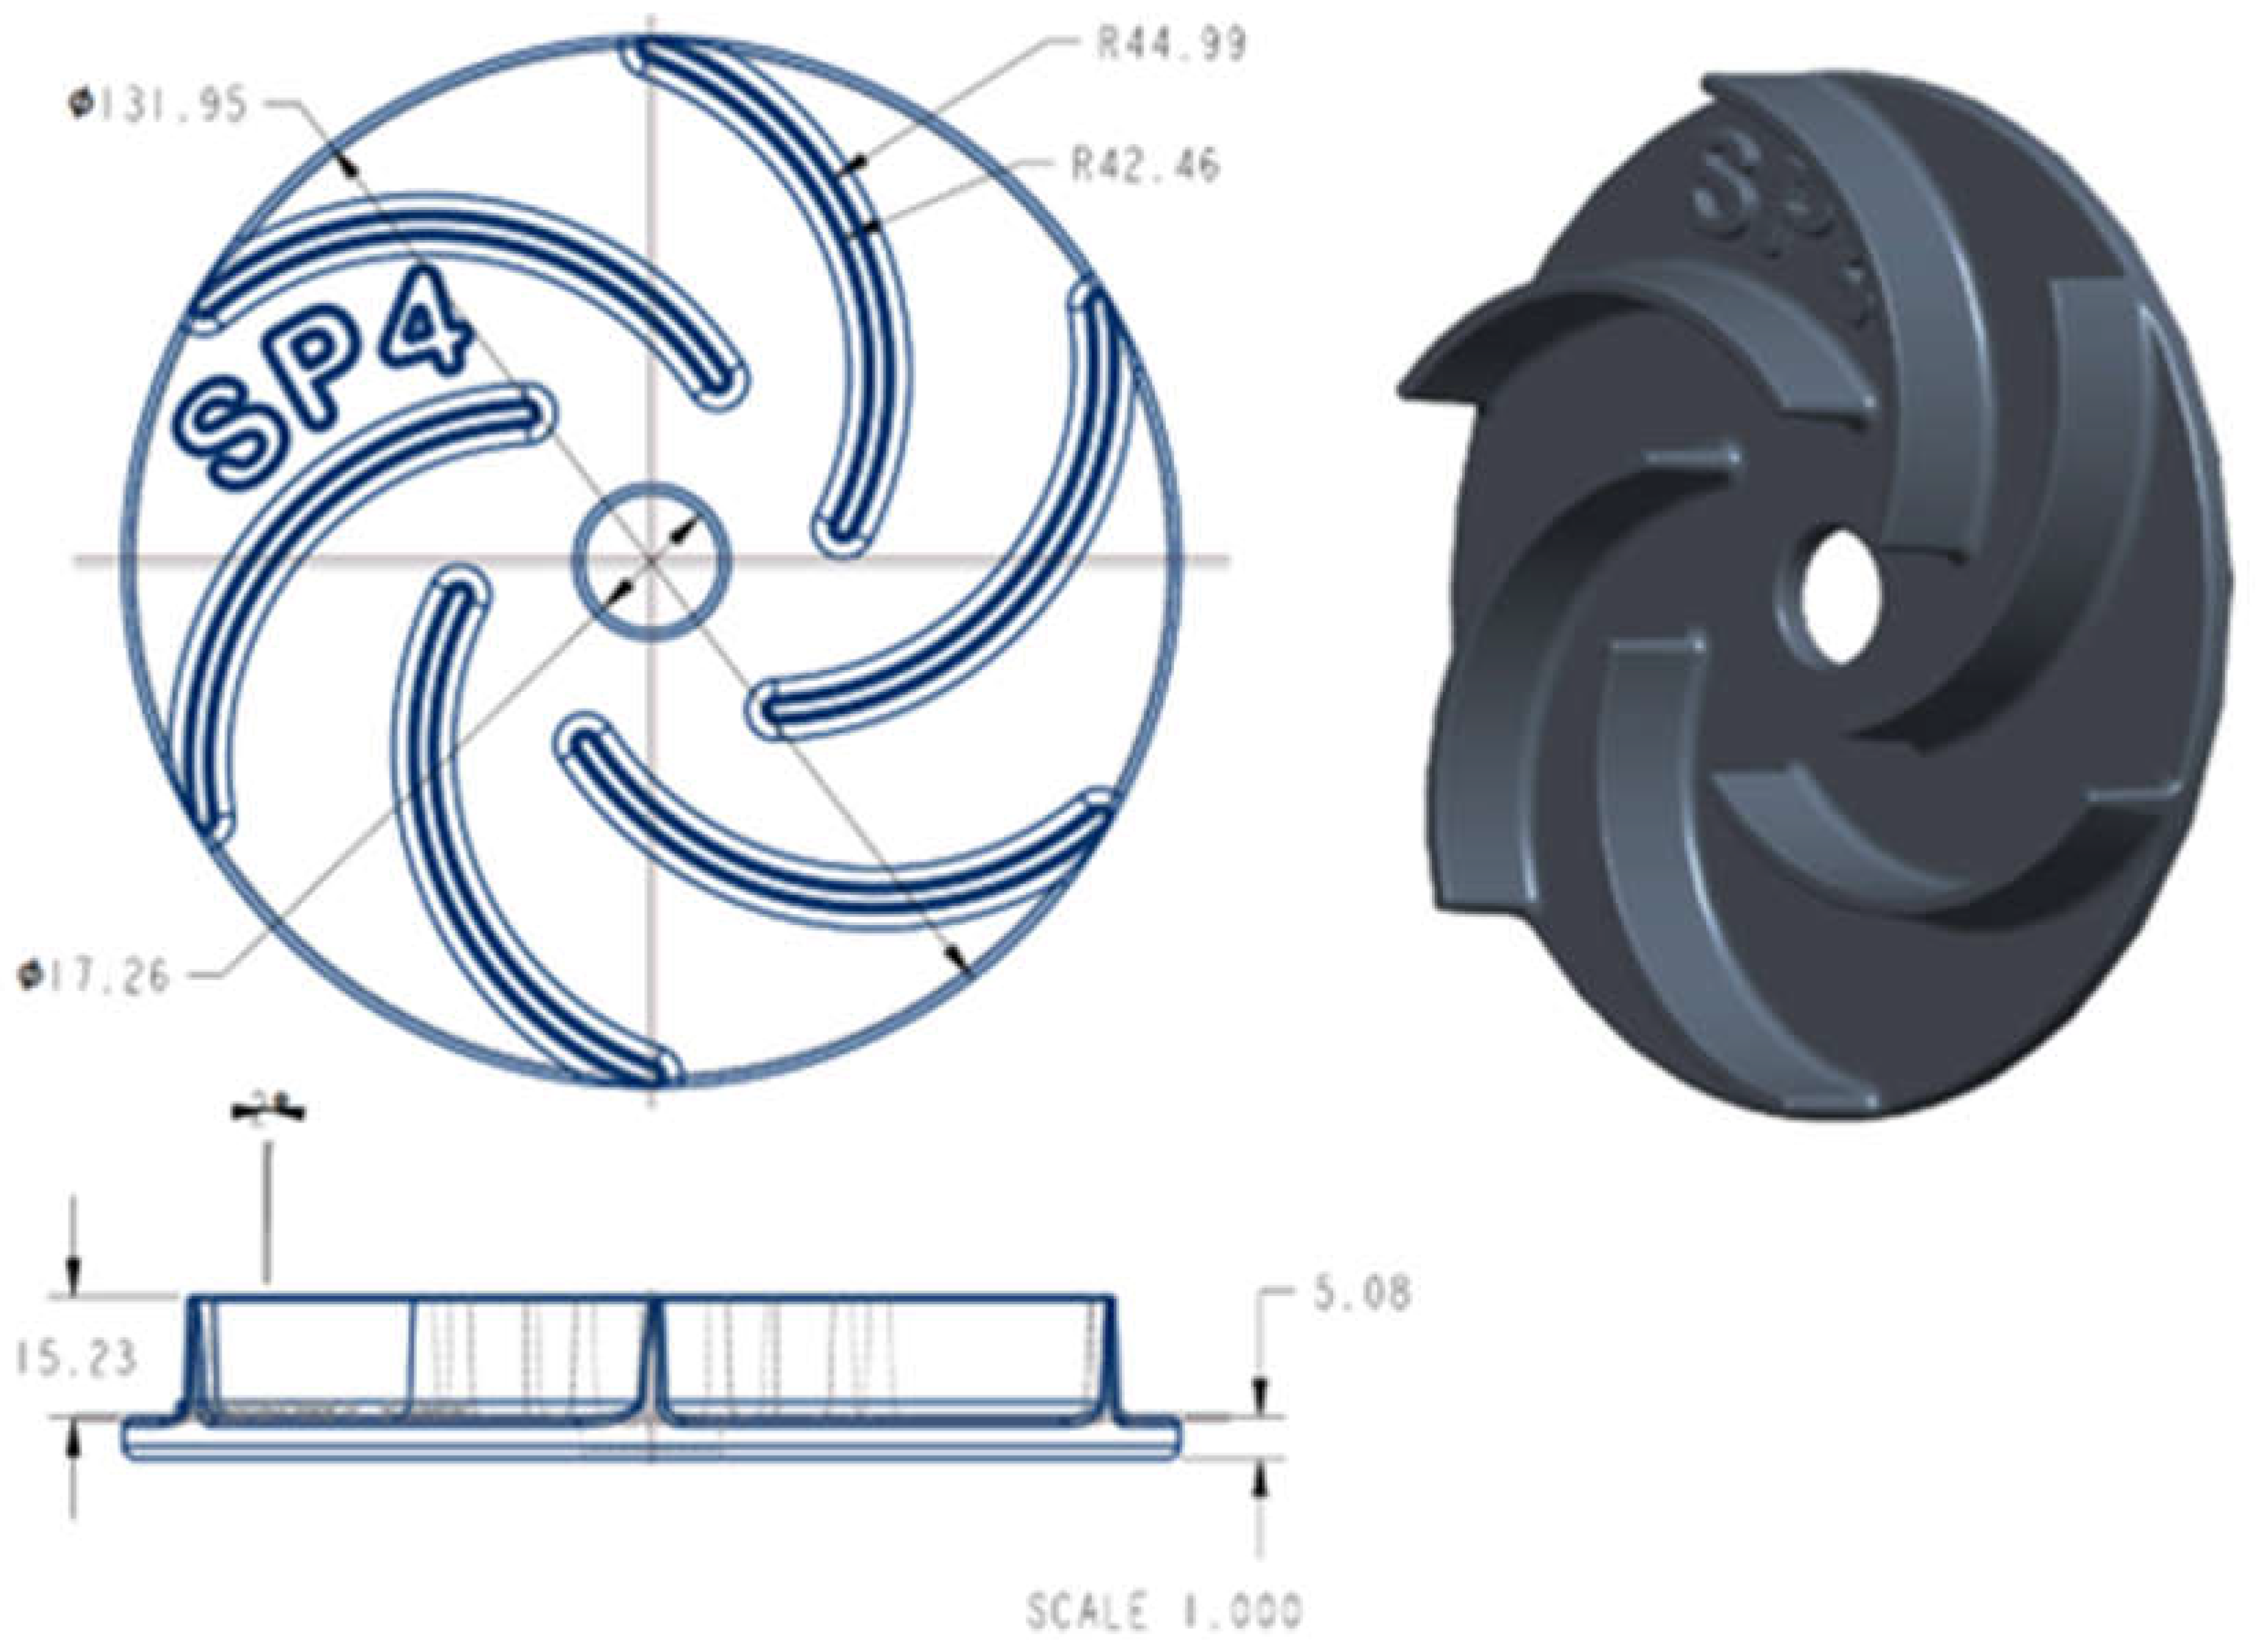
A single-shrouded, semi-open type impeller of the centrifugal pump was selected for this experiment. The design specifications were as follows: 6 blades, a 50 mm inlet diameter, a 130 mm outlet diameter, a 20° blade discharge angle, a 35° blade inlet angle, a 15 mm blade height, and a 2.5 mm blade thickness [32]. Since investment casting undergoes shrinkage during the solidification of molten metal, it is necessary to prepare sacrificial patterns oversized by applying a shrinkage allowance [33]. After consulting with industry experts, the shrinkage allowance was applied to the impeller pattern. A three-dimensional model of the impeller was created using CREO Parametric, a 3D modeling software. The 2D and 3D drawings of the impeller, with final dimensions after applying the shrinkage allowances, are provided in Figure 3. Paper size: US Letter (8.5″ × 11″ or 21.59 cm × 27.94 cm).
Figure 3.
2D and 3D drawing of an impeller using CREO parametric.
2.2. Material and Equipment
The 3D CAD file was saved in STL file format and sliced using Ultimaker Cura, an open-source slicing software with appropriate parameters. The FDM technique of additive manufacturing was used to produce the impeller pattern. The pattern was 3D printed with Acrylonitrile Butadiene Styrene (ABS) at Tri-Aayam Engineering Solutions Pvt. Ltd., 3D Printing, Ahmedabad. The important properties of ABS are listed in Table 2, and the specifications of the FDM machine are provided in Table 3.
Table 2.
Properties of ABS.
| Property | Print Temperature |
Print Bed Temperature |
Bed Preparation | Density | Ultimate Tensile Strength (UTS) |
|---|---|---|---|---|---|
| Value | 210°C – 250°C | 80°C – 110°C | Apply glue stick | 1.0 to 1.4 g /cm³ | 37 to 110 MPa |
Table 3.
Specifications of FDM.
| Particular | Detail |
| Maximum Nozzle temperature | 340 °C |
| Maximum Bed temperature | 140°C |
| Nozzle size | 0.4 mm |
| Build Volume | 300mm x 300mm x 300mm |
| Maximum Printing speed | 600mm/sec |
2.3. Experimental Design
This experimental investigation was conducted to understand the influence of FDM printing parameters on the dimensional accuracy and surface quality of various geometric features of an impeller. Taguchi's Design of Experiment (DoE) method was used for the experimental design in this research. This method is a robust design that identifies the most influential parameters and their interaction effects with a minimum number of experimental runs. It is particularly suitable when there are a few parameters and interactions involved in the process [31]. The present study aimed to investigate the impact of three printing parameters: layer thickness, extrusion temperature, and infill percentage. The experimental investigation was conducted using the Taguchi orthogonal array L9(3^3) DoE method, which involves three factors and three levels for each factor. Specifically, 3^3 was selected for nine runs. The systematic approach helped identify the criticality of the parameters and determine their impact on printing quality. By analyzing the results of the samples, the study findings can help improve the quality of the printing process and make it more efficient. Minitab 20.0 was used to generate the experimental design matrix.
Three FDM printing parameters, i.e., layer thickness, extrusion temperature, and infill percentage, were used for this experiment. Factors and their corresponding level values are shown in Table 4.
2.4. Dimension and Surface Roughness Measurement
Mitutoyo vernier calipers and a micrometer screw gauge were used to measure the dimensions of the 3D-printed impellers. We measured the dimensions at five different locations on the impeller: 1) Outer Diameter, 2) Inner Diameter, 3) Blade Thickness, 4) Shroud Thickness, and 5) Overall Height. For each location, five readings were taken, and the average value was recorded for further analysis.
Figure 4.
(a)Vernier caliper and (b)Micrometer screw gauge.
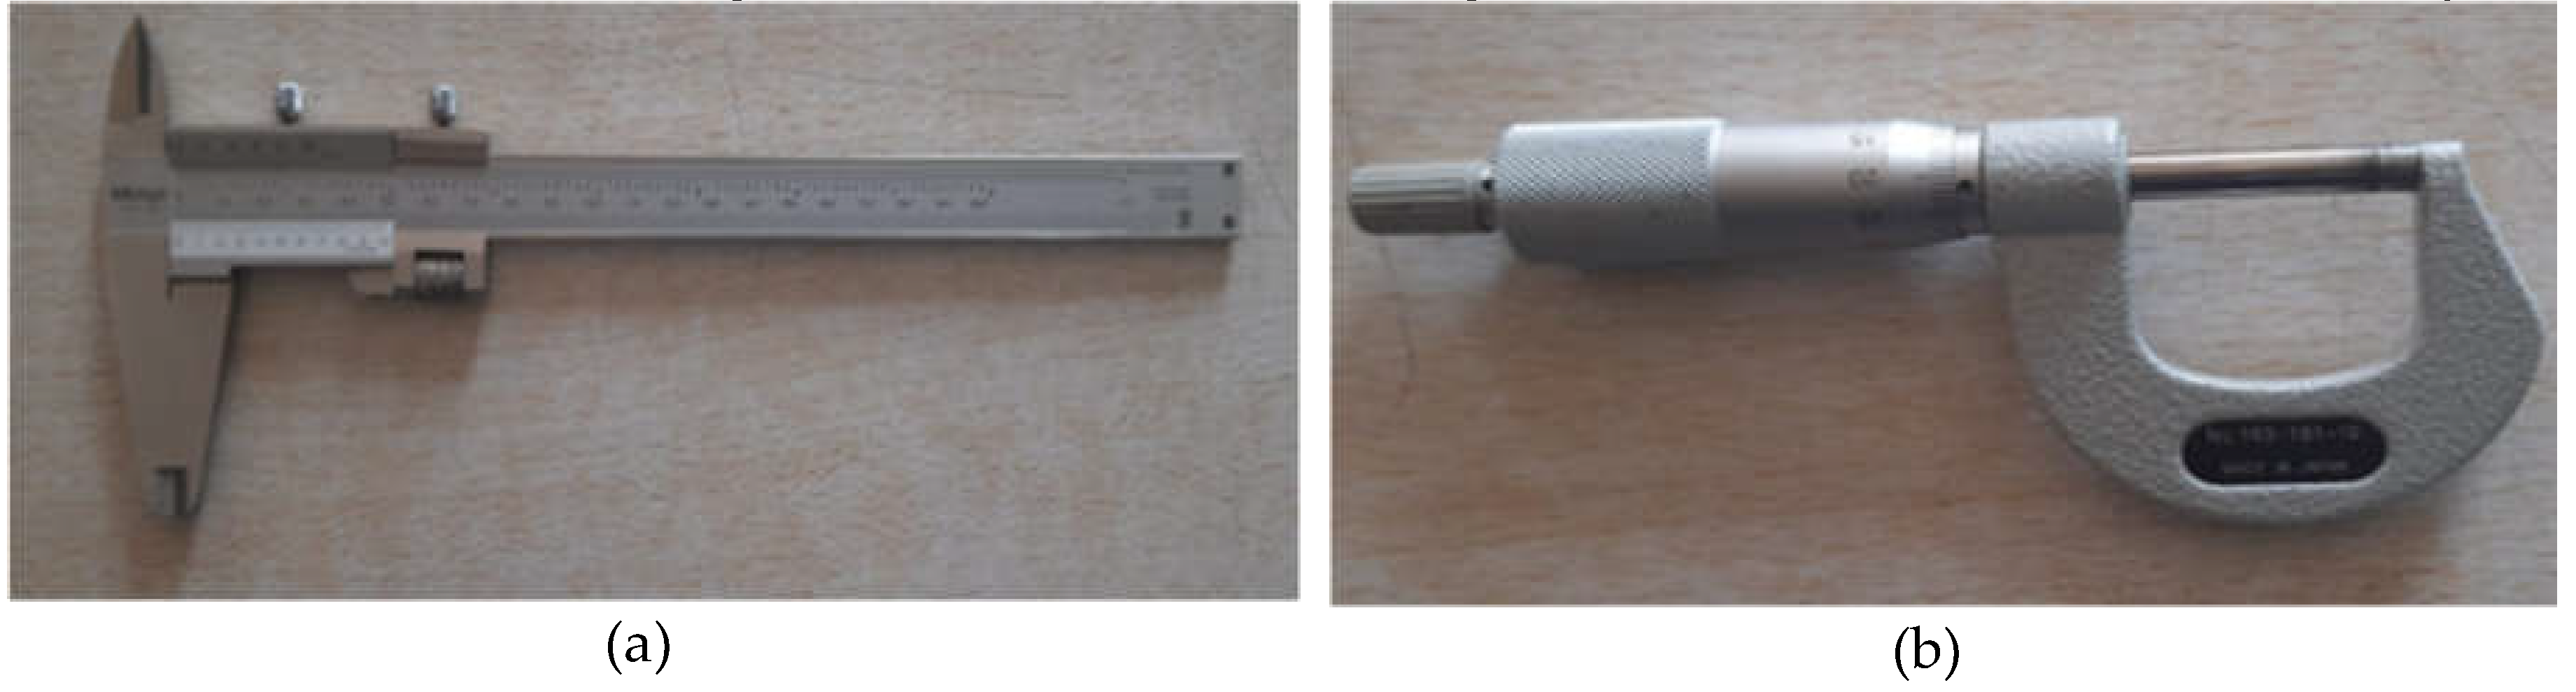
Figure 5.
Mitutoyo SJ 410 surface roughness tester.
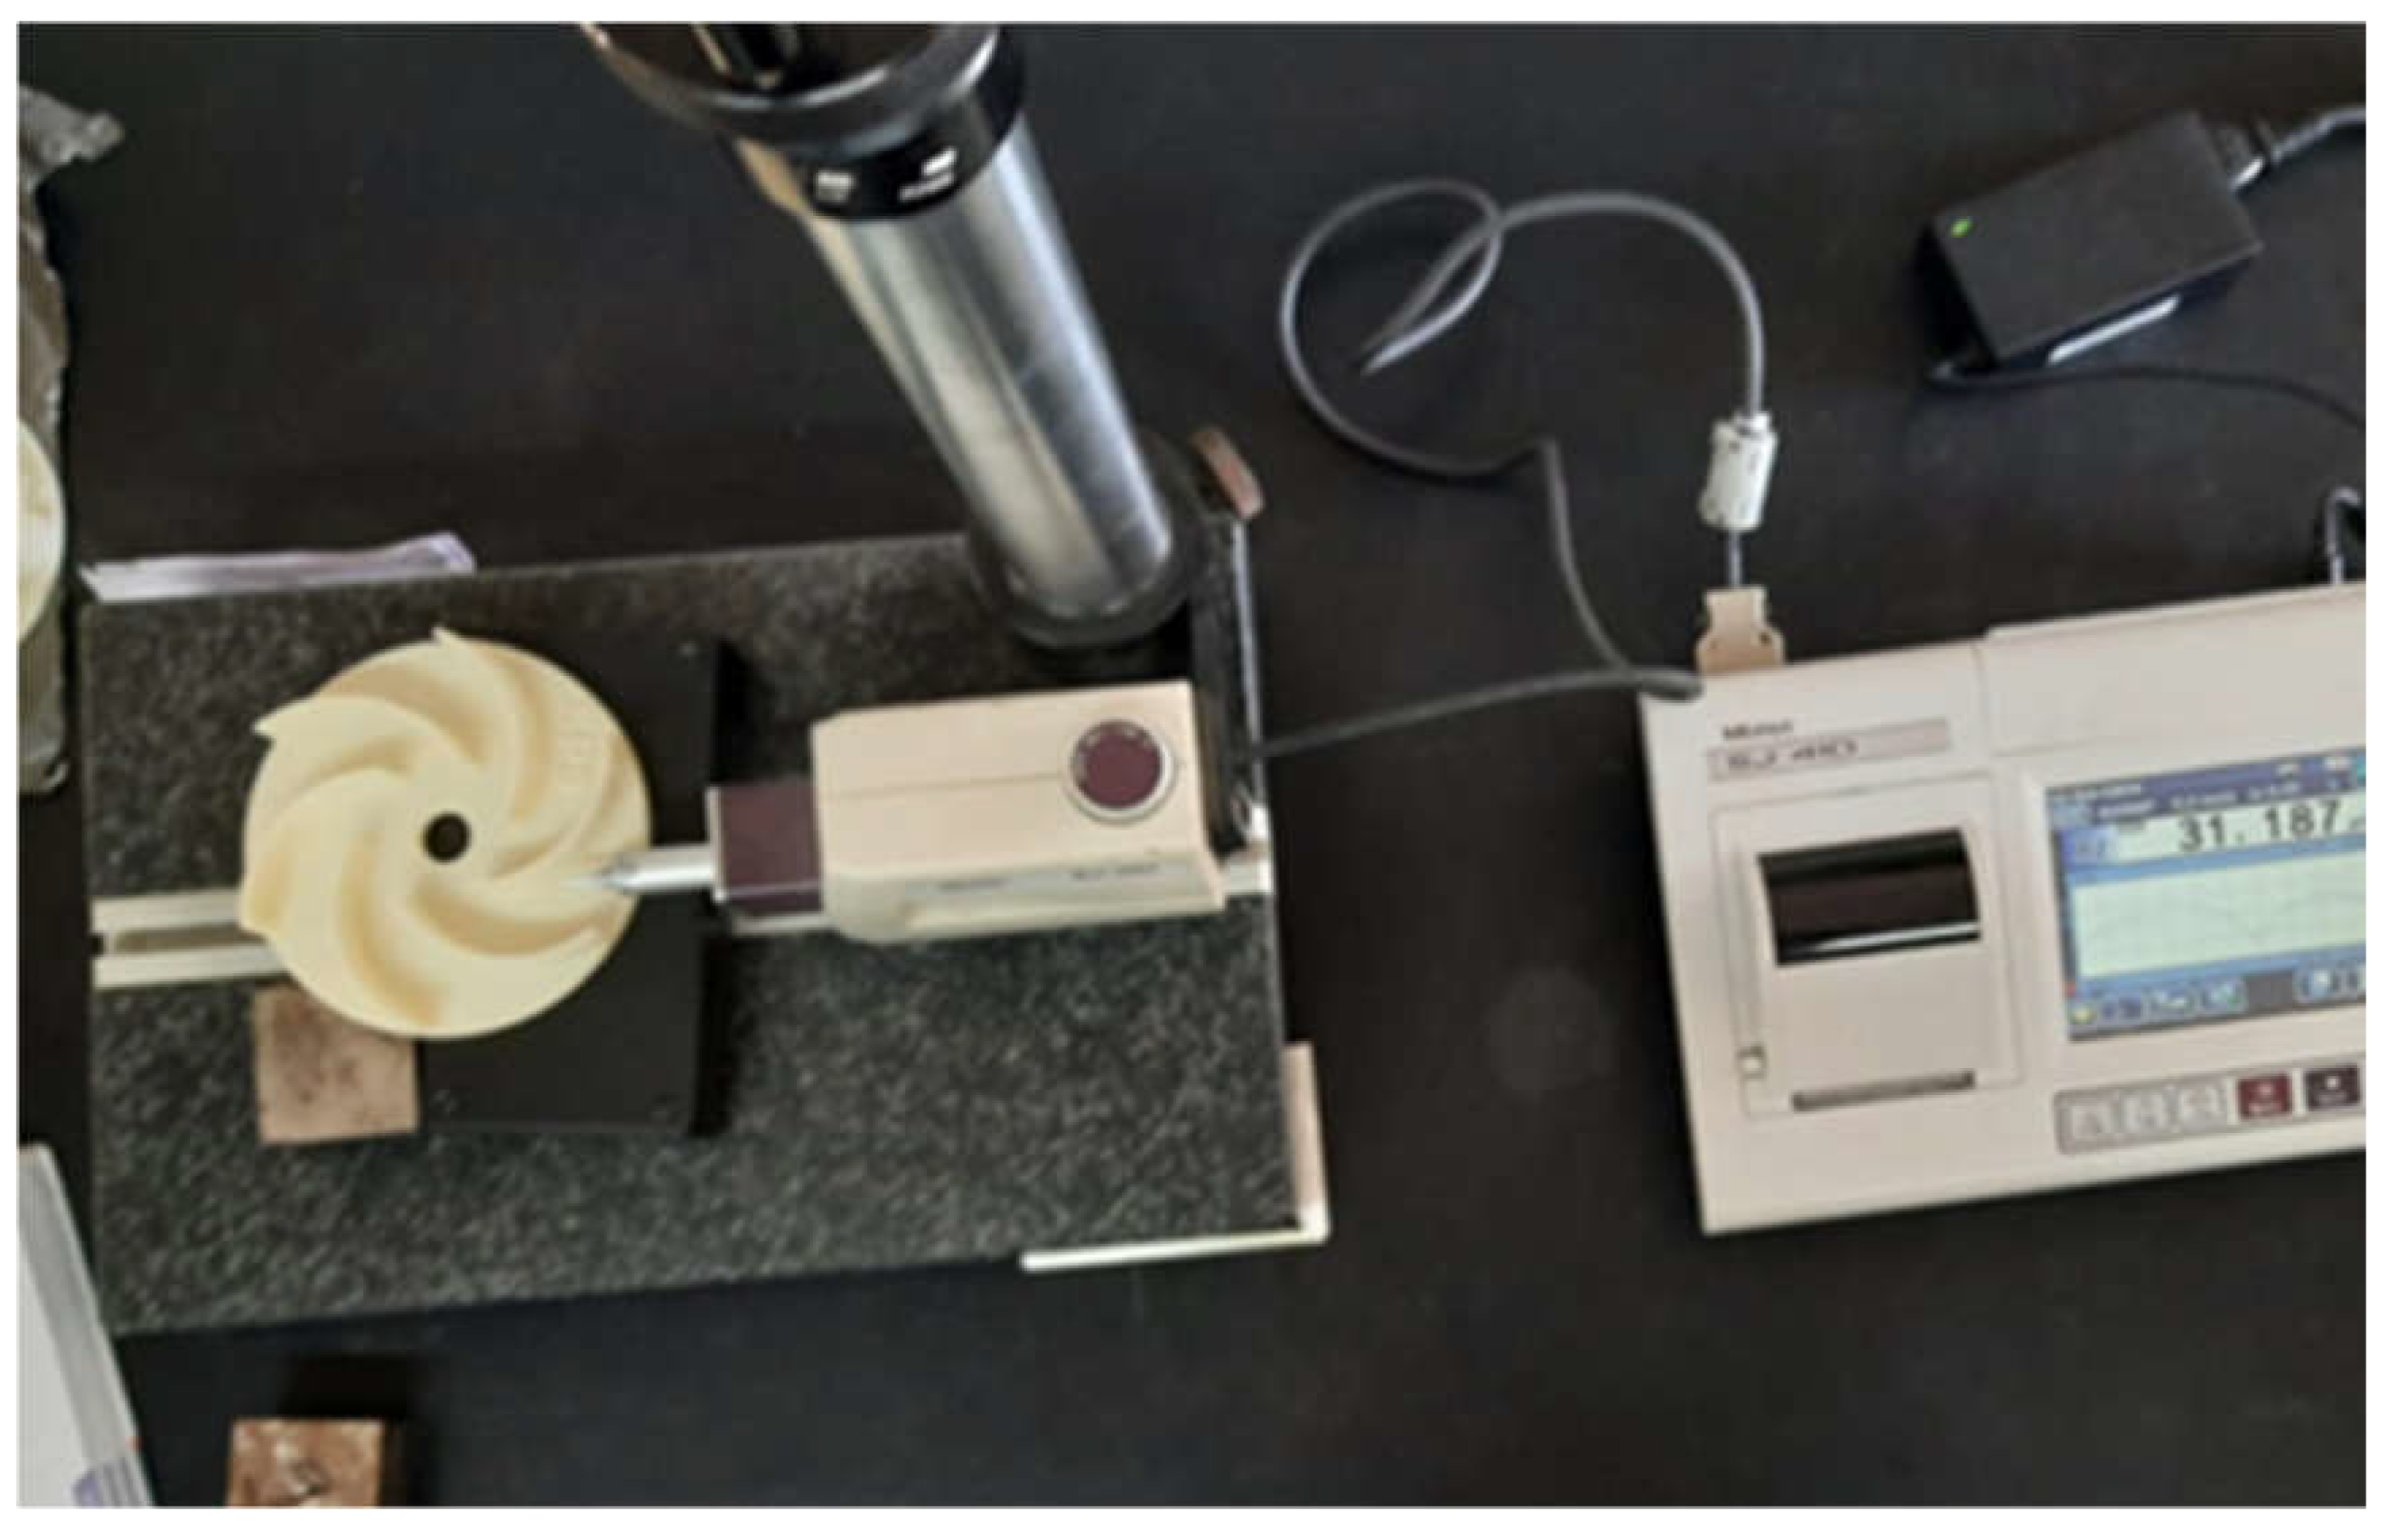
Shroud and blade surface roughness values of an impeller influence the efficiency of the centrifugal pump [34]-[36]. A Mitutoyo SJ 410 surface roughness tester was used to measure various surface quality indicators, including Ra (the absolute average of the surface profile), Rq (the root mean square of the surface profile), and Rz (the average peak-to-valley roughness). For more details on roughness parameters, readers can refer to [37]. Three measurements were taken at both the shroud and blade, and the average values were recorded for further analysis.
3. Experimental Results and Discussion
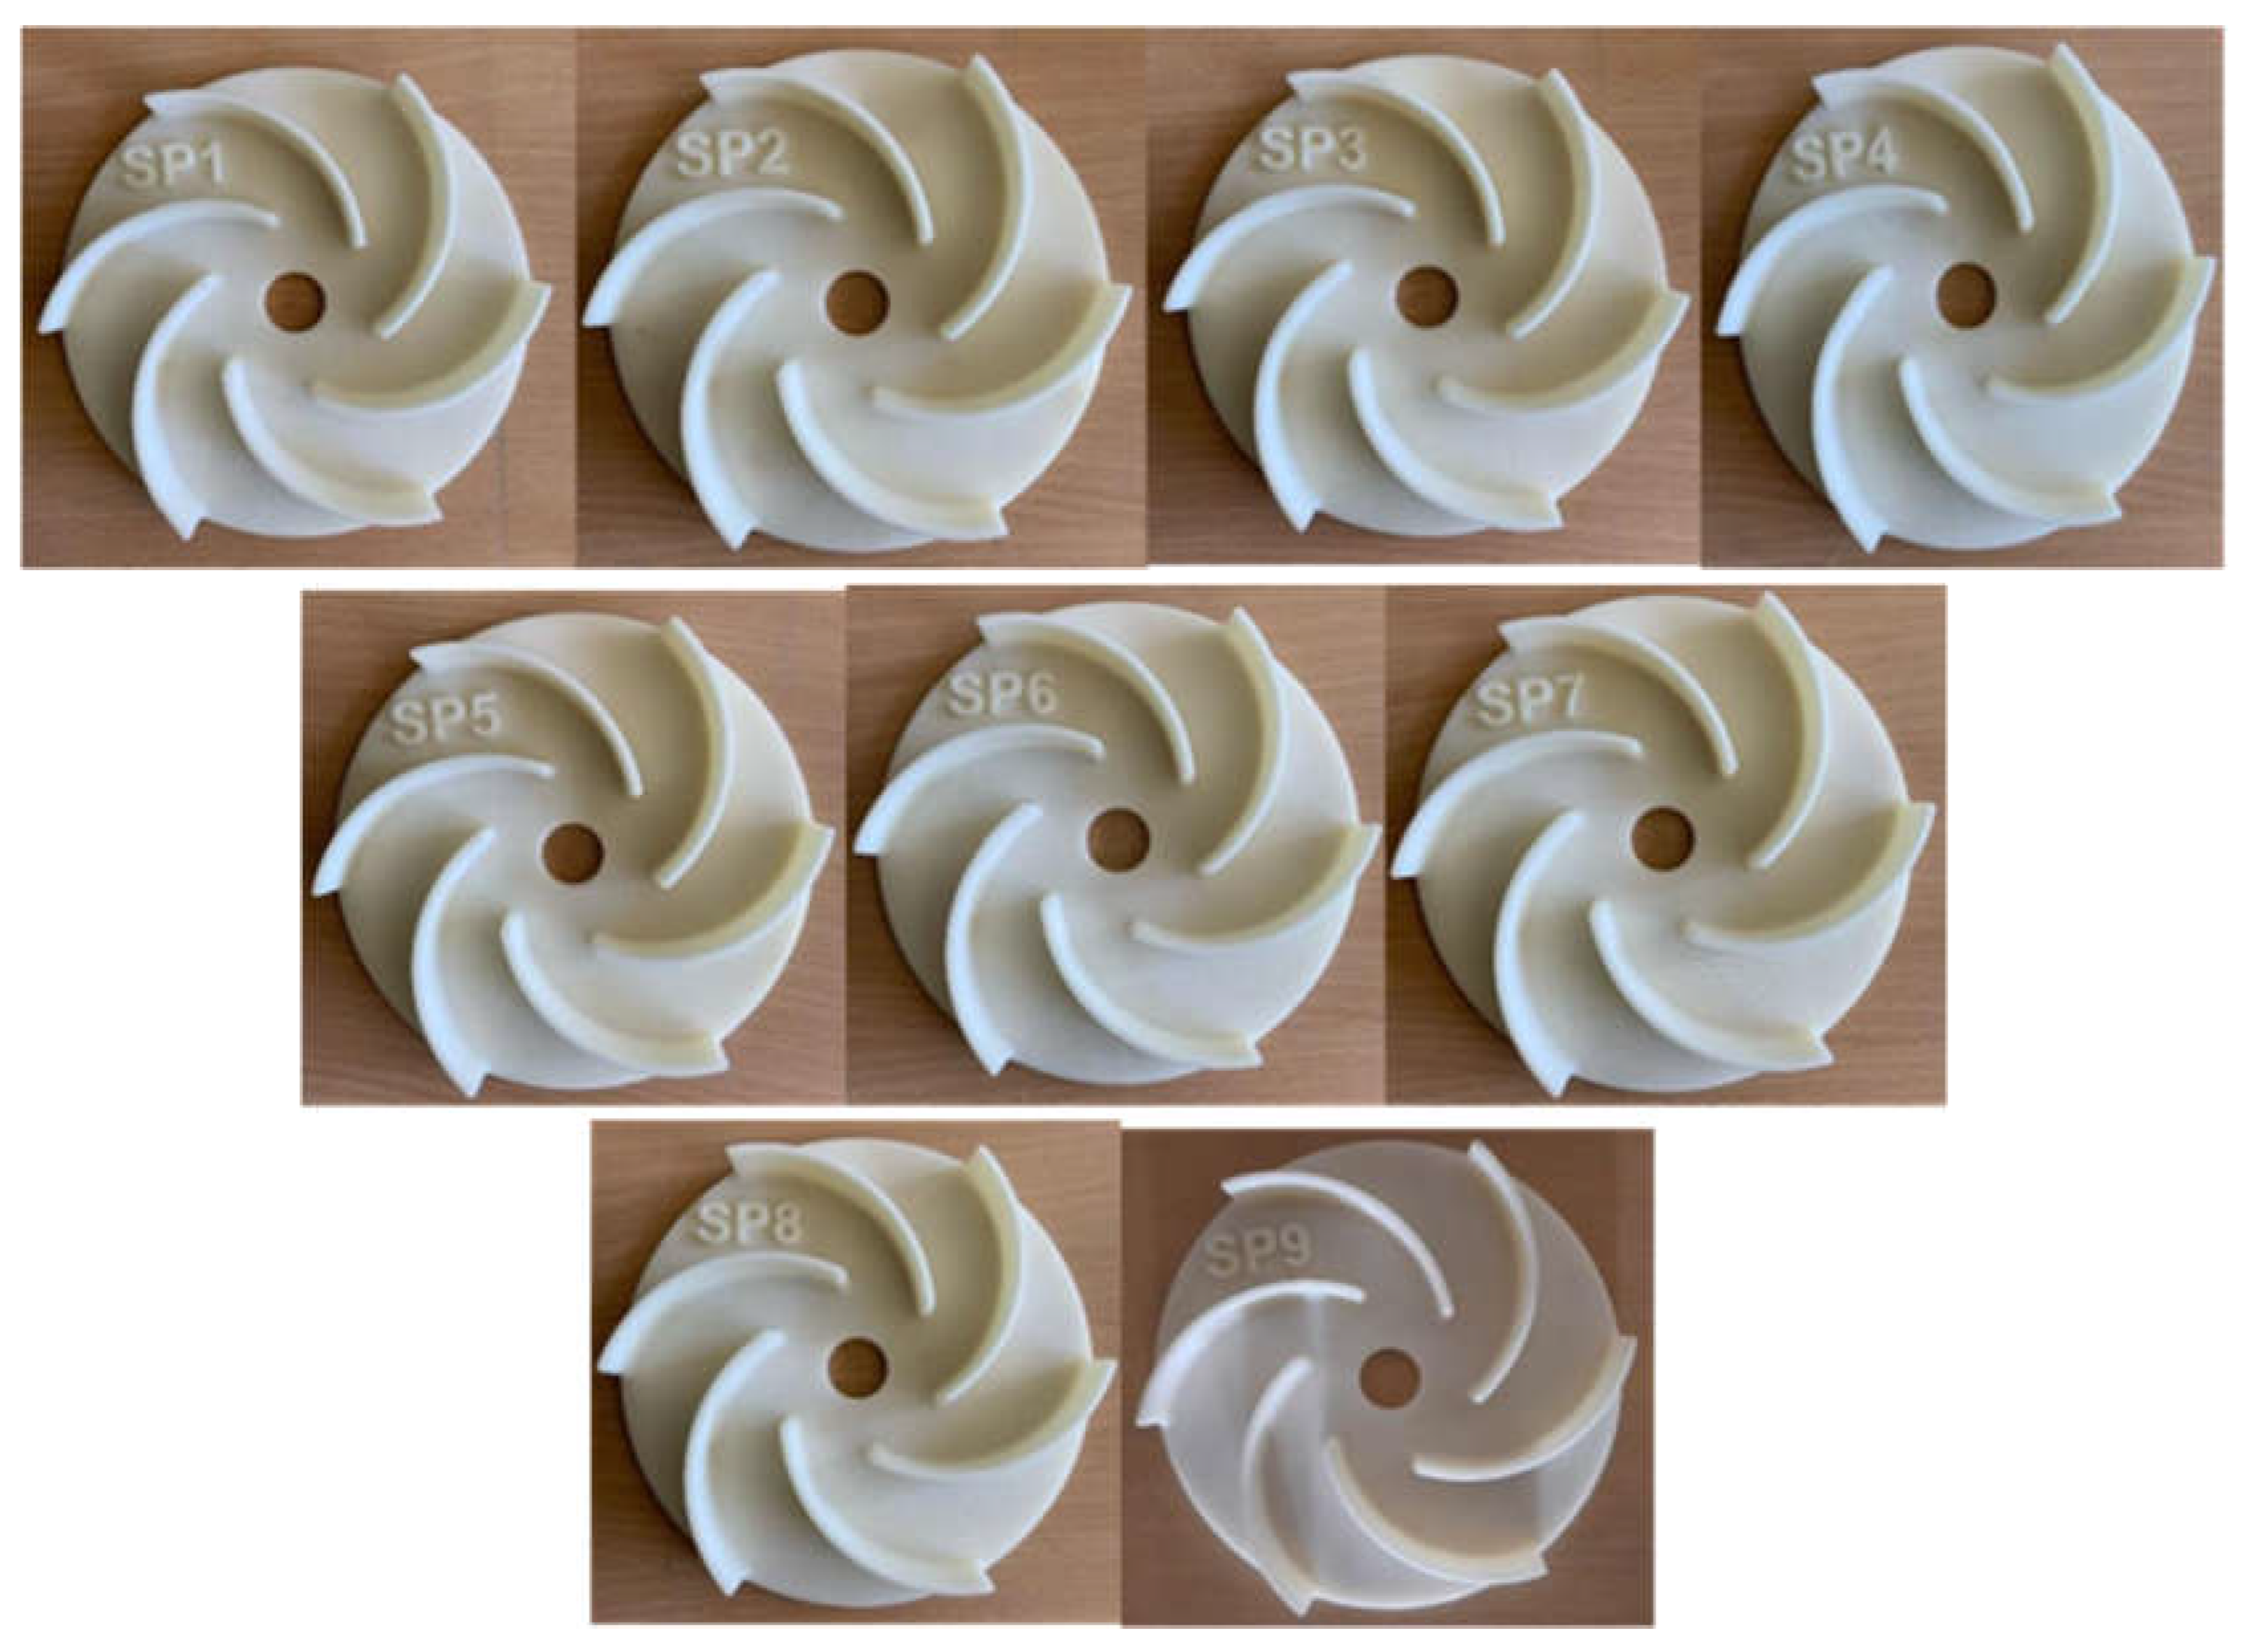
As per the Taguchi L9 experimental design, a total of nine impellers were printed on the FDM machine using ABS material. Each sample was printed with corresponding parameter settings as per table 6. All 3D printed impeller patterns with sample ID (SP1, SP2, SP3, SP4, SP5, SP6, SP7, SP8, and SP9) are shown in Figure 6.
Figure 6.
FDM printed ABS impeller patterns as per Taguchi L9 experimental design.
3.1. Analysis of Dimensional Accuracy
This investigation includes a detailed study of the results, which includes deviations between nominal value (designed value) and actual value (average measured value of 3D printed impeller). The designed dimensions of an impeller are represented in Figure 7 with their name and value. Five measurements of Outer Diameter (OD), Inner Diameter (ID), Blade Thickness (BT), Shroud Thickness (ST), and Blade Height (BH) of each sample were taken, and average values were calculated. Tables 7 to 15 show these details for each sample.
This investigation is divided into three parts: 1) The investigation of OD and ID helps to understand dimensional deviation in circular features, 2) The investigation of BT helps to understand dimensional deviation in thin, curved features, and 3) The investigation of ST and BH helps to understand dimensional deviation in the vertical Z-direction (print direction). This investigation examines the dimensional deviation between the nominal value and the actual value. Here, the nominal value refers to the designed value supplied to the 3D printer through the CAD model, while the actual value refers to the measured value obtained from the 3D-printed impeller. Refer to Tables 7 to 15 for actual values and Figure 7 for the nominal value.
Figure 7.
Impeller drawing with dimension name and designed values.
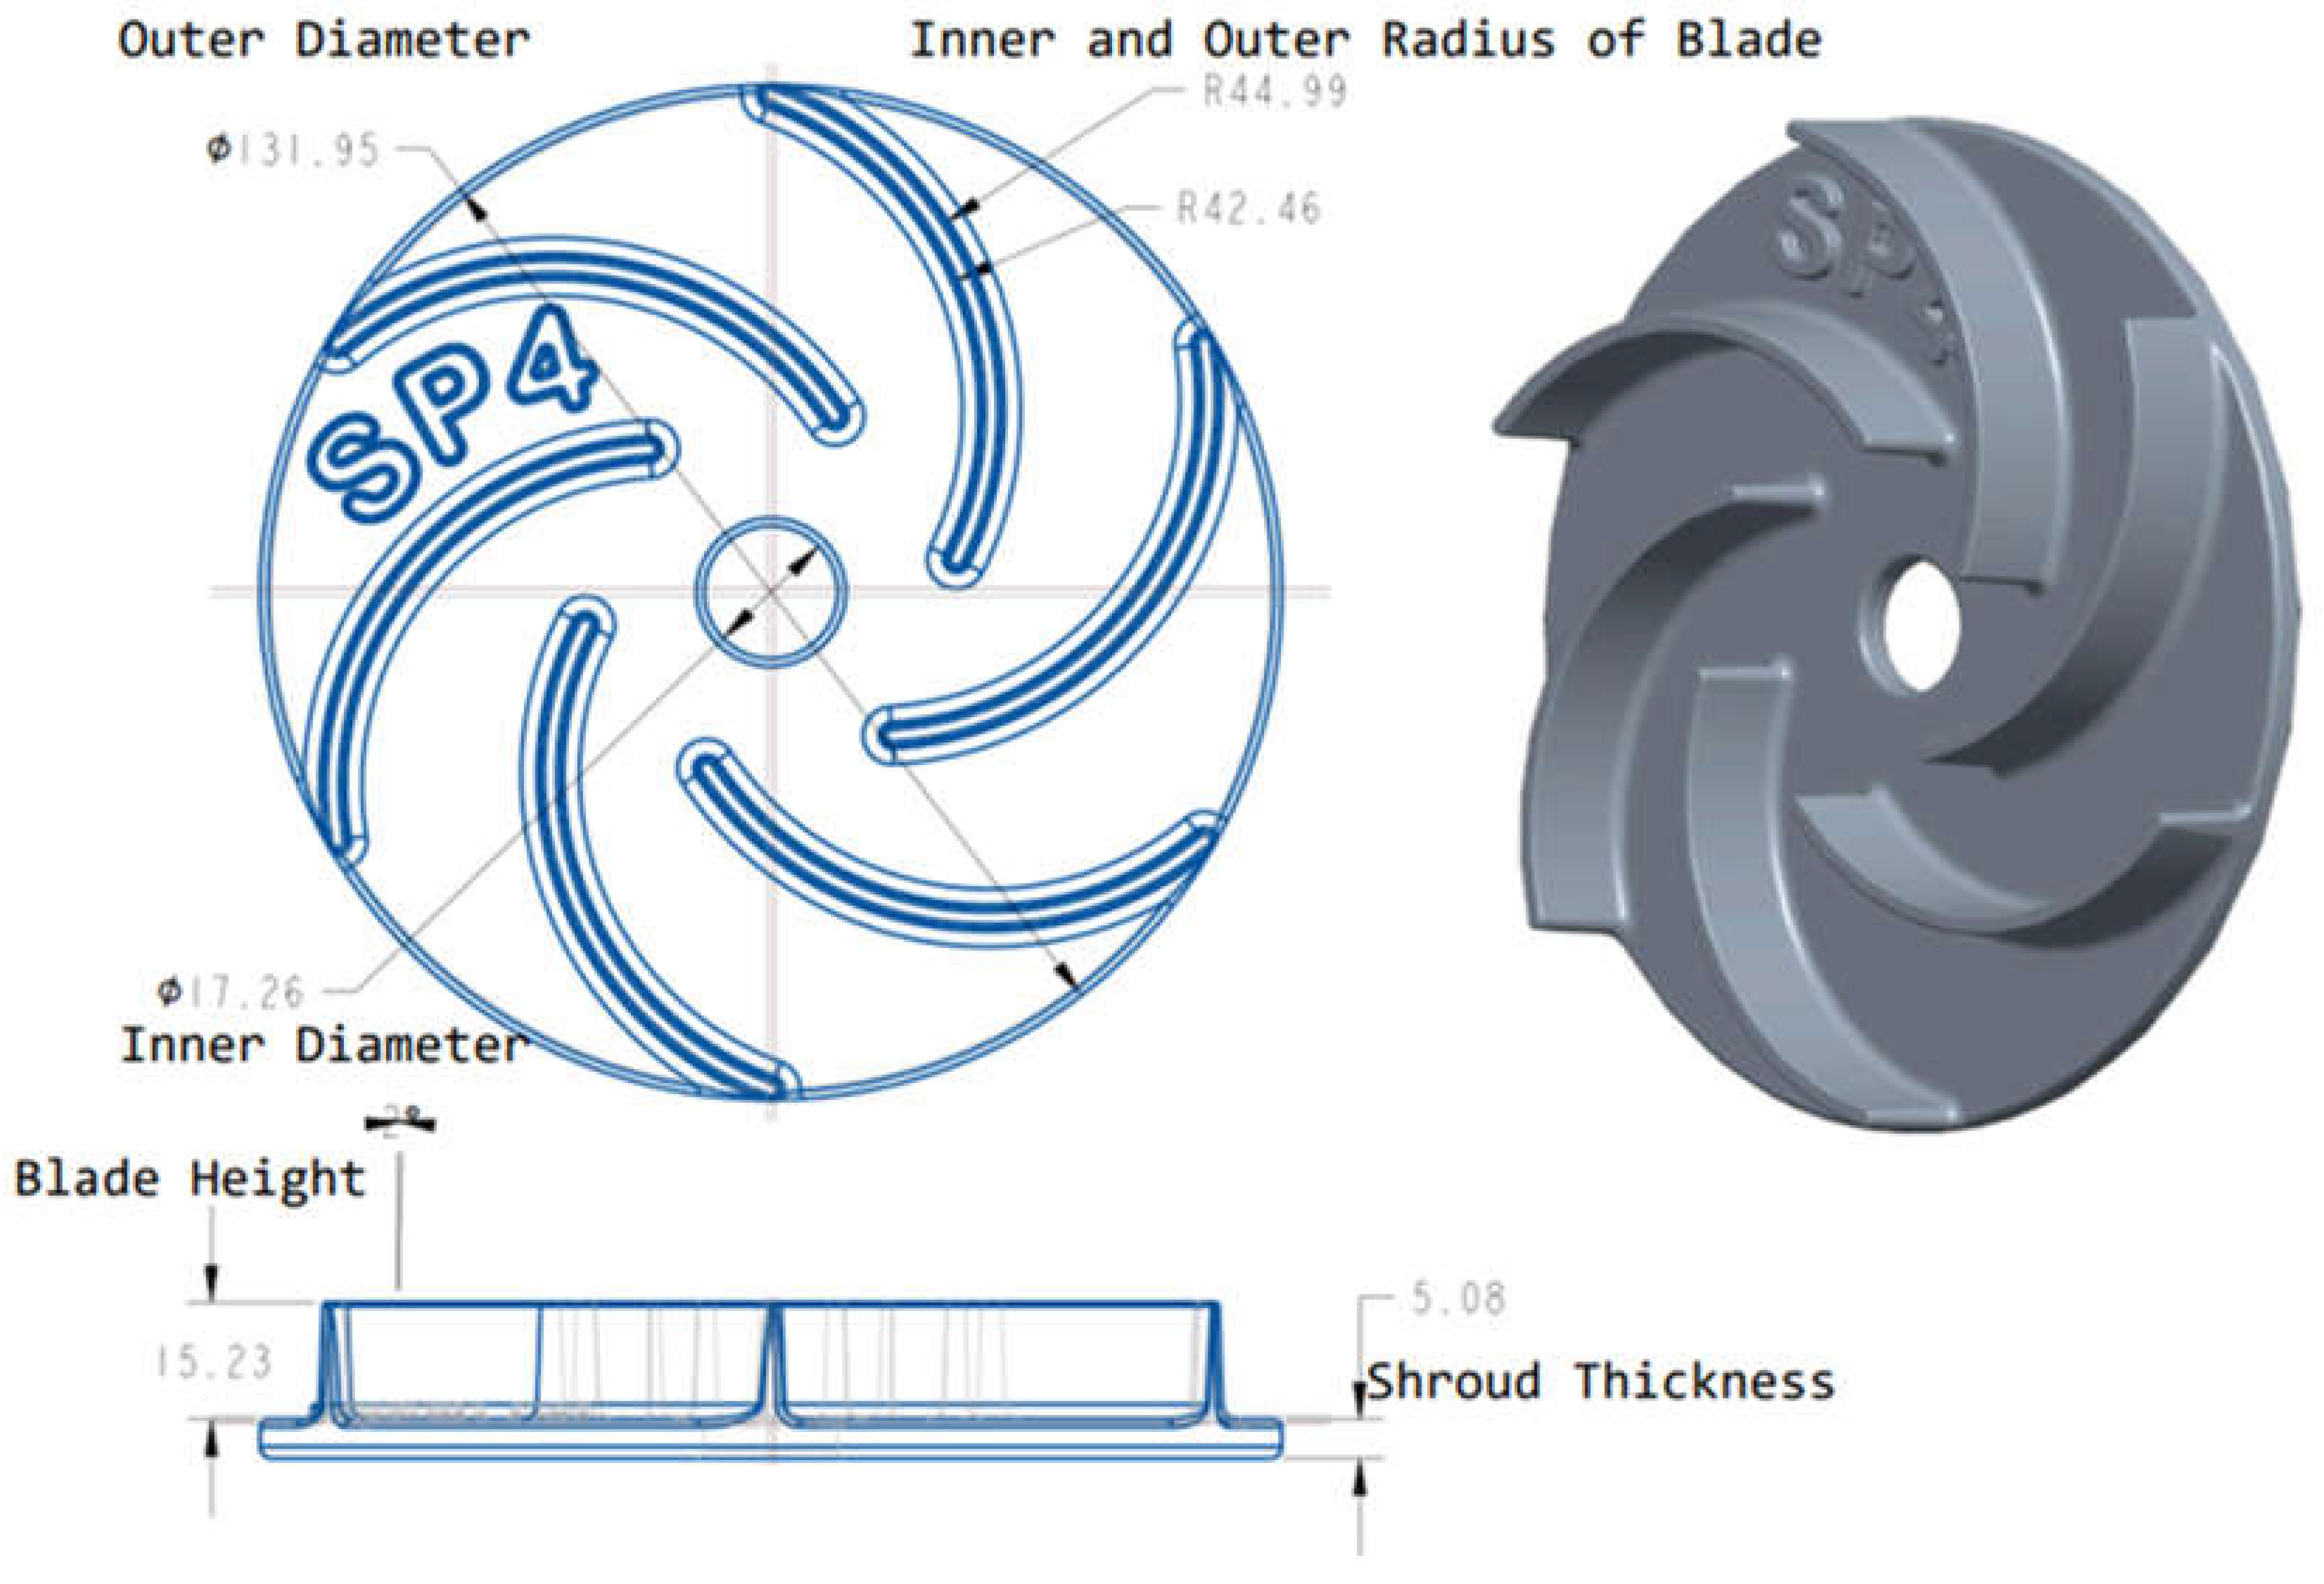
Table 7.
Measured values and average of dimensions for Specimen No-1(SP1).
| Sample ID: SP1 | 1 | 2 | 3 | 4 | 5 | Average |
| OD (mm) | 131 | 131.5 | 131.5 | 131 | 131.5 | 131.3 |
| ID (mm) | 17 | 17.1 | 17 | 17.1 | 17 | 17.04 |
| BT (mm) | 2.91 | 2.9 | 2.9 | 2.91 | 2.91 | 2.91 |
| ST (mm) | 5 | 5 | 5.1 | 5.1 | 5 | 5.04 |
| BH (mm) | 15.3 | 15.4 | 15.3 | 15.3 | 15.3 | 15.32 |
Table 8.
Measured values and average of dimensions for Specimen No-2(SP2).
| Sample ID: SP2 | 1 | 2 | 3 | 4 | 5 | Average |
| OD (mm) | 130.1 | 130.1 | 130.2 | 130.1 | 130.1 | 130.13 |
| ID (mm) | 16.8 | 16.8 | 16.8 | 16.9 | 16.8 | 16.83 |
| BT (mm) | 2.91 | 2.9 | 2.9 | 2.9 | 2.91 | 2.9 |
| ST (mm) | 5 | 5 | 5.1 | 5.1 | 5 | 5.05 |
| BH (mm) | 15.3 | 15.4 | 15.3 | 15.3 | 15.3 | 15.33 |
Table 9.
Measured values and average of dimensions for Specimen No-3(SP3).
| Sample ID: SP3 | 1 | 2 | 3 | 4 | 5 | Average |
| OD (mm) | 131.5 | 131.5 | 131 | 131.5 | 131.5 | 131.4 |
| ID (mm) | 17 | 17.1 | 17.2 | 17.1 | 17.1 | 17.1 |
| BT (mm) | 2.9 | 2.9 | 2.91 | 2.91 | 2.9 | 2.9 |
| ST (mm) | 5 | 5 | 5.1 | 5.2 | 5.1 | 5.08 |
| BH (mm) | 15.3 | 15.4 | 15.4 | 15.3 | 15.3 | 15.34 |
Table 10.
Measured values and average of dimensions for Specimen No-4(SP4).
| Sample ID: SP4 | 1 | 2 | 3 | 4 | 5 | Average |
| OD (mm) | 131.5 | 131.5 | 131 | 131.5 | 131.5 | 131.06 |
| ID (mm) | 17 | 17.1 | 17.2 | 17.1 | 17.1 | 17.06 |
| BT (mm) | 2.9 | 2.9 | 2.91 | 2.91 | 2.9 | 2.9 |
| ST (mm) | 5 | 5 | 5.1 | 5.2 | 5.1 | 5.04 |
| BH (mm) | 15.3 | 15.4 | 15.4 | 15.3 | 15.3 | 15.34 |
Table 11.
Measured values and average of dimensions for Specimen No-5(SP5).
| Sample ID: SP5 | 1 | 2 | 3 | 4 | 5 | Average |
| OD (mm) | 131.5 | 131.5 | 131 | 131.5 | 131.5 | 131.06 |
| ID (mm) | 17 | 17.1 | 17.2 | 17.1 | 17.1 | 17.06 |
| BT (mm) | 2.9 | 2.9 | 2.91 | 2.91 | 2.9 | 2.91 |
| ST (mm) | 5 | 5 | 5.1 | 5.2 | 5.1 | 5.06 |
| BH (mm) | 15.3 | 15.4 | 15.4 | 15.3 | 15.3 | 15.34 |
Table 12.
Measured values and average of dimensions for Specimen No-6(SP6).
| Sample ID: SP6 | 1 | 2 | 3 | 4 | 5 | Average |
| OD (mm) | 131.5 | 131.5 | 131 | 131.5 | 131.5 | 131.08 |
| ID (mm) | 17 | 17.1 | 17.2 | 17.1 | 17.1 | 17.06 |
| BT (mm) | 2.9 | 2.9 | 2.91 | 2.91 | 2.9 | 2.91 |
| ST (mm) | 5 | 5 | 5.1 | 5.2 | 5.1 | 5.06 |
| BH (mm) | 15.3 | 15.4 | 15.4 | 15.3 | 15.3 | 15.34 |
Table 13.
Measured values and average of dimensions for Specimen No-7(SP7).
| Sample ID: SP7 | 1 | 2 | 3 | 4 | 5 | Average |
| OD (mm) | 131.5 | 131.5 | 131 | 131.5 | 131.5 | 131.14 |
| ID (mm) | 17 | 17.1 | 17.2 | 17.1 | 17.1 | 17.06 |
| BT (mm) | 2.9 | 2.9 | 2.91 | 2.91 | 2.9 | 2.9 |
| ST (mm) | 5 | 5 | 5.1 | 5.2 | 5.1 | 5.12 |
| BH (mm) | 15.3 | 15.4 | 15.4 | 15.3 | 15.3 | 15.34 |
Table 14.
Measured values and average of dimensions for Specimen No-8(SP8).
| Sample ID: SP8 | 1 | 2 | 3 | 4 | 5 | Average |
| OD (mm) | 131.5 | 131.5 | 131 | 131.5 | 131.5 | 131.14 |
| ID (mm) | 17 | 17.1 | 17.2 | 17.1 | 17.1 | 17.04 |
| BT (mm) | 2.9 | 2.9 | 2.91 | 2.91 | 2.9 | 2.9 |
| ST (mm) | 5 | 5 | 5.1 | 5.2 | 5.1 | 5.13 |
| BH (mm) | 15.3 | 15.4 | 15.4 | 15.3 | 15.3 | 15.36 |
Table 15.
Measured values and average of dimensions for Specimen No-9(SP9).
| Sample ID: SP9 | 1 | 2 | 3 | 4 | 5 | Average |
| OD (mm) | 131.5 | 131.5 | 131 | 131.5 | 131.5 | 131.12 |
| ID (mm) | 17 | 17.1 | 17.2 | 17.1 | 17.1 | 17.06 |
| BT (mm) | 2.9 | 2.9 | 2.91 | 2.91 | 2.9 | 2.91 |
| ST (mm) | 5 | 5 | 5.1 | 5.2 | 5.1 | 5.12 |
| BH (mm) | 15.3 | 15.4 | 15.4 | 15.3 | 15.3 | 15.36 |
3.1.1. Investigation of OD and ID (Deviation in Circular Feature)
Figures 8(a) and (b) show the difference between the nominal and actual values for OD and ID, respectively. They also show the changes in OD and ID with respect to the print parameters set for the samples. Table 16 shows the deviation in OD, the deviation in ID, and the mean deviation in circular features (OD and ID) for each sample. It indicates that the dimensional deviation for OD is maximum (-1.77 mm) for sample SP2 and minimum (-0.5 mm) for sample SP3. As observed from Figure 8(a), the actual measurement values of OD for all samples are less than the nominal value. This occurs due to the shrinkage of ABS material as it cools and solidifies after printing. To improve dimensional accuracy in OD, an appropriate shrinkage factor should be considered in the nominal value.
Figure 8.
Dimension deviation a) Outer Diameter (OD) b) Inner Diameter (ID).
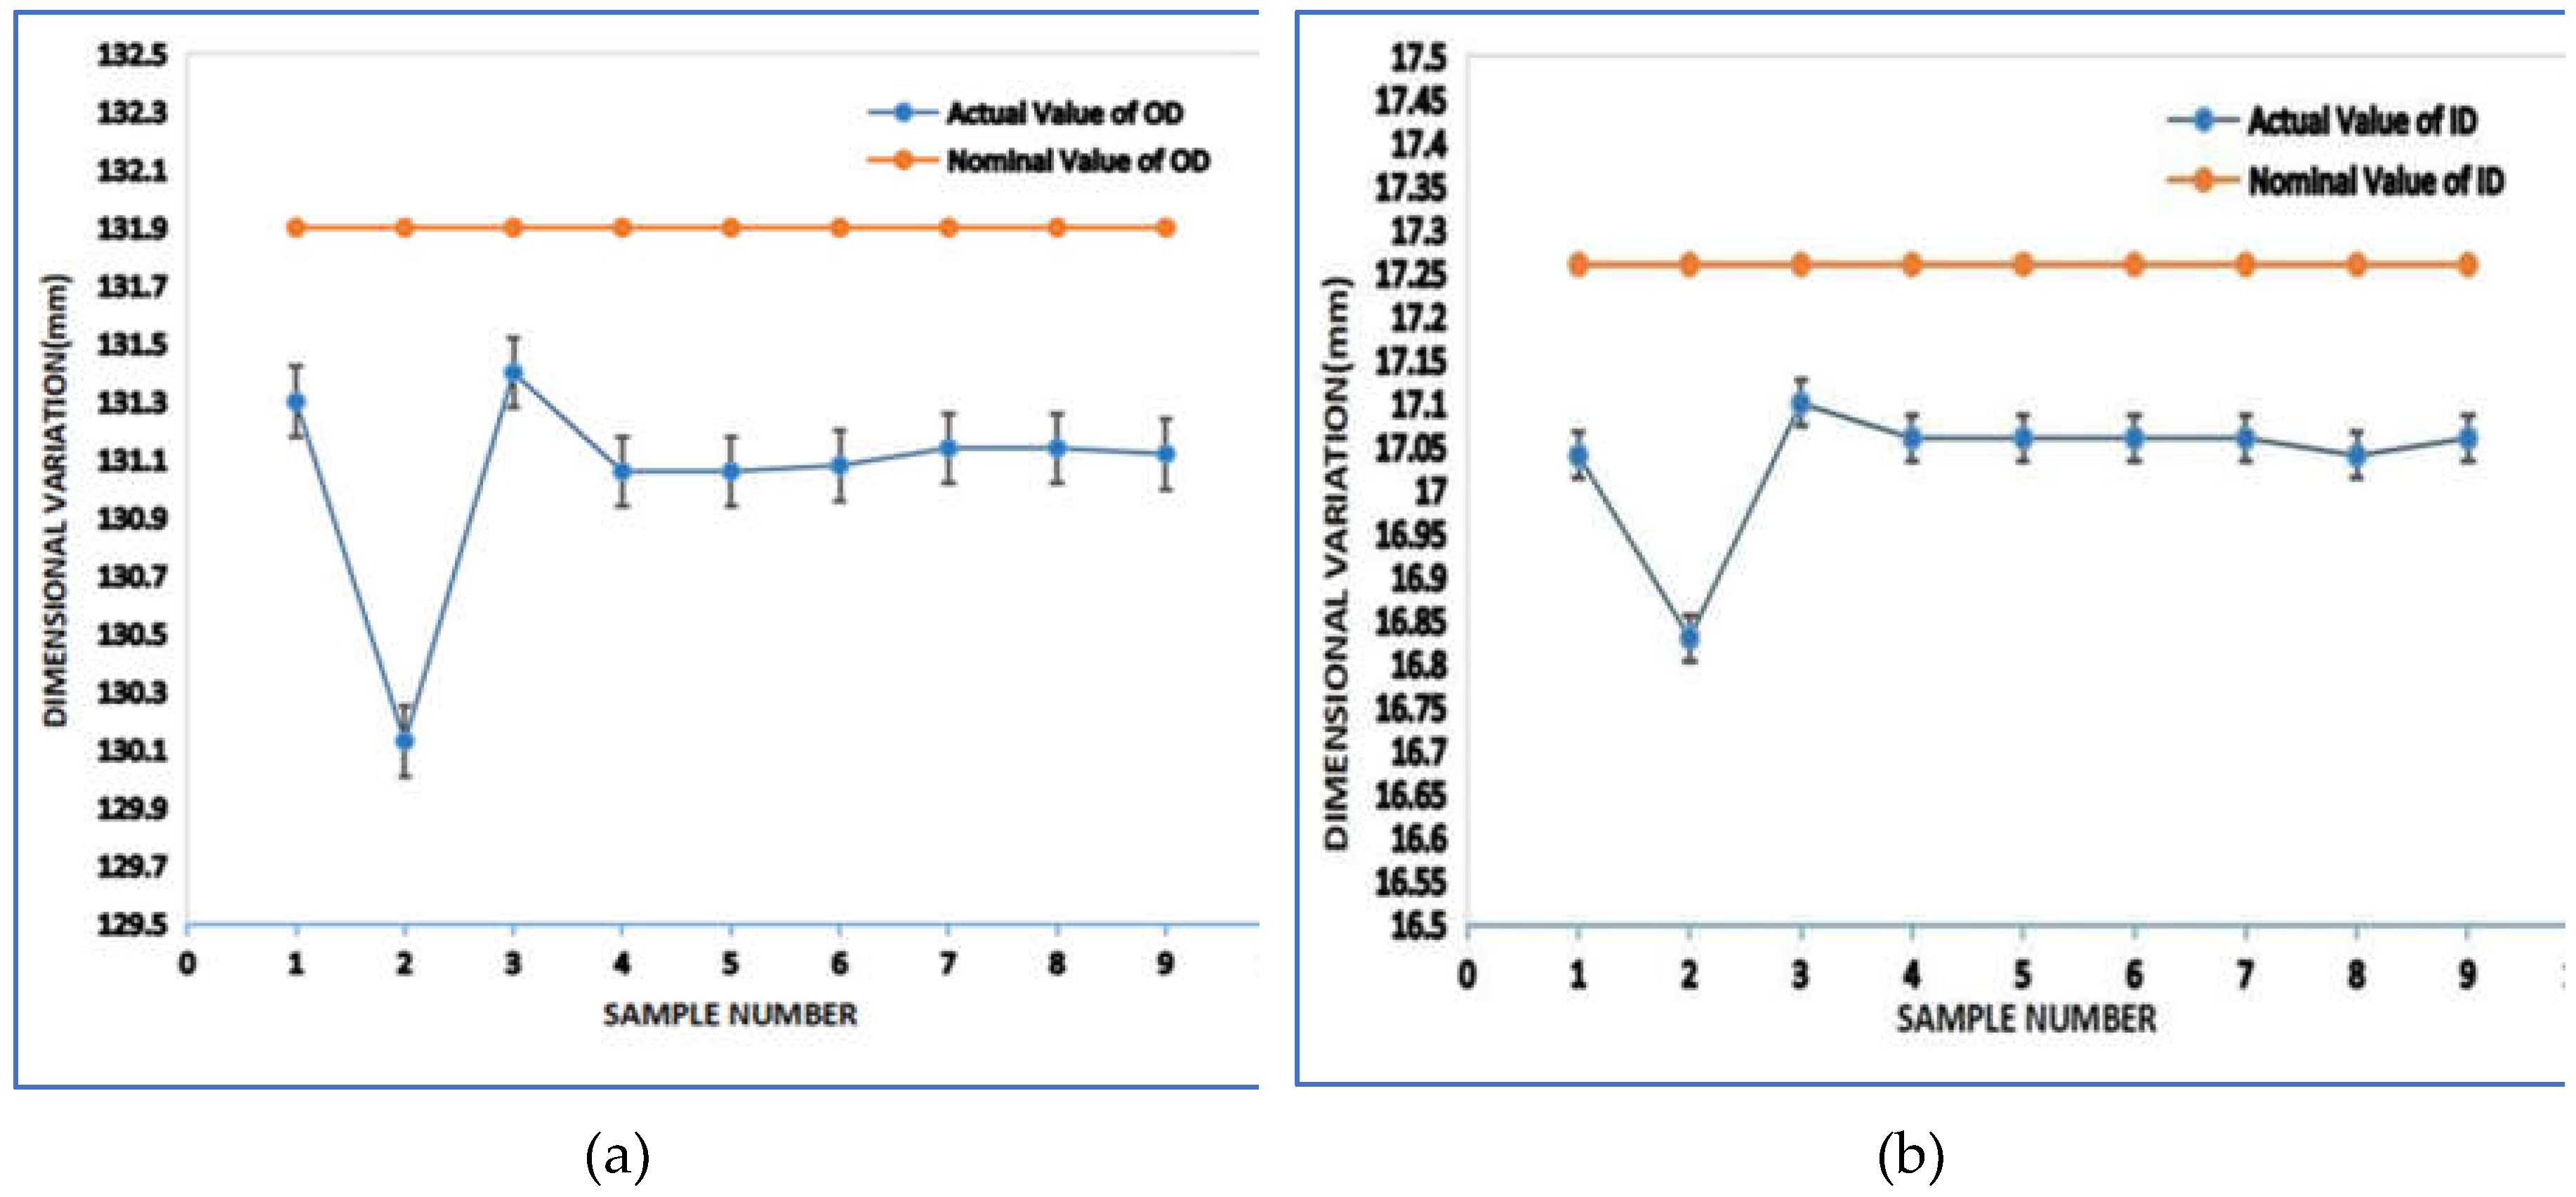
The dimensional deviation for ID is minimum in sample SP3 (-0.16 mm) and maximum (-0.43 mm) in sample SP2 (refer to Table 16). As observed from Figure 8(b), the actual measurement values of ID for all samples are less than the nominal value. This occurs due to inaccuracies in printing small features. It is also observed that the deviation in ID is much smaller than the deviation in OD. This may be due to the combined effects of shrinkage and inaccuracies in printing small features. The shrinkage causes ID to increase, while inaccuracies in printing small features cause ID to decrease. As a result, the contradictory effects of both result in a small final deviation in ID. To improve accuracy, one must understand both effects and adjust the nominal value accordingly for small features.
The dimensional deviation is given by the algebraic difference between the actual value and the nominal value, as shown in Equation 1. Equation 1a shows the calculation of deviation in OD for sample SP1, and Table 16 shows the deviation in OD and ID for all samples. Equation 2 shows the sample calculation of the mean deviation in circular features for sample SP1, and Table 16 shows the mean deviation in circular features for all samples.
So, Dimensional Deviation in OD for sample SP1 is given by,
for sample SP1 = of OD
Minimum deviation in OD and ID was observed for sample SP3, and the mean deviation in circular features is also the minimum in the case of sample SP3 (refer to Table 16). Therefore, the printing parameter values for sample SP3 will be a better choice for achieving dimensional accuracy in circular features. The printing parameter values set for SP3 are: layer thickness 0.08 mm, extrusion temperature 280°C, and infill percentage 70% (refer to Table 6). In contrast, the mean deviation is maximum for sample SP2 (refer to Table 16). In general, one should select a lower value for layer thickness, combined with a higher value for extrusion temperature and infill density. Figure 8 and Table 17 show the variation in dimension and the standard deviation of circular features (OD and ID). The standard deviation of OD is higher than that of ID. Standard deviation is a quantity that provides information about the distribution of data from its mean value. A higher value of standard deviation indicates that the data is more spread out from its mean.
3.1.2. Investigation of BT (Deviation in Thin Curved Feature)
Figure 9 shows the difference between the nominal value and the actual value for BT. Table 18 shows the deviation in BT for each sample. It indicates that the dimensional deviation for BT is maximum (0.38 mm) for samples SP1, SP5, SP6, and SP9, and the dimensional deviation for BT is minimum (0.37 mm) for samples SP2, SP3, SP4, SP7, and SP8. As observed from Figure 9, the actual measurement values of BT for all samples are greater than the nominal value. This occurs due to inaccuracies in printing thin curved features. It is also observed that the deviation in BT is much smaller than the deviation in OD. This may be due to the combined effects of shrinkage and inaccuracies in printing thin features.
Figure 9.
Dimension deviation in Blade Thickness (BT).
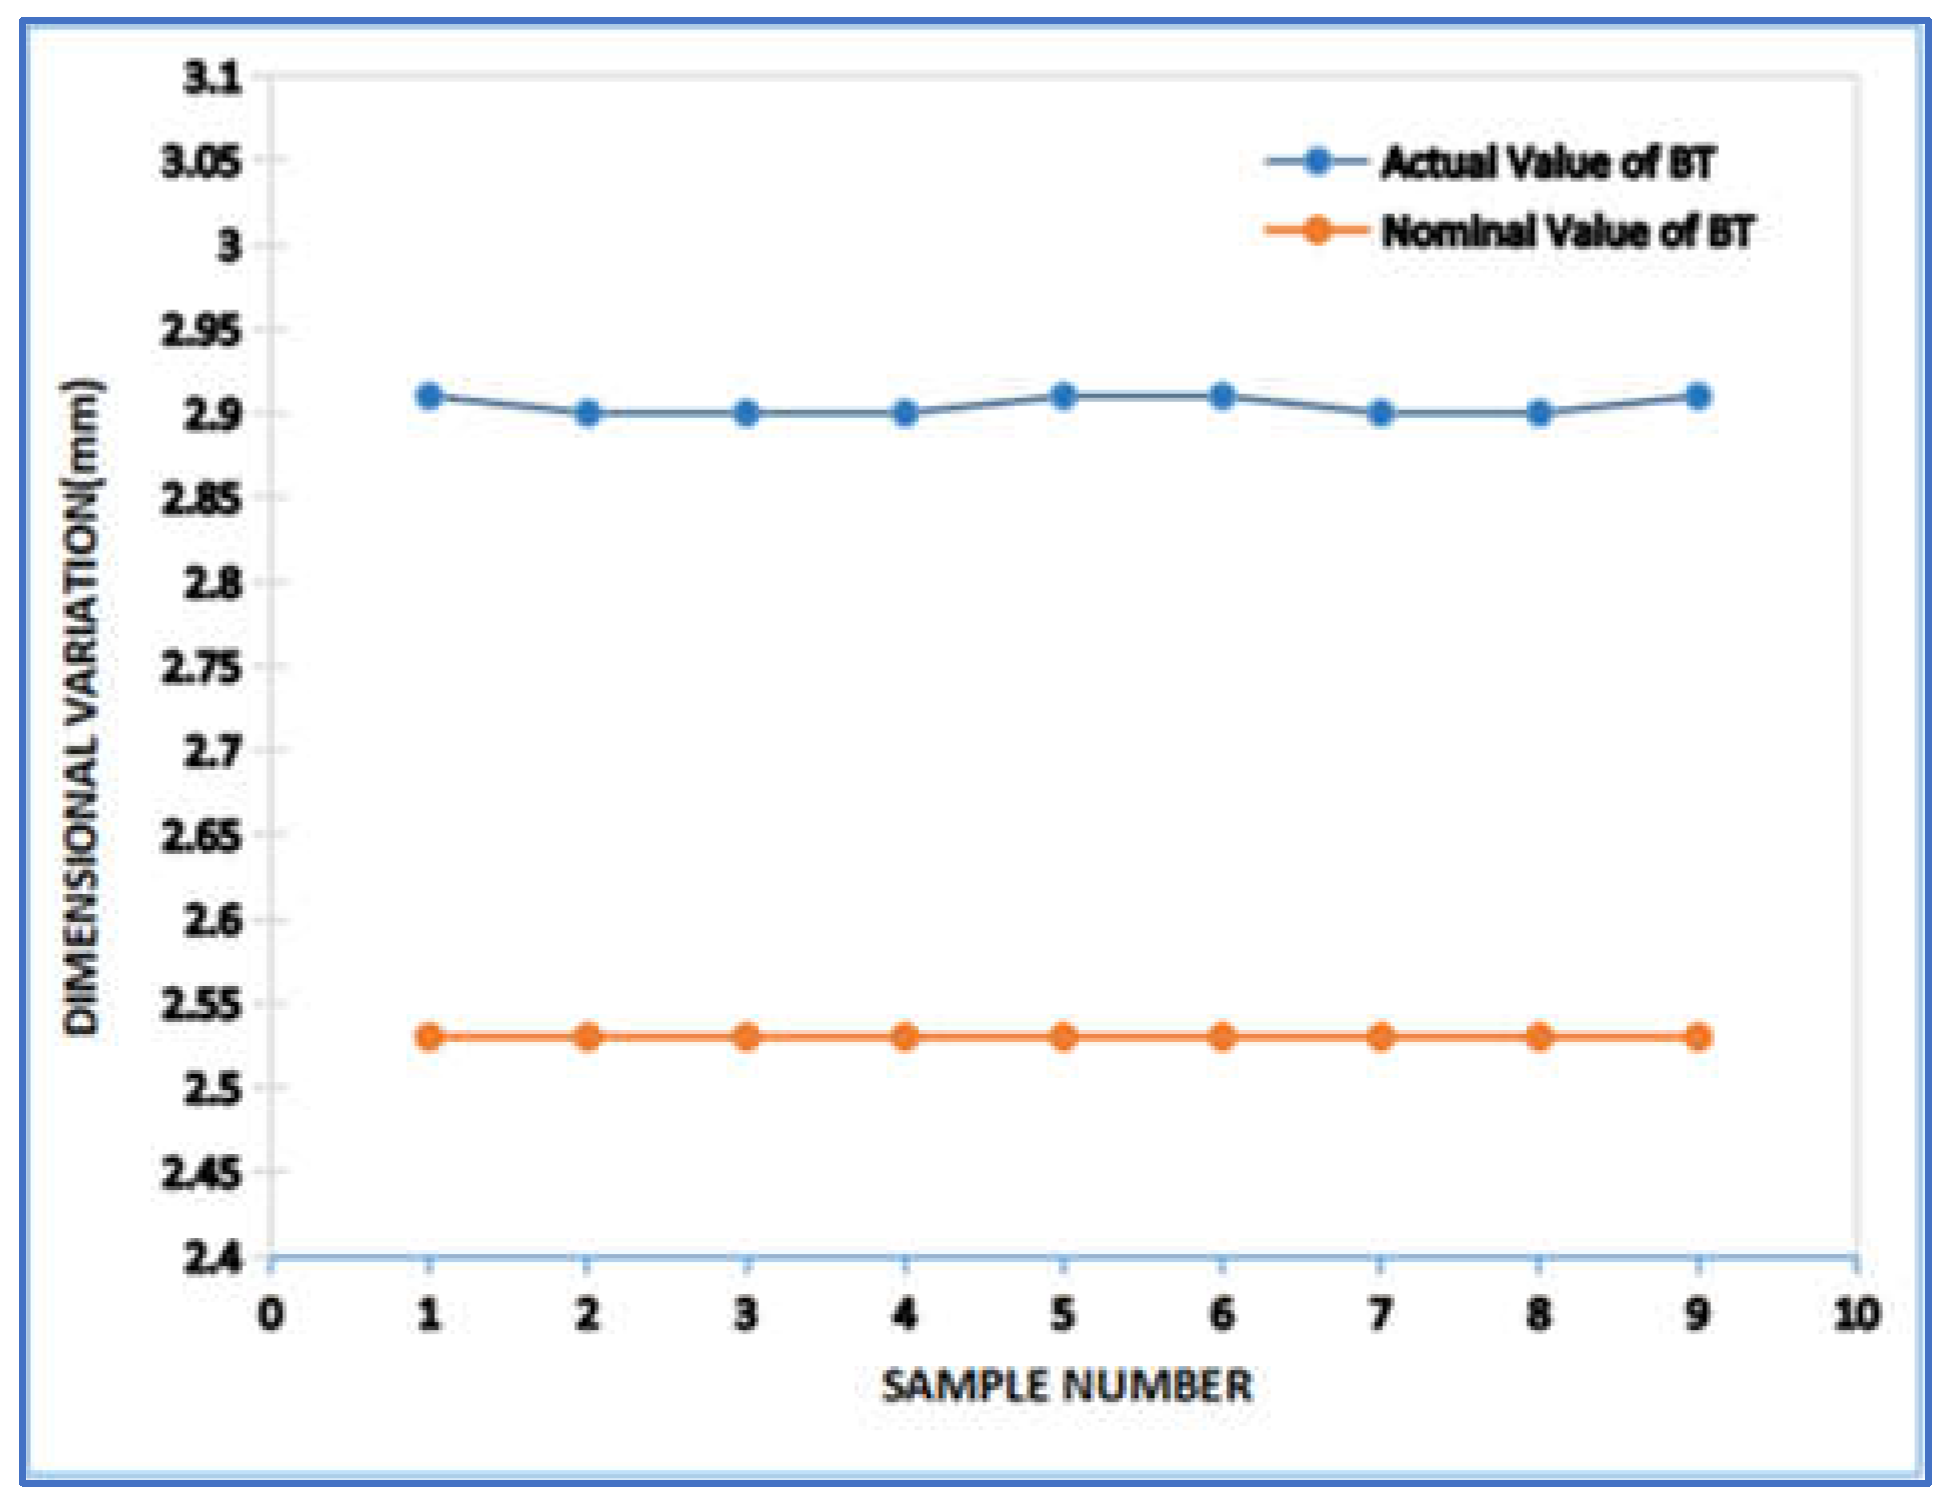
Due to shrinkage, BT will decrease, and due to inaccuracies in printing thin features, BT will increase. As a result, the contradictory effects of both lead to a small final deviation in BT. The minimum dimensional deviation in BT is slightly higher than the deviation in ID, which may occur due to the curved shape of the blade. To improve accuracy, one should consider the effects of geometric shape and size when determining the nominal value for thin curved features.
The minimum deviation in BT was observed for samples SP2, SP3, SP4, SP7, and SP8. Therefore, the printing parameter values given in Table 6 for these samples will be a better choice for achieving dimensional accuracy in thin curved features. The preferable printing parameter values are: layer thickness 0.08 mm, extrusion temperature 240-280°C, and infill percentage 50-70% (refer to Table 6). Table 19 shows the standard deviation in BT, which is 0.0052 mm. Here, the very small value of the standard deviation indicates the minimal effect of variation in print parameters on the dimensions of thin curved features.
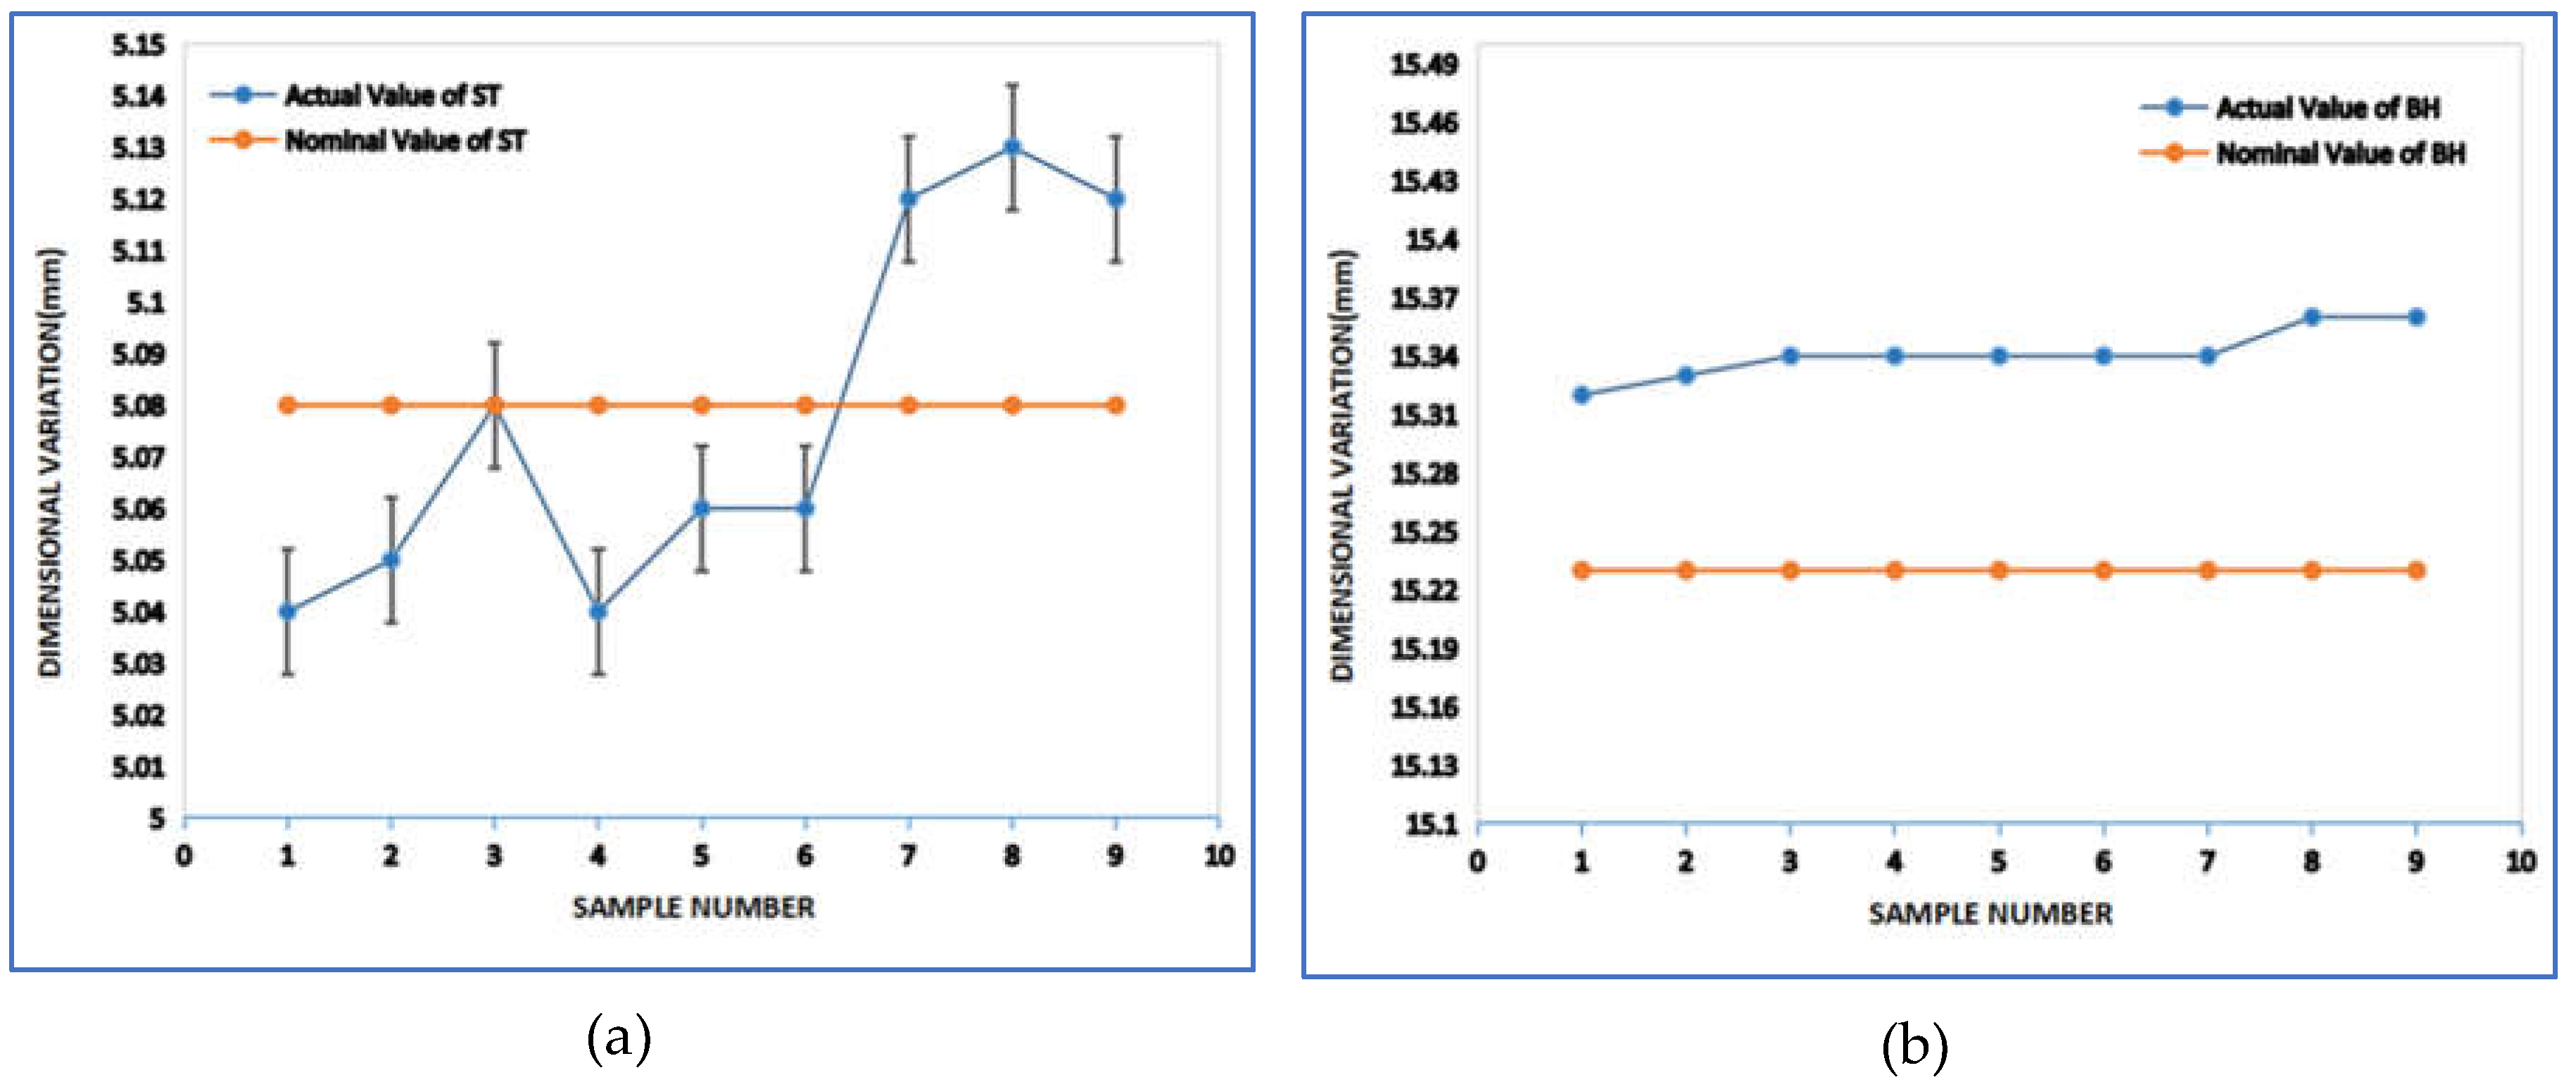
3.1.3. Investigation of ST and BH (Deviation in Vertical Z- Direction)
Figure 10(a) and (b) show the difference between the nominal value and the actual value for ST and BH, respectively. Table 20 shows the deviation in ST, the deviation in BH, and the mean deviation in the vertical Z-direction (ST and BH) for each sample. It indicates that the dimensional deviation for ST is maximum (-0.05 mm) for sample SP8 and zero for sample SP3. As observed from Figure 10(a), the actual measurement values of ST for samples SP1 to SP6, except SP3, are less than the nominal value, while for samples SP7 to SP9, the values are greater than the nominal value. This occurs because of layer thickness variation on the cooling rate, which in turn affects shrinkage and the accuracy in Z-direction printing. As the actual value exceeds the nominal value, the deviation changes its sign from negative to positive. This behavior suggests the presence of the combined effect of print parameter interaction, along with the individual effect of each parameter. To improve dimensional accuracy in ST, appropriate print parameter settings and a shrinkage factor should be considered.
The dimensional deviation for BH is minimum in sample SP1 (0.09 mm) and maximum (0.13 mm) in samples SP8 and SP9 (refer to Table 20). As observed from Figure 10(b), the actual measurement values of BH for all samples are greater than the nominal value. The actual value and deviation of BH increase consistently from SP1 to SP3, remain constant from SP3 to SP7, and again increase consistently from SP7 to SP9. This occurs due to an increase in layer thickness, which affects the accuracy in Z-direction printing (refer to Table 6 and Figure 10(a)). It is also observed that the deviation in ST is much smaller than the deviation in BH. This may be due to the geometrical size differences of the shroud and blade in the X, Y, and Z directions.
Figure 10.
Dimension deviation a) Shroud Thickness (ST) b) Blade Height (BH).
Equation 3 shows the sample calculation of mean deviation in Z direction for sample SP1 and table 20 shows the mean deviation in the Z direction for all samples.
Mean Deviation in Z direction for sample SP1=
The mean deviation is minimum (0.025 mm) for sample SP1 and maximum for sample SP8. Therefore, the print parameter set for sample SP1 will be a better choice. The preferable printing parameter values to achieve accurate dimensions in the vertical Z-direction are: layer thickness 0.08 mm, extrusion temperature 240°C, and infill percentage 30% (refer to Table 6).
Figure 10 and Table 21 show the variation in dimension and the standard deviation in the Z-direction. The standard deviation of ST is higher than that of BH. Standard deviation is a quantity that provides information about the distribution of data from its mean value. A higher standard deviation indicates that the data is more spread out from its mean.
Dimensional accuracy is influenced by both print resolution and shrinkage. Small features are more affected by print resolution, while large features are more impacted by shrinkage, aligning with findings from previous studies [11,12]. Poor print accuracy often results in over-dimensioning, as observed in BH and BT.
For ST, the dimensional deviation is negative for small layer thicknesses and positive for larger ones due to print accuracy effects. The contradictory influences of print accuracy and shrinkage lead to better dimensional accuracy in thin and small features compared to larger ones. The maximum standard deviation of 0.362 mm is observed in OD, while the minimum standard deviation of 0.0052 mm is observed in BT. This indicates that OD is the most affected dimension, whereas BT is the least affected dimension by the FDM process parameters
The minimum dimensional deviation was observed in sample SP3 for OD, ID, BT, and ST, and in sample SP1 for BH. The best FDM parameter settings to achieve minimal dimensional deviation are:
- Layer thickness: 0.08 mm (Level 1)
- Extrusion temperature: 280°C (Level 3)
- Infill density: 70% (Level 3)
3.2. Analysis of Surface Roughness
This investigation includes a detailed study of the measured values of three surface roughness parameters: Ra, Rq, and Rz. As per the DoE Taguchi L9 method, a total of nine samples were printed using FDM. The various print parameter values for each sample and all printed samples are provided in Table 6 and Figure 6. As mentioned earlier, based on the literature, two locations were selected for surface roughness measurement: the blade surface and the shroud top face. Three measurements were taken at each location, and the average value was noted for further analysis. Tables 22 to 30 present the measured and average values of the surface roughness parameters Ra, Rq, and Rz for all samples.
Table 22.
Measured values and average of surface roughness for Specimen No-1(SP1).
| Sample ID: SP1 | Location | 1 | 2 | 3 | Average |
|---|---|---|---|---|---|
| Shroud | 0.585 | 0.484 | 0.268 | 0.446 | |
| Blade | 4.169 | 4.191 | 4.481 | 4.280 | |
| Shroud | 0.795 | 0.643 | 0.313 | 0.584 | |
| Blade | 4.828 | 4.810 | 5.223 | 4.954 | |
| Shroud | 4.116 | 3.035 | 1.212 | 2.788 | |
| Blade | 18.072 | 16.763 | 19.111 | 17.982 |
Table 23.
Measured values and average of surface roughness for Specimen No-2(SP2).
| Sample ID: SP2 | Location | 1 | 2 | 3 | Average |
|---|---|---|---|---|---|
| Shroud | 2.241 | 3.445 | 2.327 | 2.671 | |
| Blade | 4.444 | 4.711 | 4.008 | 4.388 | |
| Shroud | 3.612 | 4.325 | 2.994 | 3.644 | |
| Blade | 5.271 | 5.751 | 4.709 | 5.244 | |
| Shroud | 24.738 | 18.854 | 16.998 | 20.197 | |
| Blade | 19.879 | 22.614 | 16.51 | 19.668 |
Table 24.
Measured values and average of surface roughness for Specimen No-3(SP3).
| Sample ID: SP3 | Location | 1 | 2 | 3 | Average |
|---|---|---|---|---|---|
| Shroud | 0.298 | 0.465 | 0.511 | 0.425 | |
| Blade | 4.414 | 4.759 | 3.757 | 4.310 | |
| Shroud | 0.418 | 0.662 | 0.708 | 0.596 | |
| Blade | 5.170 | 5.576 | 4.568 | 5.105 | |
| Shroud | 1.821 | 3.824 | 3.527 | 3.057 | |
| Blade | 19.805 | 19.84 | 18.463 | 19.369 |
Table 25.
Measured values and average of surface roughness for Specimen No-4(SP4).
| Sample ID: SP4 | Location | 1 | 2 | 3 | Average |
|---|---|---|---|---|---|
| Shroud | 2.797 | 3.098 | 1.540 | 2.478 | |
| Blade | 5.977 | 5.201 | 6.111 | 5.763 | |
| Shroud | 4.100 | 4.559 | 2.021 | 3.560 | |
| Blade | 6.916 | 6.860 | 7.053 | 6.943 | |
| Shroud | 22.883 | 26.264 | 11.682 | 20.276 | |
| Blade | 27.602 | 28.695 | 30.382 | 28.893 |
Table 26.
Measured values and average of surface roughness for Specimen No-5(SP5).
| Sample ID: SP5 | Location | 1 | 2 | 3 | Average |
|---|---|---|---|---|---|
| Shroud | 1.577 | 0.550 | 1.792 | 1.306 | |
| Blade | 5.315 | 5.939 | 4.822 | 5.359 | |
| Shroud | 2.326 | 0.737 | 2.502 | 1.855 | |
| Blade | 6.336 | 6.892 | 6.099 | 6.442 | |
| Shroud | 10.690 | 3.170 | 13.943 | 9.268 | |
| Blade | 26.156 | 30.325 | 26.787 | 27.756 |
Table 27.
Measured values and average of surface roughness for Specimen No-6(SP6).
| Sample ID: SP6 | Location | 1 | 2 | 3 | Average |
|---|---|---|---|---|---|
| Shroud | 1.461 | 2.842 | 4.556 | 2.953 | |
| Blade | 4.888 | 5.957 | 5.143 | 5.329 | |
| Shroud | 1.788 | 4.442 | 6.146 | 4.125 | |
| Blade | 6.176 | 7.126 | 6.521 | 6.608 | |
| Shroud | 8.393 | 22.060 | 25.132 | 18.528 | |
| Blade | 23.364 | 27.177 | 23.938 | 24.826 |
Table 28.
Measured values and average of surface roughness for Specimen No-7(SP7).
| Sample ID: SP7 | Location | 1 | 2 | 3 | Average |
|---|---|---|---|---|---|
| Shroud | 4.74 | 6.213 | 2.625 | 4.526 | |
| Blade | 6.790 | 7.128 | 6.973 | 6.964 | |
| Shroud | 5.734 | 7.735 | 4.056 | 5.842 | |
| Blade | 7.987 | 8.293 | 8.196 | 8.159 | |
| Shroud | 24.438 | 40.146 | 15.925 | 26.836 | |
| Blade | 32.358 | 31.190 | 32.709 | 32.086 |
Table 29.
Measured values and average of surface roughness for Specimen No-8(SP8).
| Sample ID: SP8 | Location | 1 | 2 | 3 | Average |
|---|---|---|---|---|---|
| Shroud | 3.317 | 2.515 | 4.902 | 3.578 | |
| Blade | 7.418 | 6.913 | 6.833 | 7.055 | |
| Shroud | 4.065 | 3.119 | 5.766 | 4.317 | |
| Blade | 8.995 | 8.057 | 8.503 | 8.518 | |
| Shroud | 20.168 | 11.813 | 24.516 | 18.832 | |
| Blade | 37.411 | 31.396 | 39.343 | 36.050 |
Table 30.
Measured values and average of surface roughness for Specimen No-9(SP9).
| Sample ID: SP9 | Location | 1 | 2 | 3 | Average |
|---|---|---|---|---|---|
| Shroud | 7.774 | 6.907 | 3.757 | 6.146 | |
| Blade | 6.404 | 6.694 | 7.388 | 6.829 | |
| Shroud | 9.935 | 9.615 | 4.753 | 8.101 | |
| Blade | 7.731 | 7.83 | 8.464 | 8.008 | |
| Shroud | 45.106 | 37.695 | 23.386 | 35.396 | |
| Blade | 31.187 | 30.732 | 32.052 | 31.324 |
Figure 11 represents the surface roughness (Ra) at the blade surface and the shroud top face for all samples. It is observed that the Ra value of the blade surface is significantly higher than the Ra value of the shroud top face for all samples. Figure 12 shows the print orientation of an impeller, and Figure 13 (a) shows the locations for surface roughness measurement.
Figure 11.
Surface Roughness Ra (μm)
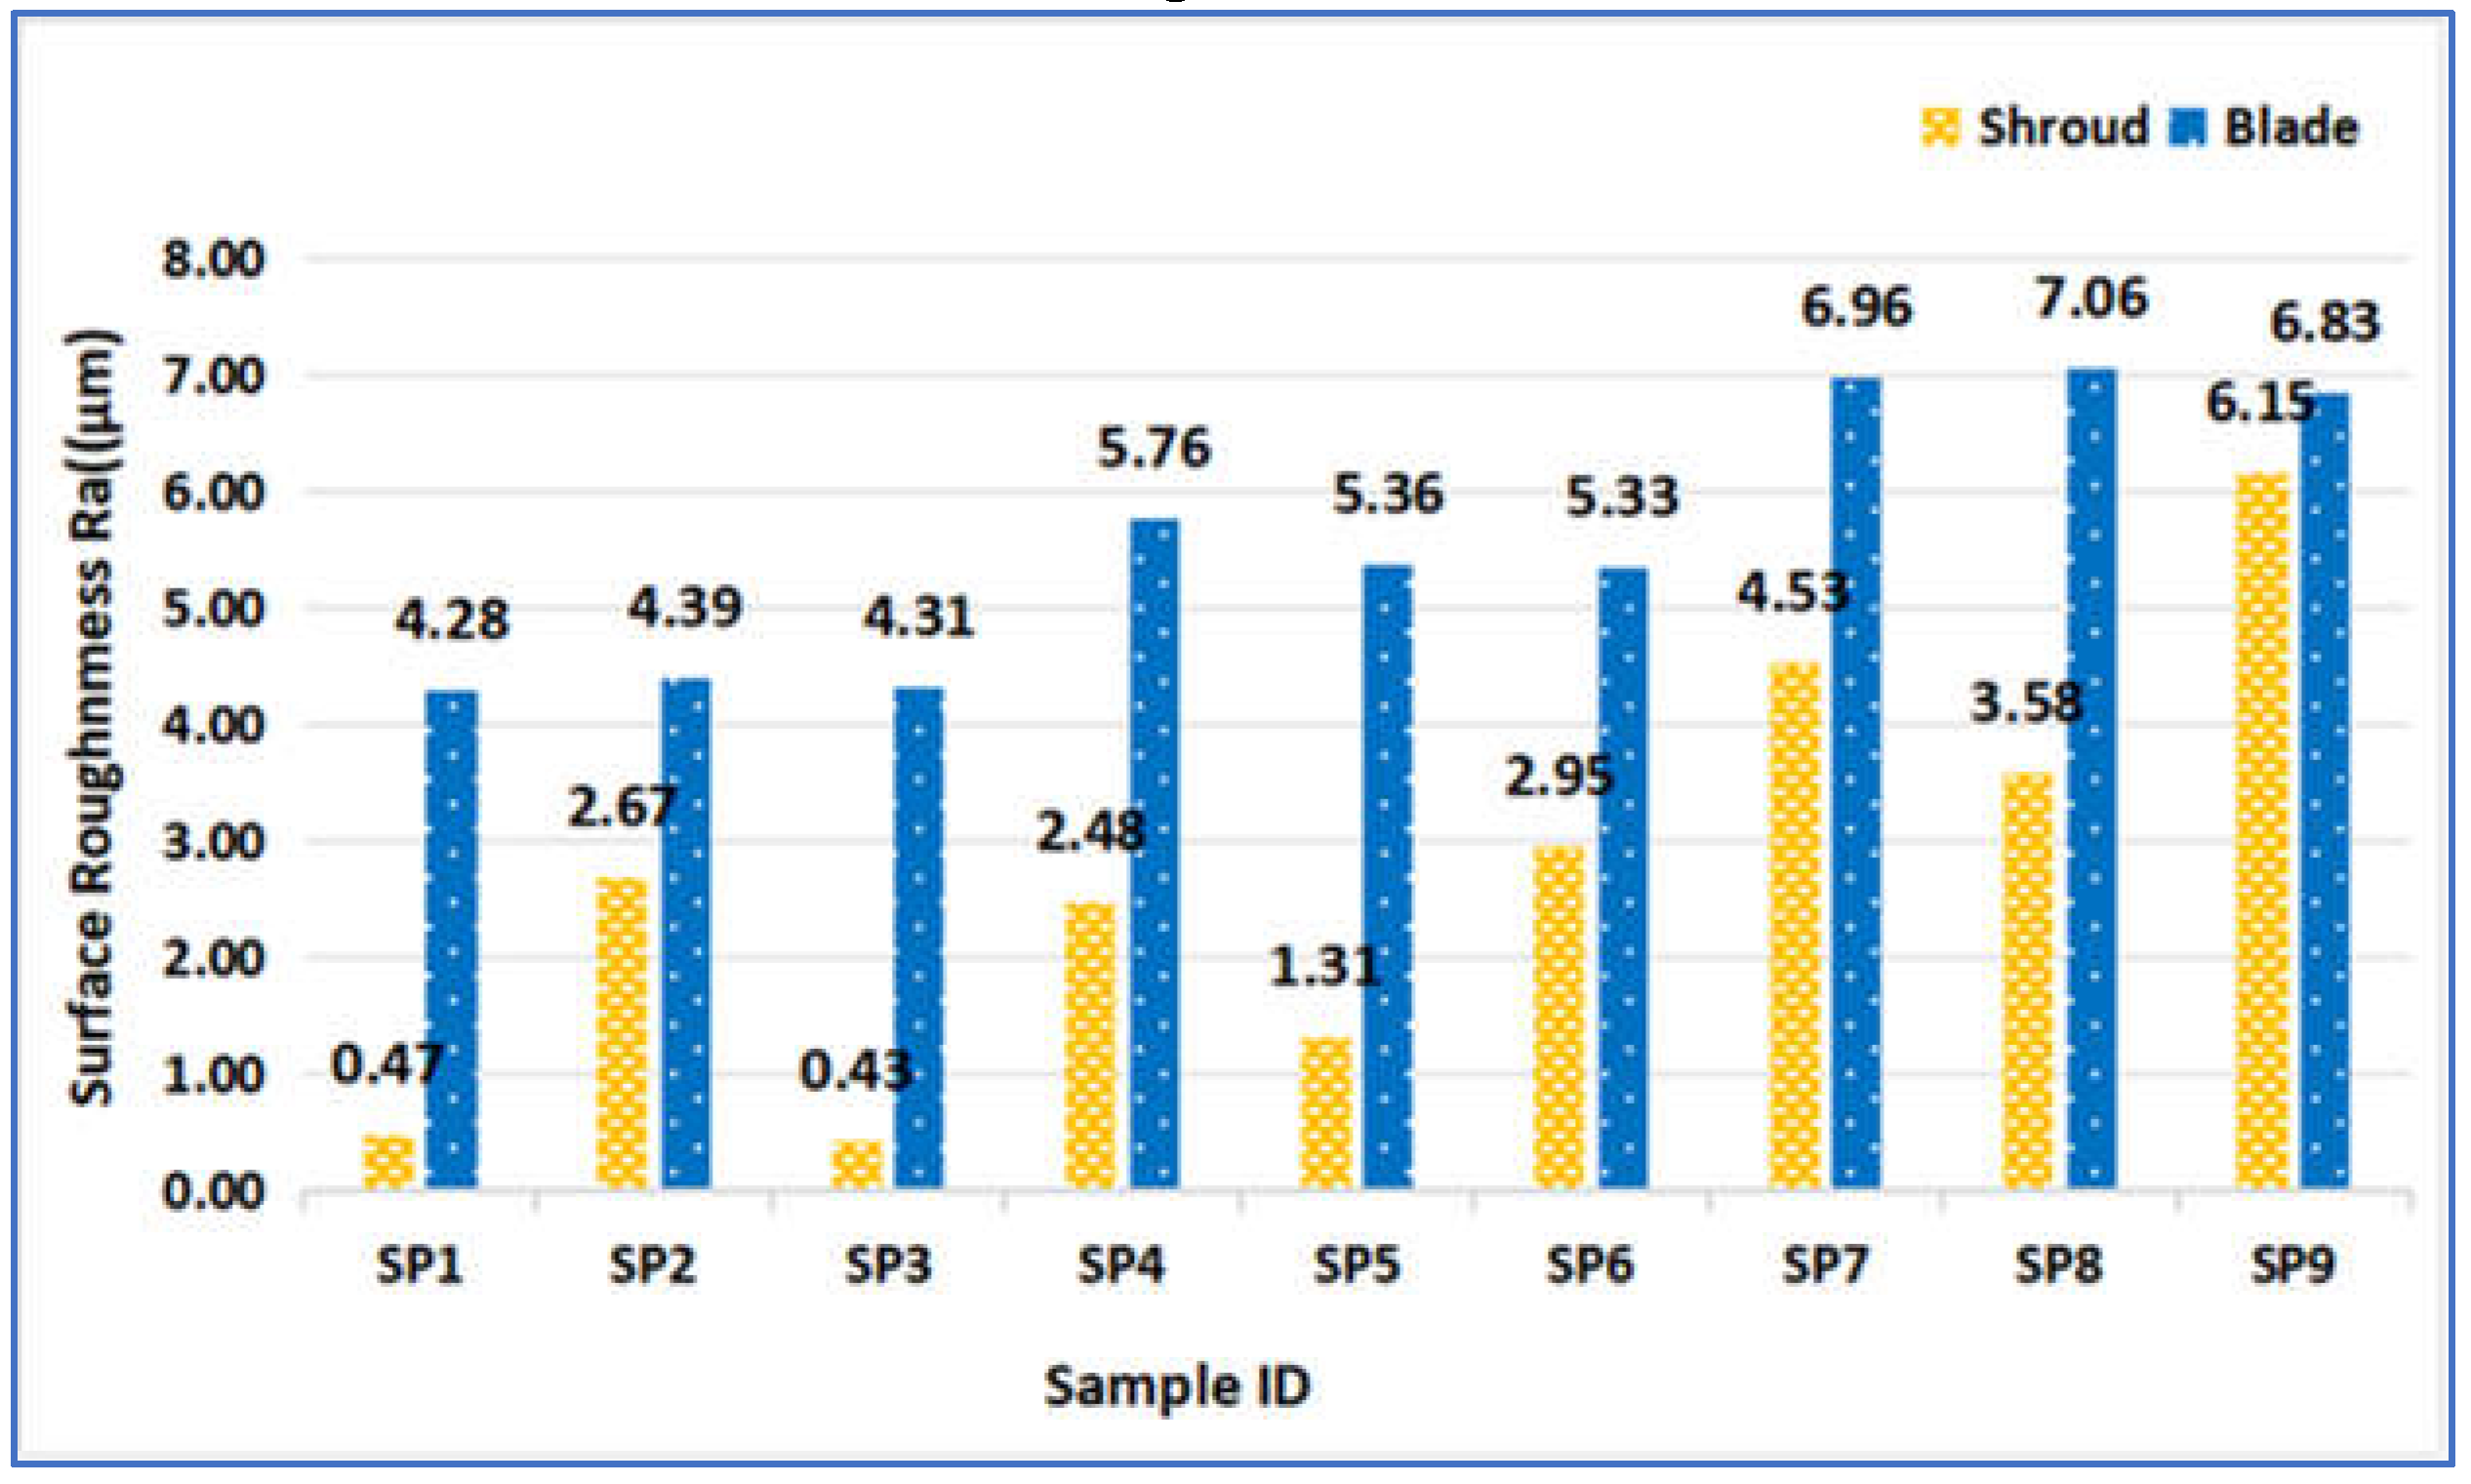
Figure 12.
Print orientation of an Impeller
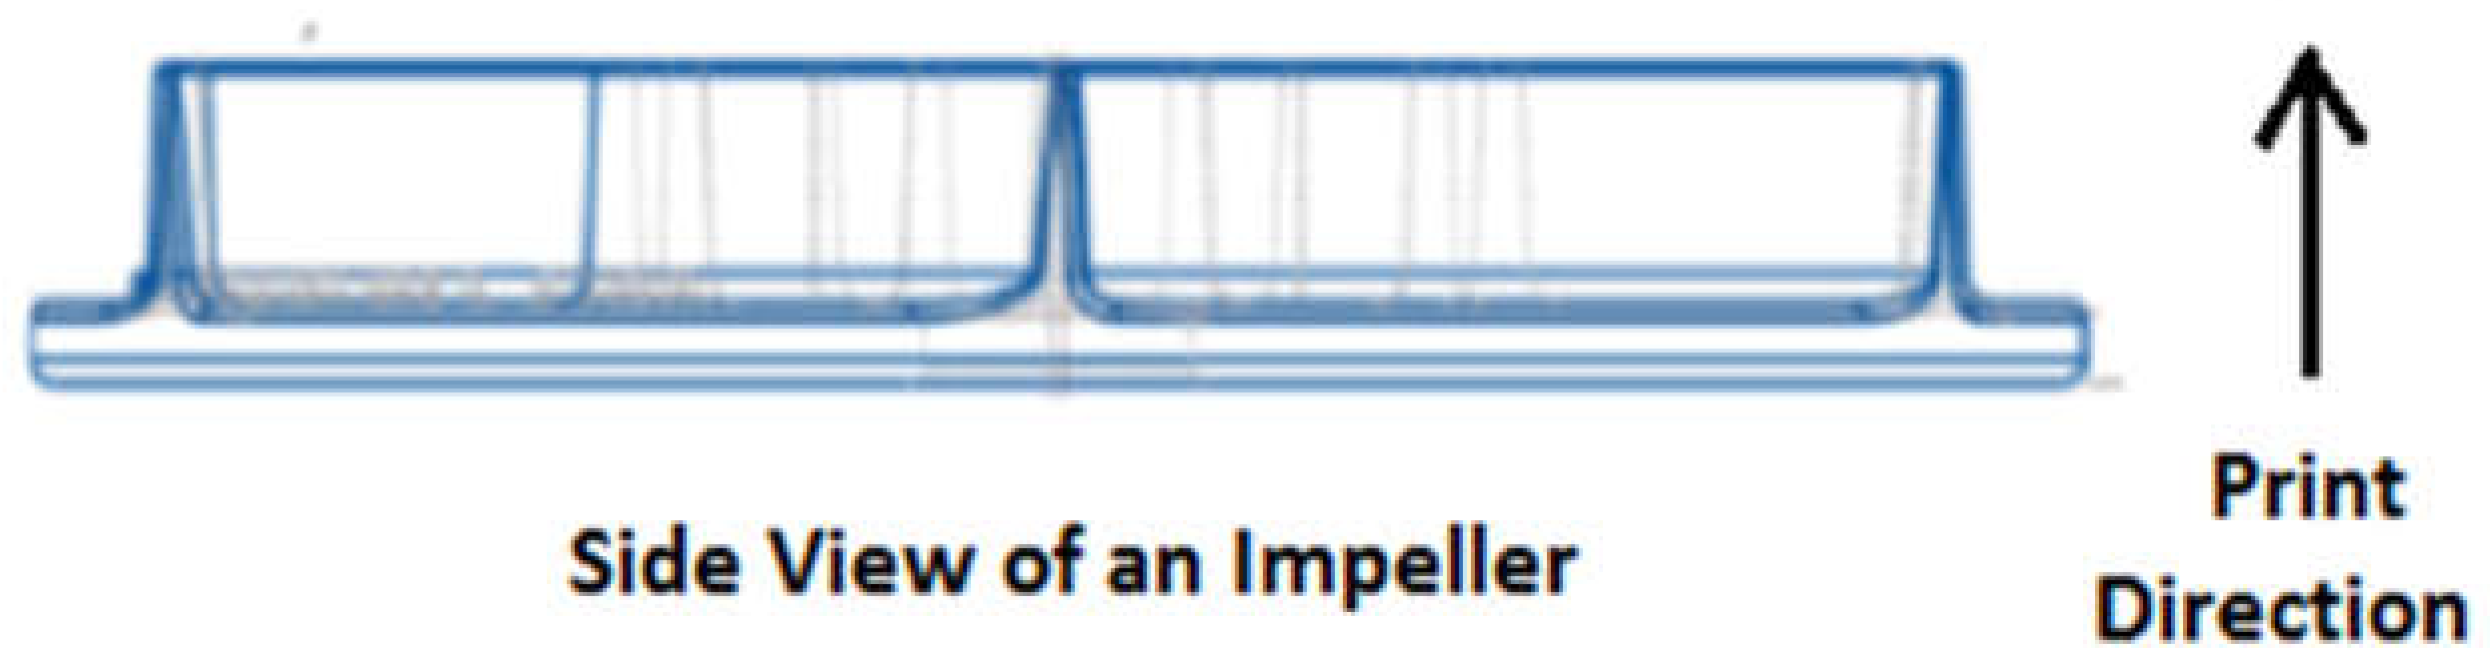
Figure 13.
(a) Surface roughness measurement locations (b) Measurement direction.
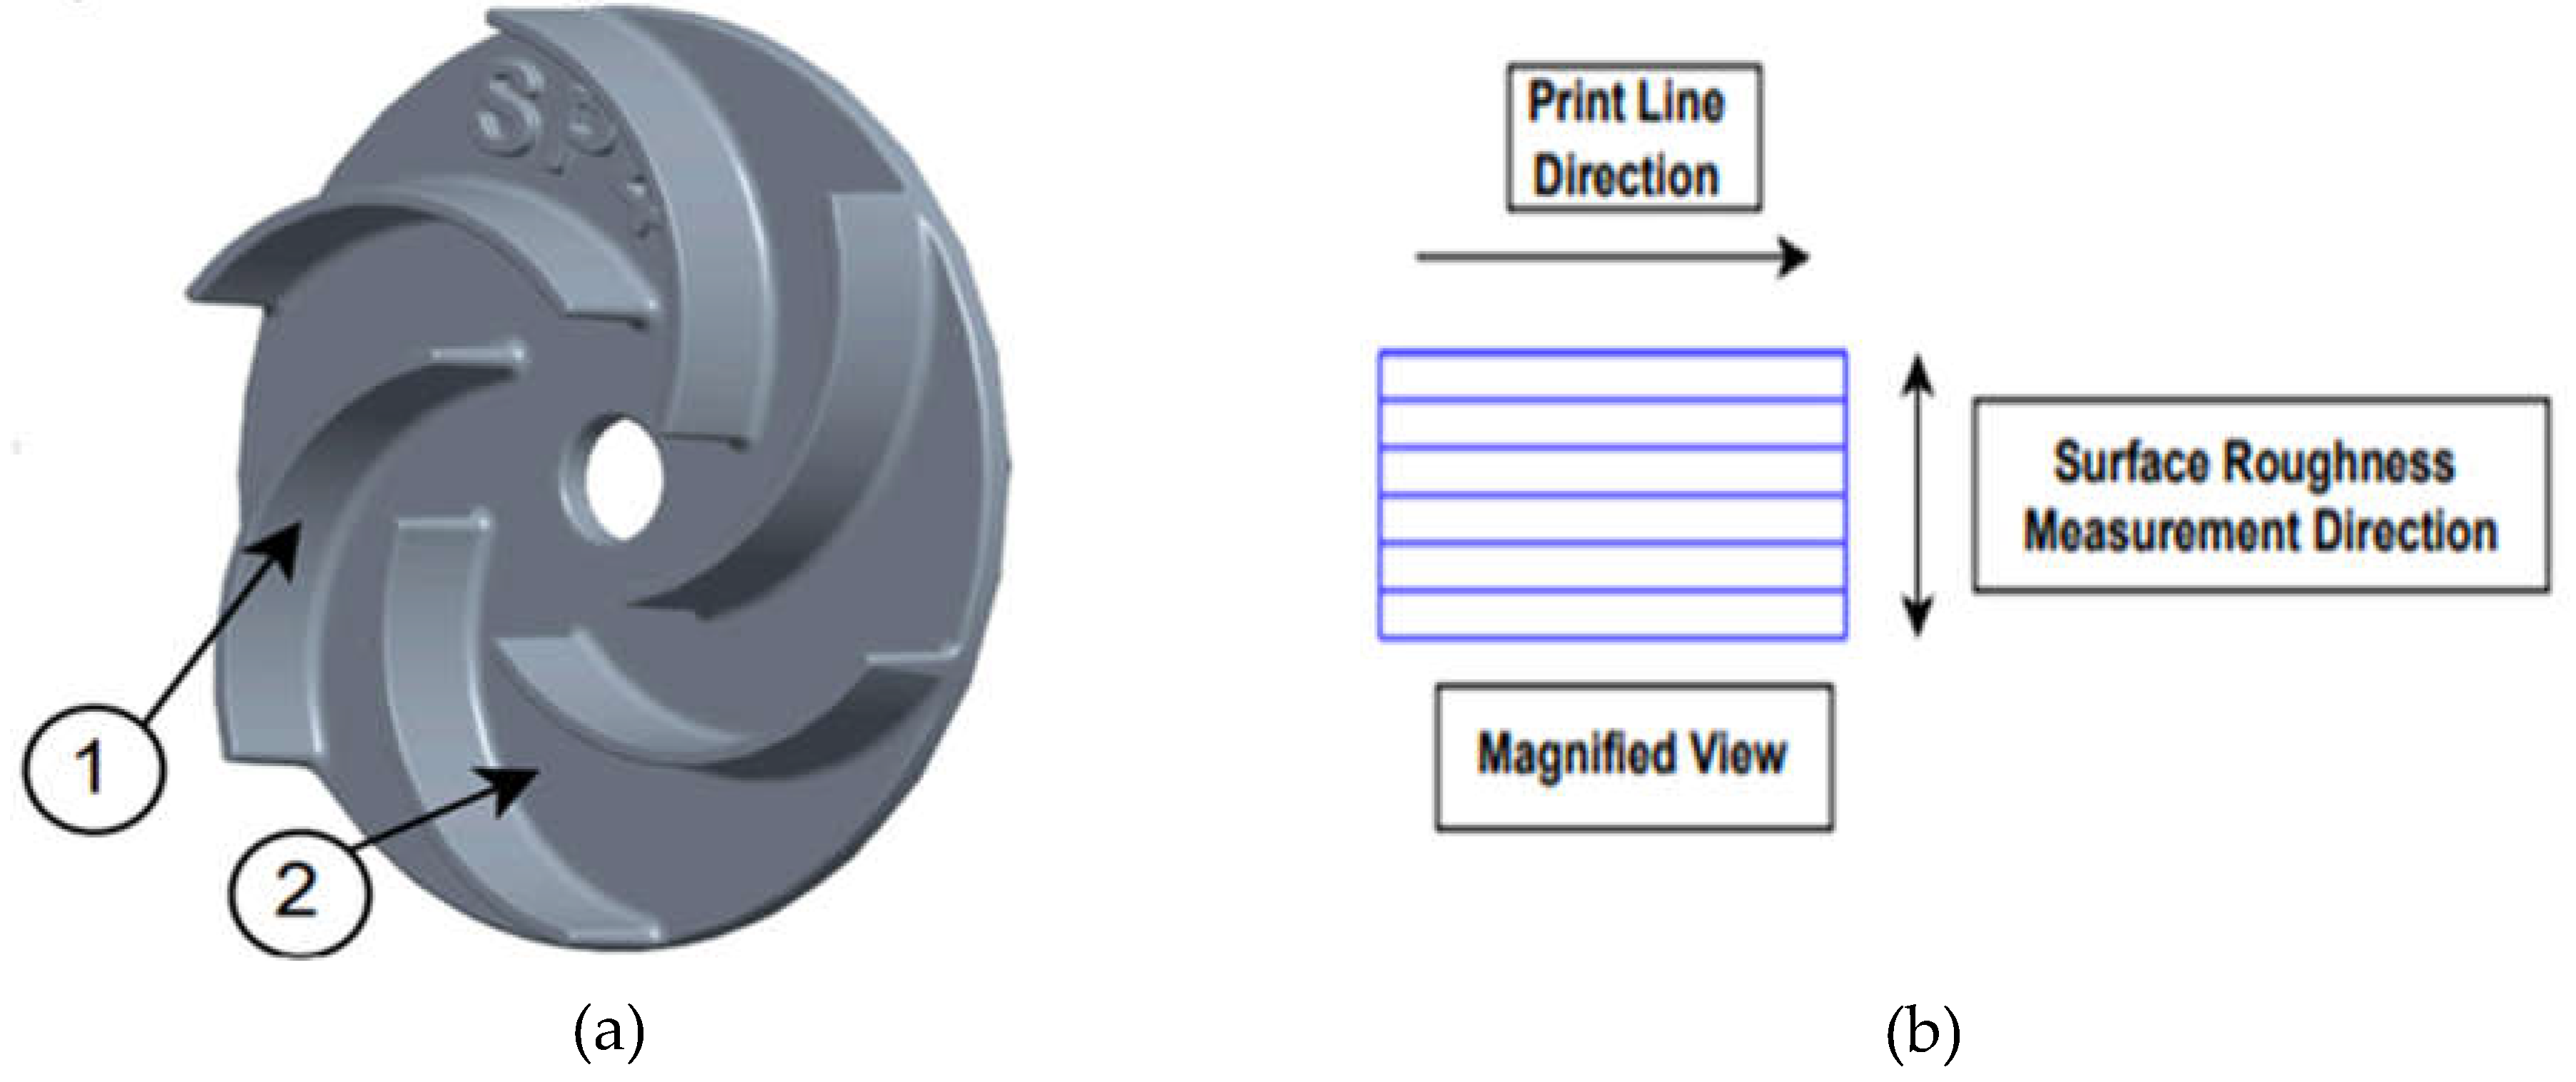
If the measurement direction is kept at 90° to the print line, it provides the best representation of the Ra value compared to all other angles [38]. Therefore, in this work, the measurement direction is kept perpendicular to the print lines for both the blade and shroud surfaces. Figure 13(b) shows a magnified view of the print line and the measurement direction.
3.2.1. Investigation of Shroud Surface Quality
Figure 11 shows an overall increase in the R_a value as we move from sample SP1 to SP9. According to Table 6, the layer thickness is 0.08 mm, 0.12 mm, and 0.16 mm for samples SP1 to SP3, SP4 to SP6, and SP7 to SP9, respectively. The behavior of R_a shows a significant effect of layer thickness on R_a. The average R_a is lowest for samples SP1-SP3 and highest for samples SP7-SP9. This indicates that R_a is directly proportional to layer thickness, such that as the layer thickness increases from 0.08 mm to 0.16 mm, R_a also increases from 0.47 µm to 6.15 µm.
During FDM printing, the print line width varies with changes in process parameters, predominantly layer thickness, printing speed, and extrusion speed. The print line width is important because it indirectly influences the quality of FDM-printed parts. The print speed refers to the speed at which the nozzle or extruder moves in the XY plane, while extrusion speed refers to the rate at which material is extruded from the nozzle. Line width is the width of the filament coming out of the nozzle during printing. Figure 14 shows a schematic representation of layer thickness and line width. During experimentation, when layer thickness is changed while print speed and extrusion speed are kept constant, line width varies with respect to layer thickness. Typically, line width is calculated automatically by the slicing software based on the other parameter values. As layer thickness increases, the line width also changes accordingly [39]. Figure 15 illustrates the change in line width with respect to layer thickness. As layer thickness decreases, line width increases to maintain a constant material flow from the extruder. Consequently, when layer thickness is reduced, gaps between the print lines decrease, and/or overlap increases. Figure 16 shows a schematic representation of the sectional view of the print line for two different layer thicknesses.
Figure 14.
Schematic sectional view of filament extrusion.
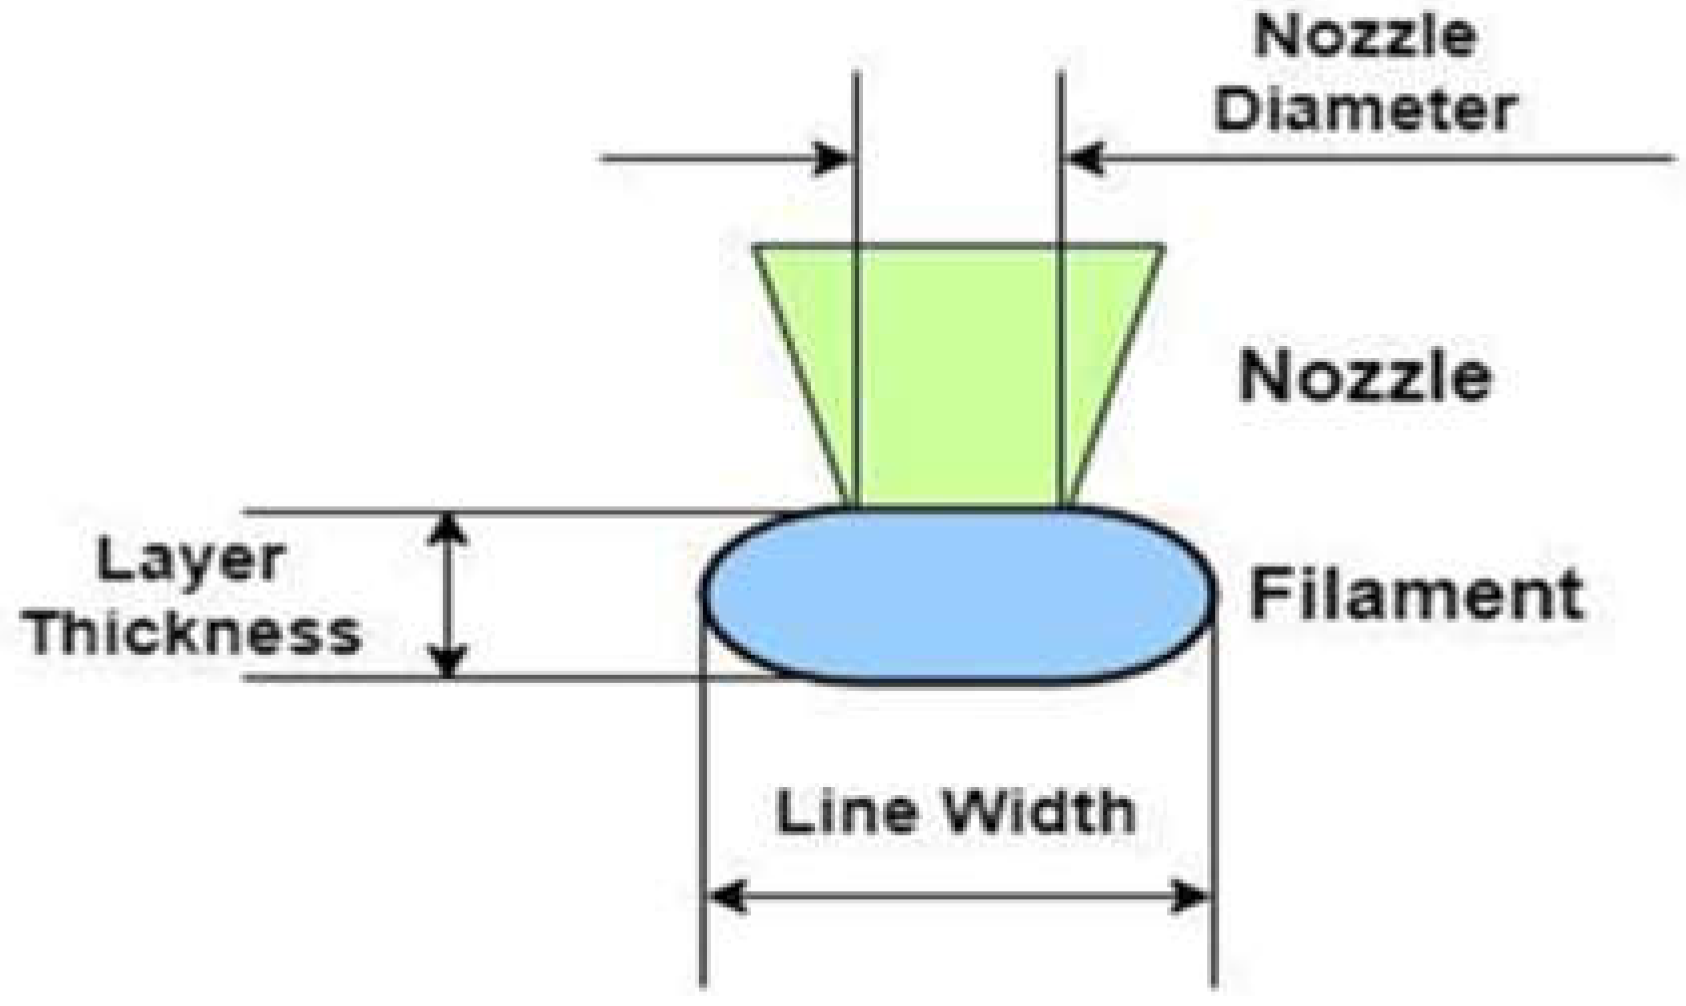
Figure 15.
Change in line width w.r.t layer thickness.
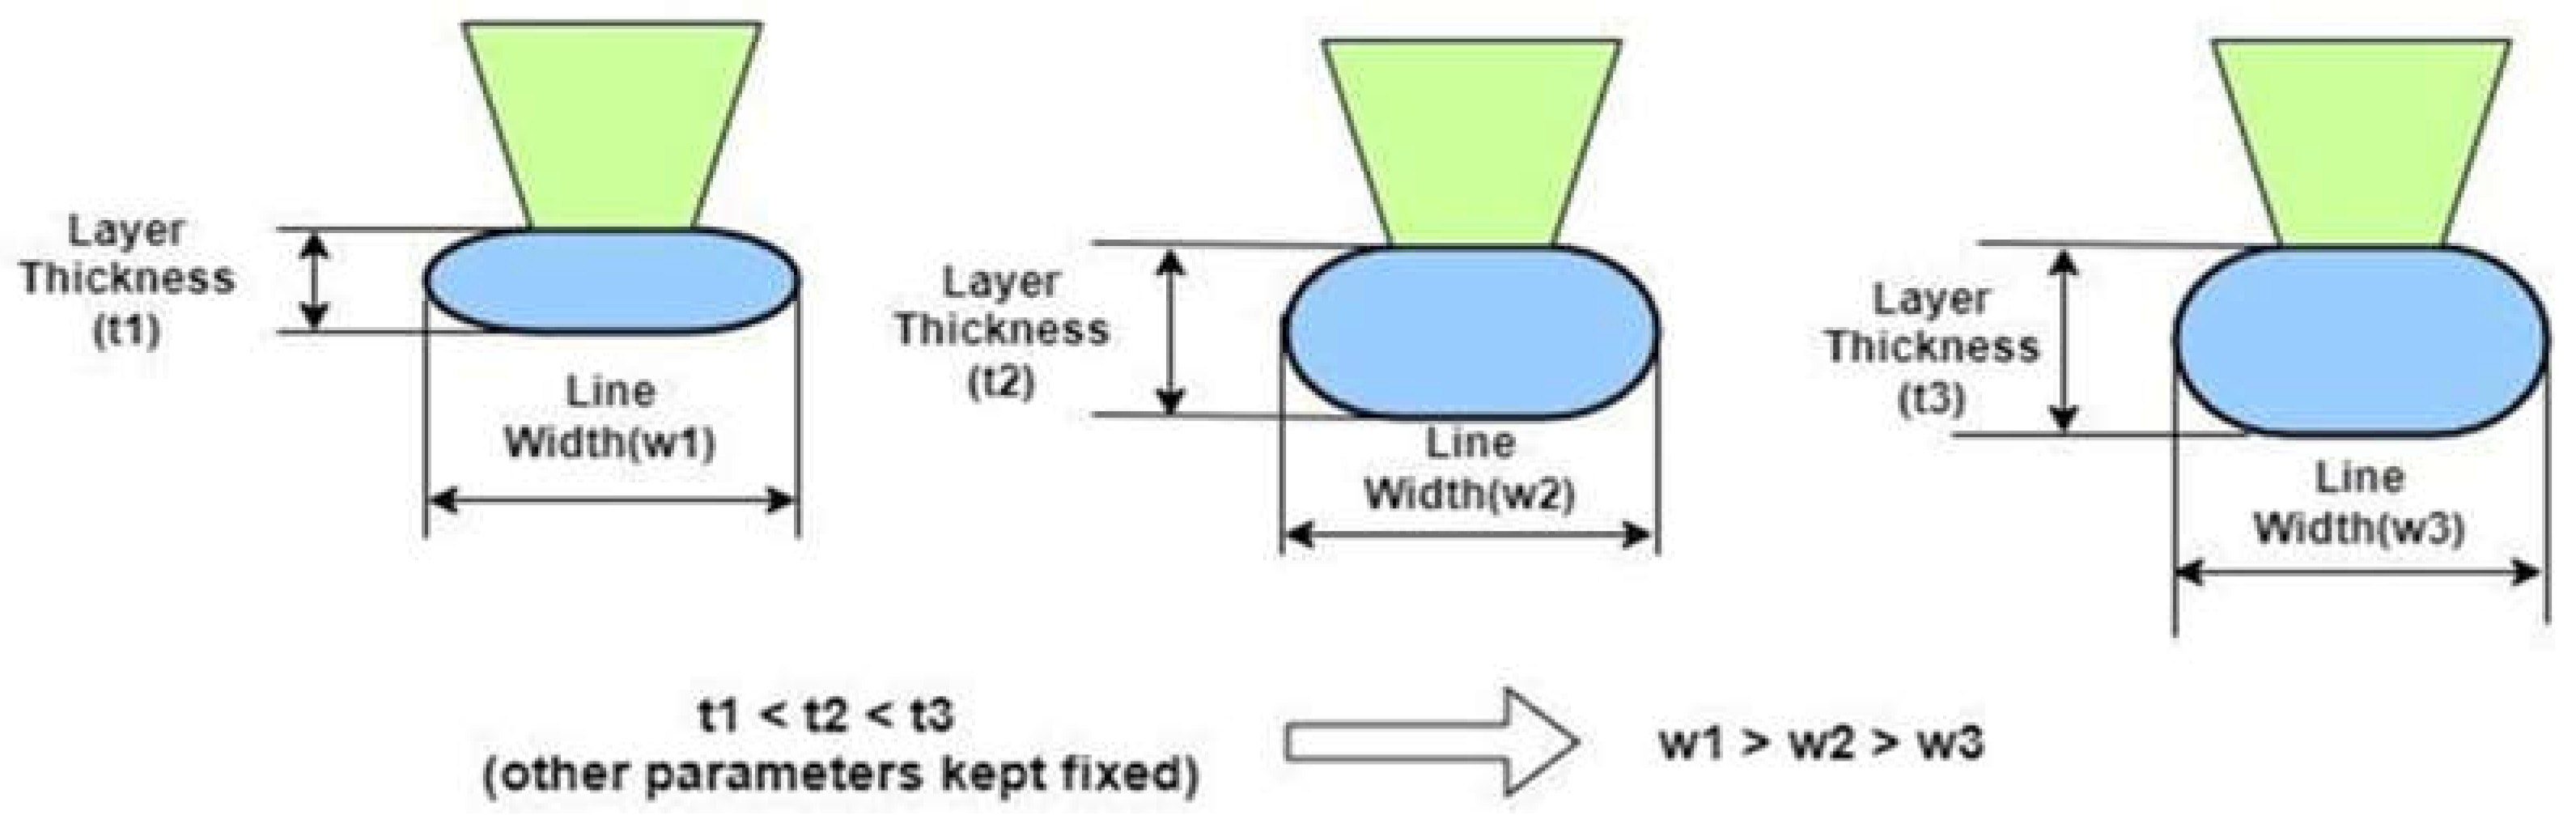
Figure 16.
Schematic representation of sectional view of print line for layer thickness. (a) 0.08mm (b) 0.16mm
Figure 16.
Schematic representation of sectional view of print line for layer thickness. (a) 0.08mm (b) 0.16mm
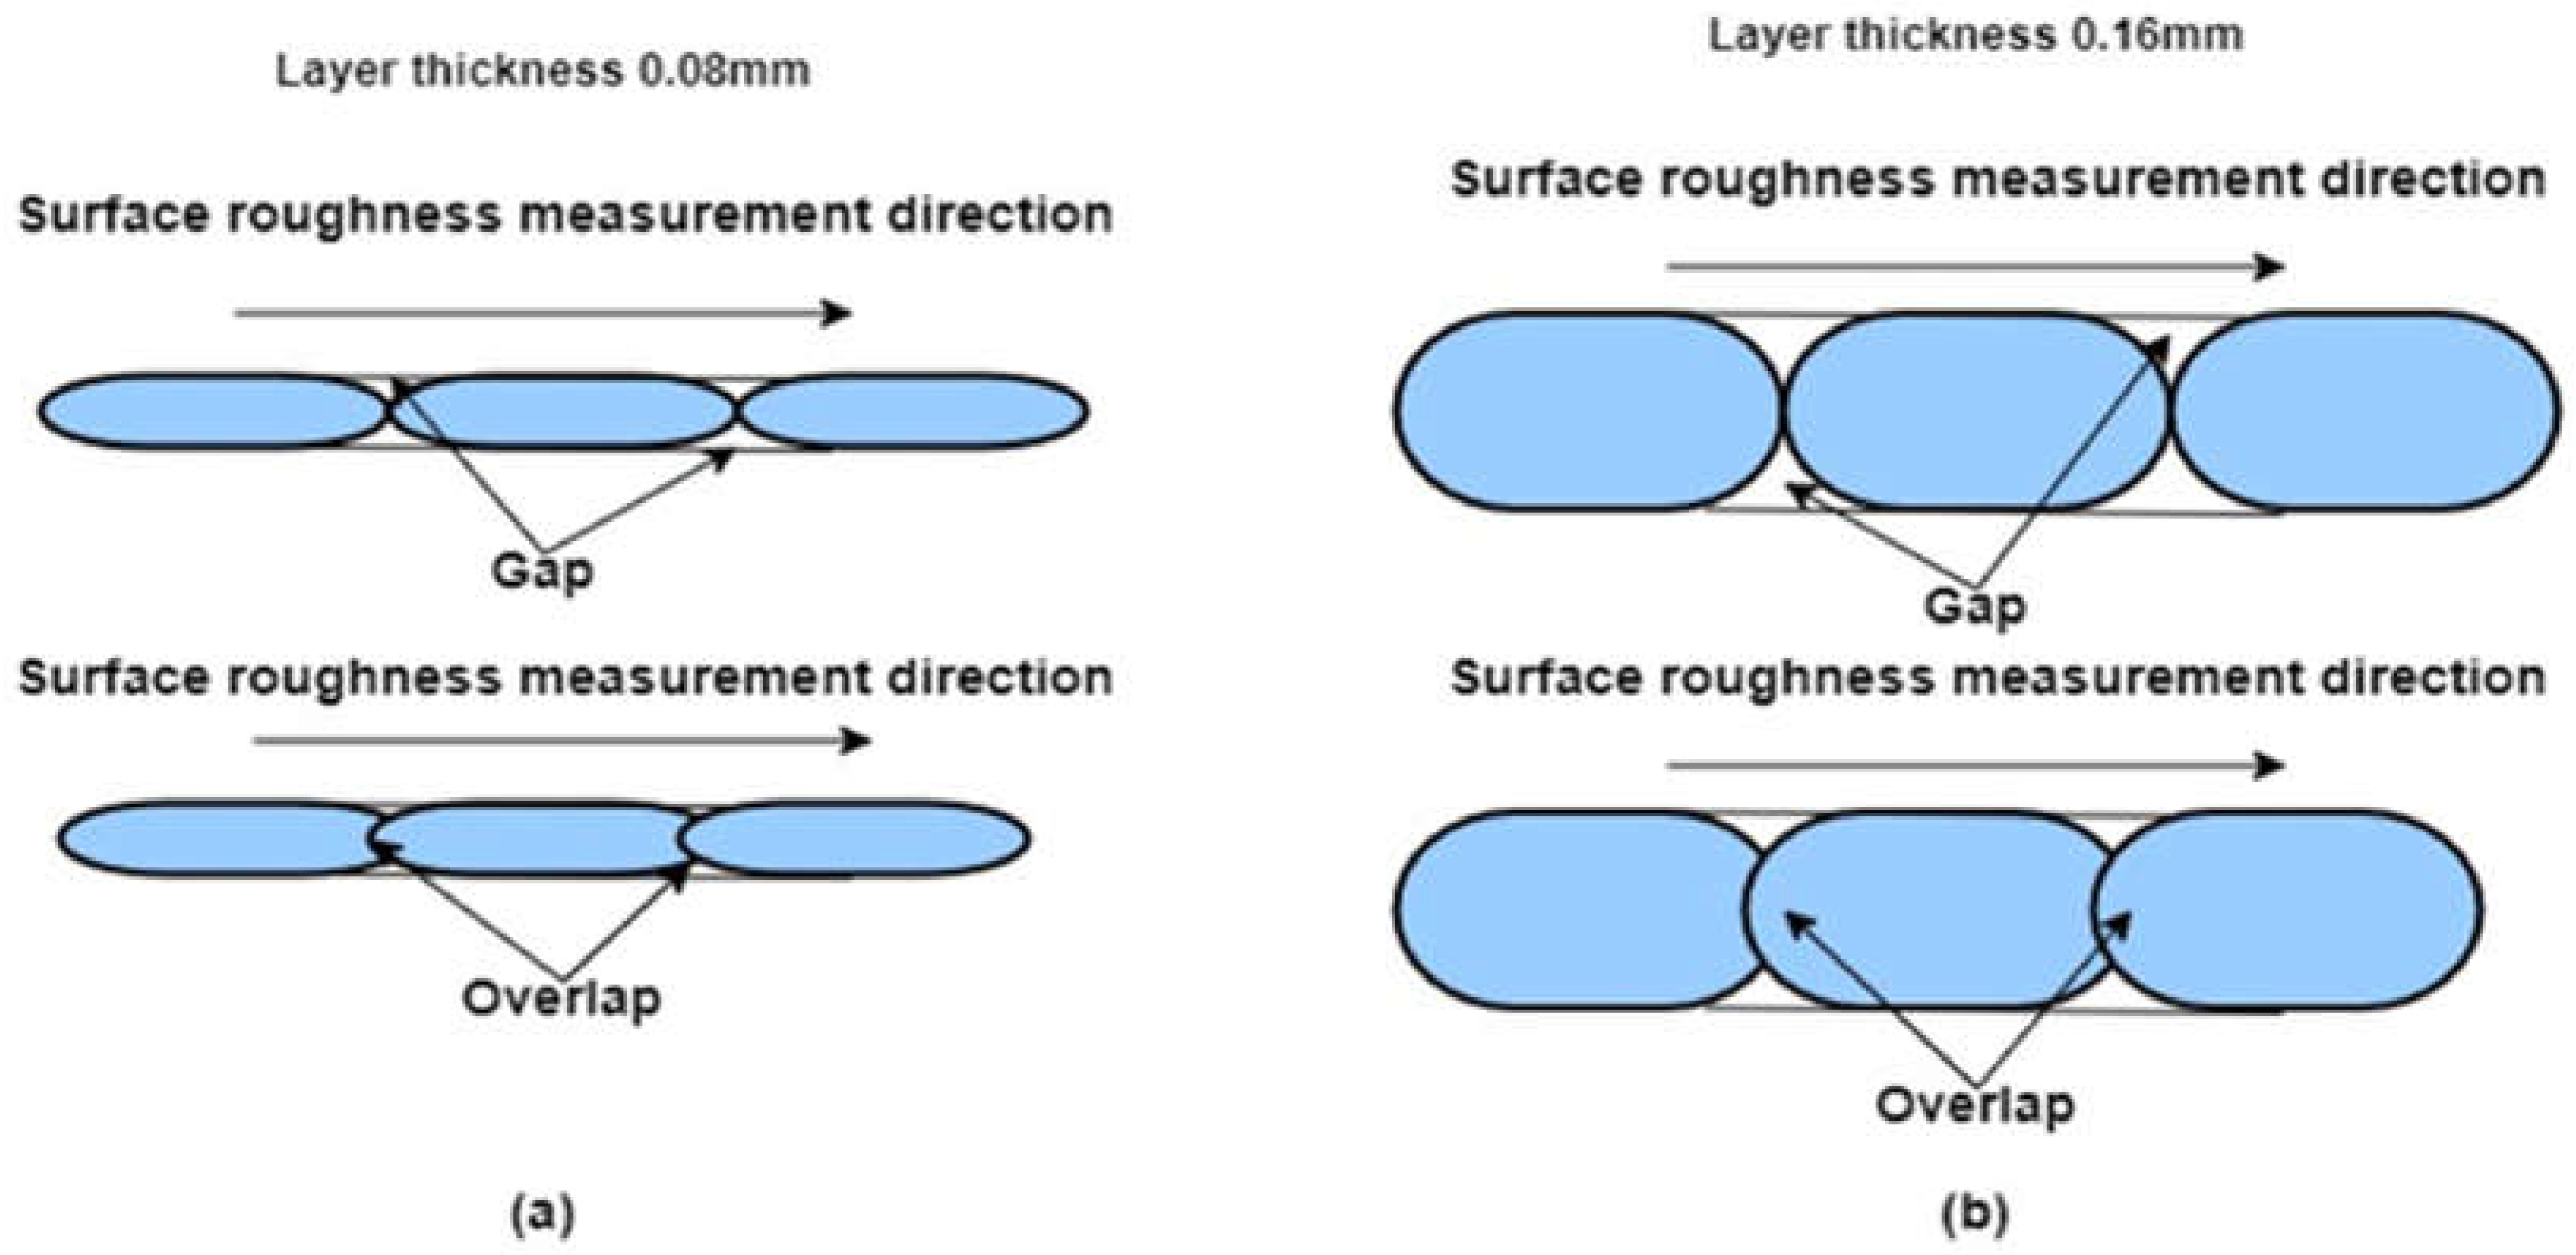
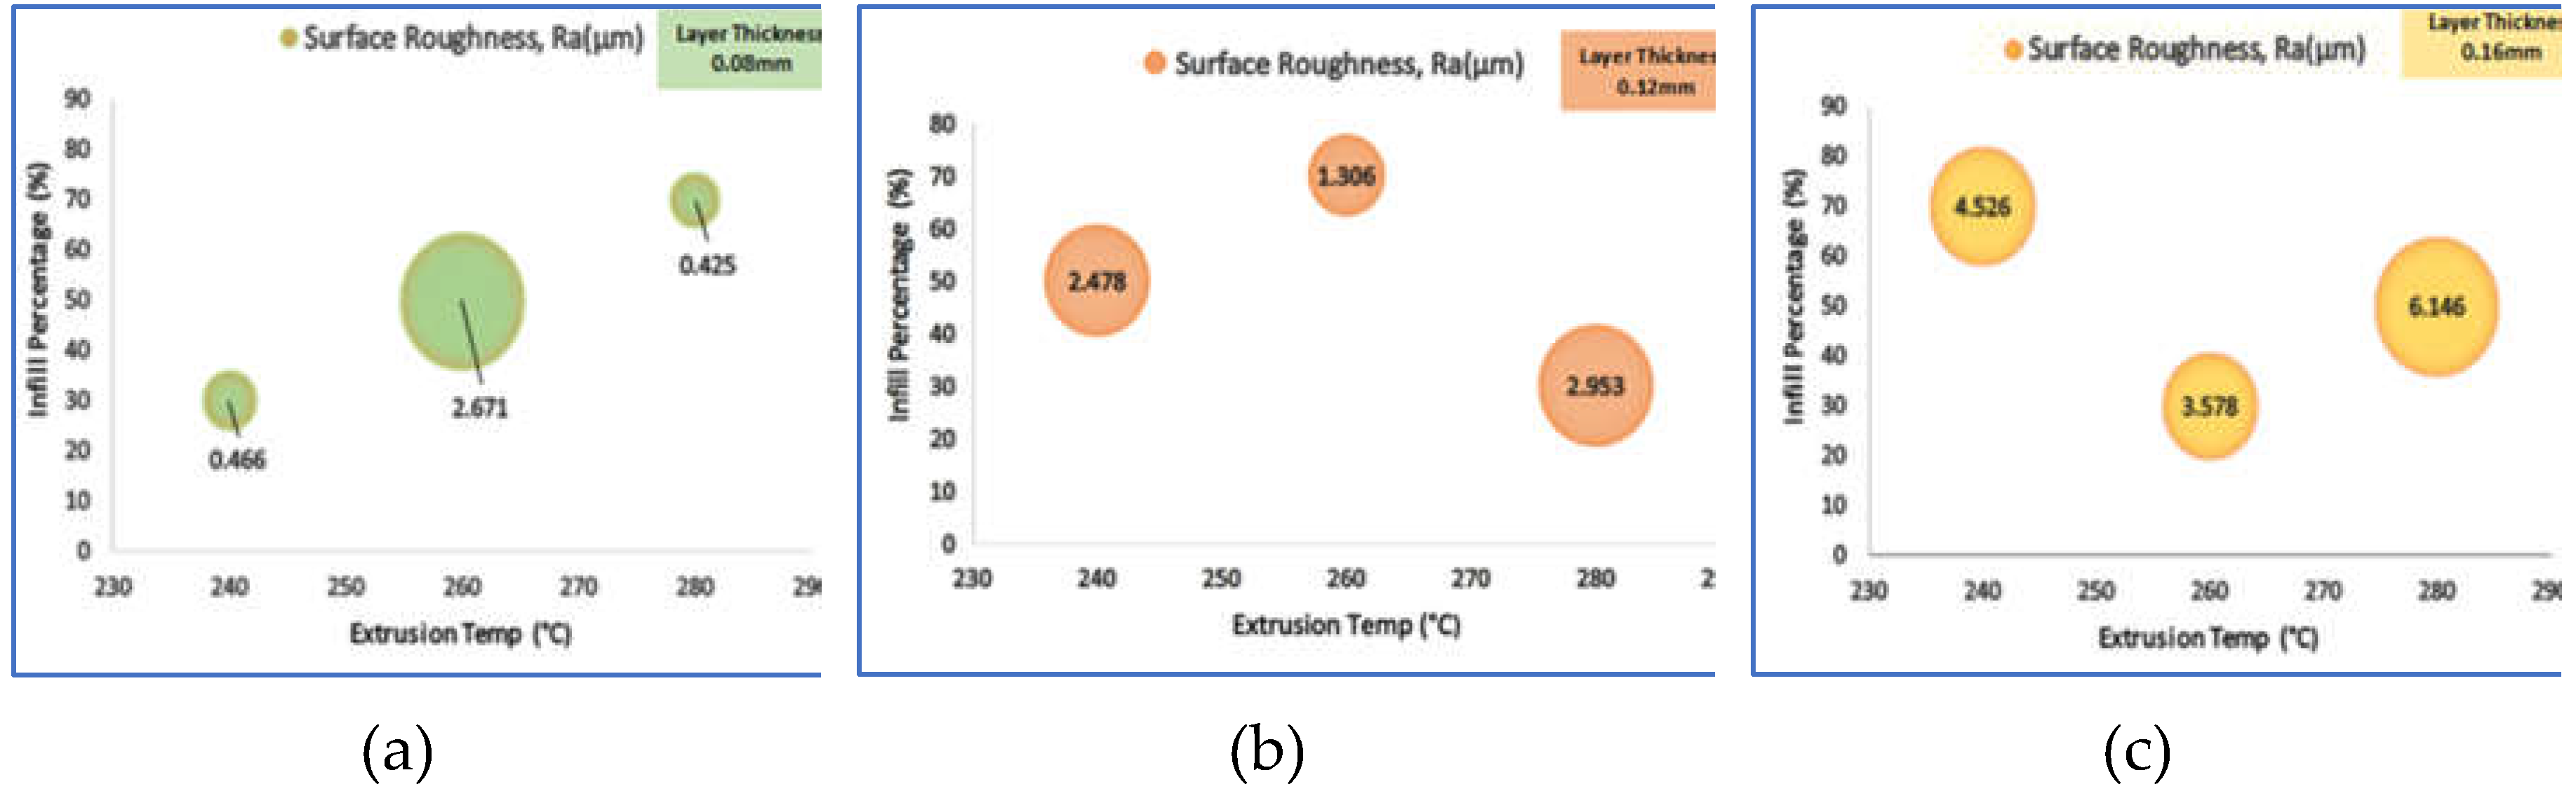
Figure 17.
Bubble plot for surface roughness at shroud surface with layer thickness (a) 0.08mm (b) 0.12mm (c) 0.16mm.
Figure 17.
Bubble plot for surface roughness at shroud surface with layer thickness (a) 0.08mm (b) 0.12mm (c) 0.16mm.
This gap between print lines is very small for a 0.08 mm layer thickness and will be partially or fully filled during the solidification of the filament material. This results in a smooth surface quality of the surface parallel to the XY plane, which is not the case for a 0.16 mm layer thickness due to the larger gap, as shown in Figures 16(a) and (b). The surface roughness Ra measurement direction is shown in Figure 16. In the case of surfaces manufactured with a 0.08 mm layer thickness, the Ra value will be lower compared to surfaces manufactured with a 0.16 mm layer thickness due to the presence of smaller gaps between print lines, as discussed. Similar results have been obtained and presented by researchers in the past [12,38,40].
Figure 17(a) shows the Ra value at the shroud surface of samples SP1, SP2, and SP3, printed with a constant layer thickness of 0.08 mm. As seen in this figure, with an increase in extrusion temperature from 240°C to 260°C and infill density from 30% to 50%, the Ra value also increased from 0.466 µm to 2.671 µm. Further increasing the extrusion temperature and infill density, Ra decreased significantly and reached 0.425 µm. Therefore, with a 0.08 mm layer thickness, the minimum Ra was achieved with an extrusion temperature of 280°C and an infill density of 70%. Figure 17(b) shows the Ra value at the shroud surface of samples SP4, SP5, and SP6, printed with a constant layer thickness of 0.12 mm. As seen in this figure, with an increase in extrusion temperature from 240°C to 260°C and infill density from 50% to 70%, the Ra value decreased from 2.478 µm to 1.306 µm. Further increasing the extrusion temperature and decreasing the infill density, Ra increased significantly, reaching 2.953 µm. Thus, with a 0.12 mm layer thickness, the minimum Ra was achieved with an extrusion temperature of 260°C and an infill density of 70%. Figure 17(c) shows the Ra value at the shroud surface of samples SP7, SP8, and SP9, printed with a constant layer thickness of 0.16 mm. As seen in this figure, with an increase in extrusion temperature from 240°C to 260°C and a decrease in infill density from 70% to 30%, the Ra value decreased from 4.526 µm to 3.578 µm. Further increasing the extrusion temperature and infill density, Ra increased significantly, reaching 6.146 µm. Therefore, with a 0.16 mm layer thickness, the minimum Ra was achieved with an extrusion temperature of 260°C and an infill density of 30%. Higher temperatures (280°C – SP3, SP6, SP9) tend to increase roughness, possibly due to excessive material flow, which leads to surface irregularities.
To conclude, out of the total nine samples, the minimum Ra (0.425μm) was achieved in sample SP3, and the FDM printing parameters set was as follows: layer thickness 0.08mm, extrusion temperature 280°, and infill density 70%. On the other hand, the maximum Ra (6.146μm) was obtained in sample SP9, and the FDM printing parameters set was as follows: layer thickness of 0.16 mm, extrusion temperature of 280°C, and infill density of 50%. It is clear from Figure 17 that surface roughness increases with an increase in layer thickness and extrusion temperature. However, the individual influence of infill density on surface quality remains ambiguous, indicating the presence of an interaction effect between parameters on surface quality.
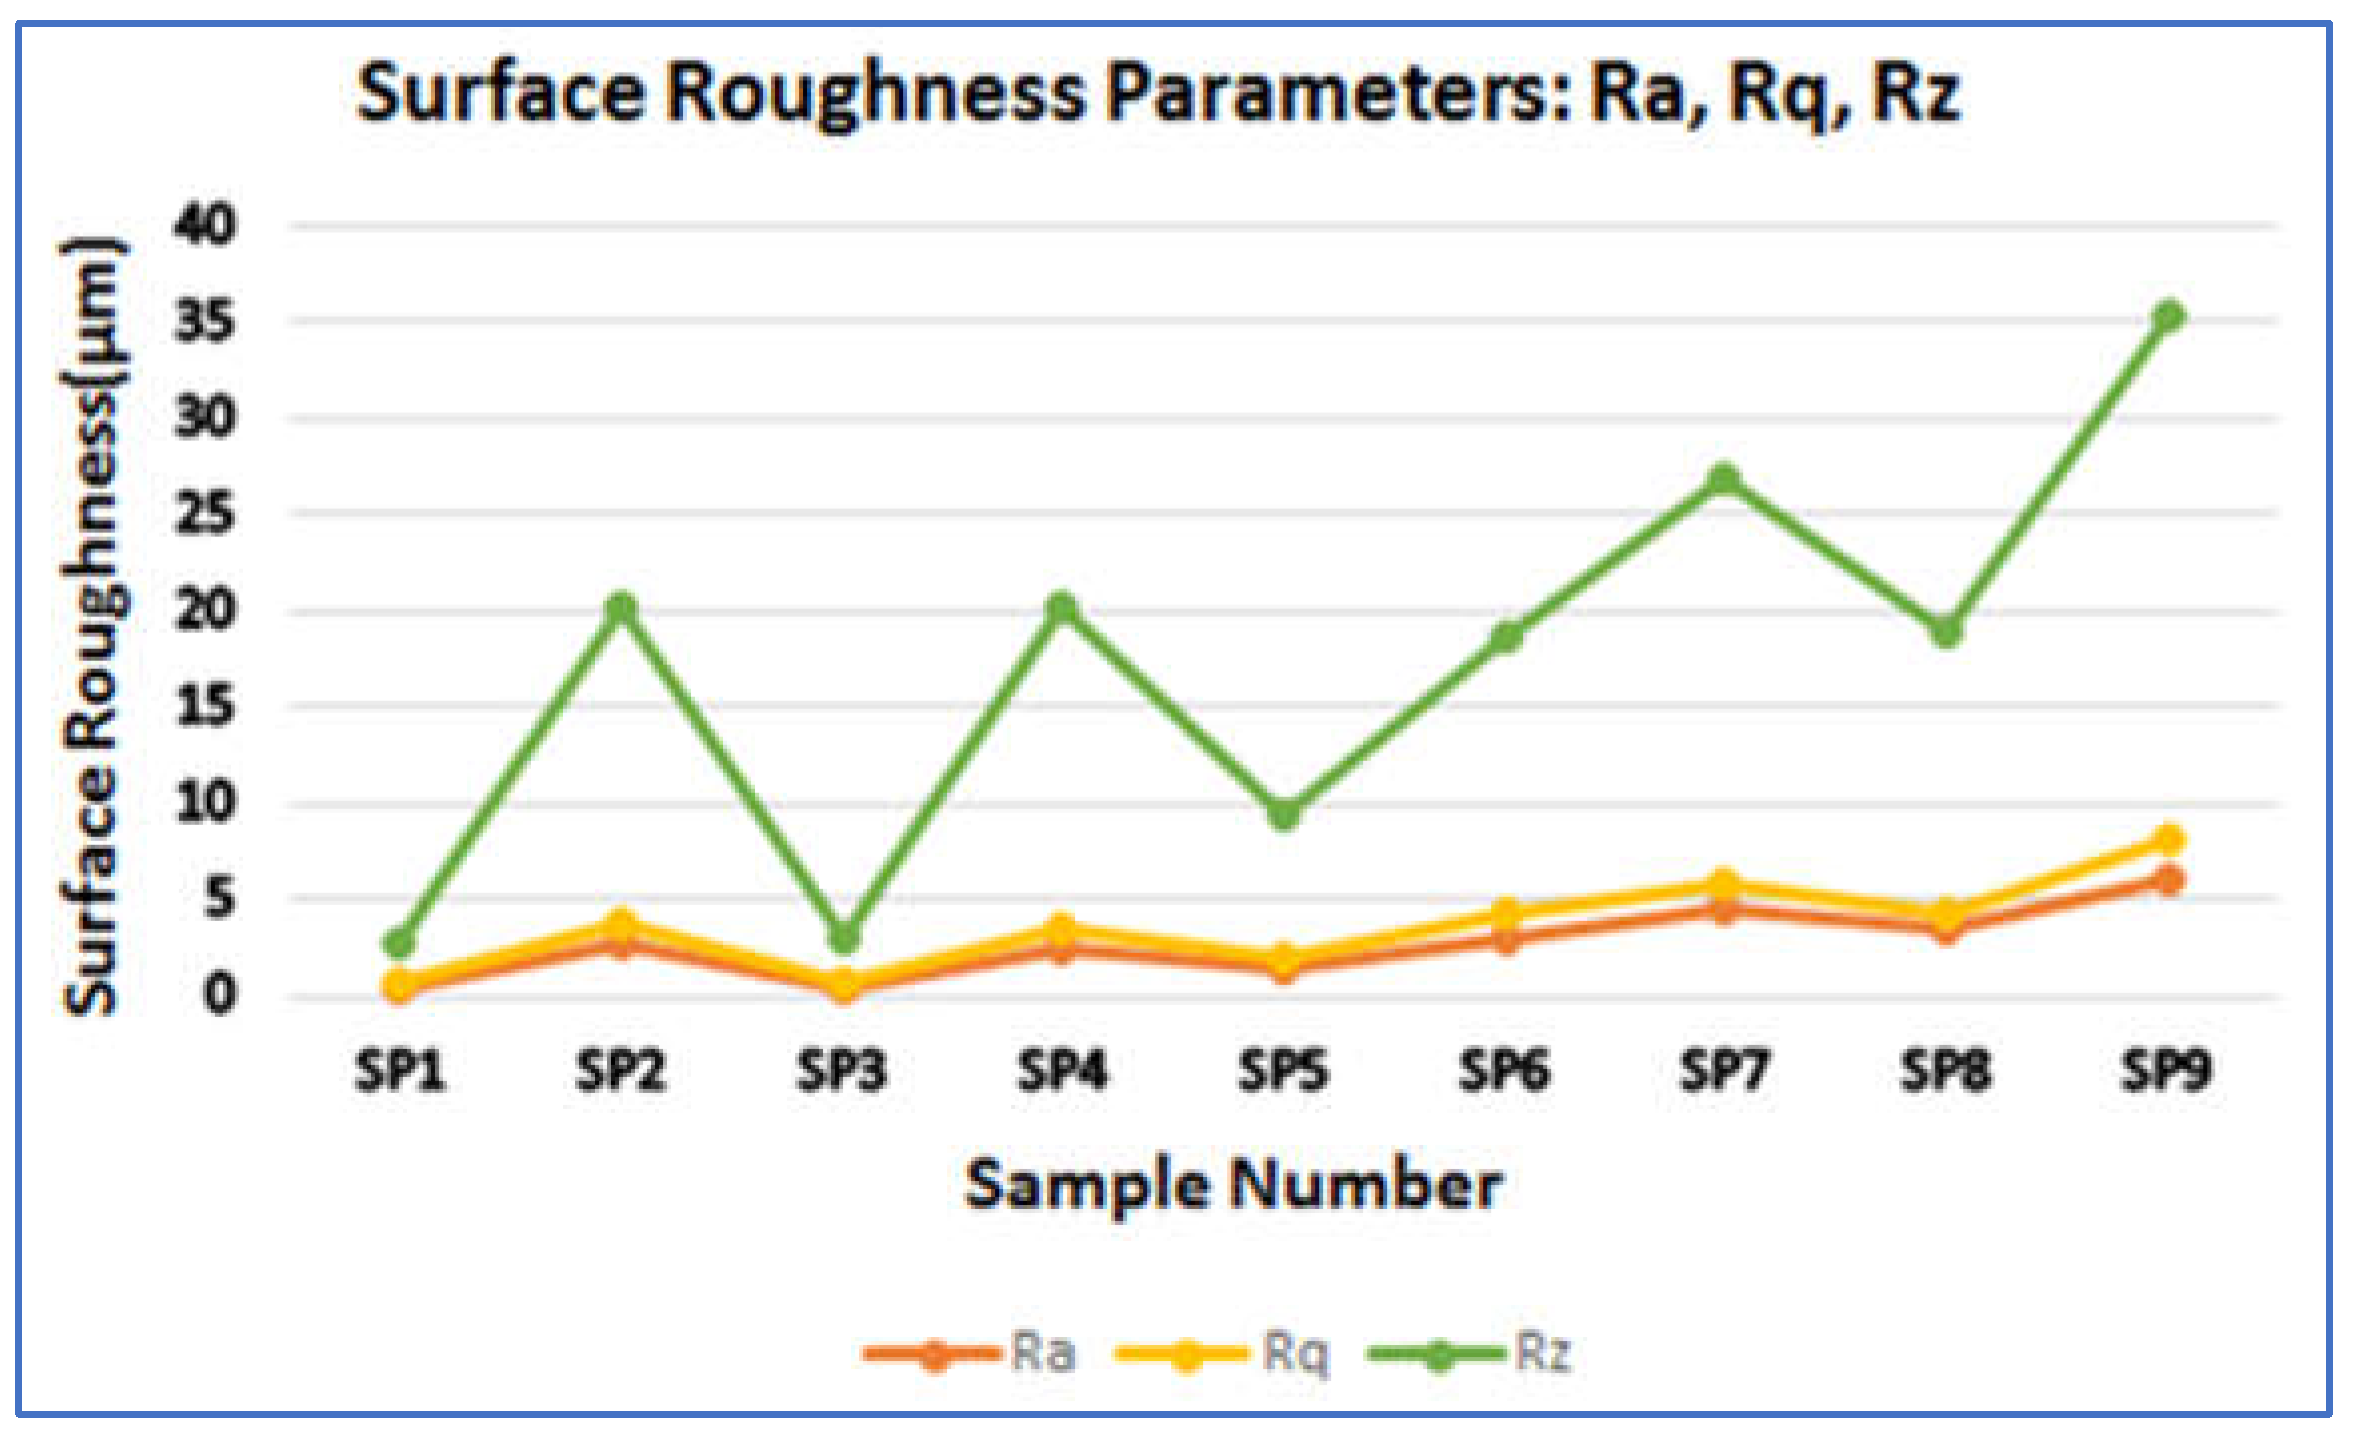
With reference to Figure 18, the surface roughness parameter Rq exhibits a similar behavior to Ra. However, Rq values are, on average, 34.35% higher than Ra values. Since Rq represents the square root of the mean of height squared from the mean line, it is more sensitive to high peaks and valleys compared to Ra. The fact that Rq > Ra indicates the presence of significant peaks and valleys on the shroud surface across all samples. The smallest difference between Rq and Ra (0.118 µm) is observed in sample SP1, suggesting that SP1 has fewer high peaks and valleys compared to the other samples. The maximum Rq value (8.101 µm) is obtained in sample SP9, while the minimum Rq value (0.584 µm) is recorded in sample SP1. Figure 18 also shows the variation of Rz across different samples. The maximum Rz value (35.396 µm) is observed in sample SP9, whereas the minimum Rz value (2.788 µm) is recorded in sample SP1. This analysis suggests that sample SP9 has the roughest surface texture, characterized by significant peaks and valleys, whereas sample SP1 has the smoothest surface among all samples.
Figure 18.
Surface roughness parameters of shroud surface: Ra, Rq, and Rz.
3.2.2. Investigation of Blade Surface Quality
Figure 11 shows an overall increase in the Ra value while moving from sample SP1 to SP9. As per Table 6, the layer thickness is 0.08 mm, 0.12 mm, and 0.16 mm for samples SP1 to SP3, SP4 to SP6, and SP7 to SP9, respectively. Ra's behavior indicates a significant effect of layer thickness on Ra. The average Ra is minimum for samples SP1 to SP3 and maximum for samples SP7 to SP9. This demonstrates that Ra is directly proportional to layer thickness, meaning that as the layer thickness increases from 0.08 mm to 0.16 mm, Ra also increases from 4.28 µm to 6.83 µm.
Figure 19 shows a schematic representation of the FDM print bed and a sectional view of the print filament. As illustrated in Figure 19 (a), (b), and (c), the gap between two successive filaments stacked on top of each other is smallest for a 0.08 mm layer thickness and largest for a 0.16 mm layer thickness. The Ra surface roughness measurement direction for the blade surface will be along the XZ/YZ plane, as shown in Figure 19, considering the print orientation presented in Figure 12.
For surfaces manufactured with a 0.08 mm layer thickness, the Ra value will be lower compared to surfaces manufactured with a 0.16 mm layer thickness due to the presence of smaller gaps between successive filaments. Similar results have been reported by previous researchers [12,38,40].
Figure 19.
Schematic representation: Sectional view of print filament for layer thickness (a) 0.08mm (b) 0.12mm (c) 0.16mm, and (d) FDM print bed.
Figure 19.
Schematic representation: Sectional view of print filament for layer thickness (a) 0.08mm (b) 0.12mm (c) 0.16mm, and (d) FDM print bed.
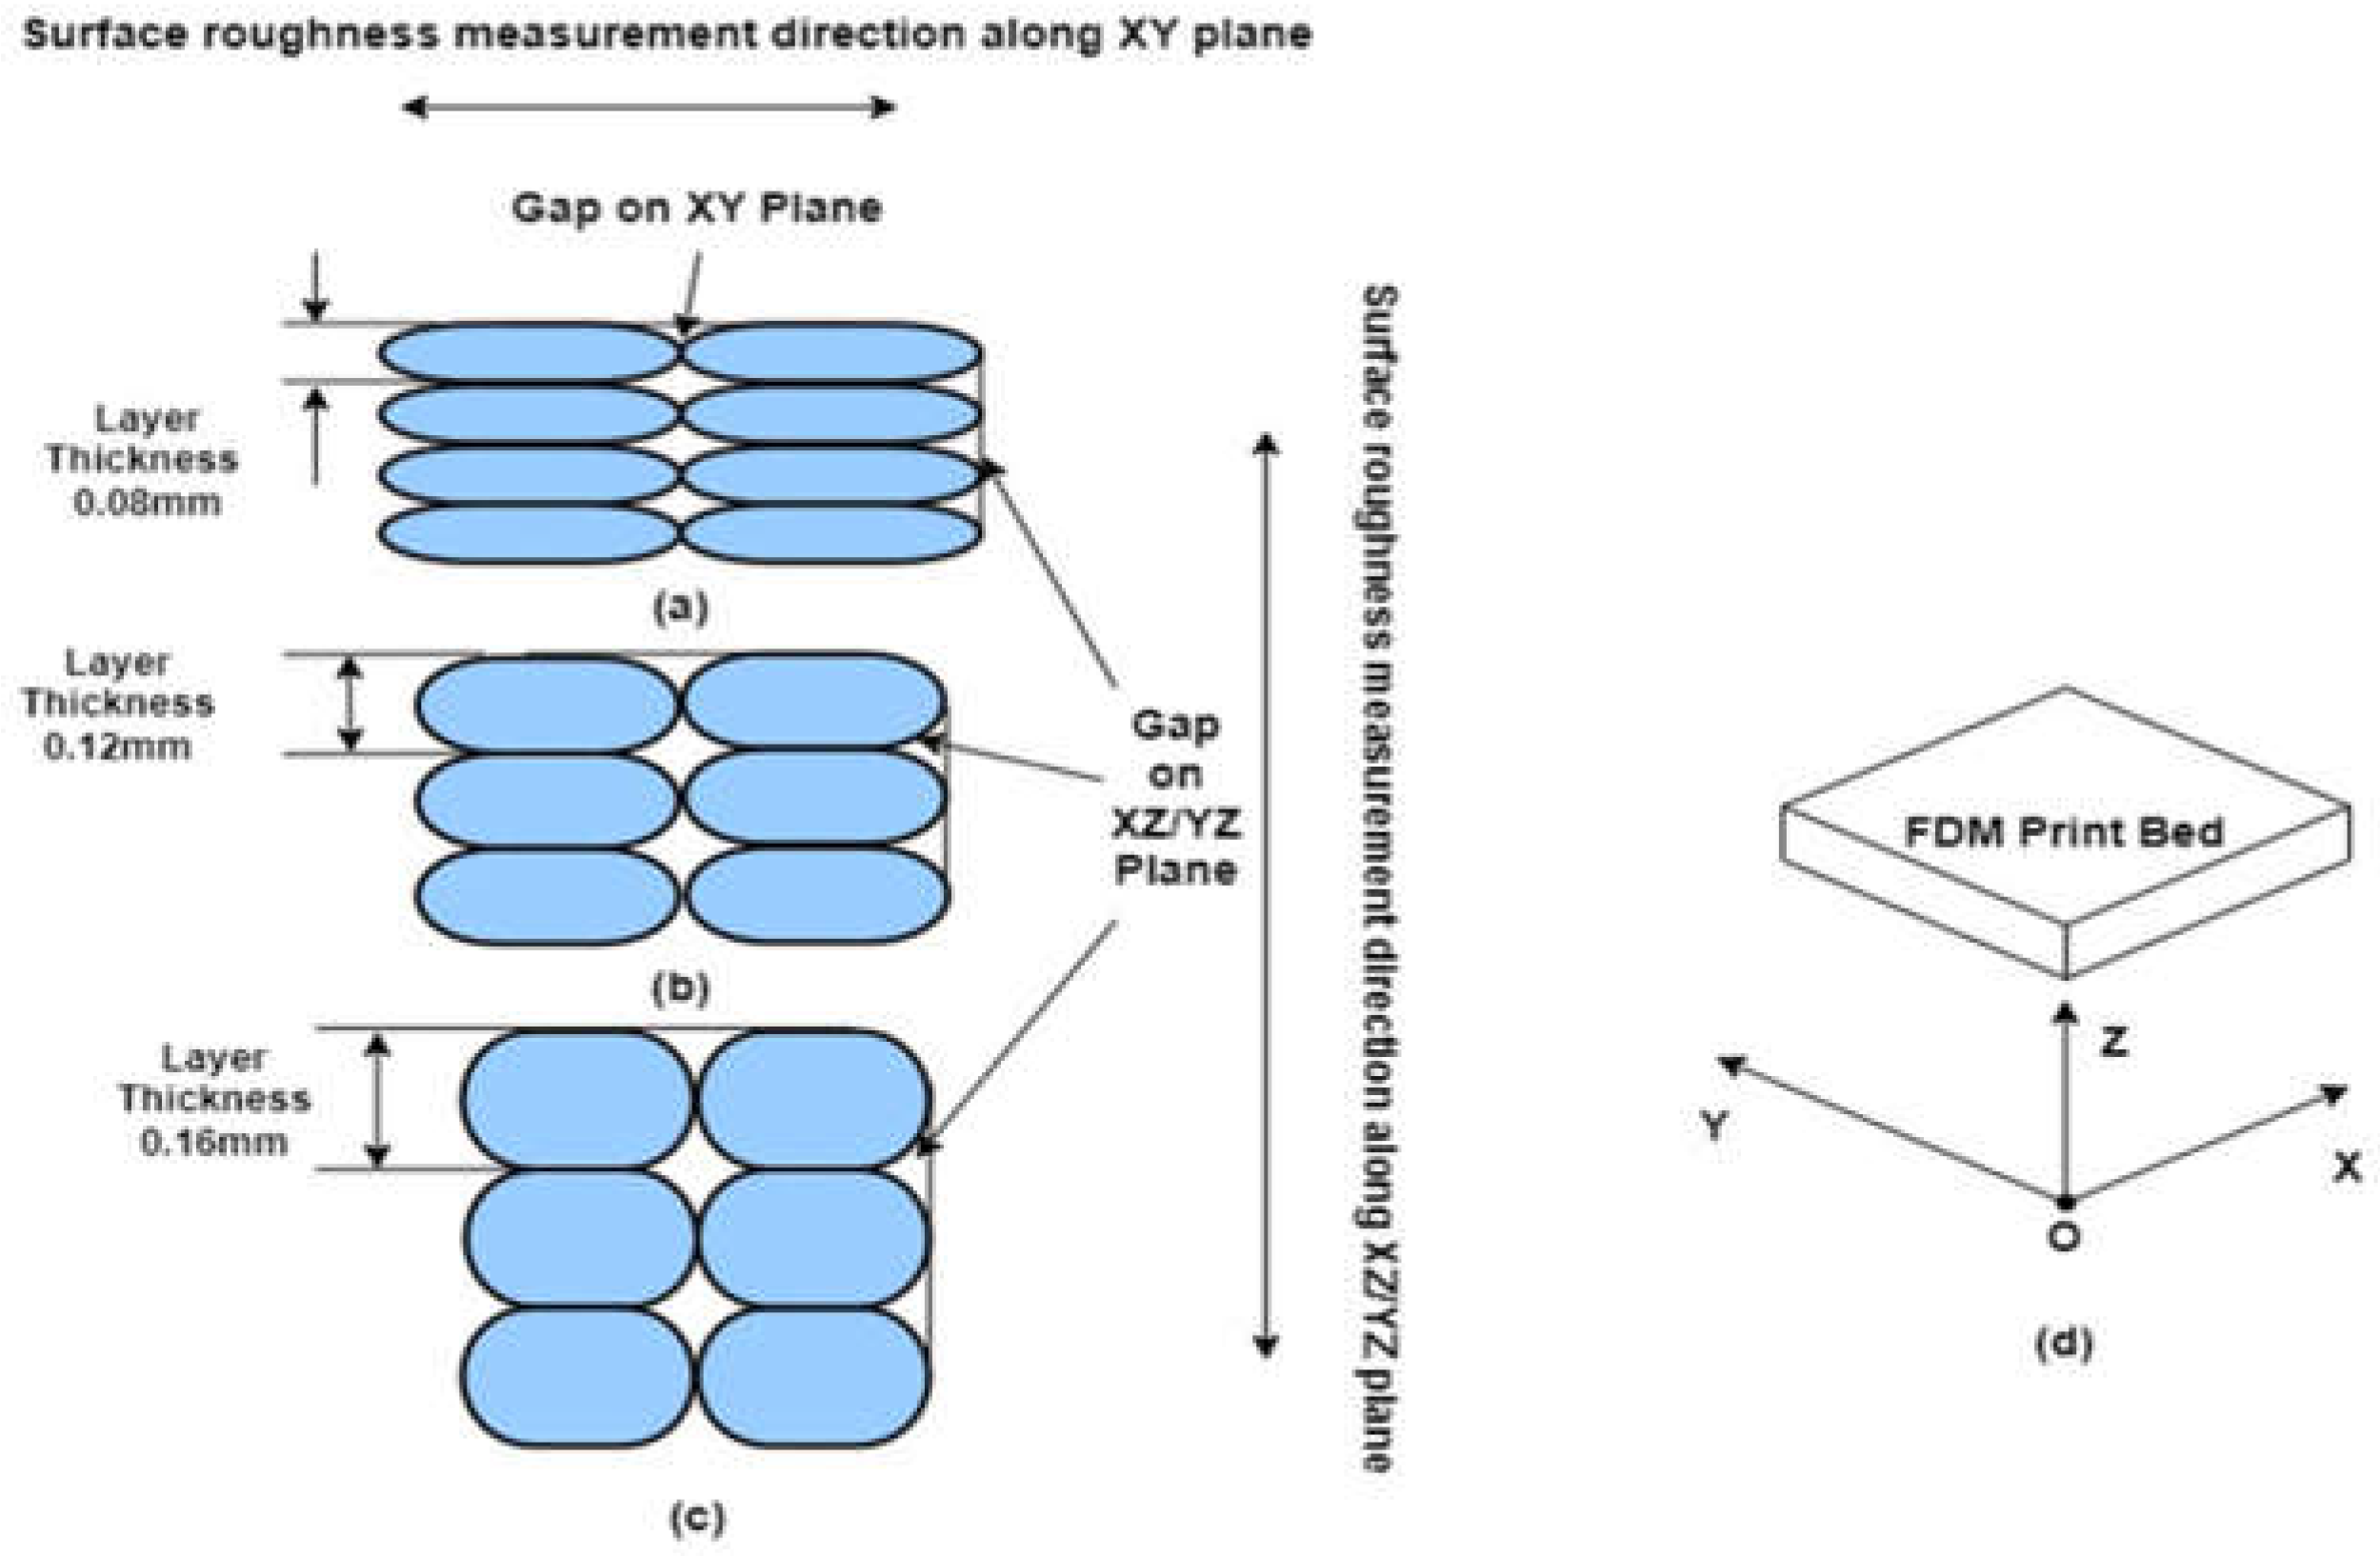
Figure 20.
Bubble plot for surface roughness at blade surface with layer thickness (a) 0.08mm (b) 0.12mm (c) 0.16mm.
Figure 20.
Bubble plot for surface roughness at blade surface with layer thickness (a) 0.08mm (b) 0.12mm (c) 0.16mm.
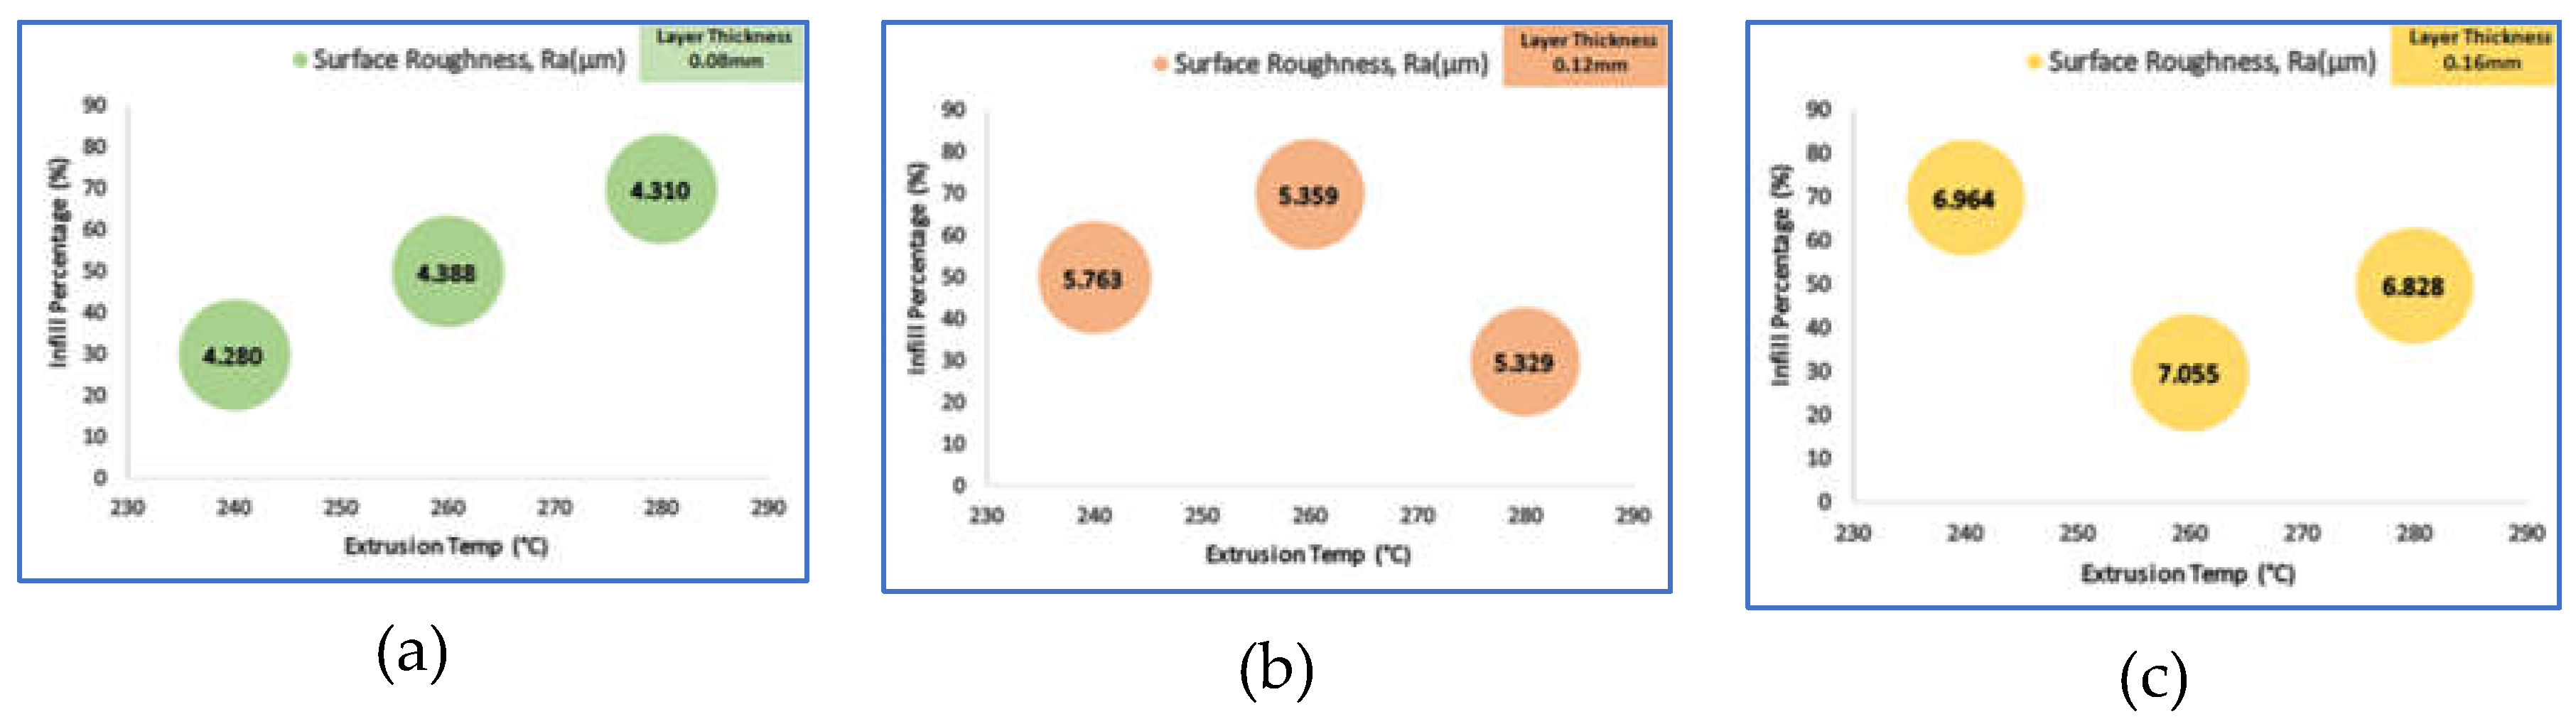
Figure 21.
Surface roughness parameters of blade surface: Ra, Rq and Rz.
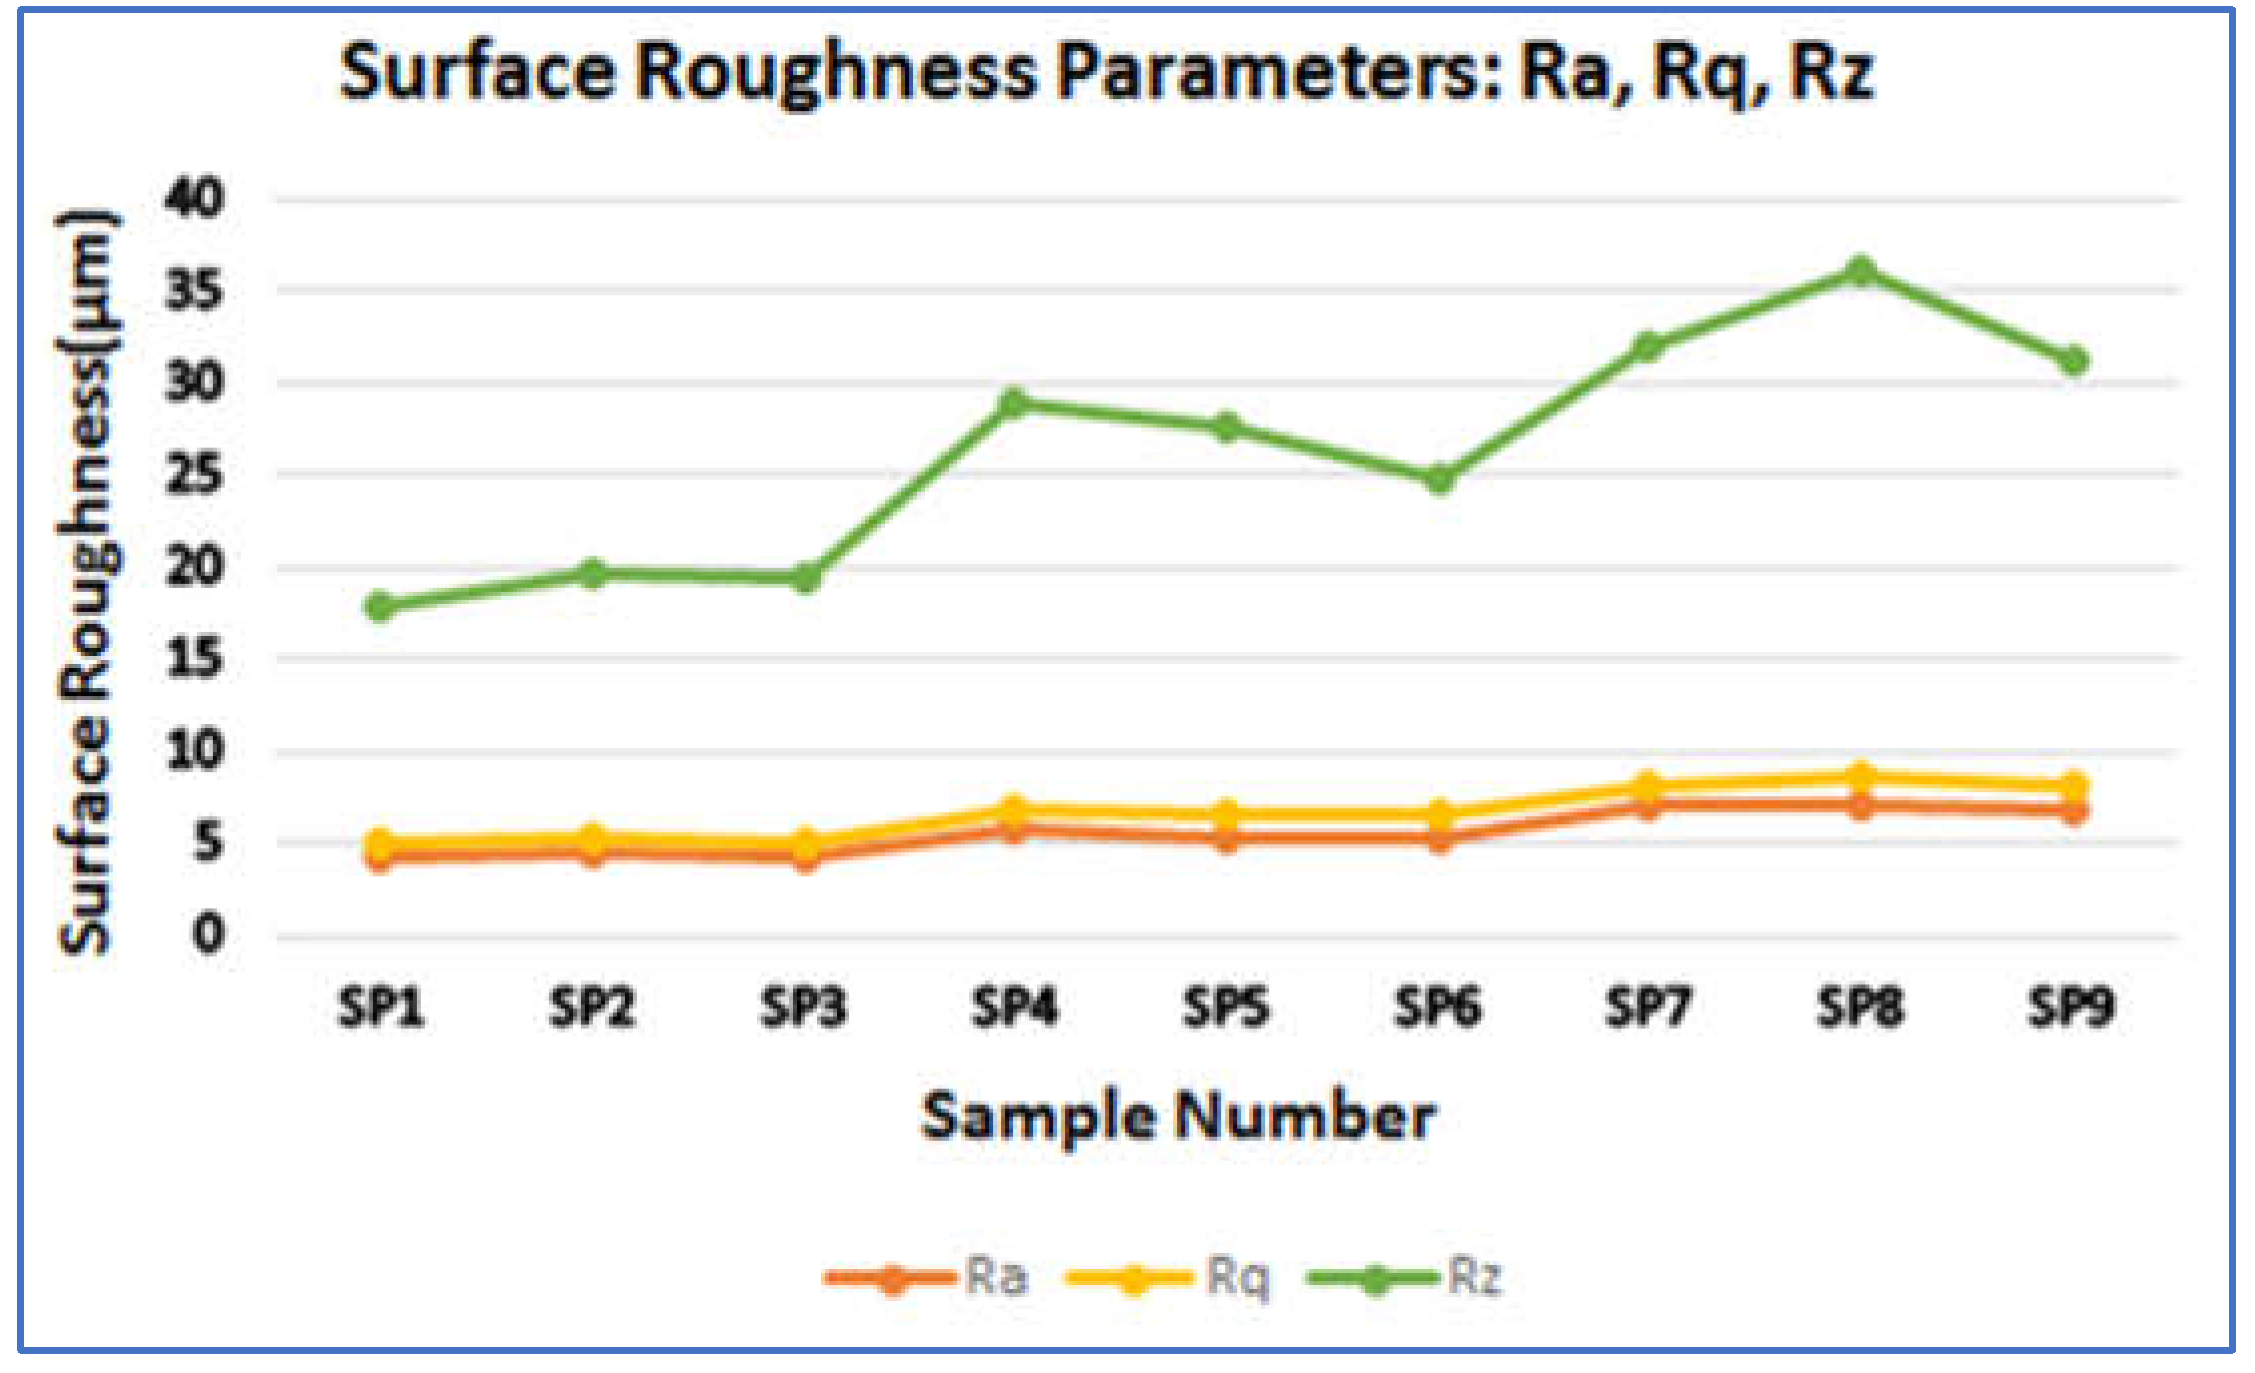
Figure 20(a) shows the Ra value at the blade surface of samples SP1, SP2, and SP3, which were printed with a constant layer thickness of 0.08 mm. As seen in this figure, with an increase in extrusion temperature from 240°C to 260°C and infill density from 30% to 50%, the Ra value also increases from 4.28 µm to 24.388 µm. However, with a further increase in extrusion temperature and infill density, Ra slightly decreases and reaches 4.31 µm. Thus, for a 0.08 mm layer thickness, the minimum Ra is achieved at an extrusion temperature of 240°C and an infill density of 30%.
Figure 20(b) shows the Ra value at the blade surface of samples SP4, SP5, and SP6, printed with a constant layer thickness of 0.12 mm. As seen in this figure, with an increase in extrusion temperature from 240°C to 260°C and infill density from 50% to 70%, the Ra value decreases from 5.763 µm to 5.359 µm. With a further increase in extrusion temperature and a decrease in infill density, Ra slightly decreases further, reaching 5.329 µm. Thus, for a 0.12 mm layer thickness, the minimum Ra is achieved at an extrusion temperature of 280°C and an infill density of 30%.
Figure 20(c) shows the Ra value at the blade surface of samples SP7, SP8, and SP9, printed with a constant layer thickness of 0.16 mm. As seen in this figure, with an increase in extrusion temperature from 240°C to 260°C and a decrease in infill density from 70% to 30%, the Ra value increases from 6.964 µm to 7.055 µm. However, with a further increase in extrusion temperature and infill density, Ra decreases significantly, reaching 6.828 µm. Thus, for a 0.16 mm layer thickness, the minimum Ra is achieved at an extrusion temperature of 280°C and an infill density of 50%.
To conclude, out of the nine samples, the minimum Ra (4.28 µm) was achieved in sample SP1 with the FDM printing parameters set to a layer thickness of 0.08 mm, an extrusion temperature of 240°C, and an infill density of 30%. On the other hand, the maximum Ra (7.055 µm) was obtained in sample SP8 with a layer thickness of 0.16 mm, an extrusion temperature of 260°C, and an infill density of 30%. It is evident from Figure 20 that surface roughness increases with an increase in layer thickness. However, the individual influence of extrusion temperature and infill density on surface quality remains ambiguous, indicating the presence of parameter interaction effects on surface quality.
With reference to Figure 21, the surface roughness parameter Rq shows a behavior similar to Ra. However, the Rq values are higher than the Ra values by an average of 19.28%. As we know, Rq represents the square root of the mean of the squared height deviations from the mean line, making it more sensitive to high peaks and valleys compared to Ra. Here, Rq > Ra indicates the presence of high peaks and valleys on the shroud surface of all samples. The difference between Rq and Ra is minimum (0.674 µm) in sample SP1, indicating that the surface texture of SP1 has fewer high peaks/valleys compared to all other samples. The maximum Rq (8.518 µm) was obtained in sample SP8, and the minimum Rq (4.954 µm) was achieved in sample SP1. Figure 21 shows the variation of Rz with respect to sample numbers. The maximum Rz (36.05 µm) was obtained in sample SP8, and the minimum Rz (17.982 µm) was achieved in sample SP1.
Ra values achieved are varies between 4 μm to 7μm, which is equivalent to N – Roughness Grade Numbers (DIN ISO 1302) N8 to N9. Achieved surface quality is acceptable for the investment casting [41,42].
Average Ra values achieved for shroud and blade surfaces are 2.72μm and 5.57μm, respectively. Overall, it is clear from figure 18 and figure 21, that all the roughness parameter values of the blade surface are higher than the shroud surface for all samples, which indicates that the surface quality of surfaces parallel to the XY plane is better than the surfaces parallel to the XZ/YZ planes. Similar results are obtained in previous studies [43,44].
Table 31 shows the mean and standard deviation of all surface roughness parameters obtained from all nine samples. Standard deviation is minimum in Ra and maximum in Rz for both shroud and blade surfaces as represented through the error bar in figure 22.
Figure 22.
Standard deviation in surface roughness parameters: Ra, Rq and Rz.
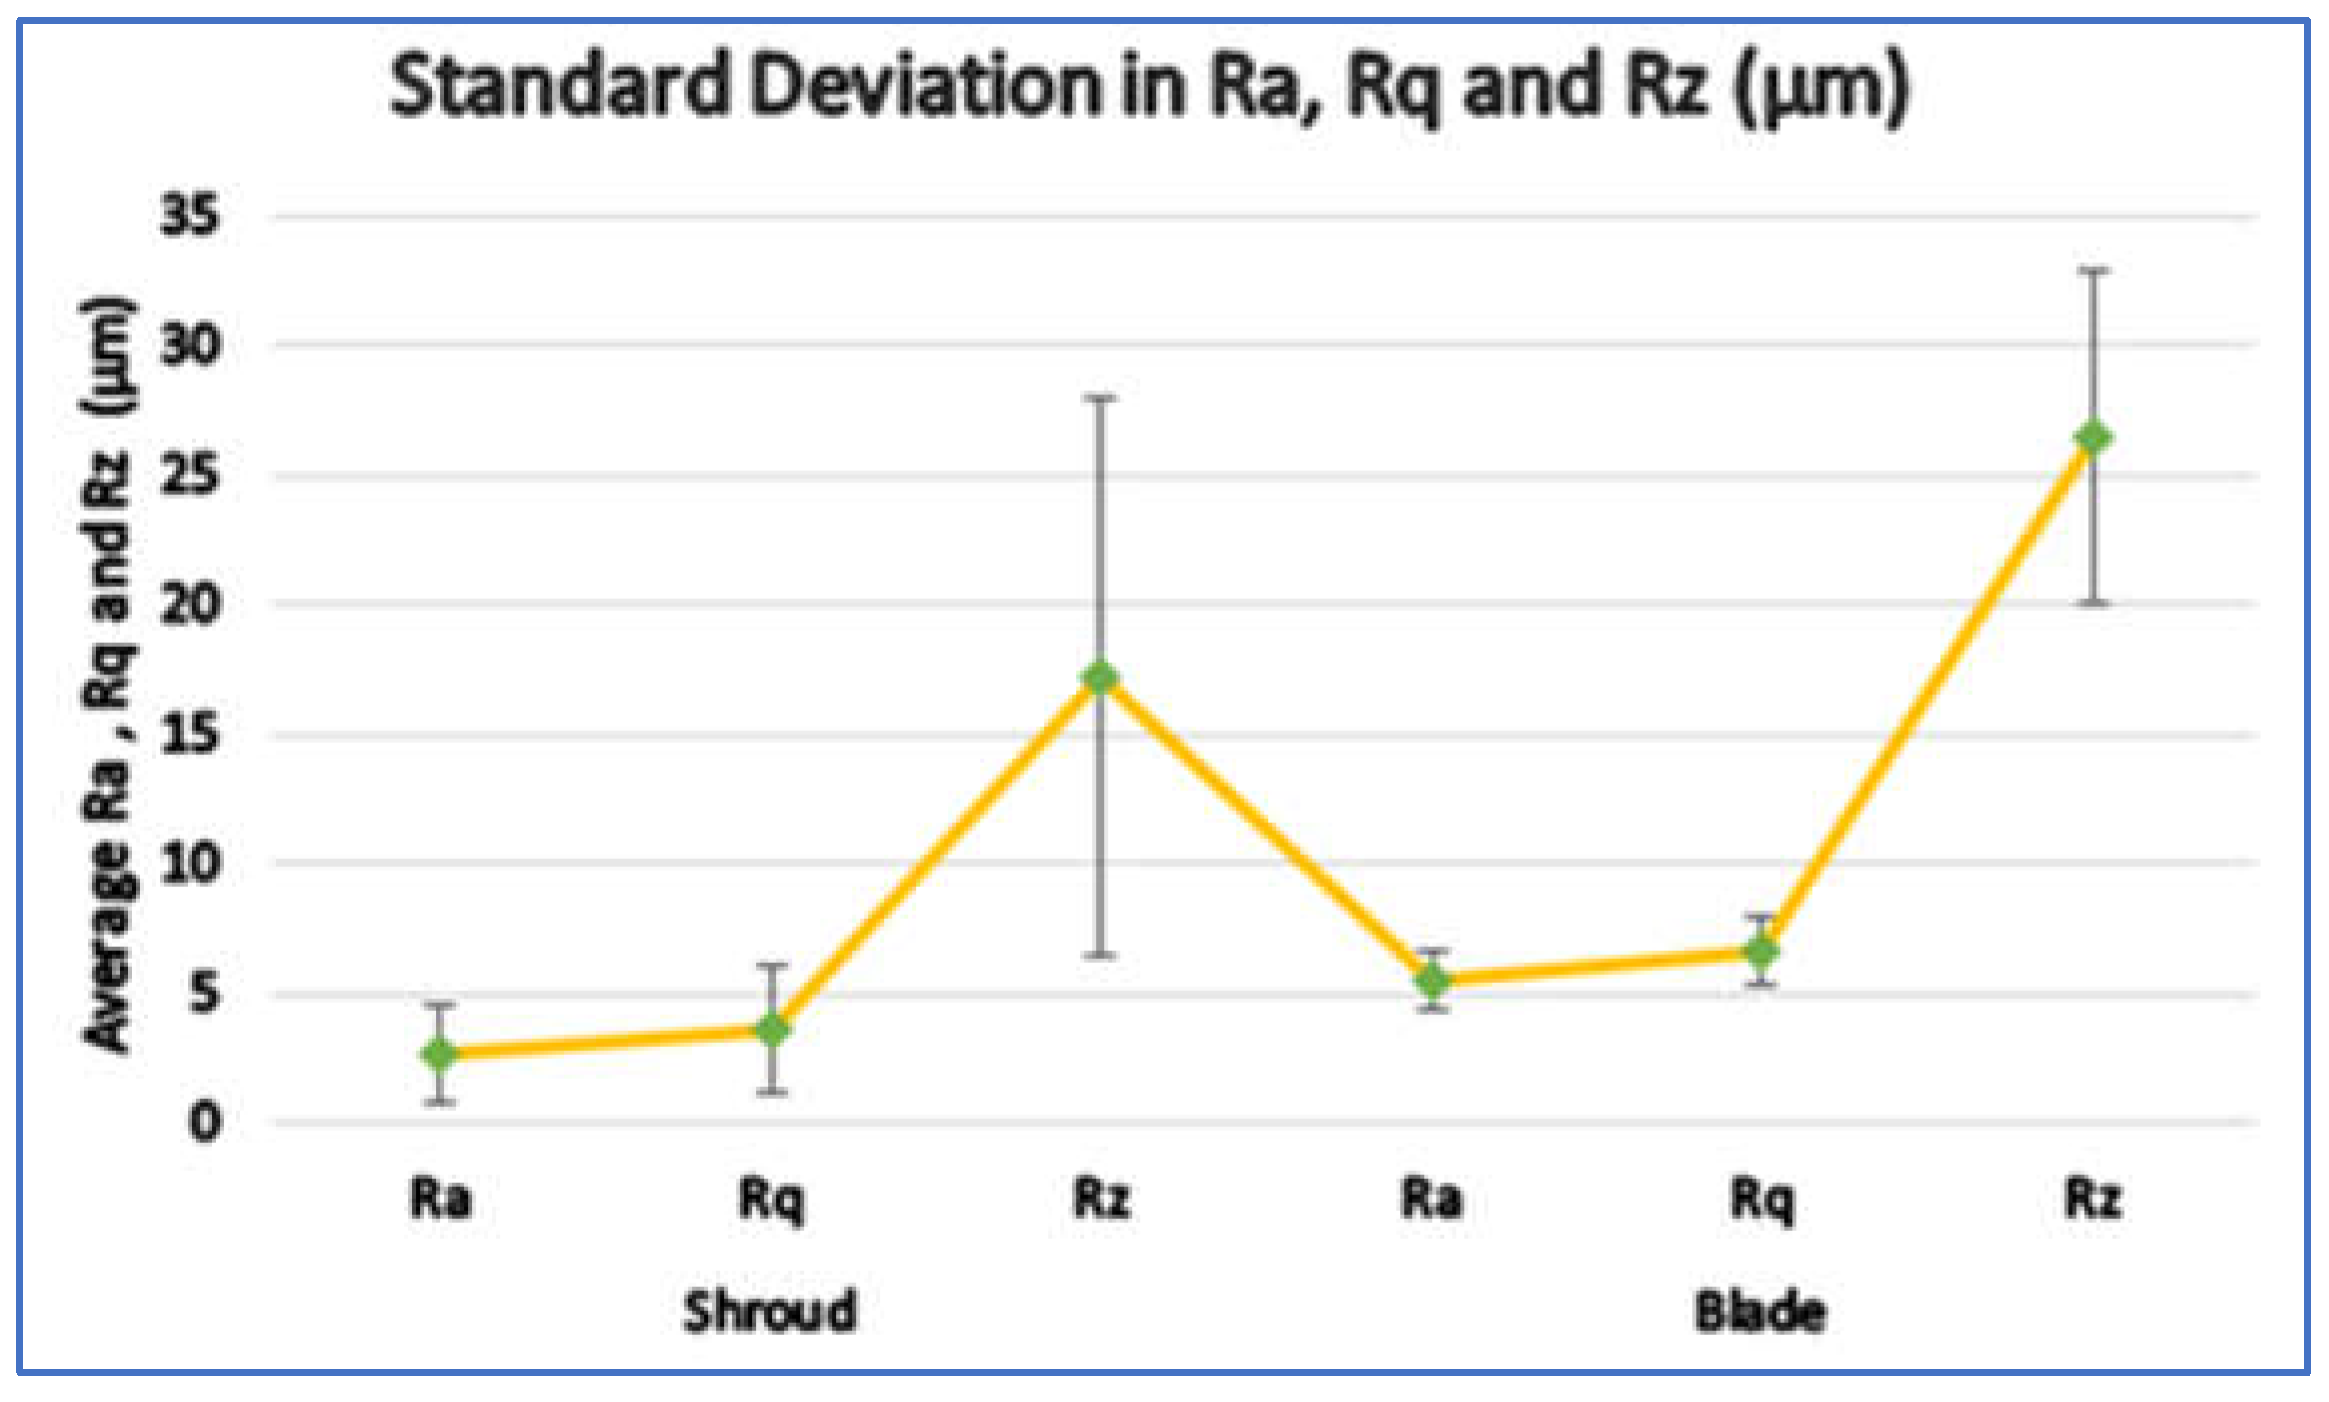
It is also clear that all three surface roughness parameters of the shroud surface are spread more than the blade surface, which indicates the shroud surface is more influenced by FDM process parameters compared to the blade surface.
4. Conclusions
An experimental study was conducted to analyze the dimensional accuracy and surface roughness of an FDM-printed, semi-open type single-shrouded impeller pattern for investment casting. ABS was used as the print material to fabricate the sacrificial pattern of this impeller. The design of experiments (DoE) was based on a Taguchi L9 (3^3) orthogonal array. Layer thickness, infill density, and extrusion temperature were selected as DoE parameters. A detailed analysis of the results was performed to evaluate the effects of these FDM process parameters on the dimensional accuracy of various features, including circular features (OD and ID), thin curved features (BT), thickness in the vertical Z direction (ST and BH), and surface quality of different planes—specifically, the shroud top face (parallel to the XY plane) and the blade surface (parallel to the XZ/YZ plane).
As a result of this study, the following general conclusions are derived:
- Small and thin features such as BT, BH, and ST tend to be printed oversized due to the dominant effect of print accuracy over shrinkage. In contrast, larger features like OD are printed undersized because shrinkage has a greater influence than print accuracy. These opposing effects of print accuracy and shrinkage result in better dimensional accuracy for small and thin features compared to larger ones.
- Small and/or thin features exhibit a standard deviation of less than 0.08 mm, indicating that FDM process parameters have minimal influence on them. The most affected dimension is OD, with the highest standard deviation of 0.362 mm.
- The best FDM parameter settings to achieve minimal dimensional deviation are: Layer thickness: 0.08 mm, extrusion temperature: 280°C, and infill density: 70%
- For surfaces parallel to the XY (shroud) plane and XZ/YZ (blade) plane, all three surface roughness parameters (Ra, Rq, and Rz) are significantly influenced by layer thickness. As layer thickness increases, surface quality will decrease, and vice versa.
- For surfaces parallel to the XY plane, at all layer thicknesses, a trend is observed where increasing extrusion temperature increases surface roughness, possibly due to excessive material flow. The impact of infill percentage is not as pronounced as layer thickness or temperature, but in general, moderate infill percentages should be used to decrease roughness.
- For surfaces parallel to the XZ/YZ plane, the individual influence of extrusion temperature and infill density on surface quality is ambiguous. It indicates the presence of a parameter interaction effect on surface quality.
- Surfaces parallel to the XY plane have better surface quality compared to those parallel to the XZ/YZ planes due to better bonding between layers and less staircase effect.
- Surface roughness parameters of the shroud surface are spread more than the blade surface, which indicates FDM process parameters influence the shroud surface more than the blade surface.
- Ra values achieved vary between 4μm - 7μm, which is in the acceptable range for investment casting applications. The first citation of figures and tables in the main text must follow a sequential order.
Authors’ Contributions
The authors confirm contribution to the paper as follows: Conceptualization, Margi Shah and Dhiren Patel; methodology, Margi Shah and Dhiren Patel; software, Margi Shah and Kuldeep A Mahajan; validation, Dhiren Patel, Mustufa Haider Abidi and Fahad Alasim; formal analysis, Margi Shah; investigation, Margi Shah; resources, Mustufa Haider Abidi, Fahad Alasim and Kuldeep A Mahajan; data curation, Margi Shah; writing—original draft preparation, Margi Shah; writing—review and editing, Dhiren Patel and Mustufa Haider Abidi; visualization, Dhiren Patel; supervision, Dhiren Patel and Sarang Pande; project administration, Dhiren Patel and Sarang Pande; funding acquisition, Mustufa Haider Abidi and Fahad Alasim. All authors reviewed the results and approved the final version of the manuscript.
Funding
The authors would like to thank the Research Institute Supporting Program (RICSP-25-2), King Saud University, Riyadh, Saudi Arabia for funding this work. The authors give assurance for no ethical issues; the study is performed as per norms and standards.
Availability of Data and Materials
The original contributions presented in this study are included in the article/supplementary material. Further inquiries can be directed to the corresponding author(s).
Ethics Approval
Not applicable.
Acknowledgement
The authors would like to thank Indus University and King Saud University for providing the necessary facilities and resources to conduct the research.
Conflicts of Interest
The author(s) declare(s) no conflicts of interest to report regarding the present study.
References
- Thin KC, Khaing MM, Aye KM. Design and performance analysis of centrifugal pump. World Academy of Science, Engineering and Technology. 2008;46(1):422-9. [CrossRef]
- Varley FA. Effects of impeller design and surface roughness on the performance of centrifugal pumps. Proc Inst Mech Eng. 1961;175(1):955-89. [CrossRef]
- Djerroud M, Dituba Ngoma G, Ghie W. Numerical identification of key design parameters enhancing the centrifugal pump performance: Impeller, impeller-volute, and impeller-diffuser. Int Scholarly Res Notices. 2011;2011(1):794341. [CrossRef]
- Pramono AE, Dermawan A. Engineering and process of investment casting for pump impellers. Recent Eng Sci Technol. 2023;1(4):11-9.
- Shah M, Monapara P, Chitroda Y, Karetiya D, Patel D. Investment casting using additive manufacturing: State-of-the-art and future directions—A review paper. 2023 IEEE 11th Region 10 Humanitarian Technology Conference (R10-HTC). 2023 Oct;889-95.
- Vaghela JR, Valaki JB, Thanki SJ, Pandey AB. Sustainability analysis of rapid tooling-based investment casting: A comprehensive review. Smart Sustain Manuf Syst. 2023;7(1):54-81.
- Shah M, Patel DR, Pande S. Additive manufacturing integrated casting—A review. Mater Today Proc. 2022; 62:7199-203. [CrossRef]
- Fedorov K, Ravindran C, Fayazbakhsh K. Effects of process parameters on friability and surface quality in the rapid investment casting process. Int J Adv Manuf Technol. 2023;125(1):731-42.
- Ngo TD, Kashani A, Imbalzano G, Nguyen KT, Hui D. Additive manufacturing (3D printing): A review of materials, methods, applications, and challenges. Compos Part B Eng. 2018; 143:172-96. [CrossRef]
- Wang S, Miranda AG, Shih C. A study of investment casting with plastic patterns. Mater Manuf Process. 2010;25(12):1482-8.
- Jayashuriya M, Gautam S, Aravinth AN, Vasanth G, Murugan R. Studies on the effect of part geometry and process parameter on the dimensional deviation of additive manufactured part using ABS material. Prog Addit Manuf. 2022;7(6):1183-93.
- Taşdemir V. Investigation of dimensional integrity and surface quality of different thin-walled geometric parts produced via fused deposition modeling 3D printing. J Mater Eng Perform. 2021;30(5):3381-7.
- Sudin MN, Shamsudin SA, Abdullah MA. Effect of part features on dimensional accuracy of FDM model. APRN J Eng Appl Sci. 2016;11(3):8067-72. [CrossRef]
- Harun WSW, Safian S, Idris MH. Evaluation of ABS patterns produced from FDM for investment casting process. WIT Trans Eng Sci. 2009;64(3):319-28.
- Singh R, Singh G. Cast component hardness comparison for investment casting prepared with wax and ABS patterns. Trans Indian Inst Met. 2015;68:17-21.
- Chohan JS, Singh R, Boparai KS. Post-processing of ABS replicas with vapor smoothing for investment casting applications. Proc Natl Acad Sci India Sect A Phys Sci. 2020; 90:1-6. [CrossRef]
- Pradhan SR, Singh R, Banwait SS, Singh S, Anand A. On pre- and post-processing of 3D printed ABS thermoplastic sacrificial pattern for strategic dog teeth. Prog Addit Manuf. 2023;8(2):241-53.
- Fedorov K, Fayazbakhsh K, Ravindran C. Surface roughness and dimensional tolerances in A319 alloy samples produced by rapid investment casting process based on fused filament fabrication. Int J Adv Manuf Technol. 2022;1-15.
- Singh R, Singh G. Investigations for statistically controlled investment casting solution of FDM-based ABS replicas. Rapid Prototyp J. 2014;20(3):215-20.
- Lee CW, Chua CK, Cheah CM, Tan LH, Feng C. Rapid investment casting: Direct and indirect approaches via fused deposition modelling. Int J Adv Manuf Technol. 2004; 23:93-101.
- Kechagias JD. Surface roughness assessment of ABS and PLA filament 3D printing parts: Structural parameters experimentation and semi-empirical modelling. Int J Adv Manuf Technol. 2024;1-12.
- Chinchanikar S, Shinde S, Gaikwad V, Shaikh A, Rondhe M, Naik M. ANN modelling of surface roughness of FDM parts considering the effect of hidden layers, neurons, and process parameters. Adv Mater Process Technol. 2024;10(1):22-32.
- Sandhu GS, Sandhu KS, Boparai KS. Effect of extrudate geometry on surface finish of FDM printed ABS parts. Mater Today Proc. 2024.
- Nadeem H, Ghazali N, Nabeel M, Ahsan MN, Khurram AA. Experimental assessment of surface roughness of fused deposition modelling parts and method of improvement. J Thermoplast Compos Mater. 2024;37(3):1187-201.
- Ouazzani K, El Jai M, Akhrif I, Radouani M, Elfahime B. Minimization of surface roughness for ABS specimens relatively to FDM process parameters—An experimental analysis. 2024 4th Int Conf Innov Res Appl Sci Eng Technol (IRASET). 2024 May;1-5.
- Petruse RE, Simion C, Bondrea I. Geometrical and dimensional deviations of fused deposition modelling (FDM) additive-manufactured parts. Metrology. 2024;4(3):411-29. [CrossRef]
- Singh A, Bhardwaj T, Saini P, Gangil N, Singh DK. Investigation on FDM process parameters for the dimensional accuracy with ABS polymer part. Eng Res Express. 2024.
- Tunçel O. The influence of the raster angle on the dimensional accuracy of FDM-printed PLA, PETG, and ABS tensile specimens. Eur Mech Sci. 2024;8(1):11-8.
- Bayraklilar MS. Dimensional accuracy of acrylonitrile butadiene styrene material produced by additive manufacturing method. J Mater Eng Perform. 2024;33(5):2531-51.
- Lestari WD, Adyono N, Faizin AK, Haqiyah A, Sanjaya KH, Nugroho A, et al. Optimization of 3D printed parameters for socket prosthetic manufacturing using the Taguchi method and response surface methodology. Results Eng. 2024; 21:101847.
- Jankovic A, Chaudhary G, Goia F. Designing the design of experiments (DOE)–An investigation on the influence of different factorial designs on the characterization of complex systems. Energy Build. 2021; 250:111298. [CrossRef]
- Ayad AF, Abdalla HM, Abo El-Azm AS. Numerical study of the semi-open centrifugal pump impeller side clearance. Int Conf Aerosp Sci Aviat Technol (ASAT). 2015 May; 16:1-14.
- Zhang Y, Bu K, Liu C. Prediction of shrinkage allowance coefficient of investment castings based on geometric parameters. Metall Mater Trans B. 2024;1-15.
- He X, Jiao W, Wang C, Cao W. Influence of surface roughness on the pump performance based on computational fluid dynamics. IEEE Access. 2019; 7:105331-41.
- Varley FA. Effects of impeller design and surface roughness on the performance of centrifugal pumps. Proc Inst Mech Eng. 1961;175(1):955-89.
- Bellary SAI, Samad A. Pumping crude oil by centrifugal impeller having different blade angles and surface roughness. J Pet Explor Prod Technol. 2016;6(1):117-27.
- Sahay C, Ghosh S. Understanding surface quality: Beyond average roughness (Ra). 2018 ASEE Annu Conf Expo. 2018 Jun. [CrossRef]
- Alsoufi MS, Elsayed AE. How surface roughness performance of printed parts manufactured by desktop FDM 3D printer with PLA+ is influenced by measuring direction. Am J Mech Eng. 2017;5(5):211-22. [CrossRef]
- Jiang JC, Xu X, Rui W, Jia Z, Ping Z. Line width mathematical model in fused deposition modelling for precision manufacturing. E3S Web Conf. 2021; 231:03003. [CrossRef]
- Sukindar NA, Yasir ASHM, Azhar MD, Azhar MAM, Abd Halim NFH, Sulaiman MH, et al. Evaluation of the surface roughness and dimensional accuracy of low-cost 3D-printed parts made of PLA–aluminum. Heliyon. 2024;10(4).
- https://get-it-made.co.uk/resources/surface-roughness-explained (Accessed on 15 January 2025).
- https://xometry.pro/en/tools/surface-roughness-converter (Accessed on 15 January 2025).
- Shah M, Patel D, Pande S. Experimental investigation of CF8 stainless steel impeller quality using PLA-based fused deposition modeling-assisted investment casting. Mater Res Express. 2025; 12:016508.
- Chand R, Sharma VS, Trehan R, Gupta MK, Sarikaya M. Investigating the dimensional accuracy and surface roughness for 3D printed parts using a multi-jet printer. J Mater Eng Perform. 2023;32(3):1145-59.
Table 4.
Factors and their levels.
| Factor | Level 1 | Level 2 | Level 3 |
| Layer thickness (mm) | 0.08 | 0.12 | 0.16 |
| Extrusion temperature (°C) | 240 | 260 | 280 |
| Infill percentage (%) | 30 | 50 | 70 |
Table 5.
Taguchi L9(3^3) orthogonal array - Coded.
| Run Order | Layer Thickness | Extrusion Temp | Infill Percentage |
| 1 | 1 | 1 | 1 |
| 2 | 1 | 2 | 2 |
| 3 | 1 | 3 | 3 |
| 4 | 2 | 1 | 2 |
| 5 | 2 | 2 | 3 |
| 6 | 2 | 3 | 1 |
| 7 | 3 | 1 | 3 |
| 8 | 3 | 2 | 1 |
| 9 | 3 | 3 | 2 |
Table 6.
Taguchi L9(3^3) orthogonal array - Un-coded.
| Run Order | Sample ID | Layer Thickness (mm) |
Extrusion Temp (°C) |
Infill Percentage (%) |
|---|---|---|---|---|
| 1 | SP1 | 0.08 | 240 | 30 |
| 2 | SP2 | 0.08 | 260 | 50 |
| 3 | SP3 | 0.08 | 280 | 70 |
| 4 | SP4 | 0.12 | 240 | 50 |
| 5 | SP5 | 0.12 | 260 | 70 |
| 6 | SP6 | 0.12 | 280 | 30 |
| 7 | SP7 | 0.16 | 240 | 70 |
| 8 | SP8 | 0.16 | 260 | 30 |
| 9 | SP9 | 0.16 | 280 | 50 |
Table 16.
Mean deviation in circular features(mm): Outer Diameter (OD), Inner Diameter (ID).
| Sample ID | Actual Value of OD | Nominal Value of OD | Deviation (OD) | Actual Value of ID | Nominal Value of ID | Deviation (ID) | Mean Deviation in circular feature |
| SP1 | 131.3 | 131.9 | -0.6 | 17.04 | 17.26 | -0.22 | 0.41 |
| SP2 | 130.13 | 131.9 | -1.77 | 16.83 | 17.26 | -0.43 | 1.1 |
| SP3 | 131.4 | 131.9 | -0.5 | 17.1 | 17.26 | -0.16 | 0.33 |
| SP4 | 131.06 | 131.9 | -0.84 | 17.06 | 17.26 | -0.2 | 0.52 |
| SP5 | 131.06 | 131.9 | -0.84 | 17.06 | 17.26 | -0.2 | 0.52 |
| SP6 | 131.08 | 131.9 | -0.82 | 17.06 | 17.26 | -0.2 | 0.51 |
| SP7 | 131.14 | 131.9 | -0.76 | 17.06 | 17.26 | -0.2 | 0.48 |
| SP8 | 131.14 | 131.9 | -0.76 | 17.04 | 17.26 | -0.22 | 0.49 |
| SP9 | 131.12 | 131.9 | -0.78 | 17.06 | 17.26 | -0.2 | 0.49 |
Table 17.
Standard deviation in circular features: Outer Diameter (OD), Inner Diameter (ID).
| Circular Feature | Standard Deviation(mm) |
|---|---|
| OD | 0.3628 |
| ID | 0.0785 |
Table 18.
Deviation in thin curved feature(mm): Blade Thickness (BT).
| Sample ID | Actual Value of BT | Nominal Value of BT | Deviation |
|---|---|---|---|
| SP1 | 2.91 | 2.53 | 0.38 |
| SP2 | 2.9 | 2.53 | 0.37 |
| SP3 | 2.9 | 2.53 | 0.37 |
| SP4 | 2.9 | 2.53 | 0.37 |
| SP5 | 2.91 | 2.53 | 0.38 |
| SP6 | 2.91 | 2.53 | 0.38 |
| SP7 | 2.9 | 2.53 | 0.37 |
| SP8 | 2.9 | 2.53 | 0.37 |
| SP9 | 2.91 | 2.53 | 0.38 |
Table 19.
Standard deviation in thin curved feature: Blade Thickness(mm).
| Thin Curved Feature | Standard Deviation(mm) |
| BT | 0.0052 |
Table 20.
Mean deviation in Z direction(mm): Shroud Thickness (SH), Blade Height (BH).
| Sample ID | Actual Value of ST | Nominal Value of ST | Deviation in ST | Actual Value of BH | Nominal Value of BH | Deviation in BH | Mean Deviation in Z direction |
|---|---|---|---|---|---|---|---|
| SP1 | 5.04 | 5.08 | -0.04 | 15.32 | 15.23 | 0.09 | 0.025 |
| SP2 | 5.05 | 5.08 | -0.03 | 15.33 | 15.23 | 0.1 | 0.035 |
| SP3 | 5.08 | 5.08 | 0 | 15.34 | 15.23 | 0.11 | 0.055 |
| SP4 | 5.04 | 5.08 | -0.04 | 15.34 | 15.23 | 0.11 | 0.035 |
| SP5 | 5.06 | 5.08 | -0.02 | 15.34 | 15.23 | 0.11 | 0.045 |
| SP6 | 5.06 | 5.08 | -0.02 | 15.34 | 15.23 | 0.11 | 0.045 |
| SP7 | 5.12 | 5.08 | 0.04 | 15.34 | 15.23 | 0.11 | 0.075 |
| SP8 | 5.13 | 5.08 | 0.05 | 15.36 | 15.23 | 0.13 | 0.09 |
| SP9 | 5.12 | 5.08 | 0.04 | 15.36 | 15.23 | 0.13 | 0.085 |
Table 21.
Standard deviation in vertical Z direction: Shroud Thickness (SH), Blade Height (BH).
| Circular Feature | Standard Deviation(mm) |
| ST | 0.0363 |
| BH | 0.0126 |
Table 31.
Standard deviation of surface roughness parameters.
| Shroud surface | Blade Surface | |||||
| Parameters | Ra | Rq | Rz | Ra | Rq | Rz |
| Mean | 2.72 | 3.62 | 17.24 | 5.58 | 6.66 | 26.43 |
| Standard Deviation | 1.87 | 2.42 | 10.7 | 1.14 | 1.36 | 6.38 |
Disclaimer/Publisher’s Note: The statements, opinions and data contained in all publications are solely those of the individual author(s) and contributor(s) and not of MDPI and/or the editor(s). MDPI and/or the editor(s) disclaim responsibility for any injury to people or property resulting from any ideas, methods, instructions or products referred to in the content. |
© 2025 by the authors. Licensee MDPI, Basel, Switzerland. This article is an open access article distributed under the terms and conditions of the Creative Commons Attribution (CC BY) license (http://creativecommons.org/licenses/by/4.0/).
Copyright: This open access article is published under a Creative Commons CC BY 4.0 license, which permit the free download, distribution, and reuse, provided that the author and preprint are cited in any reuse.


