
Submitted:
14 February 2025
Posted:
14 February 2025
You are already at the latest version
Abstract
As offshore wind turbines develop into deepwater operations, accurately quantifying the impact of stochastic excitation in complex sea environments on offshore wind turbines and conducting structural fatigue reliability analysis has become challenging. In this paper, based on long-term wind-wave reanalysis data from a site in the South China Sea, a novel direct probability integral method (DPIM) is developed for the stochastic response and fatigue reliability analysis of the key components for the floating offshore wind turbine structures under combined wind-wave excitation. A 5MW floating offshore wind turbine is considered as the research object, and a fully coupled dynamic response analysis of the wind turbine system is conducted to calculate the short-term fatigue damage value of tower base and blade root. The DPIM is applied to calculate the fatigue reliability of the wind turbine structure. The accuracy and efficiency of the proposed method are validated by comparing the obtained results with those of Monte Carlo simulations. Furthermore, the results indicate that the fatigue life of floating offshore wind turbine structures under combined wind-wave excitation meets the design requirements. Notably, the fatigue reliability of the wind turbine under aligned wind-wave conditions is lower compared to misaligned wind-wave conditions.
Keywords:
offshore wind turbines
; combined wind-wave excitation
; direct probability integral method
; fatigue reliability analysis
1. Introduction
Offshore wind energy, with its vast resource reserves and flexible environmental constraints, has become an important development direction for future wind energy [1]. However, as offshore wind power projects gradually advance into deepwater operations, the wind turbines will be subjected to complex, variable, and alternating random loads, which can easily induce cumulative fatigue damage and subsequently threaten the overall safety and stability of the structure [2,3,4]. Therefore, conducting a fatigue reliability analysis of the offshore wind turbines under stochastic environmental excitation is of significant importance.
In recent years, researchers have conducted extensive studies on the reliability analysis of offshore wind turbine units. For instance, Colone [5] examined the impact of turbulence and wave loads on the fatigue reliability of offshore wind turbine pile foundations, emphasizing the need for accurate environmental modeling to improve cost-effective and reliable monopile design. Wilkie [6] developed a computational framework using Gaussian process regression to effectively assess the fatigue reliability of offshore wind turbine substructures, providing practical insights for design and reliability in European waters. Fu [7] investigated the fatigue reliability of the wind turbine tower flange and bolt under random wind loads, proposing a fatigue probability calculation method based on probability density evolution for accurate and quantitative prediction of structural reliability under fluctuating conditions. Zhao [8] proposed a fatigue reliability analysis method using a surrogate model, C-vine copula, and Monte Carlo simulation, applied to assess fatigue reliability at three critical locations on a floating offshore wind turbine (FOWT). Although there has been considerable research on the reliability analysis of wind turbines under the combined wind-wave excitation have been studied, the research on the fatigue reliability analysis of wind turbine structures considering multiple uncertainty factors remains limited.
Currently, structural reliability analysis methods mainly include the first-order second-moment method (FORM), second-order second-moment methods (SORM), random sampling simulation methods [9], and probability density evolution methods [10,11]. FORM and SORM are commonly used for static analysis and are not suitable for the dynamic systems of wind turbines. Random sampling simulation methods, such as Monte Carlo Simulation (MCS), subset simulation, and importance sampling, yield accurate results but come with high computational costs. Li and Chen [10] established the generalized density evolution equation (GDEE) based on the principle of probability conservation and developed the probability density evolution method. However, analytical solutions for GDEE are challenging for most engineering problems. To address this issue, this paper extends a novel direct probability integral method (DPIM) [12,13,14] for the stochastic response analysis of wind turbine structures subjected to stochastic environmental excitation, aiming to achieve efficient fatigue reliability analysis of FOWTs under combined wind-wave excitation.
This study focuses on the 5 MW spar wind turbine developed by the National Renewable Energy Laboratory (NREL) [15]. An efficient assessment method for the fatigue reliability analysis of the key components for wind turbine structures with multiple uncertainty factors is further proposed based on DPIM. This model incorporates the long-term joint probability distribution of wind and wave conditions relevant to the specific maritime area for time-domain analysis. Using the rainflow counting method, the stress spectra of danger points of the support structure and blade root are extracted. Then, the number of cycles is computed via S-N curves [16], and Palmgren-Miner's cumulative fatigue damage theory [17] is applied to estimate short-term fatigue damage values. Finally, the fatigue reliability analysis of the wind turbine structures using DPIM is achieved by the proposed method.
The paper is organized as follows: Section 2 presents a detailed overview of the FOWT model and the fatigue analysis method via DPIM used in this study. Section 3 demonstrates the effectiveness of the proposed method. Moreover, the influence of different wind-wave conditions on stochastic response, fatigue damage, and fatigue reliability is further investigated. Lastly, Section 4 emphasizes the main conclusions and insights drawn from this research.
2. FOWT Model and Fatigue Reliability Analysis Method
2.1. Numerical Model of FOWT
The fatigue analysis is conducted for a NREL 5MW OWT, the platform of which is the OC3-Hywind spar-buoy [18] (Figure 1). The main properties of the wind turbine are listed in Table 1. The height of the wind turbine, the top of the tower, and the base of the tower are 90 m, 87.6 m, and 10 m above the still water level (SWL), respectively. The draft of the platform is 120 m and the center of mass (CM) of the floating platform (including the ballast) is 89.92 m below SWL. The floating platform is moored by three equally spaced catenary lines spread symmetrically about the Z-axis, one of which is directed along the negative direction of the X-axis. The fairleads are located at a depth of 70 m below the SWL and the depth of anchors is 320 m below the SWL.
In this study, a coupled areo-hydro-servo-elastic tool OpenFAST [19], which is developed and verified by NREL, is used to obtain the dynamic responses of critical components of FOWTs under different environmental conditions. The aerodynamic loads on the blades are calculated based on Blade Element Momentum (BEM) theory in the module of AeroDyn, which processes turbulent wind data produced by TurbSim. The Kaimal spectrum is used to simulate the turbulent incoming wind field for FOWTs. The wind loads on the tower are calculated based on potential flow theory. For the hydrodynamic loads, both potential theory and Morison’s equation are applied through the HydroDyn module. The viscous drag forces are accounted for by considering the drag term in Morison’s equation. The second-order wave forces are neglected, as they are minimal compared to the first-order force acting on the spar-type floater [20]. The motion equation for FOWTs is derived using Kane’s dynamics.
2.2. Probabilistic Modeling of Long-Term Joint Wind and Wave Loads
FOWTs operate in variable natural environments for extended periods, facing multiple random environmental factors primarily driven by wind and wave loads. Following IEC 61400-3 [21], this study selects three environmental parameters that influence wind and wave loads, including mean wind speed (), significant wave height (), and spectral peak period (). The wind speed can define the characteristics of wind states, the others can determine the characteristics of sea states. Other environmental conditions, such as wind and wave directions, can also significantly impact fatigue reliability analysis. In this study, the fixed wind direction is aligned with the positive X-axis. The impact of varying wind and wave directions is achieved by adjusting the angle of the inflow wave. The wave angles are set to 0°, 30°, 60°, and 90°, respectively.
Applying reanalysis data from the South China Sea station (21°N, 113°E) from 1979 to 2016 [22], and then simulating the environmental data for this sea area based on the joint distribution model of combined wind-wave excitation established by Song et al [23]. The probability distribution models of the environmental random variables are presented in Table 2. The corresponding PDF curves of environmental random variables are displayed in Figure 2.
2.3. Fatigue Damage Location and Stress Calculation
In this study, two hot-spot locations of the FOWT system, including the tower base and the blade root, are selected to evaluate fatigue reliability. A significant aspect of fatigue damage in the time domain is identifying the stress time series. Therefore, obtaining the stress time series from dynamic simulations at these locations is essential.
The base section of the tower is simplified as a thin-walled cylindrical structure subjected to axial and shear stresses. To simplify the calculation, the effects of bolts and the connection components between the tower and platform are ignored, and the cross-section of the tower is treated as plane stress that varies along the circumference. The fatigue damage caused by shear stress is considerably lower than that caused by axial stress [24], so only axial stresses are used to calculate fatigue damage in this study. The axial stress at the tower base is calculated at 7 points around its circumference (Figure 3). Based on the small deformation assumption, the nominal axial stress can be calculated using Eq. (1).
where is axial force; is the nominal cross-sectional area; and denote the tower base roll and pitching moment, respectively; and mean the sectional moments of the area to X-axis and the Y-axis, respectively; is the angle measured in the counterclockwise direction from the negative X-axis to the calculated point.
In contrast, the stress states at the blade root are more complex. The stress at the blade root is also composed of axial stress and shear stress, both of which are considered in this study. The wind turbine blade undergoes bending moments and shear forces in three directions as it rotates continuously. A fixed coordinate system is established to accurately describe these loads on the blade (Figure 4). This coordinate system remains stationary and does not change with the rotation of the blade, allowing for consistent analysis of the forces acting on the blade. To simplify the calculation, the blade root cross-section is treated as a circular ring-shaped area. The axial stress and shear stress can be calculated using Eq. (2) and Eq. (3) respectively, which is
where , and are the in-plane, out-of-plane, and pitching moment, respectively; , and are the out-of-plane shear, in-plane shear, and axial force, respectively; is the nominal cross-sectional area; and are the section modulus and section modulus in torsion, respectively.
After obtaining the stresses in the blade root section, the axial stress and shear stress should be synthesized according to the fourth strength theory:
2.4. Rainflow Counting Method
The rainflow counting method was introduced by Matsuishi and Endo in 1968 [25] and has since become a widely accepted method for analyzing random signals in the context of fatigue analysis. The primary factors influencing the fatigue life of structures include stress amplitude, the number of cycles, and mean stress amplitude. The rainflow counting method, a statistical approach commonly employed to predict fatigue life and evaluate fatigue damage, is often used to quantify these parameters.
In this paper, the time domain simulation of the 5MW spar offshore wind turbine is first performed. Then the rainflow counting method is employed to count the stress cycles in the stress time history. To account for the impact of the mean stress value on the structure's fatigue life, the Goodman method (Eq. (5)) is applied to correct the average stress.
where is the cycle’s stress range about a fixed load-mean value; is the ith cycle’s range about a load mean stress of ; is Goodman exponent. In this work, it is defined as 1.0. is the highest stress of the cross-section (in absolute value) before failure based on the ultimate strength. is the fixed mean stress value based on the time series of stress. To eliminate the mean stress effect, can be set to zero.
2.5. S-N Curve
The S-N curve defines a material's fatigue resistance by illustrating the maximum number of cycles it can withstand at a specific stress amplitude without experiencing fatigue damage. According to the DNV standard [16], the basic formula for calculating the S-N curve under different environmental conditions is as follows:
where is the predicted number of cycles to failure for the stress range ; and are the slope and the intercept parameters of the S-N curve. The blades are made of composite materials, while the tower is made of steel, is defined as 8 and 3, respectively.
2.6. Fatigue Cumulative Damage Theory
Fatigue damage refers to the extent of material degradation due to fatigue loading, often represented by the dimensionless parameter . When = 0, it indicates that the material has not undergone any fatigue damage. Conversely, when > 1 suggests that the material has exhausted its fatigue life. In this study, P-M fatigue cumulative damage theory is used to evaluate fatigue damage. The foundational formula is as follows:
where is the fatigue damage value caused by ith stress cycle; is the number of cycles for the ith stress cycle obtained by the rainflow counting method; is the number of failures under the ith stress cycle; is the simulation time ( = 600 s in this paper); stands for the total operating time of the wind turbine.
2.7. Fatigue Reliability Analysis via DPIM
Assume the stochastic sources for the multi-degree-of-freedom (MDOF) nonlinear system of floating wind turbines under random external excitation (such as wind, waves, etc.) all come from Θ, the principle of probability conservation [10] for the wind turbines is expressed as:
where and indicate PDF of input random variables θ and output vector y, respectively. The corresponding relationship between the input random variables θ and output vector y can be described by a deterministic mapping :
To further explicitly characterize the uncertainty propagation from input variables θ into output response vector y, based on the deterministic mapping and Dirac delta function, PDIE of MDOF nonlinear system of floating wind turbines is derived, i.e.,
Since in practice it is not necessary to obtain a joint PDF for all responses, only a few or even a single response is of primary concern. The dimension reduction for MDOF nonlinear system of floating wind turbines is accomplished using the property of Dirac delta function and implementing the marginal integral of Eq. (12). As a result, PDF of concerned response yℓ(t) is derived, which is
To address the issues caused by the singularity of the Dirac function in solving Eq. (13), Chen et al. [10] introduced the techniques of the partition of probability space and smoothing of the Dirac delta. Consequently, the numerical computation formula for Eq. (13) is obtained as follows:
where N indicates the number of representative points generated by the techniques of the partition of probability space means the representative response of qth representative points, is the assigned probability of qth representative points, and denotes the smoothing parameter.
Then, for achieving the fatigue reliability analysis of key components for the floating wind turbines via DPIM, the dynamic performance function is denoted as
in which Y(Θ, t) is expressed as
where B denotes the threshold, gext(Θ, t) means the equivalent extreme value of fatigue response of wind turbines. Furthermore, the fatigue reliability function of floating wind turbines is formulated by
where is safe domain of stochastic response Z(t), and denotes the PDF of Z(t). According to PDIE, the fatigue reliability function in Eq. (17) can be evaluated by
Introducing Heaviside function , the formulation for calculating the fatigue reliability of floating wind turbines in the framework of DPIM is given by
Equation (19) introduces Heaviside function to avoid the smoothing process of Dirac delta function, and the numerical solution of Eq. (19) only requires the application of the techniques of the partition of probability space, which is easier to solve.
3. Numerical Examples
In this paper, a two-step procedure for constructing representative points based on GF-discrepancy is employed, and the number of the representative points is set as 1000. As a result, the stochastic and fatigue reliability analyses of the tower base and blade root for the 5 MW spar wind turbine are achieved based on DPIM. Furthermore, MCS method results are used as a benchmark solution, the sample size for the method is set to 10,000.
3.1. Stochastic Response Analysis of Wind Turbines Under Combined Wind-Wave Excitation
The comparison of the average stress at key points of the tower base under different wind and wave angle conditions (0°, 30°, 60°, and 90°) is illustrated in Figure 5. By comparing the mean axial stress values at various points of the tower base, it is evident that the maximum mean axial stress occurs at point 7. This suggests a potential fatigue risk that warrants further investigation. Additionally, according to Eq. (1), the axial stress varies with an angle like a sinusoidal function. This indicates that as a point moves further away from the direction of the wind and waves in the Y direction, both the absolute value of the mean axial stress decrease. Furthermore, the absolute mean axial stress values on the lee side are slightly higher than those facing the waves. This increase is due to the superposition of the axial stresses resulting from the flatwise bending moment and the axial force acting on the points located on the lee side. Additionally, despite the changes in the wind and wave angles, the difference in average stresses at various points is not significant. Thus, the stresses are not sensitive to variations in wind and wave angles.
The average stress values at different points of the tower base under the aligned wind-wave condition, calculated using the DPIM and MCS methods, are shown in Figure 6 (a). Specifically, the PDF curves of the stress at point 7 of the tower base and the blade root are shown in Figure 6 (b) and Figure 6 (c), respectively.
The comparative results show that the absolute stress at point 7 ranges primarily from 80 MPa to 120 MPa. In contrast, the stress at the blade root typically falls between 20 MPa and 45 MPa. This indicates that the average stress on the supporting structure is higher than that at the blade root. Additionally, the results from both DPIM and MCS are consistent with each other. Furthermore, regarding computational efficiency, the CPU time for DPIM is approximately 22,910 s, while the MCS method takes 611,770 s. This means that DPIM is over 20 times more efficient, demonstrating the accuracy and high efficiency of the proposed method for uncertainty qualification analysis of large-scale wind turbine structures.
3.2. Fatigue Damage Analysis of Wind Turbines Under Combined Wind-Wave Excitation
To comprehensively assess the impact of fatigue accumulation effects under long-term operating conditions, the calculated fatigue damage values are first converted to a damage rate per second, which is then multiplied by the corresponding calculation duration to quantify the accumulation of damage over time. The PDF curves of the fatigue damage at the danger point (point 7) of the tower base and blade root after 20 years of operation under different wind and wave directions are illustrated in Figure 7. When the wind and wave angle is 90°, the probability that the fatigue damage value of the tower base and blade root is less than 1 is the highest compared to all other angle conditions. Additionally, the probability density function (PDF) curves show peaks in the ranges of [0.5, 0.8] and [0, 0.25], indicating the most likely variation ranges of fatigue damage for the tower base and blade root, respectively.
In contrast, when the wind and waves are aligned, the range of the structural fatigue damage values increases, and the probability of values greater than 1 also rises, making the probability of being less than 1 the lowest among all angle conditions. It can be concluded that the wind and wave angles have a significant impact on the fatigue damage of wind turbine structure, with relatively lower fatigue damage observed at 90°, while the probability of fatigue damage values exceeding 1 is highest when the wind and waves are aligned. The diagram comparison indicates that the likelihood of the fatigue damage value at the blade root being less than 0.5 is significantly higher than at the tower base. This suggests that the tower base is more susceptible to fatigue failure compared to the blade root. These findings align with the mean stress results discussed in Section 3.1.
3.3. Fatigue Reliability Analysis of Wind Turbines Under Combined Wind-Wave Excitation
In this section, the impact of wind and wave angle on the fatigue reliability of critical points under different operating years has been further studied. As shown in Figure 8, when the wind and waves are aligned, the assessment of fatigue reliability for the tower base of wind turbines is implemented based on fatigue damage at the danger point (point 7). As the wind and wave angle increases from 0° to 90°, the fatigue reliability of wind turbines shows a significant upward trend, which corresponds with the previously analyzed fatigue damage value results in Section 3.2.
As the operational lifespan of the wind turbine increases, the fatigue reliability of the tower base at various points shows a gradual decline. Under the aligned wind-wave condition, when the operational lifespan extends to the design life of 20 years, the fatigue reliability of the wind turbine is 0.855. This relatively high value indicates that the wind turbine structure possesses a significant level of fatigue reliability within the design life. However, when the operational lifespan is extended to 25 years, the fatigue reliability is significantly reduced to 0.704, indicating the adverse effects of long-term operation on the fatigue performance of the wind turbine structure. This result indicates that once the operational lifespan of the wind turbine exceeds its design life, the fatigue reliability of the wind turbine structure will gradually decline, with this downward trend becoming increasingly pronounced as the operational lifespan continues to increase.
Furthermore, the fatigue reliability of blade root for the wind turbines is also given in Figure 9. It can be seen that the combined effects of wind and waves significantly impact the fatigue reliability of the blade.
The fatigue reliability begins to sharply decline when the operational lifespan is much less than the designed lifespan (20 years) of wind turbines. Moreover, when the angle between the wind and waves is small (e.g., 0°and 30°,), the stochastic environmental excitation significantly affects the fatigue reliability of the wind turbine blades. In comparison to the misaligned wind-wave condition, the aligned wind-wave condition results in a greater impact of this excitation, leading to a decrease in fatigue reliability from 0.864 at a design life of 20 years to 0.746 at 25 years. Notably, as illustrated in Figure 8 and Figure 9, after the wind turbine has been in operation for more than 20 years, the fatigue reliability of the wind turbine structure sharply decreases. Therefore, it is essential to conduct regular inspections, maintenance, or reinforcements in high-risk areas to ensure the long-term safe and stable operation of the wind turbines.
4. Conclusions
In this paper, an efficient analysis method for the fatigue reliability of the 5 MW spar offshore wind turbine structure is proposed based on DPIM. The main conclusions are as follows:
(1) This paper develops DPIM to address the stochastic response and structural fatigue reliability analyses of key components for floating offshore wind turbines under combined wind-wave excitation. The proposed uncertainty quantification method can be applied as an alternative tool for floating offshore wind turbine structures with multiple uncertain factors.
(2) Compared to typical MCS, DPIM has high accuracy and significantly improves computational efficiency, making the assessment for the fatigue reliability analysis of key components for floating offshore wind turbine structures more efficient.
(3) The results of the uncertainty quantification analysis of the wind turbine under the combined wind-wave excitation indicate that the fatigue reliability of the tower base and blade root significantly decreases over time. Under the aligned wind-wave condition, when the wind turbine operates up to its design life of 20 years, the fatigue reliabilities of the tower base and blade root are 0.855 and 0.864, which is lower than under other angle conditions but still demonstrates high reliability. When the operational life cycle reaches 25 years, the fatigue reliabilities of the tower base and blade root are dropped to only 0.704 and 0.746, indicating a sharp decline in reliability. At this stage, regular inspections, maintenance, or reinforcements of high-risk areas are required to ensure the long-term safe and stable operation of the wind turbine.
Author Contributions
For research articles with several authors, a short paragraph specifying their individual contributions must be provided. The following statements should be used “Conceptualization, Jingyi Ding and Zhuojia Fu; methodology, Hanshu Chen; software, Jingyi Ding; validation, Youssef F. Rashed, Zhuojia Fu and Hanshu Chen; formal analysis, Xiaoting Liu; investigation, Youssef F. Rashed; resources, Zhuojia Fu; data curation, Jingyi Ding; writing—original draft preparation, Jingyi Ding; writing—review and editing, Hanshu Chen; visualization, Jingyi Ding; supervision, Zhuojia Fu; project administration, Xiaoting Liu; funding acquisition, Hanshu Chen and Zhuojia Fu. All authors have read and agreed to the published version of the manuscript.” Please turn to the CRediT taxonomy for the term explanation. Authorship must be limited to those who have contributed substantially to the work reported.
Funding
This research was funded by the National Natural Science Foundation of China (grant Nos. 12372196, 12402238); Jiangsu Funding Program for Excellent Postdoctoral Talent (Grant No. 2023ZB506); and Postdoctoral Fellowship Program of CPSF (Grant No. GZC20230667).
Institutional Review Board Statement
Not applicable.
Informed Consent Statement
Not applicable.
Data Availability Statement
The data presented in this study are available upon request from the corresponding author.
Acknowledgments
The supports of the National Natural Science Foundation of China (Grant Nos. 12372196, 12402238), Jiangsu Funding Program for Excellent Postdoctoral Talent (Grant No. 2023ZB506) and Postdoctoral Fellowship Program of CPSF (Grant No. GZC20230667) are much appreciated.
Conflicts of Interest
The authors declare no conflicts of interest.
References
- Fernando, P.-A.; Majid, B.; Sina, S. Wind-Turbine and Wind-Farm Flows: A Review. Bound-Lay Meteor. 2020, 174, 1–59. [Google Scholar]
- Gui, Q.; Zhang, G.Y.; Chai, Y.B.; Li, W. A finite element method with cover functions for underwater acoustic propagation problems. Ocean Eng. 2022, 243, 110174. [Google Scholar] [CrossRef]
- Toft, H.S.; Sørensen, J.D. Reliability-based design of wind turbine blades. Struct Saf. 2011, 33, 333–342. [Google Scholar] [CrossRef]
- Xu, K.; Larsen, K.; Shao, Y.L.; Zhang, M.; Gao, Z.; Moan, T. Design and comparative analysis of alternative mooring systems for floating wind turbines in shallow water with emphasis on ultimate limit state design. Ocean Eng. 2021, 219, 108377. [Google Scholar] [CrossRef]
- Colone, L.; Natarajan, A.; Dimitrov, N. Impact of turbulence induced loads and wave kinematic models on fatigue reliability estimates of offshore wind turbine monopiles. Ocean Eng. 2018, 155, 295–309. [Google Scholar] [CrossRef]
- Wilkie, D.; Galasso, C. Gaussian process regression for fatigue reliability analysis of offshore wind turbines. Struct Saf. 2021, 88, 102020. [Google Scholar] [CrossRef]
- Fu, B.; Zhao, J.B.; Li, B.Q.; Yao, J.; Teifouet, A.R.M.; Sun, L.Y.; Wang, Z.Y. Fatigue reliability analysis of wind turbine tower under random wind load. Struct Saf. 2020, 87, 101982. [Google Scholar] [CrossRef]
- Zhao, G.H.; Dong, S.; Zhao, Y.L. Fatigue reliability analysis of floating offshore wind turbines under the random environmental conditions based on surrogate model. Ocean Eng. 2024, 314, 119686. [Google Scholar] [CrossRef]
- Valdebenito, M.A.; Jensen, H.A.; Labarca, A.A. Estimation of first excursion probabilities for uncertain stochastic linear systems subject to Gaussian load. Comput Struct. 2014, 138, 36–48. [Google Scholar] [CrossRef]
- Li, J.; Chen, J.B. Stochastic Dynamics of Structures; John Wiley & Sons, Ltd: Singapore, 2009; pp. 192–195. [Google Scholar] [CrossRef]
- Melchers, R.E.; Beck, A.T. Structural reliability analysis and prediction, 2nd ed.; John Wiley & Sons: New York, USA, 2017; pp. 95–130. [Google Scholar] [CrossRef]
- Chen, G.H.; Yang, D.X. Direct probability integral method for stochastic response analysis of static and dynamic structural systems. Comput Methods Appl Mech Eng. 2019, 357, 112612. [Google Scholar] [CrossRef]
- Chen, G.H.; Yang, D.X. A unified analysis framework of static and dynamic structural reliabilities based on direct probability integral method. Mech Syst Signal Process. 2021, 158, 107783. [Google Scholar] [CrossRef]
- Meng, Z.; Zhao, J.Y.; Chen, G.H.; Yang, D.X. Hybrid uncertainty propagation and reliability analysis using direct probability integral method and exponential convex model. Reliab. Eng. Syst. Saf. 2022, 228, 108803. [Google Scholar] [CrossRef]
- Jonkman, J.M.; Butterfield, S.; Musial, W.; Scott, G. Definition of a 5-MW Reference Wind Turbine for Offshore System Development. 2009. [CrossRef]
- DNV-RP-C203: Fatigue design of offshore steel structures. 2011.
- Miner, M.A. Cumulative Damage in Fatigue. J. Appl. Mech. 1945, 12, A159–A164. [Google Scholar] [CrossRef]
- Jonkman, J.M. Definition of the Floating System for Phase IV of OC3. 2005. [CrossRef]
- Jonkman, J.M.; Buhl, J.M. FAST User's Guide. 2005. [CrossRef]
- Roald, L.; Jonkman, J.M.; Robertson, A.; Chokani, N. The Effect of Second-order Hydrodynamics on Floating Offshore Wind Turbines. Energy Procedia. 2013, 35, 253–264. [Google Scholar] [CrossRef]
- Wind energy generation systems-Part 3-2: Design requirements for floating offshore wind turbines. 2019.
- Dee, D.P.; Uppala, S.M.; Simmons, A.J.; Berrisford, P.; Poli, P. , et al. The ERA-Interim reanalysis: configuration and performance of the data assimilation system. Q. J. R. Meteorolog. Soc. 2011, 137, 553–597. [Google Scholar] [CrossRef]
- Song, Y.P.; Sun, T.; Zhang, Z.L. Fatigue reliability analysis of floating offshore wind turbines considering the uncertainty due to finite sampling of load conditions. Renew. Energy. 2023, 212, 570–588. [Google Scholar] [CrossRef]
- Kvittem, M.I.; Moan, T. Time domain analysis procedures for fatigue assessment of a semi-submersible wind turbine. Mar. struct. 2015, 40, 38–59. [Google Scholar] [CrossRef]
- Matsuichi, M.; Endo, T. Fatigue of metals subjected to varying stress. John Wiley & Sons: New York, USA, 1968.
Figure 1.
5MW OC3 Spar-type FOWT.
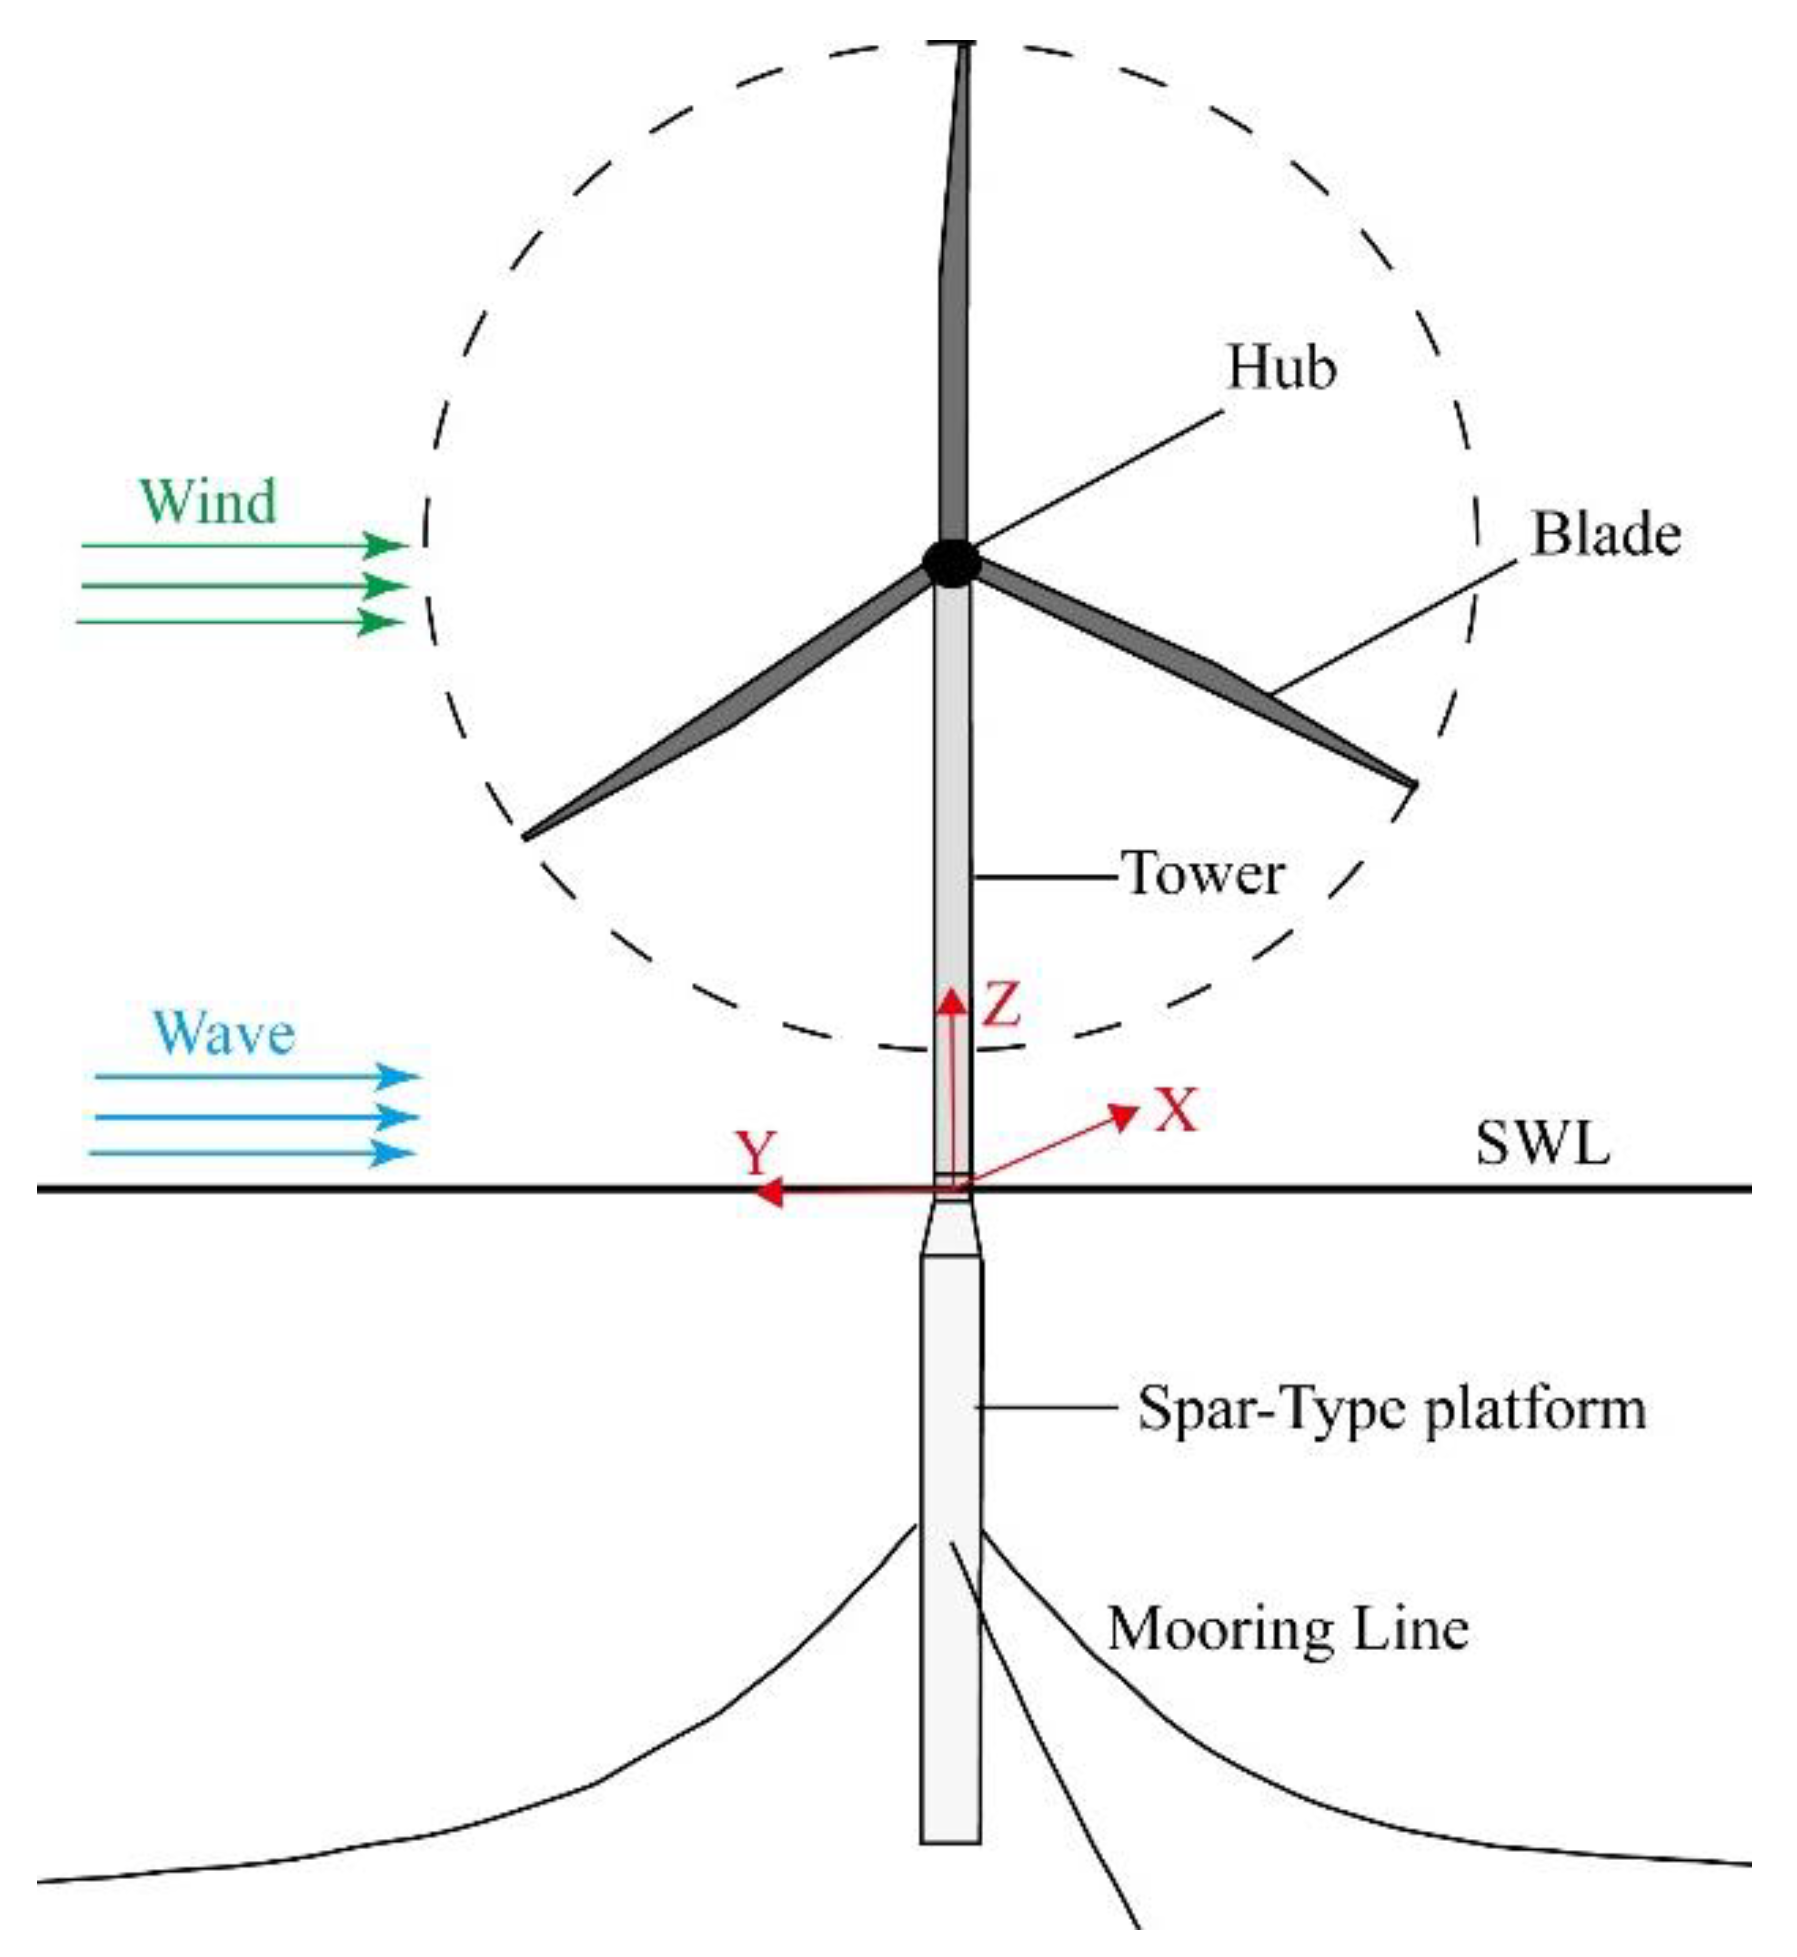
Figure 2.
PDF curves of wind and wave loading parameters under DPIM: (a) Mean wind speed; (b) Significant wave height; (c) Spectral peak period.
Figure 2.
PDF curves of wind and wave loading parameters under DPIM: (a) Mean wind speed; (b) Significant wave height; (c) Spectral peak period.
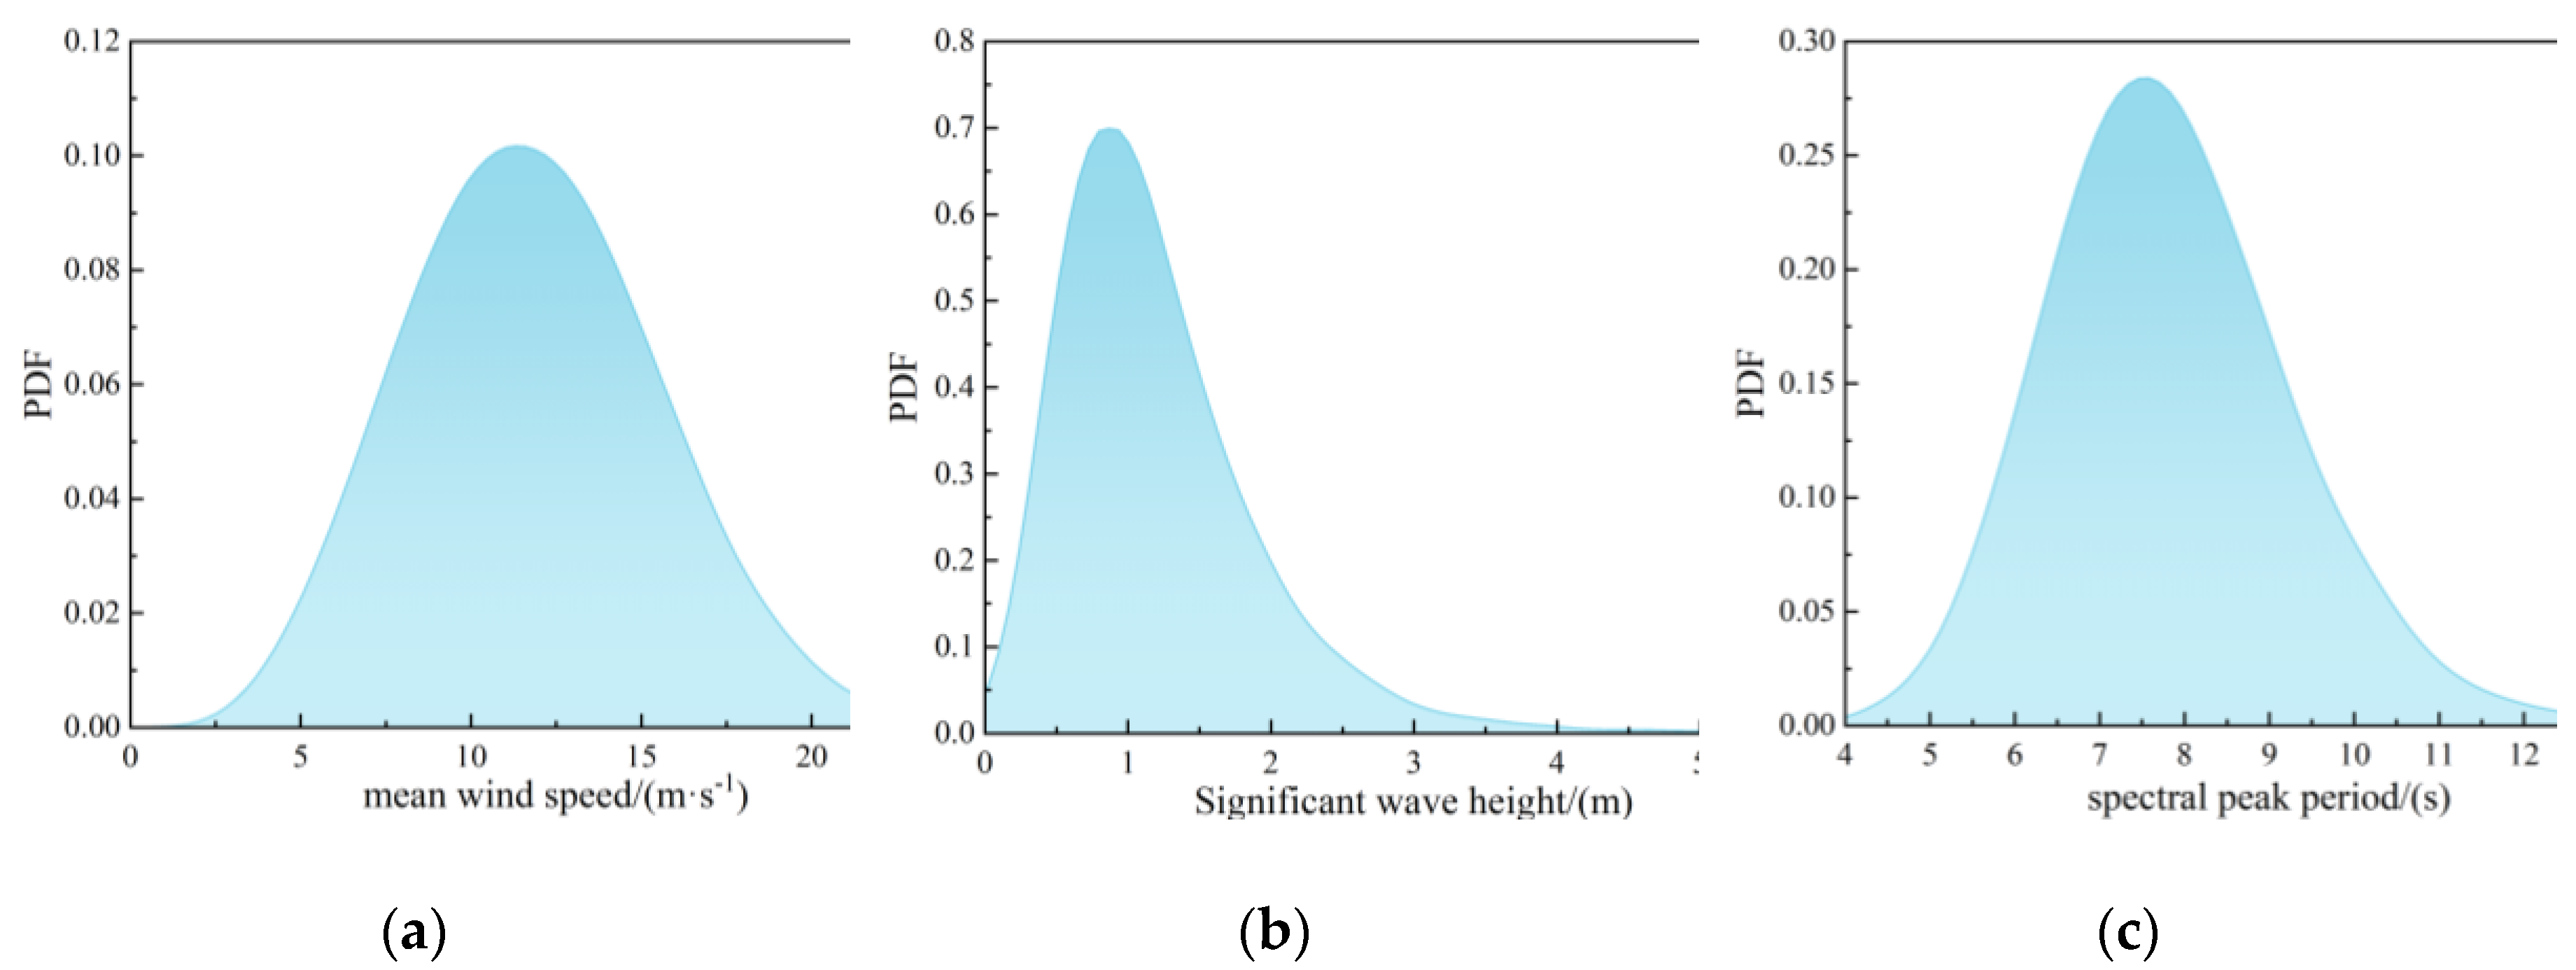
Figure 3.
Top view of the tower base.
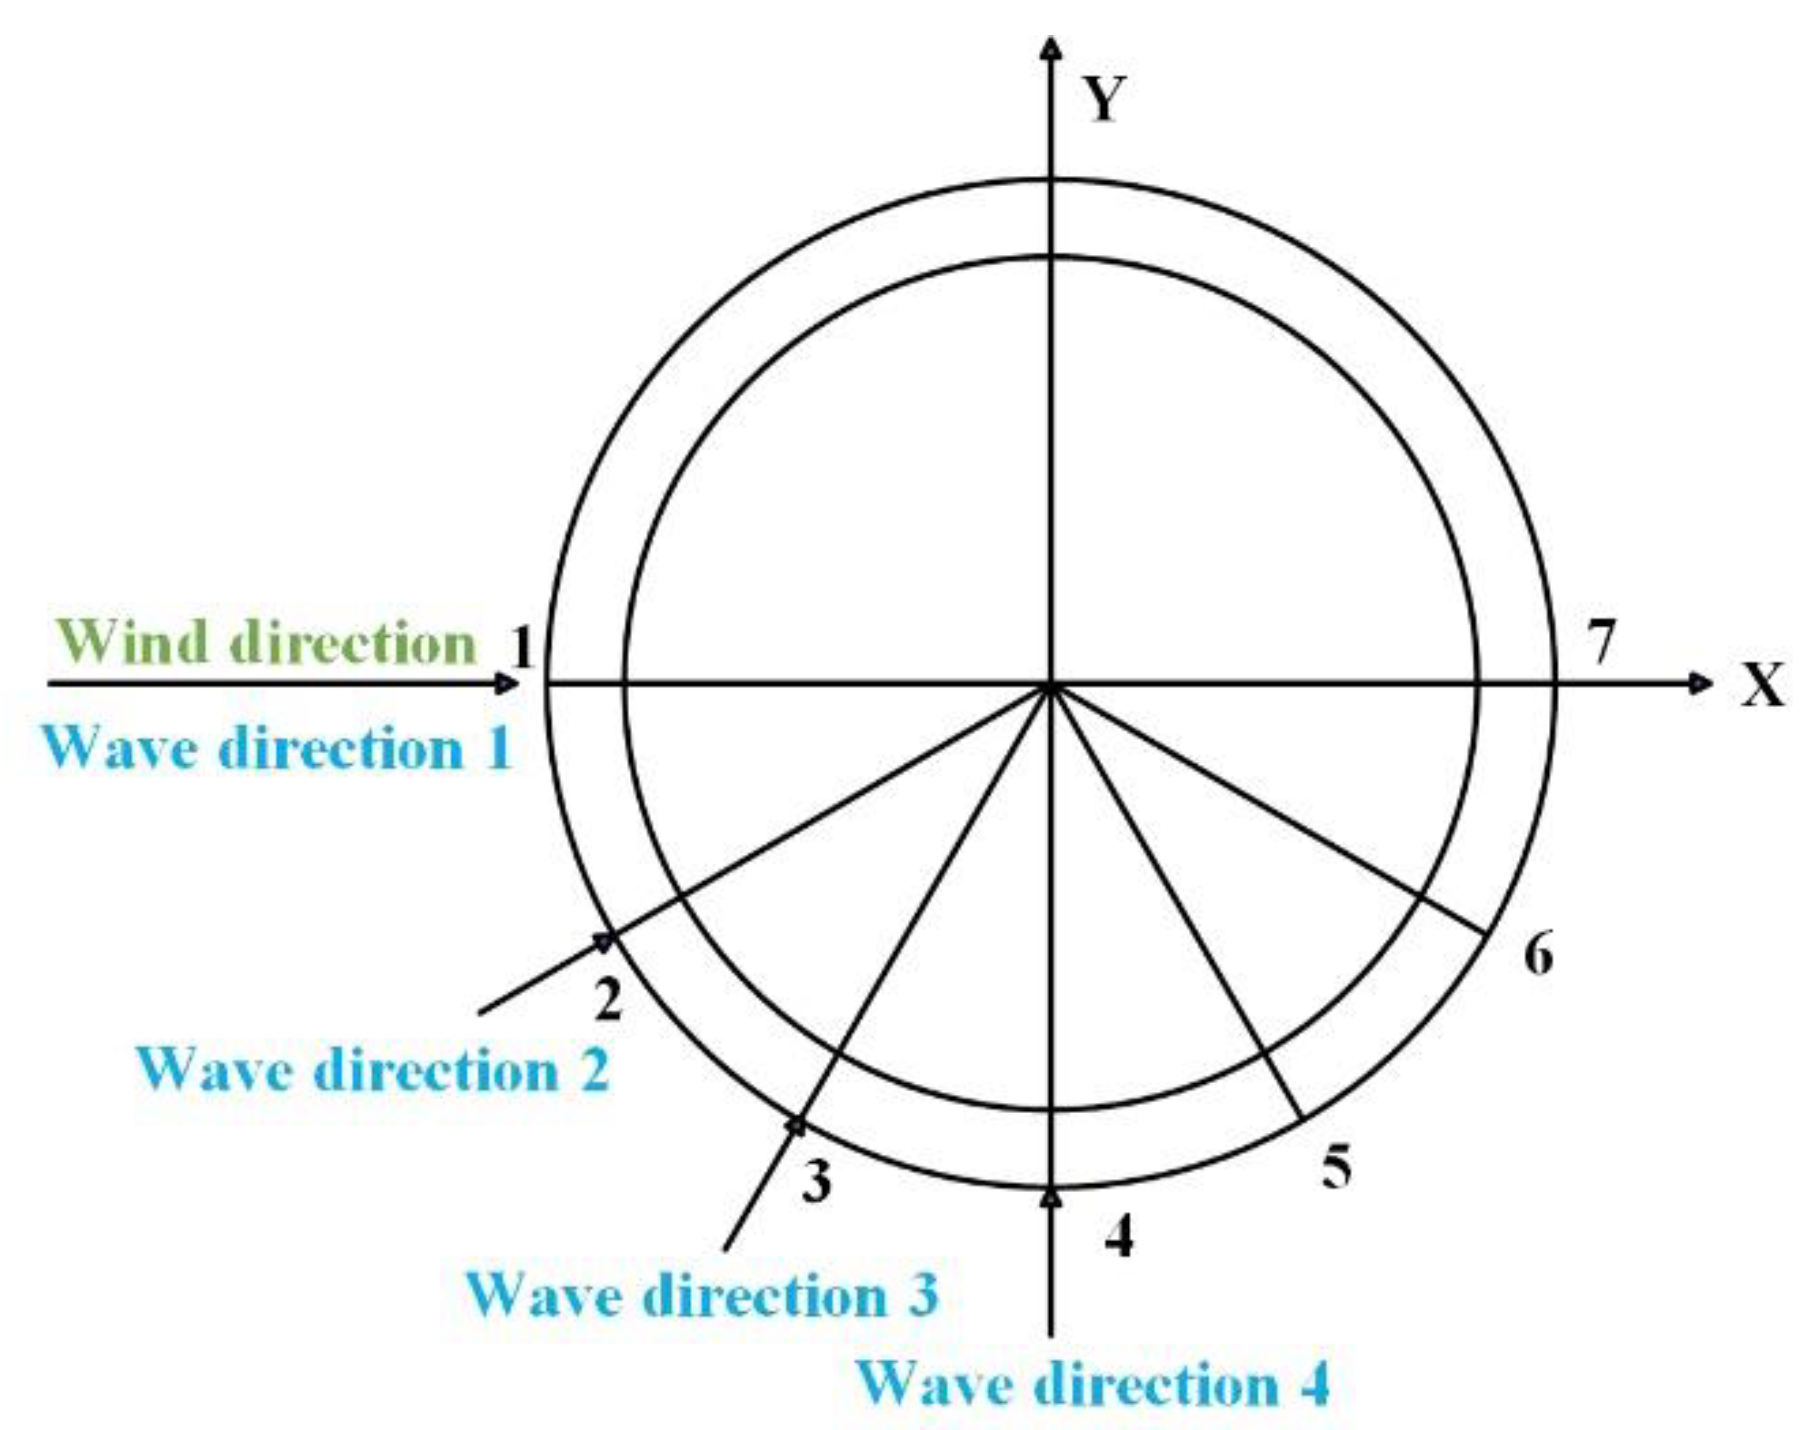
Figure 4.
The coordinate system of the wind turbine blade.
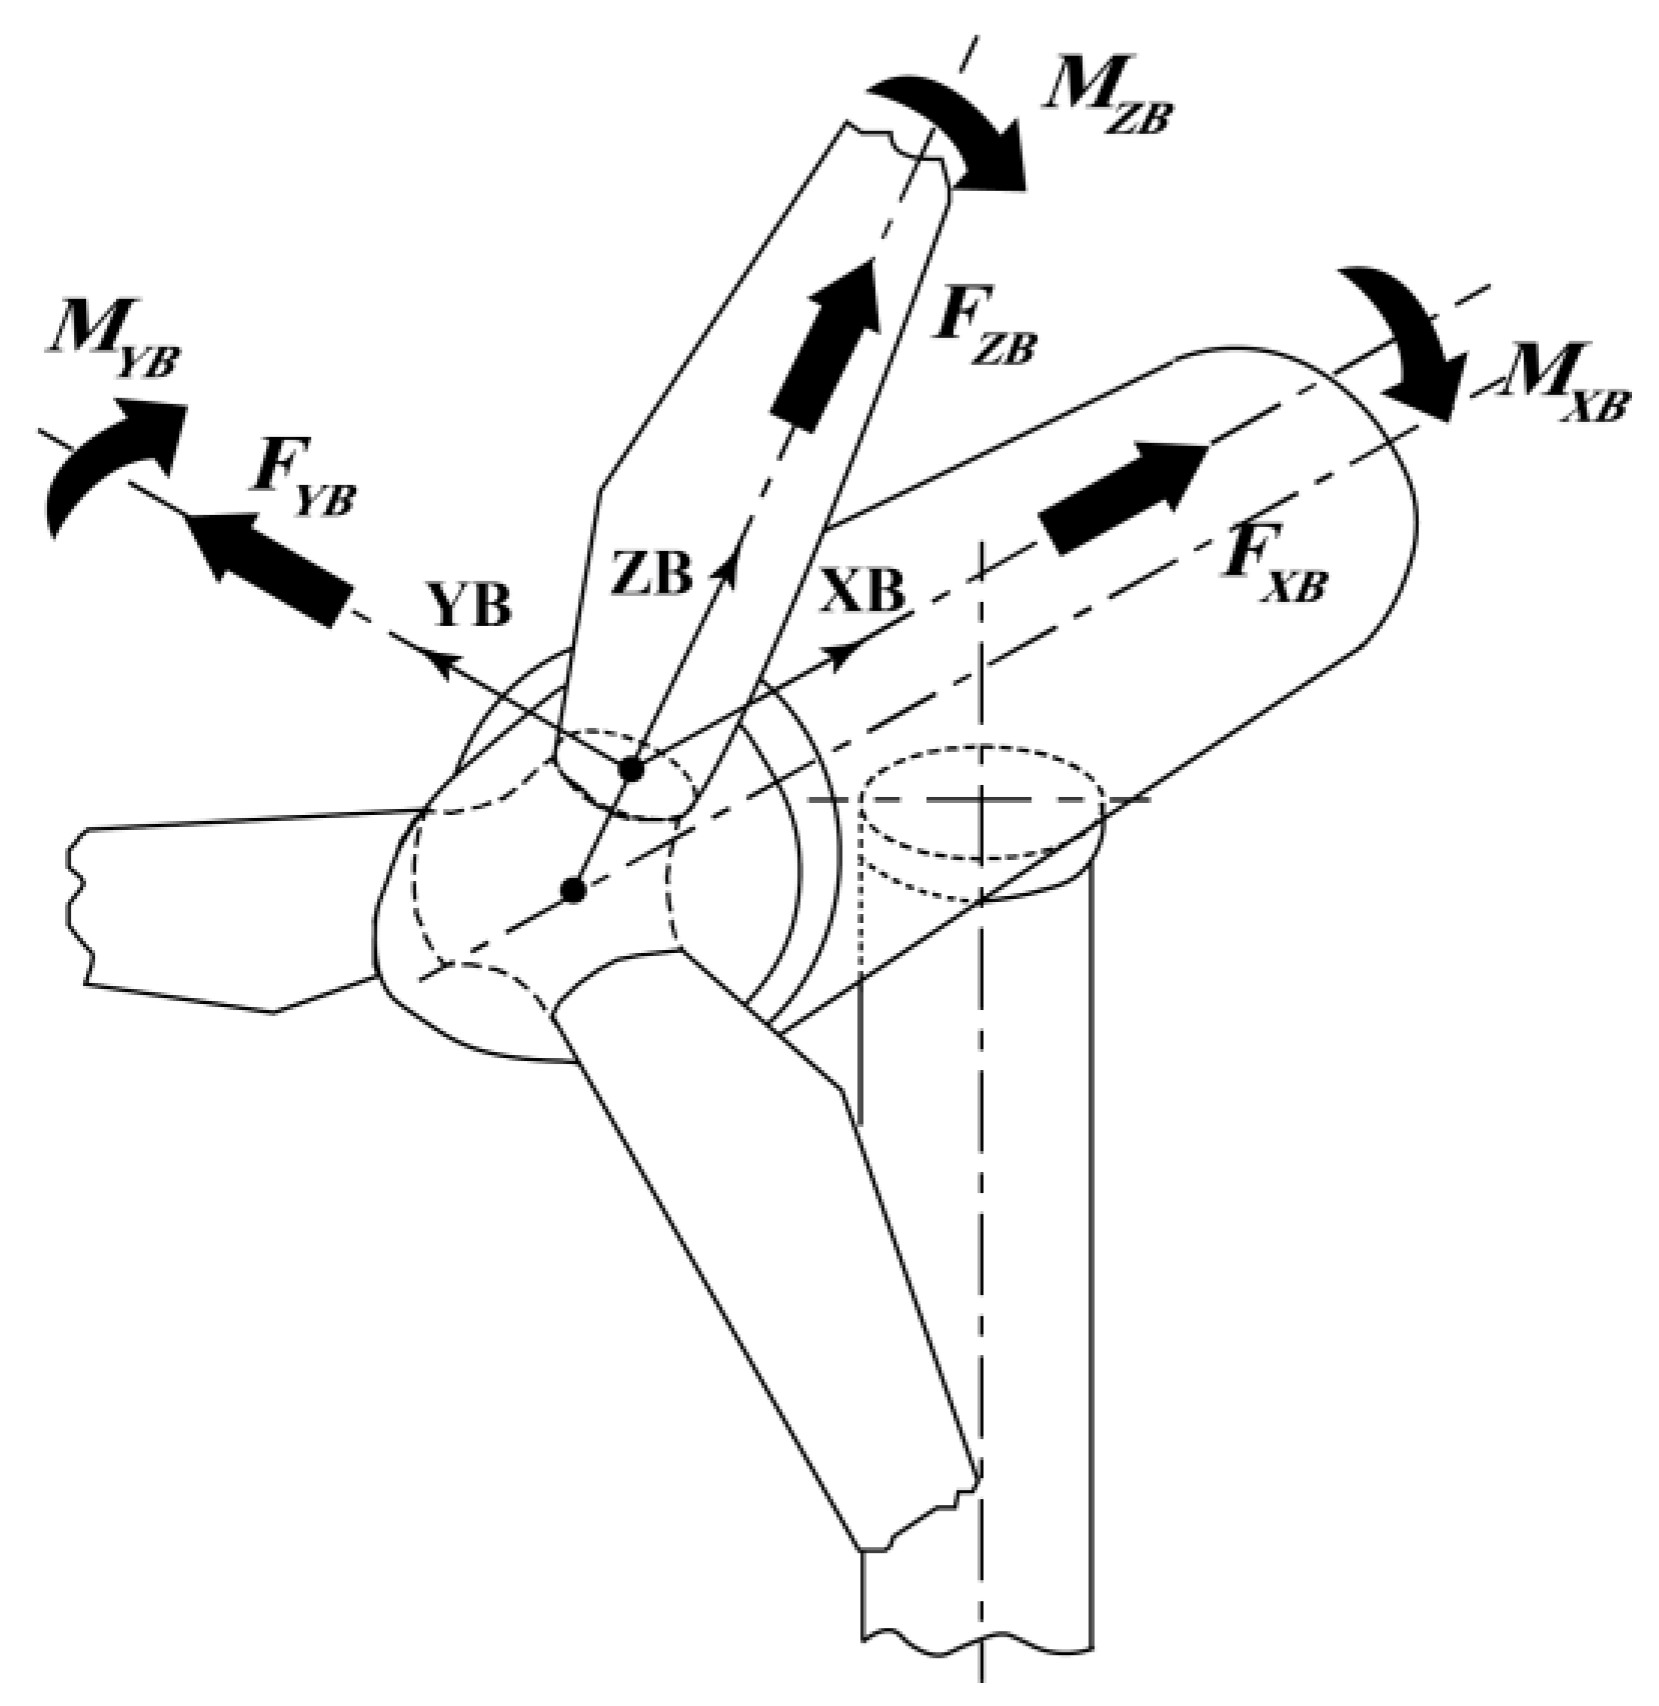
Figure 5.
Comparison of mean axial stress under different wind and wave angle conditions.
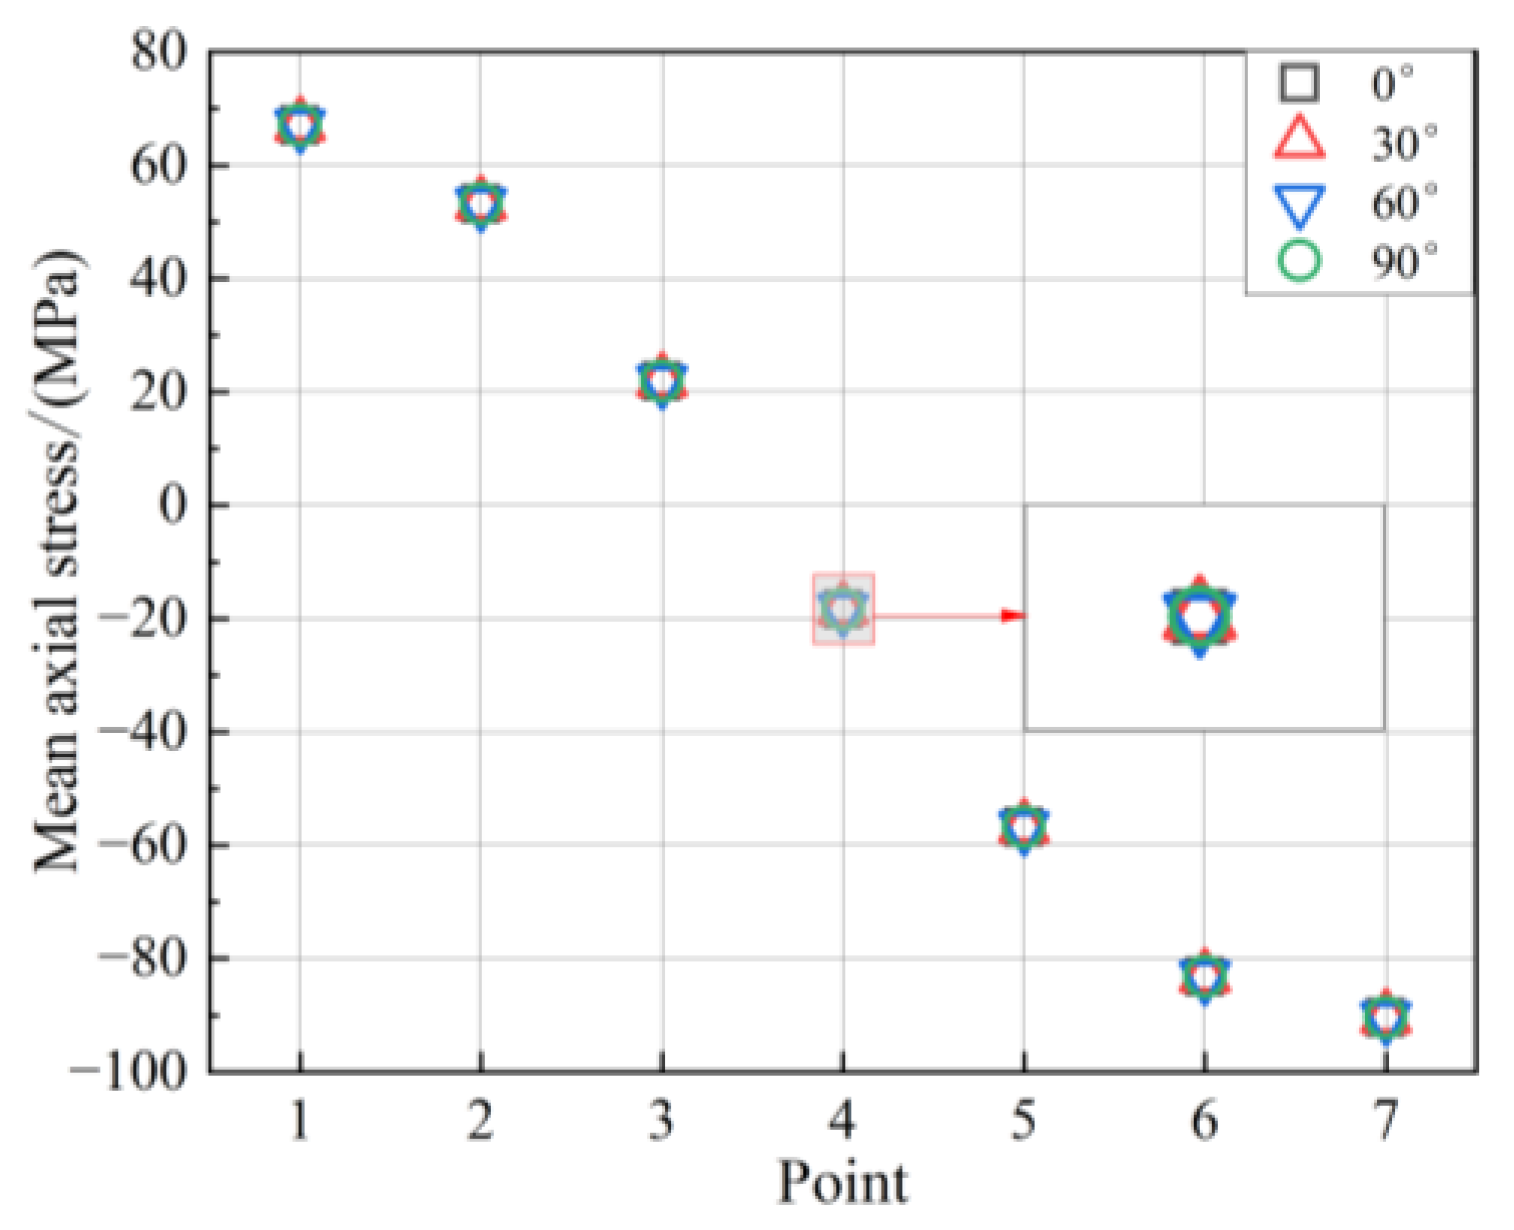
Figure 6.
Comparison of mean stress results under different methods: (a) mean axial stress at point 7 of tower base; (b) PDF curves of mean axial stress at point 7 of tower base; (c) PDF curves of mean stress at the blade root.
Figure 6.
Comparison of mean stress results under different methods: (a) mean axial stress at point 7 of tower base; (b) PDF curves of mean axial stress at point 7 of tower base; (c) PDF curves of mean stress at the blade root.
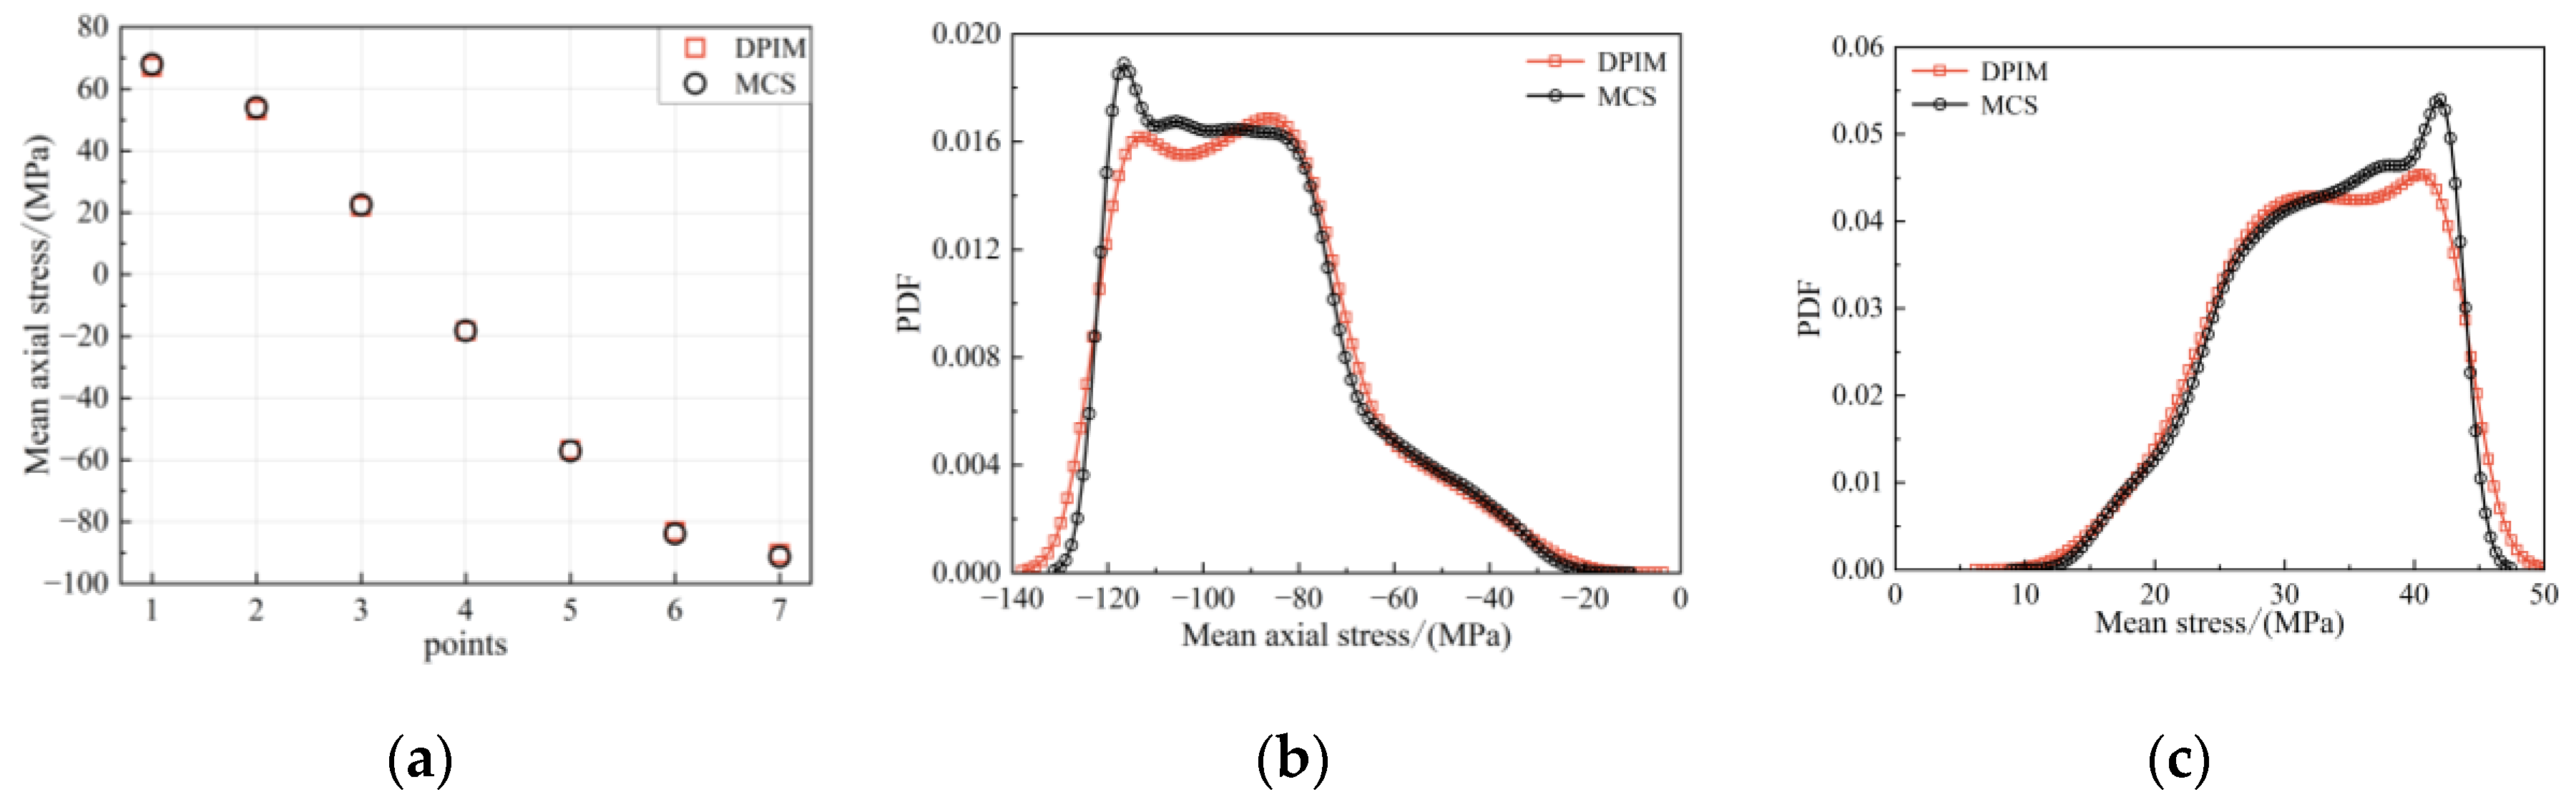
Figure 7.
Comparison of PDF curves of fatigue damage value at key components under different wind-wave angles: (a) tower base; (b) blade root.
Figure 7.
Comparison of PDF curves of fatigue damage value at key components under different wind-wave angles: (a) tower base; (b) blade root.
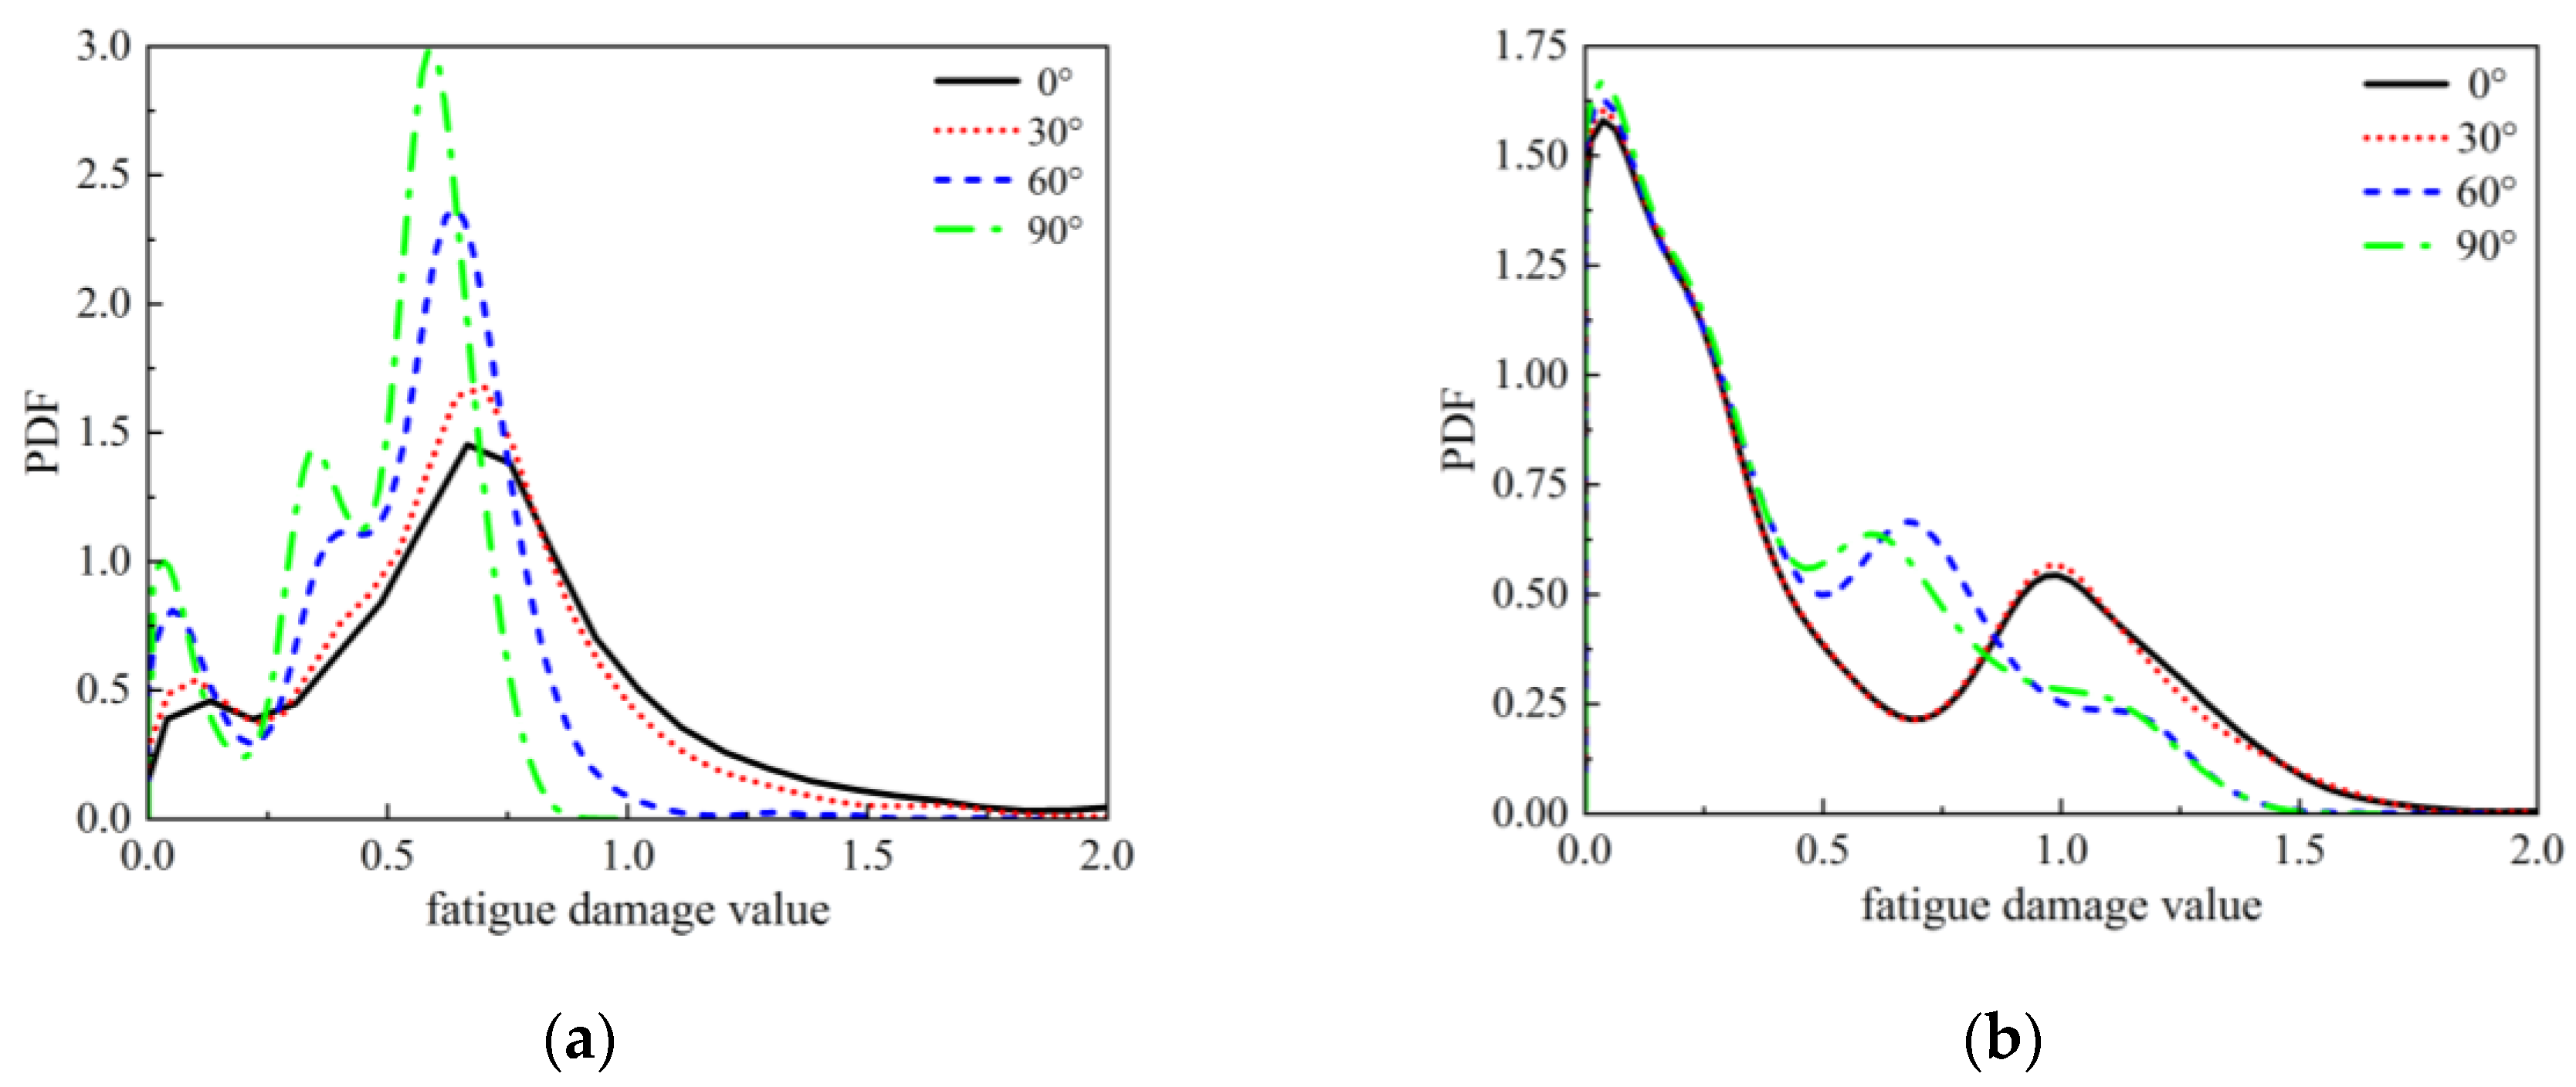
Figure 8.
Comparison of fatigue reliability of tower base under different wind-wave conditions for different operating years.
Figure 8.
Comparison of fatigue reliability of tower base under different wind-wave conditions for different operating years.
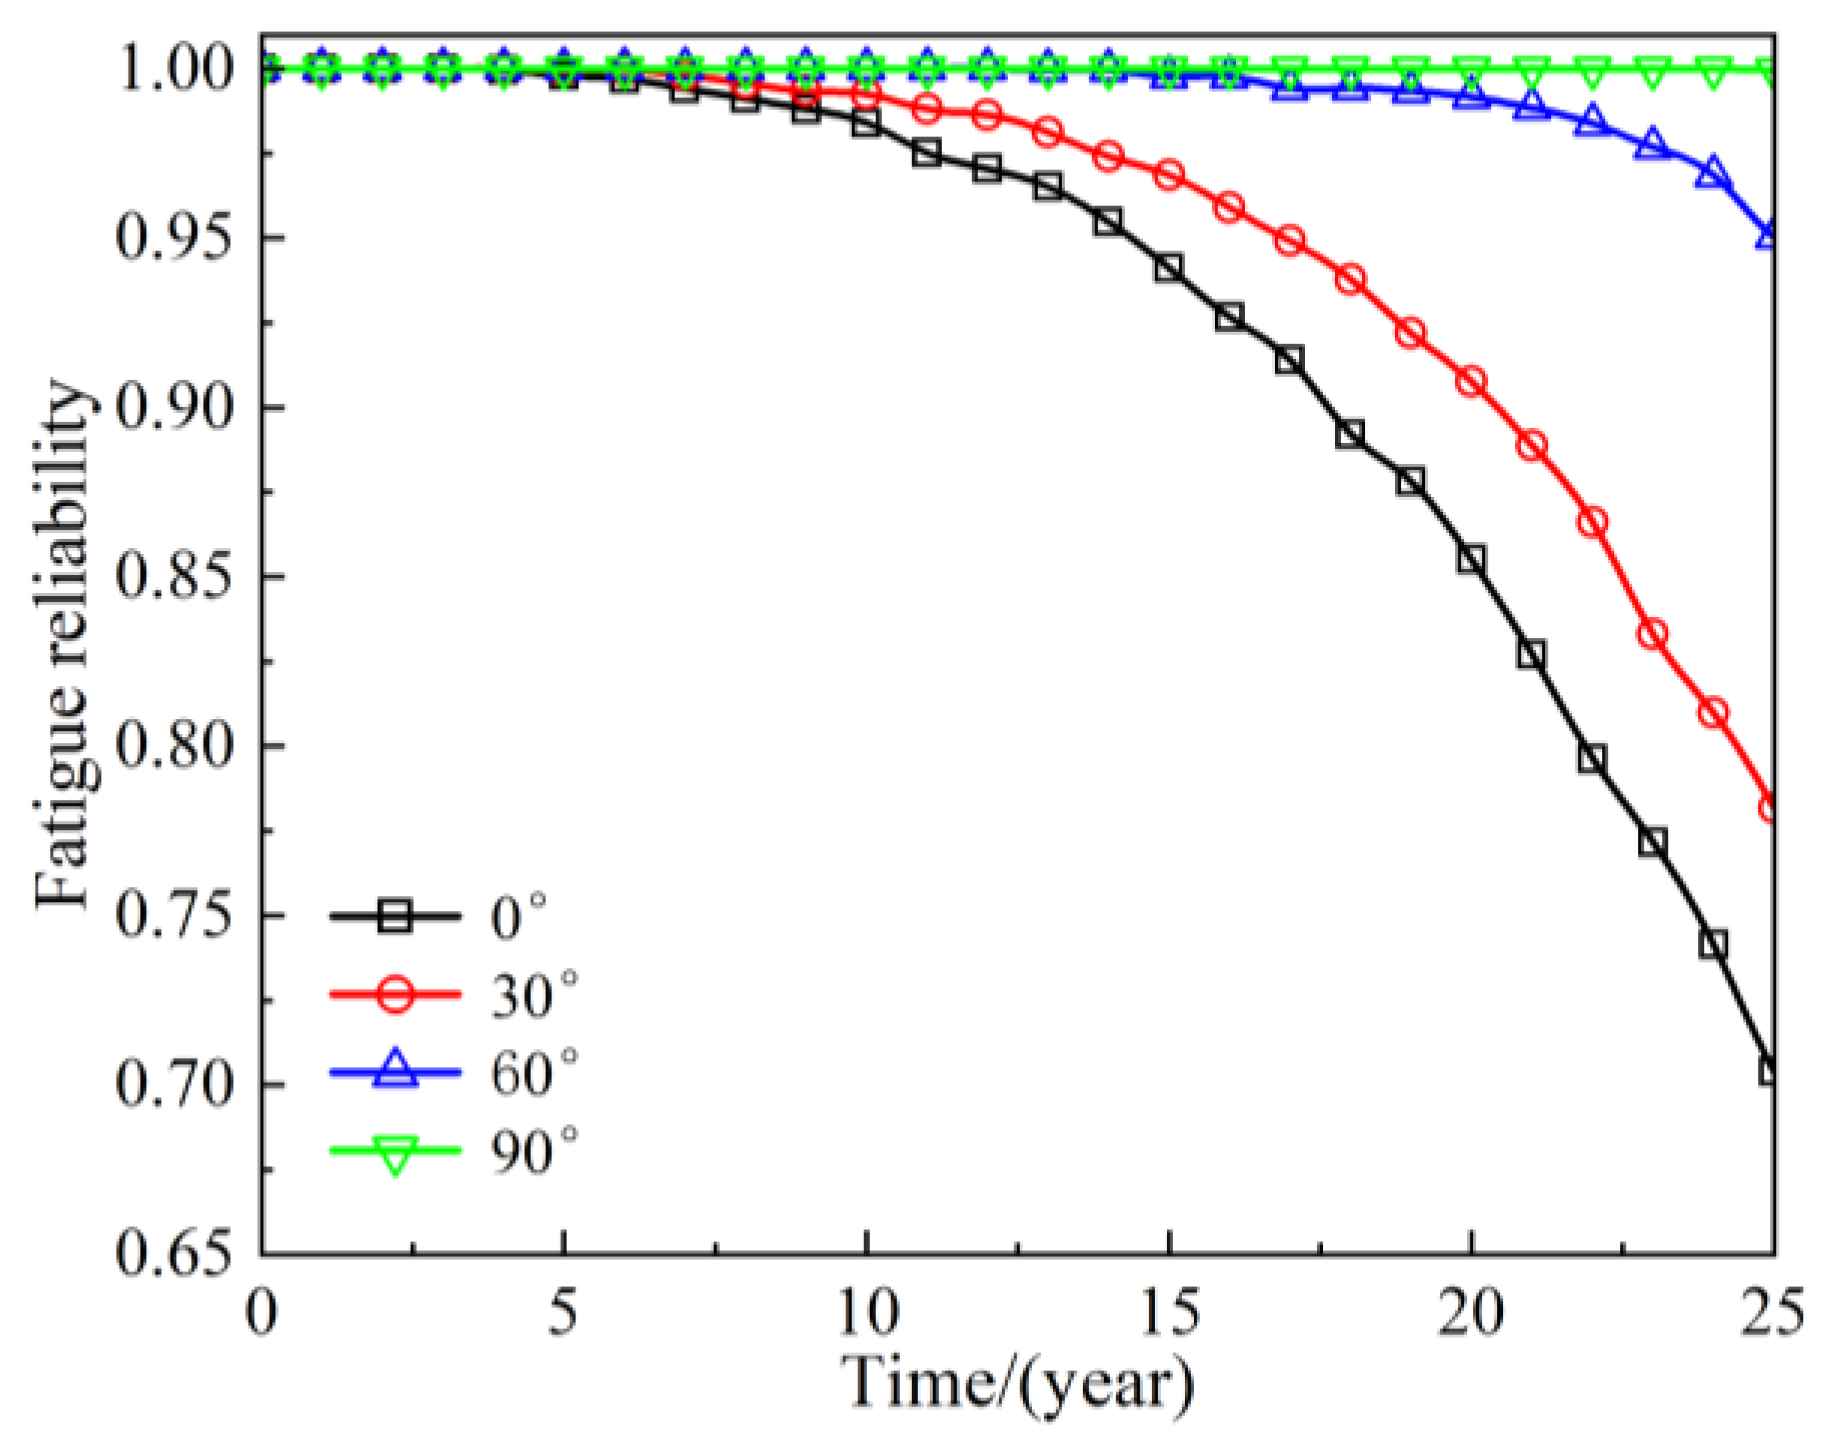
Figure 9.
Comparison of fatigue reliability of blade root under different wind-wave conditions for different operating years.
Figure 9.
Comparison of fatigue reliability of blade root under different wind-wave conditions for different operating years.
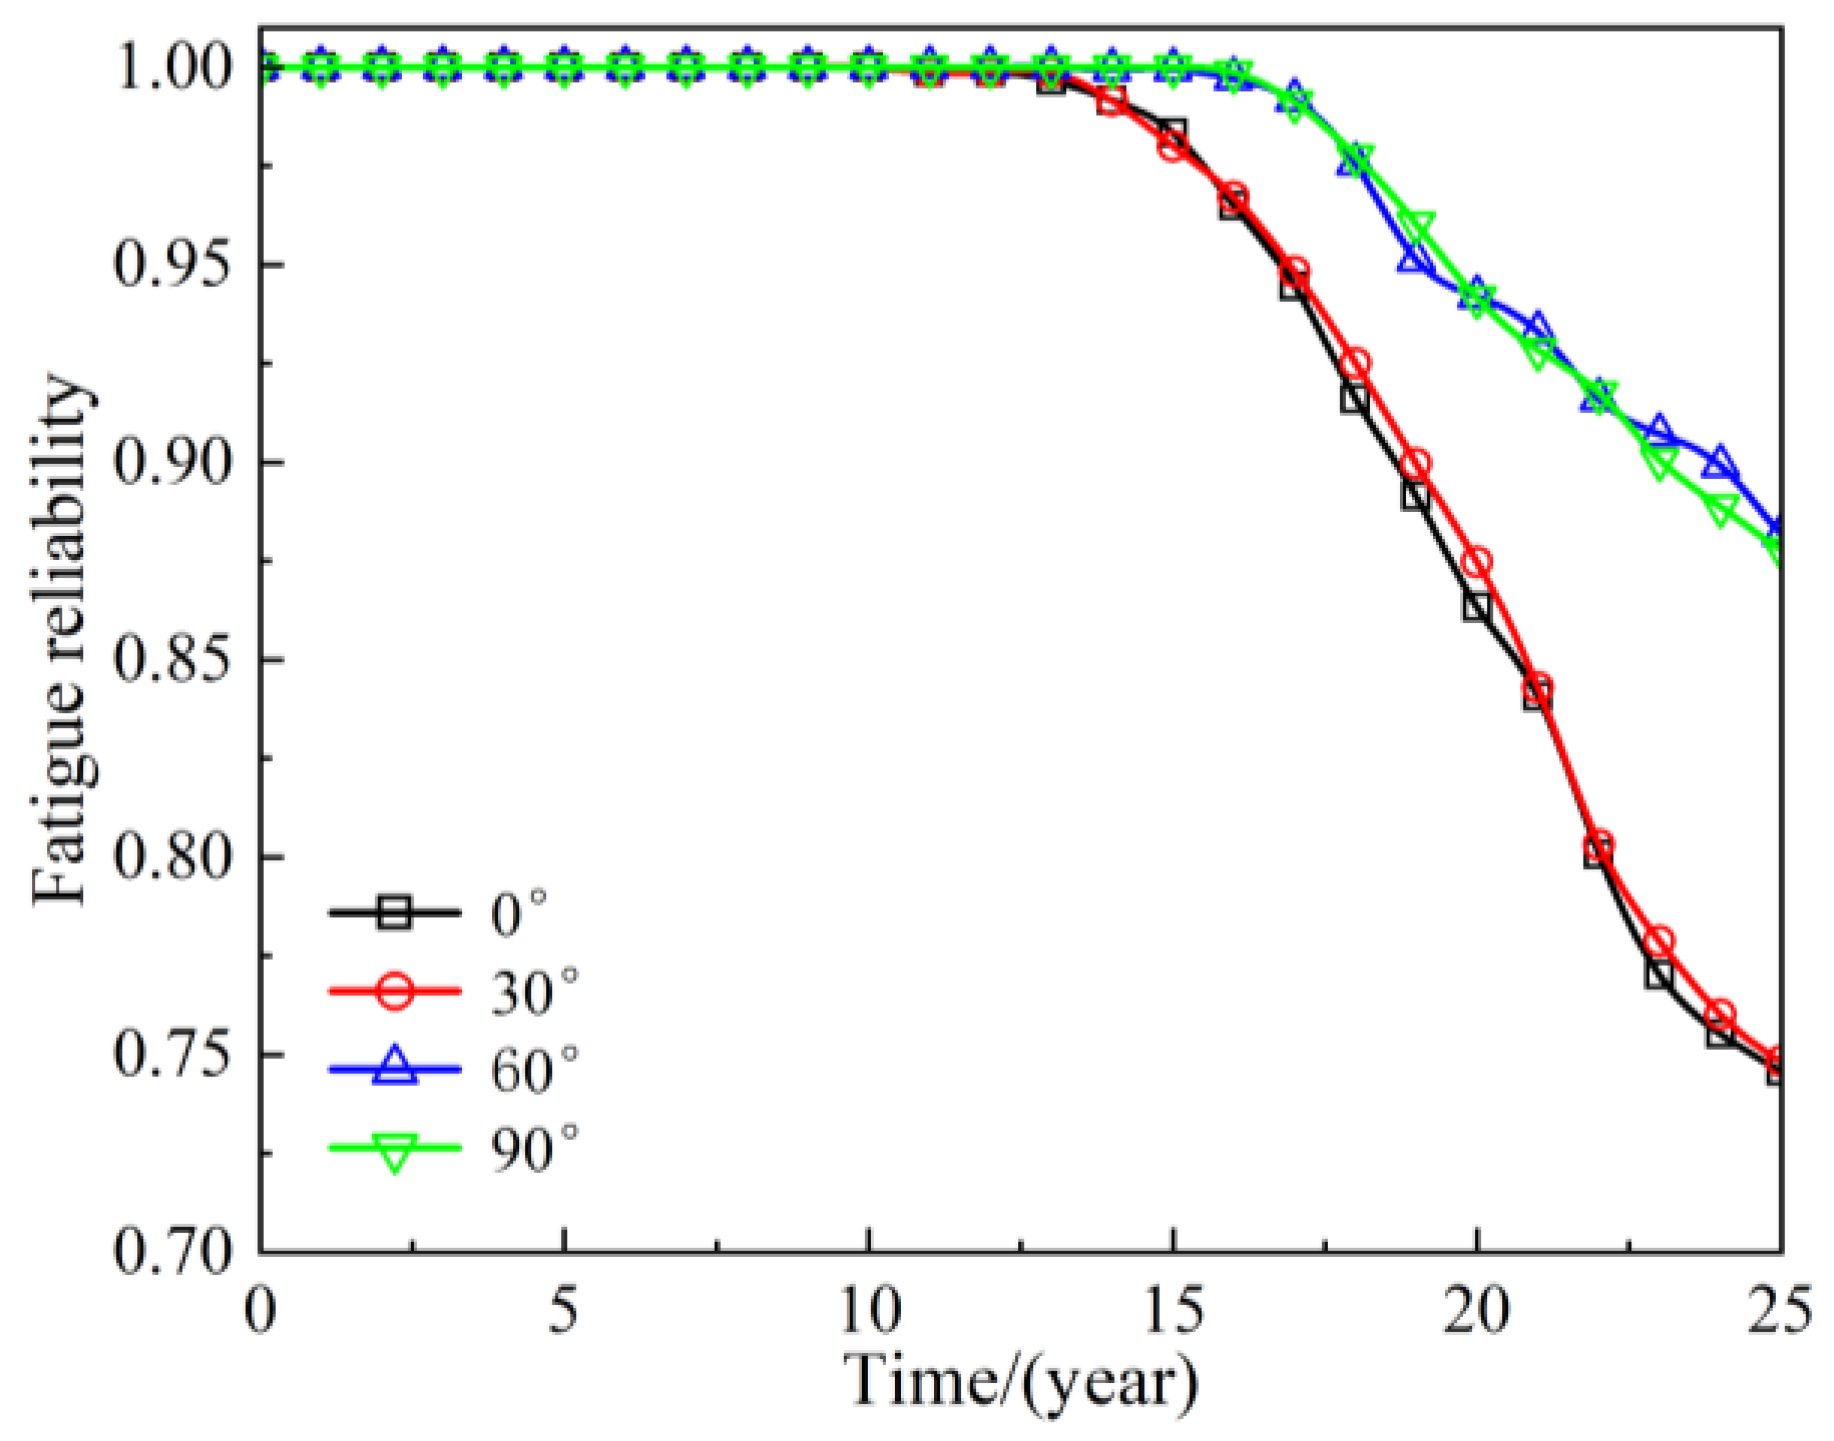

Table 1.
The main properties of the 5MW OC3 Spar-type FOWT.
| Parameter | Value |
| Rating | 5 MW |
| Rotor orientation, configuration | Upwind, 3 blades |
| Rotor and hub diameter, hub height | 126 m, 3 m, 90 m |
| Cut-in, rated, cut-out wind speed | 3 m/s, 11.4 m/s, 25 m/s |
| Cut-in, rated root speed | 6.9 rpm, 12.1 rpm |
| Elevation to tower base above SWL | 10 m |
| Tower base diameter, tower base thickness | 6.5 m, 0.027 m |
Table 2.
Probability distribution models of the environmental random variable.
| Variable | Distribution type | Distribution parameters | |
|---|---|---|---|
| Truncated Weibull |
|
||
| Lognormal |
|
||
| Lognormal |
|
Disclaimer/Publisher’s Note: The statements, opinions and data contained in all publications are solely those of the individual author(s) and contributor(s) and not of MDPI and/or the editor(s). MDPI and/or the editor(s) disclaim responsibility for any injury to people or property resulting from any ideas, methods, instructions or products referred to in the content. |
© 2025 by the authors. Licensee MDPI, Basel, Switzerland. This article is an open access article distributed under the terms and conditions of the Creative Commons Attribution (CC BY) license (http://creativecommons.org/licenses/by/4.0/).
Copyright: This open access article is published under a Creative Commons CC BY 4.0 license, which permit the free download, distribution, and reuse, provided that the author and preprint are cited in any reuse.


