
Submitted:
14 February 2025
Posted:
17 February 2025
You are already at the latest version
Abstract
The chemical composition and molecular structure of the pitch-like products obtained by liquid-phase reaction of bituminous coal with heavy hydrocarbon fractions of coal- and petroleum origin as solvents at a moderate temperature were comprehensively characterized in terms of a new polyaromatic feedstock for needle coke and other valuable high tech carbon materials. The molecular parameters of the pitch-like products were characterized by using FTIR, 1H NMR, 13C NMR and XPS. Liquid-phase chromatography was used to analyze benzo(a)pyrene (BaP) as a carcinogenicity marker, the plasticity was characterized by a softening point. The product obtained using coal tar as solvent was highly aromatic, its aromatic nuclei consisted of predominantly protonated and pericondensed cycles sparsely substituted by CH3 and occasionally CH2 groups. The product obtained using petroleum-derived heavy gas oil as a solvent was less aromatic, its aromatic structure contained mainly protonated and highly alkylated catacondensed chains, which are prone to autogenous surface oxidation at ambient temperature. A remarkable feature of the pitch-like products obtained was that they had a reduced concentration of BaP (up to 40 times less than that in typical coal-tar pitch). In terms of the molecular structure, pitch-like products obtained by low-temperature dissolution of coal can serve as low-carcinogenic polyaromatic raw materials for the production of needle coke and other valuable high tech carbon materials.
Keywords:
coal
; solvents
; dissolution
; pitch
; aromaticity
; needle coke
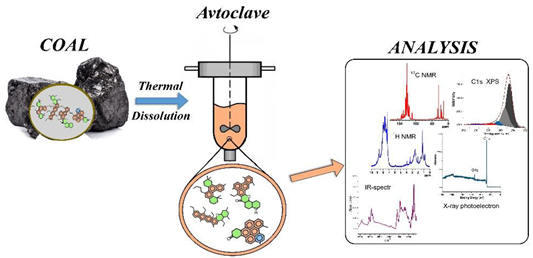
1. Introduction
Needle coke is unique carbon material with pronounced anisotropic properties, high electrical conductivity, low linear coefficient of thermal expansion, high density and resistance to thermal impact and to oxidation [1]. It is a special type of coke with extremely high graphitizability. Due to these unique properties, needle coke is a main raw material for the production of a wide range of graphite materials for the most important fields of engineering and technology: for production of various graphite electrodes [2] and modern energy devices for storing and using energy, such as lithium-ion batteries and supercapacitors, the demand for which is growing rapidly [3], graphite rods for nuclear reactors, various aerospace engineering products. By far the most important and large-scale needle coke application is in the production of ultra-high-power graphite electrodes for smelting of high quality steel in the electric arc furnaces [2]. The electric arc melting method is intensively progressing throughout the world because of its efficiency, high quality of steel produced and favorable environmental characteristics [2]. So, as long as steelmaking continues to grow, electric steel production, which requires high-quality graphite electrodes, will grow at a faster rate [4,5].
Needle coke is produced by delayed carbonization of highly aromatic (several condensed aromatic rings per cluster) feedstocks [1,6]. Suited feedstocks are currently coal tar (or coal-tar pitch) and residual fractions of primary and secondary processes of petroleum refining. The main requirements to raw materials are as follows: high content of the polyaromatic hydrocarbons (aromaticity of 60–85%), low sulfur (preferably below 1 wt.%), asphaltenes, metals and ash contents and high initial boiling point (over 250 °C) [7,8]. Critically important components are planar polyaromatic hydrocarbons of moderate chemical reactivity, having certain configuration with three to five rings and with optimal degree of substitution. Essential for needle coke morphology are the formation and coalescence of mesophase spherules and their orientation by upstreaming liquids and gaseous cracking products in the liquid-phase delayed coker drum. Favorable components of the feedstock are naphthenic and naphthenic-aromatic hydrocarbons, which ensure controlled mesophase development due to hydrogen donation ability. Multisubstituted aromatics demotes coalescence of mesophase spherules and anisotropy of the resultant coke. To obtain high-quality needle coke, the industrial feedstock is subjected to appropriate processing to adjust the composition and to balance the thermally reactive compounds (such as alkanes, alkyl chains) and thermally stable polyaromatics.
It should be noted that, currently, the entire global petroleum industry is characterized by a steady increase in the share of high-sulfur heavy petroleum [9,10]. Its use requires complex purification from sulfur, asphaltenes, metals and aromatization, which significantly increases the cost of the final product. The resources of coal tar are also limited, its yield on coal coking does not exceed 4–5%, and the production volumes have been steadily declining in recent decades [11,12] because of irreversible decline in demand for metallurgical coke due to priority development of coke-free technologies and tightening of environmental safety requirements for blast furnaces and coke plants [13]. Also, coal tar has a disadvantage associated with a high content of environmentally hazardous carcinogenic compounds, such as benz(a)pyrene. Growing demand for polyaromatic feedstock for the production of many graphite materials is driving the search for new feedstocks.
A promising and reliable type of polyaromatic feedstocks may be the products obtained by chemical processing of coals, such as thermal dissolution and hydrogenation instead of coking. For example, it has been reported [14] that high-quality needle coke can be obtained from the polyaromatic residual fraction of the coal hydrogenation process at the Shenhua plant in China. On the other hand, the organic coal matter is inherently polyaromatic, and the extraction of polyaromatic compounds at moderate temperature may be the most promising alternative. Last two decades, this process has attracted much attention [15,16,17,18,19,20,21]. Shui et al. [15] studied dissolution of Chinese coals using 1-methylnaphthalene (1-MN) and crude methylnaphthalene oil (CMN) as solvents. FTIR and CP/MAS 13C NMR spectra showed the products obtained to consist of predominantly aromatic substances (the aromaticity of 60% to 80% depending on the solvent used). More aromatic substances were produced from coal dissolution using CMN as solvent. Griffith et al. [16] used light cycle oil from the catalytic cracking of vacuum gas oil as solvent for coal dissolution at mild temperature of 350 °C. The products obtained from the Pittsburgh bituminous coal were shown to consist of bi- and tricyclic aromatic compounds. Rahman et al. [17] studied the composition of the products obtained by coal dissolution using heavy hydrocarbon fractions as solvents. The predominantly aromatic nature of the products was shown by FTIR, CP/MAS 13C NMR techniques.
Japanese researchers obtained ash-free HyperCoal product by dissolution of coals at near 380–400 °C using recycle two-ring aromatics as solvents [19,20,21]. HyperCoal consisted mainly of polycondensed aromatics and showed good viscoelastic and coking properties and can be used as a feedstock for the production of carbon fibers and anodes. Researchers from the University of Kentucky, Pennsylvania State University and West Virginia State University are also exploring the possibility of producing such carbon materials based on the products of bituminous coal dissolution at higher temperature of 400–420 °C [22,23]. Anthracene oil is used as a recycled solvent, the yield of pitch-like products, depending on the coal, reached 80–82%.
In our papers [24,25,26,27], polyaromatic products were obtained by liquid-phase solubilization of different bituminous coals at mild temperatures of 350–380 °C using technical heavy hydrocarbon fractions of coal- and petroleum origin as solvents. The products obtained represented solid pitch-like matter consisted primarily of polyaromatic substances [24,25]. The correlation analysis was performed and the coal-related parameters ensuring effective conversion into quinoline-soluble products (up to 80%) were determined [26,27].
This study is focused on the comprehensive characterization of chemical and group composition, molecular structure of the pitch-like products obtained by coal thermosolvolysis as a possible new feedstock for the process of delayed coking into needle coke. Bituminous coal, which met previously established criteria, was used for dissolution. The solvents were heavy technical hydrocarbon fractions of coal and petroleum origin. Because of the complex molecular composition, the products obtained are characterized by averaged molecular parameters determined by using a set of analytical techniques, such as 1H, 13C NMR, FTIR and XPS. Particular attention is given to structural features of the aromatic units depending on the type of solvent used. The concentration of benzo(a)pyrene as a marker of carcinogenicity and viscoelastic properties of the products are also characterized.
2. Material and Methods
2.1. Coal and Solvents Used
Bituminous coal from the Chadan deposit (Ulugkhemsky Basin, Russia) was used for dissolution. It was ground to a fraction of < 1 mm (average particle size of 0.4 mm) and dried in a vacuum oven at 85 °C. The commercial coal tar (CT) (Altai-Coke Joint-Stock Company), and heavy gas oil (GO) derived from the catalytic cracking of petroleum fraction (Omsk Oil Refinery Plant, Gazprom-Neft Company) and binary CT+GO blend were used as solvents for coal dissolution. A typical commercially available coal-tar pitch with the softening point of 88 °C provided by Altai-Coke Joint-Stock Company was used as reference sample.
2.2. Reactor Unit and Dissolution Procedure
The coal dissolution reaction was carried out following previously optimized conditions [26] using an experimental unit equipped with a 2 l stainless steel autoclave with a stirrer, which provided gradient-less conditions for temperature and reagent concentration. The autoclave was charged with 900 g of coal/solvent slurry (the proportion of 1:2 by the weight), hermetically sealed and purged carefully with nitrogen. The reaction was carried out at 380 °C for 60 min at an autogenous pressure.
At reaction completion, the autoclave was allowed to cool to 250 °C, then depressurized, and the vapor-gas products were vented through a refrigerator line, while the gases and condensed liquid were collected and measured. The valve at the bottom of the autoclave was then opened, and the molten digested product (consisted of dissolved coal in a solvent + ash coal residue) was drained off into a cylinder receiver, allowed to cool while stirring for homogenization and then was pushed out of the cylinder by a piston. The digested pitch-like product was weighted, immediately packaged in a plastic bag and stored in a desiccator. The gaseous products were analyzed by a gas chromatography.
2.3. Analytical Techniques
The elemental analysis was performed using a CHNS-analyzer (Vario EL Cube, Germany). Thermal decomposition of coal was studied using Netzsch Jupiter STA 449F1 synchronous analyzer. The volatility of the solvents was determined by temperature range on distillation.
The group composition of the resultant pitch-like products was characterized by the proportions of the toluene solubles (TS), quinoline solubles (QS), quinoline insolubles (QIS, α1-fraction) and by α2-fraction (TIS minus QIS). A ground sample of the pitch-like product (weigh of 2 g) was subjected to exhaustive extraction with toluene using a Soxhlet apparatus. Toluene insoluble residue (TIS, α-fraction) was dried under vacuum at 80 °C and weighted. Extraction with a hot quinoline was carried out according to the standard method of GOST RF 10200-2017 (rus). The pitch-like sample (1 g) was placed in an ampoule where hot quinoline was added. The ampoule was placed in a water bath at temperature of near 75 °C and kept for 30 min, shaking occasionally. Then, the ampoule was centrifuged and treated again with a fresh hot quinoline, the procedure was repeated until the quinoline solution became clear. Finally, the centrifuged quinoline-insoluble residue was washed with toluene, dried in a vacuum at 80 °C and weighed. The proportions of TS and QS soluble fractions were calculated according to formulas:
where mo, mTIS,, mQIS are the weights (g) of the initial pitch sample and of toluene insoluble and quinoline insoluble residues, respectively, and Ao is ash content (%) in the initial pitch-like product.
The FTIR spectra were recorded using a Bruker Tensor-27 IRFT spectrometer for the spectral range from 4000 to 400 cm−1. The specific spectral regions were subjected to curve-fitting analysis.
The 1H and 13C NMR high resolution spectra were recorded from the chloroform-D dissolved samples using a Bruker Advance III 300 WB spectrometer with proton resonance frequency of 300 MHz at a room temperature. For the proton spectrum, 16 scans were accumulated and 1024 scans for the 13C spectrum.
The XPS spectra were obtained using a SPECS instrument (SPECS Surface Nano Analysis GmbH, Germany) equipped with a PHOIBOS 1500 MCD9 electron analyzer, with excitation by a Mg Kα line (1253.6 eV) of the X-ray tube and with a charge neutralization gun. Pass energies were 20 eV for survey spectra and 8 eV for high-resolution spectra. The data were collected over 0.05 eV increments, and multiple scans were taken to obtain spectra with high-enough signal-to-noise ratios to allow curve-resolution techniques to be applied. The photoelectron peaks were curve-resolved using a mixed 70–30% Gauss-Lorentzian lines shape to assess the relative amounts of the particular chemical species. A Shirley-type background was subtracted prior to fitting. An energy correction was made to account for sample charging by setting the binding energy of the sp2 carbon to 284.6 eV. The atomic concentrations were calculated from the survey spectra as peak areas corrected for atomic sensitivity factors.
The benzo(a)pyrene (BaP) concentration in the initial solvents and in the toluene soluble fractions of the products was measured using Shimadzu LC20 high-performance liquid chromatograph. Chromatography conditions: capillary column with C18 reverse phase sorbent, diode array detector, the flow rate of acetonitrile-water mixture was 1 ml/min, the standard BaP solutions were used for calibration.
The viscoelastic properties of the pitch-like products were characterized by softening point using a “ring-and-ball” method according to ASTM: D36/D36M–14. The softening point corresponded to temperature at which a metal ball passed through a ring filled with the softened pitch.
3. Results
3.1. Characterization of Coal and Solvents
The data in Table 1 show the composition and properties of coal and solvents used. Coal sample was bituminous grade with the volatile matter of 37.8 wt.% (on daf), ash of 5.6 wt.% (on dry bases), softening point of around 350–360 °C, plastic layer thickness of 21 mm, vitrinite content of 85% and vitrinite reflectance coefficient of 0.77%. According to TG/DTG analysis, the thermal decomposition with the weight loss commenced at 400 °C, and maximum rate of weight loss was observed at 465 °C.
The petroleum-derived GO solvent was enriched with hydrogen and almost completely soluble in toluene. Coal-derived CT solvent contained less hydrogen, little more heteroatoms, 11.6% of toluene-insolubles and 1.8% of quinoline-insolubles. Both solvents began to distill off at temperatures above 180–221 °C, the distillation maximum was observed at around 350 °C.
3.2. Coal Dissolution
The dissolution of coal at 380 °C and autogenous pressure of near 1.4–2.5 MPa attained 80% and more. The yield of the main digested pitch-like autoclave product (consisted of dissolved coal, solvent and coal ash residue) accounted for at least 97.5%. The yields of gases and naphtha collected during depressurization of the autoclave at 250 °C were less than 0.6% and 0.55 to 4.8%, respectively, depending on the solvent used. The enhanced naphtha yield (4.8%) was obtained when CT was used as solvent. The losses due to difficulty of quantitative recovering of the viscous autoclave product were less than 2.0%.
3.2.1. The Composition of the Pitch-Like Products
Shown in Table 2 are characteristics of the products obtained using different solvents. The products obtained using CT and binary solvent represented typical solid pitch-like matter with the softening points of 82 to 90 °C, the GO product was a soft matter without a certain softening point. The product obtained using CT solvent had more carbon and oxygen, and less hydrogen compared to GO product. The products obtained with binary CT+GO blend had intermediate chemical composition compared to those obtained using each solvent separately. The concentrations of nitrogen, sulfur and oxygen were 0.6–1.3%, 0.6–1.4% and 0.8–2.6%, respectively, GO product featured smallest oxygen concentration. The increase in the dissolution duration from 1 h to 3 h resulted in increased carbon content and in reduced hydrogen, sulfur and oxygen.
The group composition consisted of 64.4 to 77.6% of toluene solubles (maltenes+asphaltenes) and 90.8 to 92.9% of quinoline soluble fractions, GO product showed least and CT product did largest amounts of the α2-fraction, which contained preasphaltenes and carbenes (Table 3). The content of quinoline insoluble α1-fraction ranged 7.1–9.2% depending on the solvent. The CT+GO blended solvent improved dissolution of coal compared to each solvent separately: the content of the quinoline insolubles in the product decreased to 7.1% versus 8.2% and 7.9% for the CT and GO products, respectively.
The concentration of BaP in the pitch-like products ranged 0.29 to 4.92 mg/g depending on the solvent used (Figure 1). The CT product showed the highest concentration, GO one - the lowest, and that obtained with the blended solvent – an intermediate concentration (in accordance with the BaP concentration in the parent solvents). All the pitch-like products obtained had significantly less BaP (up to 40 times) compared to typical commercial coal-tar pitch (12 mg/g). Two important observations should be noted: i) the increase in coal dissolution duration (in the blended solvent) from 1 h to 3 h led to decrease in BaP concentration in the reaction product from 1.84 mg/g to 1.48 mg/g; ii) in all cases, BaP concentrations in the reaction products were significantly less than those in the coal-solvent slurry before reaction. These results indicate BaP to be partially chemically consumed during the coal dissolution reaction, in contrast to coal coking resulting in BaP generation.
3.2.2. Molecular Structure of the Pitch-Like Products
FTIR spectra. Shown in Figure 2 are the FTIR spectra which reflect the variation in the parameters of the molecular structure of the pitch-like samples. The bands centered at 1600 cm−1 (stretching vibrations of the aromatic C-C bonds), 3045 cm−1 (stretching vibrations of the aromatic C-H bonds) and at 900–700 cm−1 (out-of-plane bending of the aromatic C-H bonds) indicate the aromatic structures. The broad absorbances in the spectral ranges of 3000–2750 cm−1 and 1460–1370 cm−1 (stretching and bending vibrations of the aliphatic C-H bonds, respectively) indicate the aliphatic structures. Very small absorbance at near 3430 cm−1 may indicate small amount of hydrogen-bonded phenols and possibly nitrogen-containing heterocycles with N-H bonds (as in indole and carbazole). Barely visible shoulders at about 1750 cm−1 and 1650 cm−1 reflect little carbonyl and carboxyl groups.
Absorbance in most characteristic spectral regions of 3100–2750 cm−1, and 900–700 cm−1 were deconvoluted (Figure 2b) according to well-founded guidelines [28,29] and the corresponding semi-quantitative molecular indexes were assessed. Other spectral regions also show variations in the absorbance depending on the product sample, however, they are less characteristic. For example, the spectra show large variation in the absorbance centered at 1600 cm−1, however, the extinction coefficient for this mode of vibration depends greatly on the structure of the aromatic unit, type of substituents and degree of substitution, and therefore this band can hardly be used for semi-quantitative estimation. Complex unresolved bands in the region of 1000–1300 cm−1 are related to vibrations of various C-C and C-O bonds; decomposition and assignment of individual sub-bands is difficult due to overlapping and also due to superposition of bands from silicate and aluminosilicate minerals with Si-O and Al-O bonds.
The absorbance in the 3100–2750 cm−1 region was best simulated by two symmetrical Gaussian aromatic sub-bands and by five aliphatic sub-bands. The wide band in the region of 900–700 cm−1 was best fitted to 8–10 sub-bands which reflect the number of adjacent C-H bonds at the aromatic ring, and thus a degree of the aromatic ring substitution (or condensation). A sub-band centered at 740 cm−1 was assigned [28] to four adjacent C-H bonds at the aromatic ring (i.e. ortho-substituted), it reflects the degree of substitution of aromatic rings: the higher the intensity, the lower the substitution degree.
The following molecular indexes were estimated based on the areas of the characteristic sub-bands in the deconvoluted FTIR spectra: Har hydrogen aromaticity; Car carbon aromaticity; Ios index for ortho-substituted aromatic rings; and proportion between the number of C-H bonds in the CH3 and CH2 groups which reflects the structure of the aliphatic fragments (the length or branching of alkyl groups). In assessing Har, Car and CH3/CH2 indexes we took account of the corresponding extinction coefficients. According to [28,30], the ratio of the extinction coefficient for the stretching vibrations of the aromatic C-H bonds (3100–3000 cm−1) to that for the aliphatic C-H bonds (3000–2750 cm−1) was accepted to be 0.20, and the ratio for the extinction coefficients for the asymmetrical stretching vibrations of C-H bond in the CH2 groups (sub-band centered at 2923 cm−1) and in the CH3 groups (sub-band centered at 2955 cm−1) - 0.5. Car index was estimated according to [31] using the ultimate analysis data and FTIR data for the proportion of the aliphatic hydrogens to total amount of hydrogens in an average molecule. The semi-quantitative molecular indexes above were calculated using the following formulas:
Hal/Cal in equation 4 is an atomic ratio of hydrogen to carbon for aliphatic groups, usually set to 2 [31].
One can see from Table 4 that the FTIR indexes show highly aromatic structure of the CT product (Car=0.87 and Har=0.67), its aromatic rings are rarely substituted (ortho-substituted mostly with methyl and methylene groups). GO product is least aromatic (Car=0.64 and Har=0.31), the aromatic rings being highly substituted (Ios=0.20) with larger alkyl substituents (CH3/CH2 ratio of 0.33). The product obtained with binary solvent shows molecular indexes which are almost intermediate compared to those obtained with each solvent separately. The increased dissolution duration (3 hours) resulted in increased aromaticity, CH3/CH2 ratio, and in decreased aromatic ring substitution.
1H NMR spectra. Displayed in Figure 3 are the 1H NMR spectra from the chloroform-D soluble fractions of the products. The spectral resonances were subdivided according to [32,33] into the following groups: 9.5–6.7 ppm due to aromatic protons (Har), 6.7–4.5 ppm – to Ho protons in the olefinic and hydroxyl groups; 4.5–3.4 ppm – to Hα1 protons at the α-carbon bonded to two aromatic rings; 3.4–2.0 ppm – to Hα2 protons at other α-carbons; 2.0–1.0 ppm – to Hβ protons at saturated carbons in β-position to the aromatic ring; 1.0–0.5 ppm – to Hγ protons at carbons in γ-position and others.
The spectrum from the product obtained using CT solvent shows strong resonances in the aromatic region and very weak resonances in the aliphatic one. Most aliphatic protons are bonded to carbon atoms at α-position to one aromatic cycles (3.4–2.0 ppm) and also to two cycles (like in fluorene or in 9,10-dihydroanthracene, 4.5–3.4 ppm). The products obtained with GO solvent and with blended one are less aromatic, they show large variety of protons at various aliphatic carbon atoms, including those at α-position to aromatic rings.
The integrated data on the proton distribution and Brown-Ladner structural parameters calculated are shown in Table 5. The average molecules of the chloroform-solubles derived from the CT product are highly aromatic (Har of 0.65 and fa of 0.88), closely resembling typical coal-tar pitch. The Haru/Car index means the aromatic nuclei to consist of 4–5 condensed cycles, which are rarely substituted (σ=0.16) with short alkyl substituents (n=1.8). The aromatic nuclei of the GO product consist of 3-4 highly substituted (σ=0.37) condensed cycles with longer substituents (n=2.6), and the CT+GO one is intermediate in its indexes compared to CT and GO products. The 1H NMR spectra show insignificant concentrations of the hydroxyl groups and olefinic substances in all samples.
13C NMR spectra. While 1H NMR spectra reflect the composition of the periphery of the aromatic clusters, 13C NMR spectra provide also an information related to the internal carbon framework.
The high-resolution 13C NMR spectra from the chloroform-D soluble fractions are displayed in Figure 4. According to [34,35,36], the spectra were subdivided into the following sub-regions: 0–24 ppm related to CH3; 24–49.3 ppm – to CH2 and CH groups including those in α-position to aromatic cycles; 55–70 ppm – to aliphatic C-O; 108–129.5 ppm – to quaternary pericondensed aromatic carbon, i.e. to carbon atom belonging to three aromatic rings (Car3) and also to tertiary protonated aromatic carbon (CarH); 129.5–155 ppm – to quaternary catacondensed carbon, i.e. to carbon belonging to two aromatic rings (Car2) and to quaternary aromatic carbon bonded to aliphatic carbon (CarC); 155–165 ppm – to CarO; 165–187 ppm – to COOH; 187–220 ppm – to C=O.
One can see from Figure 4 that all the spectra show resonances from the aromatic carbons to be well separated from those from the aliphatic carbons. The contribution from the oxidized carbon groups (COO and C=O, sub-region above 155 ppm) are small in all the products.
Displayed in Table 6 are the normalized integration 13C NMR data on the distribution of carbon atoms between different carbon groups. The fa aromaticity was determined as the sum of (Car3+CarH)+(Car2+CarC)+(CarO). The obtained molecular structural characteristics are in good agreement with the characteristics obtained from FTIR (Tables 4) and from 1H NMR spectra (Tables 5). They corroborate highly aromatic nature of the CT product (fa=0.87) with rarely substituted aromatic nuclei containing predominantly pericondensed+protonated cycles (Car3+CarH). The product obtained using GO solvent shows lower aromaticity (fa=0.64) and proportion of Car3+CarH groups, while the proportion of Car2+CarC groups is almost same as in the case of the CT product.
The 13C NMR technique provides the contents of Car3+CarH fraction and of Car2+CarC one, however, does not allow determining the proportions between Car3 and CarH and between Car2 and CarC, since the signals from the Car3 and Car2 aromatic carbon atoms overlap with the signals from the corresponding peripheral carbon atoms (CarH and CarC, respectively). However, with FTIR data and elemental analysis data, it is possible to estimate the CarH value from the Har value (estimated from the FTIR spectra), recalculated for carbon taking account of H/C ratio. By subtracting the CarH value thus estimated from the total content of Car3+CarH groups, one can determine the proportion of carbon atoms in the pericondensed Car3 cycles. The data in Table 6 show the aromatic nuclei in all the products to contain mainly protonated carbon atoms (47% to 55% of all the aromatic carbon atoms). The Car3 fraction is the largest in the product obtained with CT (28% of all the aromatic carbon atoms) and the smallest in that obtained with GO (19%). The product obtained with binary solvent has average structural indexes. Increasing the dissolution duration (from 1 to 3 h) results in increase in the proportion of carbon atoms in the pericondensed cycles mainly due to protonated ones.
The aliphatic structure of the products is represented by CH3 and CH2+CH groups, the product obtained with GO solvent showing large variety of aliphatic groups including those at α-positions to aromatic rings. The amount of carbon-oxygen groups in the products are small in all samples.
XPS spectra. To comprehensively characterize the molecular structure of the products and gain a deeper understanding of their properties, XPS spectra were also analyzed. The XPS technique allows functional groups on the surface to be characterized and to be compared with the functionality of the bulk matter.
The survey photoelectron spectra in Figure 5 show a major peak at near 285 eV attributed to C1s and much weaker peak at near 533 eV related to O1s. Very weak peak of N1s (near 400 eV) was also observed indicating minor concentrations of the nitrogen-containing species in all samples. Inorganic elements such as Si, Al, Ca, Fe and S can also be found on the surface in a trace amount.
The concentrations of the elements on the surface of the products were estimated based on the survey spectra. Shown in Table 7 are the atomic surface concentrations of the main elements normalized to C1s + O1s + N1s +Si2p+Ca2p = 100%. The concentrations of carbon and oxygen range 85.6 to 89.9% and 7.2 to 13.5%, respectively, depending on the sample. GO product has more oxygen concentration compared to CT product and the product obtained using blended solvent does intermediate concentrations. Actually, the data on O/C atomic ratios in Table 7 mean, that the surface of all the pitch-like samples are enriched with oxygen. At the same time, nitrogen distribution between the surface and the bulk varies moderately and almost equally in all the products. The fact that the GO product exhibits highest concentration of surface oxygen and the CT product the lowest seems to be surprising and contrasts with the bulk oxygen concentrations in these samples (Table 2).
The surface enrichment with oxygen could not result from the oxide minerals, since they were coarsely dispersed, and the contents were small (about 2%) and equal in all the products. Thus, the phenomenon of surface enrichment with oxygen resulted most likely as a result of the oxidation of surface carbons upon contact with the atmospheric oxygen when the samples were stored (in a desiccator) for 8–10 days prior XPS analysis. No changes in surface concentration were found in the GO and CT samples stored for 6 months.
C1s spectra. The chemical forms of the surface carbon-oxygen groups were analyzed using high resolution C1s XPS which are convenient and reliable for this purpose since carbon atom bonded to oxygen differs in its binding energy depending on whether it is bonded to one oxygen atom by a single bond, by a double bond, or bonded to two oxygen atoms. High-resolution XPS O1s spectra were also analyzed, but they were less reliable because of relatively low sensitivity to chemical state of oxygen and of ambiguity in signal assignment due to presence of the inorganic oxides.
Displayed in Figure 6 are the C1s XPS spectra, which show broadened C1s peaks with an asymmetry towards a higher binding energy due to oxygen effect. In all cases, the C1s asymmetrical peak was best fitted to five symmetrical Gaussian/Lorentzian sub-peaks with the binding energies of 284.6 eV, 285.2 eV, 286.3 eV, 287.8 eV and 289.5 eV. The major sub-peak centered at binding energy of 284.6±0.2 eV was assigned [37,38] to sp2-hybridized carbons in the polycondensed aromatic clusters or in graphite-like species (CI component), and that at 285.2±0.2 eV – to other sp2-hybridized aromatic carbons (possibly, in small cycles) as well as to sp3-hybridized aliphatic carbons (CII component). Three other sub-peaks at higher binding energies were assigned to oxidized carbon atoms: at 286.3±0.2 eV to C-O (hydroxyls/ethers/epoxides), at 287.8± 0.2 eV to C=O (carbonyls, ketones and quinones), at 289.5 eV to COOH and COO (acids and esters, respectively). Figure 6 shows the CI graphite-like component to dominate in the deconvoluted spectra.
Summarized in Table 8 are the distribution of the surface carbon atoms between the particular chemical forms. The cumulative content of the aromatic and aliphatic carbons (CI+CII) ranges 0.72 to 0.88, with the proportion of the major CI carbons largely varying (from 0.44 to 0.60), and that of CII hardly changing (0.26-0.28). The total proportion of the oxidized carbon ranges 0.12 to 0.28, with the largest share corresponding to GO product, the smallest to CT product, which practically corresponds to reference typical commercial coal-tar pitch (which, by the way, was stored under atmospheric conditions during a long period). The products obtained with the binary CT+GO solvent show a nearly intermediate proportion of oxidized carbon compared to the products obtained with each solvent separately, with an increase in the dissolution time (3 h) leading to some reduction in carbon oxidation. Single bonded carbon-oxygen groups such as ethers, phenols and epoxides predominate in all the products.
It should be noted that the major CI sub-peak varied significantly with full width at half maximum (FWHM) depending on the sample (Table 8): it was widest for the GO product (1.54 eV) and narrowest for the CT product (1.25 eV), like for a commercial coal-tar pitch (1.23 eV). The peak broadening could be due to a number of factors: to the extent of surface homogeneity, to size of polycondensed clusters and their structural orientation, and also to presence of heteroatoms on the surface, oxygen, in particular. For example, Mateos et al. [38] reported that the presence of oxygen on the carbon surface can induce the structural defects which result in peak broadening. In fact, a relation between the FWHM and the surface oxygen concentration is observed in Table 8: the higher the surface oxygen concentration, the wider the CI sub-peak. Thus, the broadened resonance from the CI carbon atoms for the GO product may reflect its defected surface structure, and the narrower resonance from the CT product may indicate its more regular surface structure consisted of mainly protonated and pericondensed aromatic cycles.
4. Discussion
The data obtained show that the liquid-phase reaction of bituminous coal with the coal tar and heavy petroleum gas oil as solvents at moderate temperature of 380 °C allows for deep and selective conversion of the organic coal matter into quinoline-soluble substances. A binary blend of highly aromatic CT solvent with GO having more aliphatic nature shows some synergistic effect resulting in less amount of quinoline-insolubles (7.1%) compared to both CT (8.2%) and GO (7.9%) solvents separately under the same conditions. The major product with the yields of at least 97.5% represented pitch-like matter with the softening points of 82 to 90 °C, like a typical coal-tar pitch. The distillation of the pitch-like products yielded 14.7–18.7% of liquid fractions with the boiling point of below 350 °C and 81.3–85.3% of pitch residues.
The pitch-like products obtained using CT solvent represented highly aromatic matter (carbon aromaticity of 0.87–0.88 and hydrogen aromaticity of 0.64-0.67). The aromatic nuclei of the chloroform soluble substances contained 4–5 predominantly protonated and pericondensed rings rarely substituted mainly with CH3 and occasionally CH2 groups. The pericondensed rings contained about 28% of all aromatic carbon atoms. The product obtained with GO solvent showed relatively low aromaticity, its aromatic nuclei contained mainly protonated and highly alkylated catacondensed chains, rather than pericondensed sheets. The intermediate structural parameters were characteristic of the pitch-like product obtained using binary solvent.
According to XPS spectra, the pitch-like products are prone to autogenous surface oxidation. The GO product, which has relatively low aromaticity and highly substituted aromatic rings, is most susceptible to surface oxidation. The oxidized carbon species were represented mainly by single-bonded C-O groups (phenols, ethers, and epoxides) in all samples.
The air-blowing oxidation at a moderate temperature is conventionally used to improve pitch properties [39,40,41]: to increase C/H ratio, softening point, content of carbon residue, toluene insoluble fraction, and to control the thermoplastic properties, mesophase formation, and pitch expansion on carbonization. The reactivity for oxidation has been shown [41,42] to depend on the pitch structure. Alkyl-substituted and catacondensed aromatics are easily oxidized, the benzylic carbon atoms are the most reactive and susceptible to oxygen attack. This is consistent with the high tendency for surface oxidation of GO product, which is characterized by high substitution degree of the catacondensed aromatic ring.
A remarkable feature of the products obtained was that they had a reduced content of BaP, the product obtained using petroleum-derived solvent had 40 times less BaP than typical coal tar pitch. There are two interesting points to note: i) coal itself did not generate BaP during dissolution, unlike high temperature coking process, and ii) the BaP molecules introduced into the reaction mixture with the solvent undergo chemical conversion on coal dissolution process.
The data obtained contribute to more insight into molecular structure of the pitch-like products of low-temperature coal dissolution, which, in turn, important for better understanding their properties and for predicting rational applications. A variety of the molecular structural parameters and other properties of the products obtained using different solvents can provide different directions for their utilization. In terms of composition, the pitch-like products obtained can serve as low-carcinogenic polyaromatic raw materials for the production of needle coke and other valuable carbon materials. It can be expected that pitch-like product obtained by dissolving coal in CT solvent can serve as a preferred feedstock for the production of needle coke, since it contains an increased proportion of polyaromatic molecules with pericondensed rings. Such polyaromatics have been shown [41] to be favorable for the formation of needle coke due to their structure and moderate reactivity. On the other hand, the GO product, which is characterized by protonated and catacondensed aromatic chains with highly substituted rings and by high reactivity for oxidation, can be a preferred raw material for fiber preparation. In total, by selecting solvents for coal dissolution and by using product fractionation, it is possible to optimize the molecular-structural characteristics of the dissolved products in order to obtain most favorable feedstock.
4. Conclusions
- The liquid-phase reaction of bituminous coal with commercially available heavy hydrocarbon fractions of coal- and petroleum origin at moderate temperature of 380 °C and autogenous pressure of 2.5 MPa resulted in deep and selective coal dissolution into quinoline-soluble substances (to more than 80%), the yield of gaseous products being no more than 0.5%. The binary blend of highly aromatic coal tar and aliphatic petroleum-derived gasoil fraction exhibited some synergistic effect resulting in improved coal dissolution.
- The resultant products represented typical pitch-like matter with the softening points of 82 to 90 °C. The product obtained using coal tar as solvent was highly aromatic, its aromatic nuclei consisted of predominantly protonated and pericondensed cycles sparsely substituted by CH3 and occasionally CH2 groups. The product obtained using petroleum-derived solvent was less aromatic, its aromatic structure contained protonated and highly alkylated catacondensed chains. The pitch-like product with the intermediate structural parameters was obtained using binary solvent.
- The pitch-like products underwent autogenous surface oxidation by the atmospheric oxygen at room temperature. The product obtained using petroleum-derived solvent was most susceptible to surface oxidation due to presence of highly alkylated aromatics. The surface of the product obtained using coal tar was much less oxidized, just like a commercial coal-tar pitch sample. The product obtained using a binary solvent showed moderate surface oxidation.
- All the pitch-like products obtained had a reduced concentration of BaP, the smallest concentration showing the product obtained using petroleum-derived solvent (40 times less than in typical coal-tar pitch). An increase in coal dissolution duration led to further decrease in BaP concentration.
- In terms of molecular composition, pitch-like products obtained by low-temperature dissolution of coal can serve as low-carcinogenic polyaromatic raw materials for the production of needle coke and other valuable carbon materials.
- By selecting solvents, it is possible to optimize the molecular-structural characteristics of the dissolved products in order to obtain favorable feedstock. Based on the structure of needle coke, a preferred feedstock for its preparation can be CT products containing large content of polyaromatic molecules with pericondensed rings.
Author Contributions
Conceptualization, Project administration, Validation, Writing - Review & Editing, P.K.; Methodology, Supervision, Writing - Original Draft, B.A.; Investigation, Visualization, Writing - Original Draft, L.K.; Discussion, Review & Editing, X.F.; Visualization, English text editing, X.J.; Investigation, Formal analysis, E.K. and S.L.
Declaration of Competing Interest
The authors declare that they have no known competing financial interests or personal relationships that could have appeared to influence the work reported in this paper.
Funding
The work was carried out with financial support of the Russian Science Foundation (grant 24-43-03001) and the Science and Technology Foundation of Mongolia.
Acknowledgments
The authors thank Dr. Yu. Mikhlin for recording XPS spectra and useful discussion and Dr. T. Ivanenko for recording 1H and 13C NMR spectra. Facilities of the Krasnoyarsk Regional Center of Research Equipment of Federal Research Center “Krasnoyarsk Science Center SB RAS” were employed in the work.
References
- Predel, H. Petroleum Coke. In Ullmann’s Encycl. Ind. Chem., Weinheim, Germany: Wiley-VCH Verlag GmbH & Co. KGaA, 2014; pp. 1–21. [CrossRef]
- Steppich, D. Graphite Electrodes for Electric Arc Furnaces. In Industrial Carbon and Graphite Materials, Volume I; Jäger, H., Frohs, W., Eds.; John Wiley & Sons, Ltd: GmbH, 2021; pp. 281-319. [CrossRef]
- Wachtler, M.; Öttinger, O.; Schweiss, R. Carbon and Graphite for Electrochemical Power Sources. In Industrial Carbon and Graphite Materials, Volume I; Jäger, H., Frohs, W., Eds.; John Wiley & Sons, Ltd: GmbH, 2021; pp. 379-455. [CrossRef]
- Global Needle Coke Industry Trends Analysis Report 2024, Forecast to 2032 (Broken Down by Type, End User, Regional Analysis, and Competitive Landscape). Available online: https://www.marketgrowthreports.com/global-needle-coke-industry-25826630 (accessed on 27 Jan 2025).
- Needle Coke Market Size & Share Analysis - Growth Trends & Forecasts (2025 - 2030). Available online: https://www.mordorintelligence.com/industry-reports/needle-coke-market (accessed on 27 Jan 2025). (accessed on 27 Jan 2025).
- Gabdulkhakov, R.R.; Rudko, V.A.; Pyagay, I.N. Methods for modifying needle coke raw materials by introducing additives of various origin (review). Fuel 2022, 310, 122265. [CrossRef]
- Mondal, S.; Yadav, A.; Pandey, V.; Sugumaran, V.; Bagai, R.; Kumar, R.; Pradeep, P.R.; Das, S.K.; Christopher, J.; Kapur, G.S.; Ramakumar, S.S.V. Dissecting the cohesiveness among aromatics, saturates and structural features of aromatics towards needle coke generation in DCU from clarified oil by analytical techniques. Fuel 2021, 304, 121459. [CrossRef]
- Zhang, Z.; Du, H.; Guo, S.; Lou, B.; Yu, R.; Gong, X.; Li, Z.; Li, M.; Duan, Y.; Yuan, H.; Liu, D. Probing the effect of molecular structure and compositions in extracted oil on the characteristics of needle coke. Fuel 2021, 301, 120984. [CrossRef]
- Rana, M.S.; Sámano, V.; Ancheyta, J.; Diaz, J.A.I. A review of recent advances on process technologies for upgrading of heavy oils and residua. Fuel 2007, 84, 1216-1231. [CrossRef]
- Speight, J.G. Hydrotreating and Desulfurization. In The Refinery of the Future; William Andrew, 2010; pp. 237-273. [CrossRef]
- Kozlov, A.P.; Cherkasova, T.G.; Frolov, S.V.; Subbotin, S.P.; Solodov, V.S. Innovative Coal-Tar Products at PAO Koks. Coke Chem. 2020, 63, 344–350.
- Stompel, D.Z. Eastern European Coal Tar Market A.D. 2023. International Tar Association. 2023. https://www.itaorg.com/conf-presentations.php?year=2023.
- Tiwari, H.P.; Saxena, V.K. Industrial perspective of the cokemaking technologies. In New Trends in Coal Conversion; Suárez-Ruiz, I.; Diez, M.A.; Rubiera, F., Eds.; Woodhead Publishing, Cambridge, 2019; pp. 203–246. [CrossRef]
- Cheng, X.; Li, G.; Peng, Y.; Song, S.; Shi, X.; Wu, J.; Xie, J.; Zhou, M.; Hu, G. Obtaining needle coke from coal liquefaction residue. Chem Technol Fuels Oils 2012, 48, 349–355. [CrossRef]
- Shui, H.; Zhou, Y.; Li, H.; Wang, Z.; Lei, Z.; Ren, S.; Pan, C.; Wang, W. Thermal dissolution of Shenfu coal in different solvents. Fuel 2013, 108, 385–390.
- Griffith, J.M.; Clifford, C.E.B.; Rudnick, L.R.; Schobert, H.H. Solvent extraction of bituminous coals using light cycle oil: characterization of diaromatic products in liquids. Energy Fuels 2009, 23, 4553–4561. [CrossRef]
- Rahman, M.; Pudasainee, D.; Gupta, R. Review on chemical upgrading of coal: Production processes, potential applications and recent developments. Fuel Process. Technol. 2017, 158, 35–56. [CrossRef]
- Kuznetsov, P.N.; Kuznetsova, L.I.; Buryukin, F.A.; Marakushina, E.N.; Frizorger, V.K. Methods for the Preparation of Coal-Tar Pitch. Solid Fuel Chem. 2015, 49, 213−225. [CrossRef]
- Shimanoe, H.; Mashio, T.; Nakabayashi, K.; Inoue, T.; Hamaguchi, M.; Miyawaki, J.; Mochida, I.; Yoon, S.H. Manufacturing spinnable mesophase pitch using direct coal extracted fraction and its derived mesophase pitch based carbon fiber. Carbon 2019, 158, 922-929. [CrossRef]
- Yang, J.; Nakabayashi, K.; Miyawaki, J.; Yoon, S.H. Preparation of pitch based carbon fibers using hyper-coal as a raw material. Carbon 2016, 106, 28−36. [CrossRef]
- Hamaguchi, M. Prebaked Anode from Coal Extract (3) - Carbonization Properties of Hypercoal and Its Blends with Binder Pitch. In Light Metals; Suarez, C.E., Eds.; Springer, Cham. 2012; pp.1219-1221. [CrossRef]
- Craddock, J.D.; Rantell, T.D.; Hower, J.C.; Whitlow, D.T.; Wiseman, J.; Weisenberger, M.C. Anode coke from coal – A low cost approach. Fuel 2017, 187, 229–241. [CrossRef]
- Andrews, R.J.; Rantell, T.; Jacques, D.; Hower, J.C.; Gardner, J.S.; Amick, M. Mild coal extraction for the production of anode coke from Blue Gem coal. Fuel 2010, 89, 2640–2647. [CrossRef]
- Kuznetsov, P.N.; Kamenskiy, E.S.; Kuznetsova, L.I. Comparative study of the properties of the coal extractive and commercial pitches. Energy Fuels 2017, 31, 5402–5410. [CrossRef]
- Kuznetsov, P.N.; Kamenskiy, E.S.; Kuznetsova, L.I. Solvolysis of bituminous coal in coal- and petroleum-derived commercial solvents. ACS OMEGA 2020, 5, 14384–14393. [CrossRef]
- Kuznetsov, P.; Safin, V.; Avid, B.; Kuznetsova, L.; Purevsuren, B.; Ismagilov, Z. Thermal Dissolution of Coals of the Metamorphism Series in the Anthracene Fraction of Coking Tar: An Analysis of Correlations with the Chemical and Technological Properties of Coals. Solid Fuel Chem. 2021, 55, 69–77. [CrossRef]
- Safin, V.A.; Kuznetsov, P.N.; Avid, B.; Kuznetsova, L.I.; Fan, X.; Ismagilov, Z.R. The relationship between the molecular composition of coal and the conversion of its organic matter during thermal dissolution. Carbon Letters 2022, 32, 1101-1109. [CrossRef]
- Sobkowiak, M.; Painter, P. Determination of the aliphatic and aromatic CH contents of coals by FT-i.r.: studies of coal extracts. Fuel 1992, 71, 1105–1125. [CrossRef]
- Solomon, P.R.; Carangelo, R.M. FT-i.r. analysis of coal: 2. Aliphatic and aromatic hydrogen concentration. Fuel 1988, 67, 949–959. [CrossRef]
- Dick, C.; Ediger, V.; Fabbri, D.; Gaines, A.F.; Love, G.D.; McGinn, A.; McRae, C.; Murray, I.P.; Nicol, B.J.; Snape, C.E. Eastern Mediterranean Sapropels: chemical structure, deposition and relation to oil-shales. Fuel 2002, 81, 431–448. [CrossRef]
- Supaluknari, S.; Larkins, F.P.; Redlich, P.; Jackson, W.R. Determination of aromaticities and other structural features of Australian coals using solid state 13C NMR and FTIR spectroscopies. Fuel Process. Technol. 1989, 23, 47–61. [CrossRef]
- Diaz, C.; Blanco, C.G. NMR: A powerful tool in the characterization of coal tar pitch, Energy Fuels 2003, 17, 907–913. [CrossRef]
- Twigg, A.N.; Taylor, R.; Marsh, K.M.; Marr, G. The characterization of coal tar pitches used in electrode binder manufacture by n.m.r. spectroscopy. Fuel 1987, 66, 28–33. [CrossRef]
- Yang, H.; Xiong, Y.; Xie, Z.; Jin, L.; Li, Y.; Yang, J.; Hu, H. Quantitative characterization of coal structure by high-resolution CP/MAS 13C solid-state NMR spectroscopy. Proceedings of the Combustion Institute 2021, 38, 4161–4170. [CrossRef]
- Yoshida, T.; Nakata, Y.; Yoshida, R.; Ueda, S.; Kanda, N.; Maekawa, Y. Elucidation of structural and hydroliquefaction characteristics of Yallourn brown coal by 13C CP/MAS NMR spectrometry. Fuel 1982, 61, 824–830. [CrossRef]
- Solum. M.S.; Sarofim, A.F.; Pugmire, R.J.; Fletcher, T.H.; Zhang, H. 13C NMR Analysis of Soot Produced from Model Compounds and a Coal. Energy Fuels 2001, 15, 961–971. [CrossRef]
- Dı´az, J.; Paolicelli, G.; Ferrer, S.; Comin, F. Separation of the sp3 and sp2 components in the C1s photoemission spectra of amorphous carbon films. Physical Review B 1996, 54, 8864–8869. [CrossRef]
- Mateos, J.M.J.; Fierro, J.L.G. X-ray photoelectron spectroscopic study of petroleum fuel cokes. Surface and Interface Analysis 1996, 24, 223–236.
- Niu, H.; Zuo, P.; Shen, W.; Qu, S. Evaluating multistep oxidative stabilization behavior of coal tar pitch-based fiber. Journal of Applied Polymer Science 2020, 138, e50002. [CrossRef]
- Guan, T.; Zhang, G.; Zhao, J.; Wang, J.; Li, K. Insight into the oxidative reactivity of pitch fractions for predicting and optimizing the oxidation stabilization of pitch. Fuel 2019, 242, 184–194. [CrossRef]
- Machnikowski, J.; Kaczmarska, H.; Gerus-Piasecka, I.; Dez, M.A.; Alvarez, R.; Garca, R. Structural modification of coal-tar pitch fractions during mild oxidation-relevance to carbonization behavior. Carbon 2002, 40, 11, 1937-1947. [CrossRef]
- Russo, C.; Ciajolo, A.; Stanzione, F.; Tregrossi, A.; Oliano, M.M.; Carpentieri, A.; Apicella, B. Investigation on chemical and structural properties of coal- and petroleum-derived pitches and implications on physico-chemical properties (solubility, softening and coking). Fuel 2019, 245, 478–487. [CrossRef]
Figure 1.
Benzo(a)pyrene content in different solvents and in the products obtained by coal thermosolvolysis in solvents.
Figure 1.
Benzo(a)pyrene content in different solvents and in the products obtained by coal thermosolvolysis in solvents.
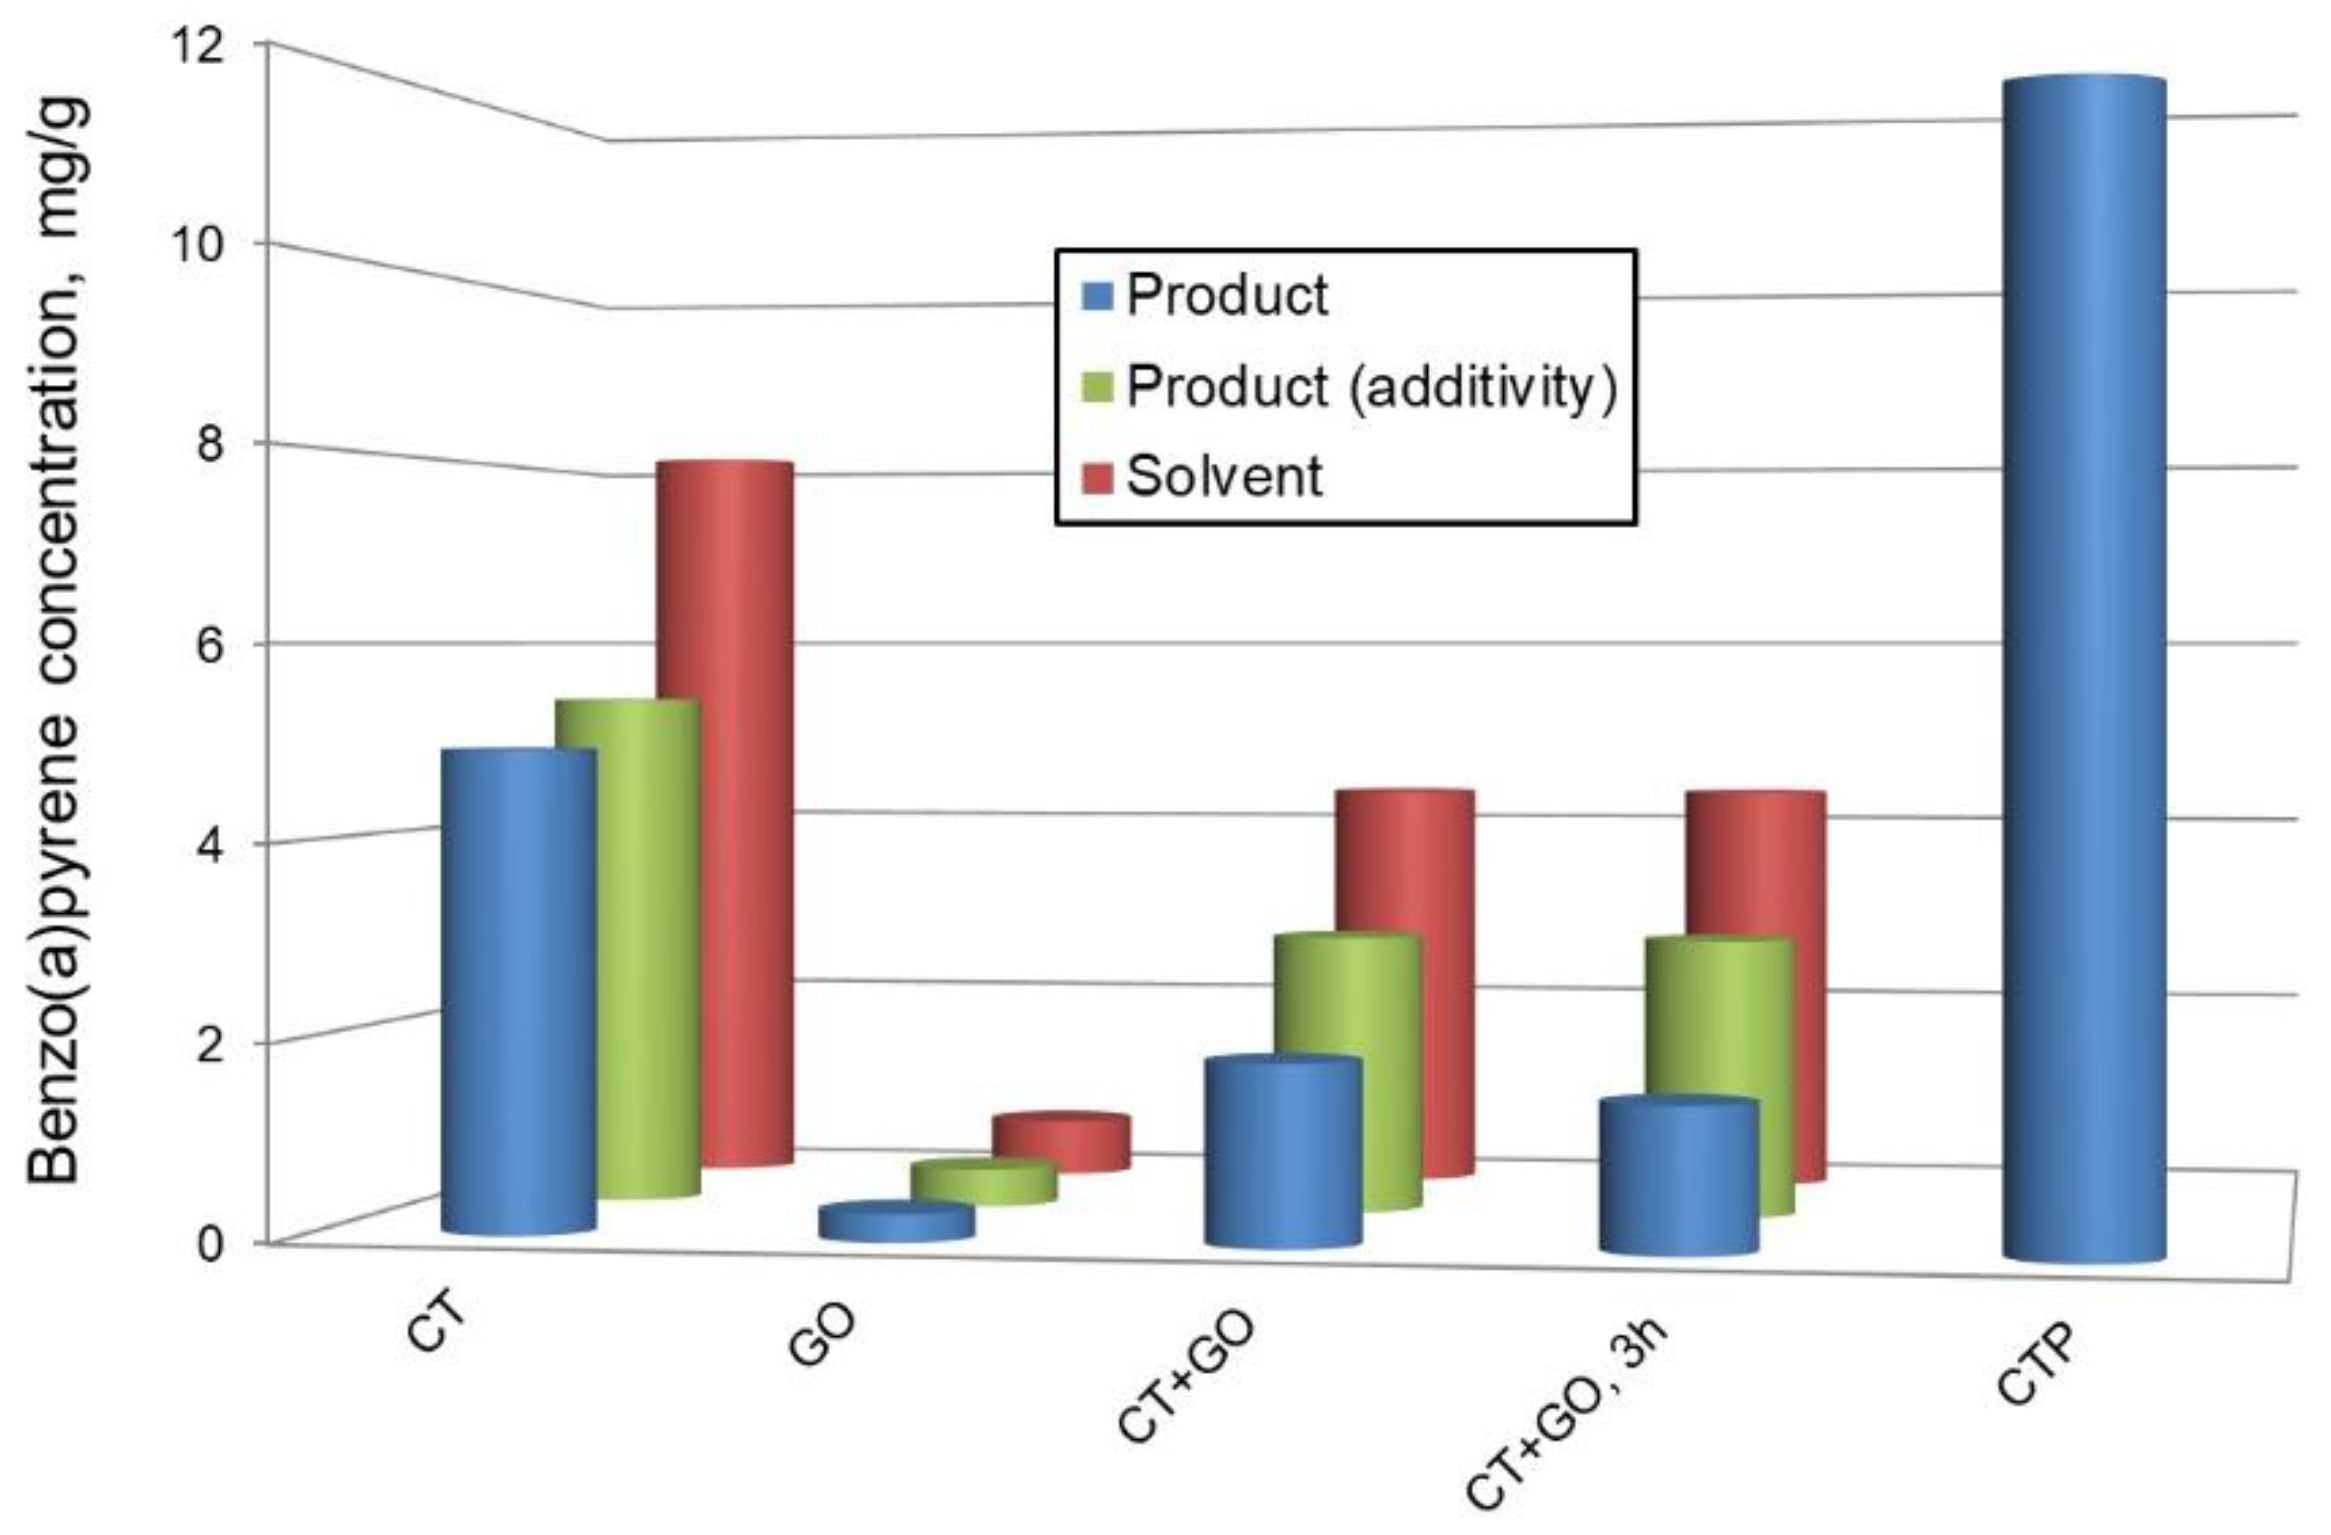
Figure 2.
FTIR spectra of the products obtained using different solvents (a) and deconvoluted spectra as examples (b).
Figure 2.
FTIR spectra of the products obtained using different solvents (a) and deconvoluted spectra as examples (b).
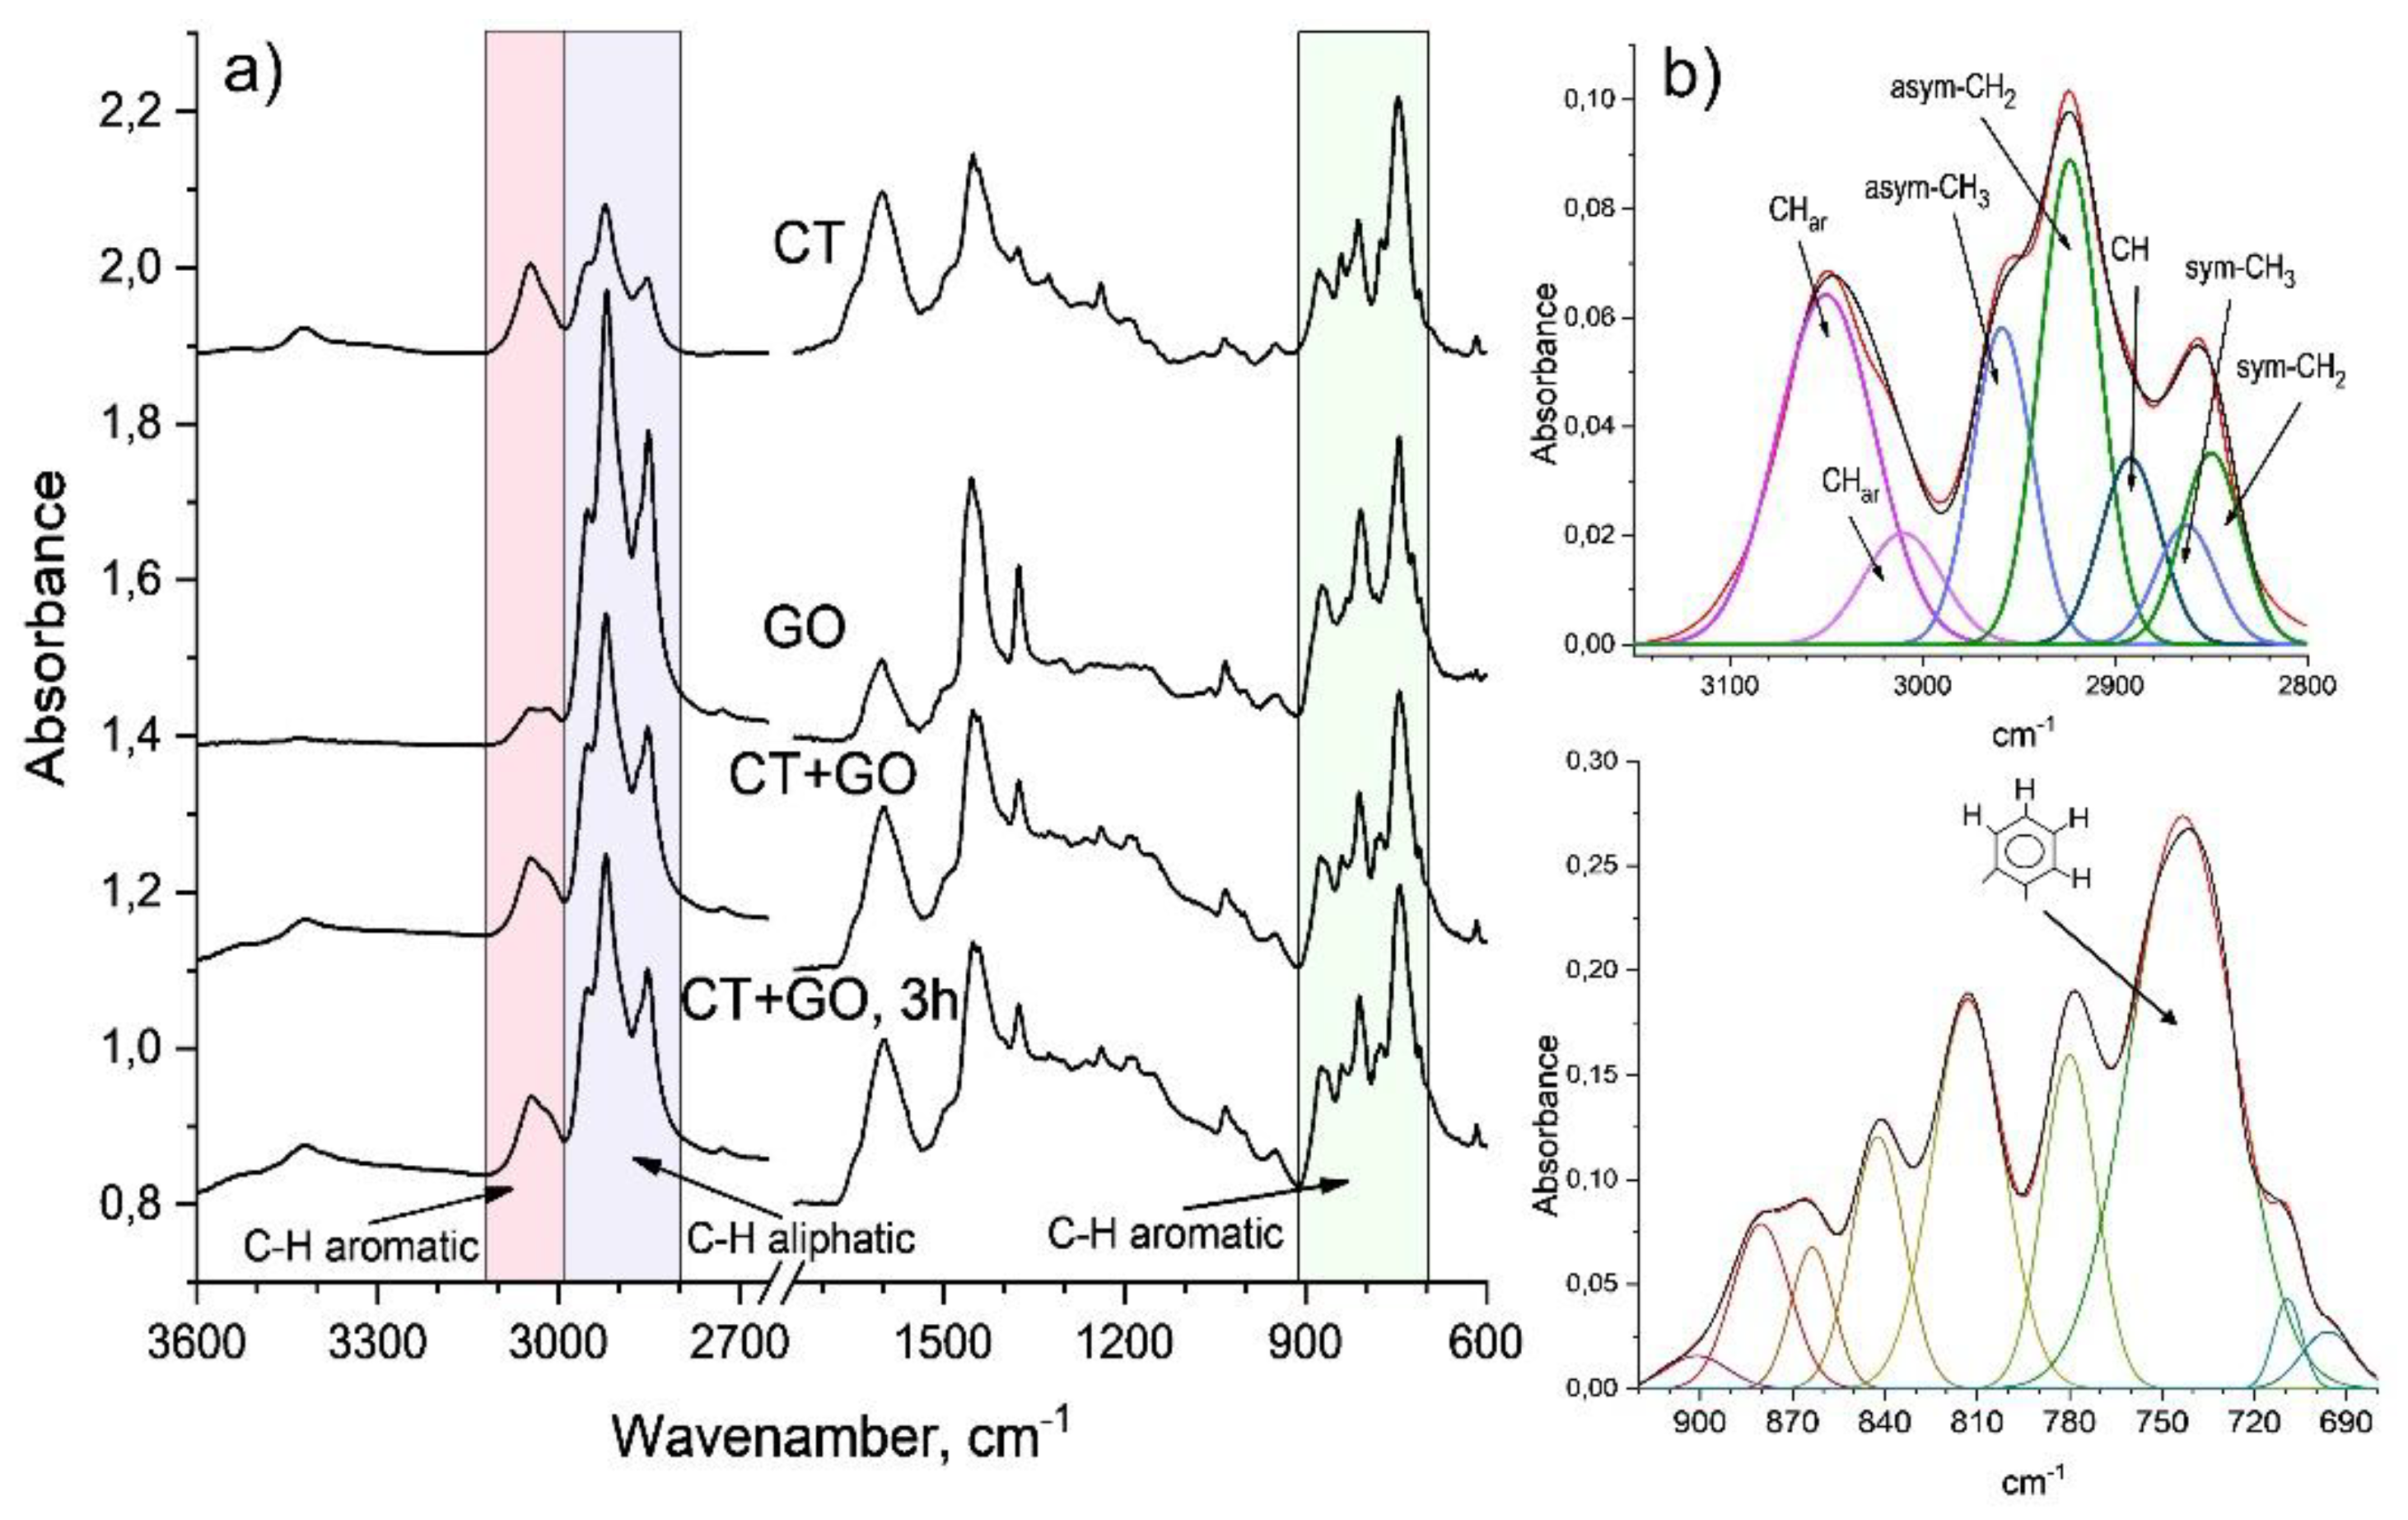
Figure 3.
The 1H NMR spectra of the chloroform-solubles derived from the products obtained using CT, GO solvents and CT+GO solvent blend.
Figure 3.
The 1H NMR spectra of the chloroform-solubles derived from the products obtained using CT, GO solvents and CT+GO solvent blend.
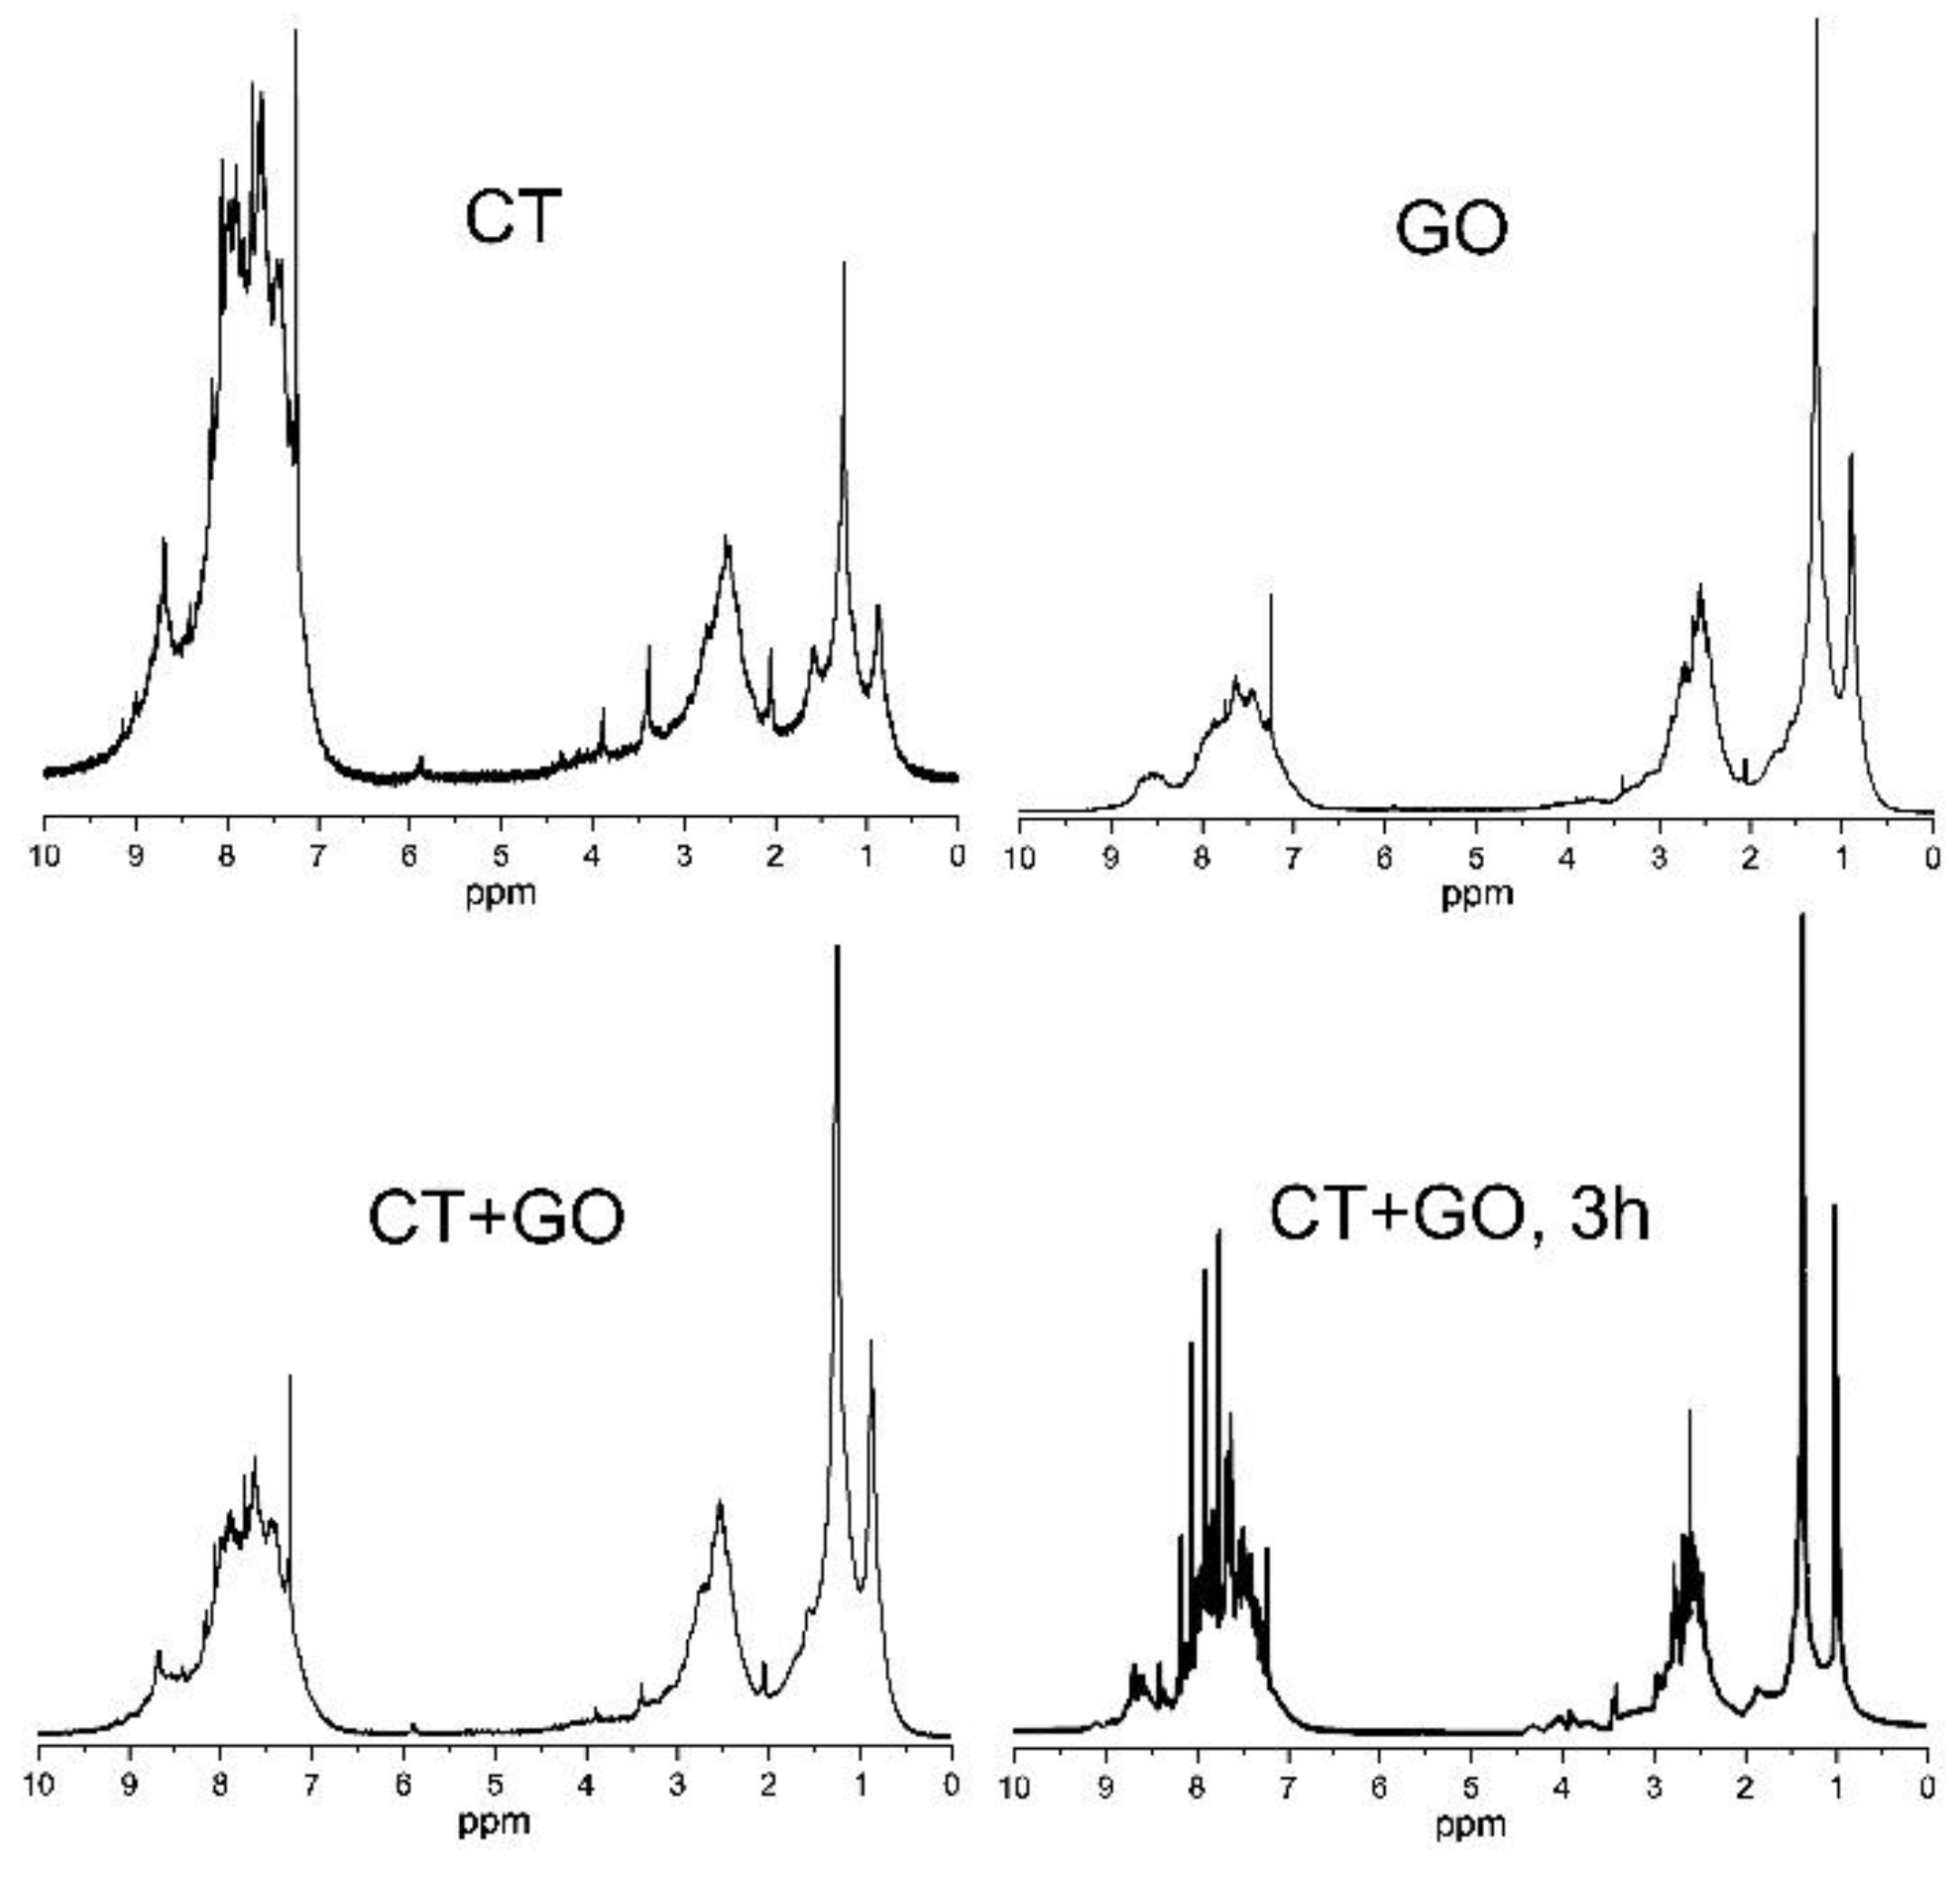
Figure 4.
The 13C NMR spectra from the chloroform-D solubles of the products obtained using different solvents.
Figure 4.
The 13C NMR spectra from the chloroform-D solubles of the products obtained using different solvents.
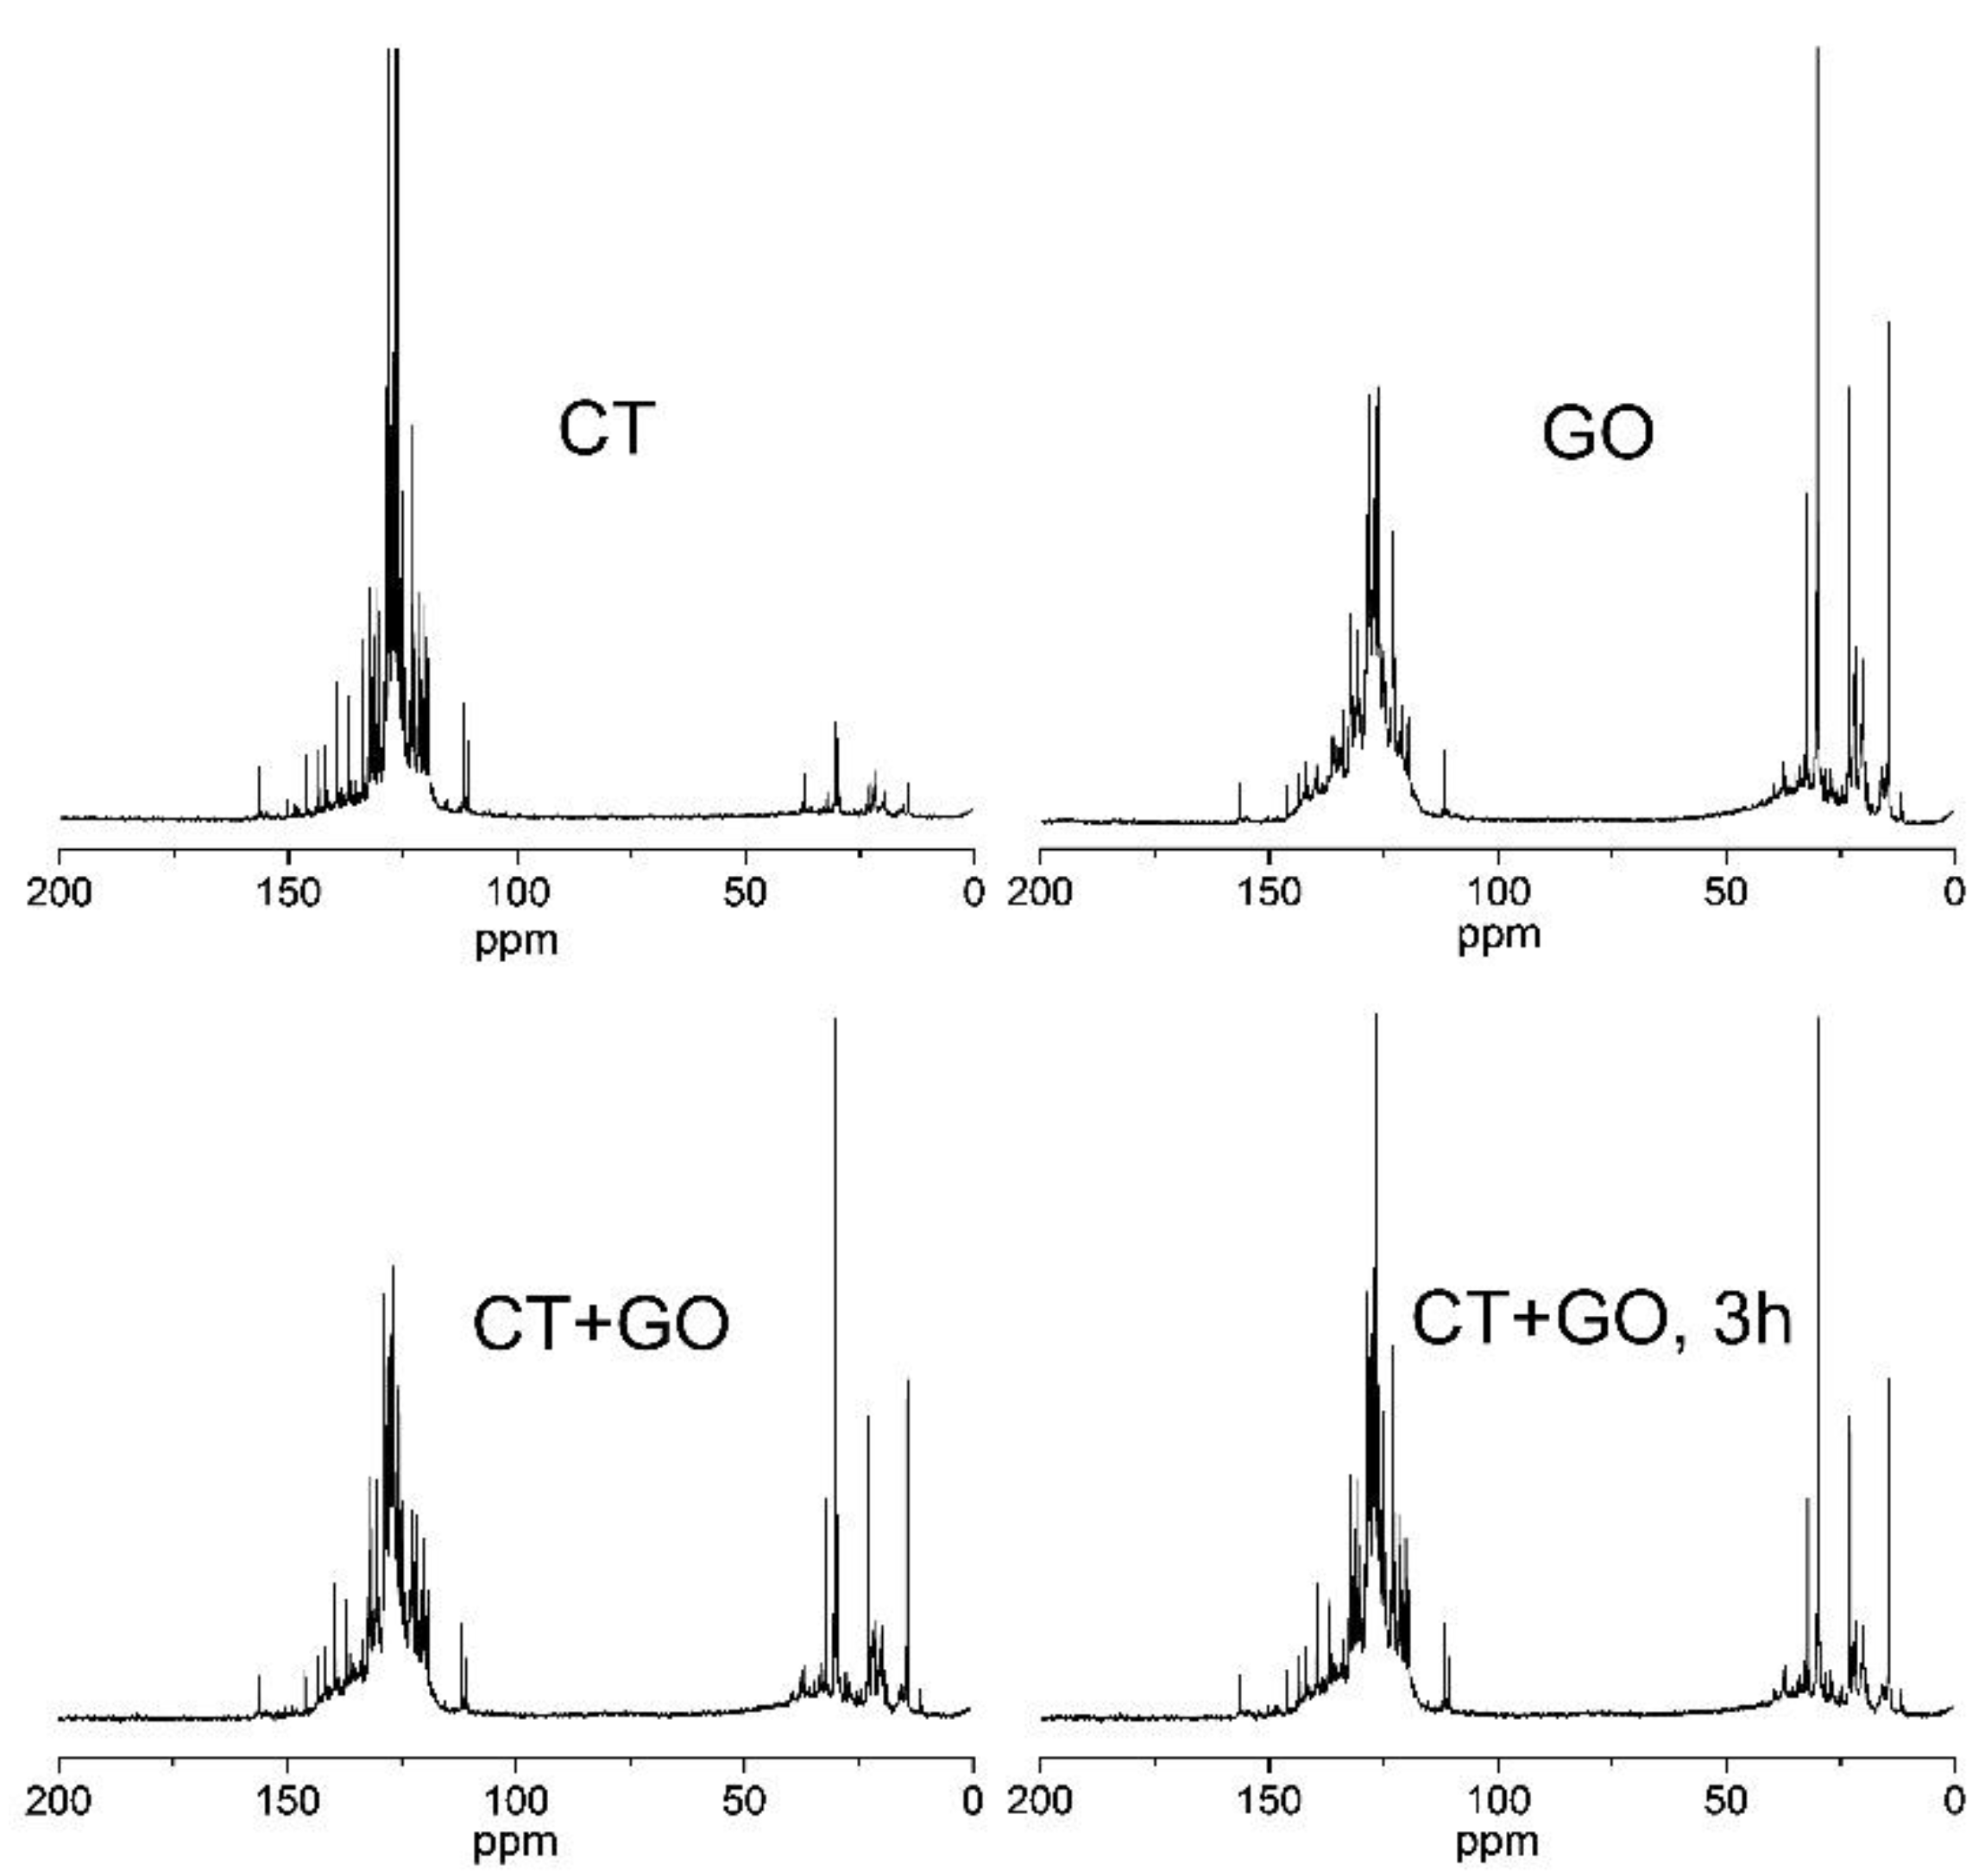
Figure 5.
The typical X-ray photoelectron survey spectra for the products obtained using different solvents.
Figure 5.
The typical X-ray photoelectron survey spectra for the products obtained using different solvents.
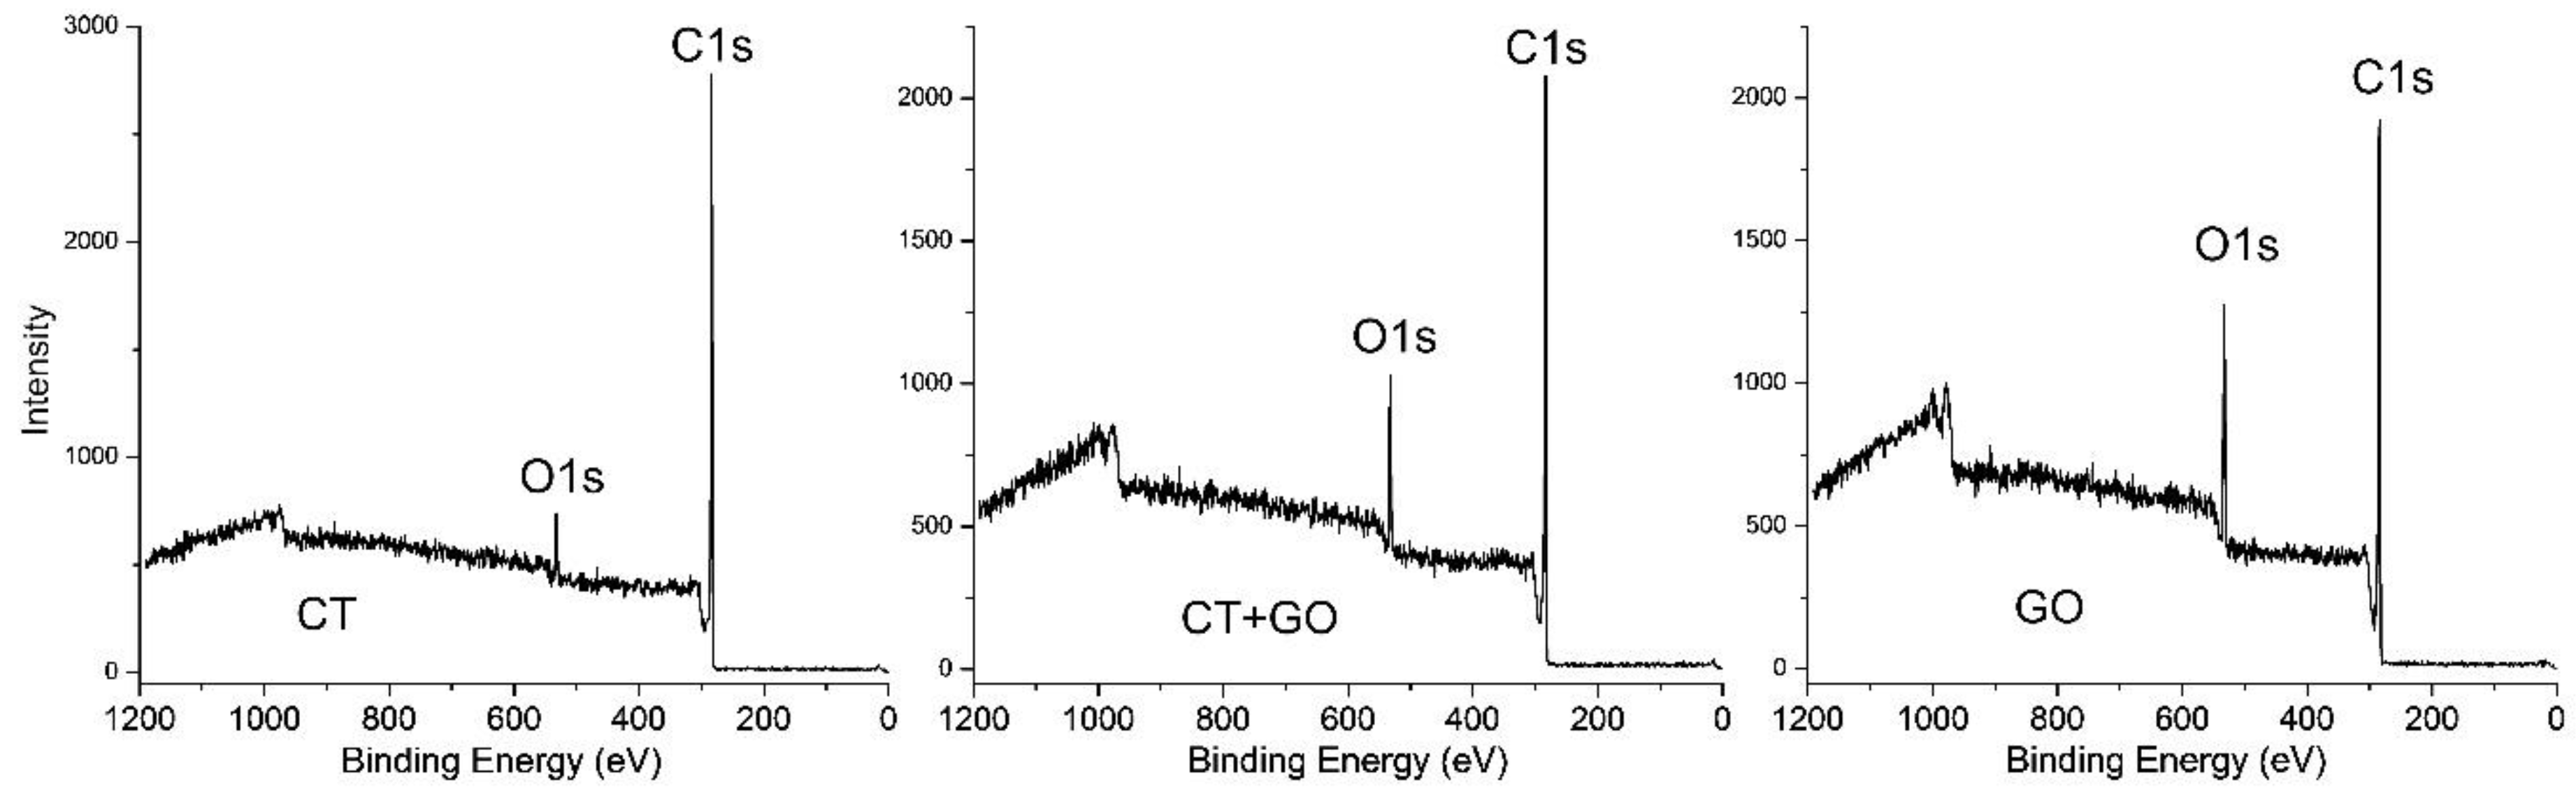
Figure 6.
C1s XPS from the products obtained using CT, HGOCC solvents and their binary blend.
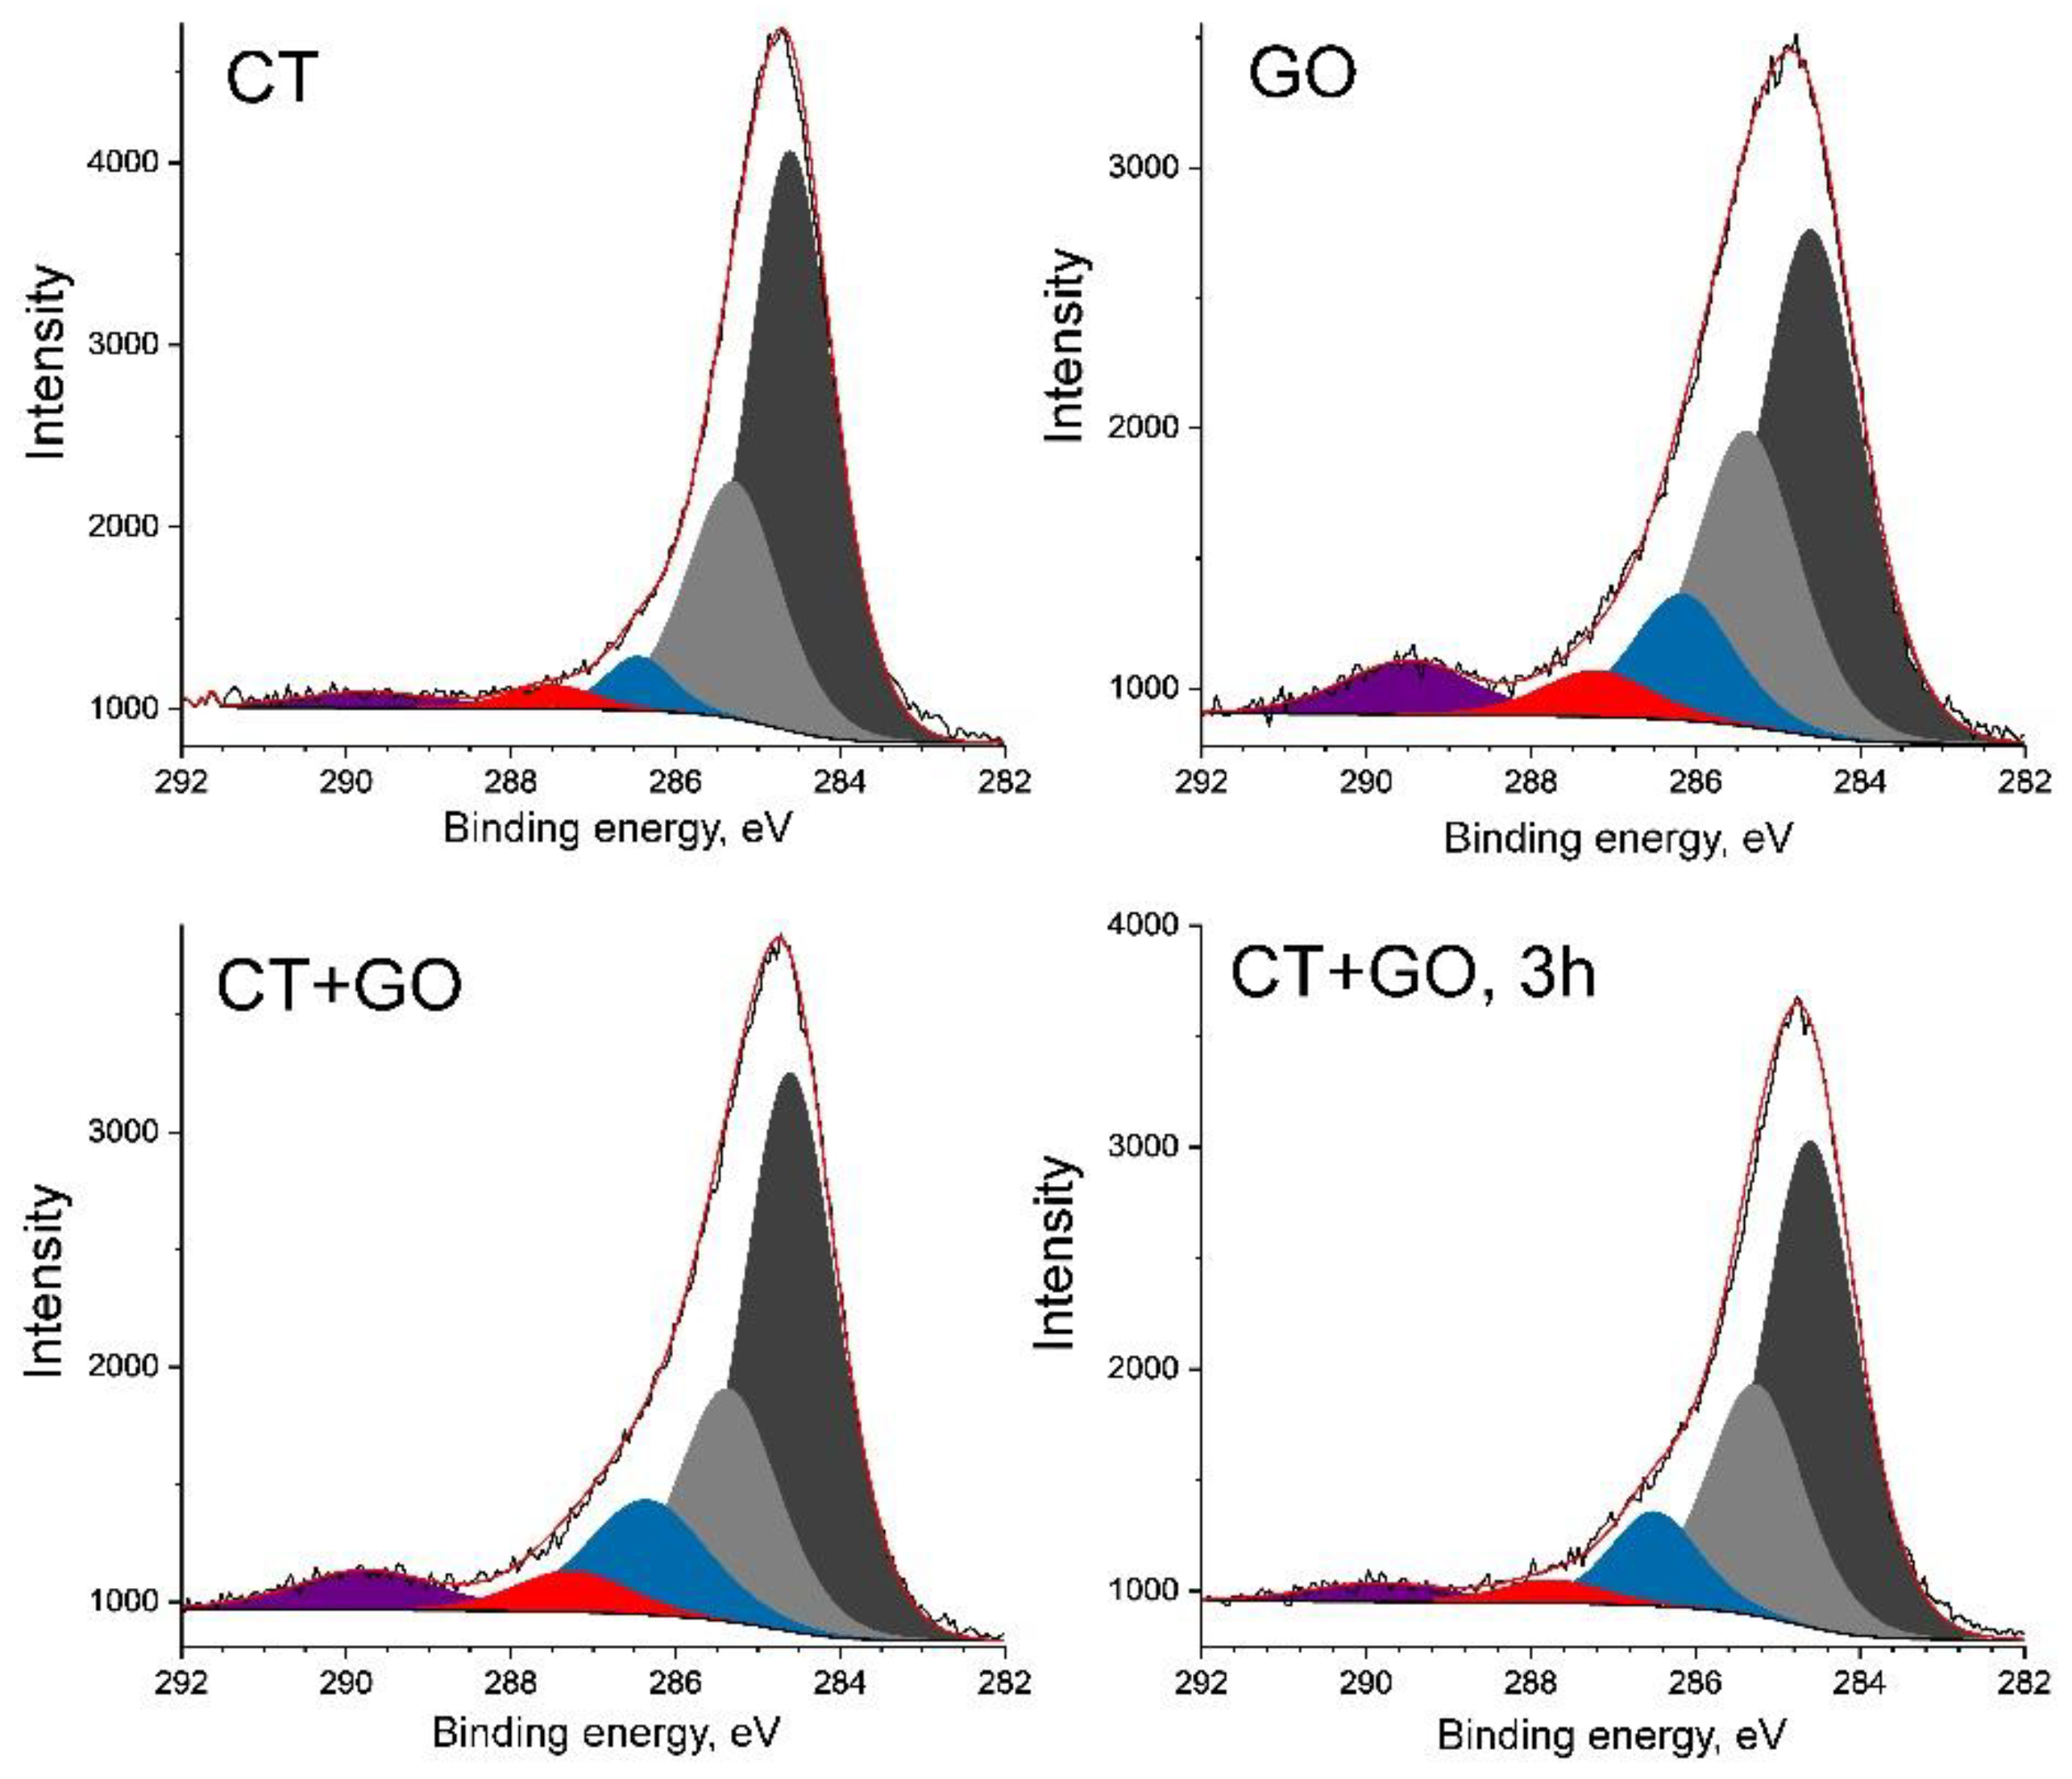

Table 1.
The characterization of coal and solvents used.
| Coal, solvent | Element composition, wt.% | BaP content, (mg/g) |
Distillation temperature range, °C |
Toluene-insolubles, wt.% | Quinoline-insolubles,wt.% | |||
| C | H | N+S+O | H/C at. | |||||
| Coal | 84.7* | 5.5* | 9.8* | 0.78 | - | – | – | – |
| CT | 91.5 | 5.3 | 3.2 | 0.69 | 8.1 | 180–550 | 11.6 | 1.8 |
| GO | 89.9 | 8.3 | 1.8 | 1.11 | 0.59 | 221–508 | 0.1 | <0.1 |
* based on daf coal.
Table 2.
Chemical composition of pitch-like products obtained on coal dissolution with different solvents for 1 h.
Table 2.
Chemical composition of pitch-like products obtained on coal dissolution with different solvents for 1 h.
| Solvent used | Content, wt.% based on daf | H/C | Softening | ||||
| C | H | N | S | O | atom. | point, °C | |
| CT | 89.7 | 5.4 | 1.3 | 1.0 | 2.6 | 0.72 | 86 |
| GO | 90.3 | 7.4 | 0.6 | 0.9 | 0.8 | 0.98 | - |
| CT+GO | 88.7 | 6.6 | 1.1 | 1.3 | 2.3 | 0.89 | 82 |
| CT+GO, 3 h* | 89.7 | 5.9 | 1.2 | 1.4 | 1.8 | 0.79 | 90 |
| Commercial coal tar pitch | 92.5 | 4.6 | 1.1 | 0.6 | 1.2 | 0.60 | 88 |
*coal dissolution duration was 3 h.
Table 3.
The group composition of the products obtained on coal dissolution using different solvents.
Table 3.
The group composition of the products obtained on coal dissolution using different solvents.
| Solvent used | Group composition, wt.% based on daf product | |||
| TS | QS |
QIS (α1-fraction) |
QS-TIS (α2-fraction) |
|
| CT | 64.4 | 91.8 | 8.2 | 27.4 |
| GO | 77.6 | 92.1 | 7.9 | 14.5 |
| CT+GO | 73.0 | 92.9 | 7.1 | 19.9 |
| CT+GO, 3h | 71.0 | 90.8 | 9.2 | 19.8 |
| Commercial coal tar pitch |
64.9 | 89.5 | 10.5 | 24.6 |
Table 4.
The characterization of molecular composition of the products based on the FTIR spectra.
| Solvent used | Aromaticity index | Ortho-substitution, Ios | CH3/CH2 | |
| Car | Har | |||
| CT | 0.87 | 0.67 | 0.44 | 0.42 |
| GO | 0.64 | 0.31 | 0.20 | 0.33 |
| CT+GO | 0.76 | 0.46 | 0.35 | 0,34 |
| CT+GO, 3 h | 0.78 | 0.50 | 0.37 | 0.41 |
Table 5.
Proton distribution and structural parameters of the average molecules of the chloroform-solubles from the products obtained using different solvents.
Table 5.
Proton distribution and structural parameters of the average molecules of the chloroform-solubles from the products obtained using different solvents.
| Solvent used | Proton distribution | Brown-Ladner structural parameters* | ||||||||
| Har | Ho | Hα | Hβ | Hγ | fa | Haru/Car | σ | n | ||
| CT | 0.65 | 0.02 | 0.18 | 0.12 | 0.03 | 0.88 | 0.63 | 0.16 | 1.8 | |
| GO | 0.30 | 0.01 | 0.28 | 0.34 | 0.07 | 0.64 | 0.68 | 0.37 | 2.6 | |
| CT+GO | 0.38 | 0.01 | 0.23 | 0.28 | 0.10 | 0.73 | 0.64 | 0.26 | 2.5 | |
| CT+GO, 3h | 0.44 | 0.002 | 0.22 | 0.27 | 0.07 | 0.78 | 0.58 | 0.23 | 2.5 | |
| Commercialcoal tar pitch | 0.67 | 0.02 | 0.15 | 0.13 | 0.03 | 0.91 | 0.50 | 0.12 | 2.0 | |
* fa – carbon aromaticity; σ - degree of aromatic ring substitution; n- average number of carbon atoms in the substituents; Haru/Car – hydrogen to carbon ratio in the hypothetical unsubstituted aromatic ring, indicates degree of the aromatic ring condensation.
Table 6.
Carbon distribution in the products obtained using different solvents.
| Solvent used | CH3 |
CH2+ CH |
OCH3 | COC | CarO | C=O+ COOH |
Car3+ CarH |
including |
Car2+ CarC |
fa | |
| Car3 | CarH* | ||||||||||
| CT | 0.04 | 0.06 | 0.01 | 0.02 | 0.01 | 0 | 0.71 | 0.24 | 0.48 | 0.15 | 0.87 |
| GO | 0.13 | 0.15 | 0.02 | 0.04 | 0.04 | 0.02 | 0.42 | 0.12 | 0.30 | 0.18 | 0.64 |
| CT+GO | 0.09 | 0.10 | 0.01 | 0.02 | 0.01 | 0.01 | 0.59 | 0.18 | 0.41 | 0.17 | 0.77 |
| CT+GO, 3h | 0.08 | 0.11 | 0.003 | 0.01 | 0.01 | 0.01 | 0.61 | 0.21 | 0.40 | 0.17 | 0.79 |
Car3 – quaternary pericondensed aromatic carbons; CarH – tertiary protonated aromatic carbons; CarC – alkylated aromatic carbons; Car2 – quaternary catacondensed aromatic carbons. * Derived from the FTIR spectra and chemical analysis.
Table 7.
The concentrations of the elements on the surface of the products, and the oxygen and nitrogen distribution between the surface and the bulk.
Table 7.
The concentrations of the elements on the surface of the products, and the oxygen and nitrogen distribution between the surface and the bulk.
| Solvent used | Surface concentration, % at | O/C atomic | N/C atomic | ||||||||
| C | O | N | Si | Ca | surface | bulk | surface | bulk | |||
| CT | 89.9 | 7.2 | 2.0 | 0.4 | 0.5 | 0.06 | 0.022 | 0.019 | 0.012 | ||
| GO | 85.6 | 13.5 | 0,6 | 0.2 | 0.1 | 0.12 | 0.007 | 0.006 | 0.006 | ||
| CT+GO | 87.2 | 9.9 | 1,4 | 0.3 | 0.2 | 0.08 | 0.019 | 0.014 | 0.011 | ||
| Commercial coal-tar pitch | 92.3 | 5.5 | 2.2 | - | - | 0.04 | 0.010 | 0.20 | 0.010 | ||
Table 8.
The distribution of carbon atoms between different carbon-containing species on the surface of the products obtained using different solvents.
Table 8.
The distribution of carbon atoms between different carbon-containing species on the surface of the products obtained using different solvents.
|
Solvent used |
Non-oxidized carbon | Oxidized carbon |
FWHM for CI, eV |
||||||
| CI | CII | total | C-O | C=O | COOH | total | |||
| CT | 0.60 | 0.28 | 0.88 | 0.06 | 0.03 | 0.03 | 0.12 | 1.25 | |
| GO | 0.44 | 0.28 | 0.72 | 0.14 | 0.08 | 0.06 | 0.28 | 1.54 | |
| CT+GO | 0.53 | 0.27 | 0.80 | 0.11 | 0.04 | 0.05 | 0.20 | 1.37 | |
| CT+GO, 3h | 0.55 | 0.28 | 0.83 | 0.11 | 0.03 | 0.03 | 0.17 | 1.35 | |
| Commercial coal tar pitch |
0.74 | 0.16 | 0.90 | 0.07 | 0.01 | 0.02 | 0.10 | 1.23 | |
Disclaimer/Publisher’s Note: The statements, opinions and data contained in all publications are solely those of the individual author(s) and contributor(s) and not of MDPI and/or the editor(s). MDPI and/or the editor(s) disclaim responsibility for any injury to people or property resulting from any ideas, methods, instructions or products referred to in the content. |
© 2025 by the authors. Licensee MDPI, Basel, Switzerland. This article is an open access article distributed under the terms and conditions of the Creative Commons Attribution (CC BY) license (http://creativecommons.org/licenses/by/4.0/).
Copyright: This open access article is published under a Creative Commons CC BY 4.0 license, which permit the free download, distribution, and reuse, provided that the author and preprint are cited in any reuse.


