
Submitted:
13 February 2025
Posted:
13 February 2025
You are already at the latest version
Abstract
This study aims to describe the advantages of electrifying regular-route buses. The results of a survey on the speed profile of buses operating on actual routes are presented here. Firstly, we focus on the acceleration / deceleration at the starting / stopping stops specifically for regular-route buses and obtain the following information: I. Starting acceleration from a bus stop is particularly strong in the second half of the acceleration process, being suitable for motor-driven vehicles. II. The features of the stopping deceleration at a bus stop are “high intensity” and “low dispersion,” with the latter enabling the refinement of regenerative settings and significantly lowering electricity economy during electrification. And we compare the speed profile of a fuel cell bus with those of a diesel bus and obtain the following information: III. Motor-driven vehicles have “high acceleration performance” and “no gear shifting” which facilitate the high-intensity stop–start acceleration operation unique to regular-route buses. By calculating and analyzing the jerk amount, we could quantitatively demonstrate the comfortable driving experience while riding on this type of bus where there is no shock due to gear shifting. IV. While the “high acceleration performance” of motor-driven vehicles produces “individual differences in the speed change patterns,” this does not translate to “individual differences in electricity consumption” owing to the characteristics of this type of vehicle. With engine-driven vehicles, measures, such as “slow acceleration” and ”shift up early” are strongly encouraged to realize eco-driving, and any driving style that deviates from these measures is avoided. However, with motor-driven vehicles, the driver does not need to be too concerned about the speed change patterns during acceleration. This characteristic also suggests a benefit in terms of the electrification of buses.
Keywords:
Route Bus
; Fuel Cell Bus
; Electric Vehicle
; Diesel Bus
; Speed Change Pattern
; Motor Characteristics
1. Introduction
In recent years, global climate change has become increasingly severe, with frequent occurrences of extreme weather events. Phenomena such as glacier melting and rising sea levels have escalated into global crises, with greenhouse gas emissions—particularly carbon dioxide—being one of the primary causes of this issue [1,2,3]. At the same time, the consumption of fossil fuels such as oil, natural gas, and coal is far exceeding their formation rate, leading to an increasing risk of resource shortages [4,5,6]. The interconnection between energy consumption and environmental change has made global warming and fossil fuel shortages intertwined issues, positioning them as central challenges for sustainable development worldwide [7,8].
Concerns over climate change and fossil fuel depletion have driven global efforts to reduce carbon emissions and conserve energy [9,10]. The transportation sector, responsible for 25% of global CO₂ emissions, plays a key role, especially road transport [11,12]. To meet the Paris Agreement targets, significant reductions are needed in this sector [13,14]. Consequently, vehicle electrification has been accelerating worldwide [15,16].
Many studies have discussed the various changes and benefits that vehicle electrification brings to road transportation, such as reducing greenhouse gas emissions [17], decreasing fossil fuel consumption [18], and protecting the environment [19].
This study focuses on an aspect that has not been fully explored: the suitability between specific driving conditions and vehicle electrification. Specifically, it investigates how the transition from internal combustion vehicles (ICVs) to electric vehicles (EVs) affects factors such as powertrain configuration and acceleration performance, and how these changes influence driving safety, driver fatigue, and passenger comfort under certain driving conditions. As previously discussed, the benefits of vehicle electrification in terms of energy savings, carbon reduction, and environmental protection have been extensively studied in many research works [17,18,19]; therefore, this study does not delve deeply into these aspects.
Different types of vehicles operate under vastly different driving conditions, which implies that different usage scenarios demand varying vehicle performance characteristics. For example, urban transit buses operating in busy city areas frequently start from bus stops due to passengers boarding and alighting. In such cases, a slow and smooth acceleration is first required to prevent passengers from losing balance or experiencing discomfort. However, once the bus merges into a high-speed traffic lane, rapid acceleration is necessary to avoid rear-end collisions with other vehicles. This situation highlights the dual requirement for high acceleration performance during lane merging (to prevent rear-end collisions) and smooth acceleration when starting (to ensure passenger safety and comfort).
At the same time, the powertrain systems of EVs differ significantly from those of conventional ICVs, leading to notable changes in vehicle performance due to electrification. In terms of powertrain composition, EVs primarily consist of batteries and electric motors, whereas ICVs rely on internal combustion engines and transmissions. Consequently, EVs exhibit significant advantages in acceleration performance (particularly at low speeds), precision in torque output control, and smooth acceleration due to the absence of a transmission system.
Ideally, the performance changes introduced by electrification should precisely align with the performance requirements of specific driving conditions. If the changes brought about by electrification contradict the demands of a particular driving scenario, efficiency may decline, making the adoption of EVs impractical. Conversely, if electrification results in excessive performance improvements that far exceed the requirements of the driving scenario, it would lead to unnecessary resource consumption, making such an approach suboptimal for the widespread adoption of EVs.
By investigating the suitability of electrification for specific driving conditions (particularly speed change pattern), we can better understand the benefits of vehicle electrification beyond the widely discussed macro-level impacts on carbon reduction, energy conservation, and environmental protection. Specifically, electrification may enhance driving safety, reduce driver fatigue, and improve passenger comfort in certain applications. Furthermore, the authors believe that clarifying the benefits of electrification in specific driving scenarios, beyond the general discussion of carbon reduction and energy efficiency, can further promote the adoption and expansion of EVs across various transportation applications.
This study focuses on a route bus that operates commercially within Tokyo [20]. EVs are said to be particularly suitable for public transportation, such as buses, because they generally have a low carbonization effect and contribute to an improved driving environment, with minimal impact on the surrounding area [21,22,23]. In addition to these benefits, as mentioned earlier, the authors consider the speed change pattern, which is unique to regular route buses, to be particularly well-suited for EVs. Therefore, this paper reports on the results of a survey of the speed change patterns of buses commercially operating in real regular routes, which was conducted to further clarify the benefits of route bus electrification.
In the first part (Section 3), the results of the analysis focused on acceleration when starting from a bus stop and deceleration when stopping, which is unique to route buses, are summarized. Through this analysis, the authors aim to highlight the specific driving performance requirements of route buses based on their operational characteristics. In the second part (Section 4), the results of the comparative analysis between the speed change pattern of an electric bus, which was chosen as an example of a motor-driven vehicle, and a diesel bus, which was chosen as an example of an engine-driven vehicle, are summarized. Through this analysis, the authors aim to further clarify the suitability of electrification for route buses in terms of improving driving safety, reducing driver fatigue, and enhancing passenger comfort. Additionally, based on the operational characteristics of route buses, this study proposes recommendations for regenerative braking settings and driving strategies specifically tailored for electric route buses.
2. Survey Method
2.1. Regular Routes and Buses Being Measured
The regular route studied in this survey is the “To 05-2” line of the Toei Bus operated by the Tokyo Metropolitan Bureau of Transportation, Japan [20]. The route shown in Figure 1 connects Tokyo Station Marunouchi South Exit and Tokyo Big Sight. The return trip distance is 17 km, and it takes approximately 80 min to complete.
2.2. Survey Period and Equipment Used
In this study, a fuel cell bus was chosen as an example of a motor-driven vehicle, and a diesel bus was chosen as an example of an engine-driven vehicle for speed measurements. Both types of buses run on the route. The measurements for the former were conducted on the journeys taken between December 14–17, 2021 by drivers A, B, C, and D, while the measurements for the latter were conducted on the journeys taken between December 22–25, 2021 by drivers E, F, G, and H.
We prepared a GPS-type device ourselves that was used for measuring the speed (Figure 2). This equipment consisted of an antenna, receiver (GPS module circuit board: UBLOX/C099-F9P [26]), and smartphone. It was devised to realize higher precision than common GPS devices through reference station compensation. Figure 3 shows an example of the measured data.
3. Survey Results and Analysis Focusing on the Acceleration / Deceleration of Route Buses When Starting and Stopping at Bus Stops
3.1. Separation and Extraction of Different Types of Starts and Stops (Bus Stop / Traffic Signal / Other)
As the analysis in this paper focuses on the acceleration when starting from a bus stop and the deceleration when stopping at a bus stop, such information must be separated and extracted from the speed measurement data. Herein, we discuss how that has been achieved.
Table 2 shows the result of performing this separation on the second bus (departing from Tokyo Station Marunouchi South Exit) on December 14, and Table 3 shows the same separation performed on all the buses on the same day. First, the continuously measured speed data is separated into individual trips, each consisting of one continuous trip from start to stop (trip number (a) in the same table). Next, the starts and stops of all of the trips are categorized into starting from/stopping at a bus stop, starting from/stopping at a traffic signal, and other starts/stops through visual examination of the GPS travel trajectory. After that, only the starts/stops at bus stops and starts/stops at traffic signals were extracted; those which were to be affected by the surrounding traffic (e.g., traffic jams) were excluded. More specifically, all of the trips that were less than 100 m were removed first (remaining start/stop number: (b) in the same table). Then, those, wherein the speed at the end of acceleration or the start of deceleration was less than 30 km/h, were excluded (remaining start/stop number: (c) in the same table).
The following analysis is performed on the data extracted through the operation discussed above. Note that the number of start accelerations/stop decelerations at bus stops, unique to regular route buses, exceeds the number of start accelerations/stop decelerations at traffic signals.
3.2. Comparative Analysis of Start Acceleration at Bus Stops and Start Acceleration at Traffic Signals
Figure 4 shows all speed change pattern measurements for the start of acceleration at bus stops and the start of acceleration at traffic signals by Driver A. Moreover, Figure 5 (Driver A) shows the same data summarized as the acceleration values for each speed region. In the first half of acceleration (in the low-speed region), the start of acceleration at bus stops is weaker than the start of acceleration at traffic signals. The main reasons for this are the consideration given to preventing passengers from falling and checking the flow of traffic in the driving lane. Meantime, during the second half of acceleration (in the medium-speed region), the start of acceleration at bus stops is stronger. The reason for this was the desires to reach cruising speed quickly after entering the driving lane to prevent rear-end collisions.
Generally, the acceleration performance of motor-driven vehicles is superior to that of engine-driving vehicles. Therefore, the characteristics of start acceleration at bus stops discussed above are considered more suitable for the former than the latter. A similar analysis was performed on the operations of every driver to verify the generality of this phenomenon (Figure 5 (Driver B–H). The results remained the same.
3.3. Comparative Analysis of Stop Deceleration at Bus Stops and Stop Deceleration at Traffic Signals
Figure 6 shows all of the speed change pattern measurements for stop decelerations at bus stops and stop decelerations at traffic signals by Driver A. Additionally, Figure 7 (Driver A) displays the same data reorganized as the accelerations (decelerations) according to each speed region. During the first half of deceleration (the high-speed region), the strength of deceleration to stop at bus stops (still in the driving lane at this point) and that of deceleration to stop at traffic signals were the same. However, during the second half of deceleration, the increase in the strength of the former (having left the driving lane at this point) was notable. This is because in general, the distance to a bus stop after leaving the driving lane is short, making faster deceleration necessary to stop. A similar analysis was performed for every driver to verify the generality of this phenomenon (Figure 7 (Driver B–H). The results were the same for all cases.
Next, we compared the degrees of dispersion between stop decelerations at bus stops and stop decelerations at traffic signals. From Figure 6 above, the former has a lower degree of dispersion in the speed change pattern than the latter. Figure 8 shows the same data reorganized as the probability distribution of the average acceleration (deceleration). The same phenomenon can also be observed in normal distribution curves and standard deviations in this figure. This was because stop decelerations at bus stops tend to be less easily affected by the traffic, which makes it possible for the drivers to decelerate out of their own volition, resulting in similar speed change patterns. Meanwhile, we concluded that there are discrepancies in stop decelerations at traffic signals because these are easily affected by the traffic.
The examination in this section elucidated the characteristics of deceleration for route buses, namely the fact that there is “strong deceleration when stopping at bus stops” and a “low degree of dispersion when stopping at bus stops.” The latter has the potential to facilitate the narrowing down of the regeneration setting in particular, which contributes to improving electricity consumption during electrification to a significant degree.
4. Survey Result and Comparative Analysis of Speed Change Patterns Between Fuel Cell Buses and Diesel Buses
4.1. Comparative Analysis of Acceleration Intensity at the Start
First, we focused on the acceleration when starting from a bus stop that is unique to route buses. Figure 9 shows the compilation of the speed change pattern for every driver (fuel cell bus: Driver A, B, C, and D / diesel bus: Driver E, F, G, and H). Moreover, Figure 10(a) shows the same data as the acceleration intensity for each speed region. One can observe that, at every speed band (particularly, at 30 km/h or more), the acceleration intensity of fuel cell buses is higher than that of diesel buses. Although the main reason for this result is the difference in the output characteristics of the motor and the engine, low acceleration (acceleration work) applied on diesel buses to reduce gear shifting shock revealed during separate interviews is also assumed to influence the results.
Next, acceleration data when starting at traffic signals was added and a similar analysis was performed. This yielded similar results, as shown in Figure 10(b).
In addition to the phenomena discussed above, stalling of diesel buses at medium speeds (10–15 km/h) and the fact that large individual differences in fuel cell buses among the drivers (high degree of dispersion) were observed in the measurement results. These are analyzed in detail in the following sections.
4.2. Analysis of the Negative Impact of Gear Shifting During the Start of Acceleration of Diesel Buses
As mentioned earlier, the acceleration of diesel buses slowed in the 10–15 km/h speed band. This was due to the interruption of acceleration caused by gear-shifting operations. Figure 11(a) shows a diagram representing the acceleration–speed profile during the start of acceleration that was prepared to clarify this phenomenon. It shows the interruption of acceleration in the diesel buses, which does not exist in the fuel cell buses. In the previous sections, we pointed out that, as a characteristic of the start–stop acceleration unique to route buses, strong acceleration occurs during the latter half of acceleration (the medium-to-high speed region) to quickly reach cruising speed to avoid a rear-end collision by the vehicle in the rear. As the abovementioned speed band corresponds to the initial stage of this acceleration, one can claim that a fuel cell bus, wherein acceleration does not slow, has characteristics that facilitate easy driver operation.
Gear shifting also makes riding more uncomfortable. The change pattern of the jerk amount was also compiled in Figure 11(b) to quantitatively understand this phenomenon [27,28,29]. While both types of buses had the same amount of jerk on startup, the deterioration of jerk when shifting gears in the diesel bus was notable.
The high acceleration performance and riding comfort can be said to be the primary advantages of motor-driven vehicles, and this phenomenon was reconfirmed in this actual measurement data. Moreover, we would like to add that many drivers agreed with these benefits.
4.3. Comparative Analysis of Individual Differences in the Speed Change Pattern When Starting
As indicated earlier, there are considerable differences among individuals in terms of the speed change patterns when starting fuel cell buses. This phenomenon was particularly notable in the speed band of 30 km/h or more. Herein, we will proceed with a detailed analysis of this phenomenon.
Figure 12 shows the aforementioned averages of the acceleration strength in each speed band as a bar graph, with the addition of the maximum and minimum values. This shows a particularly large discrepancy in the high-speed range of the fuel cell buses. Figure 13 reorganizes the appearance frequencies of the acceleration average as a distribution diagram. Furthermore, individual differences can be recognized here.
The reason why the individual differences in the speed change history become notable during the acceleration of fuel cell buses is because of the high acceleration performance of this type of bus. Meanwhile, the limitations in the acceleration performance of diesel buses result in nearly identical driving operations among the drivers, making it more difficult for individual differences to occur.
4.4. Comparative Analysis of the Speed Change Pattern When Stopping
Figure 14 compiles the speed change patterns of all drivers during deceleration while stopping at bus stops. No differences in behavior between the two types of buses, comparable to those observed during startup, were recognized.
5. Conclusions
The findings obtained through this study are summarized as follows.
- I.
- Regarding the start of acceleration at bus stops, unique to regular route buses, it was pointed out that the start of acceleration at bus stops is weaker than the start of acceleration at traffic signals during the first half of acceleration (in the low-speed region), and the reasons for this were clarified. Furthermore, it was elucidated that during the second half of the start of acceleration at bus stops (in the medium-speed region), acceleration is stronger, and the reason for this was due to the desire to reach cruising speed quickly to prevent rear-end collisions. Generally, the acceleration performance of motor-driven vehicles is superior to that of engine-driving vehicles, and it is widely understood that this characteristic is well-liked by bus drivers. Moreover, the difference in performance was verified, primarily during the second half of the start of acceleration at bus stops (in the medium-speed region).
- I.
- II. Regarding the stop deceleration at bus stops, unique to regular route buses, the characteristics of “strong deceleration when stopping at bus stops” and a “low degree of dispersion when stopping at bus stops,” as well as their reasons, were elucidated. It was pointed out that the latter, in particular, has the potential to facilitate the narrowing down of the regeneration setting, which contributes to improving electricity consumption during electrification to a significant degree.
- I.
- III. We concluded that the “no gear shifting” characteristic makes acceleration easy during departing from a bus stop in addition to the “high acceleration performance” of motor-driven vehicles. Furthermore, by calculating and analyzing the jerk amount, we could quantitatively demonstrate the comfortable driving experience while riding on this type of bus where there is no shock due to gear shifting.
- I.
- IV. While the “high acceleration performance” of motor-driven vehicles produces “individual differences in the speed change patterns,” this does not translate to “individual differences in electricity consumption” owing to the characteristics of this type of vehicle [30,31]. With engine-driven vehicles, measures, such as “slow acceleration,” are strongly encouraged to realize eco-driving, and any driving style that deviates from these measures is avoided. However, with motor-driven vehicles, the driver does not need to be too concerned about the speed history during acceleration. This characteristic also suggests a benefit in terms of the electrification of buses.
Author Contributions
Conceptualization, all authors; methodology, Y.F., W.-h.Y. and Y.K.; software, Y.F. and W.-h.Y.; validation, Y.F. and Y.K.; formal analysis, Y.F., W.-h.Y. and Y.K.; investigation, Y.F., W.-h.Y. and Y.K.; resources, Y.K.; data curation, Y.F. and Y.K.; writing—original draft preparation, Y.F.; writing—review and editing, Y.K.; visualization, Y.F. and W.-h.Y.; supervision, Y.K.; project administration, Y.K.; funding acquisition, Y.K. All authors have read and agreed to the published version of the manuscript.
Acknowledgments
The authors would like to thank the Bureau of Transportation Tokyo Metropolitan Government, especially Mr. Miyagi, for their valuable assistance and support.
Data Availability Statement
The original contributions presented in the study are included in the article, further inquiries can be directed to the corresponding author.
Conflicts of Interest
The authors declare no conflicts of interest.
References
- Intergovernmental Panel on Climate Change (IPCC). Land–climate interactions. Available online: https://www.ipcc.ch/site/assets/uploads/sites/4/2022/11/SRCCL_Chapter_2.pdf (accessed on 8 February 2025).
- Intergovernmental Panel on Climate Change (IPCC). Polar Regions. Available online: https://www.ipcc.ch/site/assets/uploads/sites/3/2022/03/05_SROCC_Ch03_FINAL.pdf (accessed on 8 February 2025).
- Intergovernmental Panel on Climate Change (IPCC). Sea Level Rise and Implications for Low-Lying Islands, Coasts and Communities. Available online: https://www.ipcc.ch/site/assets/uploads/sites/3/2022/03/06_SROCC_Ch04_FINAL.pdf (accessed on 8 February 2025).
- International Energy Agency (IEA). World energy outlook 2022 [R]. IEA, 2022, Paris. Available online: https://www.oecd-ilibrary.org/energy/worldenergy-outlook-2022_3a469970-en (accessed on 8 February 2025).
- Sorrell, S.; Speirs, J.; Bentley, R.; Brandt, A.; Miller, R. Global Oil Depletion: A Review of the Evidence. Energy Policy 2010, 38, 5290–5295. Available online: https://www.sciencedirect.com/science/article/abs/pii/S0301421510003204 (accessed on 8 February 2025). [CrossRef]
- Mikael Höök, Robert Hirsch, Kjell Aleklett, Giant oil field decline rates and their influence on world oil production, Energy Policy 2009, 37, 2262–2272. [CrossRef]
- MAZZA, Daniele; CANUTO, Enrico. Depletion of fossil fuel reserves and projections of CO $ _2 $ concentration in the Earth atmosphere. arXiv 2022, arXiv:2209.01911. [CrossRef]
- Intergovernmental Panel on Climate Change (IPCC). Summary for Policymakers. Available online: https://www.ipcc.ch/site/assets/uploads/sites/2/2022/06/SPM_version_report_LR.pdf (accessed on 8 February 2025).
- Lacal Arantegui, R.; Jäger-Waldau, A. Photovoltaics and wind status in the European Union after the Paris Agreement. Renew. Sustain. Energy Rev. 2018, 81, 2460–2471. [Google Scholar] [CrossRef]
- Foley, A.; Smyth, B.M.; Pukšec, T.; Markovska, N.; Duić, N. A review of developments in technologies and research that have had a direct measurable impact on sustainability considering the Paris agreement on climate change. Renew. Sustain. Energy Rev. 2017, 68, 835–839. [Google Scholar] [CrossRef]
- Huang, Y.; Ng, E.C.Y.; Zhou, J.L.; Surawski, N.C.; Chan, E.F.C.; Hong, G. Eco-driving technology for sustainable road transport: A review. Renew. Sustain. Energy Rev. 2018, 93, 596–609. [Google Scholar] [CrossRef]
- Alshehry, A.S.; Belloumi, M. Study of the environmental Kuznets curve for transport carbon dioxide emissions in Saudi Arabia. Renew. Sustain. Energy Rev. 2017, 75, 1339–1347. [Google Scholar] [CrossRef]
- United Nations. Summary of the Paris Agreement. Available online: http://bigpicture.unfccc.int/#content-the-paris agreement (accessed on 8 February 2025).
- United Nations. Paris Agreement—Status of Ratification. Available online: http://unfccc.int/paris_agreement/items/9444.php (accessed on 8 February 2025).
- Bryła, P.; Chatterjee, S.; Ciabiada-Bryła, B. Consumer Adoption of Electric Vehicles: A Systematic Literature Review. Energies 2023, 16, 205. [Google Scholar] [CrossRef]
- International Energy Agency (IEA). World Energy Outlook 2024. IEA, 2024. Available online: https://iea.blob.core.windows.net/assets/140a0470-5b90-4922-a0e9-838b3ac6918c/WorldEnergyOutlook2024.pdf (accessed on 8 February 2025).
- Hawkins, T.R.; Singh, B.; Majeau-Bettez, G.; Strømman, A.H. Comparative Environmental Life Cycle Assessment of Conventional and Electric Vehicles. Journal of Industrial Ecology 2013, 17, 53–64. Available online: https://onlinelibrary.wiley.com/doi/10.1111/j.1530-9290.2012.00532.x (accessed on 8 February 2025). [CrossRef]
- Wu, G.; Inderbitzin, A.; Bening, C. Total Cost of Ownership of Electric Vehicles Compared to Conventional Vehicles: A Probabilistic Analysis and Projection Across Market Segments. Energy Policy 2015, 80, 196–214. Available online: https://www.sciencedirect.com/science/article/abs/pii/S0301421515000671 (accessed on 8 February 2025). [CrossRef]
- Nordelöf, A.; Messagie, M.; Tillman, A.-M.; Ljunggren Söderman, M.; Van Mierlo, J. Environmental Impacts of Hybrid, Plug-in Hybrid, and Battery Electric Vehicles—What Can We Learn from Life Cycle Assessment? International Journal of Life Cycle Assessment 2014, 19, 1866–1890. Available online: https://link.springer.com/article/10.1007/s11367-014-0788-0 (accessed on 8 February 2025). [CrossRef]
- Bureau of Transportation Tokyo Metropolitan Government, Toei Bus Real-Time Information Service. Available online: https://tobus.jp/blsys/navi?LCD=&VCD=cslrsi&ECD=NEXT&RTMCD=181 (accessed on 12 February 2025).
- Clairand, J.-M.; Guerra-Terán, P.; Serrano-Guerrero, X.; González-Rodríguez, M.; Escrivá-Escrivá, G. Electric Vehicles for Public Transportation in Power Systems: A Review of Methodologies. Energies 2019, 12, 3114. [Google Scholar] [CrossRef]
- Ng, K.-W.; Tong, H.-Y. Comparisons of Driving Characteristics between Electric and Diesel-Powered Bus Operations along Identical Bus Routes. Sustainability 2024, 16, 4950. [Google Scholar] [CrossRef]
- Fang, Y.; Yang, W.-h.; Ihara, Y.; Kamiya, Y. Developing a Simple Electricity Consumption Prediction Formula for the Pre-Introduction Prediction for Electric Buses. World Electr. Veh. J. 2025, 16, 67. [Google Scholar] [CrossRef]
- Toyota Motor Corporation, Mass-produced Fuel Cell Bus – SORA. Available online: https://global.toyota/jp/newsroom/corporate/21862392.html (accessed on 12 February 2025).
- The Mitsubishi Fuso Truck and Bus Corporation, AERO STAR. Available online: https://www.mitsubishi-fuso.com/ja/product/aero-star/ (accessed on 12 February 2025).
- UBLOX Company, C099-F9P Application board (rev, E) User guide. Available online: https://content.u-blox.com/sites/default/files/documents/C099-F9P-AppBoard_UserGuide_UBX-18063024.pdf (accessed on 12 February 2025).
- Wang, F.; Sagawa, K.; Inooka, H. A Study of the Relationship between the Longitudinal Acceleration / Deceleration of Automobiles and Ride Comfort. The Japanese Journal of Ergonomics 2000, 36, 191–200. [Google Scholar] [CrossRef]
- Zhao Li, Yoichi Hori, Realtime Smart Speed Pattern Generator for EVs to Improve Safety and Ride Comfort taking Driver’s Command Change and Limits of Acceleration and Jerk into account, Papers of Technical Meeting on Industrial Instrumentation and Control and Mechatronics Control, IEE Japan, Vol. IIC-06, No. 16-39. 41-44, pp.5-9, 2006.
- Nobuki Akamatsu, Ikkyu Aihara, Tohru Kawabe, Driving Characteristics Analysis Using Ride Comfort Index Based on Time Series Data of Longitudinal and Lateral Accelerations, Proceedings of IFAC Japan Congress 2018, No. 13D5, pp. 1292–1297, 2018.
- Fang, Y.; Yang, W.-h.; Kamiya, Y.; Imai, T.; Ueki, S.; Kobayashi, M. Speed Change Pattern Optimization for Improving the Electricity Consumption of an Electric Bus and Its Verification Using an Actual Vehicle. World Electr. Veh. J. 2024, 15, 16. [Google Scholar] [CrossRef]
- Fang, Y.; Huang, S.-H.; Kobayashi, K.; Yang, W.-H.; Kamiya, Y. Optimization of Speed Change Pattern for Improving Electricity Consumption of Electric Heavy-duty Vehicles and Verification through Actual Vehicle Chassis Dynamometer Testing. Journal of Transactions of Society of Automotive Engineers of Japan 2024, 55, 14–19. [Google Scholar] [CrossRef]
Figure 1.
Route profile of Toei Bus 05-2 shuttle route.
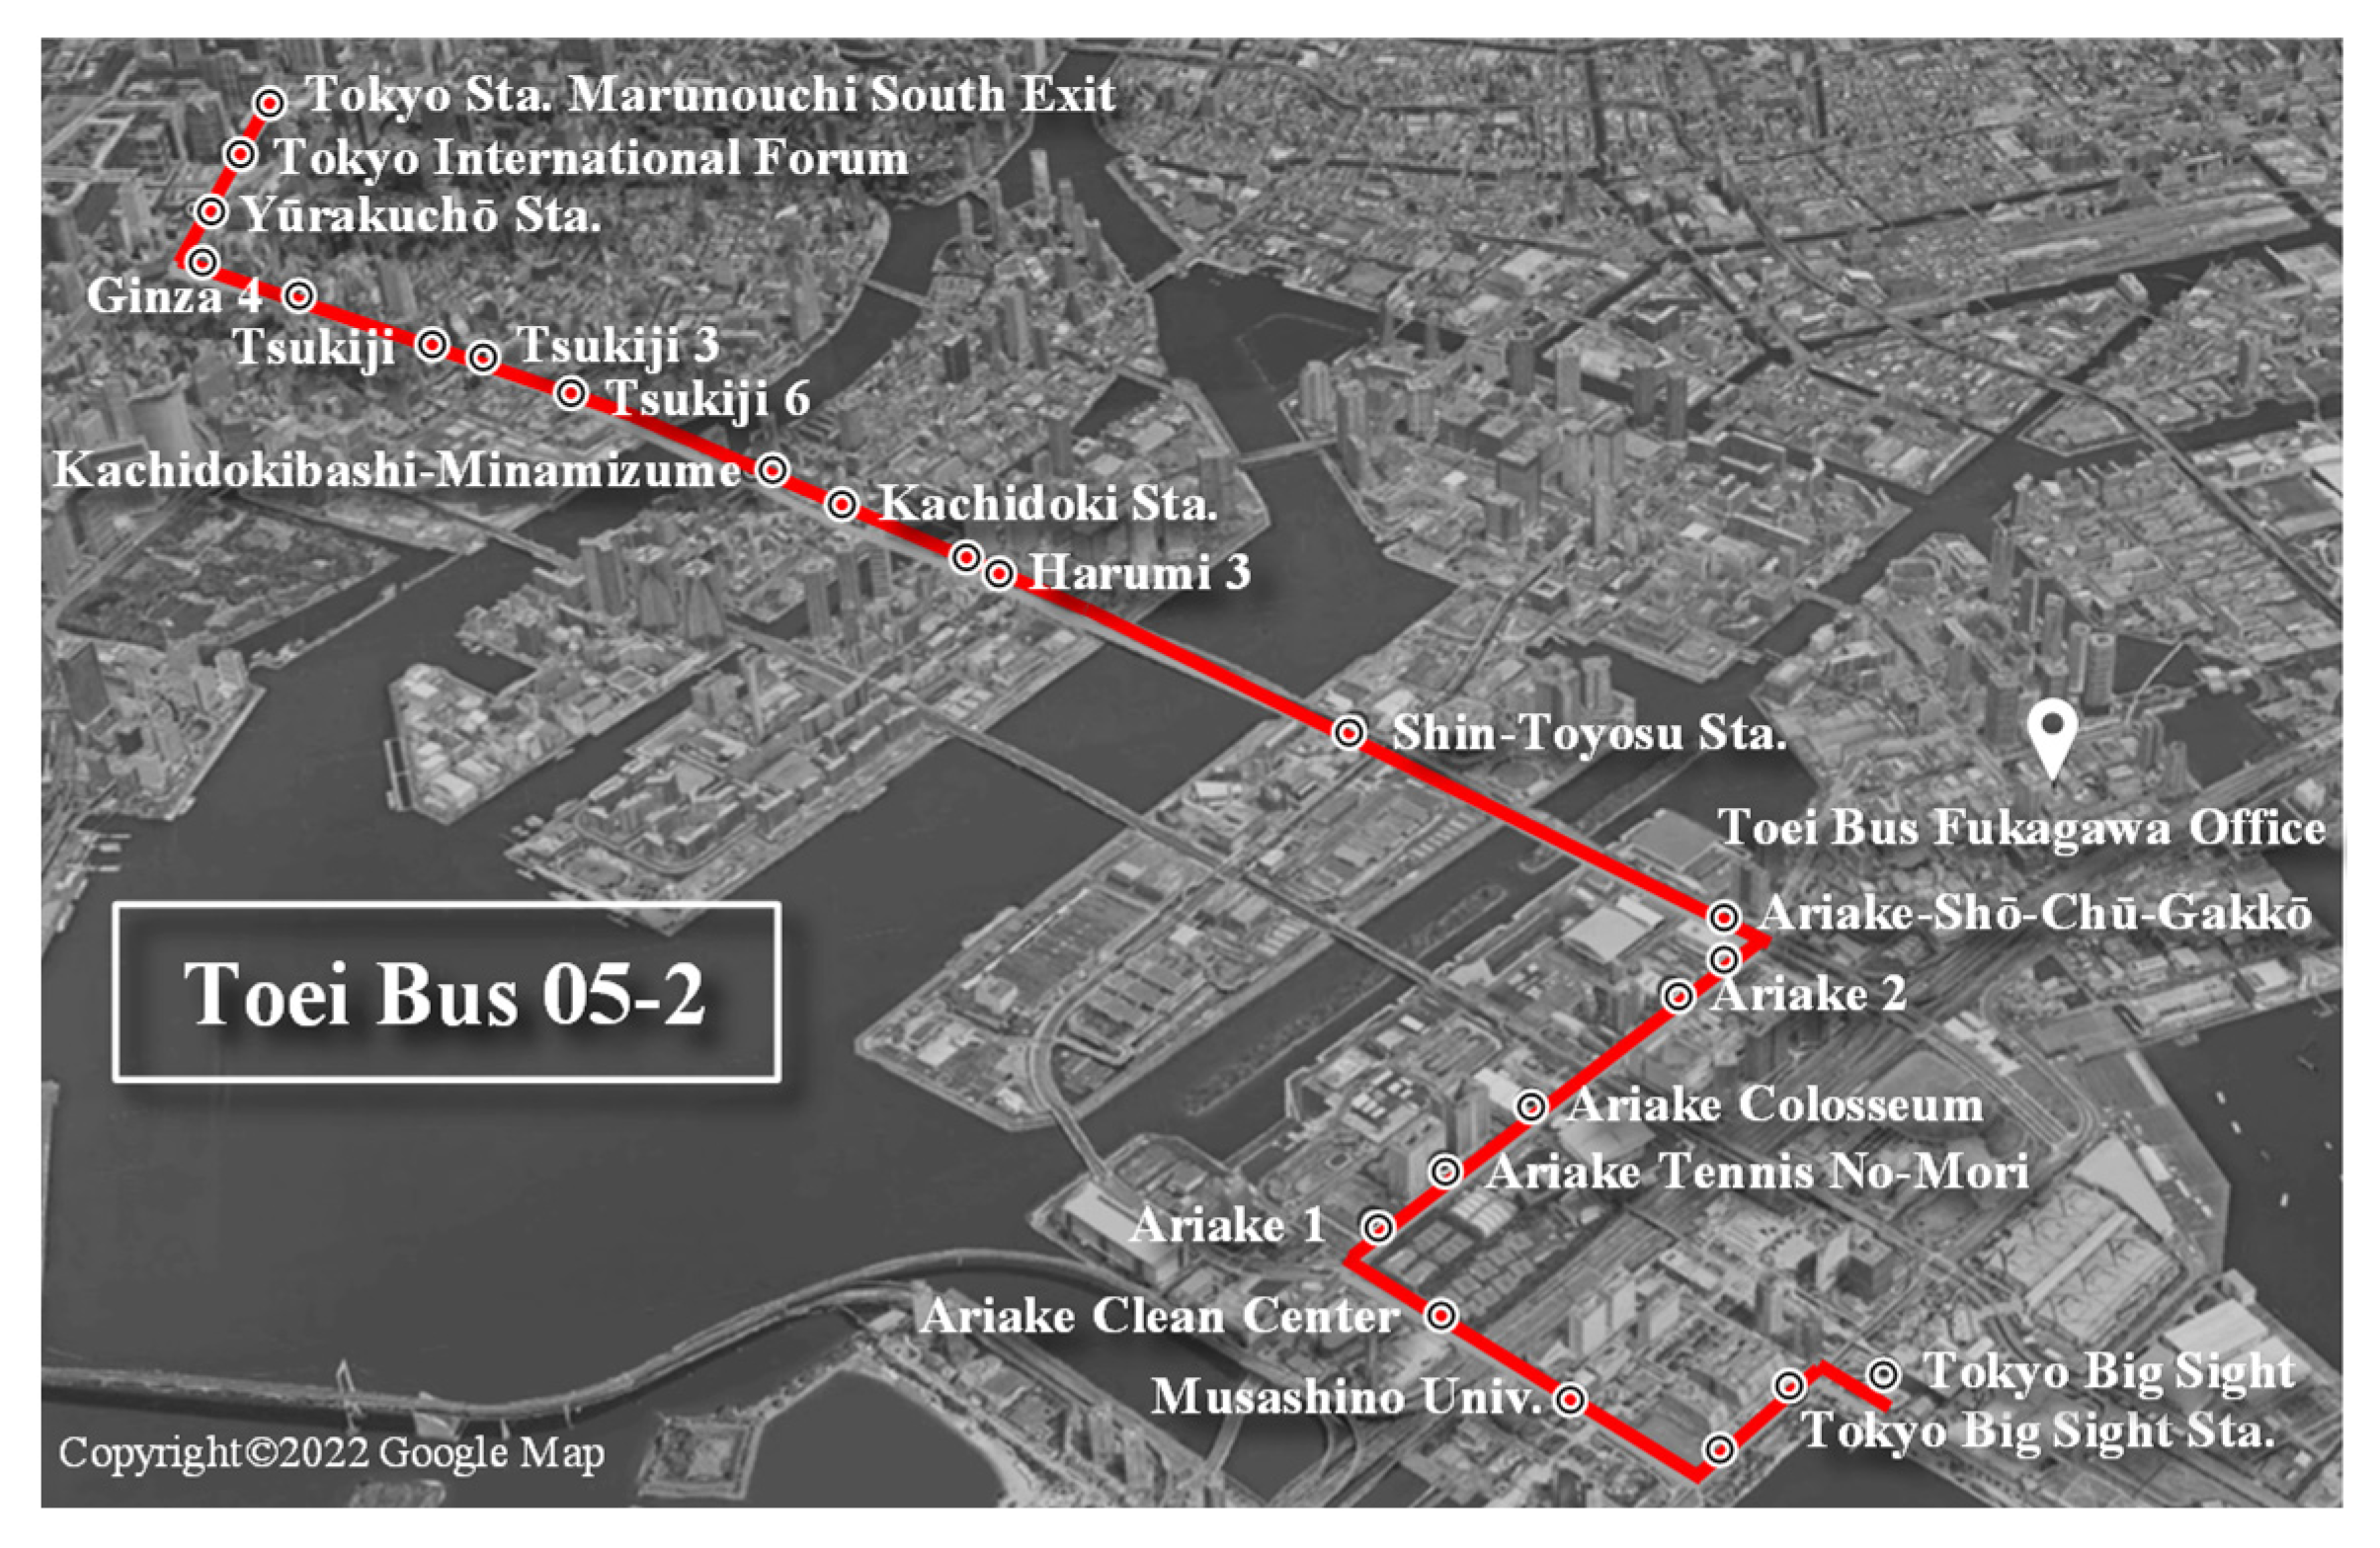
Figure 2.
Measuring equipment and measuring method.
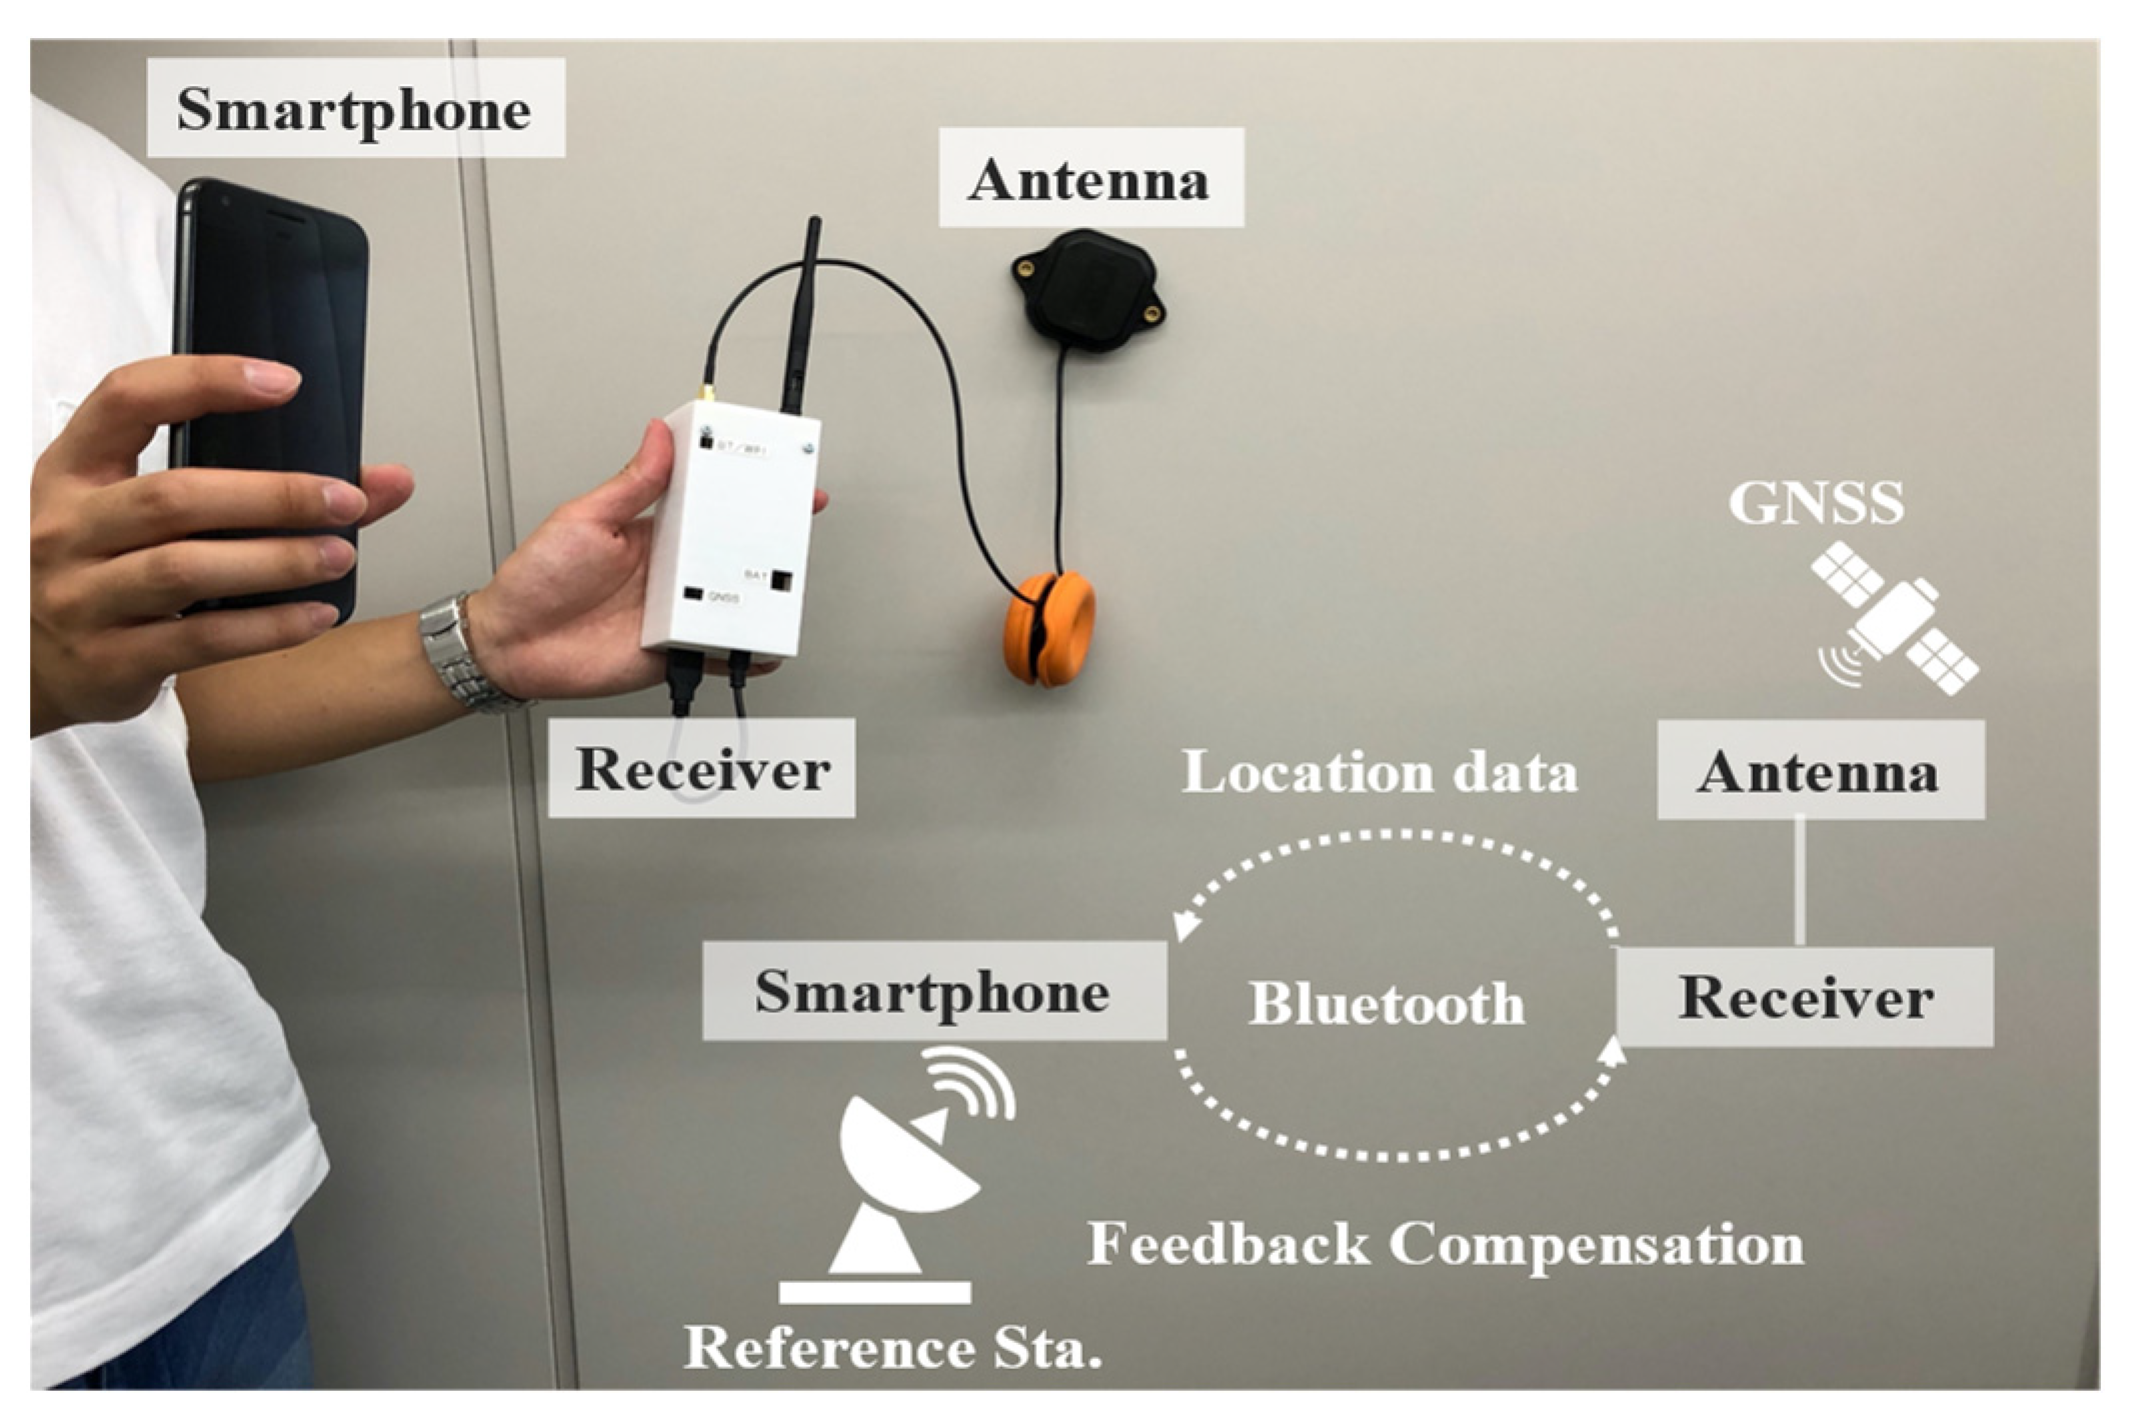
Figure 3.
Measured data Example of speed pattern.
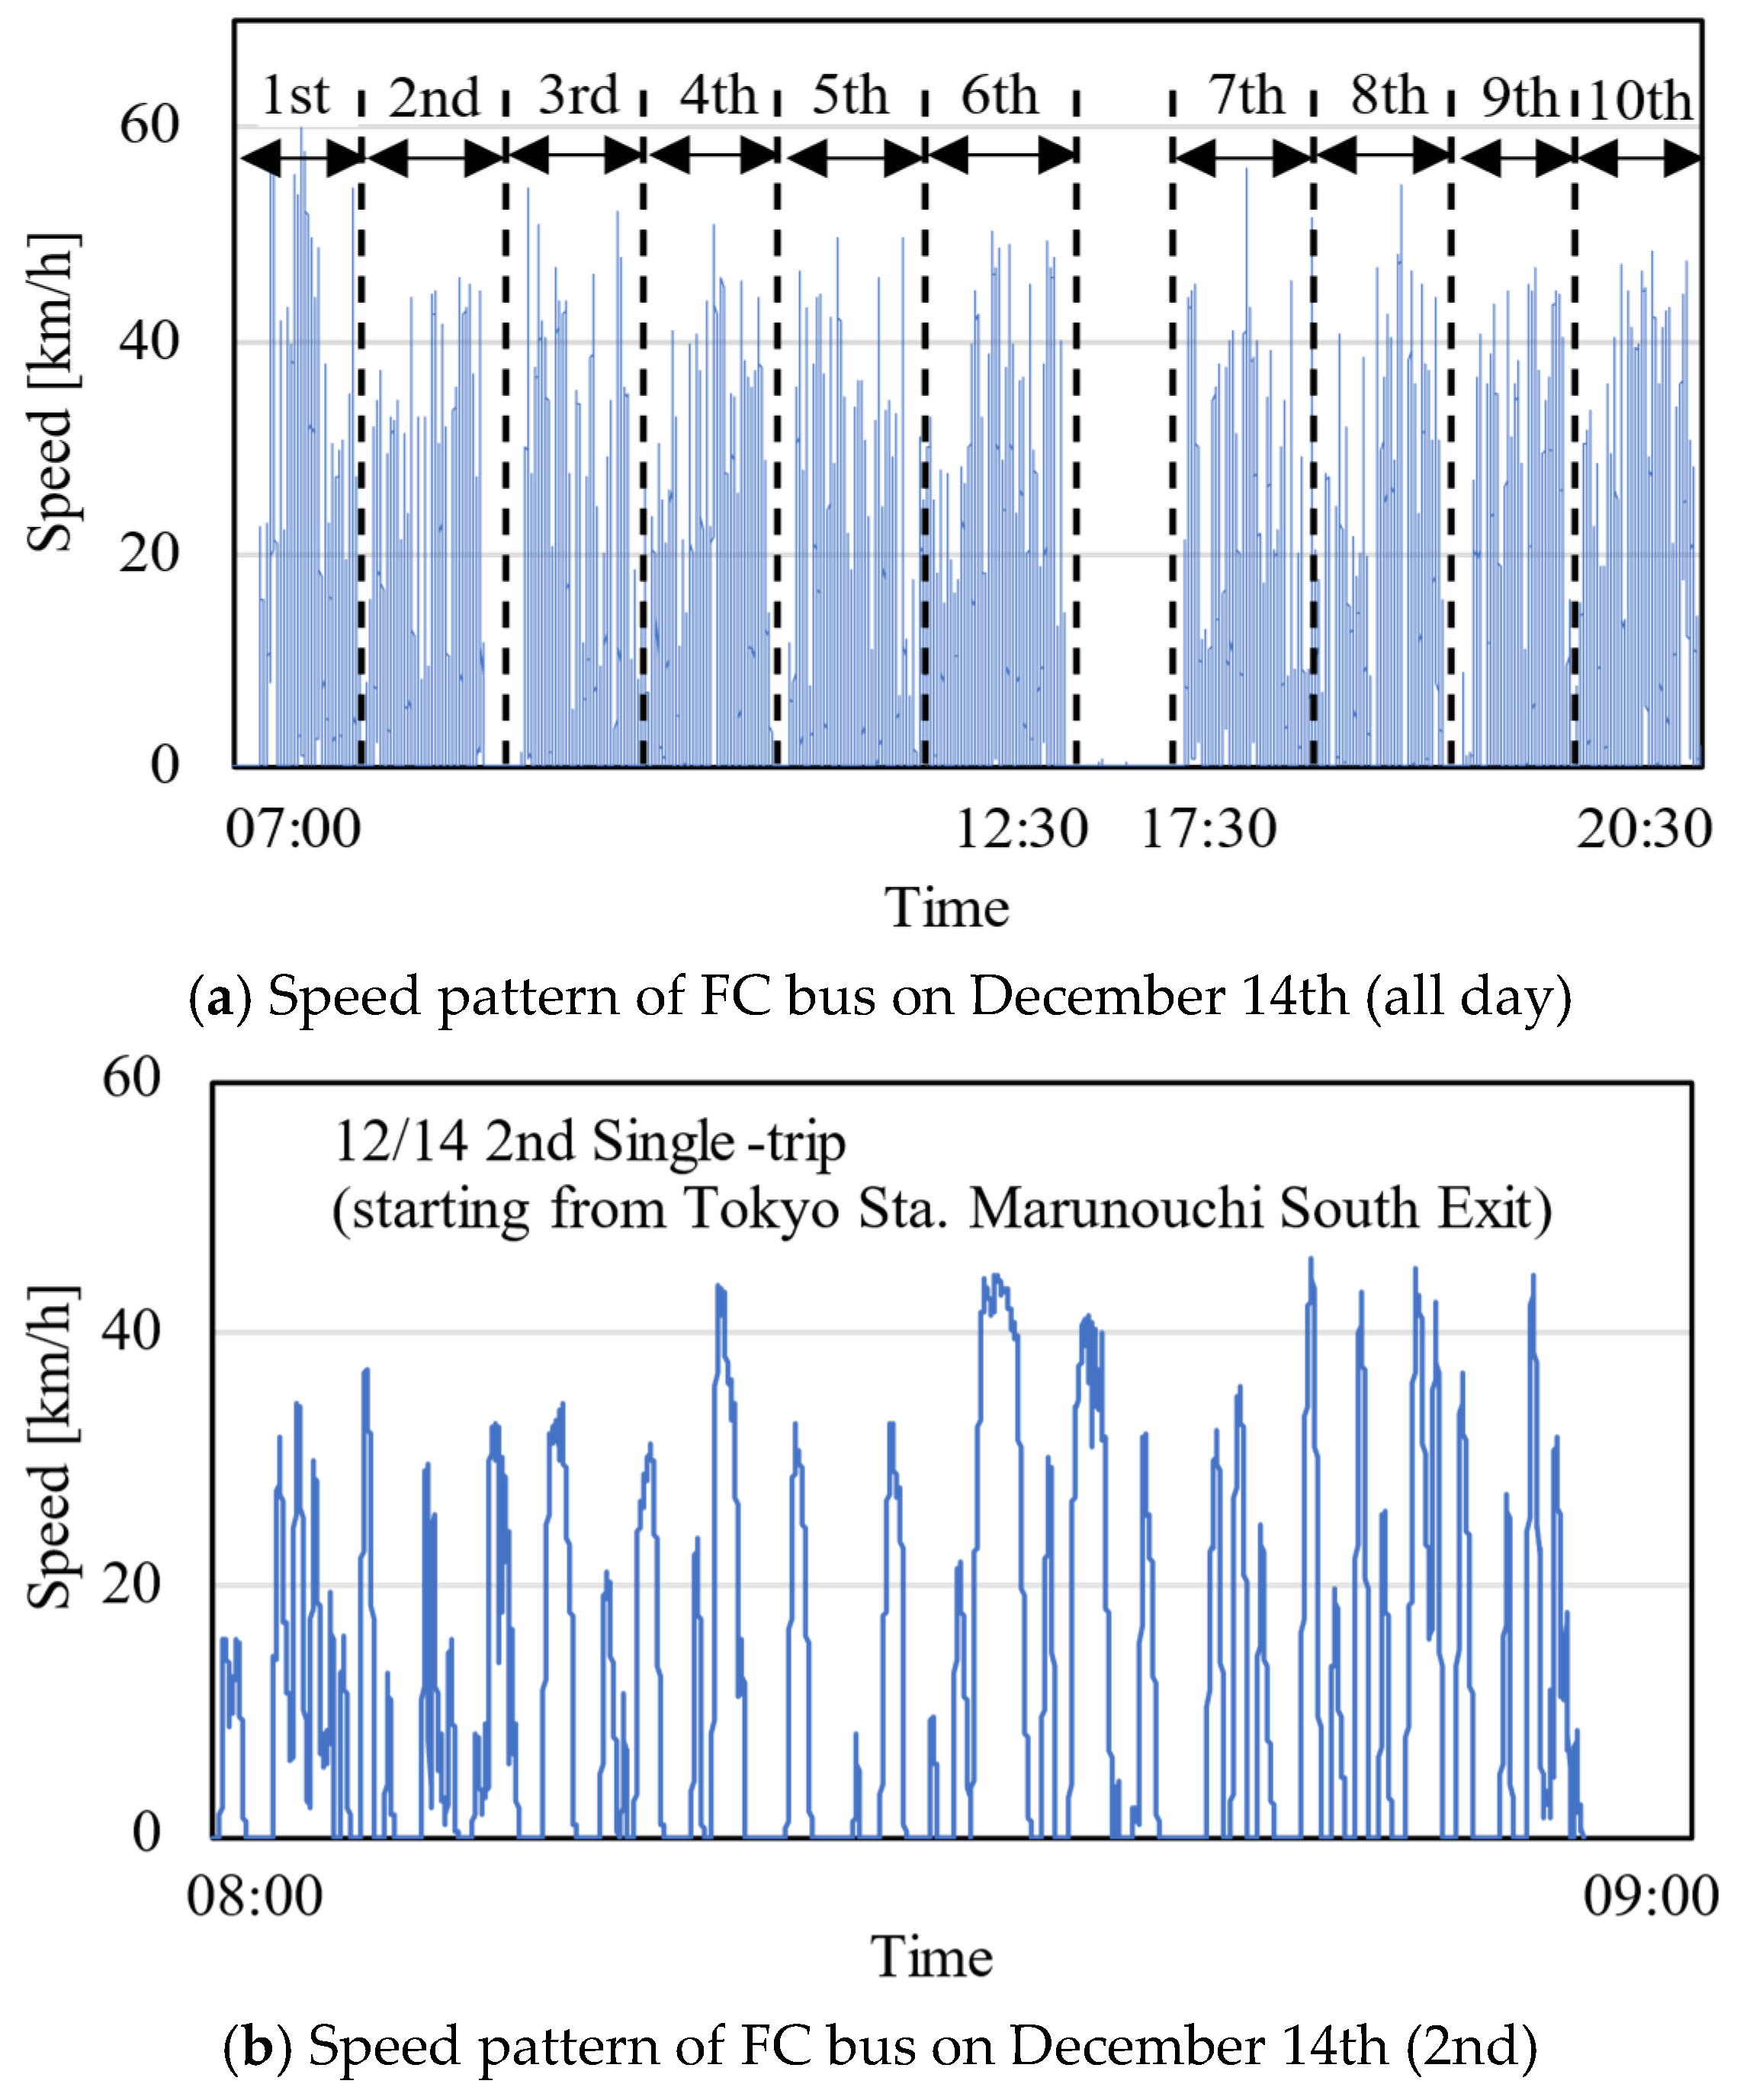
Figure 4.
Comparison of acceleration speed patterns starting from bus stops (left) / from signals (right).
Figure 4.
Comparison of acceleration speed patterns starting from bus stops (left) / from signals (right).
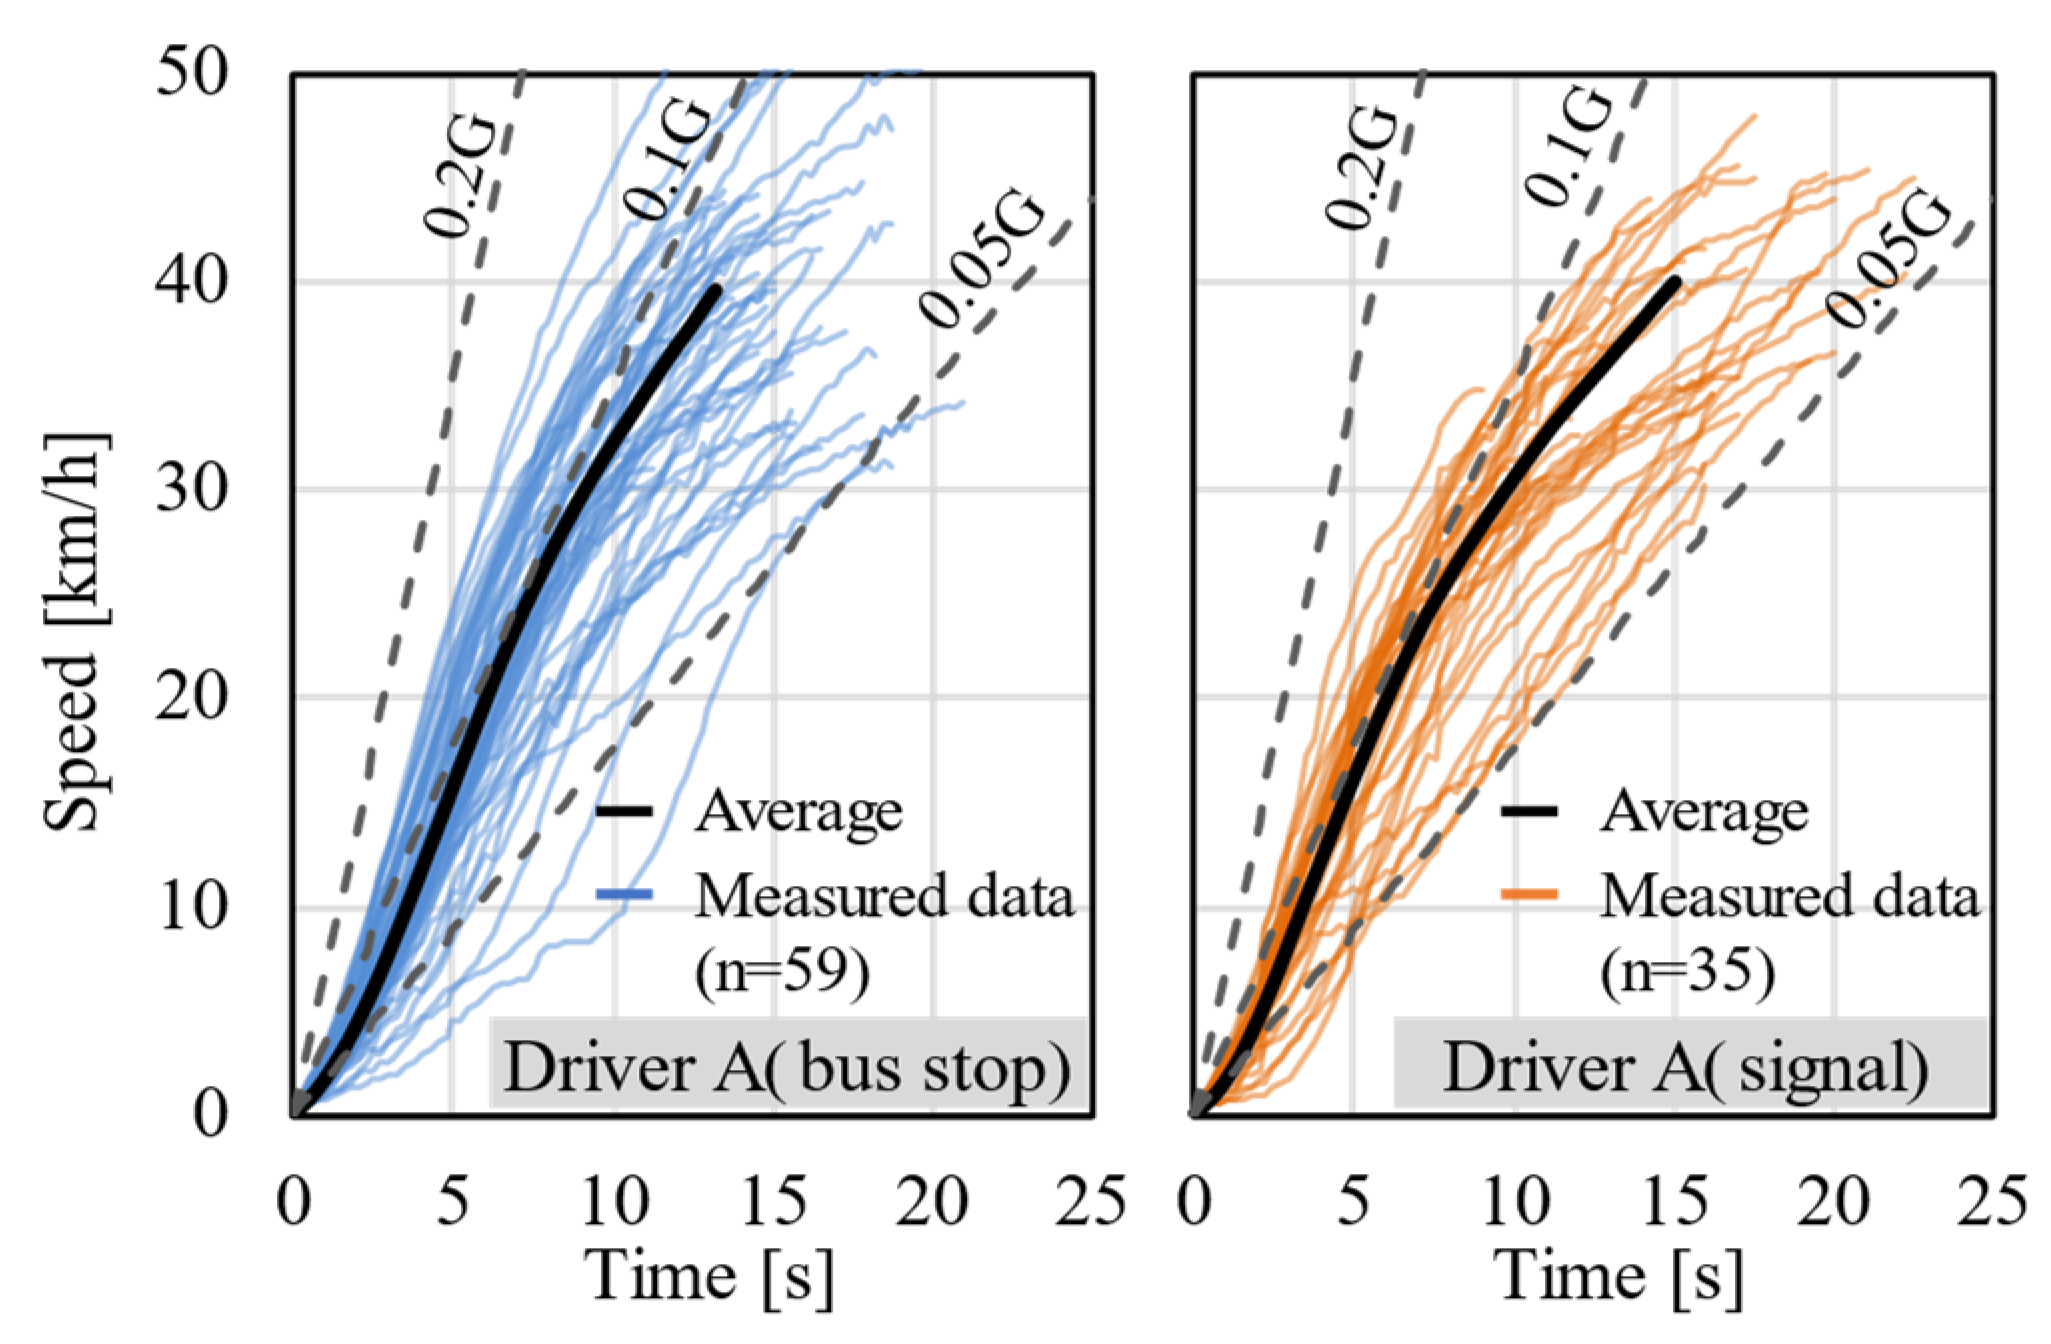
Figure 5.
Comparison of starting acceleration (each driver).
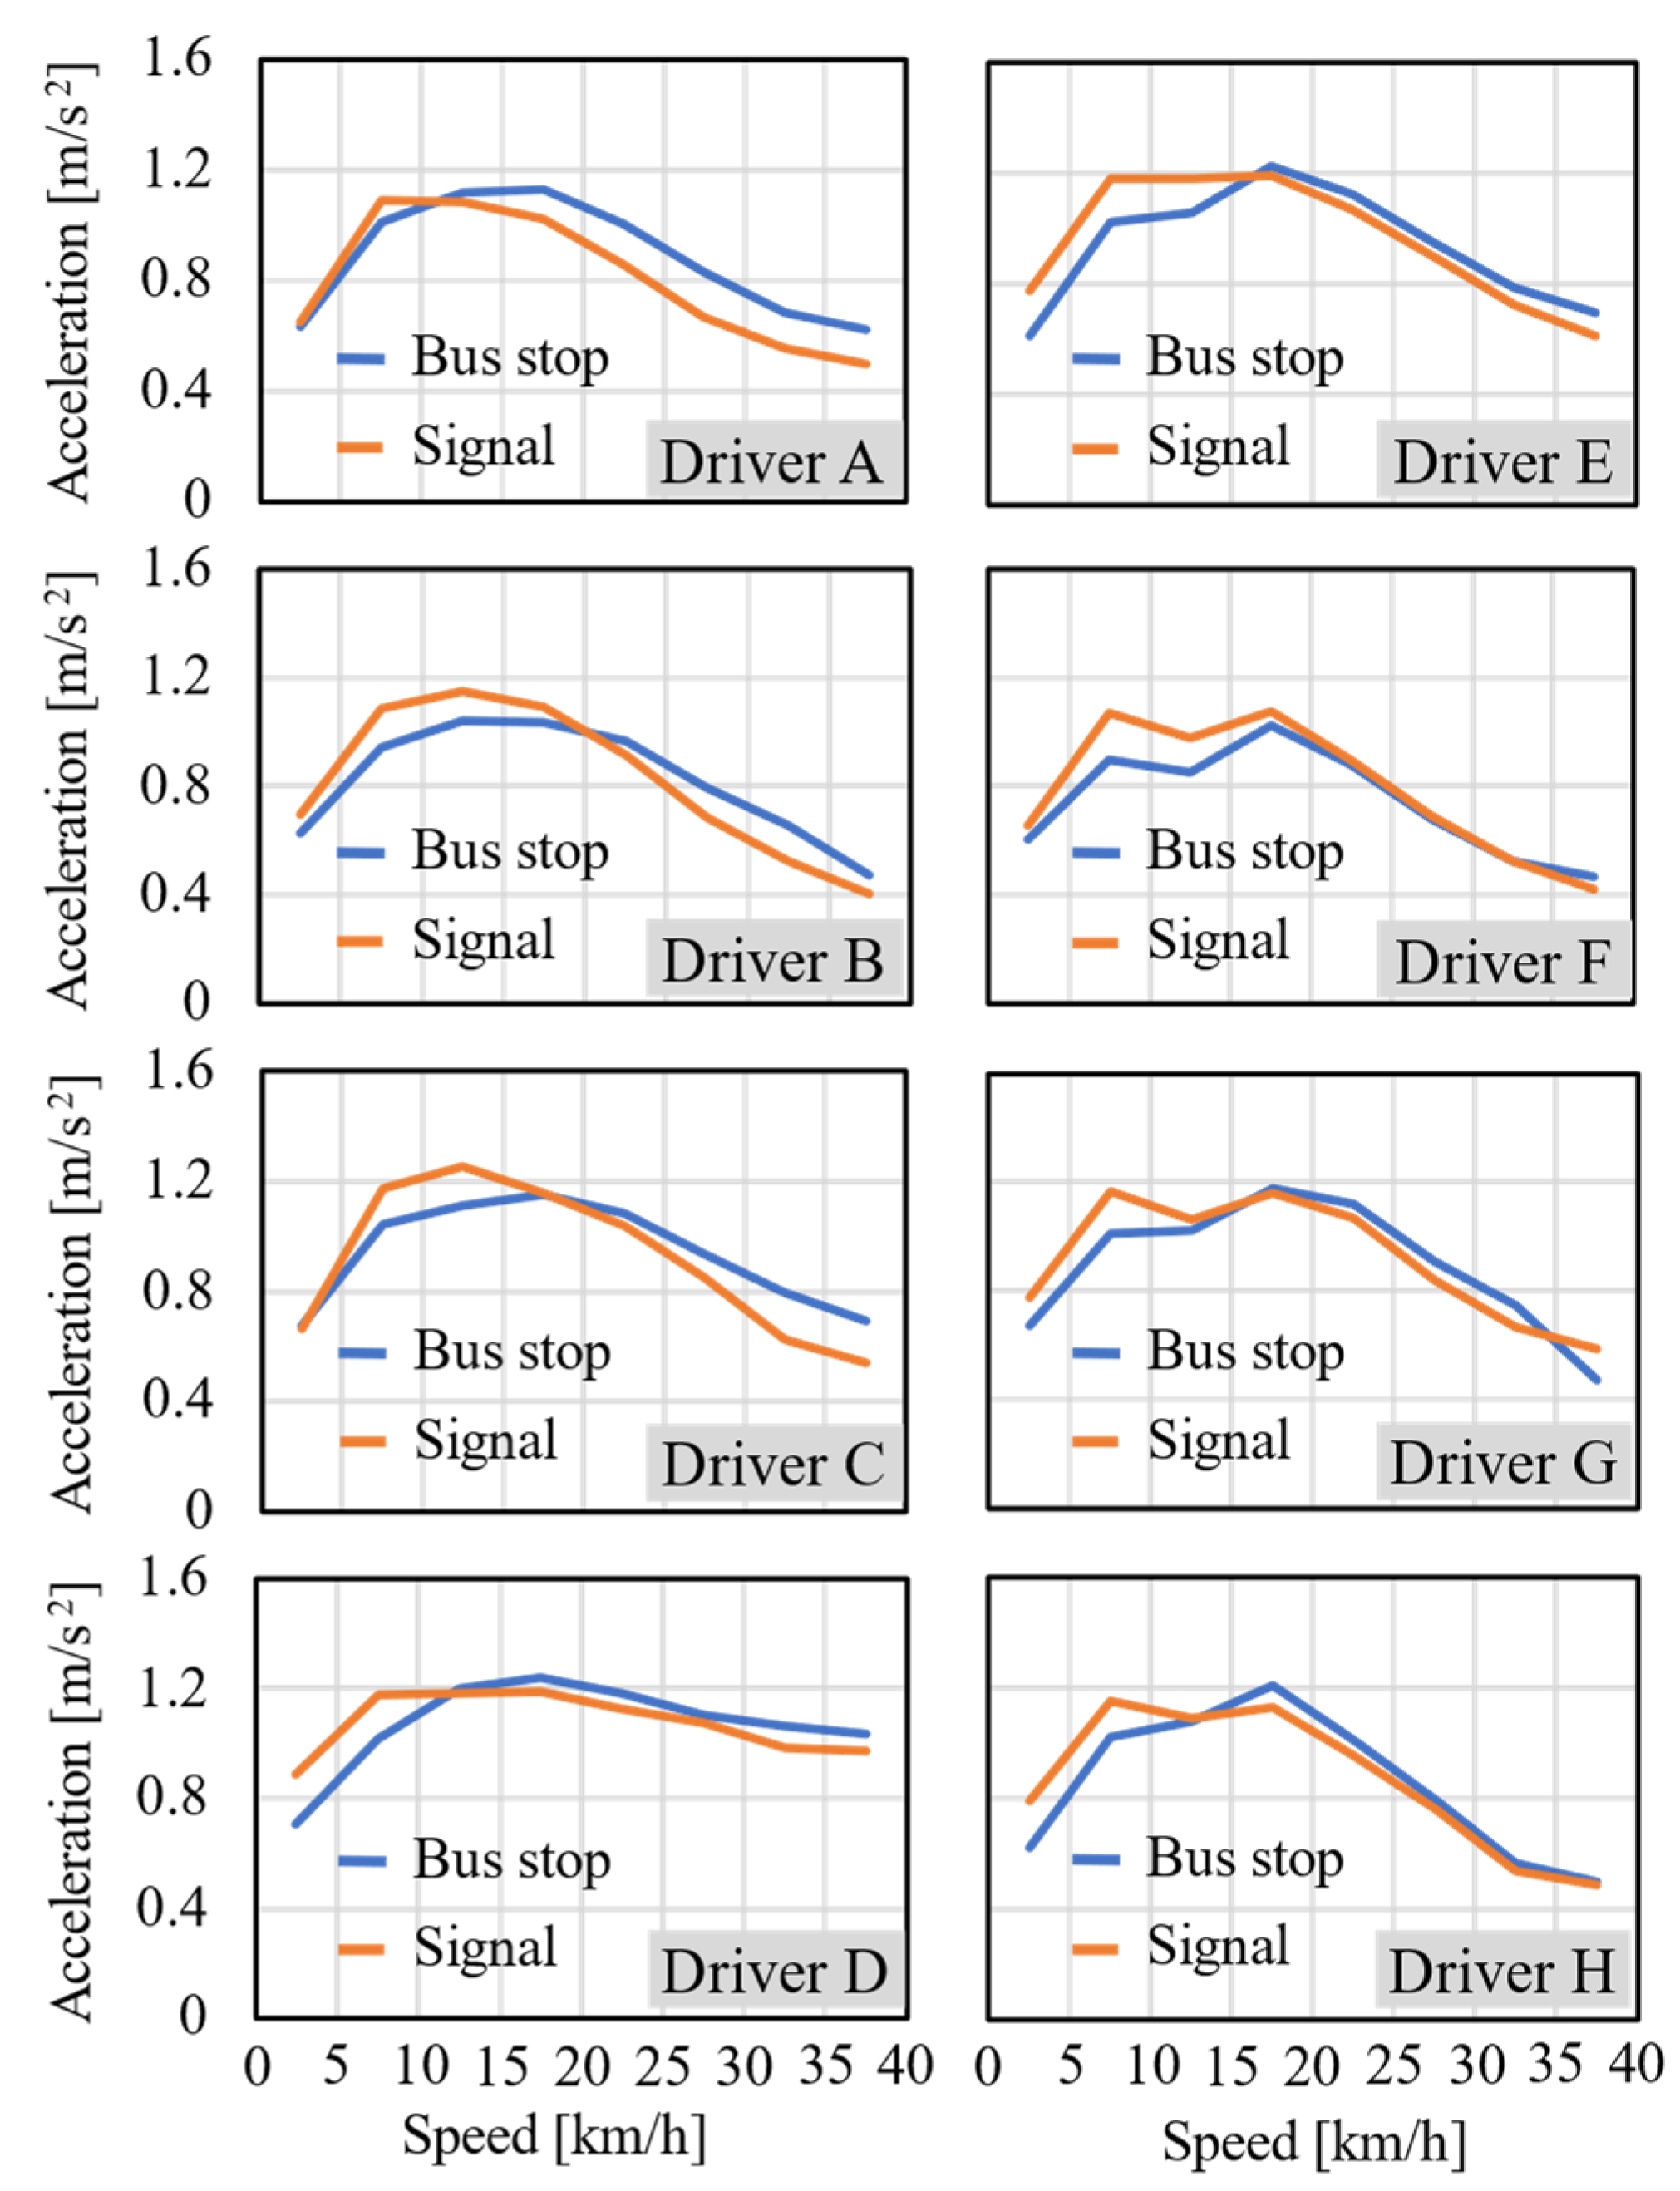
Figure 6.
Comparison of deceleration speed patterns stopping to bus stops (left) / to signals (right).
Figure 6.
Comparison of deceleration speed patterns stopping to bus stops (left) / to signals (right).
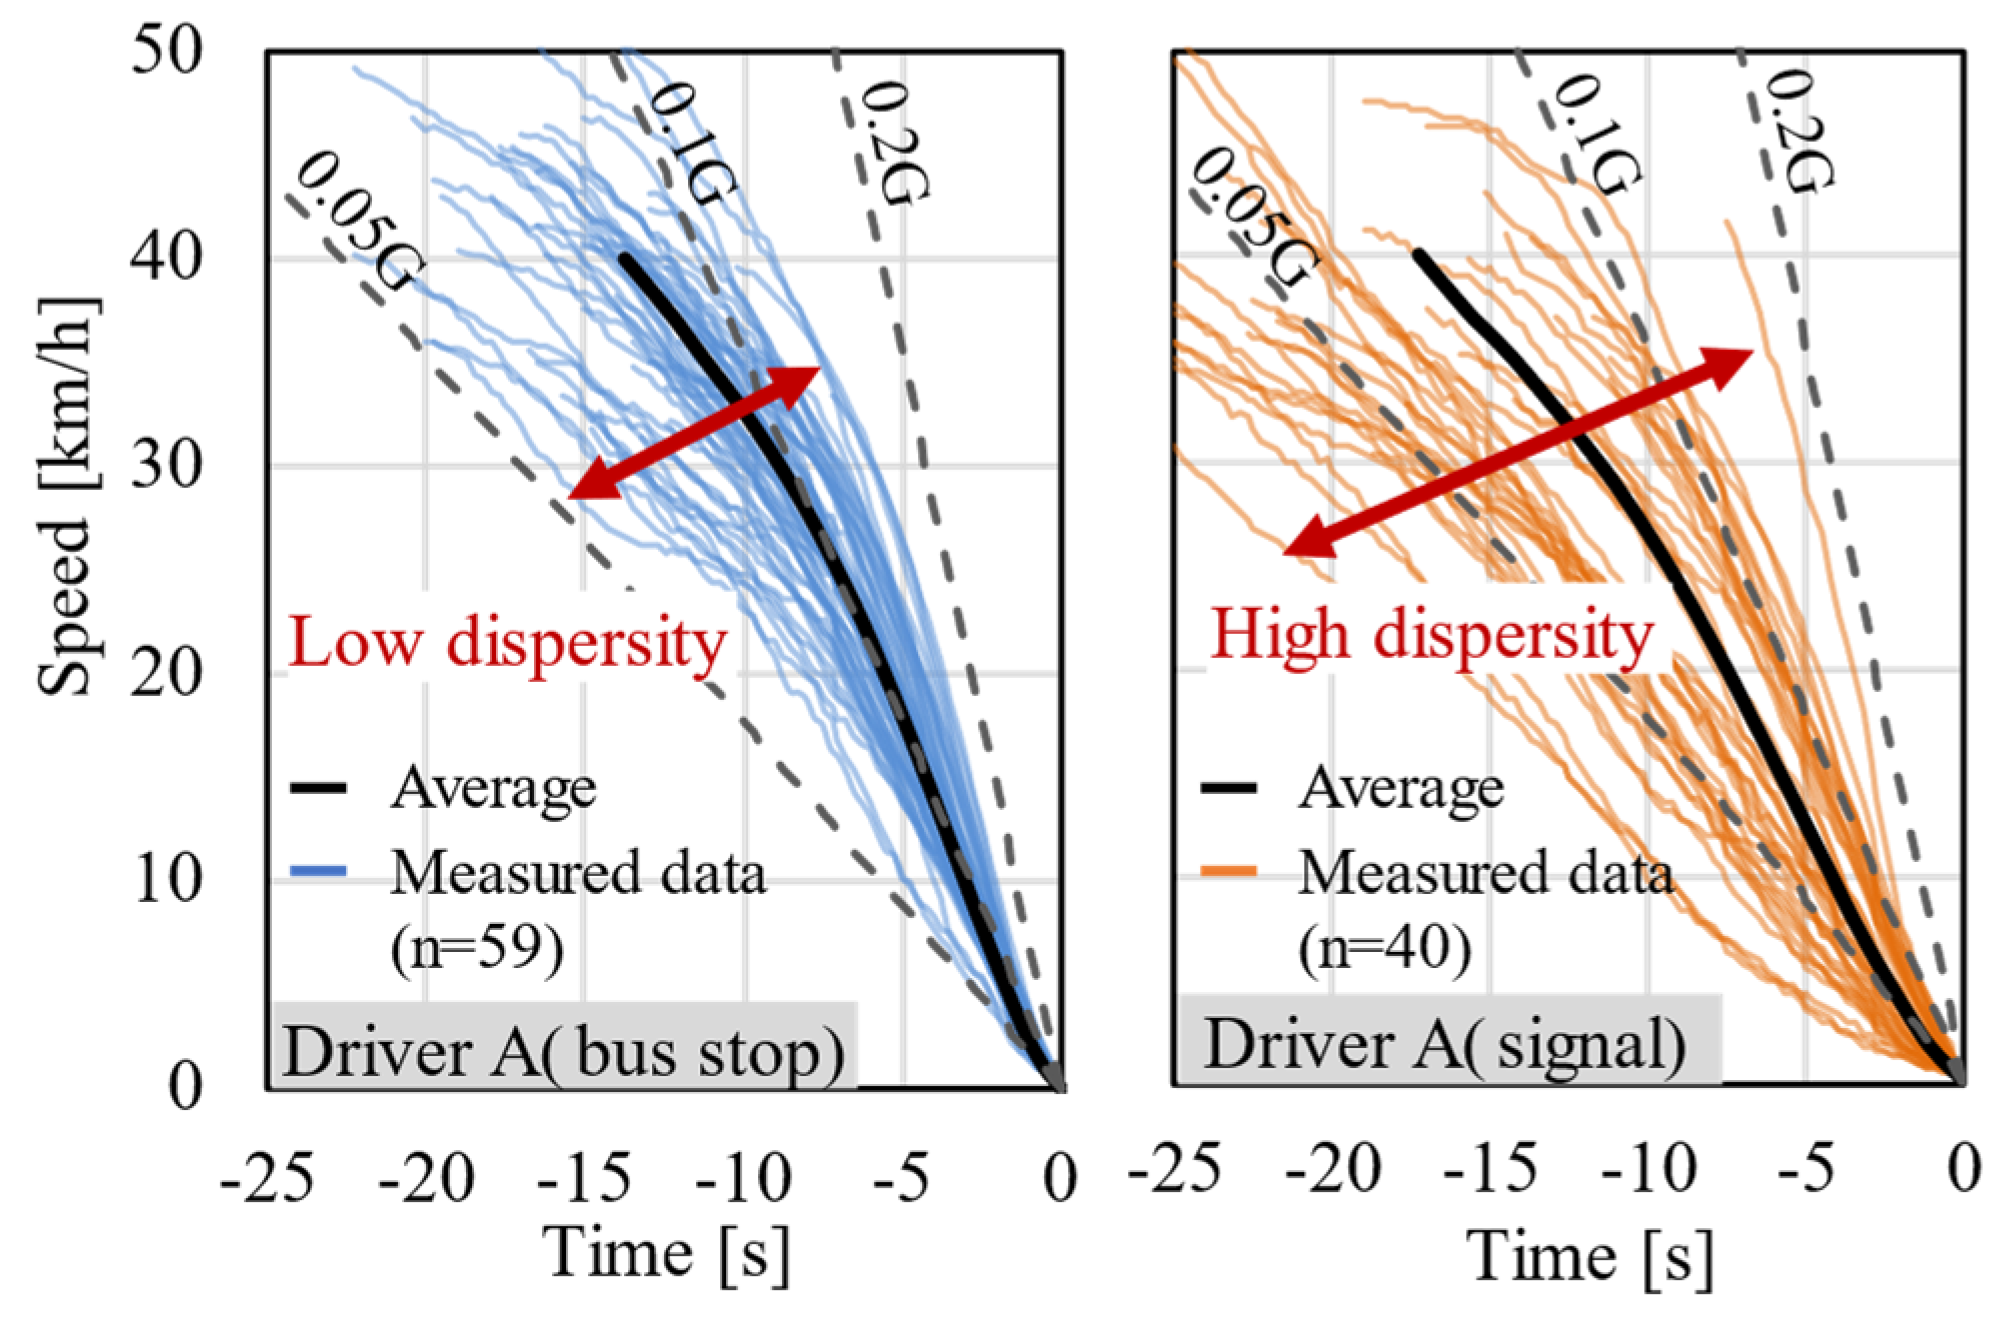
Figure 7.
Comparison of stopping deceleration (each driver).
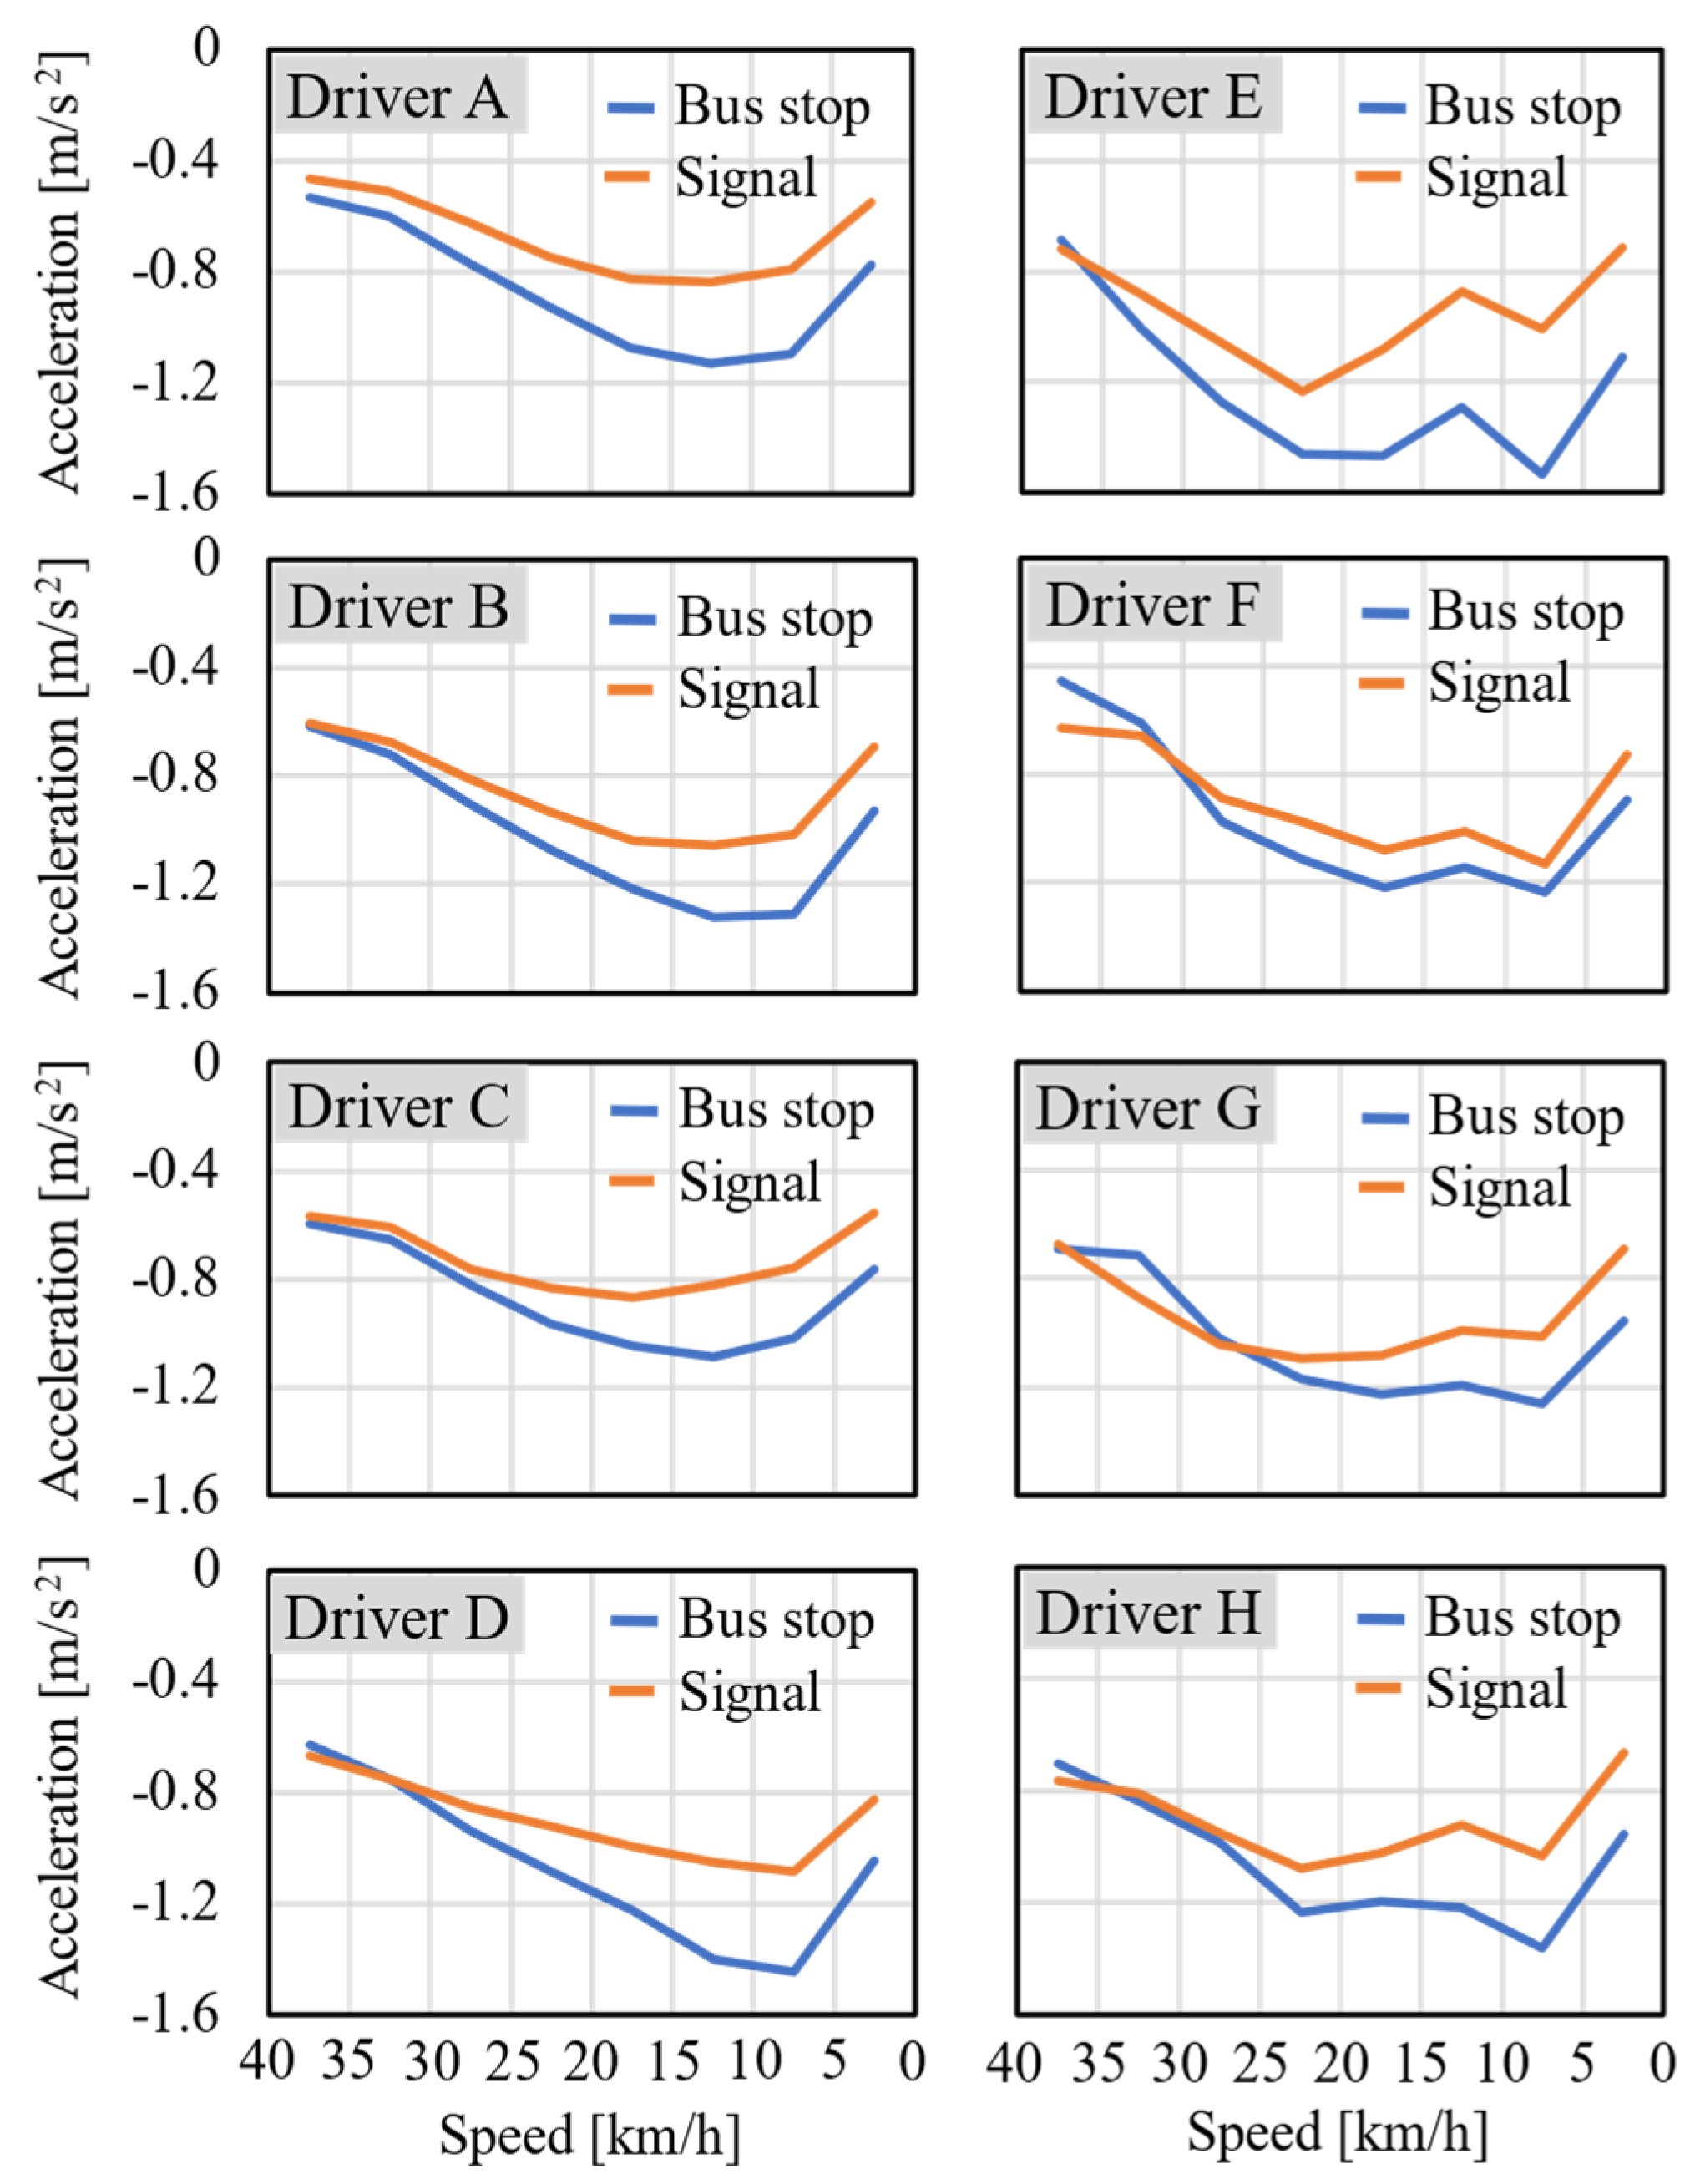
Figure 8.
Comparison of the probability distribution at deceleration section stopping to bus stops/ signals (each driver).
Figure 8.
Comparison of the probability distribution at deceleration section stopping to bus stops/ signals (each driver).
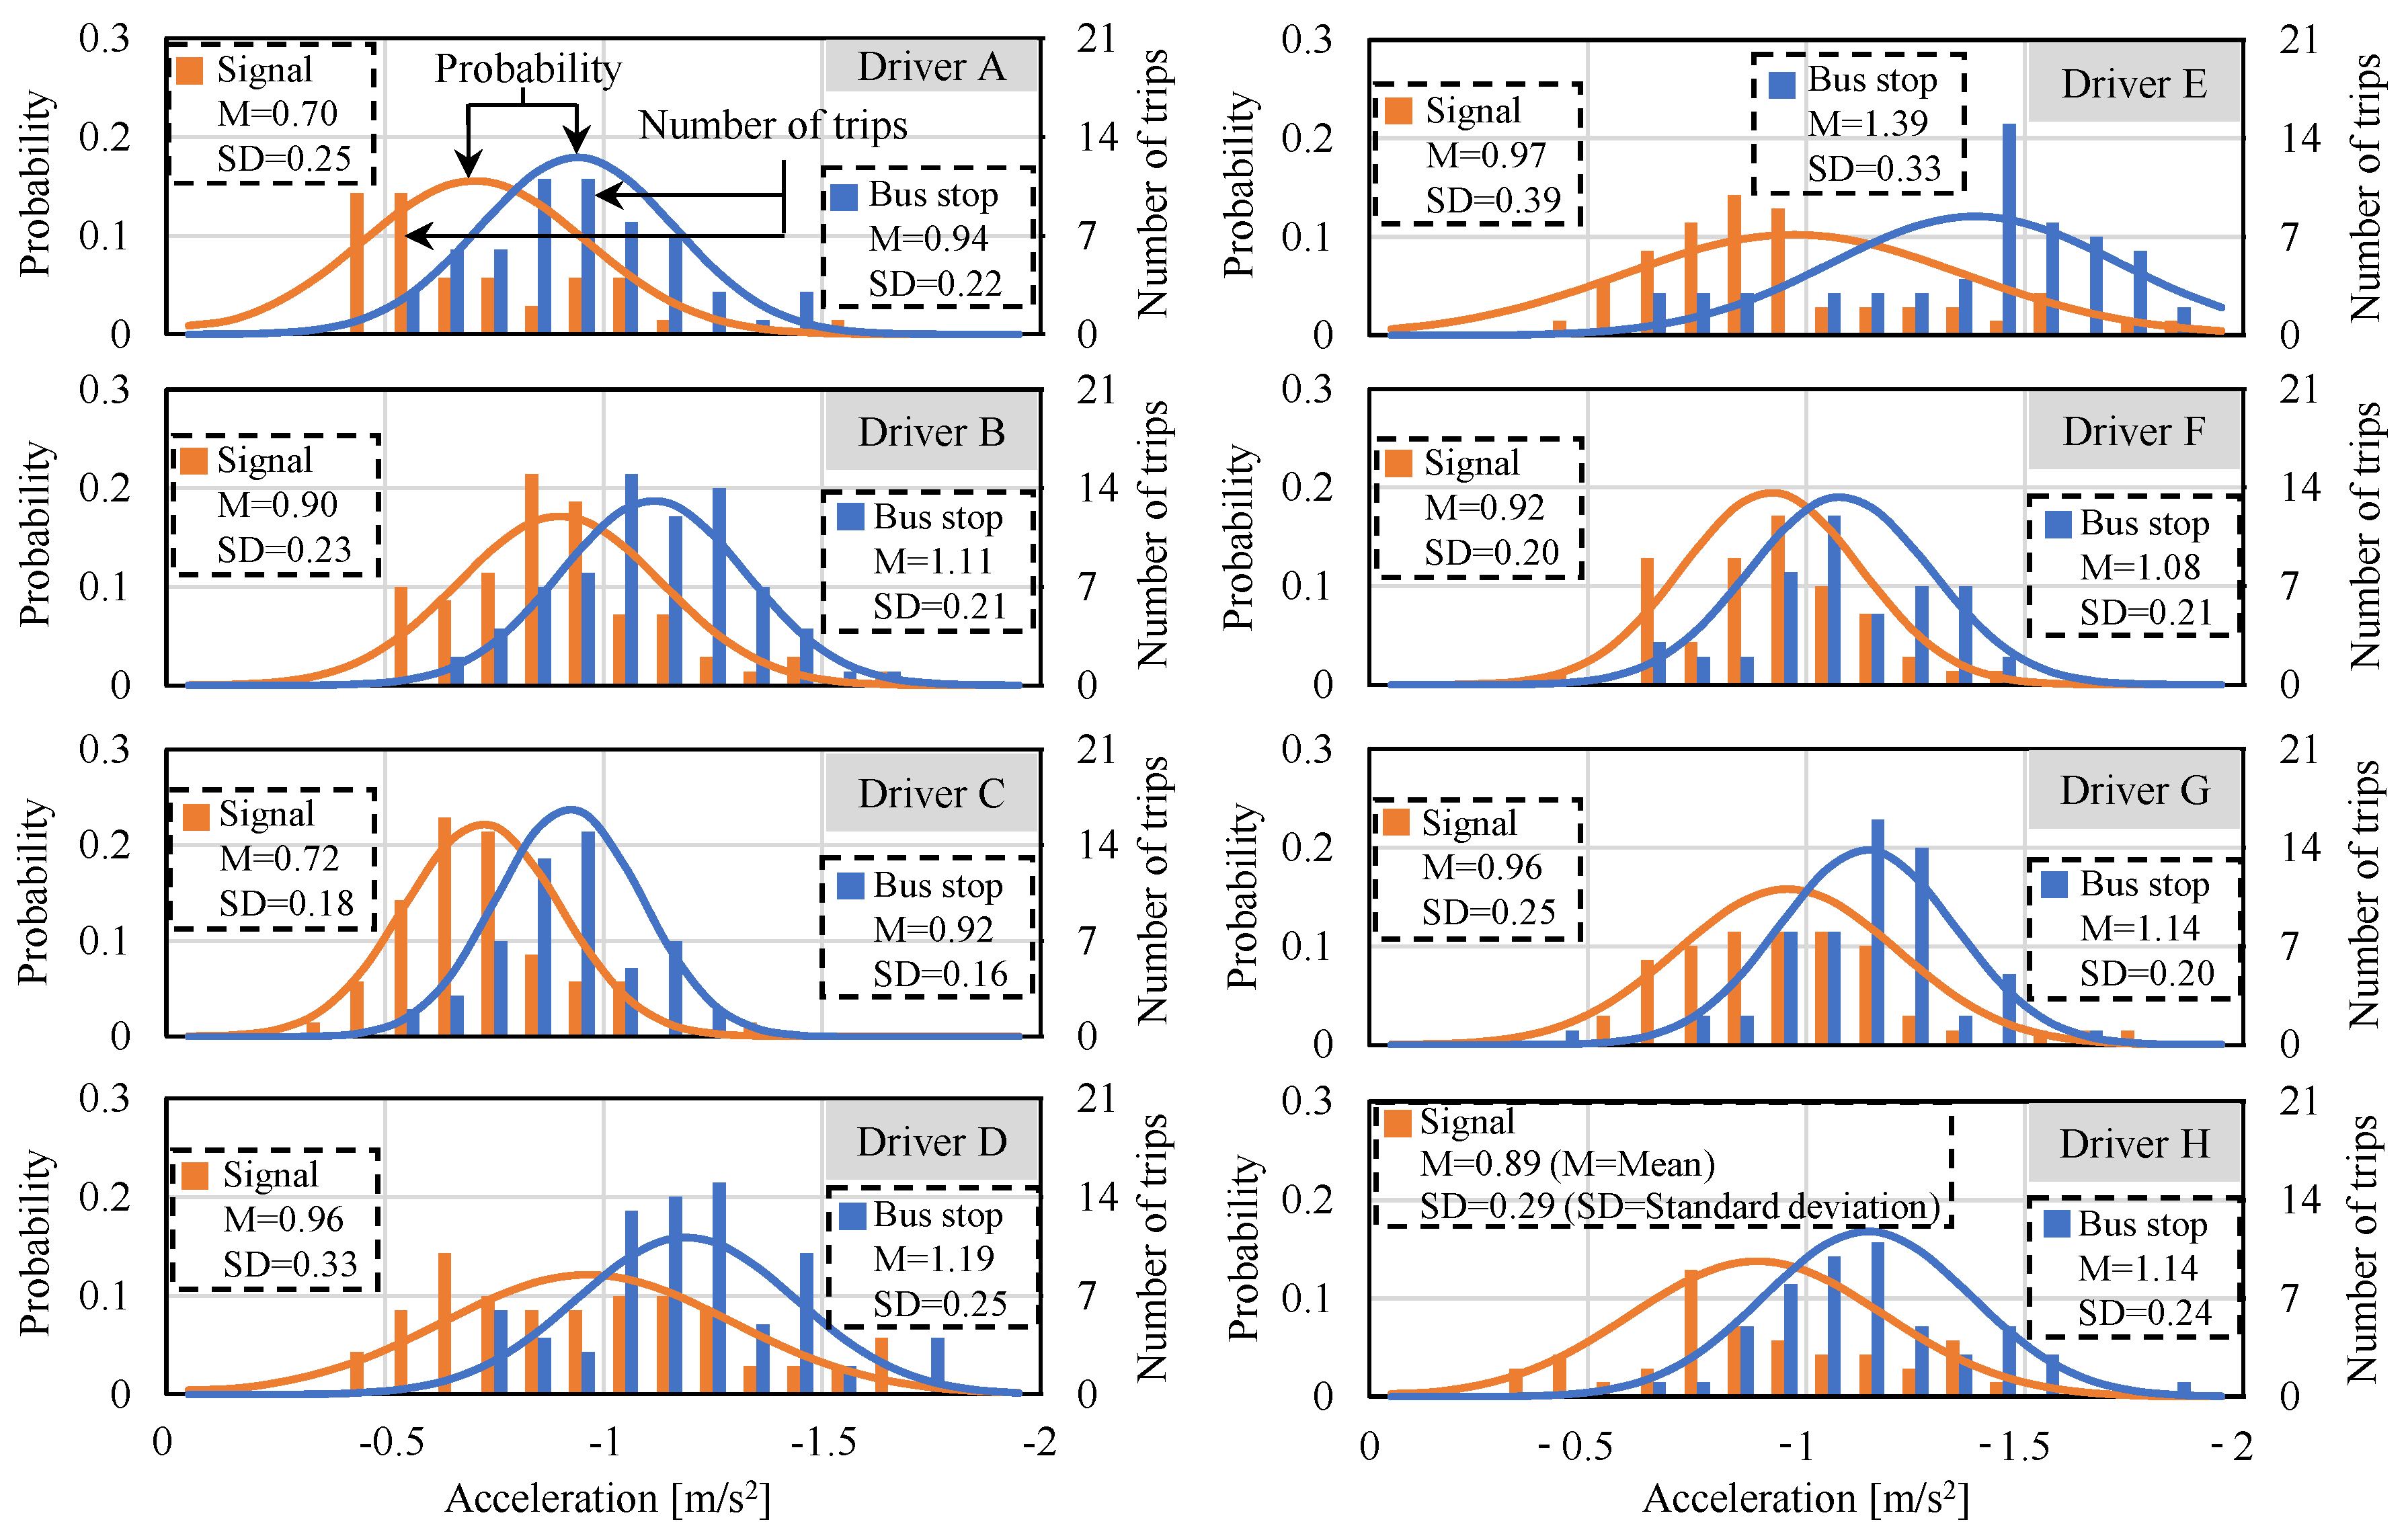
Figure 9.
Acceleration speed change pattern comparison of FC bus and Diesel bus (Acceleration from bus stops).
Figure 9.
Acceleration speed change pattern comparison of FC bus and Diesel bus (Acceleration from bus stops).
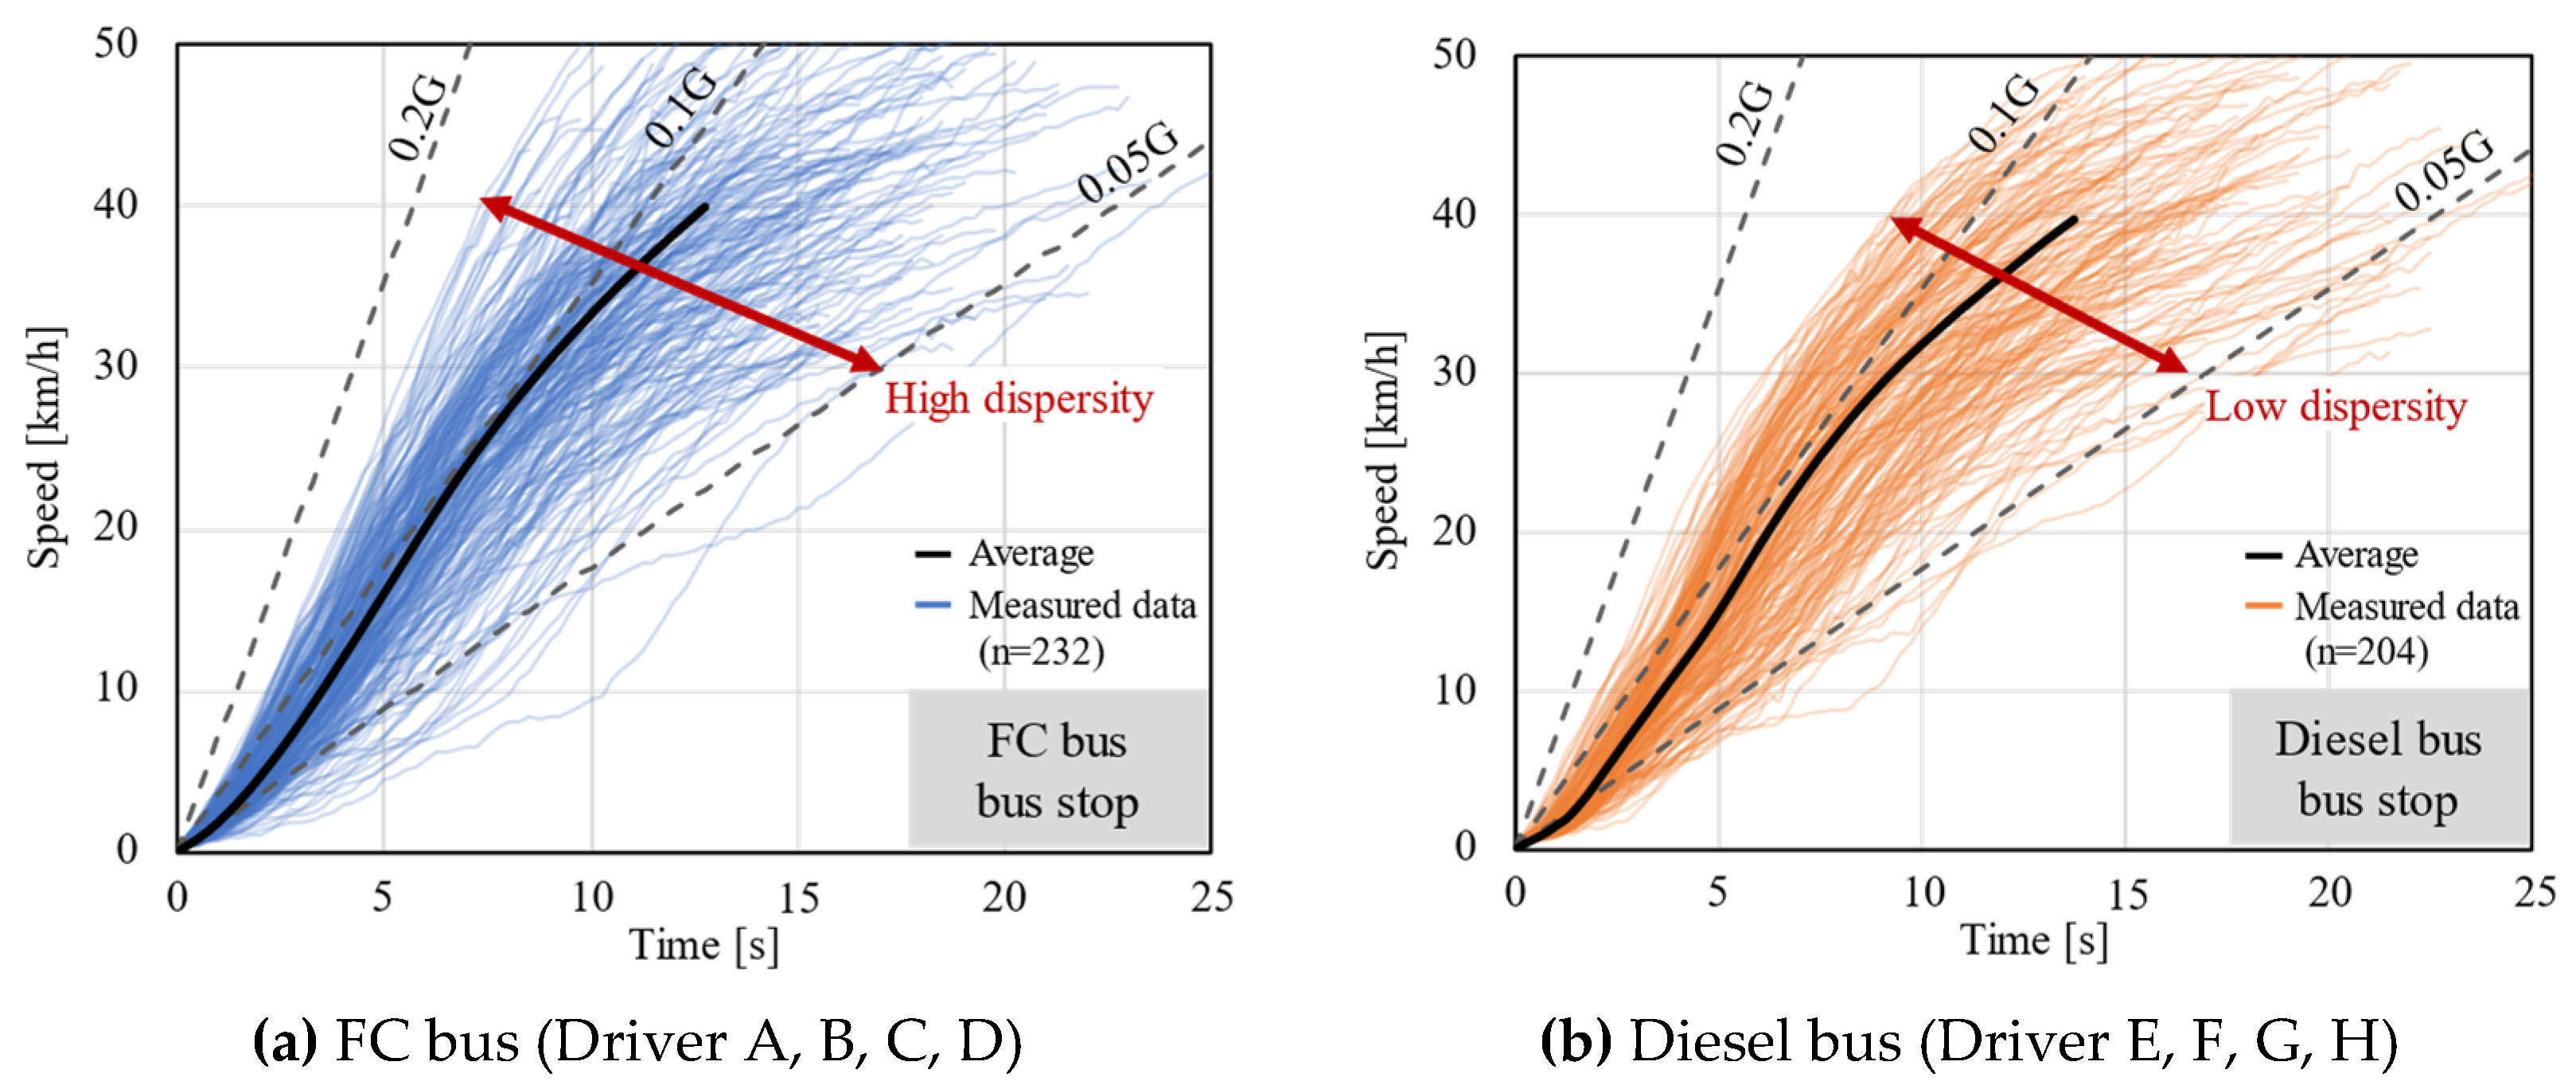
Figure 10.
Acceleration intensity comparison of FC bus and Diesel bus.
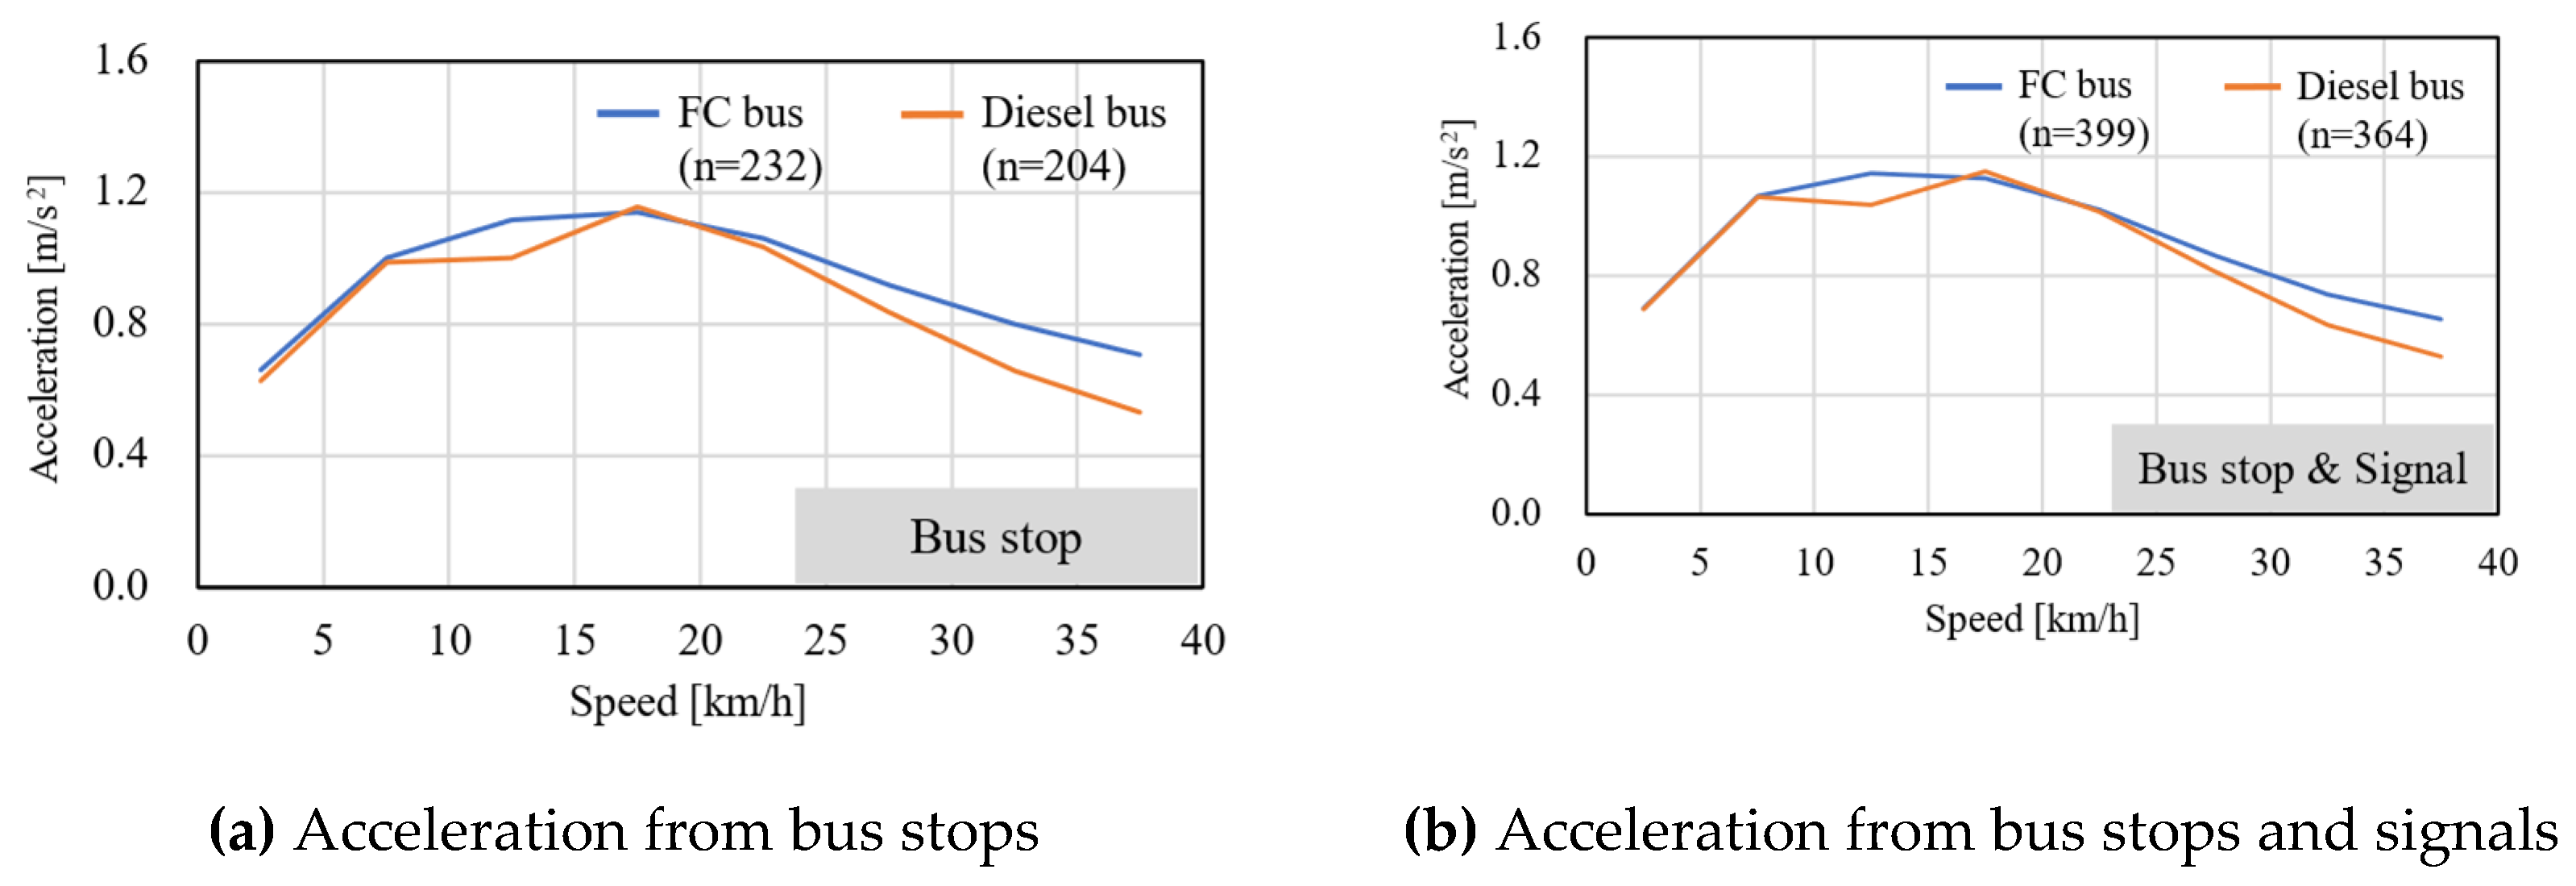
Figure 11.
Acceleration and Jerk comparison of FC bus and Diesel bus.
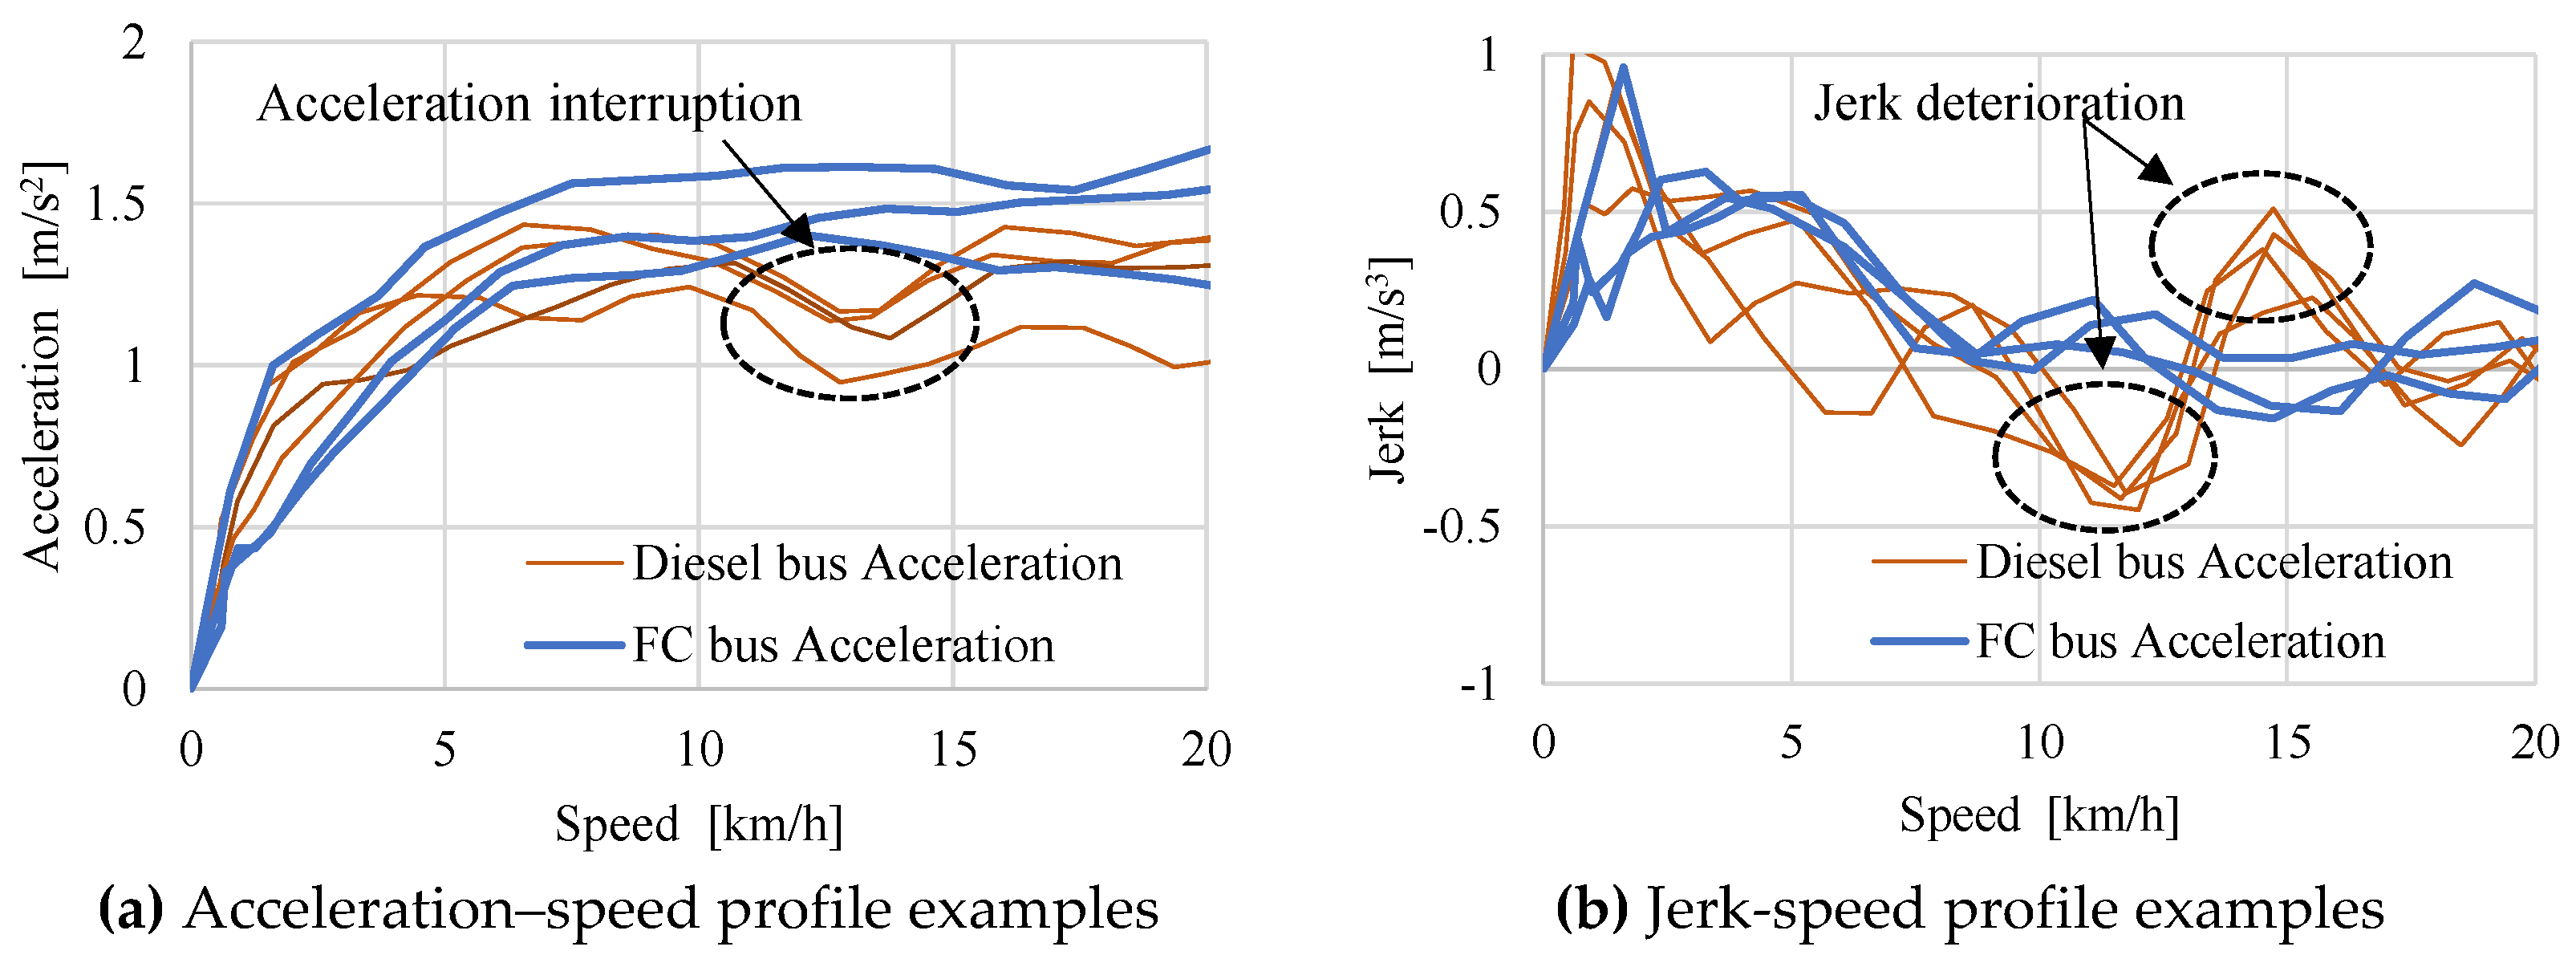
Figure 12.
Acceleration intensity comparison of FC bus and Diesel bus (Maximum value/ Minimum value).
Figure 12.
Acceleration intensity comparison of FC bus and Diesel bus (Maximum value/ Minimum value).
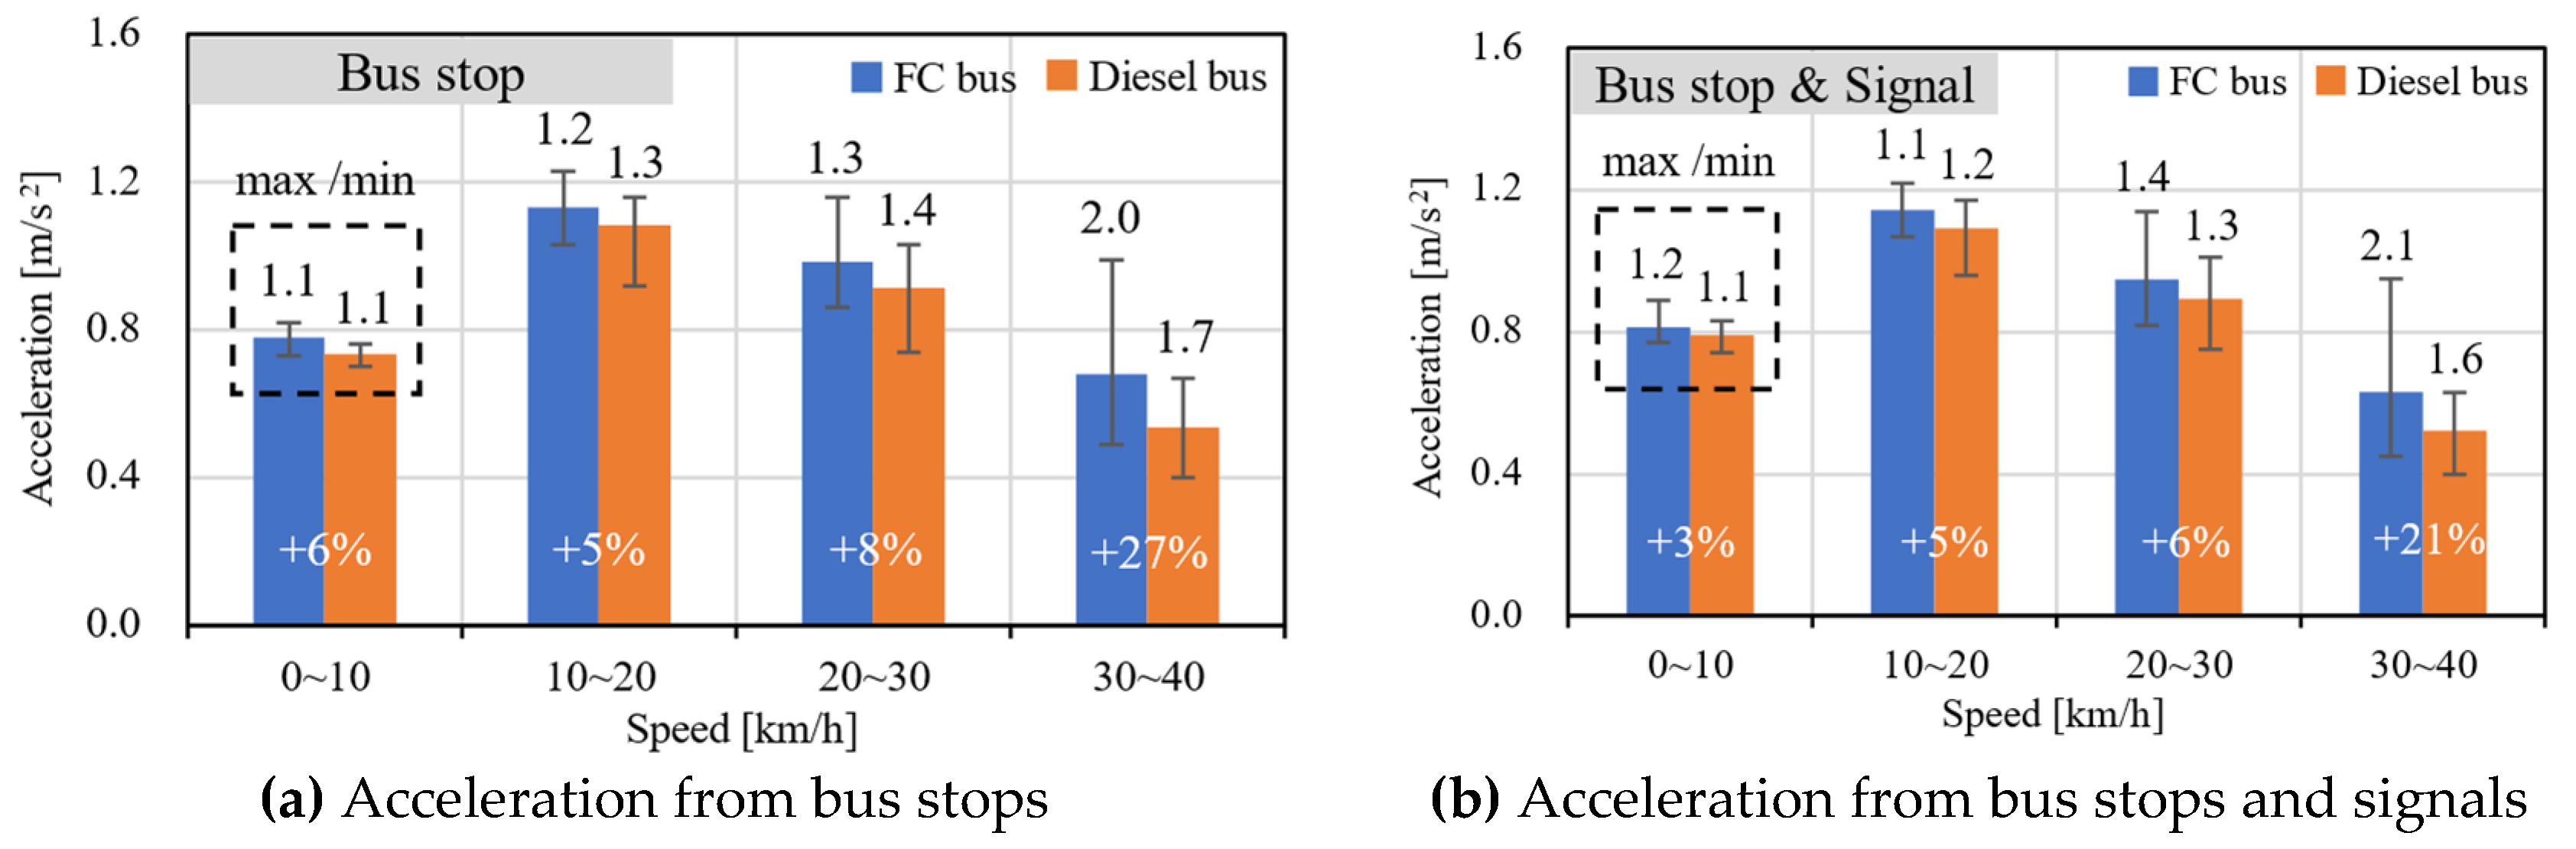
Figure 13.
Acceleration probability distribution comparison of FC and Diesel bus (limited to the acceleration from bus stops).
Figure 13.
Acceleration probability distribution comparison of FC and Diesel bus (limited to the acceleration from bus stops).
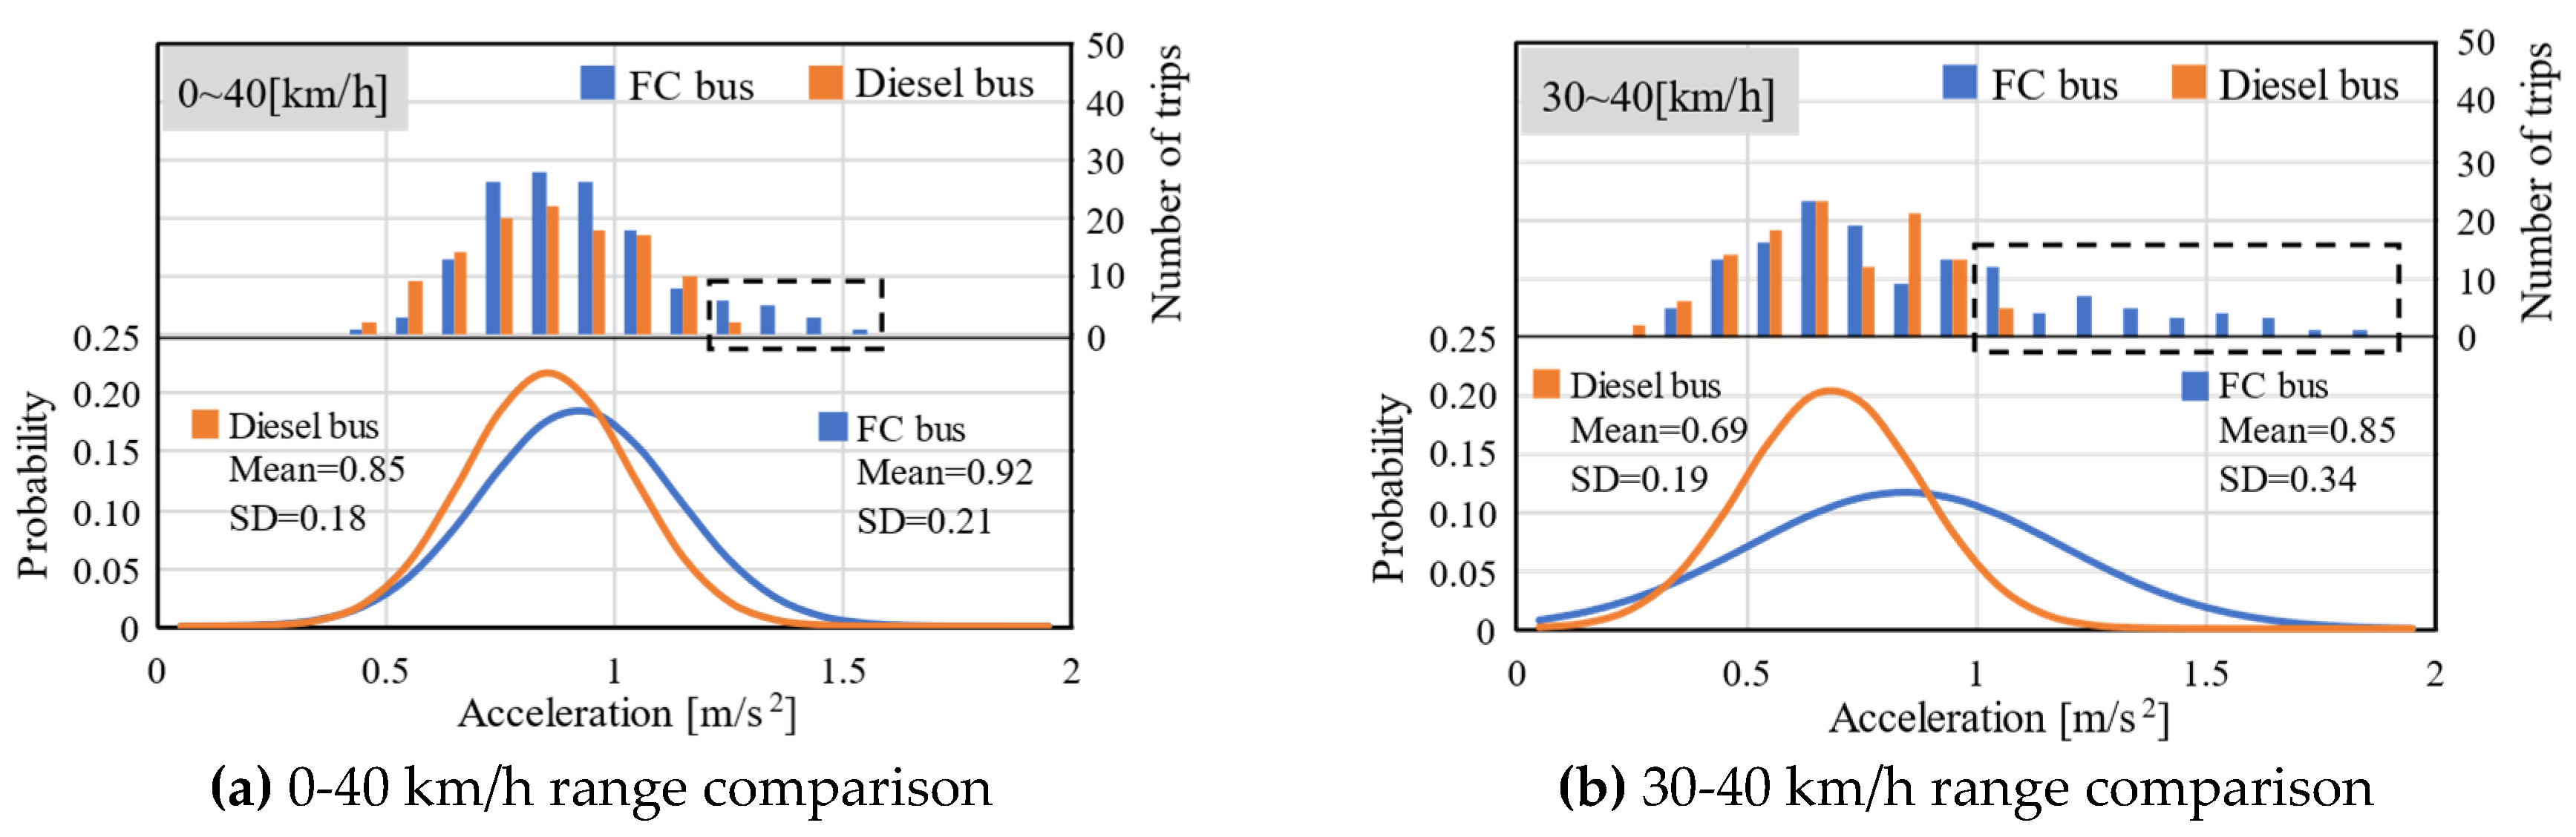
Figure 14.
Deceleration speed change pattern comparison of FC bus and Diesel bus (Deceleration to bus stops).
Figure 14.
Deceleration speed change pattern comparison of FC bus and Diesel bus (Deceleration to bus stops).
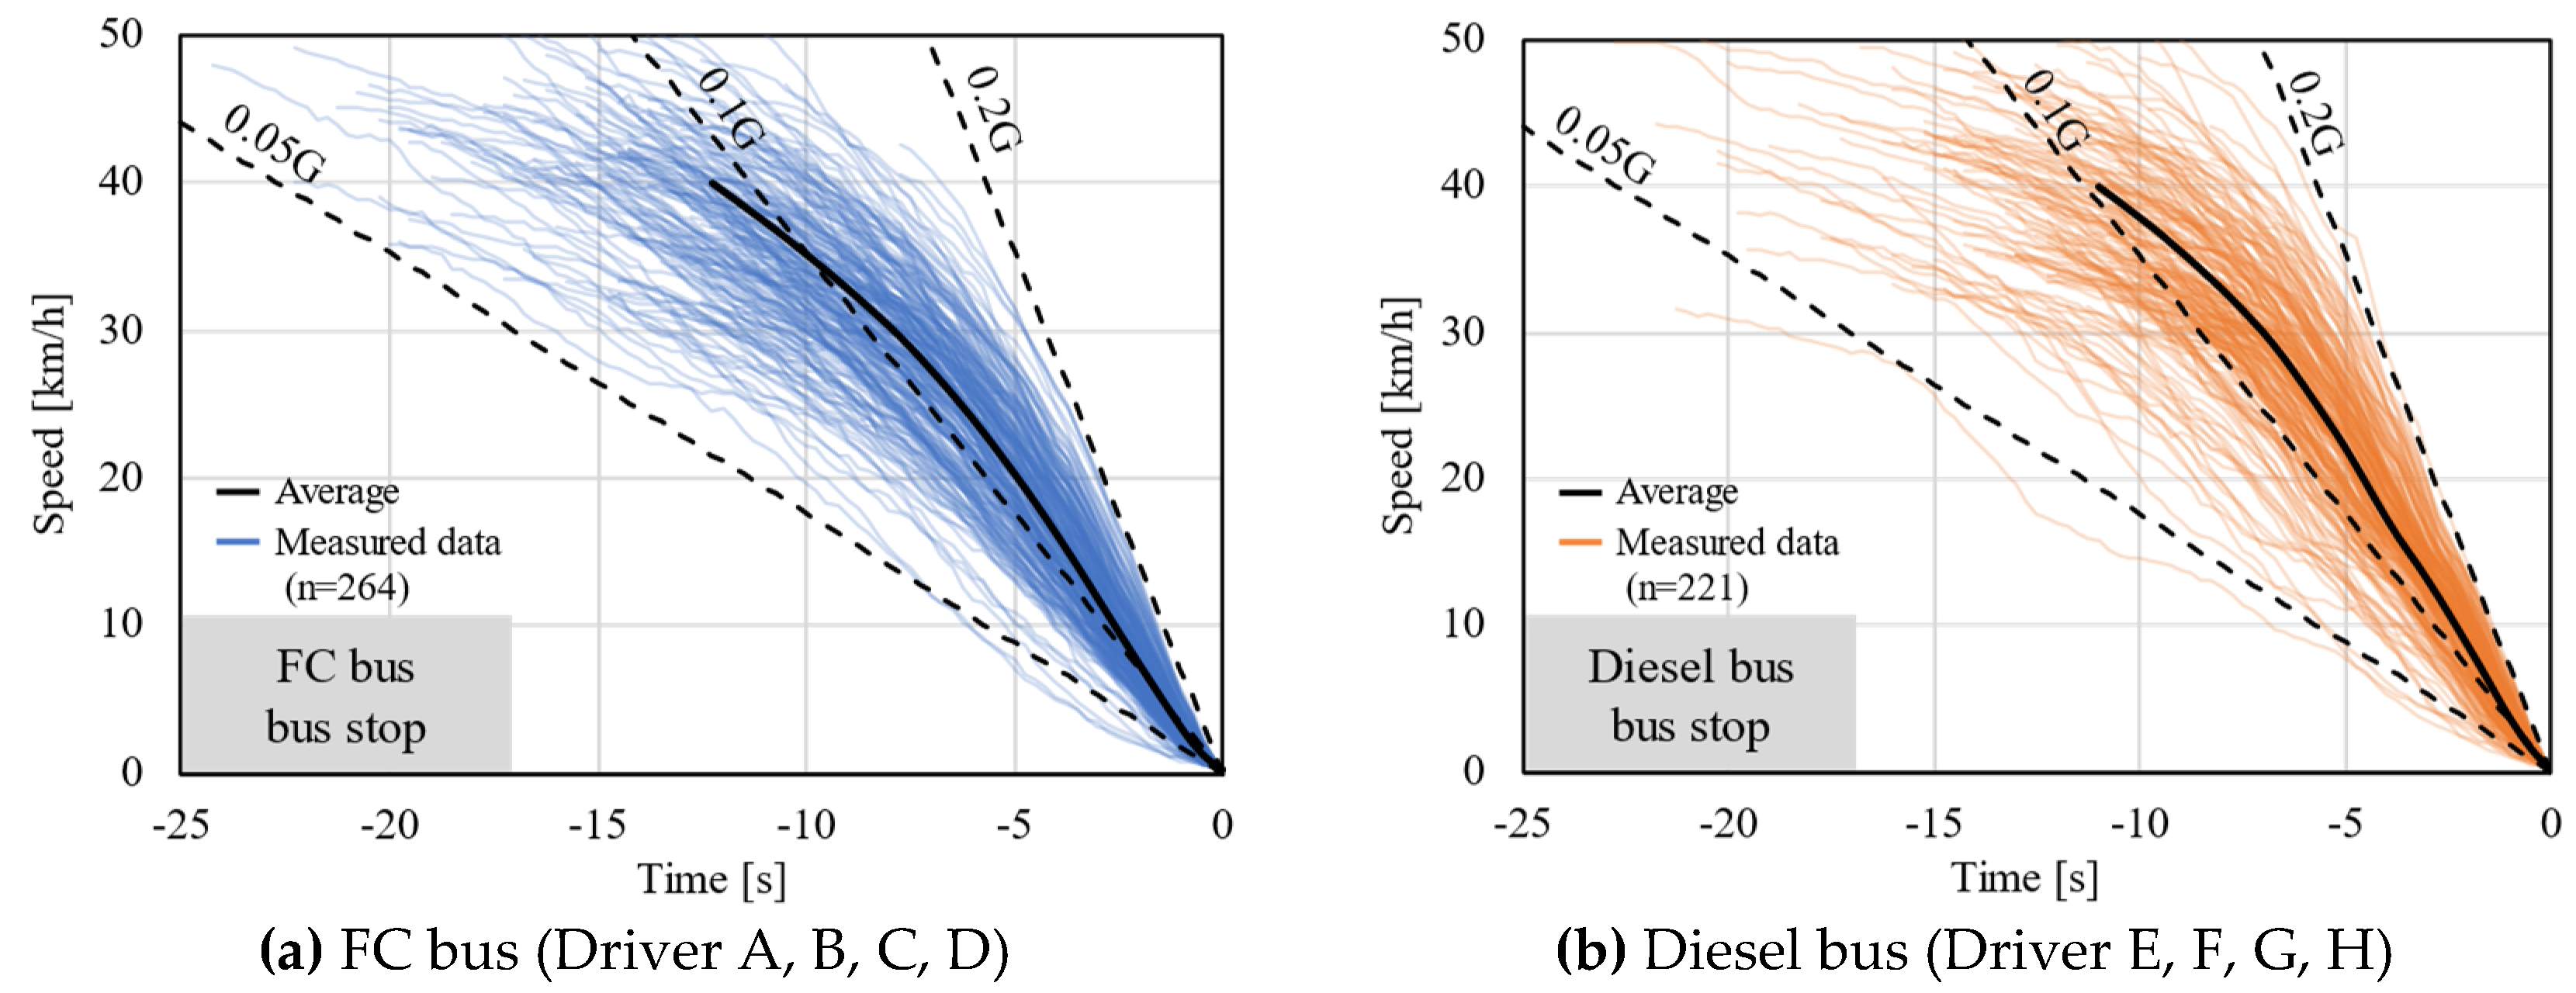

Table 1.
Specifications of tested vehicles.
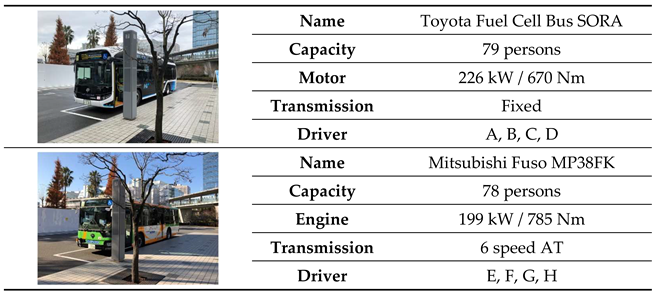 |
Table 2.
Details of measured data separation (Dec. 14th – 2nd).
| Bus stop | Signal | Total | |
|---|---|---|---|
| (a) The number of total trips | — | — | 35 |
| (b) The number of starts & stops (≧100 m) | 31 | 15 | — |
| (c) The number of starts & stops (≧100 m, ≧30 km/h) | 15 (68%) | 7 (32%) | — |
Table 3.
Details of measured data separation (Dec. 14th).
| Bus stop | Signal | Total | |
|---|---|---|---|
| (a) The number of total trips | — | — | 395 |
| (b) The number of starts & stops (≧100 m) | 295 | 165 | — |
| (c) The number of starts & stops (≧100 m, ≧30 km/h) | 118 (61%) | 75 (39%) | — |
Disclaimer/Publisher’s Note: The statements, opinions and data contained in all publications are solely those of the individual author(s) and contributor(s) and not of MDPI and/or the editor(s). MDPI and/or the editor(s) disclaim responsibility for any injury to people or property resulting from any ideas, methods, instructions or products referred to in the content. |
© 2025 by the authors. Licensee MDPI, Basel, Switzerland. This article is an open access article distributed under the terms and conditions of the Creative Commons Attribution (CC BY) license (http://creativecommons.org/licenses/by/4.0/).
Copyright: This open access article is published under a Creative Commons CC BY 4.0 license, which permit the free download, distribution, and reuse, provided that the author and preprint are cited in any reuse.


