
Submitted:
12 February 2025
Posted:
13 February 2025
You are already at the latest version
Abstract
BACKGOUND: In powerlifting, velocity indicators and skin temperature have been utilized to control training loads for both conventional athletes and athletes with disabilities.OBJECTIVE: To evaluate maximum velocity (Vmax), mean propulsive velocity (MPV), power output, and skin temperature (ST) following a 5x5 training session at 80% 1RM in conventional powerlifters (CP) and powerlifters with disabilities (PD).METHODS: 24 male athletes (12 CP and 12 PD) underwent a 5x5 training session at 80% 1RM. Post-session, velocity indicators, power output, and ST were assessed at 45% 1RM.RESULTS: Only the CP group exhibited significant differences in Vmax (P < 0.015), MPV (P < 0.007), and power output (P < 0.022) between time points. Regarding ST, only the PD group showed differences (P < 0.004) in the sternal portion of the pectoralis major. For the long head of the triceps brachii, differences were observed between groups in the post-session measurement (P > 0.024) and for the PD group only in the post-session measurement (P < 0.002).CONCLUSION: This study demonstrated that following a traditional training session (80% 1RM), assessments at 45% 1RM revealed different kinetics in velocity, power output, and ST measures between CP and PD groups. These findings suggest that within the same sport discipline, training variables may have distinct impacts across different categories of athletes.
Keywords:
training control
; diabled persons
; paralympic powerlifiting
1. Introduction
Conventional powerlifting (CP) and Paralympic powerlifting (PP) are disciplines in which athletes lift the heaviest possible loads. In PP, only the bench press (BP) event is performed due to lower limb impairments [1,2]. Training session variables are controlled through various assessment methods, including velocity analysis. An encoder attached to the BP bar analyzes the relative percentage (%RM) of each repetition and set in real-time, regulating exercise intensity [3,4].
Mean propulsive velocity (MPV), the concentric phase moment when movement acceleration exceeds gravity, is considered a reliable measure for controlling velocity and neuromuscular fatigue, thus managing force, velocity, and power loss [5,6]. Comparisons between PP and CP athletes revealed MPV differences in 45% 1RM assessments, with PP athletes achieving lower velocities, and in 80% 1RM assessments, where CP athletes attained higher velocities [7]. Interestingly, velocity-based training control has demonstrated superior results compared to percentage-based 1RM methods, proving less injurious, invasive, and time-consuming [8,9].
To evaluate whether fixed MPVs could contribute to power increases, research has shown that MPVs can accurately detect optimal power loads for each analyzed exercise [5]. Another study aiming to define the optimal combination of relative velocity and load during BP for maximum mechanical power output found that 75% of maximum velocity (Vmax) was the optimal load for achieving peak power [9,10]. High-load training (≥ 80% 1RM) in PP and CP requires proper control to avoid negative impacts on performance, leading to fatigue, hormonal imbalances, movement velocity changes, and skin temperature (ST) alterations [10,11].
ST has been identified as a method for injury control and prevention, with thermal differences > 0.7°C between sides of the same muscle potentially indicating abnormalities [11,12]. Thermal responses in different body regions vary according to recovery periods, training, number of joints involved, and muscle mass engaged. Thermal differences exceeding 2°C are considered risky, with recommendations to interrupt training [13,14].
However, a recent study with PP athletes demonstrated that it is possible to maintain elevated body temperature within acceptable levels after a high-intensity training session (<80% 1RM) [14]. Associated with this, some studies have observed that PP athletes would be stronger than CP athletes[15], that PP athletes would present responses to training in a differentiated way in relation to CP [7,16], and contrary to this, other studies have presented very similar responses between CP and PP [17,18,19,20], has having similarities in training and differences in relation to the effects of training and in the execution of the bench press in conventional and Paralympic modalities.
In this sense, many comparisons have emerged between Paralympic and conventional athletes. In this sense, training for both modalities, Paralympic and conventional, training has been similar, however, differences have been a constant, regarding the responses to training, as presented above. In this sense, this study aimed to evaluate and compare measures of velocity (VPM and Vmax), power output and local temperature of the long head of the triceps brachii (LHTB) and sternal portion of the pectoralis major (SPM) between CP and PP athletes at an intensity of 45% of 1RM after a conventional training session in BP.
2. Materials and Methods
2.1. Study Design
The research was conducted over a two-week period. During the first week, participants familiarized themselves with the equipment and protocols, and performed a one-repetition maximum (1RM) test in the bench press (BP). In the second week, participants executed four repetitions at 45% of 1RM, followed by five sets of five repetitions (5x5) at 80% of 1RM, and a second set at 45% of 1RM. Throughout the study, a minimum interval of 72 hours was maintained between assessments, whether for familiarization or testing purposes. Muscular activity was evaluated using surface electromyography (sEMG). Surface electrodes were applied during the first and last sets of the 5x5 protocol to record the electromyographic activity of the pectoralis major (PM) and the long head of the triceps brachii (TB) muscles (Figure 1). The training used was the 5, 3, 1 system, and the training was used in the week in which 5 repetitions were used [21,22], with minimum rest between training series was 3 minutes.
Tests were conducted on Mondays between 8:00 AM and 12:00 PM. Participants were instructed to maintain their regular dietary habits, abstain from consuming alcoholic beverages, and avoid physical activities in the 48 hours preceding the tests. These guidelines were confirmed through interviews with the participants prior to testing. Environmental thermal control was monitored, with ambient temperature maintained between 24°C and 26°C.
2.2. Sample
The study population consisted of 24 male subjects (12 CP and 12 PP), aged between 18 and 35 years. The CP group had an average of one year of training experience, while the PP group had an average of two years (Table 1). The PP athletes were associated with an extension project from the Department of Physical Education at the Federal University of Sergipe, Brazil. All athletes competed at the national level, were qualified for competition in their modality [2], and ranked among the top ten in their respective categories. Regarding disabilities: six athletes had lower limb malformations (arthrogryposis); one had polio sequelae; four were amputees; and one had a spinal cord injury due to an accident, with injury below the eighth thoracic vertebra. The sample size was determined using the open-source software G*Power® (version 3.0; Berlin, Germany), adopting an "F family statistic (ANOVA)" with a standard α < 0.05, β = 0.80, and an observed effect size of 1.33 for the Rate of Force Development (RFD) in weightlifting athletes [23]. This allowed for an estimated sample power of 0.80, with a minimum of eight individuals per group, suggesting that the sample is adequate. The project was submitted to and approved by the Research Ethics Committee of the Federal University of Sergipe, in accordance with the ethical principles expressed in the Declaration of Helsinki (1964, revised in 1975, 1983, 1989, 1996, 2000, 2008, and 2013) of the World Medical Association.
The inclusion criteria used were having at least 18 months of experience in the sport and effectively participating in competitions in the sport. Also for Paralympic athletes, they had to be classified and eligible for the Paralympic sport. [2]. The exclusion criterion used was the athletes using any type of illicit resource during the tests or not participating in any stage of the study. It is important to mention that both CP and PP athletes presented values that place them at a similar level to high-performance athletes, where the weight lifted divided by body weight presented values greater than 1.4.
2.3. Procedures
Body weight measurements for athletes were conducted using a Michetti electronic platform scale (Michetti, Brazil), designed to accommodate seated athletes. This scale has a maximum capacity of 300 kg and dimensions of 1.50 x 1.50 m. For non-athlete males, a high-precision Dellamed scale was employed. The bench press exercise was performed on an official flat bench measuring 210 cm, with a 220 cm bar and weight plates, all manufactured by Eleiko (Sweden) and approved by the International Paralympic Committee. This equipment selection ensures standardization and compliance with international competition standards, particularly important for the Paralympic athletes involved in the study [2]
For the measurements of Mean Propulsive Velocity (MPV), Maximum Velocity (Vmax), and Power (POT), linear encoders from the Speed4Lift force measurement system (Vitruve, Madrid, Spain) were used. These encoders were attached to the bench press bar to measure vertical displacement velocity. The analysis of these parameters was conducted before and after the training session using a load of 45% of 1RM, where the velocity would be close to 1.0 m/s. This methodology aligns with current practices in velocity-based training research, providing reliable data on biomechanical responses to training, which is crucial for optimizing training protocols and understanding specific adaptations in powerlifting athletes [25]. Velocity data recorded for the concentric phase was considered to begin at the ascending component of the movement, ending with full elbow extension. Velocity assessment at a MPV of 1 m/s has been used to measure training fatigue, this velocity would be associated with a load of 45% and 80%of 1RM [3,17]. The evaluations with 45% of 1RM were evaluated before and after training, both in CP and PP. 80% of 1RM were evaluated in Set 1 and Set 5 in both CP and PP. Both in the 45% evaluation, which was evaluated using 4 repetitions, and in the 80% evaluation, which used 5 repetitions, the values are the averages of the repetition values [6,17]
Infrared thermography was employed to record athletes' skin temperature. Subjects were instructed to remain seated and as calm as possible to avoid affecting readings. Athletes were advised to refrain from any physical activity 24 hours prior to testing and to abstain from caffeine, stimulants, or alcohol consumption. Tests were conducted in a controlled environment with ambient temperature ranging between 22°C and 24°C and relative humidity around 50%, as recorded by a Hikari HTH-240 thermo-hygrometer (Hikari, Shenzhen, China). A FLIR T640sc thermal imaging camera (FLIR, Stockholm, Sweden) was utilized, featuring a temperature range of −40°C to 2000°C, accuracy of 2%, sensitivity of <0.035, infrared spectral band of 7.5-14µm, refresh rate of 30 Hz, and resolution of 640 × 480 pixels. Thermal images were captured of the clavicular region of the pectoralis major and the long head of the triceps brachii. Figure 2 illustrates two linear encoders and the corresponding thermographic images.
In the first session, a 1RM test was conducted. Each subject initiated the attempt with a weight they believed they could lift only once with maximal effort. Weight increments were added until the maximum load that could be lifted once was achieved. If the athlete failed to complete a single repetition, 2.4 to 2.5% of the load used in the test was subtracted. Subjects rested for 3-5 minutes between attempts. This test was performed 72 hours prior to the evaluative process, which occurred in the second session. During the second session, athletes performed a preliminary warm-up for the upper limbs and a specific warm-up on the flat bench press with 30% of 1RM load, executing 10 slow repetitions (3.0 x 1.0 seconds, eccentric x concentric) and 10 fast repetitions (1.0 x 1.0 seconds, eccentric x concentric). Following this phase, athletes performed a set of 4 repetitions at 45% of 1RM intensity, followed by a 5x5 protocol with 80% of 1RM load, allowing 3 to 5 minutes of rest interval. Finally, another set of 4 repetitions at 45% of 1RM was completed. The initial and final sets at 45% 1RM were considered as the pre- and post-intervention measurements, respectively.
2.4. Statiscal
Descriptive statistics were performed considering measures of central tendency, mean ± standard deviation (X±SD), and 95% confidence interval (95% CI). The Shapiro-Wilk test was used to verify the normality of the variables, given the sample size. A two-way repeated measures ANOVA was conducted to evaluate differences between Paralympic Powerlifting and Conventional Powerlifting (PP and CP), and the moments (before and after), with an intensity of 45%, and Bonferroni post hoc tests. In characterizing the sample, the t-test was performed for independent variables. A d value <0.2 was considered a trivial effect, 0.2 to 0.6 a small effect, 0.6 to 1.2 a moderate effect, 1.2 to 2.0 a large effect, 2.0 to 4.0 a very large effect, and ≥4.0 an extremely large effect [33]. Cohen “d” was calculated as the difference between the mean divided by the pooled SD to estimate the effect size for between-lift comparison [26]. Statistical analysis was performed using the Statistical Package for the Social Sciences (SPSS 25.0) (IBM, New York, USA). The adopted significance level was p < 0.05. η2p = partial eta squared (small effect ≤0.05, medium effect 0.05 to 0.25, large effect 0.25 to 0.50, and very large effect > 0.50) [27,28].
3. Results
In Table 2, for the CP group, significant differences were observed in MPV between pre (0.93±0.23, 95% CI 0.78-1.09) and post (0.98±0.24, 95% CI 0.82-1.14, p=0.007, η2p=0.412, large effect) measurements. For Vmax, differences were found between pre (1.24±0.27, 95% CI 1.01-1.43) and post (1.31±0.28, 95% CI 1.12-1.50, p=0.015, η2p=0.038, small effect) measurements. Power output also showed significant differences between pre (439.72±131.32, 95% CI 351.50-527.95) and post (454.09±118.77, 95% CI 374.29-533.88, p=0.022, η2p=0.314, large effect) measurements.
In Figure 2, for thermography in the PP group, there was a difference in the PMS muscle between before (33.28±1.47, 95% CI 32.19-34.17) and after (35.13±1.77, 95% CI 33.98-36.37, p=0.004 η2p=0.443 large effect) measurements. Differences were observed in the TBCL muscle, after the session between CP (33.00±1.26, 95% CI 32.15-33.85) and PP (34.18±1.53, 95% CI 33.14-35.21, p=0.024 η2p=0.536, very large effect) groups, and within the PP group, between before (31.90±1.13, 95% CI 31.14-32.67) and after (34.18±1.53, 95% CI 33.14-35.21, p=0.004 η2p=0.493, large effect) measurements.
4. Discussion
The present study aimed to evaluate the parameters of Mean Propulsive Velocity (MPV), Maximum Velocity (Vmax), and muscle power, as well as the local temperature of the long head of the triceps brachii and sternal portion of the pectoralis major, between Conventional Powerlifting (CP) and Paralympic Powerlifting (PP) athletes, at an intensity of 45% 1RM, following a conventional training session in the bench press.
4.1. VMP, Vmax and Power
Differences were observed in the CP group for MPV, Vmax, and power between pre- and post-training session measurements. Post-session velocity and power variables were higher in this group. These velocity parameters have been evaluated in other studies and indicated as modulators of stimulus intensity and neuromuscular fatigue effect in training sessions [23,25,29]. According to a previous study, MPV establishes a highly reliable load-velocity relationship when compared to other velocity variables, with mean velocity showing the strongest relationship to relative intensity percentage, followed by MPV [30]
MPV has been associated with neuromuscular fatigue, which gradually develops as exercise repetitions are performed, reducing velocity during the training session and in pre- and post-session tests. The magnitude of this reduction was observed to be greater in the bench press compared to exercises like squats [30]. These variations differ from the findings in this study for the CP group, which exhibited higher MPV post-session. Additionally, this study did not find a reduction in MPV among PP athletes.
It is noteworthy that in a previous study conducted with men experienced in strength training using bench press, employing sets to failure and non-failure protocols, despite the reduction in repetitions per set and velocity loss in the sets to failure, velocity did not demonstrate significant decreases at 85%-90% of 1RM with smaller sets of repetitions [25]. However, research has shown that as repetitions approach or reach muscular failure, there is a greater loss of velocity, as well as hypertrophy of type I fibers and reduced stimulus to myosin heavy chain (MHC-IIx), thus improving muscular endurance but not maximal strength [3,31,32,33].
Our results demonstrated reductions in velocity and power parameters for the Paralympic Powerlifting (PP) group, in contrast to the Conventional Powerlifting (CP) group, where these parameters increased. Nevertheless, in elite competitors, a reduction in velocity and power measures is expected, as demonstrated in studies evaluating athletes from various disciplines [34,35]. Furthermore, when comparing two velocity reduction profiles (15% vs. 30%), athletes achieved greater neuromuscular adaptations at the lower percentage of reduction [35].
The velocity loss indicator has been increasingly evaluated for training purposes in maximum strength modalities, demonstrating a linear relationship between velocity reduction and higher %1RM [23,29,30]. In a recent study by our group, Paralympic Powerlifting (PP) athletes were exposed to two types of training: traditional with 80% of 1RM and eccentric with 110% of 1RM. For traditional training, there was no significant reduction in Mean Propulsive Velocity (MPV) between pre- and post-intervention measurements, supporting the findings of the present study [32].
Despite the widespread use of velocity reduction for training load control, the method's precision remains under constant debate, particularly when compared to traditional methods such as %1RM [6,17,23]. Nevertheless, %1RM carries considerable disadvantages, with one of the primary issues being the need to perform daily maximum strength tests to predict training load percentages, as factors such as sleep, nutrition, fatigue, and movement velocity can impact force production. This ongoing debate highlights the complexity of accurately quantifying and controlling training loads in strength-based sports, emphasizing the need for further research to optimize training methodologies and performance outcomes [8].
In addition to velocity indicators, our study evaluated power output, which also showed different results between groups. Conventional Powerlifting (CP) athletes experienced an increase in power, while Paralympic Powerlifting (PP) athletes tended towards a decrease. Power has been investigated as an important factor for adjusting optimal workload to improve human movement [36,37]. Consequently, power has been identified as a critical capacity for athletic performance, defined by the formula (power = velocity x force), meaning that increasing either velocity or force will also increase power [10,38].
Studies associating velocity loss with neuromuscular adaptations have concluded that the closer to failure during training sets, the greater the losses in velocity and power [39,40]. Accordingly, our study's training session was conducted with fixed sets. In the CP group, both Mean Propulsive Velocity (MPV) and power increased, while in the PP group, despite a reduction, no significant difference was observed.
On the other hand, with 80% of 1RM, during training and comparing series 1 with series 5, PP athletes, in the initial set, had lower velocities in both MPV and Vmax than CP athletes. However, in the final set, PP athletes had higher absolute values than CP athletes, these findings are in line with other studies [7,17,18]. Regarding Power, there were differences only between sets 1 and 5 in PP.
4.2. Skin Temperature
Skin temperature in the long head of the triceps brachii (TBCL) and sternal portion of the pectoralis major (PME) muscles showed significant alterations in both groups. Infrared thermography in sports has been used to understand thermal changes in muscle tissue after exercise or training, providing data for better understanding injury prevention, biomechanical alterations, and imbalances [30,41,42].
Physiologically, after exposure to overload, blood flow increases to the exercised area, causing changes in the thermal pattern, as observed in the sternal portion of the pectoralis major (PME) and long head of the triceps brachii (TBCL) in the Paralympic Powerlifting (PP) group [41,38]. Although an increase in post-exercise temperature values is expected, when these values exceed normal patterns, the risk of injury may increase [43]. Consequently, when the temperature surpasses values above 1.6°C, a higher risk of injury is observed, necessitating the interruption of training [42,43]. The high intensity applied by strength athletes has been identified as a relevant factor for the increase in skin temperature (ST) [44,45]. However, a recent study analyzing the thermal pattern during a traditional strength training session (5x5, 80% 1RM) in PP athletes found no thermal differences [46].
Thermal responses demonstrate how training load, exercise type, muscle groups and joints involved, cardiovascular and hemodynamic systems, among others, result in complex physiological responses that trigger adaptations and internal adjustments created by training [23,47]. This may partially explain the different results found in this study regarding ST responses between groups. Reinforcing the previous data, research applying different types of exercises, intensities, set volumes, and in distinct populations also found ambiguous results regarding thermal responses [14,48].
Corroborating with the previous exposition, when analyzing three different training methods - traditional (TRAD), time under tension (TUT), and vascular occlusion (OCL) - on ST in athletes, immediately after training, ST was reduced in all groups, but significant reductions were only observed for OCL and TUT [49]. In another study evaluating the impact of the drop set method and set volume (3 sets vs. 6 sets) on ST, an increase in temperature was evident immediately after training, and the higher volume of sets generated a greater thermal response [14].
Another factor that may influence and explain the differences in skin temperature (ST) behavior between groups in this study is the training level, as Paralympic Powerlifting (PP) athletes are more experienced than Conventional Powerlifting (CP) athletes. Research has demonstrated that after anaerobic exercise, trained women exhibit a more rapid increase in ST and maintain a more refined thermoregulatory management compared to untrained individuals [50]. Corroborating this finding, when men with different training levels were subjected to an effort test, they demonstrated similar thermoregulatory kinetics as observed in the aforementioned study [51].
4.3. Train Considerations
Our study represents the first comprehensive evaluation and analysis of velocity, power output, and skin temperature parameters among athletes from different powerlifting categories. To date, only one study [46], has conducted a similar analysis, focusing solely on Paralympic Powerlifting (PP) athletes. While that study obtained identical results for all parameters, our research uniquely identified significant differences in skin temperature for the long head of the triceps brachii. Furthermore, our findings present evidence that contradicts the majority of cited studies regarding the collected and analyzed data.
Thus, it seems that PP athletes tend to have lower initial velocity and higher velocity at the end, however, in terms of fatigue there were differences in the temperature of the Triceps, with no differences in the chest. Regarding fatigue expressed through velocity, it was observed that PP athletes had less fatigue expressed through velocity. This may be due to adaptation, since many people use their upper limbs to propel the wheelchair and to move around using crutches [52,53].
4.4. Limitations
The study has several limitations that require caution in interpreting the results. The intervention was acute, which prevents extrapolation to chronic effects, as long-term training models and duration may cause different effects on the evaluated parameters. External factors such as sleep duration, nutrition, and use of ergogenic substances were not controlled, except for illicit substances. The findings are specific to the athletic population, and effects in non-athletes may differ. Furthermore, additional studies are necessary to elucidate the remaining gaps regarding parameters for training control, in order to assist coaches and athletes in better decision-making, thus ensuring the best possible performance.
5. Conclusion
The results of our study demonstrated that following a training session with a 5x5 protocol at 80% of 1RM, velocity, power output, and skin temperature measurements differed between Conventional Powerlifting (CP) and Paralympic Powerlifting (PP) athletes. This indicates that within the same sport modality but across different categories, training variables may have distinct impacts. Despite a trend towards reduction in velocity loss parameters, no significant differences were observed. Contrary to this finding, the PP group demonstrated a significant increase in velocity measures. Furthermore, the inverse relationship between force and velocity appears to be dependent on variables beyond those discussed in the present study. There was no difference in relation to the dynamic strength indicators with 80% of 1RM, in relation to MPV and VMax, with a difference only in relation to Power for PP. Furthermore, PP athletes presented lower velocity at the beginning of training and higher speeds at the end, when compared to CP athletes.
Moreover, the increase in skin temperature for the sternal portion of the pectoralis major and long head of the triceps brachii was anticipated, despite intra- and inter-group differences. This suggests that for both CP and PP athletes, the applied intensity and volume were within safe parameters. Consequently, the utilization of high loads does not seem to compromise the athletes' integrity and performance, neither in terms of temperature increase nor velocity loss.
These findings contribute to the understanding of acute responses to high-intensity resistance training in powerlifting athletes, highlighting the importance of category-specific considerations in training program design and performance monitoring.
Author Contributions
Conceptualization, R.L.M.S. and F.J.A.; methodology, L.d.S.; software, J.L.S.; validation, L.M.V.S., formal analysis, P.F.d.A.N.; investigation, R.L.M.S.; and F.J.A., resources, B.G.d.A.T.C.; data curation, F.J.A.; writing—original draft preparation, R.L.M.S.; writing—review and editing, all authors; visualization, J.L.S.; supervision, B.F.d.A.T.C.; project administration, F.J.A.;. All authors have read and agreed to the published version of the manuscript.
Funding
This research received no external funding.
Institutional Review Board Statement
The study was conducted according to the guidelines of the Declaration of Helsinki and approved by the Institutional Review Board and approved by the Human Research Ethics Committee of the Federal University of Sergipe (UFS), under Statement Number 2637882/2018.
Informed Consent Statement
Informed consent was obtained from all subjects involved in the study.
Data Availability Statement
The data that support this study can be obtained from the address: www.ufs.br/Department of Physical Education, accessed on 12 June 2024.
Conflicts of Interest
The authors declare no conflict of interest.
References
- Spence, A.-J.; Helms, E.R.; Sousa, C.A.; McGuigan, M.R. Range of Motion Predicts Performance in National-Level New Zealand Male Powerlifters. J. Strength Cond. Res. 2023, 37, 123–128. [CrossRef]
- Para Powerlifting Rules and Regulations Available online: https://www.paralympic.org/powerlifting/rules (accessed on 30 May 2024).
- González-Badillo, J.J.; Sánchez-Medina, L. Movement Velocity as a Measure of Loading Intensity in Resistance Training. Int. J. Sports Med. 2010, 31, 347–352. [CrossRef]
- Dorrell, H.F.; Smith, M.F.; Gee, T.I. Comparison of Velocity-Based and Traditional Percentage-Based Loading Methods on Maximal Strength and Power Adaptations. J. Strength Cond. Res. 2020, 34, 46–53. [CrossRef]
- Dorrell, H.F.; Smith, M.F.; Gee, T.I. Comparison of Velocity-Based and Traditional Percentage-Based Loading Methods on Maximal Strength and Power Adaptations. J. Strength Cond. Res. 2020, 34, 46–53. [CrossRef]
- Sanchez-Medina, L.; Perez, C.E.; Gonzalez-Badillo, J.J. Importance of the Propulsive Phase in Strength Assessment. Int. J. Sports Med. 2010, 31, 123–129. [CrossRef]
- Mesquita Souza, R.L.; Aidar, F.J.; Villar, R.; Greco, G.; Santos, L.D.; Poli, L.; Lima de Santana, J.; Carvutto, R.; Gama de Matos, D.; Badicu, G.; et al. Assessment of Asymmetry at Different Intensities between Conventional and Paralympic Powerlifting Athletes. Heliyon 2023, 9, e16211. [CrossRef]
- Conceição, F.; Fernandes, J.; Lewis, M.; Gonzaléz-Badillo, J.J.; Jimenéz-Reyes, P. Movement Velocity as a Measure of Exercise Intensity in Three Lower Limb Exercises. J. Sports Sci. 2016, 34, 1099–1106. [CrossRef]
- García-Ramos, A.; Haff, G.G.; Pestaña-Melero, F.L.; Pérez-Castilla, A.; Rojas, F.J.; Balsalobre-Fernández, C.; Jaric, S. Feasibility of the 2-Point Method for Determining the 1-Repetition Maximum in the Bench Press Exercise. Int. J. Sports Physiol. Perform. 2018, 13, 474–481. [CrossRef]
- Loturco, I.; Pereira, L.A.; Abad, C.C.C.; Tabares, F.; Moraes, J.E.; Kobal, R.; Kitamura, K.; Nakamura, F.Y. Bar Velocities Capable of Optimising the Muscle Power in Strength-Power Exercises. J. Sports Sci. 2017, 35, 734–741. [CrossRef]
- Jandačka, D.; Beremlijski, P. Determination of Strength Exercise Intensities Based on the Load-Power-Velocity Relationship. J. Hum. Kinet. 2011, 28, 33–44. [CrossRef]
- Menezes, P.; Rhea, M.R.; Herdy, C.; Simão, R. Effects of Strength Training Program and Infrared Thermography in Soccer Athletes Injuries. Sports Basel Switz. 2018, 6, 148. [CrossRef]
- Naperalsky, M.; Ruby, B.; Slivka, D. Environmental Temperature and Glycogen Resynthesis. Int. J. Sports Med. 2010, 31, 561–566. [CrossRef]
- Fernández-Cuevas, I.; Bouzas Marins, J.C.; Arnáiz Lastras, J.; Gómez Carmona, P.M.; Piñonosa Cano, S.; García-Concepción, M.Á.; Sillero-Quintana, M. Classification of Factors Influencing the Use of Infrared Thermography in Humans: A Review. Infrared Phys. Technol. 2015, 71, 28–55. [CrossRef]
- van den Hoek, D.; Garrett, J.; Howells, R.; Latella, C. Paralympians Are Stronger Than You Know: A Comparison of Para and Nondisabled Powerlifting Bench Press World Records. J. Strength Cond. Res. 2023, 37, 452–456. [CrossRef]
- Aidar, F.J.; Paz, Â. de A.; Gama, D. de M.; de Souza, R.F.; Vieira Souza, L.M.; Santos, J.L.D.; Almeida-Neto, P.F.; Marçal, A.C.; Neves, E.B.; Moreira, O.C.; et al. Evaluation of the Post-Training Hypotensor Effect in Paralympic and Conventional Powerlifting. J. Funct. Morphol. Kinesiol. 2021, 6, 92. [CrossRef]
- Getirana-Mota, M.; Aidar, F.J.; Ribeiro Neto, F.; Santos, T.P.; Almeida-Neto, P.F. de; Cabral, B.G. de A.T.; Vieira-Souza, L.M.; D Garrido, N.; Reis, V.M.; Souza, R.F. Comparison of Neuromuscular Fatigue in Powerlifting Paralympics in Different Training Methods. Sports Med. Int. Open 2024, 8, a22077922. [CrossRef]
- Loturco, I.; Pereira, L.A.; Winckler, C.; Santos, W.L.; Kobal, R.; McGuigan, M. Load-Velocity Relationship in National Paralympic Powerlifters: A Case Study. Int. J. Sports Physiol. Perform. 2019, 14, 531–535. [CrossRef]
- Bartolomei, S.; Caroli, E.; Coloretti, V.; Rosaci, G.; Cortesi, M.; Coratella, G. Flat-Back vs. Arched-Back Bench Press: Examining the Different Techniques Performed by Power Athletes. J. Strength Cond. Res. 2024, 38, 1200–1205. [CrossRef]
- Ribeiro Neto, F.; Dorneles, J.R.; Luna, R.M.; Spina, M.A.; Gonçalves, C.W.; Gomes Costa, R.R. Performance Differences Between the Arched and Flat Bench Press in Beginner and Experienced Paralympic Powerlifters. J. Strength Cond. Res. 2022, 36, 1936–1943. [CrossRef]
- Noble, B.& Powerlifting: The Complete Guide to Technique, Training, and competition|Paperback Available online: https://www.barnesandnoble.com/w/powerlifting-dan-austin/1137098965 (accessed on 18 October 2024).
- Wendler, J. 5/3/1: The Simplest and Most Effective Training System for Raw Strength; 2nd Edition.; Jim Wendler LLC, 2011; ISBN 978-0-578-09738-1.
- Santos, L.C.V.; Aidar, F.J.; Villar, R.; Greco, G.; de Santana, J.L.; Marçal, A.C.; de Almeida-Neto, P.F.; de Araújo Tinoco Cabral, B.G.; Badicu, G.; Nobari, H.; et al. Evaluation of the Training Session in Elite Paralympic Powerlifting Athletes Based on Biomechanical and Thermal Indicators. Sports Basel Switz. 2023, 11, 151. [CrossRef]
- Ball, R.; Weidman, D. Analysis of USA Powerlifting Federation Data From January 1, 2012-June 11, 2016. J. Strength Cond. Res. 2018, 32, 1843–1851. [CrossRef]
- Brunsden, T.J. Hormonal Responses to Resistance Training and Its Effects on Strength Adaptations: A Brief Overview. METHODS 2023, 10.
- Hopkins, W.G.; Marshall, S.W.; Batterham, A.M.; Hanin, J. Progressive Statistics for Studies in Sports Medicine and Exercise Science. Med. Sci. Sports Exerc. 2009, 41, 3–13. [CrossRef]
- Cohen, J. Statistical Power Analysis for the Behavioral Sciences; 2nd ed.; Routledge: New York, 1988; ISBN 978-0-203-77158-7.
- Cohen, J. A Power Primer. Psychol. Bull. 1992, 112, 155–159. [CrossRef]
- Sander, A.; Keiner, M.; Wirth, K.; Schmidtbleicher, D. Influence of a 2-Year Strength Training Programme on Power Performance in Elite Youth Soccer Players. Eur. J. Sport Sci. 2013, 13, 445–451. [CrossRef]
- Sánchez-Medina, L.; González-Badillo, J.J. Velocity Loss as an Indicator of Neuromuscular Fatigue during Resistance Training. Med. Sci. Sports Exerc. 2011, 43, 1725–1734. [CrossRef]
- Teles, L.J.L.; Aidar, F.J.; Matos, D.G. de; Marçal, A.C.; Almeida-Neto, P.F. de; Neves, E.B.; Moreira, O.C.; Ribeiro Neto, F.; Garrido, N.D.; Vilaça-Alves, J.; et al. Static and Dynamic Strength Indicators in Paralympic Power-Lifters with and without Spinal Cord Injury. Int. J. Environ. Res. Public. Health 2021, 18, 5907. [CrossRef]
- Pareja-Blanco, F.; Sánchez-Medina, L.; Suárez-Arrones, L.; González-Badillo, J.J. Effects of Velocity Loss During Resistance Training on Performance in Professional Soccer Players. Int. J. Sports Physiol. Perform. 2017, 12, 512–519. [CrossRef]
- Weakley, J.; Mann, B.; Banyard, H.; McLaren, S.; Scott, T.; Garcia-Ramos, A. Velocity-Based Training: From Theory to Application. Strength Cond. J. 2021, 43, 31. [CrossRef]
- Izquierdo, M.; González-Badillo, J.J.; Häkkinen, K.; Ibáñez, J.; Kraemer, W.J.; Altadill, A.; Eslava, J.; Gorostiaga, E.M. Effect of Loading on Unintentional Lifting Velocity Declines during Single Sets of Repetitions to Failure during Upper and Lower Extremity Muscle Actions. Int. J. Sports Med. 2006, 27, 718–724. [CrossRef]
- García-Pallarés, J.; Sánchez-Medina, L.; Carrasco, L.; Díaz, A.; Izquierdo, M. Endurance and Neuromuscular Changes in World-Class Level Kayakers during a Periodized Training Cycle. Eur. J. Appl. Physiol. 2009, 106, 629–638. [CrossRef]
- Liao, K.-F.; Wang, X.-X.; Han, M.-Y.; Li, L.-L.; Nassis, G.P.; Li, Y.-M. Effects of Velocity Based Training vs. Traditional 1RM Percentage-Based Training on Improving Strength, Jump, Linear Sprint and Change of Direction Speed Performance: A Systematic Review with Meta-Analysis. PloS One 2021, 16, e0259790. [CrossRef]
- Cormie, P.; McBride, J.M.; McCaulley, G.O. Validation of Power Measurement Techniques in Dynamic Lower Body Resistance Exercises. J. Appl. Biomech. 2007, 23, 103–118. [CrossRef]
- Jidovtseff, B.; Quievre, J.; Hanon, C.; Crielaard, J. Inertial Muscular Profiles Allow a More Accurate Training Loads Definition. Sci. Sports 2009, 24, 91–96.
- Loturco, I.; Nakamura, F.Y.; Kobal, R.; Gil, S.; Abad, C.C.C.; Cuniyochi, R.; Pereira, L.A.; Roschel, H. Training for Power and Speed: Effects of Increasing or Decreasing Jump Squat Velocity in Elite Young Soccer Players. J. Strength Cond. Res. 2015, 29, 2771–2779. [CrossRef]
- Sánchez-Moreno, M.; Cornejo-Daza, P.J.; González-Badillo, J.J.; Pareja-Blanco, F. Effects of Velocity Loss During Body Mass Prone-Grip Pull-up Training on Strength and Endurance Performance. J. Strength Cond. Res. 2020, 34, 911–917. [CrossRef]
- Marins, J.; Fernández Cuevas, I.; Arnaiz-Lastras, J.; Fernandes, A.A.; Quintana, M. Applications of Infrared Thermography in Sports. A Review. Rev. Int. Med. Cienc. Act. Fis. Deporte 2015, 15, 805–824.
- Marins, R.; Fernández-Cuevas; Arnaiz-Lastras; Sillero-Quintana, Y. Applications of Infrared Thermography in Sports . A Review.; 2015.
- Abate, M.; Di Carlo, L.; Di Donato, L.; Romani, G.L.; Merla, A. Comparison of Cutaneous Termic Response to a Standardised Warm up in Trained and Untrained Individuals. J. Sports Med. Phys. Fitness 2013, 53, 209–215.
- Bishop, C.; Turner, A.; Jarvis, P.; Chavda, S.; Read, P. Considerations for Selecting Field-Based Strength and Power Fitness Tests to Measure Asymmetries. J. Strength Cond. Res. 2017, 31, 2635–2644. [CrossRef]
- Fraga, G.S.; Aidar, F.J.; Matos, D.G.; Marçal, A.C.; Santos, J.L.; Souza, R.F.; Carneiro, A.L.; Vasconcelos, A.B.; Da Silva-Grigoletto, M.E.; van den Tillaar, R.; et al. Effects of Ibuprofen Intake in Muscle Damage, Body Temperature and Muscle Power in Paralympic Powerlifting Athletes. Int. J. Environ. Res. Public. Health 2020, 17, 5157. [CrossRef]
- Neves, E.B.; Moreira, T.R.; Lemos, R.; Vilaça-Alves, J.; Rosa, C.; Reis, V.M. Using Skin Temperature and Muscle Thickness to Assess Muscle Response to Strength Training. Rev. Bras. Med. Esporte 2015, 21, 350–354. [CrossRef]
- Charkoudian, N. Mechanisms and Modifiers of Reflex Induced Cutaneous Vasodilation and Vasoconstriction in Humans. J. Appl. Physiol. Bethesda Md 1985 2010, 109, 1221–1228. [CrossRef]
- Neves, E.B.; Vilaca-Alves, J.; Antunes, N.; Felisberto, I.M.V.; Rosa, C.; Reis, V.M. Different Responses of the Skin Temperature to Physical Exercise: Systematic Review. Annu. Int. Conf. IEEE Eng. Med. Biol. Soc. IEEE Eng. Med. Biol. Soc. Annu. Int. Conf. 2015, 2015, 1307–1310. [CrossRef]
- DE Almeida Barros, N.; Aidar, F.J.; DE Matos, D.G.; DE Souza, R.F.; Neves, E.B.; DE Araujo Tinoco Cabral, B.G.; Carmargo, E.A.; Reis, V.M. Evaluation of Muscle Damage, Body Temperature, Peak Torque, and Fatigue Index in Three Different Methods of Strength Gain. Int. J. Exerc. Sci. 2020, 13, 1352–1365.
- Uchôa, P.; Matos, F.; Neves, E.B.; Saavedra, F.; Rosa, C.; Reis, V.M.; Vilaça-Alves, J. Evaluation of Two Different Resistance Training Volumes on the Skin Surface Temperature of the Elbow Flexors Assessed by Thermography. Infrared Phys. Technol. 2018, 93, 178–183. [CrossRef]
- Formenti, D.; Ludwig, N.; Gargano, M.; Gondola, M.; Dellerma, N.; Caumo, A.; Alberti, G. Thermal Imaging of Exercise-Associated Skin Temperature Changes in Trained and Untrained Female Subjects. Ann. Biomed. Eng. 2013, 41, 863–871. [CrossRef]
- de Aquino Resende, M.; Aidar, F.J.; Vasconcelos Resende, R.B.; Reis, G.C.; de Oliveira Barros, L.; de Matos, D.G.; Marçal, A.C.; de Almeida-Neto, P.F.; Díaz-de-Durana, A.L.; Merino-Fernández, M.; et al. Are Strength Indicators and Skin Temperature Affected by the Type of Warm-Up in Paralympic Powerlifting Athletes? Healthc. Basel Switz. 2021, 9, 923. [CrossRef]
- Resende, M. de A.; Vasconcelos Resende, R.B.; Reis, G.C.; Barros, L. de O.; Bezerra, M.R.S.; Matos, D.G. de; Marçal, A.C.; Almeida-Neto, P.F. de; Cabral, B.G. de A.T.; Neiva, H.P.; et al. The Influence of Warm-Up on Body Temperature and Strength Performance in Brazilian National-Level Paralympic Powerlifting Athletes. Med. Kaunas Lith. 2020, 56, 538. [CrossRef]
Figure 1.
Experimental study design. Legend: 1 RM: one repetition maximum; MVP: mean propulsive velocity; Vmax: maximum velocity.
Figure 1.
Experimental study design. Legend: 1 RM: one repetition maximum; MVP: mean propulsive velocity; Vmax: maximum velocity.
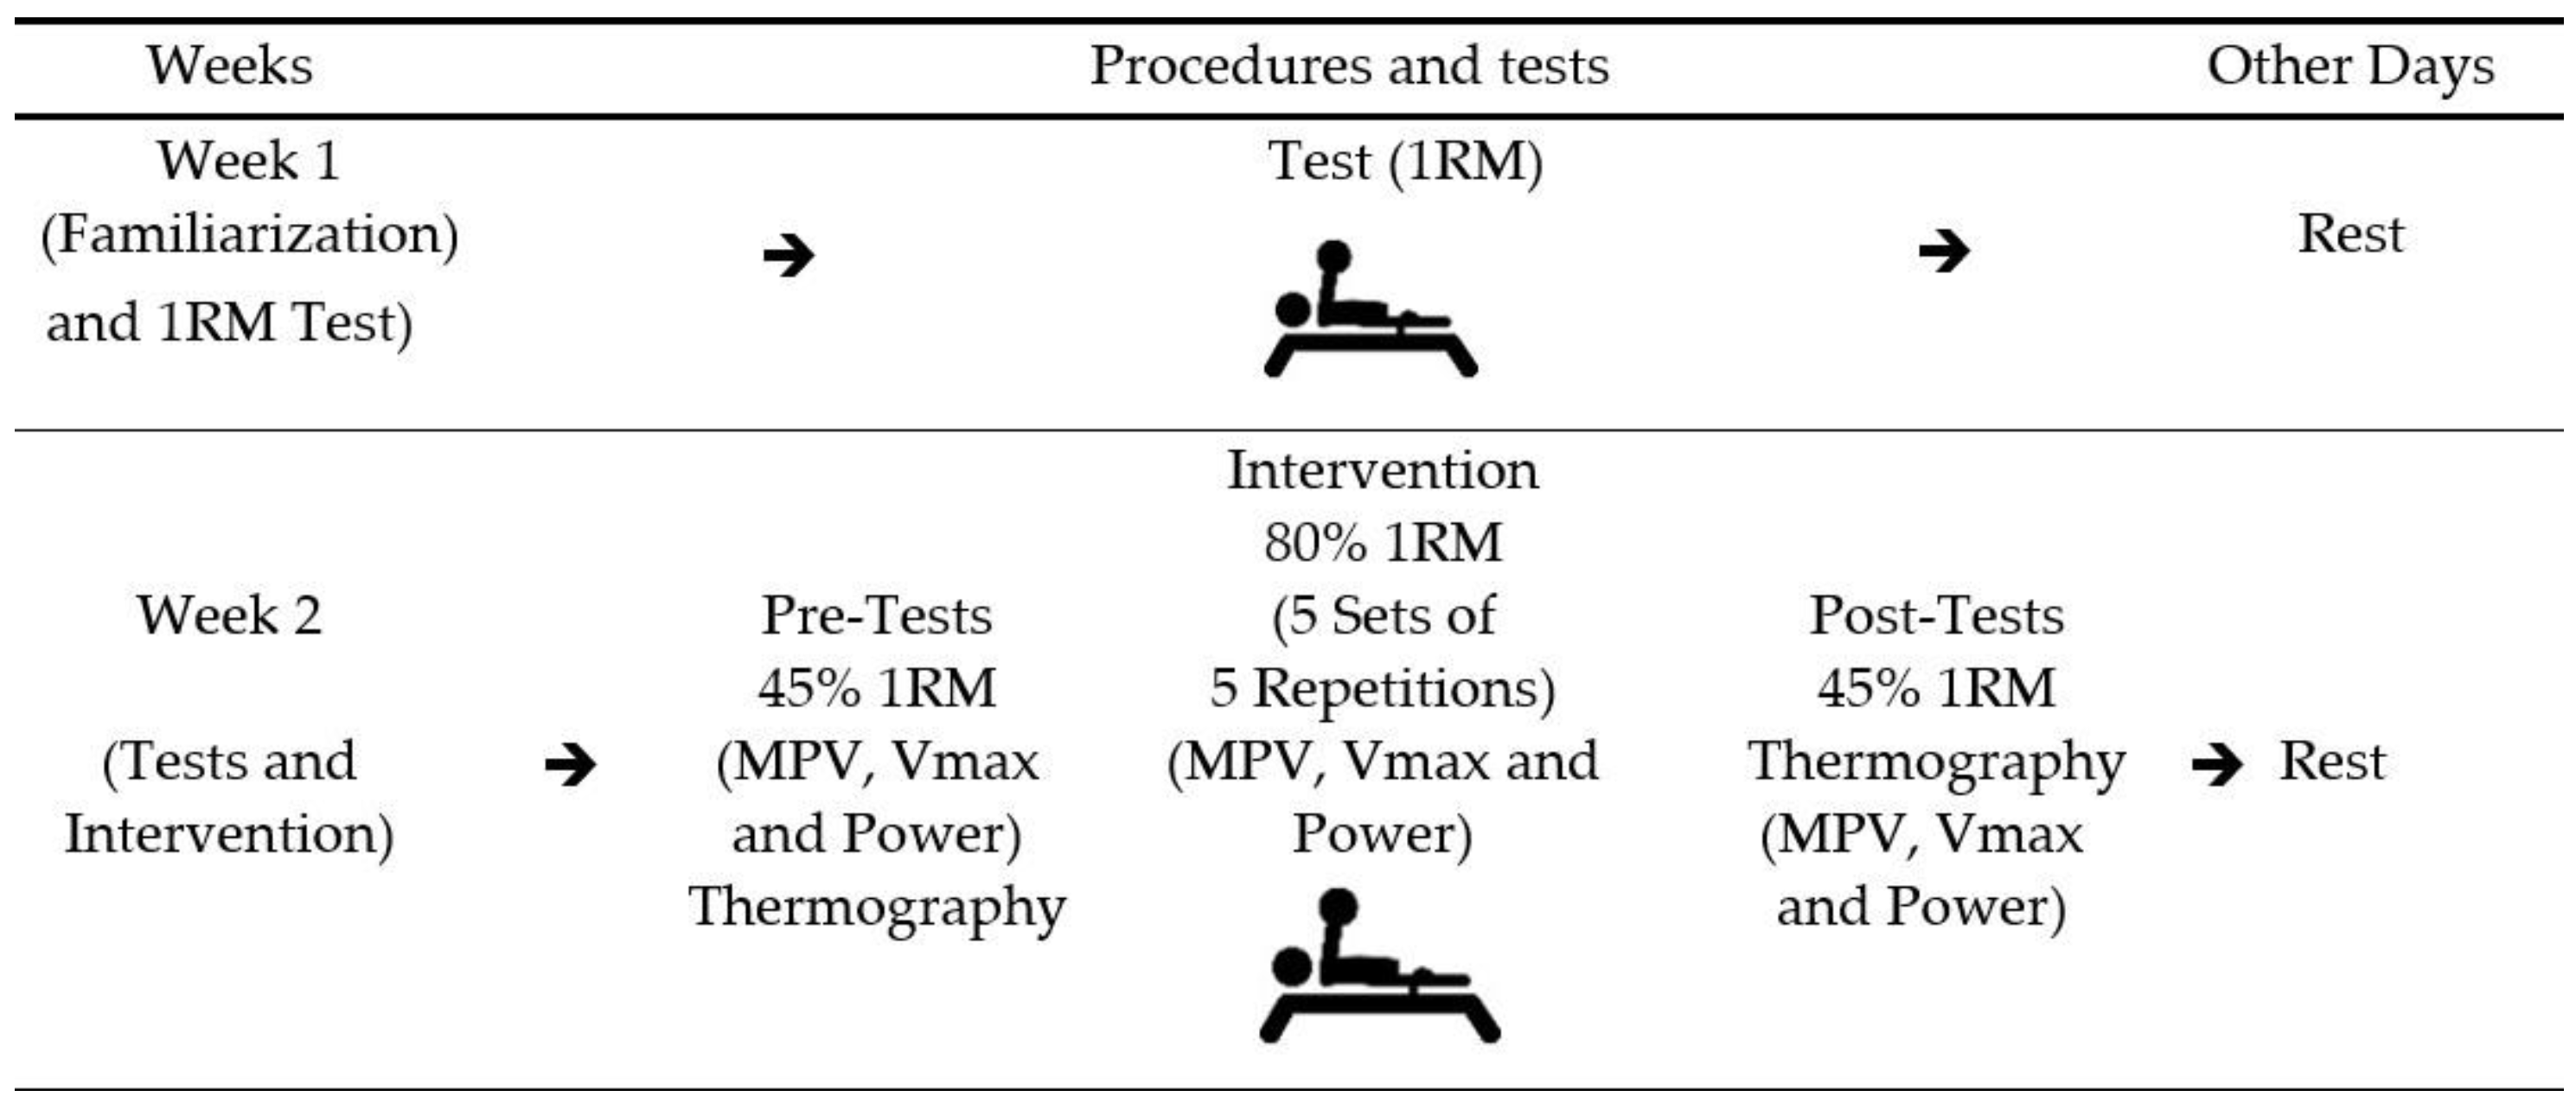
Figure 2.
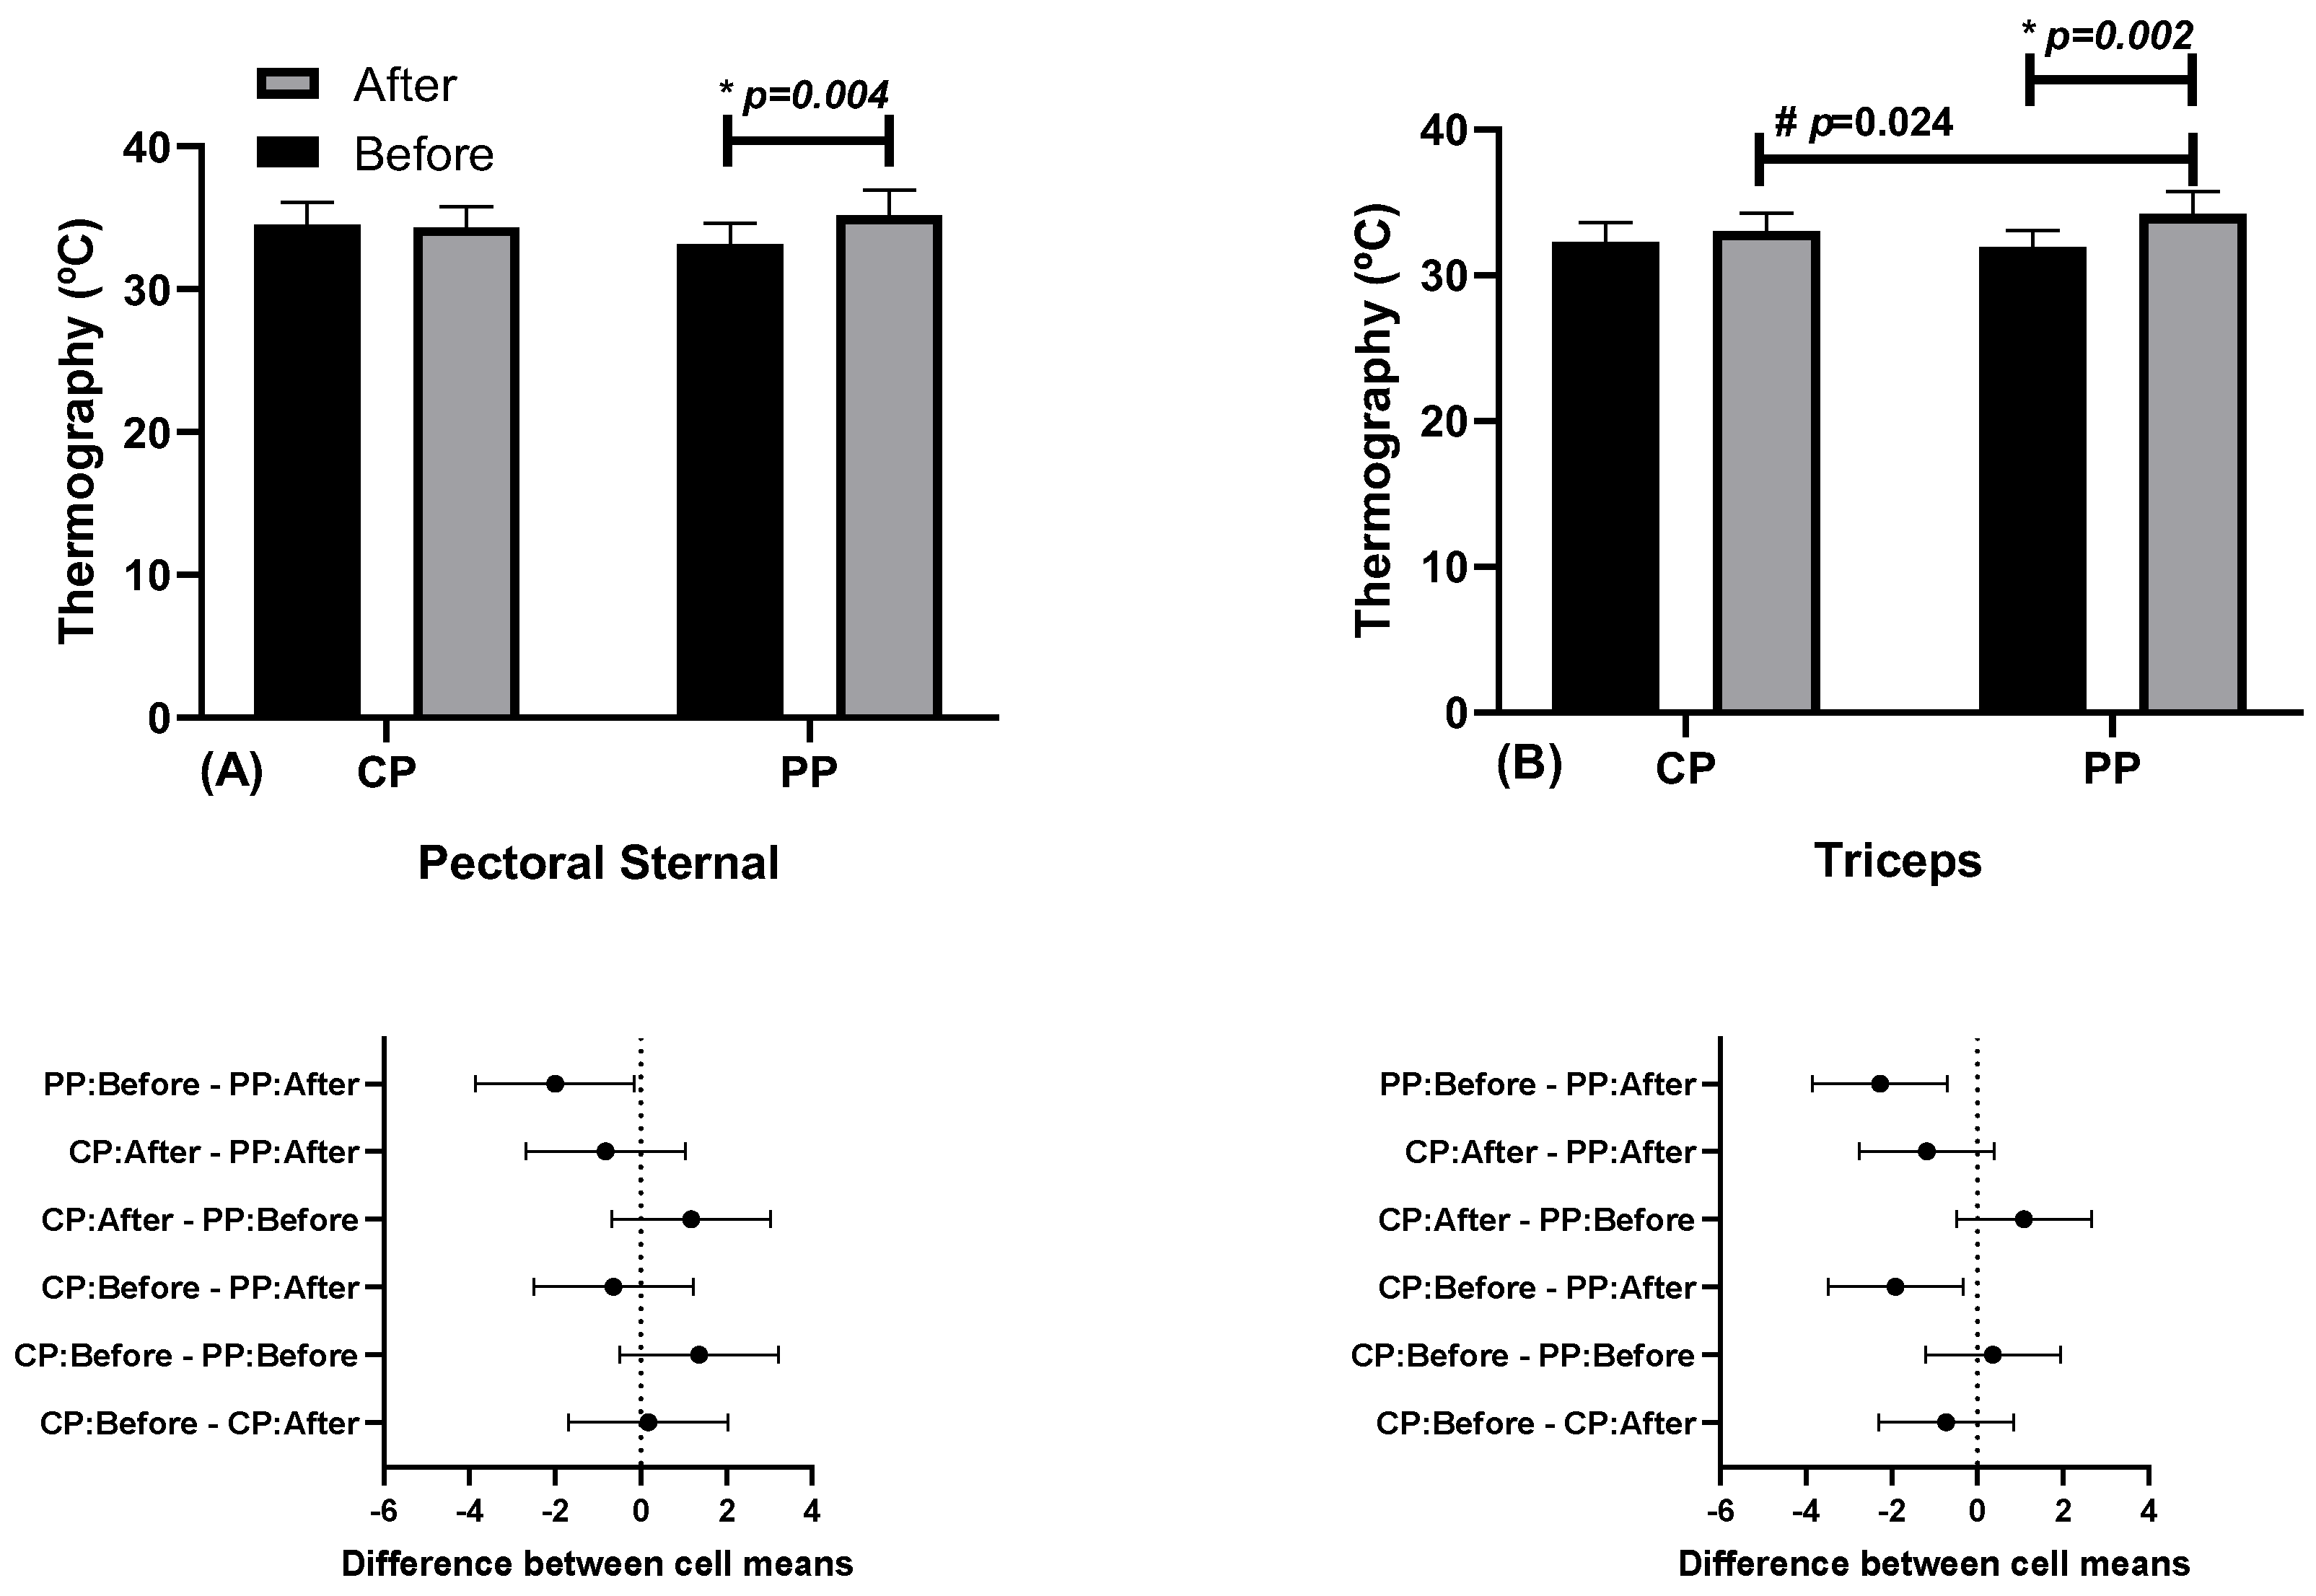

Table 1.
Sample characteristics.
| Conventional Powerlifting (CP) | Paralympic Powerlifting (PP) |
p | Cohen’s d | |
|---|---|---|---|---|
| Age (years) | 29.84±4.21 | 30.81±8.05 | 0,715 | XXX |
| Body weight (Kg) | 78.52±7.95 | 70.00±16.13 | 0,115 | XXX |
| Experience (years) | 1.81±0.41 | 2.84±1.31 | 0,016 | 1,108 |
| 1RM Bench Press Test (Kg) | 118.49±17.71 | 122.02±38.06 | 0,440 | XXX |
| 1RM/Body mass | 1.51±0.61* | 1.71±0.42* | 0,175 | XXX |
The load lift by the athletes ranked them among the top 10 in their categories at the national level. ** 1 RM/body mass values > 1.4 for the bench press is considered elite for athletes [24]. SD = standard deviation.
Table 2.
Concentric Mean Velocity before and after 45% and 80% of 1RM (Mean ± SD, and CI 95%).
| Before | After | |||||
|---|---|---|---|---|---|---|
| CP (a) | PP (b) | CP (c) | PP (d) | p | η2p | |
| VMP 45% (m/s) |
0.93±0.23 (0.78-1.09) |
0.92±0.17 (0.80-1.04) |
0.98±0.24a (0.82-1.14) |
0.83±0.17 (0.71-0.94) |
“a” p=0.007 |
0.412* |
| Vmax 45% (m/s) |
1.24±0.27 (1.01-1.43) |
1.26±0.20 (1.12-1.39) |
1.31±0.28a (1.12-1.50) |
1.14±0.19 (1.01-1.27) |
“a” p=0.015 |
0.388* |
| Power 45% (W) |
439.72±131.32 (351.50-527.95) |
524.42±140.50 (430.03-618.81) |
454.09±118.77a (374.29-533.88) |
478.78±134.72 (388.27-569.298) |
“a” p=0.022 |
0.314* |
| VMP 80% (m/s) |
0.46±0.11 (0.40-0.53) |
0.35±0.10 a (0.29-0.42) |
0.45±0.11 (0.38-0.52) |
0.49±0.19 b (0.37-0.61) |
“a”p=0.040# “b”p=0.008* |
0.455# 0.468* |
| Vmax 80% (m/s) |
0.65±0.12 (0.57-0.72) |
0.50±0.14 a (0.41-0.59) |
0.64±0.16 (0.54-0.74) |
0.67±0.25 b (0.51-0.83) |
“a”p=0.033# “b”p=0.006* |
0.431# 0.481* |
| Power 80% (W) |
375.98±91.21 (318.03-433.94) |
386.79±199.35 (260.13-513.45) |
337.73±80.12 (286.83-388.64) |
460.99±222.15 b (319.84-602.14) |
“b”p=0,034* | 0.427* |
p< 0.05 (ANOVA). η2p = partial eta square (small effect ≤0.05, medium effect 0.05 to 0.25, high effect 0.25 to 050 and very high effect (> 050). * Intraclass, # Interclass. PP: Paralympic Powerlifters; CP: Conventional Powerlifters.
Disclaimer/Publisher’s Note: The statements, opinions and data contained in all publications are solely those of the individual author(s) and contributor(s) and not of MDPI and/or the editor(s). MDPI and/or the editor(s) disclaim responsibility for any injury to people or property resulting from any ideas, methods, instructions or products referred to in the content. |
© 2025 by the authors. Licensee MDPI, Basel, Switzerland. This article is an open access article distributed under the terms and conditions of the Creative Commons Attribution (CC BY) license (http://creativecommons.org/licenses/by/4.0/).
Copyright: This open access article is published under a Creative Commons CC BY 4.0 license, which permit the free download, distribution, and reuse, provided that the author and preprint are cited in any reuse.


