
Submitted:
11 February 2025
Posted:
11 February 2025
You are already at the latest version
Abstract
Smart home technologies offer numerous benefits to consumers. This study explored the relationship between the perceived benefits of and likelihood of adopting smart home technologies among Taiwanese consumers. The study conducted a survey in May 2024 and collected data from 424 respondents of various ages, educational backgrounds, and income levels. Data on the perceived benefits of smart home technologies, the perceived challenges of adopting these technologies, current methods for managing household tasks and energy consumption, and the likelihood of adopting smart home technologies were collected. The perceived benefits of smart home technology include enhanced comfort, security, and energy efficiency. Comfort and energy efficiency but not enhanced security were significant predictors of adoption. Proficiency in online research but not general technical proficiency also significantly predicted adoption. Consumers dissatisfied with current home management methods were more likely to adopt smart home technologies. Positive perceptions of benefits and dissatisfaction with current methods drive the adoption of smart home technologies. A merit of this study is its use of empirical evidence. The study offers valuable insights into consumer buying behaviors and contributes to the smart home technology industry by identifying gaps that may prevent users from embracing smart home technologies.
Keywords:
buying behavior
; smart home technology
; internet of things
; technology acceptance model
1. Introduction
A smart home is a home equipped with technology to enhance comfort, security, and entertainment by managing devices within the home and with the outside world [1]. The smart home market has grown substantially due to advances in Internet of Things technology and increasing consumer demands for connected living. Pliatsikas and Economides [2] highlighted the benefits of smart home technologies, such as monitoring and managing sick individuals and older adults, saving money, and managing energy consumption. The factors that influence consumer buying behavior in this domain are not well understood. Several studies on the topic have explored consumer preferences and adoption patterns. A comprehensive analysis of the drivers and barriers affecting purchasing decisions is needed.
Ghaffarianhoseini et al. [3] showed that smart homes help users maintain independence while enhancing safety, security, and comfort. Smart homes monitor and regulate activities, behavior patterns, and health status, adapting automatically to user needs and preferences. Smart homes also manage energy consumption, contributing to energy-efficient living environments that are essential for sustainable urban development. The adoption of smart home technologies is primarily driven by the desire to enhance personal comfort and convenience [4]. This trend highlights a fundamental human tendency to seek solutions that simplify one’s daily routines and improve one’s living standards. Across different cultures, individuals gravitate toward smart home technologies not just for the technology itself but for the tangible benefits of comfort, convenience, and efficiency.
A 2023 analysis of Taiwan’s smart home market by Statista highlighted the sector’s growth trajectory and potential. The market is expected to achieve revenues of US$565.7 million by 2024. With an annual growth rate of 7.33%, the market is expected to expand to US$750.6 million by 2028. This growth is driven by several factors. First, the integration of smart technologies into daily life has increased consumer demand for home automation solutions. As awareness and acceptance of smart home devices grow, adoption rates increase, fueling market expansion. Second, technological advancements and the proliferation of Internet of Things devices are enabling more sophisticated and interconnected smart home ecosystems. As these devices evolve, consumers have more options to enhance their living space. Additionally, government initiatives and supportive policies, such as subsidies for energy-efficient appliances and smart city projects, are boosting market growth. This alignment between smart home technology adoption and personal comfort reflects a convergence of consumer priorities across cultures.
The projected consumer interest in smart home technologies aligns with market trends. Data consistently show increased demand for these technologies, highlighting their growing value among consumers worldwide. Indicators such as sales figures, adoption rates, and product launches suggest that personal comfort and lifestyle benefits are driving market dynamics. A gap in the literature is the limited focus on sociopsychological factors affecting consumer attitudes toward smart home technologies. Aspects such as perceived value, trust, and psychological motivations have received relatively little scrutiny. Understanding how these factors interact with technology can provide insights into why certain consumers embrace smart home technologies while others remain skeptical or hesitant.
Several studies have examined how demographic factors such as age, income, and education influence the adoption of smart home technologies, although a consensus on the significance and directionality of these factors has not been established. Some studies have suggested that younger consumers are more likely to adopt smart home technologies due to their familiarity with digital devices, whereas other studies have argued older individuals may show more interest due to their need for convenience and safety. Understanding these demographic nuances is essential for developing effective marketing strategies and product designs. Additionally, the influence of contextual factors, such as cultural differences and regulatory frameworks, on consumer buying behavior is not well understood. Cultural norms can affect perceptions of privacy and security, affecting the desirability of smart home technologies across different regions. Similarly, regulatory environments and industry standards can influence consumer trust and willingness to invest.
This study addresses these gaps by exploring the factors affecting consumer buying behavior for smart home technologies in Taiwan. The study conducted an online survey to examine the interplay between technological, sociopsychological, demographic, and contextual factors that shape consumer attitudes and preferences.
2. Literature Review
In the field of smart home technologies, understanding individual acceptance and use of information technology is crucial. Research into information systems often uses theoretical frameworks to explore the attitudes and intentions of potential users toward adopting these technologies. For example, Peek et al. [5] examined factors such as social influence and perceptions of technology, focusing on older adults and their acceptance of technologies that support aging in place. They found that older adults value benefits such as increased safety and independence more than just perceived usefulness, suggesting that acceptance involves factors beyond the technology acceptance model.
Smart home technology combines various technologies and services within home networks to improve our quality of life [6] and represents a modern form of ubiquitous computing, embedding intelligence and automation into homes to address needs related to comfort, control, security, safety, health care, and energy conservation [7]. Marikyan et al. [8] describe smart homes as dwellings equipped with intelligent technologies that provide personalized services and suggest that future research take a longitudinal approach to explore how perceived values, risks, technology fit, and performance affect usage behavior and satisfaction. Smart home technology comprises hardware, sensors, and switches, enabling the creation of novel appliances and services for home use that can perform a myriad of functions, such as alerting residents to open gates or extreme temperatures, providing security for individuals with physical disabilities, and reminding older adults to take their medication. Today, the Internet has become an integral part of our homes, bringing convenience and automation to enhance everyday routines.
With Internet-connected devices, individuals can easily manage their home environments using a smartphone or tablet. Smart homes are interconnected ecosystems that include various devices and services that operate independently and in tandem, using Internet of Things technologies to communicate and having intuitive and interactive designs. Denning et al. [9] noted that as technology becomes more integrated into homes, the desire for impenetrable security across devices increases. Improving the effectiveness, compatibility, and user-friendliness of home security solutions is becoming increasingly important.
Research has shown that consumers view smart technologies positively and appreciate the time and cost savings. Smart home systems can also help manage and reduce energy use. Smart technologies can provide companionship and support for those in need, improving human well-being [10]. Initial investments in smart home technologies can be expensive. Ethical and legal issues, such as a lack of legal frameworks for smart home technology, also present challenges. Several studies have examined the adoption of smart home technology by employing well-established frameworks such as the technology acceptance model and the innovation diffusion theory [11,12].
Research into smart home technology for health and social care has focused mainly on energy management. Household appliances need to be compatible with energy management systems and smart home technology systems to function synergistically as an integrated whole. To capitalize on this potential, utilities and manufacturers of smart home energy management systems must collaborate to establish interfaces that integrate components and facilitate interaction between utility providers and households [13]. In research into health monitoring, studies often lack theoretical frameworks to explain user intentions and behaviors. Usability studies should be conducted that incorporate such frameworks to identify key adoption factors for smart homes and health-monitoring technologies. Consumers are expected to gradually adopt smart home solutions by integrating existing devices, including smart lights, shutters, and thermostats. Consumers should be informed of potential risks, including hacking, eavesdropping, data theft, and privacy breaches, that exist in smart home ecosystems [14].
Most usability studies on home health technologies have used qualitative methodologies. Quantitative research could provide evidence on user adoption [15]. Zin et al. [16] explored the technology acceptance model in smart home technology acceptance. Few studies have examined household perspectives regarding the acceptance and adoption of such technology. Boer et al. [17] and Alexander et al. [18] highlighted the importance of Internet skills, such as information navigation, in using Internet of Things technology. Kowalski et al. [19] demonstrated that individuals with higher technical proficiency were more likely to adopt smart home services and products, suggesting that technical proficiency empowers users to control their home environment.
Bradfield and Allen [20] argued that current methods for managing home energy consumption are ineffective and advocated for smart home technology to improve management capabilities. Wang et al. [21] assessed both positive and negative aspects of smart home devices, noting that performance expectancy and compatibility significantly influence adoption intentions. The smart home field has attracted much research since 1997 [22]. The present study contributes to the understanding and use of smart home technologies, particularly in Taiwan.
3. Research Questions
On the basis of the aforementioned studies, the following research questions were formulated to develop hypothesis:
Research Questions for Hypothesis 1:
RQ1.1: How do users perceive the benefits of smart home technology in terms of enhanced comfort, security, and energy efficiency?
RQ1.2: To what extent do user perceptions of these benefits correlate with their likelihood of adopting smart home services and products?
Research Questions for Hypothesis 2:
RQ2.1: What is the level of technical proficiency among individuals in managing Internet-connected devices and navigating information?
RQ2.2: How does technical proficiency influence an individuals’ inclination to adopt smart home services and products?
Research Questions for Hypothesis 3:
RQ3.1: What are the current methods used by individuals for managing home energy consumption and household tasks?
RQ3.2: How do perceived inadequacies in these methods drive users to seek solutions that enhance their home management capabilities through smart home technology adoption?
These questions explore the factors identified in the hypotheses and provide insights into the relationships between user perceptions, technical proficiency, perceived inadequacies of current methods, and adoption behaviors related to smart home technology.
4. Hypothesis
The aforesaid reviews and research questions have highlighted the diverse effects of smart home technology, showcasing its potential to transform modern living by enhancing comfort, security, energy efficiency, and social connectivity. Challenges such as high initial costs, ethical considerations, and legal constraints must be addressed for successful adoption. The promise of increased personal comfort and lifestyle convenience also plays a crucial role in the adoption of smart home technologies. On the basis of these insights, the following hypotheses were proposed:
Hypothesis 1:
User perceptions of the benefits of smart home technology, including enhanced comfort, security, and energy efficiency, positively correlate with their likelihood of adoption.
Hypothesis 2:
Individuals with higher technical proficiency, demonstrated by their ability to manage Internet-connected devices and navigate information, are more likely to adopt smart home services and products.
Hypothesis 3:
The perceived inadequacy of current methods for managing home energy consumption and household tasks drives the adoption of smart home technology as users seek solutions that improve their home management capabilities.
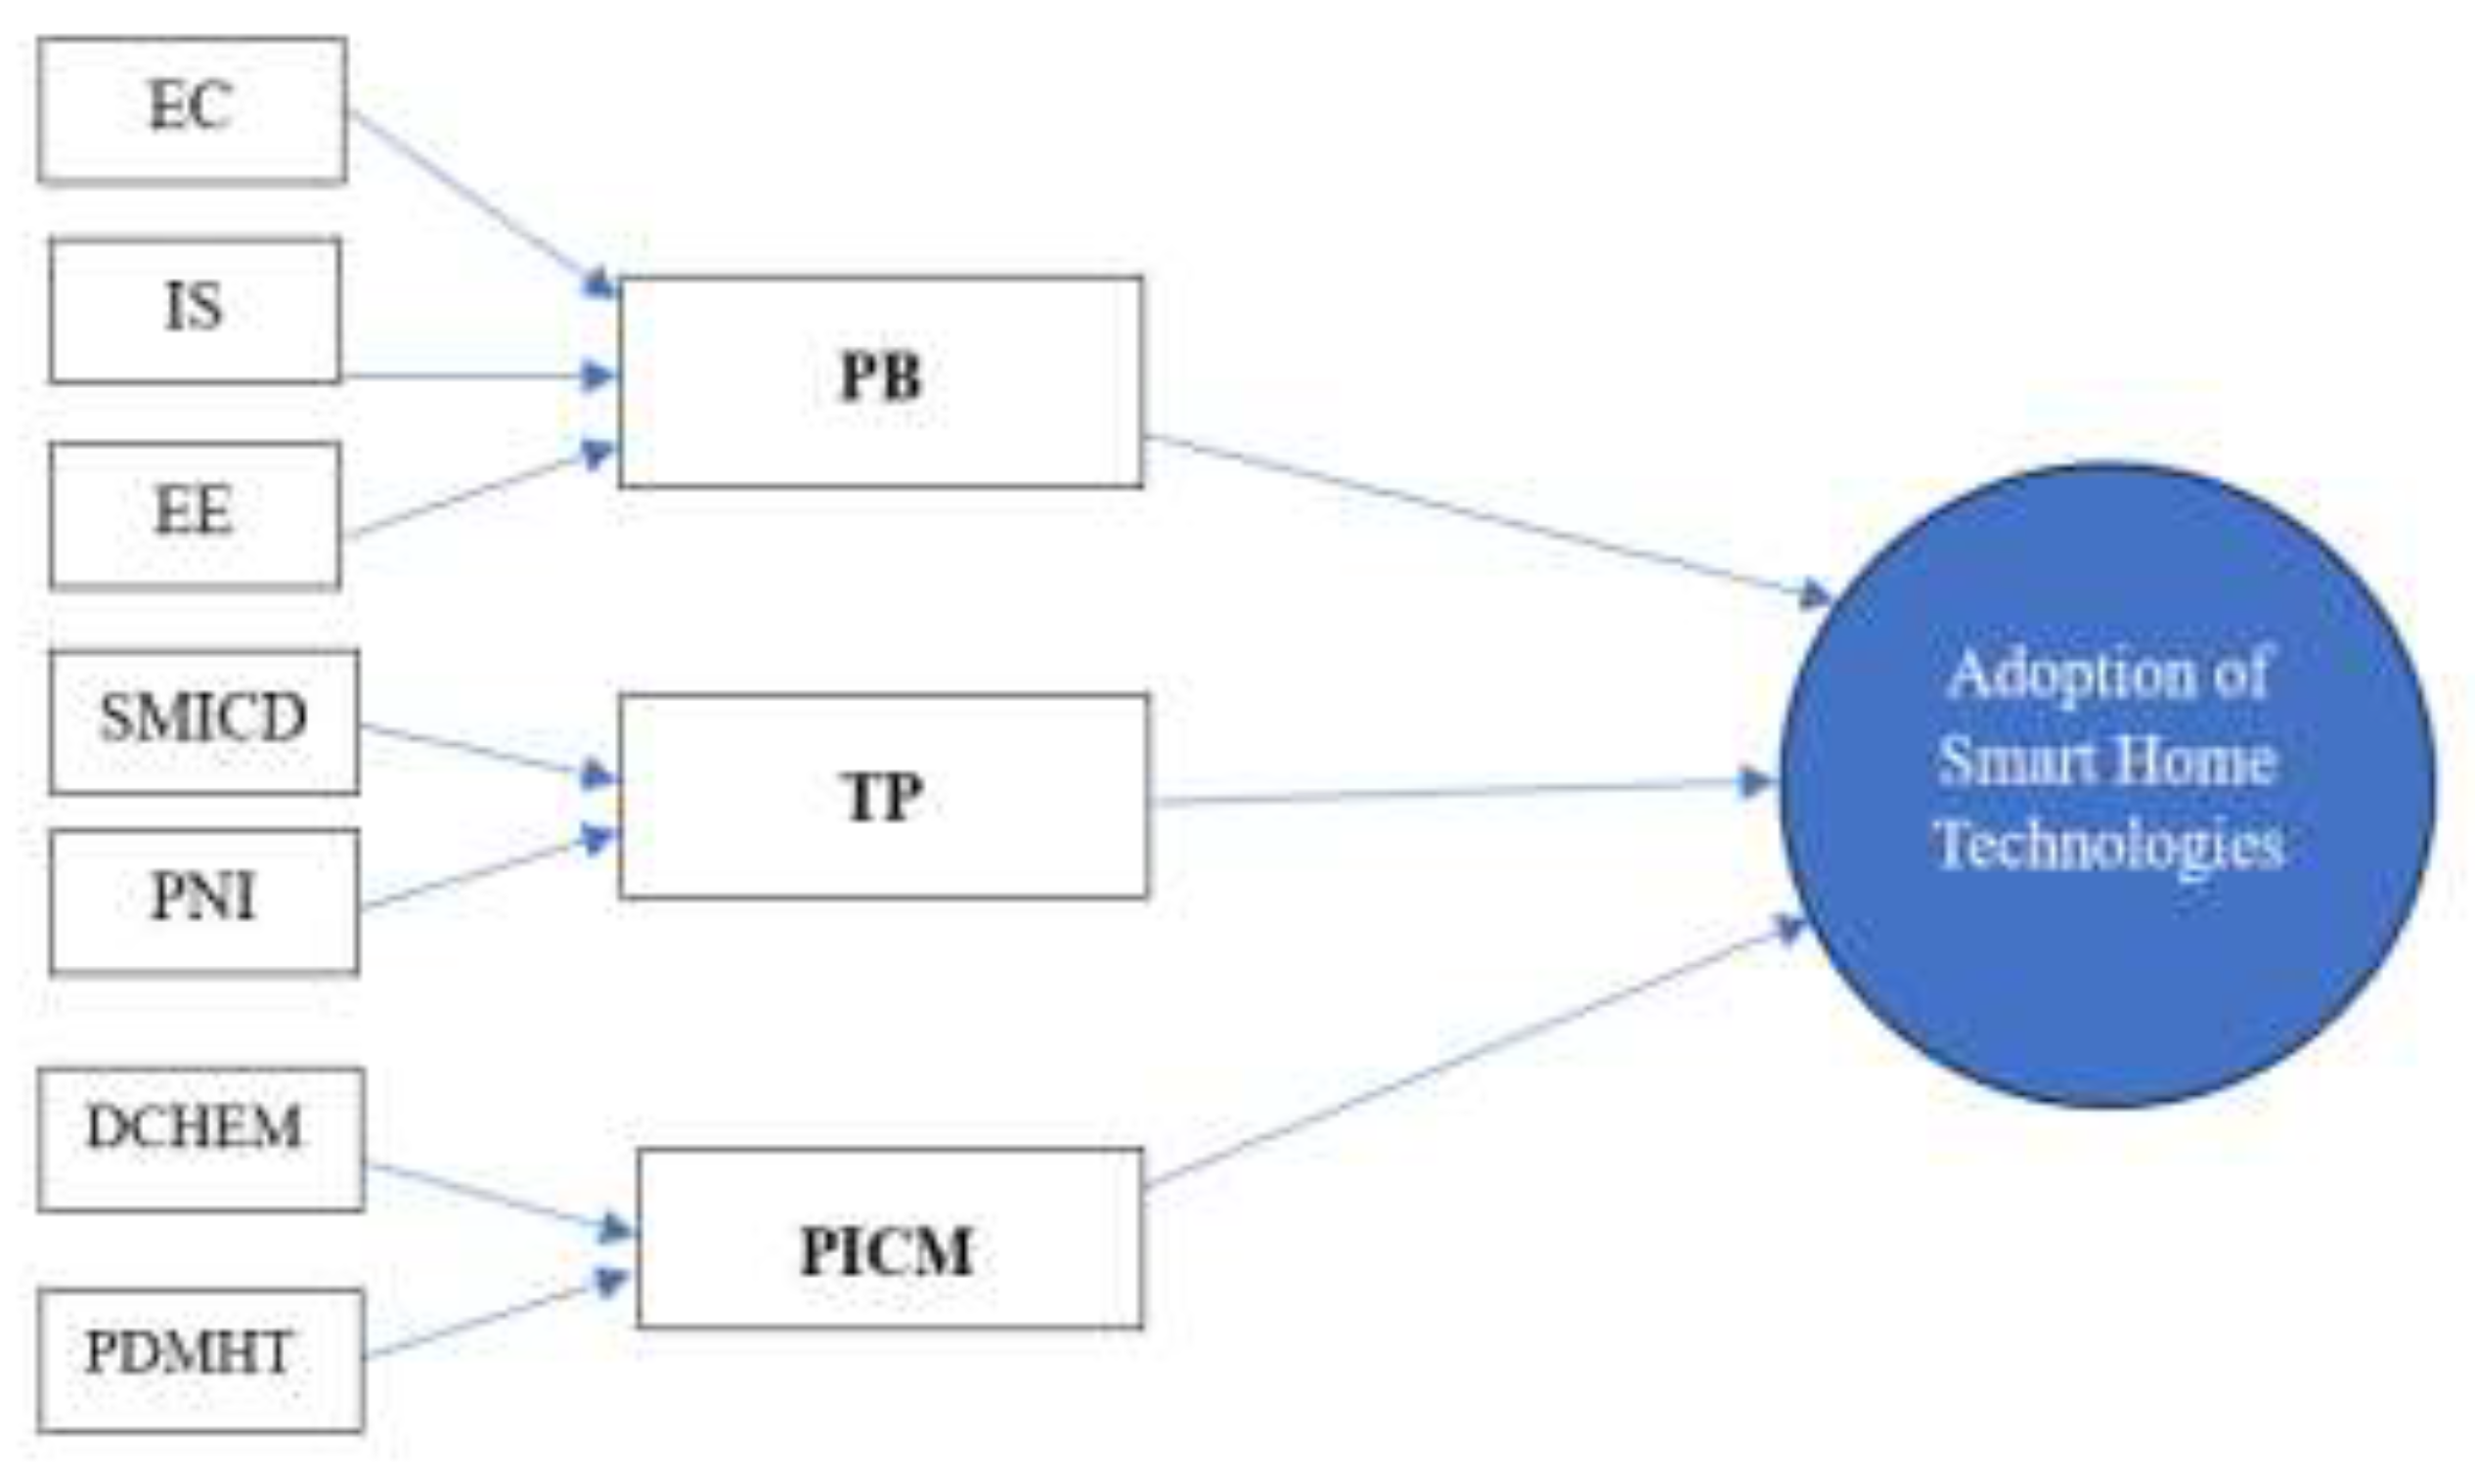
5. Research Model
A research model was developed on the basis of the identified hypotheses to investigate the factors influencing the adoption of smart home technology. The model consists of three main constructs, each representing a hypothesis, along with their respective indicators.
Perceived benefits refers to how individuals subjectively evaluate the advantages of using smart home technology. These benefits include the following.
- Enhanced comfort. Enhance comfort is the perception that smart home technology improves daily comfort and convenience by automating tasks, adjusting environmental settings, and providing personalized experiences.
- Improved security. This belief centers on the idea that smart home technology enhances home security through features such as surveillance cameras, motion sensors, smart locks, and burglar alarms, thereby enhancing feelings of safety.
- Energy efficiency. This perception involves the belief that smart home technology aids in energy conservation by optimizing usage, monitoring consumption, and integrating renewable energy sources, leading to cost savings and environmental benefits.
Perceived benefits are subjective and vary among individuals, preferences, and experiences. Understanding these perceptions is crucial for predicting and explaining adoption behaviors related to smart home technology.
Technical proficiency refers to how skilled and knowledgeable individuals are in handling and understanding Internet-connected devices and information related to smart home technology. This includes the following.
Skill in managing Internet-connected devices. This involves the ability to set up, configure, troubleshoot, and operate various smart home devices such as thermostats, lighting systems, security cameras, and appliances. This proficiency indicator includes the ability to use applications or platforms for controlling and customizing these devices.
Proficiency in navigating information. This refers to the ability to access, evaluate, and use information related to smart home technology, such as product specifications, user manuals, troubleshooting guides, and online resources. This proficiency involves effectively searching for and interpreting information to make informed decisions and resolve technical issues.
Technical proficiency is crucial for determining how ready and able individuals are to adopt smart home services and products. Higher technical proficiency is likely to positively correlate with smart home technology adoption by making it easier to integrate and use smart home technologies. Understanding the technical proficiency of users helps in designing user-friendly interfaces, providing effective technical support, and tailoring marketing strategies to different user segments.
Perceived inadequacy of current methods refers to how individuals view the limitations and inefficiencies of current approaches for managing home energy consumption and household tasks. This perception suggests that traditional methods are not meeting the evolving needs and expectations of modern users. Indicators of this inadequacy include the following.
Dissatisfaction with current home energy management. This involves feelings of dissatisfaction or frustration with how effective, convenient, or cost-effective current methods are for monitoring, controlling, and optimizing energy use. Challenges may include difficulty tracking energy consumption, limited control over energy-intensive devices, and inefficiencies in managing energy expenses.
Perceived difficulty in managing household tasks. This refers to the perception that traditional methods for managing tasks such as cleaning, organizing, scheduling, and coordinating activities are complex, inefficient, or time-consuming. Individuals may find these methods cumbersome, labor-intensive, or inflexible in responding to changing needs and preferences.
This perception of inadequacy motivates individuals to seek alternative solutions, such as smart home technologies, to improve home management. Understanding these perceptions is essential for identifying innovation opportunities, designing effective interventions, and promoting the adoption of smart home technologies that offer tangible benefits and address unmet needs.
Figure 1.
Dependencies of constructs and indicators in research model.
6. Methodology
6.1. Research Design
The study employed a questionnaire survey to obtain primary evidence. Survey data were quantitatively analyzed.
6.2. Data Collection
A survey was conducted in May 2024. Respondents were recruited using convenience sampling. Students of an EMBA course at a university in Taiwan and individuals from the local community were invited to participate. Interested respondents were then sent a link to an online survey that collected responses to items about various aspects of smart home technology adoption, including perceived benefits, technical proficiency, current methods for managing home tasks, and overall satisfaction. The survey consisted of both Likert scale and categorical questions and obtained a comprehensive view of respondent attitudes and behaviors.
6.3. Survey
The survey was designed to collect data related to the following key areas:
Perceived Benefits of Smart Home Technology. Perceptions of comfort, security, and energy efficiency.
Technical Proficiency. Skills in managing Internet-connected devices and navigating information.
Current Methods for Managing Home Tasks. Current methods for managing energy consumption and household tasks.
Likelihood of Adoption. Likelihood of adopting smart home technologies.
6.4. Sample Description
In total, 424 valid responses were collected from a diverse sample of respondents of various ages, educational backgrounds, and income levels. The demographic characteristics of the respondents are summarized in Table 1.
6.5. Respondent Demographic Characteristics
Most respondents were middle-aged. The average age of the respondents was 46.32 years. The respondents were well-educated. Most respondents were cooperative and responsible. The average number of cohabitants was 2.64. The average annual household income was US$ 52,503.85. The average personal income was US$ 32,394.68. Most respondents had a low-to-mid income. Most respondents lived with 3 or more cohabitants, with 37.50% reporting 4 cohabitants. A substantial proportion (36.56%) of the respondents had an annual household income of US$ <33,000, with a declining percentage in higher income brackets. Only 8.02% reported household incomes of US$ >83,000. Half (50.47%) of the respondents owned or co-owned their houses with their spouses, and 30.66% resided in houses owned by their parents or grandparents.
7. Respondent Answers and Analysis
7.1. Respondent Answers
Answers to each of the research constructs are listed in Appendix A-the Summary of Respondent Answers. Analysis of the answers is as follows:
7.2. Analysis of Respondent Answers to Each Construct
7.2.1. Construct A of Perceived Benefits
Question 1: the preference for smart home technologies to enhance comfort was strongly supported by the respondents, with a combined 78.54% either agreeing (60.14%) or strongly agreeing (18.40%) with the statement that smart home technologies are for enhanced comfort. Few respondents did not support this preference.
Question 2: the idea that smart home technologies are a means to improve security was agreed to by 59.20% of the respondents and strongly agreed to by 18.16% of the respondents. Few respondents disagreed with this idea.
Question 3: in total, 61.09% of the respondents either agreed (45.05%) or strongly agreed (16.04%) with the statement that smart home technologies are for energy efficiency. Few respondents disagreed with this statement.
Question 4: in total, 38.44% of the respondents had a neutral perception of the perceived benefits and likelihood of adopting smart home technology. Furthermore, 34.43% agreed with this statement, and 8.73% strongly agreed with this statement. Overall, 43.16% of the respondents had a positive perception. In total, 18.40% of the respondents had a negative perception, with 2.36% strongly disagreeing and 16.04% disagreeing with the statement.
7.2.2. Construct B of Technical Proficiency
Question 1: regarding technical proficiency in managing Internet-connected devices, 54.72% of the respondents identified as heavy users, indicating a high level of familiarity and comfort with technology. Only a small percentage of respondents classified themselves as novice or advanced users, and 8.48% reported having minimal experience.
Question 2: in total, 39.39% of the respondents classified themselves as having an intermediate level of familiarity, 34.43% of the respondents classified themselves as familiar, and 3.77% of the respondents classified themselves as never having touched the technology and finding it difficult.
Question 3: regarding the influence of technical skills on the adoption of smart home technology, 39.15% of the respondents reported that technical skills have a moderate influence, indicating that a foundational level of technical knowledge plays a key role in smart home adoption. Additionally, 27.59% of the respondents stated that technical skills have a very significant effect, and 21.46% of the respondents indicated only a slight influence. The smallest groups, 5.90% each, believed that technical skills either had no influence or were extremely influential. Overall, most respondents (66.74%) fall within a moderate to very much significant range of reliance on these skills for smart home adoption.
7.2.3. Construct C of Perceived Inadequacy of Current Methods
Question 1: regarding methods used for managing energy consumption, traditional approaches dominated. Traditional light and gas switches were the most commonly used methods, with 54.48% of the respondents relying on them. Similarly, energy-saving home appliances were popular, used by 52.83% of the respondents, suggesting a growing awareness of energy-efficient products. Manual thermostat adjustment for air conditioners was also a frequent method, used by 43.63% of the respondents. Conversely, smart home technology products for energy management were the least common, with only 18.40% adoption. No respondents selected the “Other” category, showing a preference for conventional and emerging smart technology methods. This highlights a balance between traditional energy management methods and the gradual adoption of newer, more advanced solutions.
Question 2: most respondents (66.98%) had a neutral sentiment regarding energy consumption management. A combined 10.61% of the respondents reported feeling dissatisfied, and 21.23% of the respondents expressed satisfaction, indicating a relatively small but notable group who were pleased with their energy management strategies. The percentages for “Very Dissatisfied” and “Very Satisfied” were minimal, at 0.47% and 0.71%, respectively. Overall, the findings show that a significant portion of the respondents were neutral. Improvement in energy consumption management to enhance user satisfaction is warranted.
Question 3: regarding perceived operating difficulties in managing household tasks with current methods, most of the respondents experienced at least some level of difficulty. Specifically, 50.71% of the respondents reported feeling “slightly” challenged, indicating a moderate concern regarding their current management methods. Additionally, 16.51% of the respondents expressed a “moderate” level of difficulty, and only small fractions reported being “very much” (0.94%) or “extremely” (0.47%) affected by these difficulties. By contrast, 31.37% of the respondents indicated they do not face difficulties at all. Overall, the findings suggest that many individuals find household task management manageable and a considerable number find it challenging, highlighting an opportunity for improving current methods to enhance efficiency and user experience.
7.2.4. Construct D of Consumer’s Demand, Concern, Buying Role, and Environmental Awareness
Question 1: the primary purpose of using smart home technologies was for intelligent household appliance and energy management, with 49.29% of the respondents saying this was their main motivation. Security management followed as a significant priority for 23.93% of the participants, reflecting concerns about safety in the home environment. By contrast, areas such as smart medicine and health care and digital video and multimedia entertainment attracted less interest, highlighting the dominant focus on energy efficiency and security in smart home technology adoption.
Question 2: concerns around privacy were prevalent, with 48.35% of the respondents expressing a moderate level of worry, and 35.38% indicating they were very much concerned. Only a small percentage, 1.42%, reported feeling not at all concerned, suggesting that privacy remains a significant issue for the majority of participants in relation to smart home technologies.
Question 3: the role of initiator was the most prominent in purchasing smart home technologies, with 37.03% of the respondents identifying as such. Other significant roles included gatekeeper (33.25%) and analyzer (29.01%), reflecting a collaborative decision-making process where multiple stakeholders are involved in the purchasing journey.
Question 4: concerns about energy saving and sustainability were evident among respondents, with 43.16% expressing a slight level of concern and 33.25% indicating a moderate level of concern. Although only a small percentage felt very much or extremely supportive (21.23% combined), the data suggests that a significant portion of participants recognize the importance of energy efficiency and sustainability, highlighting a growing awareness in this area.
8. Hypothesis Testing and Interpretation
Data analysis involved both descriptive and inferential statistics:
Descriptive Statistics. Mean scores and standard deviations were calculated for key variables, including perceived benefits, technical proficiency, and likelihood of adoption.
Inferential Statistics. Correlation and regression analyses were conducted to test the hypotheses. Correlation coefficients were used to assess the strength and direction of relationships between variables. Multiple regression analysis was performed to examine the effect of perceived benefits and technical proficiency on the likelihood of adoption. All three hypotheses were tested using regression analysis.
8.1. Hypothesis 1
User perceptions of the benefits associated with smart home technology, including enhanced comfort, security, and energy efficiency, positively correlated with their likelihood of adoption. For this testing, data from Construct A of the perceived benefits were utilized.
We calculated the correlation coefficients between the likelihood of adoption and each of the three perceptions of benefits. We used the average scores provided to perform this calculation. For simplicity, we assumed the data points for the perceptions of benefits and likelihood of adoption were as follows:
Enhanced comfort (X₁): 3.94
Improved security (X₂): 3.93
Energy efficiency (X₃): 3.69
Likelihood of adoption (Y): 3.31
Enhanced comfort had the highest average score (3.94), indicating that respondents felt most satisfied with how smart home technologies improve their comfort levels. Improved security followed closely, with an average score of 3.93, showing strong agreement on the perception that smart home technologies enhance security. Energy efficiency had a slightly lower average score (3.69), indicating that although respondents recognize the potential for energy savings, their satisfaction with this aspect is slightly less than that for comfort and security. Likelihood of adoption had the lowest average score (3.31), suggesting that although respondents acknowledge the benefits of smart home technologies, they have a more neutral or reserved attitude toward actually adopting these technologies.
8.1.1. Interpretation of Dependence
The data suggest a positive but partial dependence of adoption likelihood on satisfaction with the perceived benefits. Although higher satisfaction with comfort, security, and energy efficiency aligns somewhat with a higher likelihood of adoption, this dependence is not absolute. Despite respondents’ positive perceptions of comfort and security, their likelihood of adopting smart home technology remains moderate.
This indicates potential barriers, such as financial considerations, perceived ease of use, or privacy concerns, that may affect the final decision to adopt smart home technologies. For instance, users may appreciate the benefits but feel hesitant due to installation costs, complexity, or maintenance concerns, which would temper their enthusiasm to adopt.
8.1.2. Regression Analysis
We conducted a regression analysis to evaluate the effect of each predictor on the likelihood of adoption. The general form of this study’s regression model was as follows.
where β0 is the intercept, β1, β2, and β3 are the correlation coefficients, and ϵ (epsilon) is the error term.
Likelihood of Adoption = β0 + β1 (Enhanced Comfort) + β2 (Improved Security) +β3 (Energy Efficiency) + ϵ
The regression outputs are shown in the Table 2.
8.1.3. Regression Summary and Interpretation
Model Fit
The R-squared value is 0.2363, which indicates that 23.63% of the variance in the dependent variable (likelihood of adoption) is explained by the three independent variables: enhanced comfort, improved security, and energy efficiency.
The F-statistic is 43.31 (p < 0.001). This suggests that at least one of the predictors has a significant relationship with the likelihood of adoption.
Individual Predictor Analysis
Intercept. The intercept coefficient is 0.6162 (p = 0.0117), indicating that the baseline likelihood of adoption is statistically significant when all predictors are zero.
Enhanced Comfort (X Variable 1)
Coefficient: 0.4062
Standard Error: 0.0817
T statistic: 4.97
p value: 9.74×10⁻⁷ (significant at p < 0.001)
Interpretation: enhanced comfort has a positive and significant effect on the likelihood of adoption. This suggests that as enhanced comfort increases, the likelihood of adoption also increases, supporting its relevance in predicting adoption likelihood.
Improved Security (X Variable 2)
Coefficient: 0.1140
Standard Error: 0.0828
T statistic: 1.3764
P value: 0.1694 (not significant)
Interpretation: improved security does not have a significant effect on adoption likelihood at the 0.05 significance level. Thus, this factor may not be a strong predictor in influencing the likelihood of adoption.
Energy Efficiency (X Variable 3)
Coefficient: 0.1752
Standard Error: 0.0558
T statistic: 3.1384
p value: 0.0018 (significant at p < 0.01)
Interpretation: energy efficiency has a positive and significant effect on the likelihood of adoption. This implies that increases in energy efficiency are associated with an increased likelihood of adoption, confirming its role as an influential predictor.
8.1.4. Interpretation on Hypothesis 1
Enhanced comfort and energy efficiency are significant predictors of the likelihood of adoption, with positive coefficients and significant p values. This indicates that these two factors play an essential role in predicting adoption. Improved security, however, was not a significant predictor, as indicated by its p value (0.1694), which is higher than the 0.05 threshold.
Hypothesis 1 is partially supported by the regression analysis. The hypothesis is supported for enhanced comfort and energy efficiency because these factors have a positive and significant effect on the likelihood of adoption but is not supported for improved security because this factor does not significantly influence the likelihood of adoption.
This suggests that any strategies to increase the likelihood of adoption should prioritize enhancing comfort and improving energy efficiency and focus less on security features.
8.2. Hypothesis 2
To test Hypothesis 2, we examined whether technical proficiency in managing Internet-connected devices and navigating information were associated with the likelihood of adopting smart home services and products. Here data from Construct B of the technical proficiency were utilized.
The average scores for technical proficiency, user familiarity, and likelihood of adoption were 3.50, 3.27, and 3.06, respectively.
Given these scores, technical proficiency and likelihood of adoption were high. Thus, a strong positive relationship exists, suggesting that higher technical proficiency is associated with a higher likelihood of adopting smart home technology. Hypothesis 2 is supported because the high average scores for both technical proficiency and likelihood of adoption suggest a strong positive correlation, indicating that individuals with higher technical proficiency are more likely to adopt smart home technologies.
8.2.1. Regression Analysis
We examined the relationship between technical proficiency and information navigation proficiency with the likelihood of adopting smart home services and products. The regression outputs are shown in the Table 3.
8.2.2. Regression Model Interpretation
The fitted regression model was as follows.
Likelihood of Adoption = 1.452 + 0.071(Technical Proficiency)
+ 0.415 (Information Navigation Proficiency)
8.2.3. Key Points from the Output
Multiple R (0.435): This indicates a moderate positive correlation between the independent variables (technical proficiency and information navigation proficiency) and the likelihood of adoption.
R Square (0.1899): In total, 18.99% of the variance in the likelihood of adoption is explained by technical proficiency and information navigation proficiency.
Significance F (5.60 × 10⁻²⁰): The model is significant, as indicated by the very low significance level (p < 0.05).
8.2.4. Coefficients and p Values
Intercept (1.452): This is the baseline likelihood of adoption when both technical and information navigation proficiencies are zero.
Technical Proficiency Coefficient (0.071): For each unit increase in technical proficiency, the likelihood of adoption increases by 0.071 units, assuming information navigation proficiency is constant. However, the p value for this variable is 0.284, which is not significant. This suggests that technical proficiency alone does not have a significant effect on adoption likelihood.
Information Navigation Proficiency Coefficient (0.415): For each unit increase in information navigation proficiency, the likelihood of adoption increases by 0.415 units, with technical proficiency held constant. This variable has a very low p value (5.28 × 10⁻¹²), indicating a significant positive effect on adoption likelihood.
8.2.5. Interpretation for Hypothesis 2
The results suggest that information navigation proficiency is a significant predictor of the likelihood of adopting smart home technologies and that technical proficiency (managing Internet-connected devices) is not a significant predictor. Therefore, Hypothesis 2 is only partially supported. Information navigation proficiency contributes to the likelihood of adoption; technical proficiency does not.
In summary, individuals who are proficient in navigating information (such as online research or understanding technology-related information) are more likely to adopt smart home services and products. General technical proficiency does not significantly influence adoption likelihood.
8.3. Hypothesis 3
Hypothesis 3 suggests that individuals who perceive current methods as inadequate are more likely to adopt smart home technologies. To test this, we examined whether the perceived inadequacy of current methods for managing home energy consumption and household tasks was correlated with the adoption of smart home technology.
We drew on data from Construct C and Construct A in the Appendix A.
Average Perceived Inadequacy: 3.11
Average Likelihood of Adoption: 3.31
Covariance and Correlation: Positive, indicating a relationship.
Higher perceived inadequacy in managing home tasks and energy correlates with higher likelihood of adopting smart home technologies. This supports Hypothesis 3, indicating that perceived problems with current methods drive the adoption of smart home technologies.
The same results were revealed in the Table 4:
9. Conclusions
Users generally perceive the benefits of smart home technology, in terms of enhanced comfort, security, and energy efficiency, positively. A strong positive correlation was observed between these perceived benefits and the likelihood of adoption. Additionally, users with higher technical proficiency are more inclined to adopt smart home technologies. Dissatisfaction with current methods for managing home tasks also drives adoption. The findings support all three hypotheses.
Hypothesis 1. A significant correlation between user perceptions of enhanced comfort, security, and energy efficiency and the likelihood of adopting smart home solutions was demonstrated. The strongest correlations were with perceptions of energy efficiency and security, suggesting these benefits should be highlighted in marketing strategies.
Hypothesis 2. Individuals with higher technical proficiency are more likely to adopt smart home technologies. This highlights the importance of training and education to increase adoption rates among users with lower technical proficiency.
Hypothesis 3. Users dissatisfied with current methods for managing home energy consumption and household tasks are more likely to adopt smart home technologies. This suggests that perceived inadequacies in traditional methods drive the desire for more efficient alternatives.
Overall, the findings emphasize the importance of perceived benefits, technical skills, and dissatisfaction with current methods as key factors influencing the adoption of smart home technologies. Marketing strategies should focus on these benefits to increase adoption rates. Additionally, improving user technical skills through education and support can boost adoption. Addressing inadequacies in current methods for managing home energy and household tasks and highlighting how smart home technologies can improve capabilities will likely increase adoption.
10. Contributions, Limitations, and Suggestions
This research uncovers the factors influencing the adoption of smart home technologies, specifically focusing on user perceptions and technical competencies. The study makes several contributions to the understanding of consumer behavior and adoption patterns in the context of smart home technologies in Taiwan. The findings may be useful for researchers and smart home technology manufacturers.
10.1. Theoretical Contributions to the Academic Literature
10.1.1. Theoretical Enrichment
This research provides insights into how perceived benefits, such as enhanced comfort, improved security, and energy efficiency, influence the likelihood that individuals will adopt smart home technology. Comfort and security are the most positively perceived aspects. Users are more likely to adopt smart home technologies when they feel that these products will significantly improve their comfort and security. These outcomes add to the literature by demonstrating the importance of psychological comfort and perceived security. Second, this research bridges the gap between theoretical models of technology acceptance and practical implementation and offers a multidimensional framework to evaluate the effectiveness of smart home systems, focusing on factors such as user behavior, security, and data privacy.
10.1.2. Empirical Evidence
This study used primary data obtained from a survey. In total, 424 valid survey responses were analyzed. The findings of this research enrich the literature by providing empirical evidence related to how buying decisions are influenced in Taiwan. The study also obtained data on new variables for consideration in smart home adoption studies. Privacy expectations, long-term maintenance cost, and environmental sustainability are examples of data obtained in this study that further advance our understanding of consumer buying behaviors.
10.2. Practical Contributions to the Smart Home Technology Industry
10.2.1. Identifying Key Purchasing Factors and Developing a Buying Behavior Model
According to this study, despite positive perceptions of the benefits of smart home technologies, the likelihood of adoption was relatively moderate. This paradox between benefit perception and actual adoption likelihood suggests the presence of additional barriers, such as financial costs, ease of use, and privacy concerns, which are not fully addressed by the benefits alone. The study thus contributes to the smart home technology industry by identifying gaps that may prevent users from embracing smart home technologies. The insights provided by this study can help stakeholders address these adoption barriers more directly, perhaps through user-friendly designs, cost reduction strategies, or enhanced data security measures.
Technical proficiency (ability to manage Internet-connected devices and navigate information) affected the likelihood of adopting smart home technologies. Technical proficiency influences adoption but is not the sole factor influencing adoption; other elements, such as user-friendly interfaces or accessibility, also play important roles. This finding highlights the need for continued innovation in simplifying technology use, making it accessible to users with varying levels of technical skills.
10.2.2. Marketing Strategy and Products/Services Development
This study demonstrated the importance of psychological comfort and perceived security in technology adoption. The findings may guide developers and marketers in this industry to emphasize these aspects in their product development, service offerings, and promotional efforts.
The study also demonstrated the relevance of information navigation proficiency—users’ ability to locate, evaluate, and use information effectively—in the adoption of smart home technologies. With a positive correlation between information navigation proficiency and adoption likelihood, this study suggests that users who are better at handling information are more inclined to adopt smart home technologies. This contribution points to the potential benefits of educational initiatives or information campaigns that enhance users’ abilities to understand and use smart home technology information, thus supporting informed decision-making and potentially boosting adoption rates.
The findings of this study have additional important implications for industry leaders and policymakers. For industry leaders, the research indicates that focusing on enhancing comfort and security features while simplifying device operation could increase user satisfaction and adoption rates. Moreover, addressing perceived barriers such as cost and privacy concerns may help convert favorable perceptions into actual adoption behaviors. Policy makers should increase public awareness and provide educational resources to enhance information navigation and technical proficiency, thereby boosting smart home technology adoption.
This study also delivers practical value to the smart home technology industry in Taiwan by identifying key trends in consumer preferences, adoption barriers, and critical success factors. It provides industry stakeholders with actionable insights into improving product design, enhancing user interfaces, and strengthening security protocols. The research further contributes to understanding the role of interoperability between different smart home devices, highlighting the importance of cross-platform compatibility to increase consumer satisfaction and market penetration.
The study contributes insights that can lead to the development of consumer segments based on demographics or psychographics, thereby enhancing targeted marketing strategies.
10.3. Contributions to Our Society and Environmental Sustainability
The study’s insights could increase public interest in smart homes, leading to higher adoption rates, improving quality of life, and boosting development in the smart home technology industry.
Given the increasing awareness in recent decades of the need to care for the environment, smart home products that are environmentally friendly can positively influence purchase decisions. This study shows that consumers’ environmental awareness affects their buying behavior. The study highlights how smart home technology can improve quality of life while promoting sustainable development. Specifically, more than 50% of the respondents are concerned about energy saving and sustainability, suggesting that the smart home technology industry should incorporate more green technology into their products to meet the needs of environmentally conscious consumers.
10.4. Limitations
Several limitations of this study should be noted. First, the survey was conducted only in northern and central Taiwan and only in urban areas, and the sample size is small. The sample may not be fully representative of Taiwan’s smart home consumer market. Second, the rapid evolution of smart home technologies may make the findings obsolete. Third, the study primarily focuses on consumer behavior and does not cover all technical or engineering aspects of smart home systems. Finally, limited access to proprietary industry data restricted the study’s scope in addressing specific commercial and marketing strategies.
10.5. Suggestions for Future Research
Longitudinal studies should be conducted to investigate long-term user behavior and the effect of smart home systems on energy consumption and quality of life. Qualitative in-depth interviews with experienced users and major providers of smart home technologies may be useful for obtaining more comprehensive insights into user adoption behaviors. Examining smart home adoption in different cultural and socioeconomic contexts could achieve a broader understanding of global trends and consumer needs.
Author Contributions
Conceptualization, J.Y.L. and C.C.C.; methodology, J.Y.L; software, J.Y.L.; validation, C.C.C.; formal analysis, J.Y.L.; investigation, J.Y.L.; resources, J.Y.L.; data curation, J.Y.L.; writing—original draft preparation, J.Y.L.; writing—review and editing, J.Y.L. and C.C.C.; visualization, J.Y.L.; supervision, C.C.C.; project administration, J.Y.L.; funding acquisition, J.Y.L. All authors have read and agreed to the published version of the manuscript.
Funding
This research received no external funding. The author did not receive any specific grant from funding agencies in the public, commercial, or not-for-profit sectors.
Institutional Review Board Statement
Accepted by advisory professor panel with statement of relevant to research domain and satisfactory manuscript writing, acceptance: Dec. 24, 2024.
Informed Consent Statement
Informed consent was obtained from all subjects involved in the study.
Data Availability Statement
All research data are available by the author.
Acknowledgments
This manuscript was edited by Wallace Academic Editing.
Conflicts of Interest
The author declare there are no conflict of interest.
Abbreviations
Appendix A

Table A1.
Summary of respondent answers.
| Construct | ||
| Question (Variable) | Sample (n = 424) | Percent (%) |
| ||
| How do you perceive the benefits associated with smart home technology in terms of enhanced comfort, security, and energy efficiency? | ||
| ||
| Strongly Disagree | 5 | 1.18 |
| Disagree | 2 | 0.47 |
| Neutral | 84 | 19.81 |
| Agree | 255 | 60.14 |
| Strongly Agree | 78 | 18.40 |
| ||
| Strongly Disagree | 4 | 0.94 |
| Disagree | 4 | 0.94 |
| Neutral | 88 | 20.76 |
| Agree | 251 | 59.20 |
| Strongly Agree | 77 | 18.16 |
| ||
| Strongly Disagree | 5 | 1.18 |
| Disagree | 24 | 5.66 |
| Neutral | 136 | 32.07 |
| Agree | 191 | 45.05 |
| Strongly Agree | 68 | 16.04 |
| ||
| Strongly Disagree | 10 | 2.36 |
| Disagree | 68 | 16.04 |
| Neutral | 163 | 38.44 |
| Agree | 146 | 34.43 |
| Strongly Agree | 37 | 8.73 |
| ||
| ||
| Almost Never Touched | 18 | 4.24 |
| Novice | 18 | 4.24 |
| Intermediate | 138 | 32.55 |
| Heavy User | 232 | 54.72 |
| Advanced | 18 | 4.25 |
| ||
| Never touched before, difficult | 16 | 3.77 |
| Novice but shall be able to | 63 | 14.86 |
| Intermediate | 167 | 39.39 |
| Familiar | 147 | 34.43 |
| Advanced | 32 | 7.55 |
| ||
| Not at all | 25 | 5.90 |
| Slightly | 91 | 21.46 |
| Moderately | 166 | 39.15 |
| Very much | 117 | 27.59 |
| Extremely | 25 | 5.90 |
| ||
| ||
| Traditional light and gas switches | 231 | 54.48 |
| Conventional home appliances | 164 | 38.68 |
| Manual thermostat adjustment | 185 | 43.63 |
| air conditioner | ||
| Energy-saving home appliances | 224 | 52.83 |
| Smart home technology products | 78 | 18.40 |
| (e.g., automatic lighting, gas detection, etc.) | ||
| Others | 0 | 0 |
| ||
| Very Dissatisfied | 2 | 0.47 |
| Dissatisfied | 45 | 10.61 |
| Neutral | 248 | 66.98 |
| Satisfied | 90 | 21.23 |
| Very Satisfies | 3 | 0.71 |
| ||
| Not at all | 133 | 31.37 |
| Slightly | 215 | 50.71 |
| Moderately | 70 | 16.51 |
| Very much | 4 | 0.94 |
| Extremely | 2 | 0.47 |
| ||
| ||
| Security Management | 101 | 23.93 |
| Intelligent Household Appliance and Energy Management | 208 | 49.29 |
| Smart Medicine and Healthcare | 60 | 14.22 |
| Digital Video and Multimedia | 53 | 12.56 |
| Entertainment | ||
| Others | 0 | 0 |
| ||
| Extremely | 26 | 6.13 |
| Very Much | 150 | 35.38 |
| Moderately | 205 | 48.35 |
| Slightly | 37 | 8.73 |
| Not at all | 6 | 1.41 |
| ||
| Initiator, suggesting purchase | 157 | 37.03 |
| Analyser, inquiry about quotation | 123 | 29.01 |
| Gatekeeper, information provider | 141 | 33.25 |
| Influencer, professional knowledge | 111 | 26.18 |
| Decider, payer | 107 | 25.24 |
| Buyer, purchasing handler | 95 | 22.41 |
| User, beneficiary | 123 | 29.01 |
| ||
| Not at all | 10 | 2.36 |
| Slightly | 183 | 43.16 |
| Moderately | 141 | 33.25 |
| Very much Supportive | 80 | 18.87 |
| Extremely Supportive | 10 | 2.36 |
References
- Aldrich, F. Smart homes: Past, present and future. In Inside the Smart Home, Harper, R., Ed.; Springer Verlag: Berlin, 2003; pp. 17–36. [Google Scholar]
- Pliatsikas, P.; Economides, A.A. Factors influencing intention of Greek consumers to use smart home technology. Appl. Syst. Innov. 2022, 5, 26. [Google Scholar] [CrossRef]
- Ghaffarianhoseini, A.; Tookey, J.; Omrany, H.; Fleury, A.; Naismith, N.; Ghaffarianhoseini, M. The essence of smart homes: application of intelligent technologies towards smarter urban future. 2016. [CrossRef]
- Rock, L.Y.; Tajudeen, F.P.; Chung, Y.W. Usage and impact of the internet-of-things-based smart home technology: a quality-of-life perspective. Univ. Access. Inf. Soc. 2023, 23, 345–364. [Google Scholar] [CrossRef] [PubMed]
- Peek, S.T.; Wouters, E.J.; van Hoof, J.; Luijkx, K.G.; Boeije, H.R.; Vrijhoef, H.J. Factors influencing acceptance of technology for aging in place: a systematic review. Int. J. Med. Inform. 2014, 83, 235–248. [Google Scholar] [CrossRef] [PubMed]
- Robles, R.J.; Kim, T.H. Applications, systems and methods in smart home technology: a review. Int. J. Adv. Sci. Technol. 2010, 15, 37–47. [Google Scholar]
- Alam, M.R.; Reaz, M.B.I.; Ali, M.A.M. A review of smart homes— past, present, and future. IEEE Trans. Syst. Man Cybern. Part C (Appl. Rev). 2012, 42, 1190–1203. [Google Scholar] [CrossRef]
- Marikyan, D.; Papagiannidis, S.; Alamanos, E. Smart home sweet smart home: an examination of smart home acceptance. Int. J. E-Bus. Res. 2021, 17, 1–24. [Google Scholar] [CrossRef]
- Denning, T.; Kohno, T.; Levy, H. . Computer security and the modern home. Commun. ACM 2013, 56, 94–103. [Google Scholar] [CrossRef]
- Lashkari, B.; Chen, Y.; Musilek, P. Energy management for smart homes—state of the art. Appl. Sci. 2019, 9, 3459. [Google Scholar] [CrossRef]
- Davis, F.D. Perceived usefulness, perceived ease of use, and user acceptance of information technology. MIS Q. 1989, 13, 319–340. [Google Scholar] [CrossRef]
- Rogers, E.M. Diffusion of Innovations, 5th ed.; Free Press: New York, NY, USA, 2003. [Google Scholar]
- Liu, L.; Stroulia, E.; Nikolaidis, I.; Miguel-Cruz, A.; Rincon, A.R. Smart homes and home health monitoring technologies for older adults: a systematic review. Int. J. Med. Inf. 2016, 91, 44–59. [Google Scholar] [CrossRef]
- Korneeva, E.; Olinder, N.; Strielkowski, W. Consumer attitudes to the smart home technologies and the Internet of Things (IoT). Energies 2021, 14, 7913. [Google Scholar] [CrossRef]
- Martin, S.; Kelly, G.; Kernohan, W.G.; McCreight, B.; Nugent, C. Smart home technologies for health and social care support. Cochrane Database Syst. Rev. 2008. [Google Scholar] [CrossRef] [PubMed]
- Zin, K.S.L.T.; Kim, S.; Kim, H.-S.; Feyissa, I.F. A study on technology acceptance of digital healthcare among older Korean adults using extended tam (extended technology acceptance model). Adm. Sci. 2023, 13, 42. [Google Scholar] [CrossRef]
- Boer, P.S.; van Deursen, A.J.; van Rompay, T.J. Accepting the internet-of-things in our homes: the role of user skills. Telematics Inform. 2019, 36, 147–156. [Google Scholar] [CrossRef]
- Alexander, A.J.; van der Zeeuw, A.; de Boer, P.; Jansen, G.; van Rompay, T. Development and validation of the Internet of Things Skills Scale (IoTSS). Inform. Commun. Soc. 2022, 25, 1883–1899. [Google Scholar] [CrossRef]
- Kowalski, J.; Biele, C.; Krzysztofek, K. Smart home technology as a creator of a super-empowered user. In International Conference on Intelligent Human Systems Integration, Springer: Cham, Germany, 2019; pp. 175–180.
- Bradfield, K.; Allen, C. User perceptions of and needs for smart home technology in South Africa. In Advances in Informatics and Computing in Civil and Construction Engineering, Springer: Cham, German, 2019; pp. 255–262.
- Wang, X.; McGill, T.J.; Klobas, J.E. I want it anyway: consumer perceptions of smart home devices. J. Comput. Inform. Syst. 2020, 60, 437–447. [Google Scholar] [CrossRef]
- Chien, K.M.; Luor, T.Y.; Wu, T.C.; Lu, H.P. Trends and contribution for smart home research: an assessment of academic articles from 1997-2010. Adv. Mater. Res. 2011, 219, 1201–1210. [Google Scholar] [CrossRef]
Lin (Capacity) Jung-Yi is a doctoral candidate at the College of Management, National Taipei University of Technology (NTUT). His primary research interests include business marketing and the electronic industry. In 1992, he founded Forttek Security, Inc., a professional security company specializes in the integration, installation, and maintenance of surveillance recording, access control, and burglar alarm systems (website: www.forttek.com.tw). In 2023, he enthusiastically embarked on this project “Factors influencing consumer buying behavior for smart home technologies”, his future research plan will focus on innovative marketing strategy in Taiwan’s electronic industry. Lin holds a bachelor’s degree from the Department of Electronic Engineering at Taipei Institute of Technology (formerly NTUT), and a Master of Business Administration through distance learning at the University of Leicester in England. He was also the valedictorian of the Executive MBA program at NTUT. Prior to establishing Forttek, he held several positions, including Supervisor of the Engineering Department at Senior Electronics (an LED factory), Supervisor of the Assembly Section at Auva Electronics (a computer factory), and Business Development Manager at Guardforce Security, Taiwan.
Table 1.
Respondent demographic characteristics.
| Item | ||
| Factor | Sample (n = 424) | Percent (%) |
| Gender | ||
| Male | 231 | 54.48 |
| Female | 193 | 45.52 |
| Age | ||
| ≤30 years | 41 | 9.67 |
| 31–45 years | 168 | 39.62 |
| 46–60 years | 165 | 38.92 |
| >60 years | 50 | 11.79 |
| Education | ||
| High school or below | 58 | 13.68 |
| Associate bachelor’s degree | 62 | 14.62 |
| Bachelor’s degree | 181 | 42.69 |
| Master’s degree | 114 | 26.89 |
| Doctoral degree | 9 | 2.12 |
| Personality | ||
| Extraverted | 41 | 9.67 |
| Agreeable | 193 | 45.52 |
| Conscientious | 105 | 24.76 |
| Emotionally stable | 53 | 12.50 |
| Neurotic | 20 | 4.72 |
| Open to experiences | 12 | 2.83 |
| Occupation | ||
| Executive/top management | 27 | 6.57 |
| Middle management | 56 | 13.63 |
| First-line management | 53 | 12.89 |
| Non managerial staff/employee | 230 | 55.96 |
| Housewife, retiree | 43 | 10.46 |
| Student | 2 | 0.49 |
| Annual personal income | ||
| US$ ≤23,000 | 204 | 48.11 |
| US$ 23,001–33,000 | 102 | 24.06 |
| US$ 33,001–50,000 | 70 | 16.51 |
| US$ 50,001–70,000 | 20 | 4.72 |
| US$ >70,000 | 28 | 6.60 |
| Number of cohabitants | ||
| 0 | 41 | 9.67 |
| 1 | 60 | 14.15 |
| 2 | 69 | 16.27 |
| 3 | 95 | 22.41 |
| 4 | 159 | 37.50 |
| Annual household income | ||
| US$ <33,000 | 155 | 36.56 |
| US$ 33,000–46,000 | 108 | 25.47 |
| US$ 46,001–63,000 | 69 | 16.27 |
| US$ 63,001–83,000 | 58 | 13.68 |
| US$ >83,000 | 54 | 8.02 |
| Ownership of house | ||
| Leasing, your landlord | 58 | 13.68 |
| Your relative or friend | 22 | 5.19 |
| Your grandparents or parents | 130 | 30.66 |
| Your spouse or yours | 214 | 50.47 |
| Others | 0 | 0 |
Table 2.
Regression output for hypothesis 1.
| SUMMARY OUTPUT | ||||||||
| Regression Statistics | ||||||||
| Multiple R | 0.486083884 | |||||||
| R Squared | 0.236277543 | |||||||
| Adjusted R Square | 0.230822382 | |||||||
| Standard Error | 0.810102518 | |||||||
| Observations | 424 | |||||||
| ANOVA | ||||||||
| df | SS | MS | F | Significance F | ||||
| Regression | 3 | 85.27390253 | 28.42463418 | 43.31266632 | 2.09318E-24 | |||
| Residual | 421 | 275.6317578 | 0.65626609 | |||||
| Total | 424 | 360.9056604 | ||||||
| Coefficients | Standard Error | t Stat | P-value | Lower 95% | Upper 95% | Lower 95.0% | Upper 95.0% | |
| Intercept | 0.616179386 | 0.243213883 | 2.533487715 | 0.011656116 | 0.138111297 | 1.094247474 | 0.138111297 | 1.094247474 |
| X Variable 1 (Enhanced Comfort) | 0.406218228 | 0.08172585 | 4.970498648 | 9.74386E-07 | 0.245575585 | 0.566860871 | 0.245575585 | 0.566860871 |
| X Variable 2 (Improved Security) | 0.113960964 | 0.082795521 | 1.376414601 | 0.169426659 | -0.04878 4254 |
0.276706182 | -0.04878 4254 |
0.276706182 |
| X Variable 3 (Energy Efficiency) | 0.1752104 | 0.055827152 | 3.138444203 | 0.001818232 | 0.065474972 | 0.284945828 | 0.065474972 | 0.284945828 |
Table 3.
Regression outputs for hypothesis 2.
| SUMMARY OUTPUT | ||||||||
| Regression Statistics | ||||||||
| Multiple R | 0.435766047 | |||||||
| R Square | 0.189892048 | |||||||
| Adjusted R Square | 0.186043554 | |||||||
| Standard Error | 0.884321683 | |||||||
| Observations | 424 | |||||||
| ANOVA | ||||||||
| df | SS | MS | F | Significance F | ||||
| Regression | 2 | 77.1732 | 38.5866 | 49.34191 | 5.60118E-20 | |||
| Residual | 421 | 329.2325 | 0.782025 | |||||
| Total | 423 | 406.4057 | ||||||
| Coefficients | Standard Error | t Stat | P-value | Lower 95% | Upper 95% | Lower 95.0% | Upper 95.0% | |
| Intercept | 1.452480039 | 0.194083 | 7.483814 | 4.26E-13 | 1.070987908 | 1.833972 | 1.070988 | 1.83397217 |
| X Variable 1 (Technical Proficiency) | 0.071344208 | 0.066509 | 1.072693 | 0.284023 | -0.05938 7757 |
0.202076 | -0.05939 | 0.202076173 |
| X Variable 2 (Information Navigation proficiency) | 0.415379214 | 0.058489 | 7.101895 | 5.28E-12 | 0.300413345 | 0.530345 | 0.300413 | 0.530345083 |
Table 4.
Regression outputs for hypothesis 3.
| SUMMARY OUTPUT | ||||||||
| Regression Statistics | ||||||||
| Multiple R | 0.450882577 | |||||||
| R Square | 0.203295098 | |||||||
| Adjusted R Square | 0.197604349 | |||||||
| Standard Error | 0.827410344 | |||||||
| Observations | 424 | |||||||
| ANOVA | ||||||||
| df | SS | MS | F | Significance F | ||||
| Regression | 3 | 73.37035159 | 24.45678386 | 35.7237839 | 1.3959E-20 | |||
| Residual | 420 | 287.5353088 | 0.684607878 | |||||
| Total | 423 | 360.9056604 | ||||||
| Coefficients | Standard Error | t Stat | P-value | Lower 95% | Upper 95% | Lower 95.0% | Upper 95.0% | |
| Intercept | 1.583397931 | 0.193294452 | 8.191636706 | 3.1353E-15 | 1.203452888 | 1.963342974 | 1.203452888 | 1.963342974 |
| X Variable 1 | 0.117223074 | 0.06231416 | 1.88116272 | 0.06064129 | -0.005263 401 |
0.23970955 | -0.005263 401 |
0.23970955 |
| X Variable 2 | 0.101836046 | 0.057909782 | 1.758529248 | 0.07938575 | -0.011993 06 |
0.215665152 | -0.011993 06 |
0.215665152 |
| X Variable 3 | 0.321416944 | 0.045600502 | 7.048539578 | 7.4662E-12 | 0.231783307 | 0.41105058 | 0.231783307 | 0.41105058 |
Disclaimer/Publisher’s Note: The statements, opinions and data contained in all publications are solely those of the individual author(s) and contributor(s) and not of MDPI and/or the editor(s). MDPI and/or the editor(s) disclaim responsibility for any injury to people or property resulting from any ideas, methods, instructions or products referred to in the content. |
© 2025 by the authors. Licensee MDPI, Basel, Switzerland. This article is an open access article distributed under the terms and conditions of the Creative Commons Attribution (CC BY) license (https://creativecommons.org/licenses/by/4.0/).
Copyright: This open access article is published under a Creative Commons CC BY 4.0 license, which permit the free download, distribution, and reuse, provided that the author and preprint are cited in any reuse.


