
Submitted:
10 February 2025
Posted:
11 February 2025
You are already at the latest version
Abstract
The Mg-Y-Zn magnesium alloy system is known for the presence of Long-Period Stacking Ordered (LPSO) phases that improves strength and ductility with minimal amounts of alloying elements. Even better improvements are associated with the specific microstructure known as the Mille-Feuille structure (MFS) that can occur in this alloy as well after proper heat treatment. This study systematically compares the traditional ingot metallurgy method with the Bridgman method (slow cooling), coupled with diverse heat treatments and extrusion process. Microscopic analyses reveal variations in the presence of LPSO phases, Mille-Feuille structure, and especially grain size, leading to divergent mechanical and corrosion properties. The Bridgman approach surprisingly stands out, ensuring superior mechanical properties due to kink and texture strengthening.
Keywords:
slow solidification
; extrusion
; kink
; mechanical properties
; Mille-Feuille
; corrosion
1. Introduction
Magnesium materials are being developed to achieve optimal mechanical and corrosion properties to fulfill their intended functions effectively. In industrial applications, magnesium serves as a lightweight construction material [1], while in medicine, it is utilized for biodegradable implants due to its biocompatibility [2]. Both applications require materials with high strength and reasonable ductility. For biodegradable implants, corrosion resistance is crucial to prevent excessive hydrogen release, which could hinder the healing process [3]. In contrast, for the aviation industry, enhanced ignition resistance is a critical factor [4,5]. These properties can be improved through appropriate alloying strategies.
Rare earth elements are a suitable choice for alloying magnesium, as they can be dissolved and improve mechanical properties through solid solution strengthening and intermetallic phase formation. These phases have electrochemical potentials similar to that of the magnesium matrix, making them less problematic from a corrosion perspective. Additionally, yttrium, for example, concentrates in the corrosion products as Y2O3 or Y(OH)3, which are hardly soluble and act as barriers to further corrosion, significantly enhancing the ignition temperature [6,7]. Rare earth elements also have the added benefit of weakening the texture after deformation, replacing it with a more favorable
"rare-earth" texture, which exhibits less asymmetry compared to the typical basal texture. Even better mechanical properties can be achieved by combining rare earth elements with other alloying elements such as zinc. This is particularly advantageous in Mg-Y-Zn alloys due to the presence of long-period stacking ordered (LPSO) phases, which enable these materials to achieve exceptional mechanical properties [8].
These phases exhibit a distinctive long-range periodic arrangement of atoms along the basal planes, typically spanning several nanometers, which endows the material with unique mechanical properties. Extensive research has demonstrated that LPSO phases significantly enhance both strength and ductility [9,10,11,12,13]. The formation of these phases is closely related to the reduction of stacking fault energy due to the synergistic effects of Y and Zn [14,15,16,17], the formation of Zn6Y8 clusters [18,19,20,21,22,23], and the stability of the face-centered cubic (fcc) structure coexisting with the hexagonal close-packed (hcp) structure due to the glide of the basal plane with Shockley partial dislocations [14,15,24,25]. Various types of LPSO phases, including 10H, 14H, 18R, and 24R, have been observed, indicating rhombohedral or hexagonal lattice structures with different atomic distances between layers, with 14H being identified as the most stable configuration [19,26,27]. In addition to the Mg-Y-Zn alloying system, LPSO phases have been observed in other alloying systems containing combinations of rare earth elements such as Sm, Gd, Tb, Dy, Ho, Er, or Tm with other metallic elements such as Al, Co, Ni, or Cu [28,29].
LPSO structures can form a specific microstructure known as Mille-Feuille (MF) [30,31,32]. This structure is characterized by the occurrence of irregular LPSO layers within the Mg grain. A single LPSO layer, described as a cluster-arranged layer (CAL) composed of Zn6Y8 clusters, was identified by Kawamura et al. [32]. Multiple CALs with up to 5 atomic layers of Mg between them are referred to as cluster-arranged nanoplates (CANaPs). When multiple CANaPs occur within an Mg grain with more than 5 atomic layers of Mg between them, they form the MF structure. This structure can be obtained through proper heat treatment, which involves dissolving yttrium and zinc into the Mg solid solution followed by quenching to create a supersaturated solid solution. Greater supersaturation can be achieved through rapid solidification processes. Subsequent aging leads to the precipitation of CALs within stacking faults, forming the MF structure. This structure is advantageous as it combines the benefits of hard intermetallic phases and a soft Mg matrix [33]. The dispersion (quantity of CANaPs per unit distance) of CANaPs peaks after a specific aging duration, while their thickness gradually increases with aging time [32]. Studies have shown that yield strength is significantly influenced by CANaP dispersion, with no notable dependence on their thickness. Jian et al. investigated the influence of stacking fault (SF) density and proposed a dependency similar to the Hall-Petch relation, expressed in the form of Equation (1).
σ0.2 = σa + k·d-1
Where σa represents the flow stress resulting from all strengthening mechanisms apart from parallel stacking faults, k is a material constant, and d is the mean spacing between stacking faults (SFs). Consequently, a higher density of SF structures contributes to increased strengthening [34].
Nevertheless, mechanical properties after heat treatment alone remain suboptimal, necessitating thermomechanical processing. Strength enhancement in magnesium alloys is achieved through mechanisms such as solid solution strengthening, the Hall-Petch relation, dispersion strengthening, and texture strengthening [17]. The behavior of a microstructure containing LPSO phases, MF structure, or a rich solid solution during extrusion is distinct, leading to varied final properties dependent on both the initial microstructure and extrusion conditions. Numerous publications highlight the advantageous properties resulting from rapid solidification or the utilization of metal powders for compaction, as opposed to traditional cast ingots [8,35,36]. Rapid solidification methods are beneficial due to the swift cooling process, resulting in supersaturated solid solutions and the formation of very fine grains. However, challenges may arise concerning particle consolidation, such as the presence of oxides on the surface or potential alterations to the microstructure due to elevated temperatures during consolidation.
Extrusion, the most common processing method for magnesium, is closely tied to dynamic recrystallization (DRX) enhanced by the particle-stimulated nucleation mechanism [37]. Consequently, a fine-grained material is achieved, and strength is improved in accordance with the Hall-Petch relation. However, depending on the extrusion conditions, regions with non-recrystallized grains are typically present. In magnesium materials, there is a tendency for basal planes to align parallel with the extrusion direction, resulting in a strong basal texture in worked grains [38]. This texture is usually associated with significant asymmetry in compressive yield strength (CYS) and tensile yield strength (TYS) due to the lower energy requirement for twinning than the slip mechanism, as compression readily induces twinning while tension suppresses it [39,40]. Although DRX grains may also exhibit basal texture, twinning becomes more challenging with reduced grain size [41]. LPSO and MF structures impede non-basal slip dislocations [17].
The MF structure utilizes a unique deformation mechanism known as kinking, which suppresses twinning and results in low asymmetry of mechanical properties [17]. Additionally, during extrusion, the MF structure introduces kinks into the material, contributing to kink strengthening [32,40]. A higher dispersion of kinks correlates with increased strength [32]. Therefore, easier kinking during extrusion may result in higher strength. Kinking occurs more readily in larger grains with favorable orientation. An alternative method for maximizing kink strengthening might involve the opposite of rapid solidification – slow solidification, which produces very large grains that are conducive to kink strengthening.
Researchers commonly focus on rapid solidification methods to enhance mechanical properties compared to casting as was demonstrated in a recent study [42]. In contrast this follow-up paper investigates the effect of the opposite process, slow solidification, providing an insight into the deformation behavior of large-grained Mg-2Y-1Zn alloy prepared by the Bridgman method. Large grains with MF structure are prone to kinking when favorably oriented, thereby promoting greater strengthening after deformation. Thus, extrusion introduces a high density of kinks into microstructure, further improving mechanical properties. Various heat treatments produce distinct microstructures containing LPSO phases or MF structures, which profoundly impact the final properties following extrusion.
- Materials and methods Material preparation
- Microstructure characterization
- Corrosion properties
- Ignition temperature
- Mechanical properties
Alloy with composition of Mg-2Y-1Zn (wt. %) was prepared by melting of pure elements in induction furnace at 750 °C under protective argon atmosphere. The material contained minimal amount of impurities (40 ppm Fe, 10 ppm Cu, 20 ppm Ni) according to ICP. The melt was casted into steel mold with 20 mm in diameter (I). Twelve ingots with the same final composition (2 ± 0.1 wt.% Y, 1 ± 0.1 wt.% Zn) were prepared. Six ingots were remelted using Bridgman technique (Figure 1) in order to prepare material with very large grains. This technique involves the slow descent of carbon vessel (11 mm·h-1) with a lid with a small hole through a heating zone set at 700 °C, causing the material to re-melt. The process was carried out under an argon atmosphere at 1.75 bar, ensuring minimal volatilization and preserving constant composition after re-melting. These materials are further denoted as Bridgman samples (B). Subsequently four casted ingots and four Bridgman ingots were heat treated at 525 °C for 8 hours finished with quenching in water (T4). Two of each solution treated ingots were subsequently aged at 350 °C for 12 hours (T6). These six differently treated ingots were characterized in their current state and then extruded at the temperature of 400 °C with an extrusion ratio of 17.5 and ram speed of 2 mm·s-1 (Ex).
For microstructure characterization the samples were ground on the SiC papers P80-P4000, afterward, they were polished on diamond pastes 3 µm and 1 µm. The final polishing was performed on the Eposil F suspension. Samples were etched in the solution of 4.2 g picric acid, 10 ml H2O, 10 ml acetic acid, 70 ml ethanol in order to investigate the grain size. The grain size was determined by image analysis of 3 images in imageJ. Microstructure was studied by optical microscopy (OM) (Observer.D1m, Carl Zeiss AG, Jena, Germany). SEM measurements with EDS analysis was done using a TescanVEGA3 LMU scanning electron microscope (SEM) equipped with energy dispersive spectroscopy (EDS) and electron back scattered detector (EBSD Oxford instruments). The electron back-scattered diffraction (EBSD) analysis was performed using an FEI 3D Quanta 3D field-emission-gun DualBeam scanning electron microscope equipped with an EBSD detector TSL/EDAX Hikari. EBSD mapping was performed with a step size ranging from 30 nm to 0.1 µm, acceleration voltage of 20 kV, and beam current of 32 nA. Data were analyzed using a EDAX OIM Analysis 9 software. An observation of the microstructure was performed by Conventional Transmission Electron Microscopy (CTEM) using a FEI Tecnai G2 F20 X- TWIN microscope with a double-tilt specimen holder operated at 200 kV.
Corrosion behaviour was studied in the simulated body fluid (SBF) prepared according to Müller [43]. The starting pH was set to 7.4 at 37 °C. An SBF volume of 100 ml per 1 cm2 of sample surface was used. Samples were fixed in plastic holders and immersed in SBF for 14 days at 37 °C. The corrosion rate was evaluated based on the weight changes after the removal of corrosion products. Three measurements were performed for all materials.
Potentiodynamic tests and electrochemical impedance spectroscopy (EIS) were conducted in simulated body fluid (SBF) at 37 °C. The sample surface area-to-solution volume ratio was maintained at 100 ml/cm². A potentiostat in a standard three-electrode configuration was employed, with the working electrode being a cylindrical sample (5 mm in diameter, 10 mm in height), a carbon stick as the counter electrode, and a silver/silver chloride electrode as the reference. Before measurements, all electrodes were immersed in the SBF solution for 30 minutes. After 30 minutes the open circuit potential (OCP) was roughly constant, so electrochemical impedance spectroscopy (EIS) started. For EIS measurements, a sinusoidal potential with an amplitude of 10 mV was applied, and the frequency was scanned from 50 kHz to 0.025 Hz. The EIS data were analyzed using Gamry Echem Analyst software. After EIS measurement the sample was kept in the solution for another 10 minutes to stabilize OCP before the cathodic polarization started. Cathodic polarization curves were recorded at a scan rate of 5 mV/s, with the potential ranging from the open circuit potential (Eocp) to −0.8 V vs. Eocp. The data were analyzed using Gamry Echem Analyst software.
Samples with dimensions 5x5x5 mm were used for ignition tests. Samples were put into the Al2O3 crucible which was inserted into the chamber of a resistance furnace. One thermocouple was in the direct contact with the sample and the other one was situated in the middle of the crucible. The tests were performed at a stable flow of technical air (100 l·h-1). The heat rate corresponded to the 25 °C·min-1. The temperature regularly increased with time during the test until there was rapid increase due to the ignition of the sample.
Compressive and tensile properties were measured using INSTRON 1362 machine at room temperature at a strain rate of 0.001 s-1. Cylindrical samples with a diameter of 5 mm and 7.5 mm high were used for compressive tests. Compressive yield strength (CYS) and ultimate compressive strength (UCS) were determined from compressive curves. Tensile tests were performed on dog bone specimens with a gauge length of 25 mm and diameter equal to 3.5 mm. Tensile yield strength (TYS), ultimate tensile strength (UTS), and elongation to fracture (A) were determined from compressive curves. Three measurements were performed for each material. Specific compression tests were conducted on halved cylindrical B sample in order to observe microstructure and identify grain orientation by EBSD before and after deformation. Deformation at 21°C and 400 °C was performed. Additional compression test with in-situ measurement of strain fields on the sample surface was performed at room temperature using a displacement rate of 0.004 mm/s and maximum macroscopic strain magnitude of approximately 10 %. The strain field was evaluated using a digital image correlation technique. For this purpose, the sample surface was painted with a speckle pattern using a fine airbrush and recorded during the compression test by a CMOS PCIe camera Ximea CB262CG-GP-X8G3 with 26 Mpx resolution. Mercury-dic (https://mercury-dic.com/) software implementing digital image correlation (DIC) technique was used to track on-line, using two virtual extensometers denoted A1 and A2, the macroscopic compression strains of the two grains forming the sample. The recorded images were further post-processed using the same software in order to evaluate the inhomogeneity and localization of the strains on the sample surface.
- Results The microstructures
- Mechanical properties
- Corrosion properties
- Ignition properties
The microstructure of the cast material is depicted in Figure 2A. It exhibits a typical dendritic structure comprising a magnesium solid solution and intermetallic phases, notably LPSO phases. Upon solid solution treatment, these intermetallic phases dissolve into the solid solution, resulting in a cleaner microstructure with sparse YH2 phases and relatively large grains (10-1000 µm) (Figure 2B). Subsequent aging at 350 °C led to the precipitation of a MF structure, characterized by linear phases distributed within each grain without the presence of block LPSO phases (Figure 2C). The grain size remained unchanged after aging.
In contrast, the material prepared by the Bridgman method resulted in the microstructure shown in Figure 2D. Although a single crystal was not achieved due to the presence of alloying elements, the grain size was significantly larger (500-5000 µm) compared to the casted ingot. Immediately after preparation, a very dense MF structure formed within the material. The detailed TEM images of this specific microstructure are shown in Figure 2G,H, revealing detail of MF structure composed of CANaPs and CALs that form spikes at the grain boundaries which might efficiently act as nuclei for recrystallization. The visibility of nanometer sized CANaPs by optical microscopy arises due to the wedge shaped etch pits formed at the locations of CANaPs during etching that are visible on STEM image in Figure 2I. However, large block LPSO phases were also present. The Bridgman sample exhibited significant inhomogeneity, with alloying elements concentrated primarily in the center. The solid solution treatment led to the dissolution of these phases, leaving only stable YH2 phases, likely due to impurities in the atmosphere during processing. Interestingly, these YH2 phases were aligned in rows, remnants from the MF structure (Figure 2E). Subsequent aging led to the reformation of the MF structure, but without the presence of block LPSO phases (Figure 2F). Therefore, the primary difference between the T6 states for the samples produced by casting and Bridgman method appears to be the grain size.
The microstructures at two different magnifications for each material after extrusion are illustrated in Figure 3. Extrusion of the cast ingot resulted in almost complete dynamic recrystallization (DRX) (Table 1), producing grains sized between 0.5 and 15 µm (Figure 3A). Additionally, a small content of larger grains elongated in the extrusion direction with a typical basal texture were visible in the microstructure. Extrusion of the ingot after solution treatment (IT4Ex) led to a larger content of non-DRX grains (Table 1) and a smaller range of DRX grain sizes (0.5-5 µm) (Figure 3B). Non-DRX grains occasionally exhibited an irregular MF structure, suggesting partial precipitation during extrusion due to the elevated temperature and deformation. Finally, the IT6Ex sample exhibited a higher fraction of DRX grains (Table 1) with the similar range of grain sizes (0.5-5 µm). Moreover, the large, deformed grains in the IT6Ex sample contained kinks within their structure (Figure 3C).Extrusion of the ingot produced by Bridgman method had significantly larger non-DRX grains with a high density of kinks (Figure 3D). The BT4Ex sample exhibited a similar appearance to the IT4Ex sample, with the primary distinction being the larger non-DRX grains (Figure 3E). Similarly, the BT6Ex sample resembled the IT6Ex sample but showed differences in grain sizes and the presence of kinks (Figure 3F). Nevertheless, the sizes of all DRX grains in the extruded Bridgman samples ranged also between 0.5 and 5 µm.
Mechanical properties in tension and compression parallel to the extrusion direction were measured, including compressive yield strength (CYS), ultimate compressive strength (UCS), tensile yield strength (TYS), ultimate tensile strength (UTS), and ductility (A), as summarized in Table 2. It is evident that both the bare casting and production by Bridgman method resulted in poor mechanical properties. Solid solution treatment significantly improved elongation and slightly enhanced strength. Aging further improved strength but at the cost of reduced ductility. Samples produced by Bridgman method exhibited very high deviations in mechanical properties, which is associated with the presence of very large grains. Overall, the mechanical properties of the Bridgman samples were lower compared to those of the casted ingot.
To investigate the material's response to extrusion conditions, compressive tests at different temperatures were conducted, as shown in Figure 4. For ingot metallurgy, both CYS and UCS generally decrease with increasing temperature. The differences in CYS between room temperature and 400 °C are 34 MPa, 19 MPa, and 43 MPa for the I, IT4, and IT6 samples, respectively. At 400 °C, the material exhibits complete plasticity without cracking up to the deformation of 40 %.
For Bridgman samples, CYS and UCS were primarily dependent on grain orientation rather than temperature. Although ingot metallurgy samples also showed slight dependence on grain orientation, their smaller grains, compared to the Bridgman method, resulted in less pronounced effects. However, the grain size in ingot metallurgy samples was still relatively large, leading to variability in behavior, as observed in the IT4 and IT6 samples (Figure 4B,C). In contrast, grain orientation was the main factor influencing the flow curves of Bridgman samples. Regardless, all samples exhibited plastic behavior at 400 °C.
Mechanical properties in tension and compression parallel to the extrusion direction were measured, and the values are summarized in Table 3. The lowest YS was observed in the IEx sample; however, this sample also exhibited the highest elongation. A significant increase in TYS was achieved by using solution-treated ingot. However, the increase in compressive CYS was less pronounced, and there was a reduction in ductility. Extrusion of aged ingot resulted in a greater enhancement of CYS, but the enhancement of TYS was not as substantial as in the case of IT4Ex. As a result, values of CYS and TYS were almost the same. The ductility was the lowest among ingot materials but was still relatively adequate for most applications.
Tensile strength of Bridgman products was significantly higher compared to those from ingot metallurgy. The difference in TYS between the IEx and BEx materials was approximately 109 MPa. Unfortunately, the elongation of Bridgman products was much lower. The lowest elongation of 1.8% was measured for the BT4Ex product, which also exhibited the second lowest CYS, despite having the second highest TYS among the prepared products. Fortunately, the BT6Ex sample demonstrated both high strength and retained ductility, with a reasonable elongation of about 5.7%.
Corrosion tests were conducted in simulated body fluid (SBF) at a temperature of 37 °C in closed containers. The corrosion rate was calculated based on the weight changes after exposure for 14 days and removal of corrosion products. The values are summarized in Table 4. The highest corrosion rate was measured for the casted ingot and casted ingot after extrusion. Otherwise, all other samples exhibited corrosion rates between 0.6 and 0.8 mm·y-1, which falls within the optimal range for applications in medicine as biomaterials.
Electrochemical methods, including potentiodynamic polarization and EIS, were employed to further investigate the corrosion behavior of the samples (Figure 5). While long-term exposure tests provided insights into the material's degradation over extended periods, electrochemical methods offered information on the initial corrosion behavior (approximately during the first hour of exposure). It is worth mentioning that the prediction of corrosion rate of magnesium and its alloys from electrochemical tests is quite inappropriate for several reasons. Firstly, it is known that the real number of exchanged electrons during magnesium corrosion is not 2 (used for calculations) but somewhere between 1 and 2 [44,45,46]. Secondly, the adequate usage of EIS assumes that the system is in stable conditions, which is always quite hard to fulfill and in the case of highly degradable metals like magnesium, it can cause the artefacts on measured data. For these reasons, only the evaluated values of icor and resistances are considered to compare the materials and their corrosion behavior at the beginning of exposure.
Potentiodynamic polarization curves for the samples before and after extrusion are shown in Figure 5A,B, respectively. The corrosion behavior was relatively similar across all samples, with a slight shift of corrosion potentials towards more positive values observed after extrusion.
The results of EIS measurements, presented as Nyquist plots, are shown in Figure 5E-H. The EIS data were analyzed using an equivalent circuit model designed to characterize the corrosion behavior of magnesium alloys in SBF (Figure 5E). This model includes a solution resistance (RS) and two distinct time constants. The first RC element, defined by Rf; and CPEf, represents the overall resistance of the corrosion product barrier on the material surface and the capacitance of this layer. The second RC component, characterized by the charge transfer resistance (Rct) and the double-layer capacitance (CPEdl), corresponds to the interface between the magnesium alloy surface and the electrolyte within the pores of the corrosion product layer. The fitted parameters derived from the EIS measurements are summarized in Table 5 and Table 6 for samples before and after extrusion, respectively. The resistance components in the fitted data are indicative of the material's corrosion resistance. The results reveal that all materials exhibit similar values of charge transfer resistance (Rct), suggesting a comparable corrosion mechanism at the interface between the electrolyte and the non-degraded material surface. Similarly, Rf, representing the resistance of the corrosion product layer, is consistent across all materials, indicating a similar protective character of the corrosion products. Extrusion generally had a minor positive effect on corrosion resistance, as evidenced by the increase in Rf for extruded materials. However, an exception was observed in the case of the extruded ingot, where Rf decreased.
Ignition properties of extruded samples were measured in a furnace with the presence of technical air, and the results are summarized in Table 7. The ignition temperatures ranged between 828 and 944 °C, with Bridgman products exhibiting slightly higher ignition temperatures compared to those from ingot metallurgy. Additionally, there was a trend of a slight decrease in ignition temperature with further heat treatment.
- Discussion Microstructure
- Mechanical properties
- Corrosion properties
- Ignition properties
The microstructure of the cast ingot exhibited a typical coarse-grained dendritic structure with block LPSO phases (Figure 2A), consistent with observations reported by other researchers [40,47,48,49]. Solid solution treatment followed by water quenching effectively dissolved all phases (Figure 2B). This heat treatment produced thermally stable YH2 phases, a common occurrence in magnesium alloys containing yttrium [50]. The quenching process increased the concentration of alloying elements in the solid solution [51]. Subsequent aging led to the specific precipitation of phases in rows (Figure 2C), a phenomenon linked to the low stacking fault energy of this alloy due to the presence of yttrium and zinc [14,15,16,47]. Initially, GP zones with an hcp structure formed along the basal planes, which then transformed into local fcc structures upon reaching a certain Y/Zn concentration [19]. Consequently, yttrium and zinc formed CANaPs with uneven distances between them, known as the MF structure [18,21,32].
The same phenomenon was observed in the material prepared using the Bridgman method. During this process, the ingot was remelted in a current heating zone and then slowly solidified and cooled, resulting in the formation of both a dense MF structure and block LPSO phases in the microstructure (Figure 2D). This material also featured very large grains. Solution treatment effectively dissolved both the MF structure and the LPSO phases, leading to an increased concentration of alloying elements in the solid solution. However, YH2 phases formed in the regions where the MF structure had been, and these YH2 phases were arranged in rows (Figure 2E). Subsequent aging resulted in the re-precipitation of the MF structure through a similar mechanism as observed in ingot metallurgy, without the presence of block LPSO phases (Figure 2F). YH2 phases remained in the microstructure, and the grain size continued to be extremely large.
Extrusion of the materials led to partial dynamic recrystallization (DRX) in all cases. The highest fraction of DRX was observed in the IEx sample (Table 1), attributed to the presence of relatively fine LPSO phases that were uniformly distributed throughout the microstructure (Figure 6A). These LPSO phases are known to facilitate DRX by acting as nucleation sites and enhancing the recrystallization process [17,51]. DRX grains in this sample exhibited a weak basal texture, while larger, deformed grains displayed a strong basal texture (Figure 6G) [39,40,48,51]. In contrast, the IT4Ex sample showed a lower proportion of DRX grains, as it initially lacked LPSO phases and MF structures that could aid the DRX process. Extrusion resulted in a microstructure containing alternating rows of DRX and non-DRX regions (Figure 3B), shown in greater detail in Figure 6D. This arrangement was observed in all prepared materials except for the IEx sample, which was nearly fully recrystallized. The DRX grains (Figure 6B) also contained MF structure, as depicted in the TEM image (Figure 6C). During extrusion, some MF structure began to precipitate due to the elevated temperature and deformation, which contributed slightly to the recrystallization and notably reduced subsequent grain growth. Precipitation of the MF structure during extrusion may be attributed to the deformation-induced precipitation, as reported by Rosalie et al. [52]. However, since the MF structure formed during deformation, it did not incorporate a significant number of kinks. Conversely, the IT6Ex sample already contained MF structure before extrusion. This pre-existing MF structure is advantageous for DRX, as it facilitates recrystallization at grain boundaries, resulting in a higher DRX fraction (Table 1) [17]. Additionally, the MF structure was maintained in non-DRX grains and exhibited kinks due to deformation during extrusion. Those kinks can be observed in Figure 6E and TEM detail in Figure 6F.
In the BEx sample, kinking was prominent (Figure 3D) due to the high density of MF structure and the presence of LPSO phases [32,40]. The resulting microstructure comprised both DRX grains (Table 1), and non-DRX grains with a high density of kinks. Kinking, which replaces twinning in the presence of MF structure, occurs more readily in large, well-oriented grains compared to smaller grains [17,53]. Consequently, the large, well-oriented grains in the BEx sample developed a high number of kinks such as in Figure 6E. In contrast, the BT4Ex sample initially lacked MF structure, resulting in a smaller fraction of DRX grains. However, partial MF precipitation occurred during extrusion as in the case of IT4Ex sample. This sample also exhibited large, deformed grains with a strong basal texture (Figure 3E). The BT6Ex sample (Figure 3F) similarly displayed kinks (Figure 6E) in large, deformed grains and a higher DRX content, aided by the MF structure [17]. Overall, Bridgman samples generally showed a lower fraction of DRX grains compared to those prepared by ingot metallurgy. This difference may be due to the fact that recrystallization primarily initiates at grain boundaries. Consequently, the larger grains in these samples reduce the efficiency of this mechanism, requiring other processes to facilitate recrystallization.
For the discussion of mechanical properties, several values were calculated and are presented in Table 8 and Table 9. The value of CYS/TYS ratio is related to the asymmetry of mechanical properties which is generally connected to the twinning mechanism in magnesium [54]. It is worth mentioning that twinning is generally observed in grains with basal texture when the compressive loading is applied parallel to the extrusion direction. While this mechanism is not active under tensile loading parallel to the extrusion direction, the CYS values are lower compared to TYS and the CYS/TYS asymmetry is in the most cases in the range 0-1. Contrary if the orientation of crystal is opposite and twinning in tension is favorable while twinning in compression is hindered, then this value could be higher than 1, however, this almost never happens in magnesium materials due to the tendency to have basal texture. The UCS/CYS and UTS/TYS ratios describe the relative difference between yielding and maximum strength, corresponding to the potential for hardening. This can be further quantified by the hardening capacity in tension (HCT) and hardening capacity in compression (HCC) for tension and compression, respectively [55,56,57]. They are calculated using the equation (2).
HC = UC−YSYS
Where US is ultimate strength and YS is yield strength in compression or in tension. Higher hardening capacity means better ability of the material to harden during plastic deformation.
The mechanical properties of samples prepared by casting, or the Bridgman method were generally suboptimal, as expected. However, certain characteristics are notable prior to extrusion. In ingot metallurgy, the mechanical properties are symmetrical, with the CYS to TYS ratio close to 1 (Table 8), indicating that the grains have a predominantly random orientation. The cast ingot exhibited superior mechanical properties compared to pure magnesium, attributable to strengthening from intermetallic phases and solid solution strengthening [58]. Solution treatment led to a slight increase in strength due to solid solution strengthening, as yttrium significantly enhances the strength of the solid solution. However, this gain is partially offset by the dissolution of intermetallic phases, which weakens the material [17,34]. The increase in ductility is attributed to the absence of intermetallic phases, which allows for longer free path for dislocations [52]. The high hardening capacity is also associated with the lack of these phases. Subsequent aging resulted in the formation of an MF structure, which improved strength but also reduced ductility and hardening capacity.
Samples prepared using the Bridgman method exhibited significant variability in mechanical properties due to the presence of large grains. Each tested sample comprised only a few grains, making grain orientation and the Schmidt factor the primary factors influencing mechanical properties [39,40]. Consequently, each sample's behavior was predominantly determined by the orientation of its largest grain. Molodov et al. [53] investigated eight distinct single crystal orientations of pure magnesium and their effects on mechanical properties, highlighting three that exhibit significant differences. When crystals are compressed along the c-axis, dislocation slip in the basal plane is suppressed, necessitating slip in other planes, which results in a high hardening rate. Conversely, compression perpendicular to the c-axis promotes extensive twinning, initially leading to a low hardening rate, followed by a higher rate as the twin orientation aligns with the c-axis. The third orientation, with the c-axis at a 45° angle to the compressive force, facilitates dislocation slip along the basal plane, resulting in a low hardening rate. In this case, the samples were not single crystals, and their specific crystal orientations were not observed. Nonetheless, the influence of grain orientation is evident from the CYS/TYS ratio, which deviates significantly from 1 on both sides, indicating the absence of a preferential grain orientation in the Bridgman-processed samples. The high hardening capacities observed in these samples are attributed to their very large grains and are influenced by grain orientation, as demonstrated by the high values observed in the BT4 sample. Compressive tests conducted at elevated temperatures provided insights into the material's behavior during extrusion. The results indicated that an extrusion temperature of 400 °C is optimal, as it allows for plastic deformation without initiating cracking. The reduction in CYS with increasing temperature was more pronounced for the IT6 sample as it dropped from 104 MPa at 20 °C to 52 MPa at 400 °C. The lowest decrease of CYS (from 93 MPa at 20 °C to 66 MPa at 400 °C) was observed for IT4 sample. This effect may be attributed to the enhanced solid solution strengthening by Y and Zn at elevated temperatures, coupled with the precipitation of MF structure.
For Bridgman samples, some exhibited plastic behavior even at 300 °C, highlighting a strong dependence on grain orientation. The predominant crystal orientation can be inferred from the initial segment of the compressive stress-strain curves. Specifically, the samples B (at 20 °C) and BT6 (from 20 to 200 °C) (Figure 4D,F) displayed low initial hardening rates, suggesting a predominant orientation conducive to extensive twinning [53]. Although twinning is typically replaced by kinking in these materials, it is likely that kinking will manifest similarly to twinning in this context [17,26].
To further investigate the deformation processes in Bridgman material, two compression samples were prepared, and their microstructures were observed before and after compression at room temperature and at 400°C. The microstructure of the samples revealed that they consisted of only a few grains, each with a specific orientation and, therefore, a different Schmidt factor (Figure 7).
In both cases, grains with orientation close to [01-10] exhibited a large number of kinks and occasional twins within kinks, while grains with orientation close to [-12-10] contained both kinks and large twins. Contrary grains with orientation close to [0001] appeared unchanged. Deformation bands were observed to initiate at grain boundaries and proliferate within the grains. A detailed view of the kink is presented in Figure 7D. The image reveals the presence of multiple CANaPs, and a narrow section of CANaP free region. A visible solute enriched stepwise kink band is present in lower CANaP part, which turned into dislocation source and induced a dislocation pile-up within the CANaP free region [59]. The increased spacing allowed the dislocation pile-up to bend along nearest CAL. However, the deformation energy was insufficient to form a full stepwise kink band in upper CANaP region. Despite this, the dislocation pile-up generated localized strain, causing rotational kink, which resulted in just slight bending of the grain. This highlights the advantageous effects of CANaP structures on deformation behavior. These deformation bands may induce kinking or twinning in adjacent grains. At elevated temperatures, a higher density of kinks was observed especially at the grain boundaries.
Dynamic recrystallization occurring at grain boundaries is therefore associated with this kinking and twinning which was also observed earlier [54].
Deformation at lower temperatures resulted in larger kinks and the presence of small twins within these kinks. Similar observations were made by Hagihara et al. [31] during deformation of a single crystal containing MF structure at room temperature and 300°C. They noted hardening after yielding for grains with orientation [01-10], which is consistent with the current observations. At elevated temperatures, no significant deformation traces were observed in grains oriented close to [0001]. In contrast, deformation bands were visible in grains oriented close to [01-10] and [-12-10], which is in line with Hagihara et al.'s findings.
Another compressive test was performed using DIC as a tool for in-situ measurement of strain (Figure 8). The smaller grain (designed as gr.2) with orientation [4-2-2-1] parallel to the y axis which is close to [-12-10] presented at the edge of the orientation triangle and originating from the family of directions <11-20> should be susceptible to kinking. Indeed, it was characterized with uneven strain in the place of kinks. These kinks reoriented the grain close towards [-12-11] parallel to the y axis. Moreover, after the introduction of kinks into the microstructure the hardening rate of this grain increased. Grain 1 with orientation [01-11] parallel to the y axis which is just between [0001] and [01-10] at the bottom side of orientation rectangle is less susceptible for kinking. Nevertheless, some kinking occurred as it also changed orientation close towards [-12-11] parallel to the y axis. The deformation by twinning occurs along the shear band as the orientation sharply changes to ≈ [-13-20] parallel to the y axis. After the introduction of these kinks and twins, the hardening rate of this grain also increased. Interestingly, in two other axis the tensile strain concentrated predominantly along the grain boundary and slightly at the kink bends indicating that this place is suitable for initiation of dynamic recrystallization as was observed in the microstructure after extrusion. Yamasaki at al. [60] observed numerous kinks along the <11-20> and these kinks increased nano-hardness in those regions.
The mechanical properties of the extruded samples showed significant improvements, with notable variations linked to the microstructural changes during extrusion. Direct extrusion of cast ingot resulted in low CYS and TYS, but high elongation. This outcome is attributed to the presence of LPSO phases, which act as nuclei for dynamic recrystallization [51]. The high content of DRX grains (98 ± 2%) and the dispersion of LPSO phases significantly enhanced ductility. Conversely, non-DRX grains exhibited a typical basal texture, which influenced mechanical properties differently depending on the applied force. Basal texture tends to facilitate twinning under compression, which requires less strength compared to dislocation slip, leading to lower CYS. However, this orientation is less favorable for twinning under tensile force, resulting in higher TYS [54]. The effect is further pronounced by larger grain sizes. The IEx sample demonstrated relatively low asymmetry in mechanical properties, as evidenced by a CYS/TYS ratio of 0.9, due to the high fraction of DRX grains with only weak basal texture, however, with slightly larger grain size compared to other samples. This sample exhibited the highest hardening capacity due to the presence of a high fraction of DRX grains.
In contrast, the IT4Ex sample had CYS/TYS ratio of 0.85. The initial absence of an MF structure, which aids the recrystallization process, resulted in a microstructure with a higher proportion of non-DRX grains (23 ± 3%) with strong basal texture. This led to easier twinning, reduced CYS, increased TYS, and decreased ductility. The hardening capacity in tension was significantly lower compared to that in compression, indicating that the texture of non-DRX grains was a major factor influencing mechanical properties.
Interestingly, the IT6Ex sample exhibited CYS/TYS ratio very close to 1, which is attributed to the presence of MF structure that enhances the recrystallization process [17], therefore, this material contained more DRX regions (85 ± 2%) with more random texture compared to large non-DRX grains with strong basal texture. However, the effect of the MF structure on dynamic recrystallization was less pronounced compared to the dispersed LPSO phases. As a result, this microstructure still contained a relatively large proportion of non-DRX grains, but these grains included MF structures with kinks that provided a strong hardening effect and suppressed twinning [40,61]. Consequently, both TYS and CYS values were similar.
Similar issues were observed in materials prepared using the Bridgman method. The BEx sample demonstrated a substantial improvement in TYS, which was 110 MPa higher compared to the IEx sample. This significant enhancement is attributed to the presence of block LPSO phases, a MF structure within non-DRX grains. High content of large non-DRX grains (30 ± 9%), combined with suitable orientation, are highly susceptible to twinning and kinking, as discussed in the compressive tests at elevated temperatures [41,62]. Consequently, during extrusion, extensive kinking occurred and stayed in the non-DRX grains (Figure 6E) with favorable orientations, significantly increasing the material's strength [32,40]. Despite kinking should suppress twinning, the strong basal texture together with large non-DRX grains probably still allowed twinning to some extent similarly as was observed in detailed compression of B samples. This led to a higher CYS/TYS ratio, indicating asymmetrical mechanical properties. Interestingly, the extruded material also exhibited low hardening capacities in both compression and tension, reflecting strengthening primarily from non-DRX grains. The smaller fraction of DRX grains and basal texture of large non-DRX grains resulted in only 3% elongation.
The microstructure of BT4 material was similar to the IT4 sample but differed in grain size and the amount of YH2 phases. The TYS of the BT4Ex sample was 62 MPa higher than that of the IT4Ex sample, although the CYS was 23 MPa lower. This suggests a strong asymmetry in mechanical properties due to the pronounced strong basal texture in very large non-DRX grains [39,40], that were present in high amount (33 ± 6%). However, the BT4Ex sample lacked an initial MF structure, and therefore did not benefit from kinks that would otherwise hinder twinning. Large, favorably oriented non-DRX grains were highly prone to twinning under compression, resulting in very high TYS but very low CYS and ductility, as reflected in the low hardening capacities.
In contrast, the BT6 sample was similar to the IT6 sample, with the primary difference being grain size. The TYS of the BT6Ex sample was 85 MPa higher than that of the IT6Ex sample, while the
CYS was only 7 MPa lower. Although there remains some asymmetry in mechanical properties, it is significantly less pronounced compared to the BT4Ex sample, due to the presence of the MF structure, associated kinks and slightly larger content of DRX grains (73 ± 3%) [17,26]. Nevertheless, the large grains still contributed to twinning, or the lower density of the MF structure was less effective at hindering this mechanism. The BT6Ex sample exhibited the highest strengths and a reasonable ductility of 5.7%. This was achieved due to the presence of large grains that were prone to kinking during thermomechanical processing, with the kinks significantly enhancing the material's strength. As was shown by Somekawa et al. [63] increasing amount of kinks significantly increases the hardness of the material. However, ductility and CYS were still reduced due to the persistent basal texture or large non-DRX grains.
The slow solidification process resulted in similar TYS compared to the materials prepared by rapid solidification, despite having 1.5 wt.% less yttrium [42]. However, the slowly-solidified material exhibited significantly lower ductility and CYS due to texture strengthening. To enhance the mechanical properties and reduce asymmetry in materials produced by slow solidification, increasing the content of alloying elements could be beneficial. This approach would likely lead to a higher density of MF structures and kinks, which could improve the material's strength. Therefore, optimizing kink and texture strengthening while minimizing negative impacts of asymmetrical properties and low ductility could further improve the material's performance.
Out of the obtained results it seems that the optimal method for preparing the WZ21 alloy appears to be extrusion of IT6 state, which achieves similar TYS and CYS (~277 MPa) while maintaining a relatively high elongation of ~10.4 %. In contrast, if maximizing TYS would be the priority, then BT6Ex material with a TYS of 363 MPa would be optimal. However, its large difference between TYS and CYS (~100 MPa) together with lower elongation of 5.7 % present certain limitations.
When compared to other ternary Mg-based alloys, Mg-Y-Zn shows considerable promise for superior mechanical properties. For instance Mg-Nd-Zn alloys reach TYS values ranging from 145 to 276 MPa [64,65,66], Mg-Al-Zn alloys reach 130-253 MPa [67,68,69,70], and advanced Mg-Y-Nd alloys reach 180-260 MPa [35,69,71,72] depending on the composition and processing. However, none of these systems contain LPSO phases, which can be further exploited through suitable thermomechanical processing as demonstrated in the precent work.
Overall, the mechanical properties obtained here are comparable with those reported by Cabeza et al. [73] for Mg-2Y-1Zn alloy, where TYS values of 211 MPa and 292 MPa were achieved for extruded ingot and extruded powder metallurgy product, respectively. Nevertheless, they reached higher elongation of 13 % and 23 %. Their materials consisted of DRX grains and LPSO phases together with fine precipitates and lamellar precipitates.
Adjusting Y and Zn contents can also influence mechanical properties of Mg-Y-Zn alloys. Rosalie et al. [52] worked with higher content of Zn and they extruded Mg-1.7Y-7.7Zn alloy followed by T4 treatment, reaching a TYS of 150 MPa and elongation of ~23%. Aging increased TYS to 217 MPa, though elongation decreased to 15 %. Nevertheless, using deformation before aging, raised TYS to 287 MPa with an elongation of 8%. This increase was associated with induced precipitation of lamellar phases, thus, illustrating the importance of tailored heat treatment. Kawamura et al. [32] used higher Y content in Mg-3.5Y-1Zn rapidly solidified ribbons, achieving a TYS of 368 MPa and elongation of 10.5% after extrusion. The increase of strength in this case was associated with the high density of kink bands such as in the case of BT6Ex sample, however, a more favorable arrangement of DRX and non-DRX regions yielded improved ductility.
Interestingly, increasing alloying elements alone is insufficient to achieve major enhancements in mechanical properties. For instance, Onorbe et al. [37] measured a TYS of 240 MPa with 20% elongation for extruded Mg-7Y-2.6Zn alloy, while Ruan et al. [74] reported a TYS of 303 MPa and 14% elongation for Mg-10Y-5Zn alloy. More promising strategy involves adding other elements to Mg-Y-Zn system as demonstrated by Nishimoto et al. [75] who reached exceptional TYS of 498 MPa and 5% elongation after extrusion of rapidly solidified Mg-7Y-2.1Zn-0.4Al ribbons or combining this addition of fourth element with controlling of the CANaP precipitation [76].
The measured corrosion rates for most of the tested samples are considered adequate for biomaterials [77,78,79]. The corrosion resistance of this alloy is attributed to the presence of yttrium, which forms a stable Y2O3 or Y(OH)3 layer on the sample's surface [80,81,82]. This protective layer can form more easily from the solid solution or less stable phases [83].
The highest corrosion rate observed in the ingot metallurgy product (I) is linked to its significant inhomogeneity which is represented by high deviation of values and also due to the presence of high amount of block LPSO phases. These phases, which have a more positive standard reduction potential than the magnesium matrix due to the presence of Zn, accelerate the corrosion rate by micro-galvanic cell formation [13,84]. This effect is further enhanced after extrusion due to the alignment of these phases in rows parallel to the extrusion direction, increasing their surface area. Solid solution treatment (IT4) reduced the corrosion rate significantly, as it dissolved the harmful intermetallic phases into the solid solution, thus improving the corrosion resistance [83]. Subsequent aging (IT6) led to the precipitation of the MF structure reducing the amount of Y in the solid solution of α-Mg, thus increasing the corrosion rate. This increase is less profound compared to I product due to the better material homogeneity.
Bridgman samples exhibited very similar corrosion rates. While Bridgman sample (B) contained both the MF structure and large block LPSO phases, the latter should significantly increase the degradation rate, as seen in the casted ingot. However, in Bridgman sample (B), these phases were large and sparse, resulting in a smaller total surface area and mitigating their negative effect [85]. Y still sufficiently concentrated in the corrosion products (Figure 9A) However, inhomogeneity resulted in the presence of relatively large deviations of measured values of corrosion rates. Solid solution treatment of Bridgman sample (BT4) further improved the corrosion resistance due to the dissolution of phases into the solid solution. It has similar corrosion rate as IT4 sample, therefore, the amount of Y dissolved in the solid solution seems to be more important factor affecting corrosion than the grain size. Subsequent aging slightly increased corrosion rate due to the precipitation of MF structure, thus, depletion of Y from the solid solution.
Extrusion increased the corrosion rate of IEx sample due to the higher surface area of prolonged LPSO phases. Moreover, the corrosion rate of IT4Ex product increased due to the partial precipitation of MF structure. Due to the recrystallization in this sample and increase in the volume of grain boundaries the corrosion resistance improves because of easier salt passivation at these boundaries, which have a higher energy state compared to the grain interior [86,87,88]. This results in rapid initial corrosion but better long-term resistance. Thus, fine-grained materials perform better in long-term exposure tests compared to the coarse-grained materials. However, this improvement was compensated by the presence of inhomogeneous bimodal structure (DRX and non-DRX areas). The corrosion rate of IT6Ex sample remained the same due to opposing effects of grain refinement and increased inhomogeneity due to the bimodal structure. Extrusion of BEx sample lead to the creation of DRX grains that makes salt passivation (Figure 9B) easier [86,87,88] and thus also slightly improved corrosion resistance. However, extrusion of BT4Ex sample resulted in higher corrosion rate compared to BT4 sample due to the partial precipitation of MF structure. In case of BT6Ex sample only negligible increase of corrosion rate is visible again due to the opposing effects of grain refinement and bimodal structure. Despite having a lower Y content, these materials achieved similar corrosion resistance compared to those produced by rapid solidification [42].
It is worth mentioning that the electrochemical measurements of corrosion of magnesium are not always suitable because magnesium undergoes not only electrochemical reactions but also significant non-electrochemical processes, such as the chemical reaction of Mg+ ions with water, which are not directly registered by techniques like potentiodynamic polarization, polarization resistance, or EIS [44,45,46,89]. These methods can yield inconsistent corrosion rates and often differ from results obtained through long-term exposure tests and weight change measurements, as they do not fully account for the unique hydrogen evolution and surface film formation processes associated with magnesium corrosion [90].
Although not precise in corrosion rate predictions, electrochemical analyses like EIS can show the differences in corrosion mechanisms and corrosion products formation. Our results revealed rather similar initial corrosion behavior for all samples. The main reason is related to the fact that selected SBF is oversaturated by phosphates. When the magnesium is corroded and pH of the corrosion environment increases, there is quick tendency for the precipitation of phosphate layer on the magnesium alloys, regardless of the material condition. This layer creates some barrier which protect the material against corrosion (Figure 9). This behavior is clearly confirmed by the EIS data and evaluated values of Rct and Rf, which are close for all materials. Minor differences in Ecor may be related to the differences in LPSO or MF distribution and the amount of alloying elements in the solid solution.
Except for the IEx sample, all tested materials exhibited corrosion rates ranging from 0.6 to 0.8 mm·y-1, which is relatively favorable compared to other studies on similar alloying systems. For instance, Cabeza et al. [73] investigated the same alloy and observed a stabilized corrosion rate of approximately 9 mm·y-1 for extruded ingot, while the extruded powder metallurgy product reached up to 25 mm·y-1 after 2 days of exposition in PBS. These extremely high values are associated with the presence of secondary LPSO phases, similar to the IEx sample. In contrast, Zhang et al. [91] reported a similar corrosion rate of 1 mm·y-1 after 9 days in Hank’s solution for extruded Mg-1.7Y-1.5Zn alloy, and Wang et al. [92] measured corrosion rates between 0.7 and 1 mm·y-1 in SBF for Mg-Y-Zn-Nd alloy over 7 days, depending on the preparation method .
When properly subjected to thermomechanical processing, the Mg-Y-Zn system can surpass other ternary alloys lacking yttrium. For example, the Mg-Nd-Zn system can exhibit corrosion rates of around 1.34 mm·y-1 [64], while Mg-Al-Zn alloys may reach approximately 2.93 mm·y-1 [93]. On the other hand, alloys containing Y in combination with other elements can attain substantially lower corrosion rates, as demonstrated by Mg-Y-Nd alloys, where the corrosion rate is about 0.46-0.73 mm·y-1 [35,72] depending on the preparation method.
The ignition resistance of magnesium alloys is primarily influenced by the type and quantity of alloying elements present in the material. The ignition temperature is elevated due to the formation of a stable protective oxide layer, with yttrium being particularly effective in this regard [6,94,95]. This protection occurs because Y2O3 replaces the less protective MgO layer, owing to its lower Gibbs free energy of formation compared to magnesium oxide [6]. Even an yttrium content of 2 wt.% is sufficient to achieve an ignition temperature above 800 °C, consistent with findings from other studies reporting similar results with 3 wt.% Y [5,94]. Bridgman-processed samples exhibited slightly higher ignition temperatures, which may be attributed to sample inhomogeneity, potentially leading to a marginally higher yttrium content in some samples. Similarly, cast ingot also showed high variability in measured ignition temperatures. A decrease in ignition temperature was observed after solid solution treatment, likely due to homogenization and partial Y depletion in the solid solution resulting from the formation of YH2 phases. Subsequent aging further reduced the ignition temperature, attributed to the depletion of the solid solution by Y and the formation of MF structures. The initial protective oxide layer is primarily derived from yttrium in the solid solution rather than from intermetallic phases, facilitating the formation of a more effective protective layer. Overall, the ignition resistance of these materials is comparable to that of the advanced WE43 alloy [96,97].
1. Conclusion
The magnesium alloy Mg-2Y-1Zn was produced using conventional casting followed by a slow solidification process, with subsequent heat treatments (T4 and T6) and extrusion. Notable differences in the microstructure were observed prior to extrusion, primarily due to variations in grain size. Slow solidification resulted in significantly larger grains compared to those in the cast ingot. Solid solution treatment led to the dissolution of phases into the solid solution of α-Mg, while subsequent aging led to the formation of a Mille-Feuille (MF) structure.
Extrusion resulted in a multimodal microstructure consisting of both fine DRX grains and large non-DRX grains. The DRX grains exhibited a weak basal texture, while the non-DRX grains displayed a very strong basal texture. In cases where MF structure was present, the non-DRX grains contained kinks, with a higher density of kinks observed in the larger grains.
Mechanical properties improved significantly after extrusion. Notably, products from the slow solidification process demonstrated much higher strength due to the combined effects of texture and kink strengthening. A pronounced asymmetry in mechanical properties was observed, particularly in materials subjected to solid solution treatment due to the higher content of non-DRX grains with strong basal texture without the significant presence of kinks. Higher content of non-DRX grains was associated with the absence of intermetallic phases, which act as nuclei for recrystallization, and the lack of MF structure prior to extrusion, which replaces twinning with kinking. Greater asymmetry was observed in materials with very large grains, resulting in reduced ductility.
The corrosion rate of most prepared materials was below 0.8 mm·y-1 which is good results in respect to the total content of alloying elements (3 wt.%). The corrosion protection was achieved primarily due to the presence of Y in the solid solution. Casted ingot was characterized with the worst corrosion resistance due to the presence of high amount of LPSO phases. Otherwise, all other samples had relatively similar corrosion rates with slightly better performance of samples after solid solution treatment due to the higher fraction of Y in the solid solution.
All prepared materials were characterized by sufficiently high ignition temperature, primarily due to the protective Y2O3 layer formed on the material surface during heating. However, significant deviations in the casted samples were linked to microstructural inhomogeneity. Also, the depletion of solid solution by Y during heat treatments due to the formation of YH2 phases, and other intermetallic phases caused some minor deterioration in ignition resistance.
Despite some drawbacks, such as the asymmetrical properties and reduced ductility of large-grained materials prior to extrusion, there is considerable potential to achieve high-strength materials. Increasing the amounts of Y and Zn is expected to result in a denser MF structure, which would enhance kink strengthening and reduce twinning more significantly.
Future research aimed at enhancing mechanical properties should concentrate on maximizing kink strengthening by developing materials with a dense MF structure. This goal can be achieved by increasing the alloying element content or through appropriate thermomechanical processing in order to control MF precipitation. Another objective is to identify processing conditions that optimize the balance of DRX and non-DRX regions, thereby achieving the best possible strength-ductility synergy. Lastly, introducing a fourth alloying element that does not disrupt the MF structure could further improve mechanical properties.
Acknowledgment
This research was supported by Japan Society for the Promotion of Science (KAKENHI Grant-in-Aid for Scientific Research; 18H05475, 18H05476 and JP20H00312) and MRC International Collaborative Research Grant. The authors would like to thank the Czech Science Foundation (Project No. 22-22248S) and specific university research (A1_FCHT_2024_007) for financial support. The authors acknowledge the assistance provided by the Ferroic Multifunctionalities project, supported by the Ministry of Education, Youth, and Sports of the Czech Republic. Project No. CZ.02.01.01/00/22_008/0004591, co-funded by the European Union. CzechNanoLab project LM2023051 funded by MEYS CR is gratefully acknowledged for the financial support of the measurements/sample fabrication at LNSM Research Infrastructure. Miroslav Čavojský would like to thank Vega 1/0531/22 for financial support.
Declaration of generative AI and AI-assisted technologies in the writing process
During the preparation of this work the author(s) used ChatGPT4.0 in order to check grammar and improve readability. After using this tool/service, the author(s) reviewed and edited the content as needed and take(s) full responsibility for the content of the publication.
References
- Tekumalla, S.; Gupta, M. , An insight into ignition factors and mechanisms of magnesium based materials: A review. Mater. Des. 2017, 113, 84–98. [Google Scholar] [CrossRef]
- Zheng, Y. F.; Gu, X. N.; Witte, F. , Biodegradable metals. Materials Science and Engineering: R: Reports 2014, 77, 1–34. [Google Scholar] [CrossRef]
- Seal, C. K. , Biodegradable surgical implants based on magnesium alloys – A review of current research. IOP Conference Series: Materials Science and Engineering 2009, 4, 012011. [Google Scholar] [CrossRef]
- Yu, X.; Shen, S.; Jiang, B.; Jiang, Z.; Yang, H.; Pan, F. , The effect of the existing state of Y on high temperature oxidation properties of magnesium alloys. Appl. Surf. Sci. 2016, 370, 357–363. [Google Scholar] [CrossRef]
- Zhou, N.; Zhang, Z.; Dong, J.; Jin, L.; Ding, W. , Selective oxidation behavior of an ignition-proof Mg-Y-Ca-Ce alloy. Journal of Rare Earths 2013, 31, 1003–1008. [Google Scholar] [CrossRef]
- Kubasek, J.; Minarik, P.; Hosova, K.; Sasek, S.; Knapek, M.; Vesely, J.; Straska, J.; Dvorsky, D.; Cavojsky, M.; Vojtech, D. , Novel magnesium alloy containing Y, Gd and Ca with enhanced ignition temperature and mechanical properties for aviation applications. J. Alloys Compd. 2021, 877, 10. [Google Scholar] [CrossRef]
- Dvorsky, D.; Kubasek, J.; Vojtech, D.; Minarik, P. , Novel aircraft Mg-Y-Gd-Ca alloys with high ignition temperature and suppressed flammability. Mater. Lett. 2020, 264, 127313. [Google Scholar] [CrossRef]
- Yoshihito Kawamura, K. H. , Akihisa Inoue, Tsuyoshi Masumoto, Rapidly Solidified Powder Metallurgy Mg97Zn1Y2Alloys with Excellent Tensile Yield Strength above 600 MPa. Special Issue on Platform Science and Technology for Advanced Magnesium Alloys 2001, 42, 1172–1176. [Google Scholar]
- KAWAMURA; #160; Yoshihito; YAMASAKI; Michiaki, Formation and Mechanical Properties of Mg[97]Zn[1]RE[2] Alloys with Long-Period Stacking Ordered Structure. Japan Institute of Metals: Sendai, JAPON, 2007; 48.
- Yamasaki, M.; Hashimoto, K.; Hagihara, K.; Kawamura, Y. , Effect of multimodal microstructure evolution on mechanical properties of Mg–Zn–Y extruded alloy. Acta Mater. 2011, 59, 3646–3658. [Google Scholar] [CrossRef]
- Tong, L. B.; Li, X.; Zhang, D. P.; Cheng, L. R.; Zhang, H. J. , Dynamic recrystallization and texture evolution of Mg-Y-Zn alloy during hot extrusion process. Mater. Charact. 2014, 92, 77–83. [Google Scholar] [CrossRef]
- Lv, B.-J.; Peng, J.; Peng, Y.; Tang, A.-T.; Pan, F.-S. , The effect of LPSO phase on hot deformation behavior and dynamic recrystallization evolution of Mg–2.0Zn–0.3Zr–5.8Y alloy. Mater. Sci. Eng., A 2013, 579, 209–216. [Google Scholar] [CrossRef]
- Li, C. Q.; Xu, D. K.; Zeng, Z. R.; Wang, B. J.; Sheng, L. Y.; Chen, X. B.; Han, E. H. , Effect of volume fraction of LPSO phases on corrosion and mechanical properties of Mg-Zn-Y alloys. Mater. Des. 2017, 121, 430–441. [Google Scholar] [CrossRef]
- Pan, F.-s.; Luo, S.-q.; Tang, A.-t.; Peng, J.; Lu, Y. , Influence of stacking fault energy on formation of long period stacking ordered structures in Mg–Zn–Y–Zr alloys. Progress in Natural Science: Materials International 2011, 21, 485–490. [Google Scholar] [CrossRef]
- Kawano, S.; Iikubo, S.; Ohtani, H. , Role of substituted atoms in stacking fault formation in long-period stacking ordered system. Computational Materials Science 2020, 171, 109210. [Google Scholar] [CrossRef]
- Datta, A.; Waghmare, U. V.; Ramamurty, U. , Structure and stacking faults in layered Mg-Zn-Y alloys: A first-principles study. Acta Mater. 2008, 56, 2531–2539. [Google Scholar] [CrossRef]
- Xu, C.; Nakata, T.; Qiao, X.; Zheng, M.; Wu, K.; Kamado, S. , Effect of LPSO and SFs on microstructure evolution and mechanical properties of Mg-Gd-Y-Zn-Zr alloy. Scientific Reports 2017, 7, 40846. [Google Scholar] [CrossRef]
- Hosokawa, S.; Maruyama, K.; Kobayashi, K.; Stellhorn, J. R.; Paulus, B.; Koura, A.; Shimojo, F.; Tsumuraya, T.; Yamasaki, M.; Kawamura, Y.; Yoshioka, S.; Sato, H. , Electronic structures and impurity cluster features in Mg-Zn-Y alloys with a synchronized long-period stacking ordered phase. J. Alloys Compd. 2018, 762, 797–805. [Google Scholar] [CrossRef]
- Kim, J.-K.; Jin, L.; Sandlöbes, S.; Raabe, D. , Diffusional-displacive transformation enables formation of long-period stacking order in magnesium. Scientific Reports 2017, 7, 4046. [Google Scholar] [CrossRef]
- Nie, J. F.; Wilson, N. C.; Zhu, Y. M.; Xu, Z. , Solute clusters and GP zones in binary Mg–RE alloys. Acta Mater. 2016, 106, 260–271. [Google Scholar] [CrossRef]
- Okuda, H.; Yamasaki, M.; Kawamura, Y. , Transition to long period stacking ordered structures in Mg85Gd9Zn6 alloys from amorphous ribbons examined by synchrotron radiation scattering: Comparison with Mg85Y9Zn6 alloys. Scripta Mater. 2017, 139, 26–29. [Google Scholar] [CrossRef]
- Yokobayashi, H.; Kishida, K.; Inui, H.; Yamasaki, M.; Kawamura, Y. , Enrichment of Gd and Al atoms in the quadruple close packed planes and their in-plane long-range ordering in the long period stacking-ordered phase in the Mg–Al–Gd system. Acta Mater. 2011, 59, 7287–7299. [Google Scholar] [CrossRef]
- Egusa, D.; Abe, E. , The structure of long period stacking/order Mg–Zn–RE phases with extended non-stoichiometry ranges. Acta Mater. 2012, 60, 166–178. [Google Scholar] [CrossRef]
- Kekule, T.; Smola, B.; Vlach, M.; Kudrnova, H.; Kodetova, V.; Stulikova, I. , Thermal stability and microstructure development of cast and powder metallurgy produced Mg–Y–Zn alloy during heat treatment. J. Magnes. Alloy 2017, 5, 173–180. [Google Scholar] [CrossRef]
- Liao, H.; Kim, J.; Lee, T.; Song, J.; Peng, J.; Jiang, B.; Pan, F. , Effect of heat treatment on LPSO morphology and mechanical properties of Mg–Zn–Y–Gd alloys. J. Magnes. Alloy 2020, 8, 1120–1127. [Google Scholar] [CrossRef]
- Shao, J.; Chen, Z.; Chen, T.; Hu, Z.; Zhou, X.; Liu, C. , The effect of LPSO on the deformation mechanism of Mg–Gd–Y–Zn–Zr magnesium alloy. J. Magnes. Alloy 2016, 4, 83–88. [Google Scholar] [CrossRef]
- Abe, E.; Ono, A.; Itoi, T.; Yamasaki, M.; Kawamura, Y. , Polytypes of long-period stacking structures synchronized with chemical order in a dilute Mg–Zn–Y alloy. Philos. Mag. Lett. 2011, 91, 690–696. [Google Scholar] [CrossRef]
- Kawamura, Y. , Material Characteristics and Future Perspective on LPSO-type Magnesium Alloys. Materia Japan 2015, 54, 44–49. [Google Scholar] [CrossRef]
- Kawamura, Y.; Yamasaki, M. , Formation and Mechanical Properties of Mg<SUB>97</SUB>Zn<SUB>1</SUB>RE<SUB>2</SUB> Alloys with Long-Period Stacking Ordered Structure. Mater. Trans. 2007, 48, 2986–2992. [Google Scholar]
- Emura, S.; Ji, X. , Introduction of Mille-Feuille-Like α/β Layered Structure into Ti–Mo Alloy. Mater. Trans. 2020, 61, 856–861. [Google Scholar] [CrossRef]
- Hagihara, K.; Ueyama, R.; Yamasaki, M.; Kawamura, Y.; Nakano, T. , Surprising increase in yield stress of Mg single crystal using long-period stacking ordered nanoplates. Acta Mater. 2021, 209, 116797. [Google Scholar] [CrossRef]
- Kawamura, Y.; Yamagata, H.; Inoue, S.-i.; Kiguchi, T.; Chattopadhyay, K. , Kink bands and strengthening of millefeuille-structured magnesium alloys by cluster-arranged nanoplates (CANaPs): The case of Mg-0.4Zn-1.0Y alloy. J. Alloys Compd. 2023, 939, 168607. [Google Scholar] [CrossRef]
- Liu, H.; Briffod, F.; Shiraiwa, T.; Enoki, M.; Emura, S. , Clustering Analysis of Acoustic Emission Signals during Compression Tests in Mille-Feuille Structure Materials. Mater. Trans. 2022, 63, 319–328. [Google Scholar] [CrossRef]
- Jian, W. W.; Cheng, G. M.; Xu, W. Z.; Koch, C. C.; Wang, Q. D.; Zhu, Y. T.; Mathaudhu, S. N. , Physics and model of strengthening by parallel stacking faults. Appl. Phys. Lett. 2013, 103. [Google Scholar] [CrossRef]
- Kubásek, J.; Dvorský, D.; Čavojský, M.; Vojtěch, D.; Beronská, N.; Fousová, M. , Superior Properties of Mg–4Y–3RE–Zr Alloy Prepared by Powder Metallurgy. J. Mater. Sci. Technol. 2017, 33, 652–660. [Google Scholar] [CrossRef]
- Mora, E.; Garces, G.; Onorbe, E.; Perez, P.; Adeva, P. , High-strength Mg-Zn-Y alloys produced by powder metallurgy. Scripta Mater. 2009, 60, 776–779. [Google Scholar] [CrossRef]
- Oñorbe, E.; Garcés, G.; Pérez, P.; Adeva, P. , Effect of the LPSO volume fraction on the microstructure and mechanical properties of Mg–Y2X–Zn X alloys. J. Mater. Sci. 2012, 47, 1085–1093. [Google Scholar] [CrossRef]
- Bohlen, J.; Yi, S. B.; Letzig, D.; Kainer, K. U. , Effect of rare earth elements on the microstructure and texture development in magnesium-manganese alloys during extrusion. Mater. Sci. Eng., A 2010, 527, 7092–7098. [Google Scholar] [CrossRef]
- Hagihara, K.; Kinoshita, A.; Sugino, Y.; Yamasaki, M.; Kawamura, Y.; Yasuda, H. Y.; Umakoshi, Y. , Plastic deformation behavior of Mg97Zn1Y2 extruded alloys. T. Nonferr. Metal. Soc. 2010, 20, 1259–1268. [Google Scholar] [CrossRef]
- Gong, W.; Aizawa, K.; Harjo, S.; Zheng, R.; Kawasaki, T.; Abe, J.; Kamiyama, T.; Tsuji, N. , Deformation behavior of as-cast and as-extruded Mg97Zn1Y2 alloys during compression, as tracked by in situ neutron diffraction. Int. J. Plast. 2018, 111, 288–306. [Google Scholar] [CrossRef]
- Chino, Y.; Kimura, K.; Mabuchi, M. , Twinning behavior and deformation mechanisms of extruded AZ31 Mg alloy. Mater. Sci. Eng., A 2008, 486, 481–488. [Google Scholar] [CrossRef]
- Dvorský, D.; Inoue, S.-I.; Yoshida, A.; Kubásek, J.; Duchoň, J.; de Prado, E.; Školáková, A.; Hosová, K.; Svora, P.; Kawamura, Y. , Advantages of rapid solidification over casting of Mg-0.4Zn-1Y alloy. J. Magnes. Alloy 2024, 12, 2847–2862. [Google Scholar] [CrossRef]
- Müller, L.; Müller, F. A. , Preparation of SBF with different HCO3- content and its influence on the composition of biomimetic apatites. Acta Biomater. 2006, 2, 181–189. [Google Scholar] [CrossRef]
- Atrens, A.; Shi, Z.; Mehreen, S. U.; Johnston, S.; Song, G.-L.; Chen, X.; Pan, F. , Review of Mg alloy corrosion rates. J. Magnes. Alloy 2020, 8, 989–998. [Google Scholar] [CrossRef]
- Song, G.; Atrens, A. , Understanding Magnesium Corrosion—A Framework for Improved Alloy Performance. Adv. Eng. Mater. 2003, 5, 837–858. [Google Scholar] [CrossRef]
- Song, G. L.; Atrens, A. , Corrosion Mechanisms of Magnesium Alloys. Adv. Eng. Mater. 1999, 1, 11–33. [Google Scholar] [CrossRef]
- Zhou, Y.; Mao, P.; Zhou, L.; Wang, Z.; Wang, F.; Liu, Z. , Effect of long-period stacking ordered phase on hot tearing susceptibility of Mg–1Zn–xY alloys. J. Magnes. Alloy 2020, 8, 1176–1185. [Google Scholar] [CrossRef]
- Morikawa, T.; Kaneko, K.; Higashida, K.; Kinoshita, D.; Takenaka, M.; Kawamura, Y. , The Fine-Grained Structure in Magnesium Alloy Containing Long-Period Stacking Order Phase. Mater. Trans. 2008, 49, 1294–1297. [Google Scholar] [CrossRef]
- Liu, H.; Xue, F.; Bai, J.; Zhou, J.; Sun, Y.-s. , Microstructure and mechanical properties of Mg94Zn2Y4 extruded alloy with long-period stacking ordered structure. T. Nonferr. Metal. Soc. 2013, 23, 3598–3603. [Google Scholar] [CrossRef]
- Minárik, P.; Zemková, M.; Lukáč, F.; Bohlen, J.; Knapek, M.; Král, R. , Microstructure of the novel biomedical Mg–4Y–3Nd alloy prepared by spark plasma sintering. J. Alloys Compd. 2020, 819, 153008. [Google Scholar] [CrossRef]
- Hagihara, K.; Kinoshita, A.; Sugino, Y.; Yamasaki, M.; Kawamura, Y.; Yasuda, H. Y.; Umakoshi, Y. , Effect of long-period stacking ordered phase on mechanical properties of Mg97Zn1Y2 extruded alloy. Acta Mater. 2010, 58, 6282–6293. [Google Scholar] [CrossRef]
- Rosalie, J. M.; Somekawa, H.; Singh, A.; Mukai, T. , Effect of precipitation on strength and ductility in a Mg–Zn–Y alloy. J. Alloys Compd. 2013, 550, 114–123. [Google Scholar] [CrossRef]
- Molodov, K. D.; Al-Samman, T.; Molodov, D. A. , On the Plasticity and Deformation Mechanisms in Magnesium Crystals. Metals 2023, 13, 640. [Google Scholar] [CrossRef]
- Chaudry, U. M.; Tariq, H. M. R.; Zubair, M.; Ansari, N.; Jun, T.-S. , Implications of twinning on the microstructure development, crystallographic texture and mechanical performance of Mg alloys- a critical review. J. Magnes. Alloy 2023, 11, 4146–4165. [Google Scholar] [CrossRef]
- Wang, H.-Y.; Yu, Z.-P.; Zhang, L.; Liu, C.-G.; Zha, M.; Wang, C.; Jiang, Q.-C. , Achieving high strength and high ductility in magnesium alloy using hard-plate rolling (HPR) process. Scientific reports 2015, 5, 17100–17100. [Google Scholar] [CrossRef]
- Hama, T.; Kariyazaki, Y.; Hosokawa, N.; Fujimoto, H.; Takuda, H. , Work-hardening behaviors of magnesium alloy sheet during in-plane cyclic loading. Mater. Sci. Eng., A 2012, 551, 209–217. [Google Scholar] [CrossRef]
- Shi, Q.-x.; Wang, C.-j.; Deng, K.-k.; Nie, K.-b.; Cao, M.; Gan, W.-m.; Liang, W. , Work hardening and softening behavior of pure Mg influenced by Zn addition investigated via in-situ neutron diffraction. Mater. Sci. Eng., A 2020, 772, 138827. [Google Scholar] [CrossRef]
- Miura, S.; Imagawa, S.; Toyoda, T.; Ohkubo, K.; Mohri, T. , Effect of Rare-Earth Elements Y and Dy on the Deformation Behavior of Mg Alloy Single Crystals. Mater. Trans. 2008, 49, 952–956. [Google Scholar] [CrossRef]
- Matsumoto, T.; Yamasaki, M.; Hagihara, K.; Kawamura, Y. , Configuration of dislocations in low-angle kink boundaries formed in a single crystalline long-period stacking ordered Mg-Zn-Y alloy. Acta Mater. 2018, 151, 112–124. [Google Scholar] [CrossRef]
- Yamasaki, M.; Matsumoto, T.; Mayama, T.; Somekawa, H.; Hagihara, K.; Nishimoto, S.; Kawamura, Y. , Dynamic recovery around deformation kink boundary of Mg-Y-Zn alloy with long-period stacking ordered structure. Mater. Lett. 2024, 377, 137360. [Google Scholar] [CrossRef]
- Matsuda, M.; Ii, S.; Kawamura, Y.; Ikuhara, Y.; Nishida, M. , Interaction between long period stacking order phase and deformation twin in rapidly solidified Mg97Zn1Y2 alloy. Mater. Sci. Eng., A 2004, 386, 447–452. [Google Scholar] [CrossRef]
- Meyers, M. A.; Vöhringer, O.; Lubarda, V. A. , The onset of twinning in metals: a constitutive description. Acta Mater. 2001, 49, 4025–4039. [Google Scholar] [CrossRef]
- Somekawa, H.; Ando, D.; Hagihara, K.; Yamasaki, M.; Kawamura, Y. , Intrinsic kink bands strengthening induced by several wrought-processes in Mg-Y-Zn alloys containing LPSO phase. Mater. Charact. 2021, 179, 111348. [Google Scholar] [CrossRef]
- Dvorský, D.; Kubásek, J.; Voňavková, I.; Vojtěch, D. , Structure, mechanical and corrosion properties of extruded Mg-Nd-Zn, Mg-Y-Zn and Mg-Y-Nd alloys. Mater. Sci. Technol. 2019, 35, 520–529. [Google Scholar] [CrossRef]
- Zhang, X.; Yuan, G.; Mao, L.; Niu, J.; Fu, P.; Ding, W. , Effects of extrusion and heat treatment on the mechanical properties and biocorrosion behaviors of a Mg–Nd–Zn–Zr alloy. J. Mech. Behav. Biomed. 2012, 7, 77–86. [Google Scholar] [CrossRef] [PubMed]
- Zhang, X. B.; Wang, Z. Z.; Yuan, G. Y.; Xue, Y. J. , Improvement of mechanical properties and corrosion resistance of biodegradable Mg-Nd-Zn-Zr alloys by double extrusion. Materials Science and Engineering B-Advanced Functional Solid-State Materials 2012, 177, 1113–1119. [Google Scholar] [CrossRef]
- Witte, F.; Hort, N.; Vogt, C.; Cohen, S.; Kainer, K. U.; Willumeit, R.; Feyerabend, F. , Degradable biomaterials based on magnesium corrosion. Curr. Opin. Solid State Mater. Sci. 2008, 12, 63–72. [Google Scholar] [CrossRef]
- Vojtěch, D.; Kubásek, J.; Šerák, J.; Novák, P. , Mechanical and corrosion properties of newly developed biodegradable Zn-based alloys for bone fixation. Acta Biomater. 2011, 7, 3515–3522. [Google Scholar] [CrossRef]
- Dvorský, D.; Kubásek, J.; Vojtěch, D. , AZ31 and WE43 alloys for biomedical applications. In Solid State Phenomena, 2017; Vol. 270 SSP, pp 205-211.
- Xu, D.; Han, E.-h.; Xu, Y. , Effect of long-period stacking ordered phase on microstructure, mechanical property and corrosion resistance of Mg alloys: A review. Progress in Natural Science: Materials International 2016, 26, 117–128. [Google Scholar] [CrossRef]
- Zhang, X.; Yuan, G.; Mao, L.; Niu, J.; Ding, W. , Biocorrosion properties of as-extruded Mg–Nd–Zn–Zr alloy compared with commercial AZ31 and WE43 alloys. Mater. Lett. 2012, 66, 209–211. [Google Scholar] [CrossRef]
- Liu, D.; Ding, Y.; Guo, T.; Qin, X.; Guo, C.; Yu, S.; Lin, S. , Influence of fine-grain and solid-solution strengthening on mechanical properties and in vitro degradation of WE43 alloy. Biomed. Mater. 2014, 9, 015014. [Google Scholar] [CrossRef]
- Cabeza, S.; Garcés, G.; Pérez, P.; Adeva, P. , Properties of WZ21 (%wt) alloy processed by a powder metallurgy route. J. Mech. Behav. Biomed. 2015, 46, 115–126. [Google Scholar] [CrossRef] [PubMed]
- Ruan, Y.; Xia, S.; Li, C.; Guo, C.; Du, Z. , Experimental study on the microstructure and mechanical properties of the Mg-Y-Zn alloys with LPSO phases tailored by CALPHAD method. J. Alloys Compd. 2023, 965, 171414. [Google Scholar] [CrossRef]
- Nishimoto, S.; Koguchi, Y.; Yamasaki, M.; Kawamura, Y. , Effect of hierarchical multimodal microstructure evolution on tensile properties and fracture toughness of rapidly solidified Mg–Zn–Y–Al alloys with LPSO phase. Mater. Sci. Eng., A 2022, 832, 142348. [Google Scholar] [CrossRef]
- Nishimoto, S.; Yamasaki, M.; Kawamura, Y. , Improving fracture toughness of rapidly solidified Mg–Zn–Y alloys by controlling precipitation of cluster-arranged nanoplates and LPSO phases. J. Alloys Compd. 2025, 178720. [Google Scholar] [CrossRef]
- Ezechieli, M.; Ettinger, M.; Konig, C.; Weizbauer, A.; Helmecke, P.; Schavan, R.; Lucas, A.; Windhagen, H.; Becher, C. , Biomechanical characteristics of bioabsorbable magnesium-based (MgYREZr-alloy) interference screws with different threads. Knee Surg Sports Traumatol Arthrosc 2016, 24, 3976–3981. [Google Scholar] [CrossRef]
- Ben-Hamu, G.; Eliezer, D.; Shin, K. S.; Cohen, S. , The relation between microstructure and corrosion behavior of Mg-Y-RE-Zr alloys. J. Alloys Compd.
- Tan, L. L.; Yu, X. M.; Wan, P.; Yang, K. , Biodegradable Materials for Bone Repairs: A Review. J. Mater. Sci. Technol. 2013, 29, 503–513. [Google Scholar] [CrossRef]
- Liu, M.; Schmutz, P.; Uggowitzer, P. J.; Song, G.; Atrens, A. , The influence of yttrium (Y) on the corrosion of Mg–Y binary alloys. Corros. Sci. 2010, 52, 3687–3701. [Google Scholar] [CrossRef]
- Yao, H. B.; Li, Y.; Wee, A. T. S. , Passivity behavior of melt-spun Mg–Y Alloys. Electrochim. Acta 2003, 48, 4197–4204. [Google Scholar] [CrossRef]
- Hänzi, A. C.; Gunde, P.; Schinhammer, M.; Uggowitzer, P. J. , On the biodegradation performance of an Mg–Y–RE alloy with various surface conditions in simulated body fluid. Acta Biomater. 2009, 5, 162–171. [Google Scholar] [CrossRef]
- Birbilis, N.; Easton, M. A.; Sudholz, A. D.; Zhu, S. M.; Gibson, M. A. , On the corrosion of binary magnesium-rare earth alloys. Corros. Sci. 2009, 51, 683–689. [Google Scholar] [CrossRef]
- Dvorský, D.; Kubásek, J.; Vojtech, D.; Vavrík, J. In Microstructure and mechanical properties of extruded Mg-2Y-1Zn magnesium alloy, METAL 2017 - 26th International Conference on Metallurgy and Materials, Conference Proceedings, 2017; pp 1519-1523.
- Nakatsugawa, I.; Chino, Y. , Effect of Area Ratio on the Galvanic Corrosion of AZX611 Magnesium Alloy/A6N01 Aluminum Alloy Joint. Mater. Trans. 2021, 62, 1764–1770. [Google Scholar] [CrossRef]
- Liu, Y.; Liu, D.; You, C.; Chen, M. , Effects of grain size on the corrosion resistance of pure magnesium by cooling rate-controlled solidification. Frontiers of Materials Science 2015, 9, 247–253. [Google Scholar] [CrossRef]
- Dvorský, D.; Kubásek, J.; Roudnická, M.; Průša, F.; Nečas, D.; Minárik, P.; Stráská, J.; Vojtěch, D. , The effect of powder size on the mechanical and corrosion properties and the ignition temperature of WE43 alloy prepared by spark plasma sintering. J. Magnes. Alloy 2021, 9, 1349–1362. [Google Scholar] [CrossRef]
- Zheng, T.; Hu, Y.; Yang, S. , Effect of grain size on the electrochemical behavior of pure magnesium anode. J. Magnes. Alloy 2017, 5, 404–411. [Google Scholar] [CrossRef]
- Feliu, S. , Electrochemical Impedance Spectroscopy for the Measurement of the Corrosion Rate of Magnesium Alloys: Brief Review and Challenges. Metals 2020, 10, 775. [Google Scholar] [CrossRef]
- Santiago, F.; Federico, R. G.-G.; Violeta, B.; Juan, C. G.; Sebastian Feliu, B. , Tomasz, T.; Wojciech, B.; Mariusz, K., Eds. IntechOpen: Rijeka, 2018; p Ch. 2.Challenges. In Magnesium Alloys, Tomasz, T.; Wojciech, B., Ed.; Mariusz, K., Eds. IntechOpen: Rijeka, 2018; Mariusz, K., Eds. IntechOpen: Rijeka, 2018. [Google Scholar]
- Zhang, E.; He, W. W.; Du, H.; Yang, K. , Microstructure, mechanical properties and corrosion properties of Mg-Zn-Y alloys with low Zn content. Mater. Sci. Eng., A.
- Wang, J.; Wang, L.; Guan, S.; Zhu, S.; Ren, C.; Hou, S. , Microstructure and corrosion properties of as sub-rapid solidification Mg–Zn–Y–Nd alloy in dynamic simulated body fluid for vascular stent application. Journal of Materials Science: Materials in Medicine 2010, 21, 2001–2008. [Google Scholar] [CrossRef]
- Prince, L.; Noirfalise, X.; Paint, Y.; Olivier, M. , Corrosion mechanisms of AZ31 magnesium alloy: Importance of starting pH and its evolution. Mater. Corros. 2022, 73, 1615–1630. [Google Scholar] [CrossRef]
- Inoue, S.-i.; Iwanaga, K.; Kawamura, Y. , Oxidation behavior and improvement in nonflammability of LPSO-type Mg–Zn–Y–Sr alloy. J. Magnes. Alloy 2024. [Google Scholar] [CrossRef]
- Inoue, S.-i.; Yamasaki, M.; Kawamura, Y. , Classification of high-temperature oxidation behavior of Mg-1 at% X binary alloys and application of proposed taxonomy to nonflammable multicomponent Mg alloys. Corros. Sci. 2020, 174, 108858. [Google Scholar] [CrossRef]
- Liu, C.; Lu, S.; Fu, Y.; Zhang, H. , Flammability and the oxidation kinetics of the magnesium alloys AZ31, WE43, and ZE10. Corros. Sci. 2015, 100, 177–185. [Google Scholar] [CrossRef]
- Dvorsky, D.; Kubasek, J.; Hosova, K.; Cavojsky, M.; Vojtech, D. , Microstructure, Mechanical, Corrosion, and Ignition Properties of WE43 Alloy Prepared by Different Processes. Metals 2021, 11, 18. [Google Scholar] [CrossRef]
Figure 1.
Bridgman scheme.
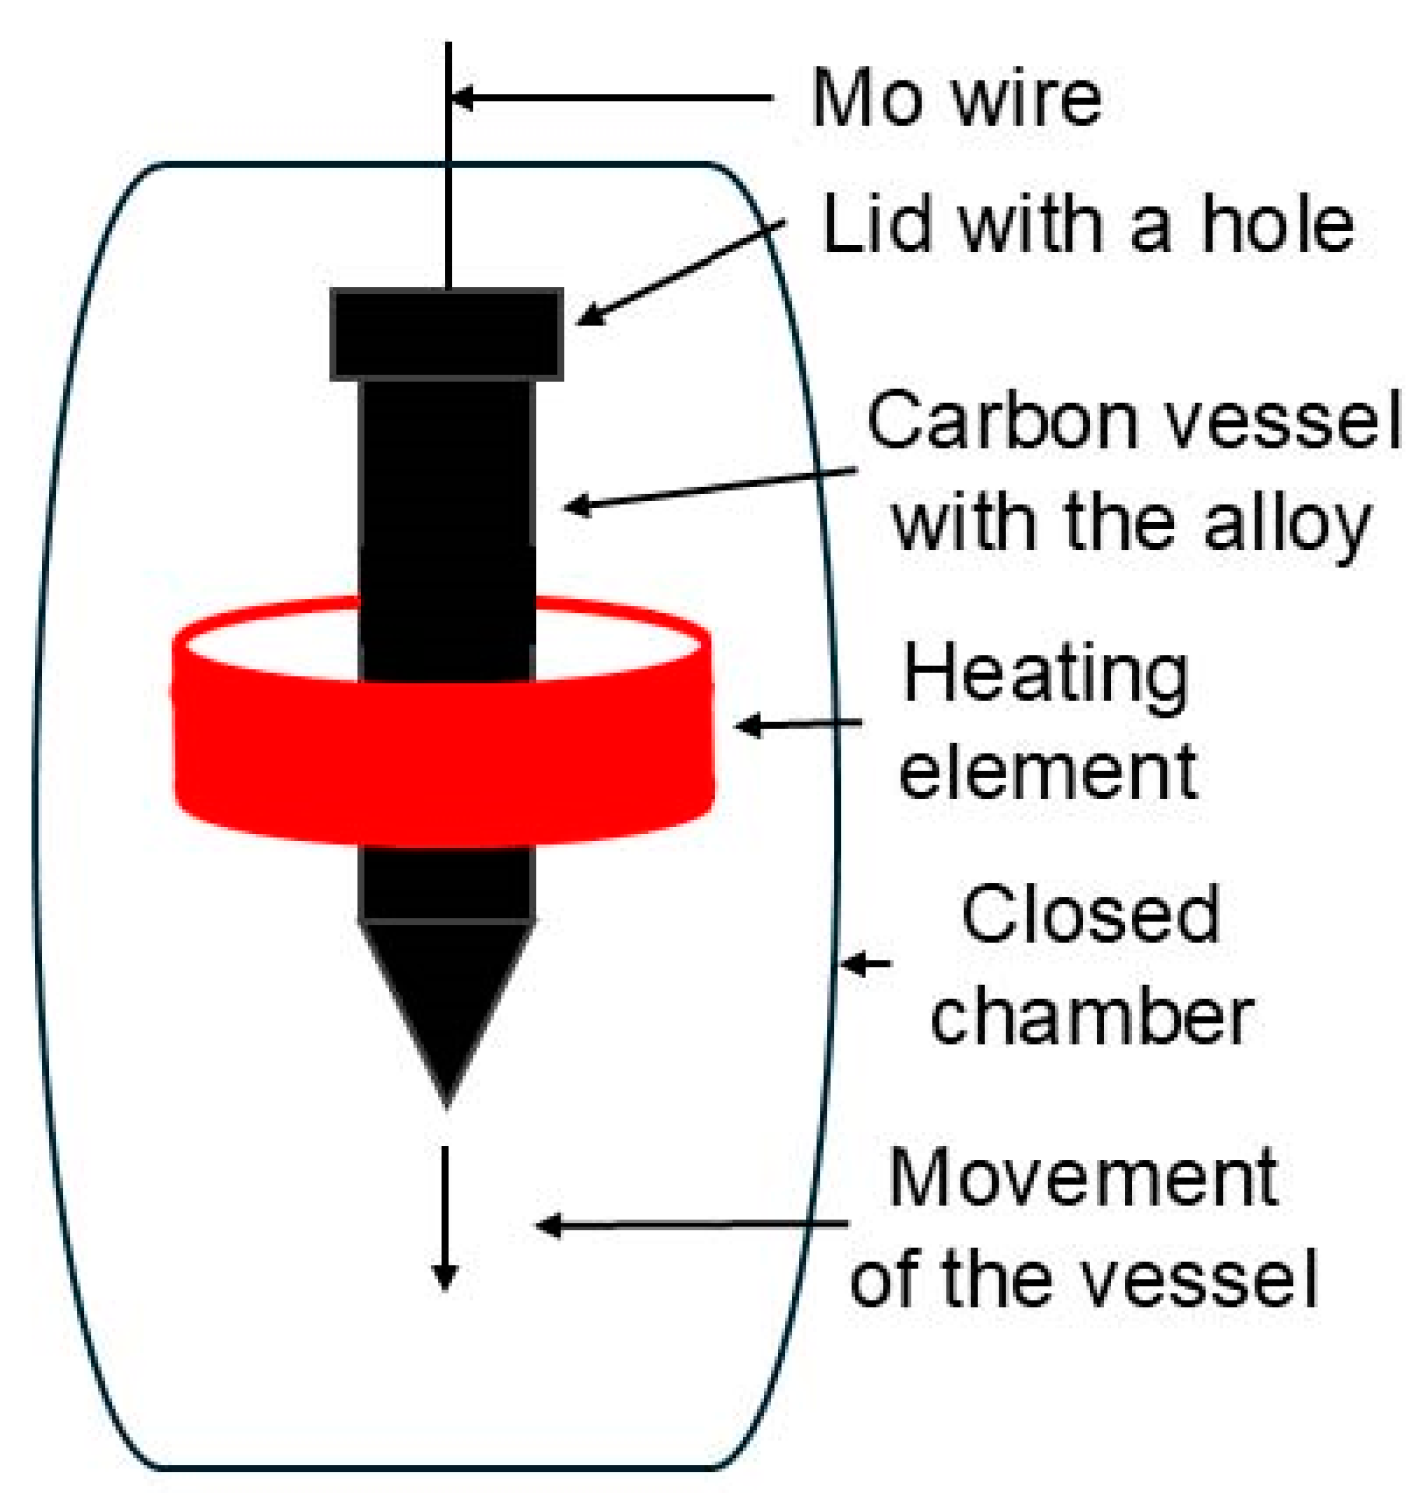
Figure 2.
Microstructure of the samples prior to extrusion - OM: A) I, B) IT4, C) IT6, D) B, E) BT4, F) BT6; BF TEM micrographs of Bridgman samples: G) MF structure H) detail of grain boundary, I) STEM detail of the surface of the sample after etching.
Figure 2.
Microstructure of the samples prior to extrusion - OM: A) I, B) IT4, C) IT6, D) B, E) BT4, F) BT6; BF TEM micrographs of Bridgman samples: G) MF structure H) detail of grain boundary, I) STEM detail of the surface of the sample after etching.
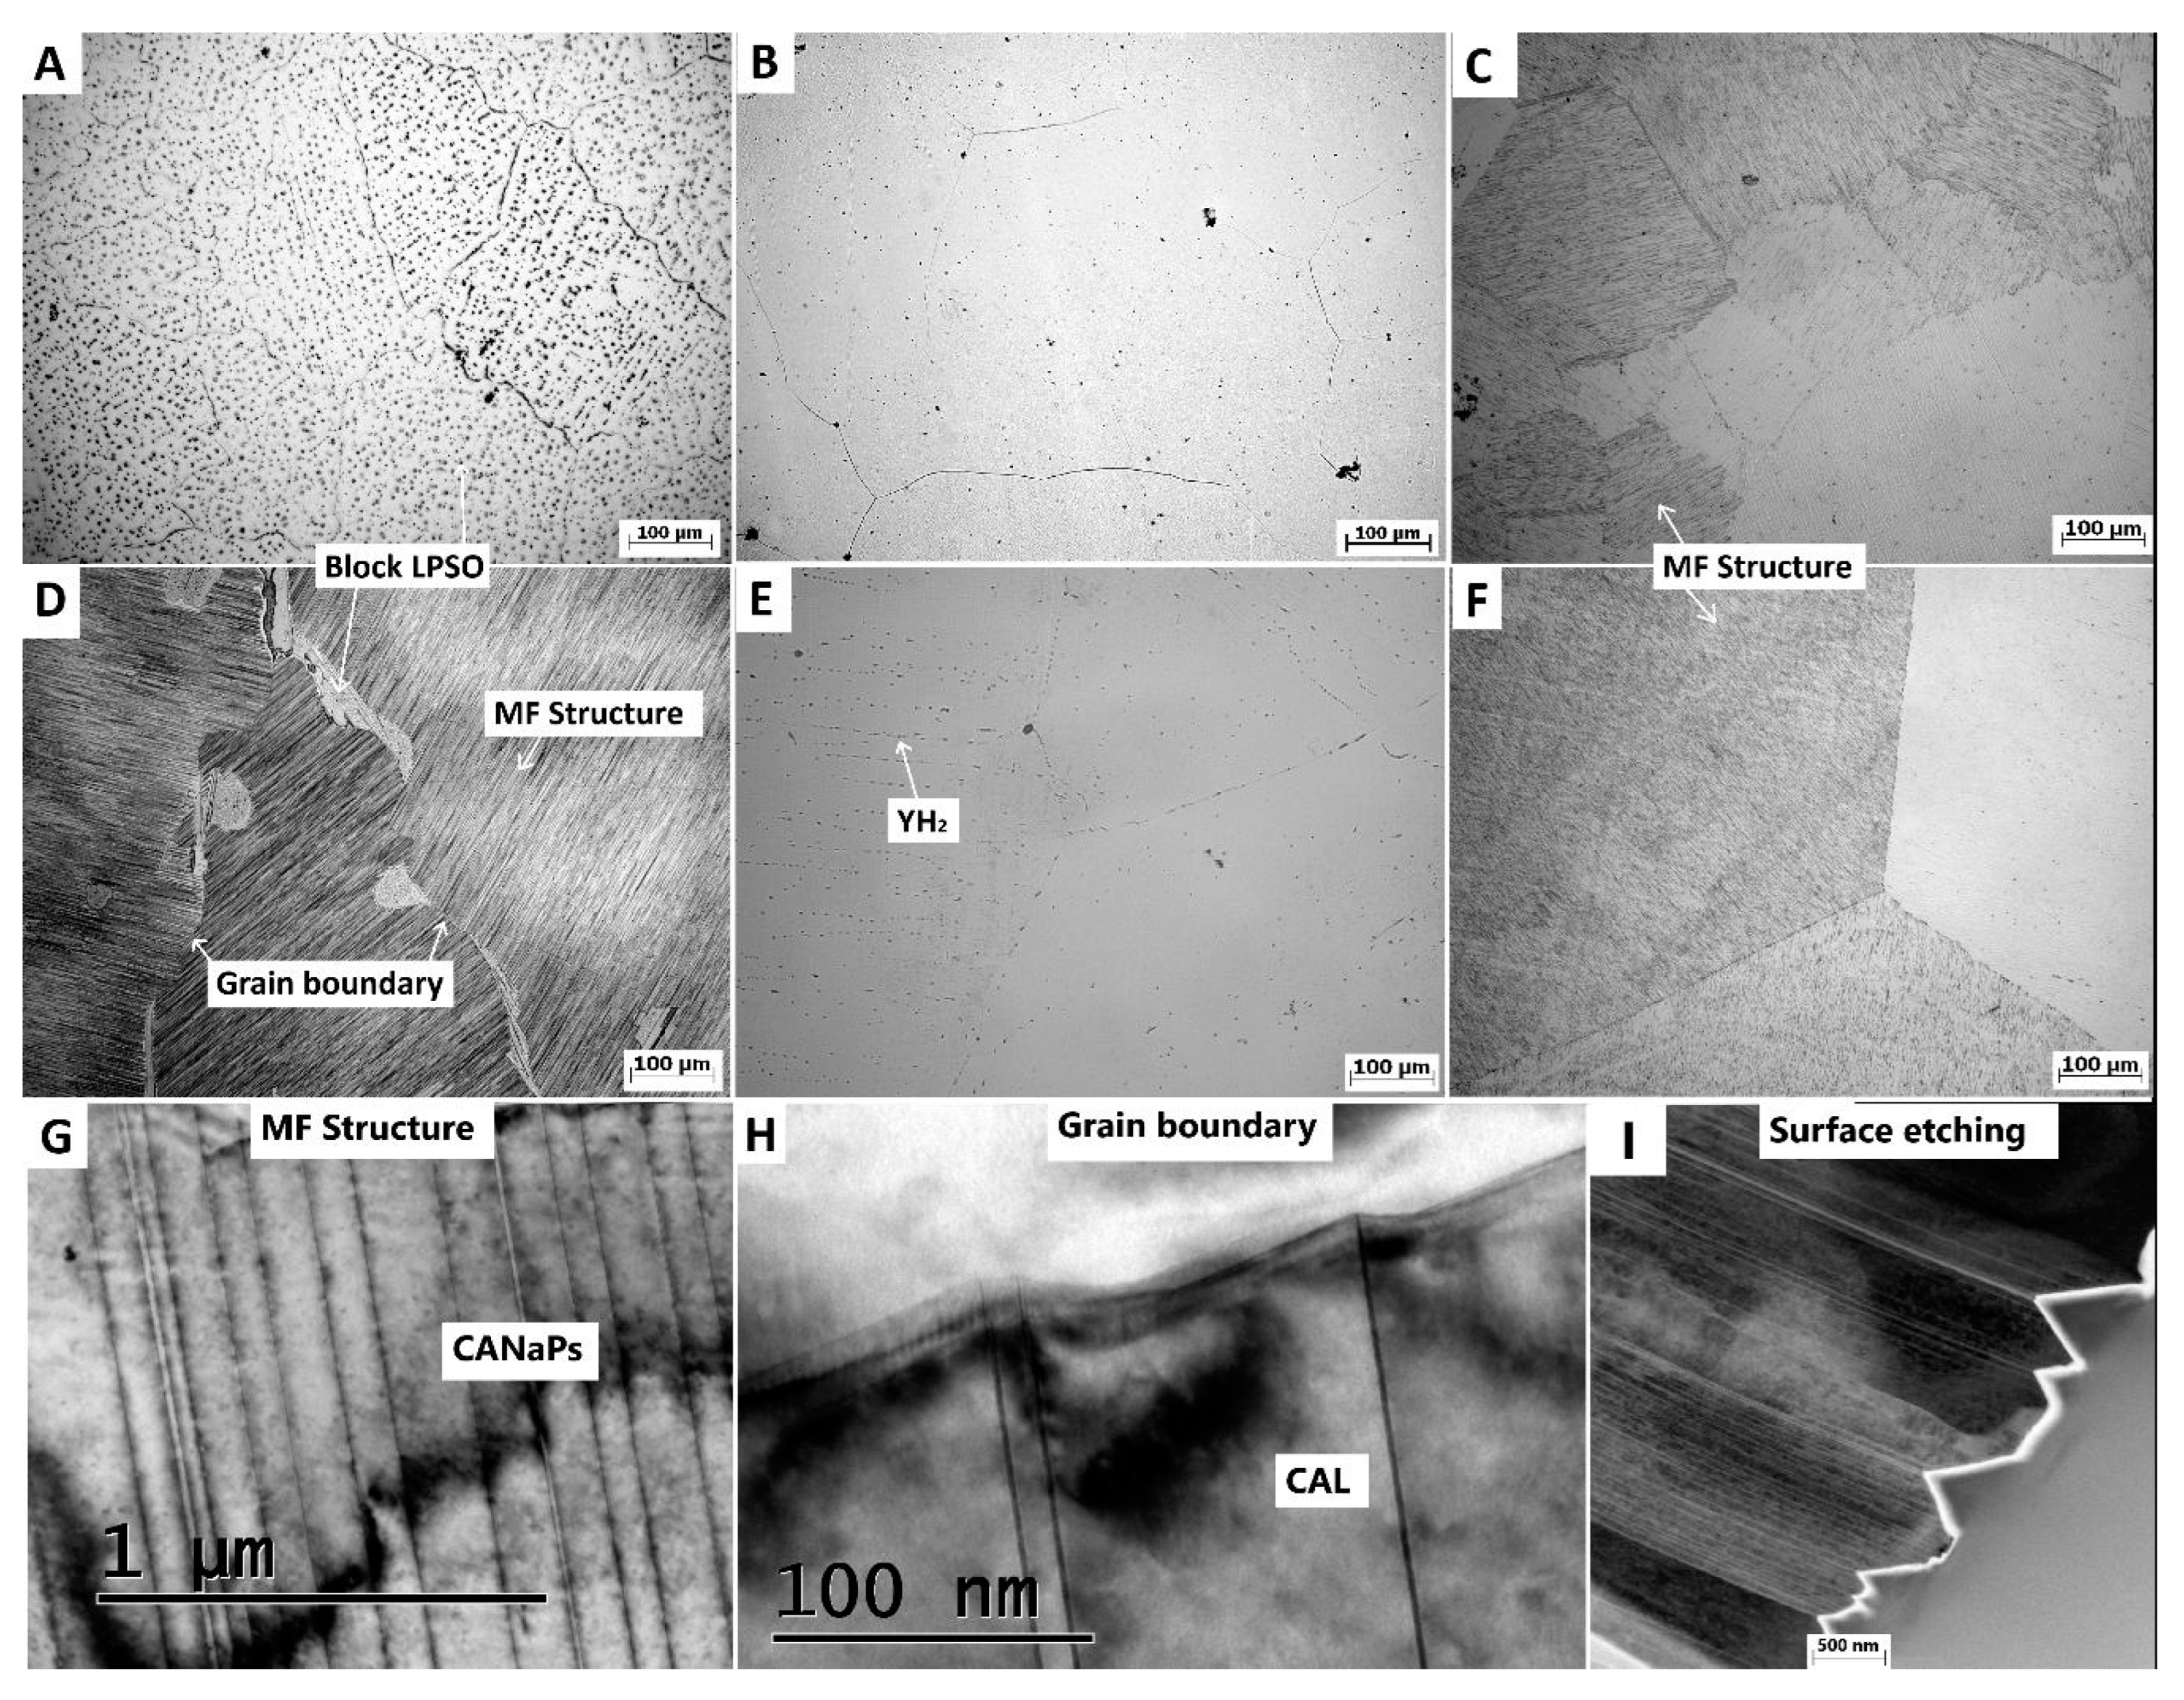
Figure 3.
Microstructures of extruded products - OM: A) IEx, B) IT4Ex, C) IT6Ex, D) BEx, E) BT4Ex, F) BT6Ex.
Figure 3.
Microstructures of extruded products - OM: A) IEx, B) IT4Ex, C) IT6Ex, D) BEx, E) BT4Ex, F) BT6Ex.
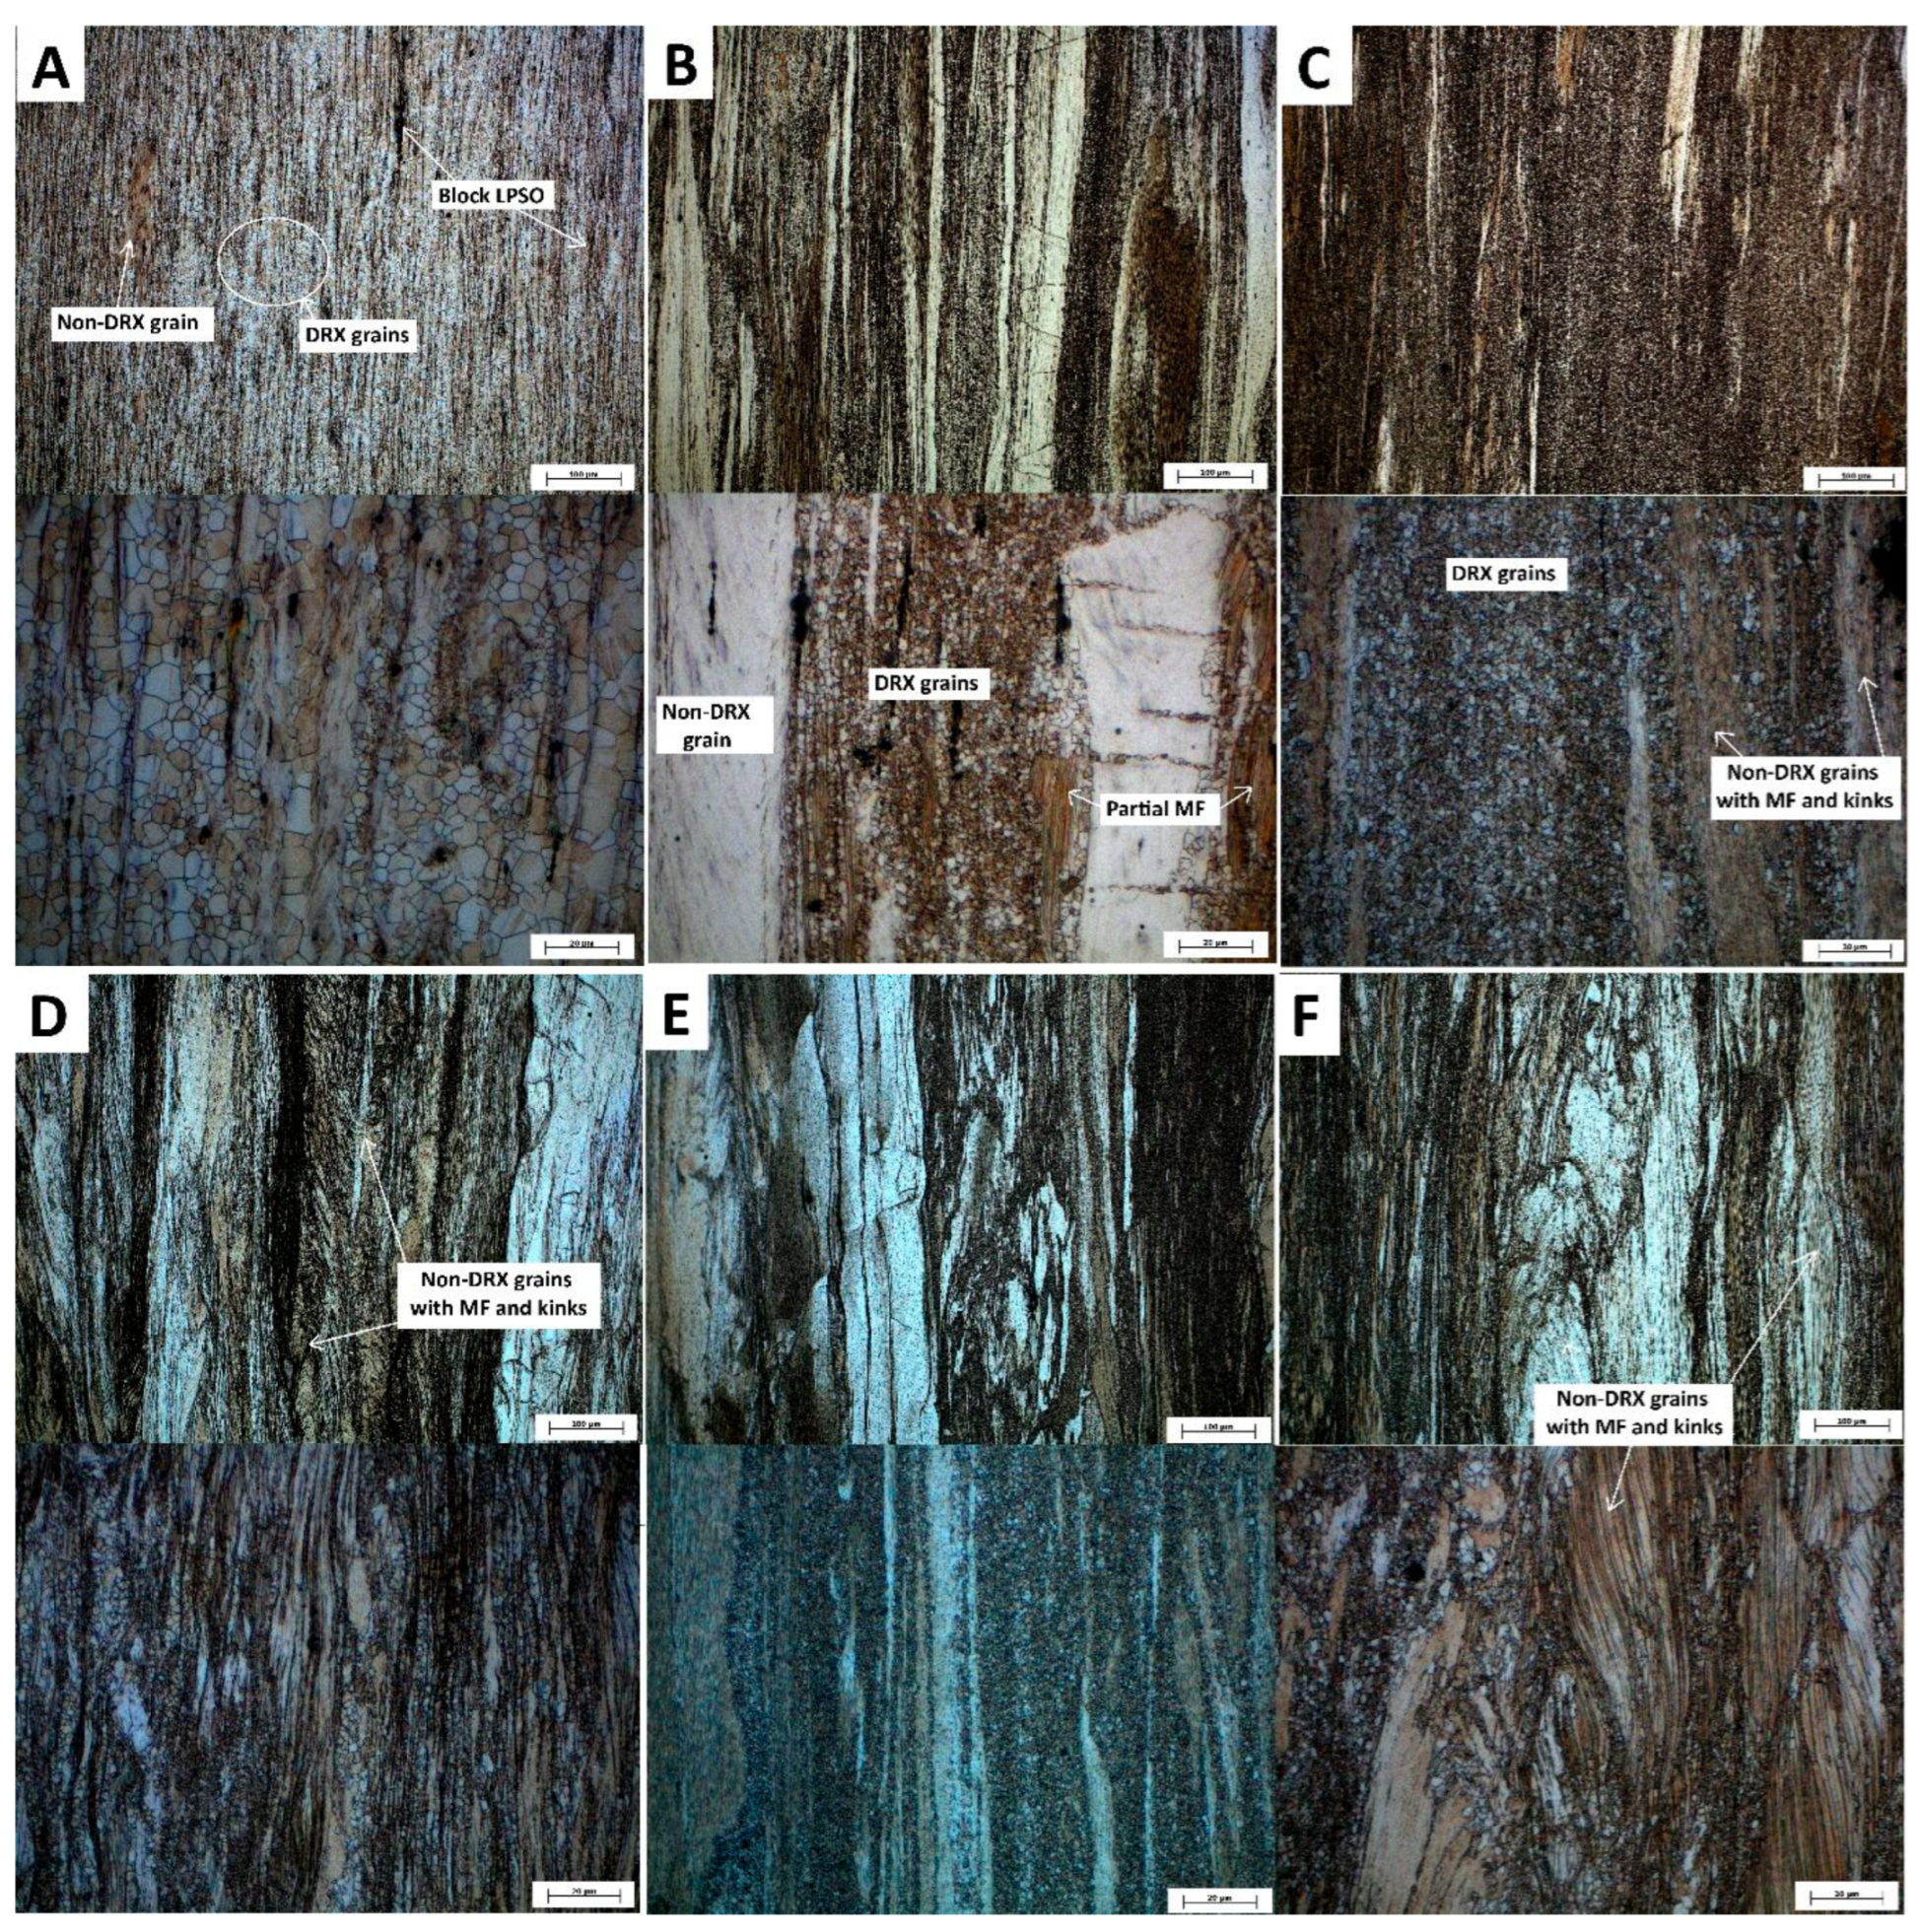
Figure 4.
Compressive curves of samples before extrusion measured at different temperatures: A) I, B) IT4, C) IT6, D) B, E) BT4, F) BT6.
Figure 4.
Compressive curves of samples before extrusion measured at different temperatures: A) I, B) IT4, C) IT6, D) B, E) BT4, F) BT6.
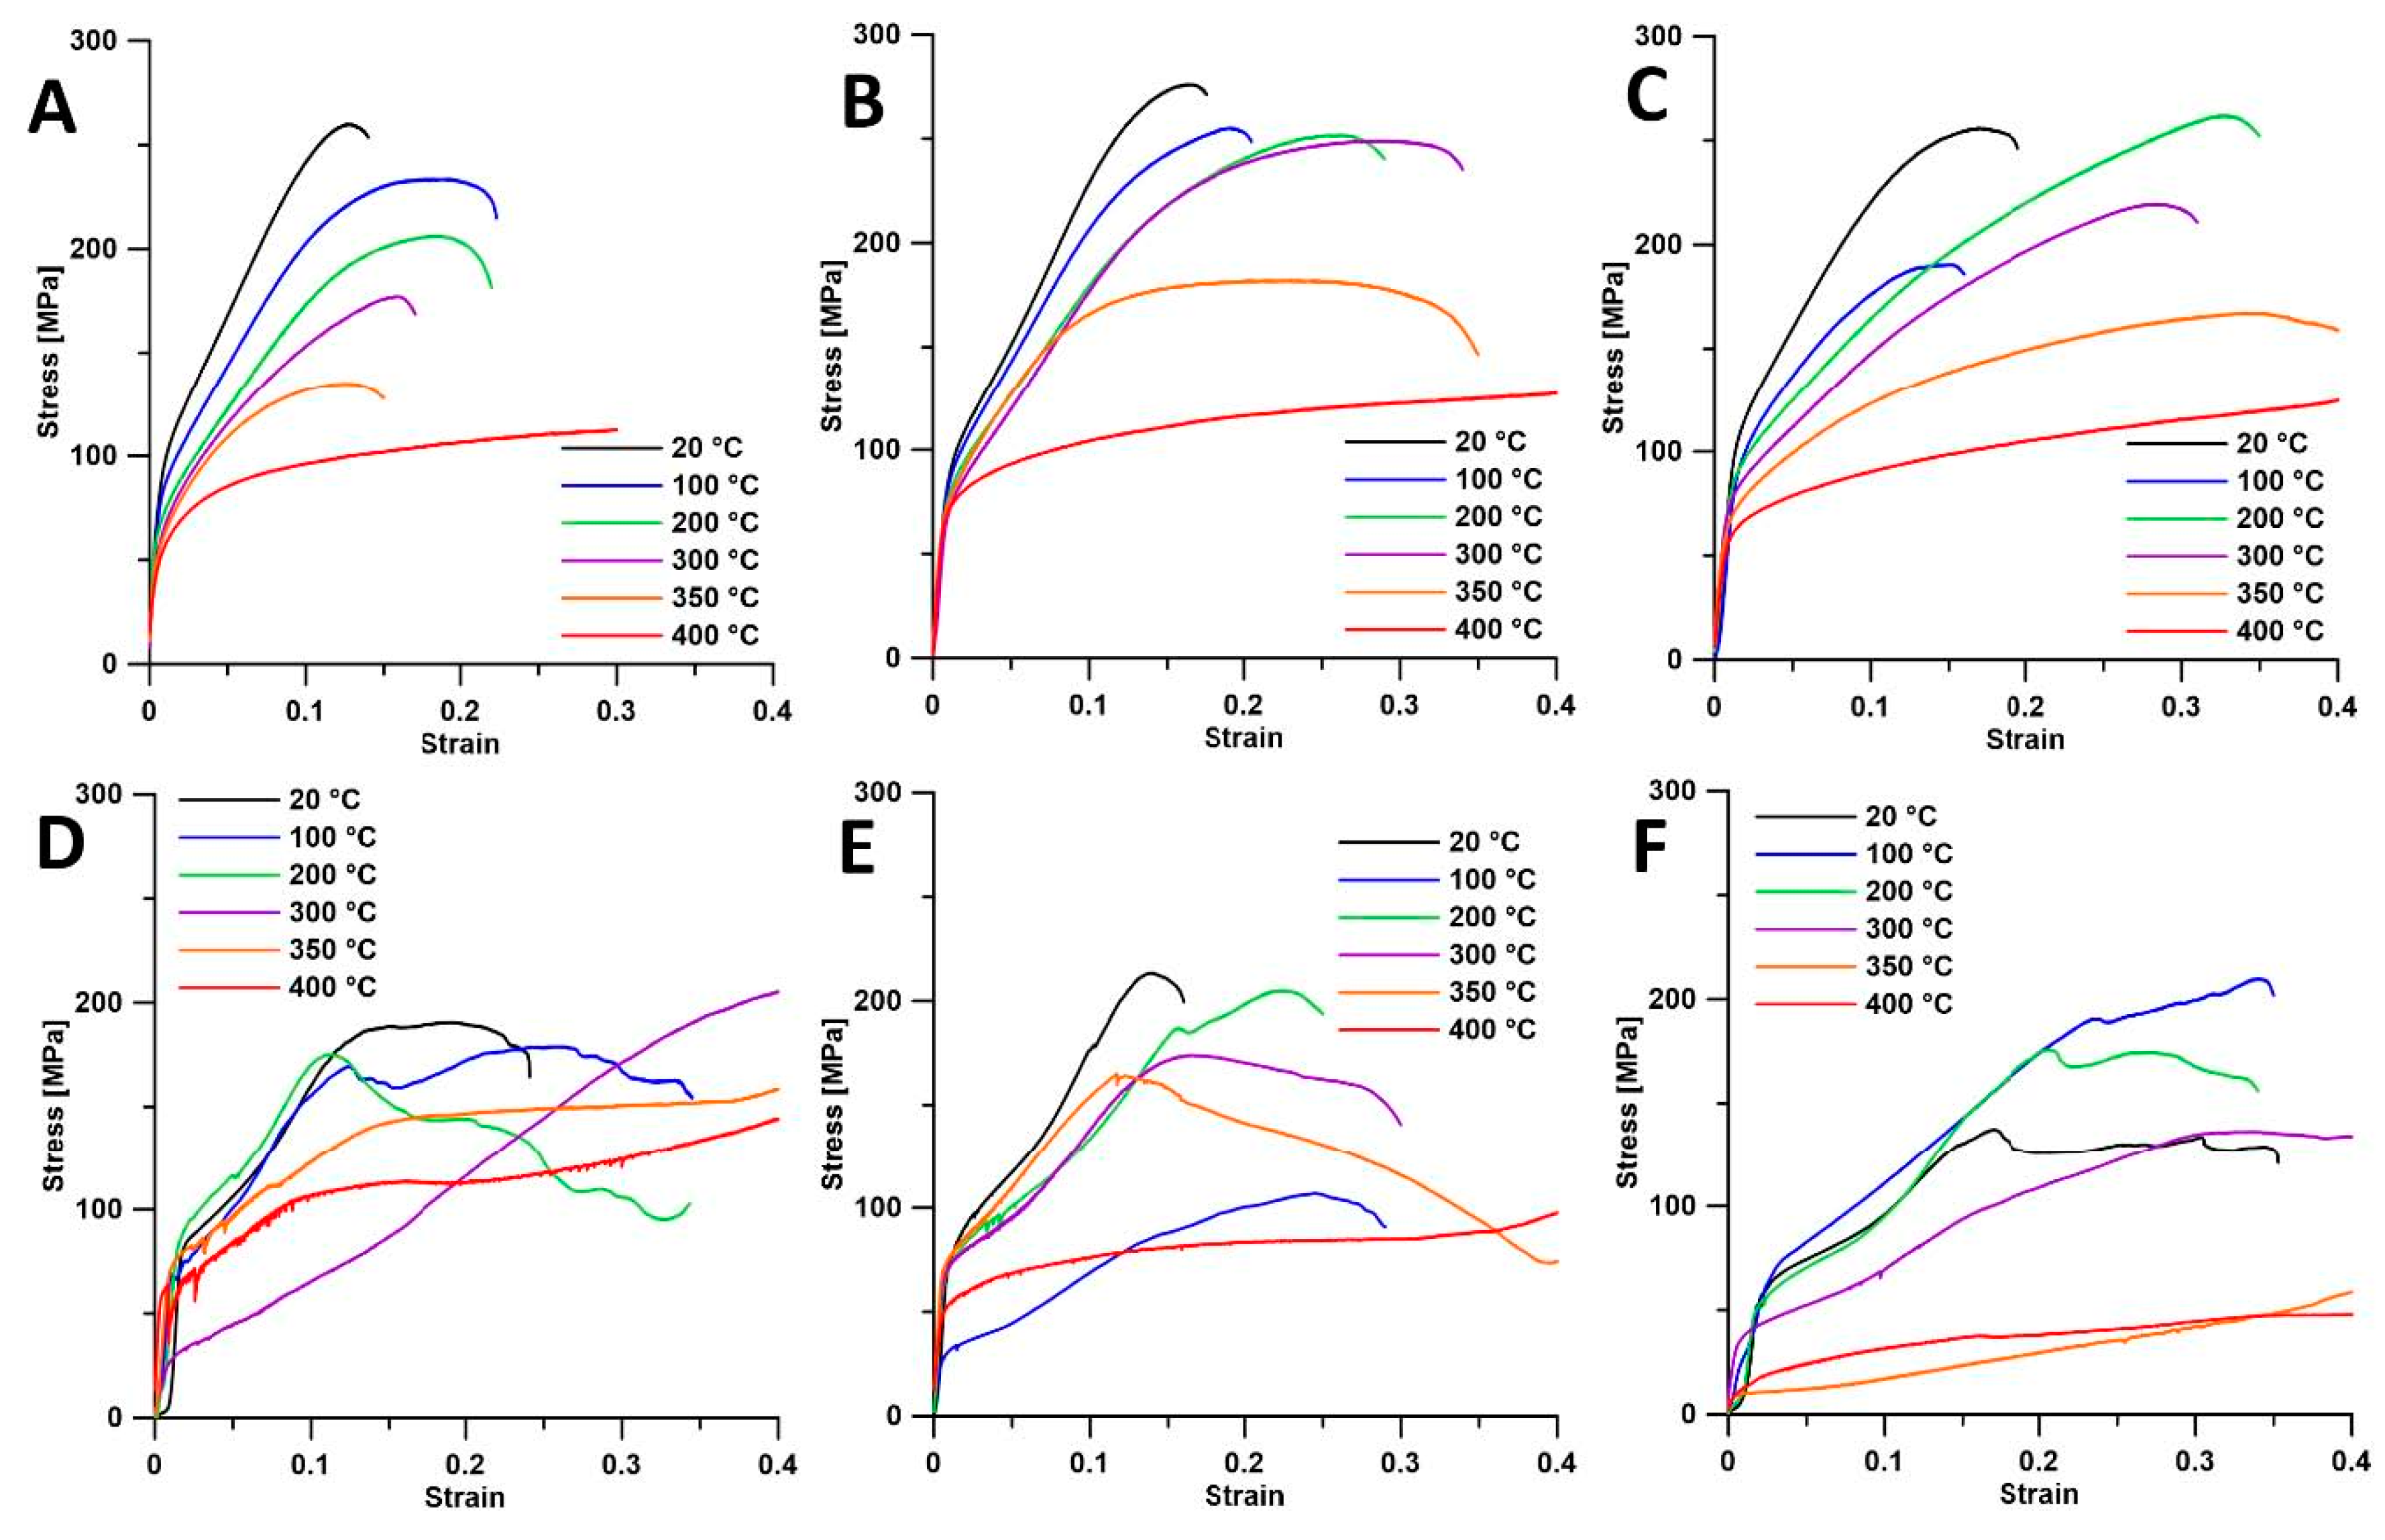
Figure 5.
Electrochemical tests – potentiodynamic curves of A) ingot samples before extrusion, B) Bridgman samples before extrusion, C) extruded ingot samples, D) extruded Bridgman samples; EIS of E) ingot samples before extrusion, F) Bridgman samples before extrusion, G) extruded ingot samples, H) extruded Bridgman samples.
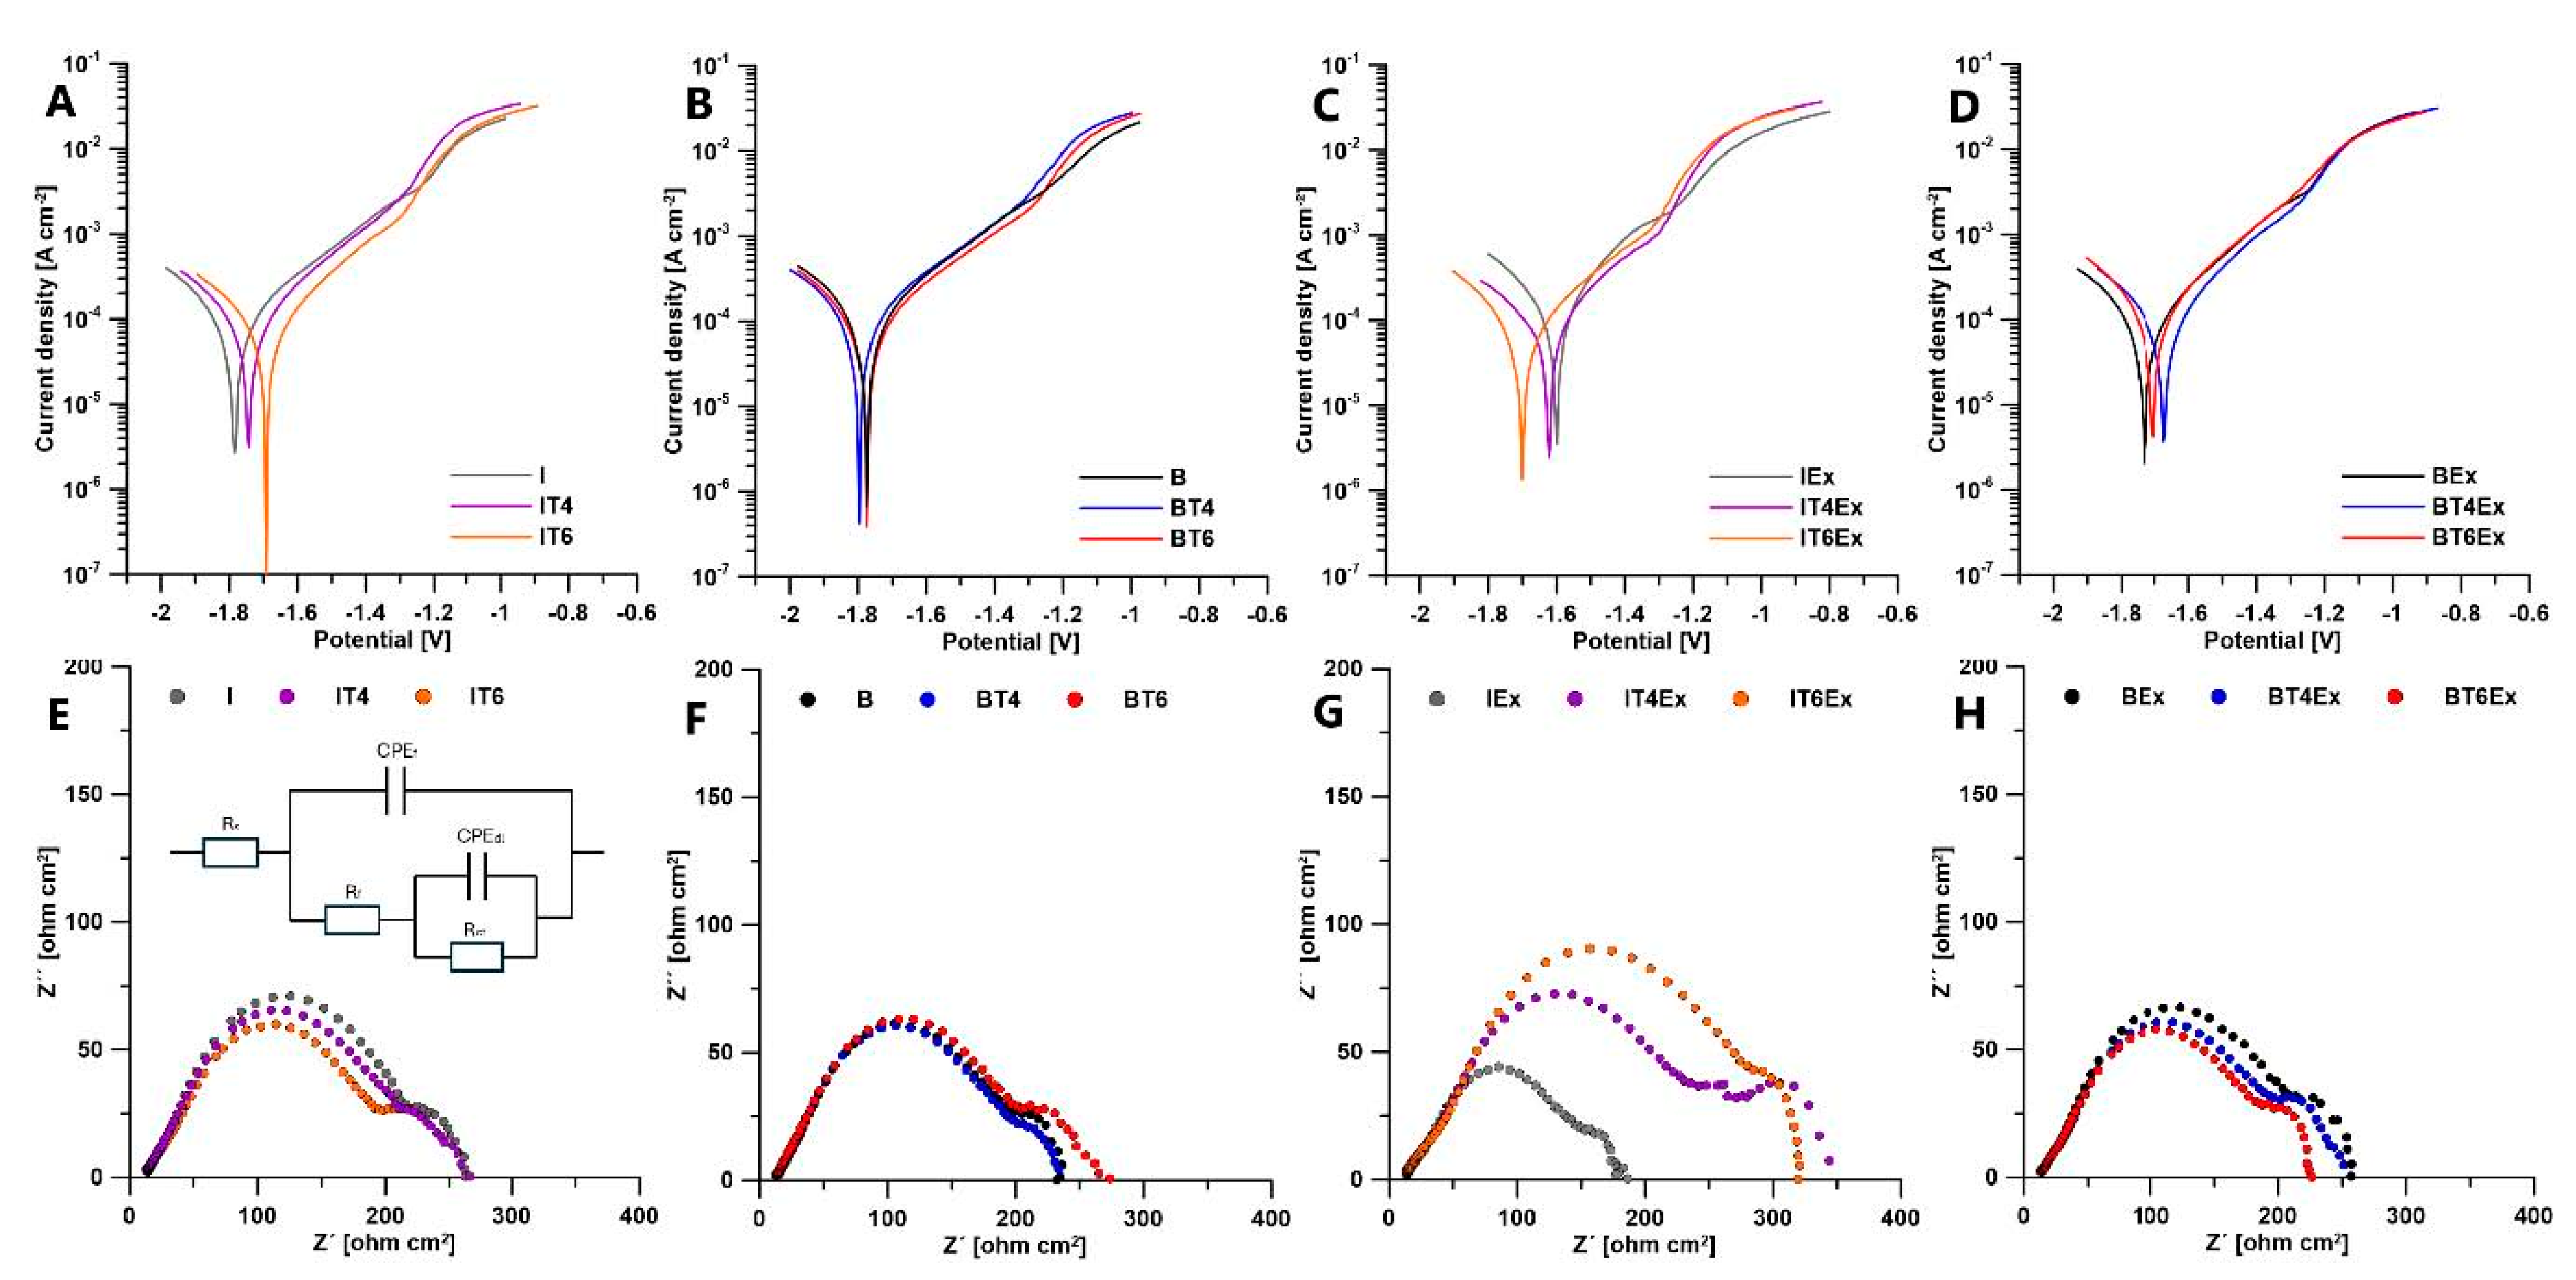
Figure 6.
Microstructures of specific features of extruded products in detail, that were observed among prepared
materials: A) SEM – LPSO phases in rows (IEx only), B) SEM – DRX area C) STEM – DRX area D) SEM – areas
of DRX and non-DRX grains E) SEM – non-DRX area containing kink bands F) STEM – non-DRX area containing
kink bands, G) EBSD and inverse pole figures of DRX and non-DRX grains.
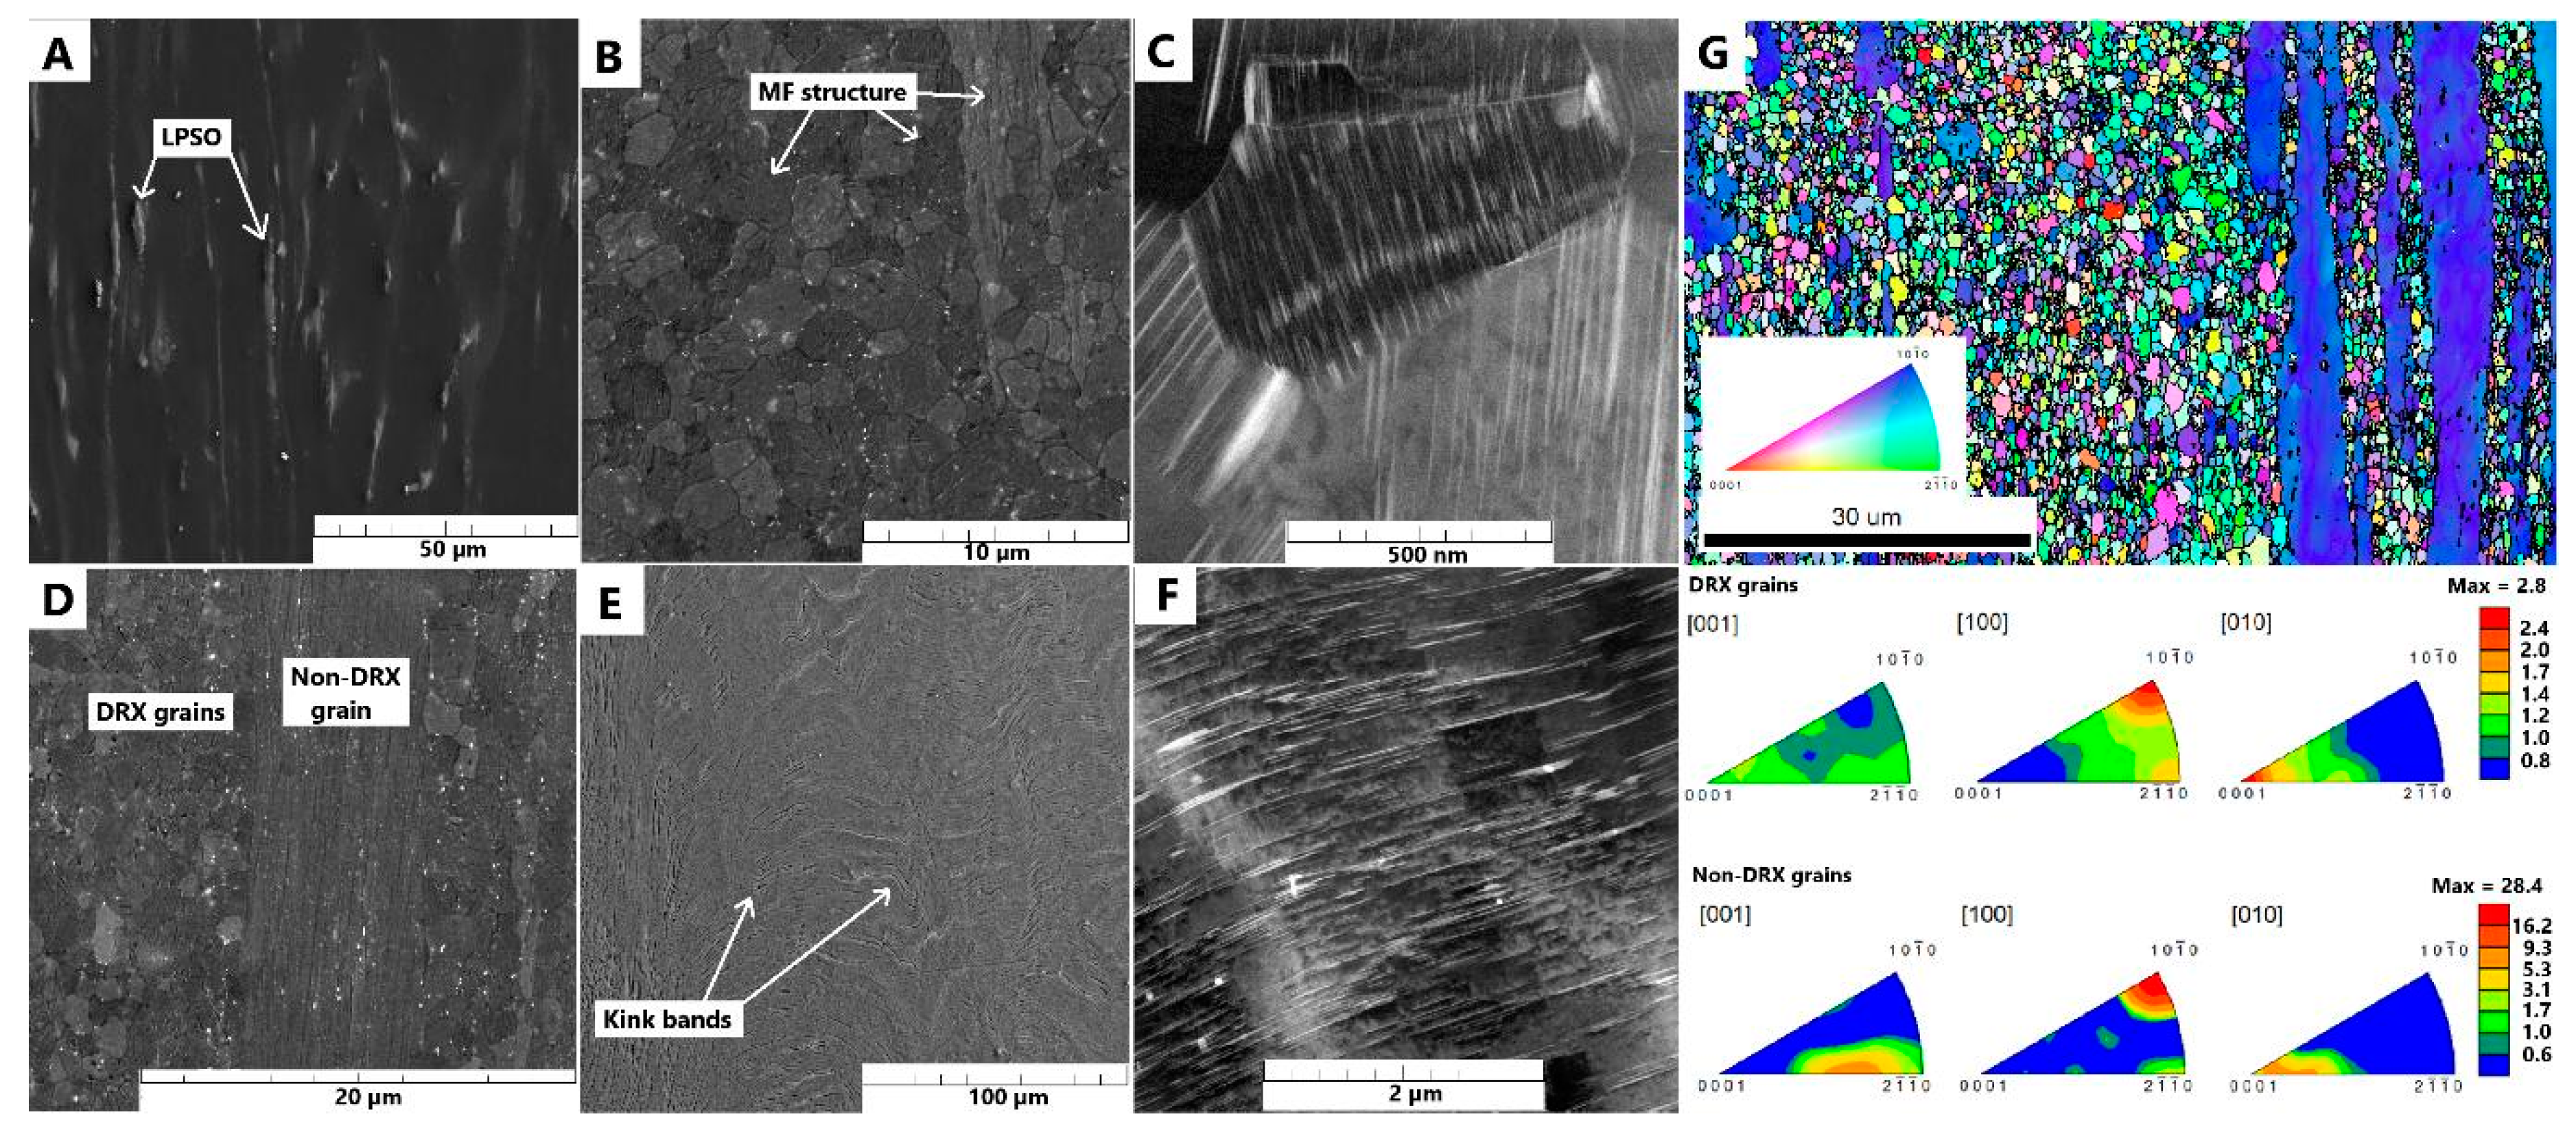
Figure 7.
Microstructure with known grain orientation of B samples before and after compressive tests with details of microstructure features at A) 21 °C, B) 400 °C. The colors of markers in grains indicate the initial orientation according to the legend. C) Compressive curves of displayed samples at 21 °C and 400 °C, D) STEM details of sample deformed at 400 °C.
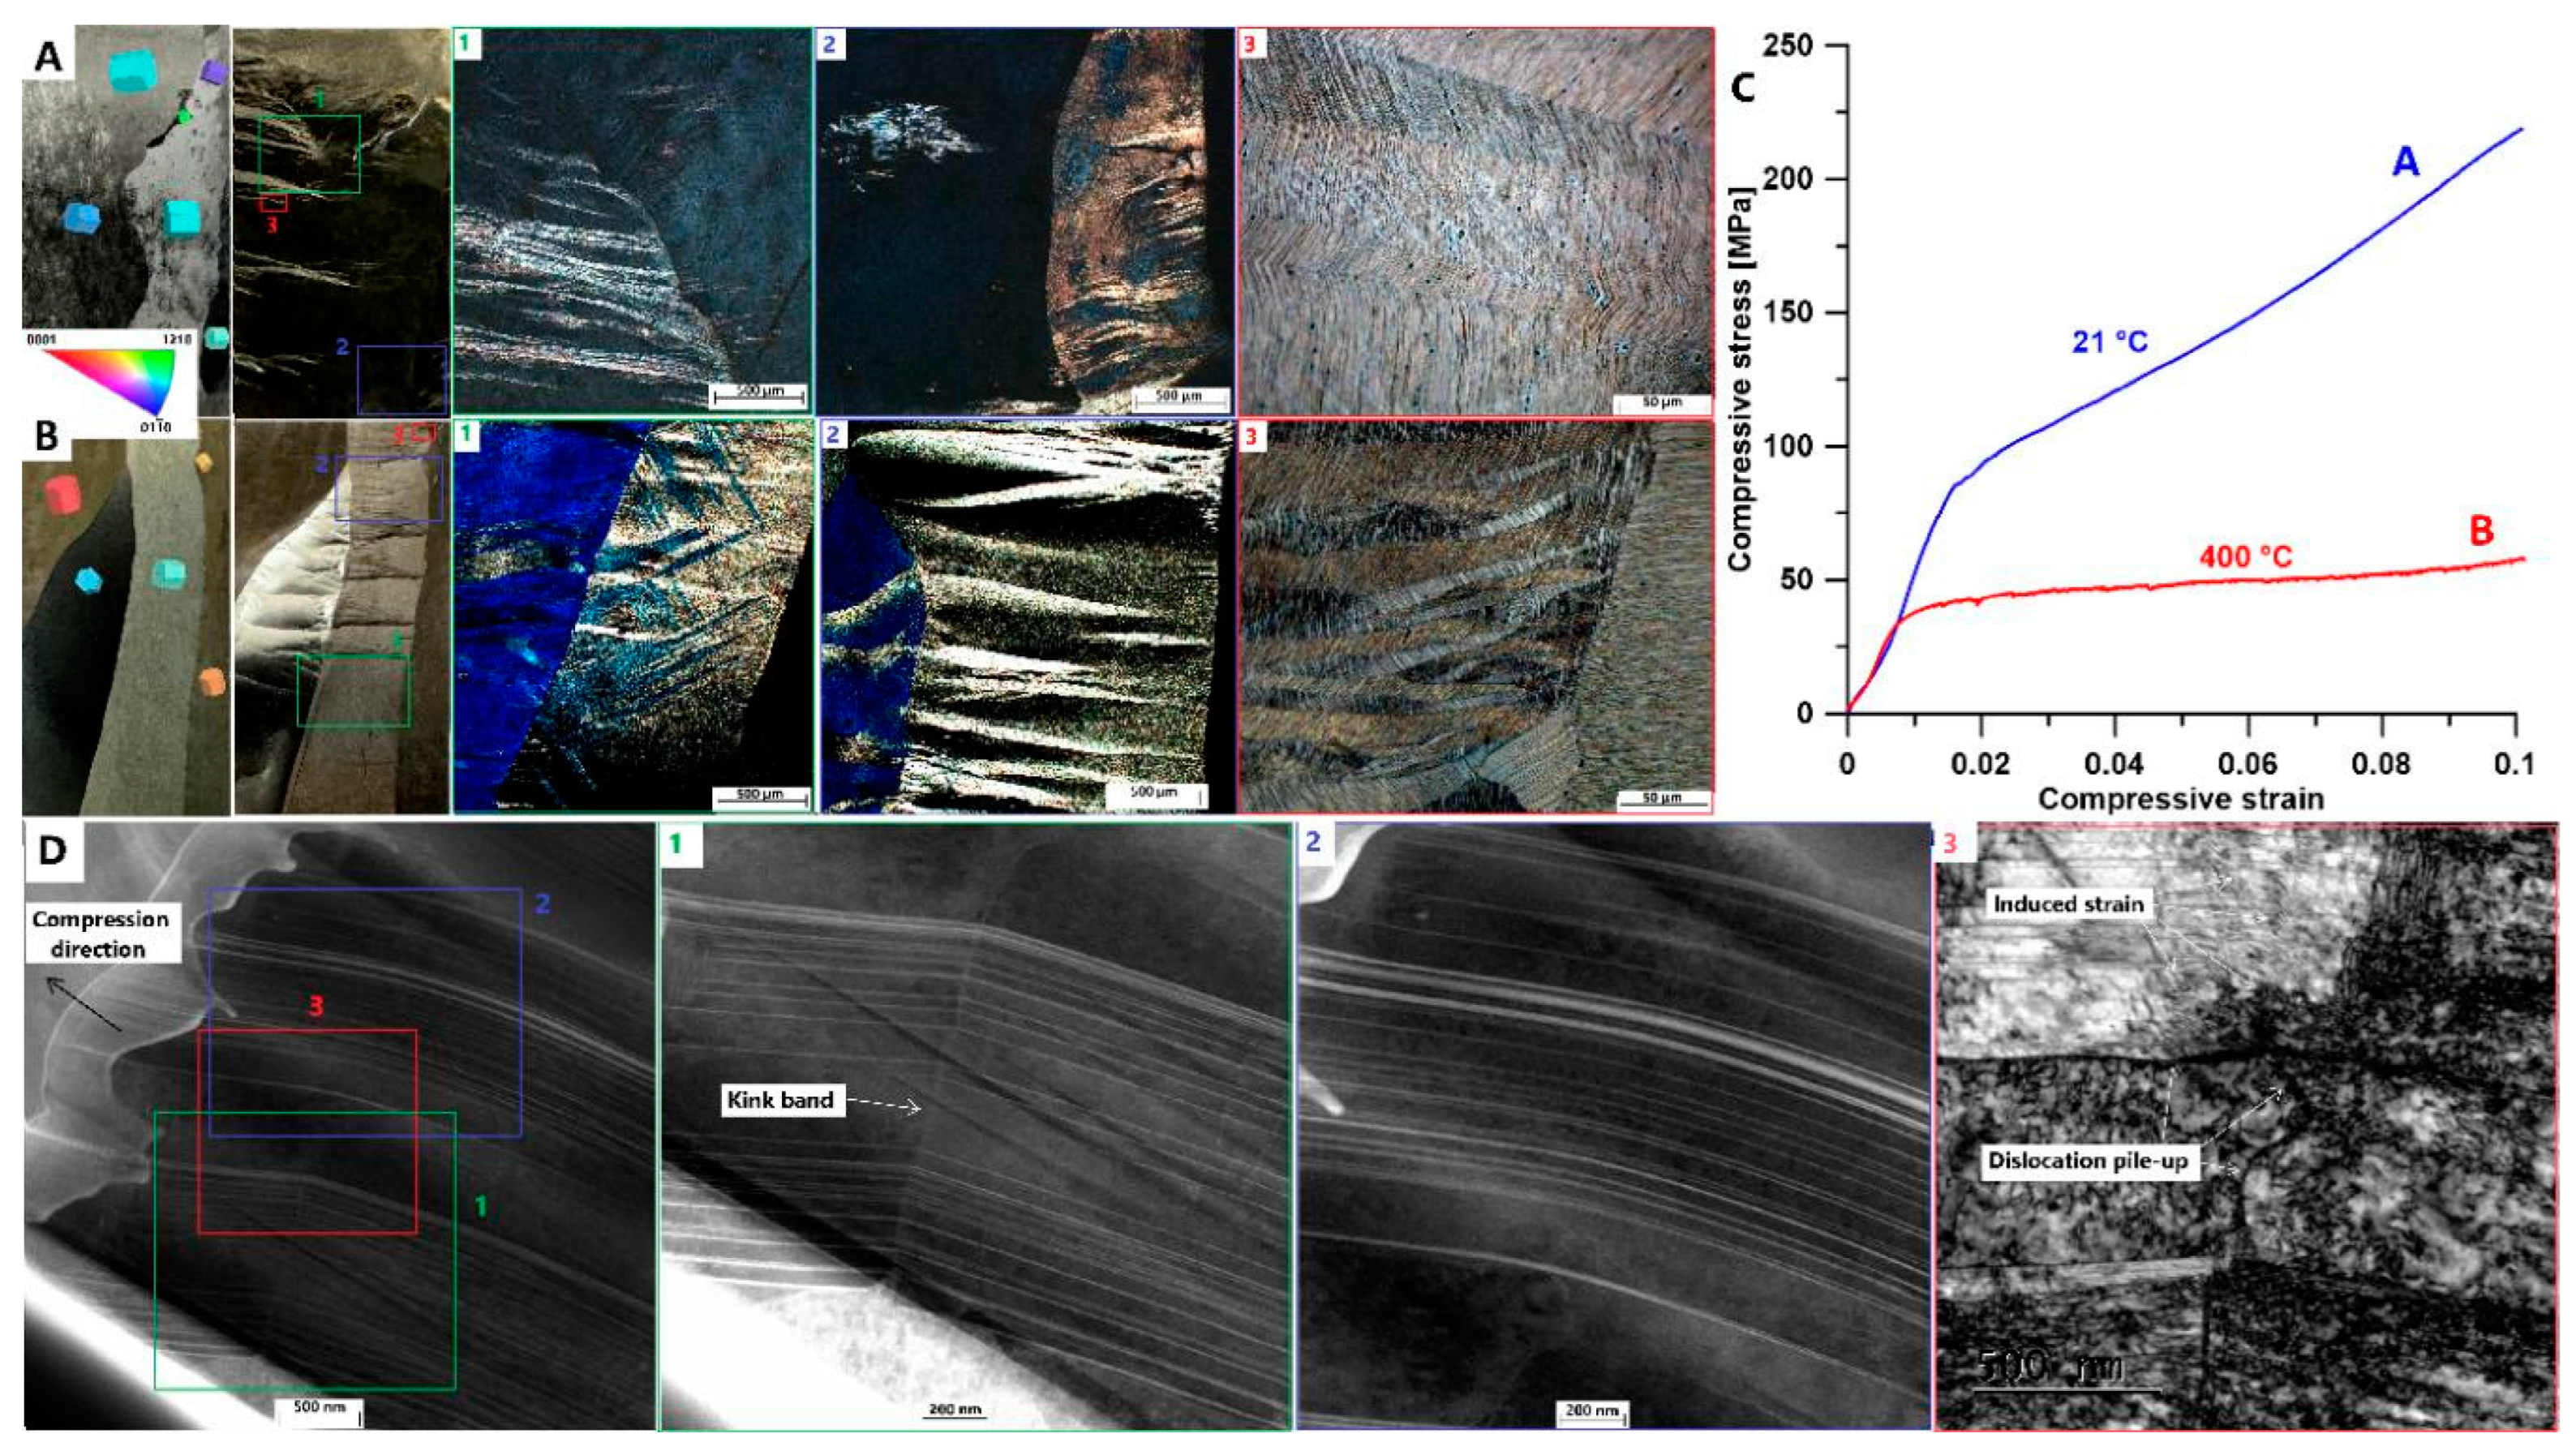
Figure 8.
Compressive test at room temperature with DIC measurement and EBSD analysis: Initial state with division of sample to two grains A1 and A2 with initial grain orientations represented by colors and hexagons. Compressive curves for each grain according to DIC analysis. Strain along the loading axis in both grains is represented in selected points of the compressive curve (1, 2, 3, 4). 5 is the final state after compression with detailed EBSD analysis.
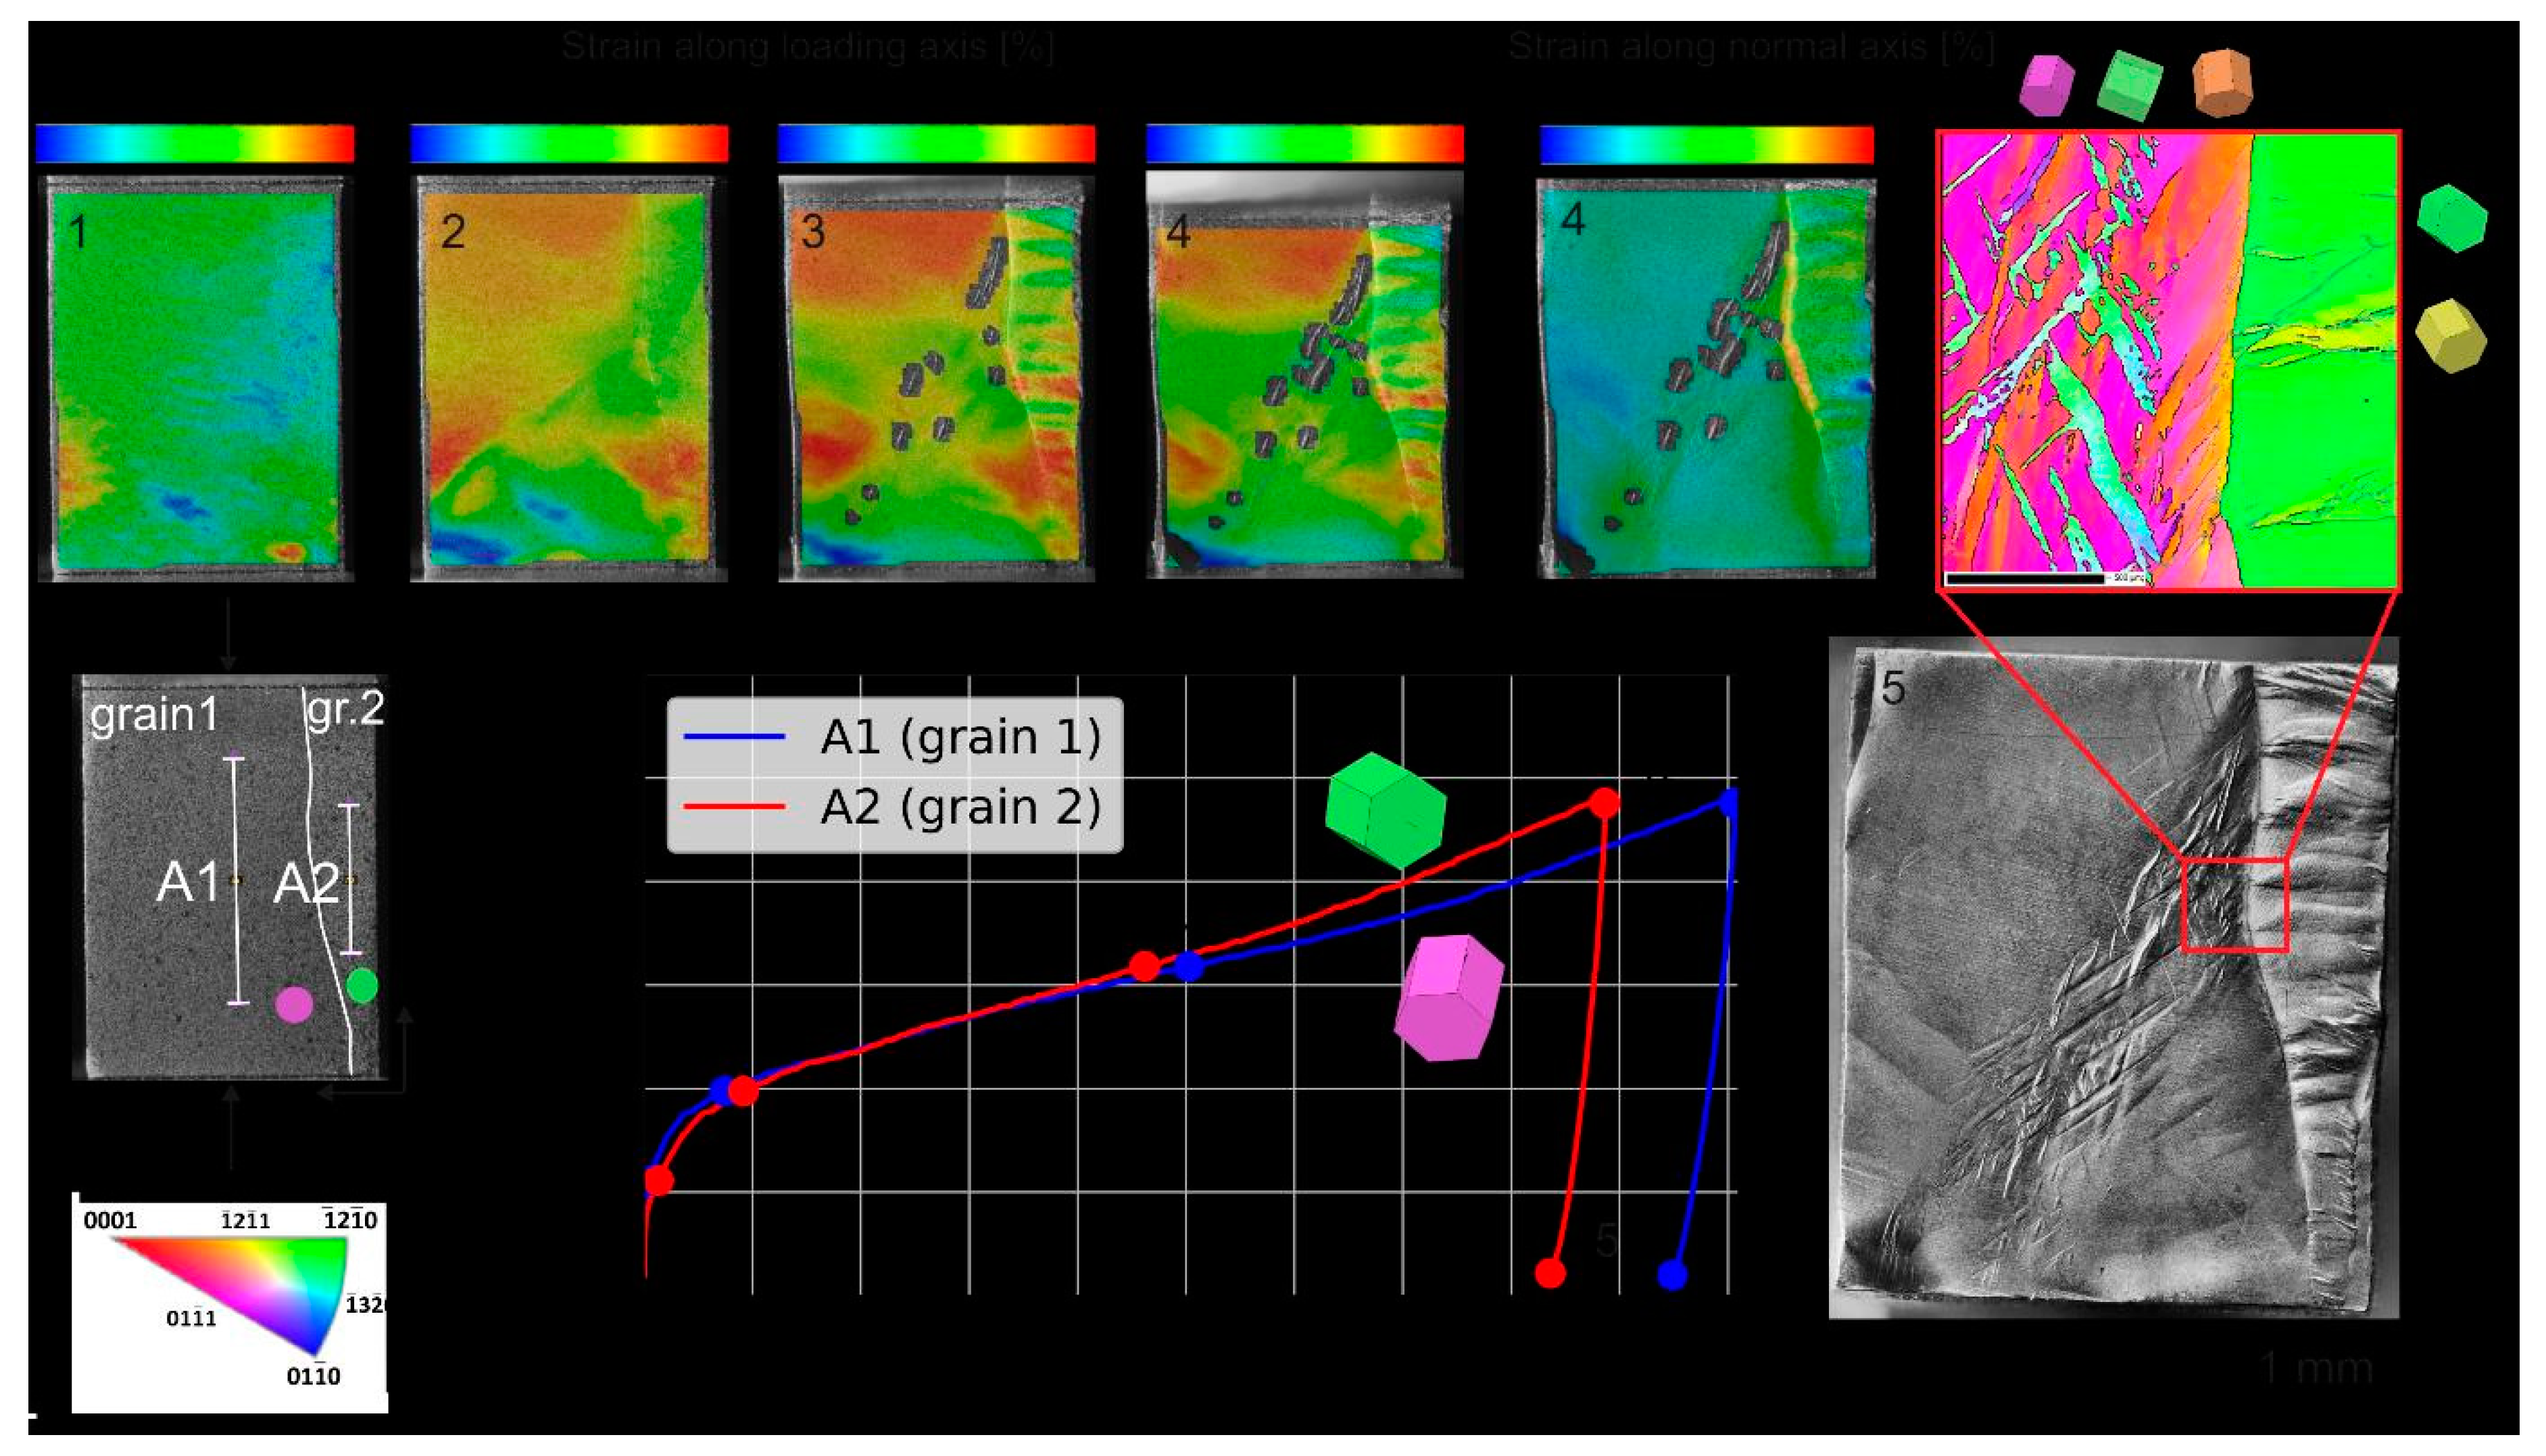
Figure 9.
Sample cut after exposition in SBF with EDS analysis: A) B sample, B) BEx sample.
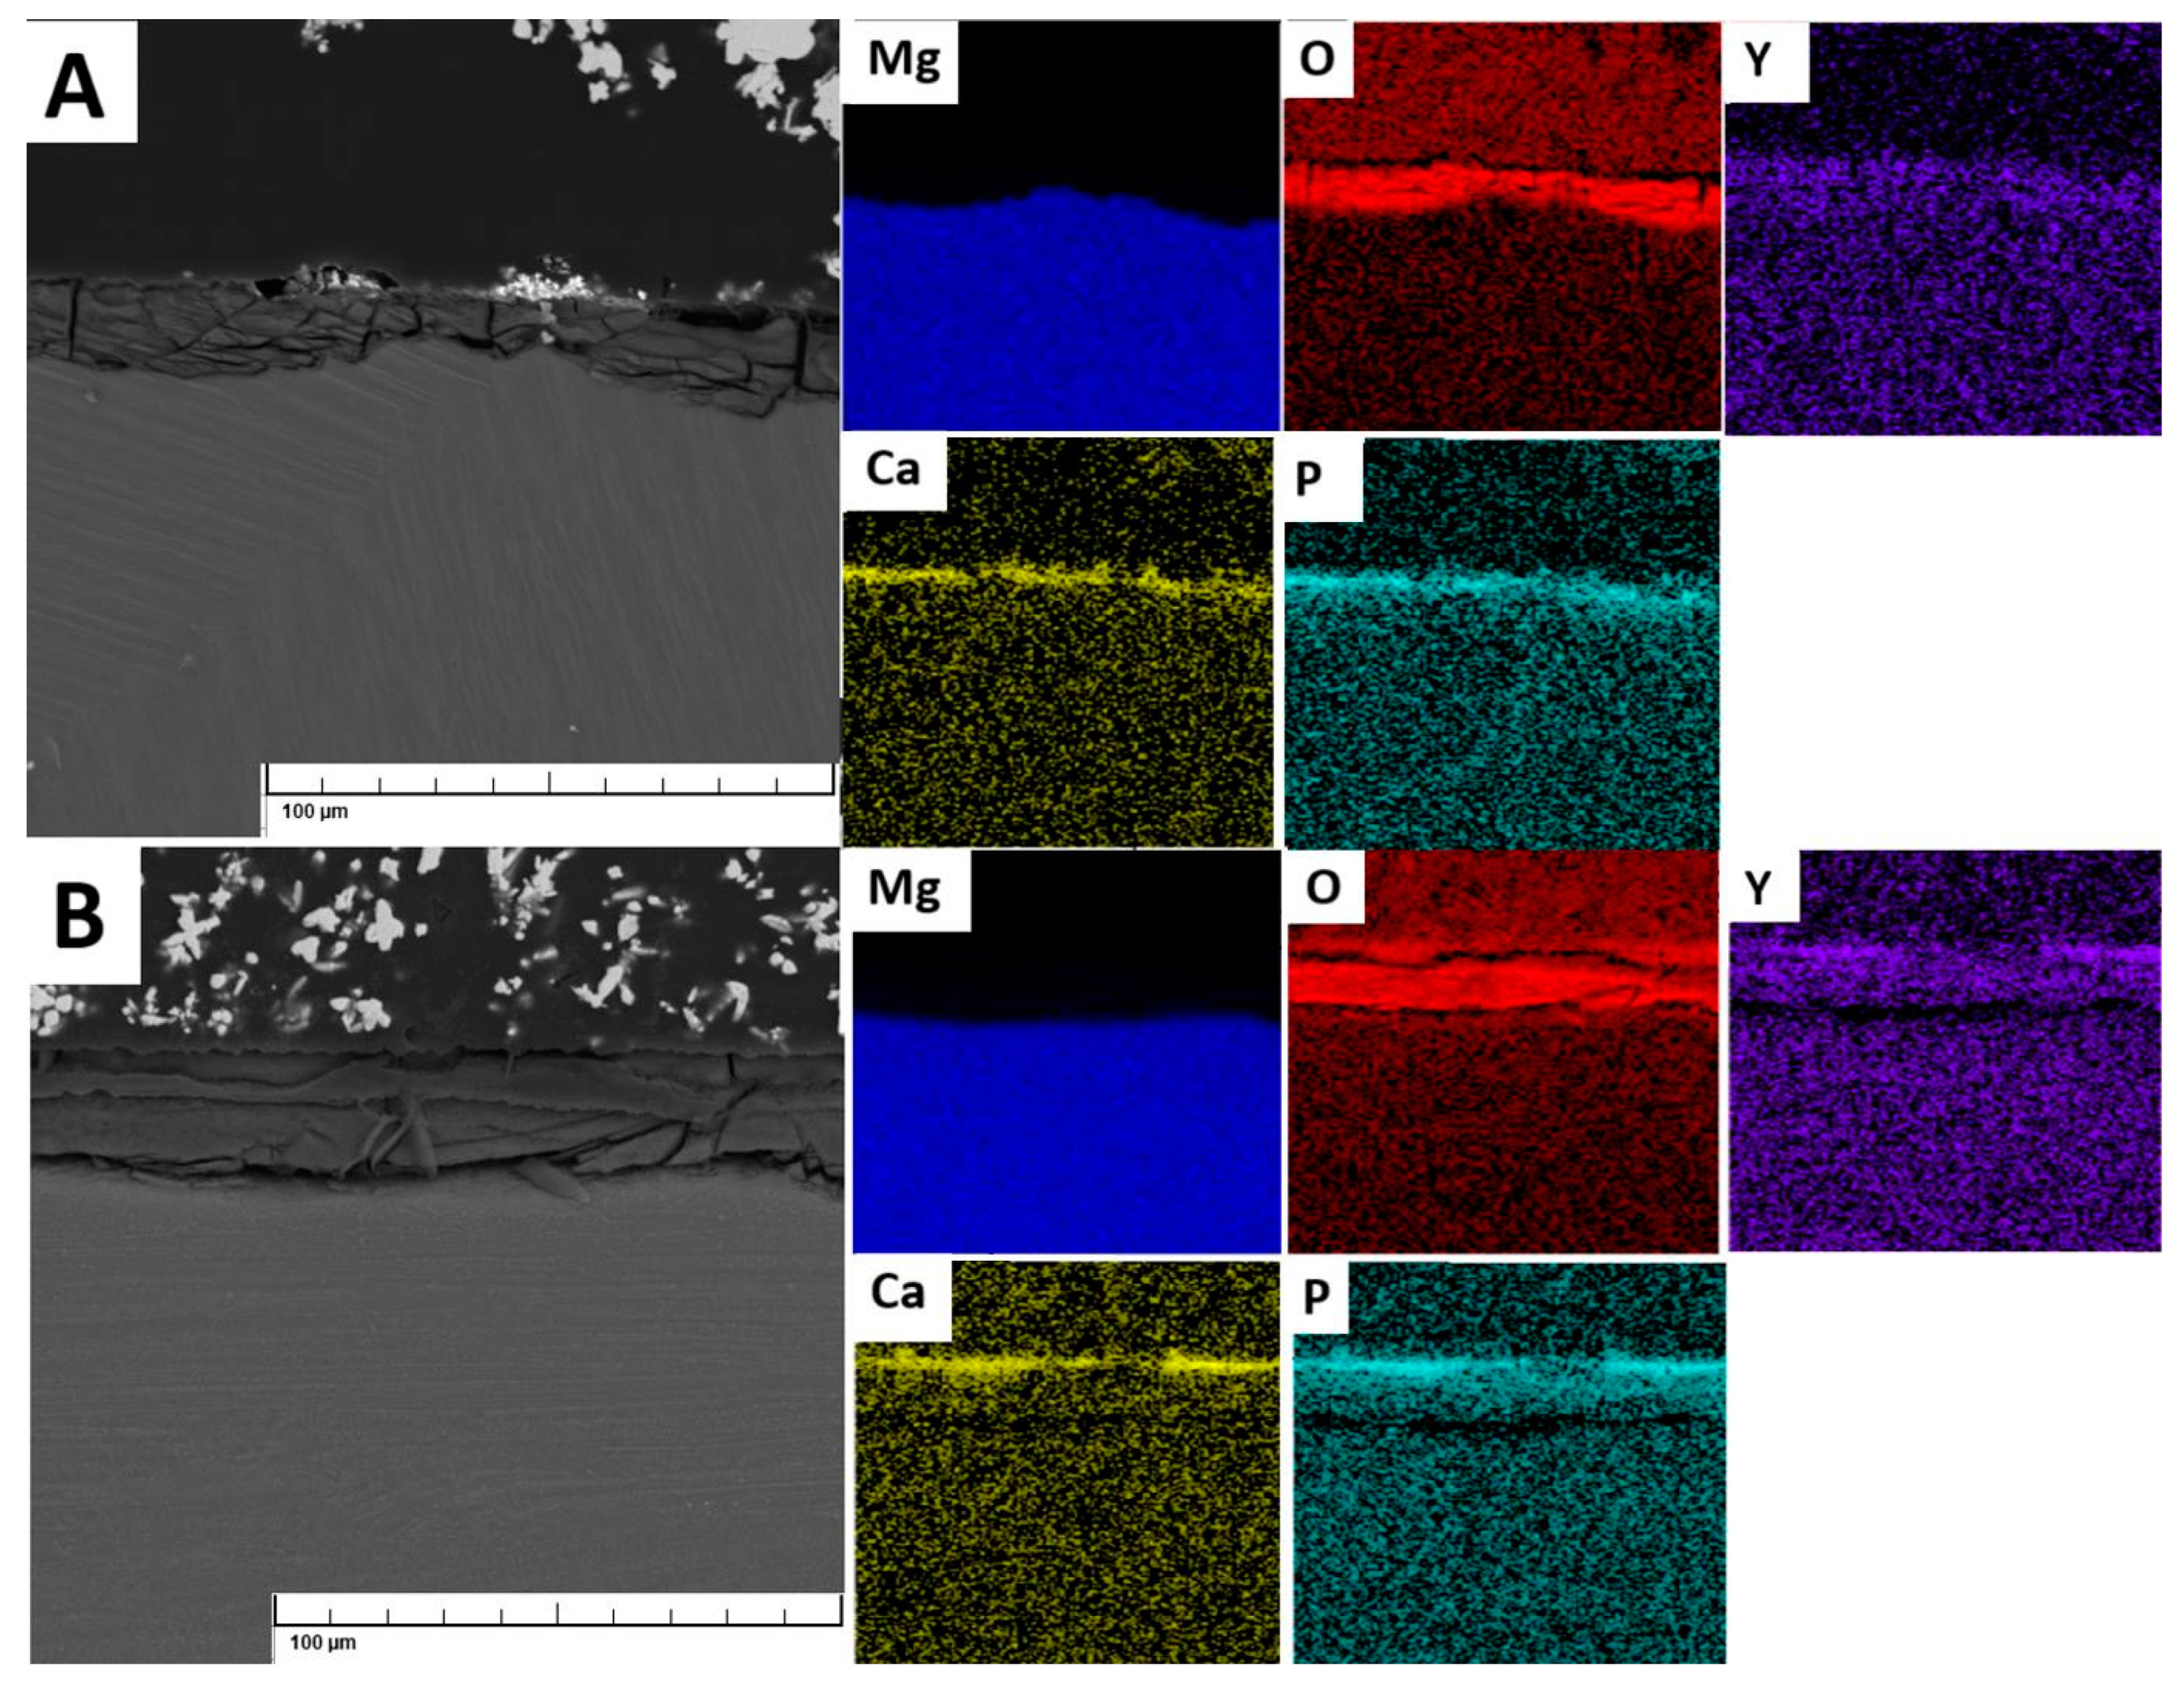

Table 1.
Dynamically recrystalized area of extruded samples. DRX = recrystalized area [%].
| Ingot metallurgy | Bridgman method | |||||
|---|---|---|---|---|---|---|
| IEx | IT4Ex | IT6Ex | BEx | BT4Ex | BT6Ex | |
| DRX | 98 ± 2 | 77 ± 3 | 85 ± 2 | 70 ± 9 | 67 ± 6 | 73 ± 3 |
Table 2.
Mechanical properties of samples prior to extrusion.
| Ingot metallurgy | Bridgman method | |||||
|---|---|---|---|---|---|---|
| I | IT4 | IT6 | B | BT4 | BT6 | |
| CYS [MPa] | 85 ± 5 | 93 ± 9 | 104 ± 1 | 69 ± 17 | 44 ± 25 | 41 ± 19 |
| UCS [MPa] | 234 ± 24 | 286 ± 9 | 255 ± 3 | 198 ± 27 | 195 ± 17 | 130 ± 8 |
| TYS [MPa] | 80 ± 3 | 85 ± 5 | 101 ± 2 | 30 ± 8 | 67 ± 43 | 29 ± 16 |
| UTS [MPa] | 142 ± 12 | 181 ± 9 | 144 ± 11 | 56 ± 18 | 105 ± 45 | 55 ± 21 |
| A [%] | 5.5 ± 1.1 | 10.5 ± 0.6 | 4.1 ± 1.3 | 7.3 ± 1.7 | 9.2 ± 4.0 | 4.2 ± 4.0 |
Table 3.
Mechanical properties of extruded samples.
| Ingot metallurgy | Bridgman method | |||||
|---|---|---|---|---|---|---|
| IEx | IT4Ex | IT6Ex | BEx | BT4Ex | BT6Ex | |
| CYS [MPa] | 199 ± 3 | 246 ± 2 | 276 ± 5 | 269 ± 15 | 223 ± 19 | 263 ± 3 |
| UCS [MPa] | 438 ± 23 | 483 ± 16 | 493 ± 16 | 369 ± 10 | 253 ± 7 | 303 ± 16 |
| TYS [MPa] | 221 ± 8 | 290 ± 8 | 278 ± 7 | 330 ± 10 | 352 ± 4 | 363 ± 5 |
| UTS [MPa] | 278 ± 9 | 318 ± 8 | 313 ± 12 | 352 ± 3 | 356 ± 4 | 381 ± 2 |
| A [%] | 14.6 ± 1.6 | 11.2 ± 0.3 | 10.4 ± 0.8 | 3.0 ± 1.1 | 1.8 ± 1.5 | 5.7 ± 1.2 |
Table 4.
Corrosion rates of prepared materials in SBF – exposition tests.
| Ingot metallurgy | Bridgman method | |||||
|---|---|---|---|---|---|---|
| I | IT4 | IT6 | B | BT4 | BT6 | |
| vcor [mm·y-1] | 1.25 ± 0.26 | 0.58 ± 0.05 | 0.70 ± 0.06 | 0.75 ± 0.12 | 0.61 ± 0.02 | 0.67 ± 0.03 |
| vcor [mm·y-1] Ex | 1.38 ± 0.29 | 0.63 ± 0.01 | 0.70 ± 0.06 | 0.64 ± 0.02 | 0.71 ± 0.03 | 0.69 ± 0.04 |
Table 5.
Electrochemical methods – fitted data of samples before extrusion.
| Ingot metallurgy | Bridgman method | |||||
|---|---|---|---|---|---|---|
| I | IT4 | IT6 | B | BT4 | BT6 | |
| Ecor [Vsce] | -1.78 | -1.74 | -1.69 | -1.77 | -1.80 | -1.77 |
| Icor [µAcm2] | 81 | 58 | 59 | 93 | 97 | 80 |
| Rf[ohm] | 203 | 198 | 172 | 176 | 176 | 174 |
| Rct[ohm] | 33 | 35 | 52 | 35 | 33 | 42 |
Table 6.
Electrochemical methods – fitted data of extruded samples.
| Ingot metallurgy | Bridgman method | |||||
|---|---|---|---|---|---|---|
| IEx | IT4Ex | IT6Ex | BEx | BT4Ex | BT6Ex | |
| Ecor [Vsce] | -1.60 | -1.62 | -1.70 | -1.73 | -1.67 | -1.70 |
| Icor [µAcm2] | 129 | 66 | 64 | 80 | 91 | 98 |
| Rf[ohm] | 131 | 223 | 258 | 193 | 177 | 174 |
| Rct[ohm] | 24 | 92 | 35 | 39 | 42 | 30 |
Table 7.
Ignition temperatures of prepared materials.
| Ingot metallurgy | Bridgman method | |||||
|---|---|---|---|---|---|---|
| I | IT4 | IT6 | B | BT4 | BT6 | |
| Tig [°C] | 879 ± 24 | 858 ± 16 | 828 ± 15 | 930 ± 39 | 922 ± 12 | 886 ± 15 |
Table 8.
Mechanical properties of samples before extrusion.
| Ingot metallurgy | Bridgman method | |||||
|---|---|---|---|---|---|---|
| I | IT4 | IT6 | B | BT4 | BT6 | |
| UCS/CYS | 2.75 | 3.08 | 2.44 | 2.86 | 4.46 | 3.20 |
| UTS/TYS | 1.78 | 2.13 | 1.42 | 1.87 | 1.56 | 1.88 |
| CYS/TYS | 1.07 | 1.09 | 1.03 | 2.31 | 0.65 | 1.39 |
| HcT | 0.779 | 1.133 | 0.418 | 0.867 | 0.562 | 0.875 |
| Hcc | 1.746 | 2.083 | 1.441 | 1.861 | 3.458 | 2.205 |
Table 9.
Mechanical properties of extruded samples.
| Ingot metallurgy | Bridgman method | |||||
|---|---|---|---|---|---|---|
| IEx | IT4Ex | IT6Ex | BEx | BT4Ex | BT6Ex | |
| UCS/CYS | 2.20 | 1.96 | 1.79 | 1.37 | 1.13 | 1.15 |
| UTS/TYS | 1.26 | 1.10 | 1.13 | 1.07 | 1.03 | 1.05 |
| CYS/TYS | 0.90 | 0.85 | 0.99 | 0.82 | 0.63 | 0.72 |
| HcT | 0.258 | 0.097 | 0.126 | 0.067 | 0.011 | 0.050 |
| Hcc | 1.201 | 0.963 | 0.786 | 0.372 | 0.135 | 0.152 |
Disclaimer/Publisher’s Note: The statements, opinions and data contained in all publications are solely those of the individual author(s) and contributor(s) and not of MDPI and/or the editor(s). MDPI and/or the editor(s) disclaim responsibility for any injury to people or property resulting from any ideas, methods, instructions or products referred to in the content. |
© 2025 by the authors. Licensee MDPI, Basel, Switzerland. This article is an open access article distributed under the terms and conditions of the Creative Commons Attribution (CC BY) license (http://creativecommons.org/licenses/by/4.0/).
Copyright: This open access article is published under a Creative Commons CC BY 4.0 license, which permit the free download, distribution, and reuse, provided that the author and preprint are cited in any reuse.


