1. Introduction
Tunnel excavation in urban areas or through soft ground below the phreatic level presents significant engineering challenges, particularly regarding ground movement control. Earth Pressure Balance (EPB) TBMs have been extensively employed in such conditions, with the primary objective of minimizing ground disturbances. Their controlled excavation method enables precise manipulation of face pressure and backfilling techniques, reducing settlement risks and ensuring structural stability (Clough et al., 1983; Leca et al., 2000; Mair & Taylor, 1997).
Barcelona Metro Line 9 crosses deltaic deposits, where the behavior of the ground during tunneling operations remains a crucial topic of study. This study builds upon previous research (Gens et al., 2011; Yubero, 2021; Yubero & Bonet, 2024), investigating the correlation between TBM operational parameters and observed ground movements in a greenfield setting. In particular, it examines volume loss mechanisms and settlement distributions in response to variations in TBM driving parameters, hyperbaric interventions, and site-specific geological conditions (Dimmock, 2003; Fargnoli et al., 2013).
This research is conducted as part of a collaboration between the Universitat Politècnica de Catalunya (UPC-CIMNE) and Infraestructures.cat, the entity responsible for managing Line 9's infrastructure. The partnership has enabled extensive data collection throughout different construction stages, allowing for a detailed assessment of the interaction between EPB TBM operations and ground response. Previous studies on EPB tunneling in urban environments, such as those in Milan, Shanghai, and Bangkok, have highlighted key factors influencing settlement patterns, including variations in face pressure, grouting volume control, and the impact of tunneling beneath critical infrastructure (Antiga & Chiorboli, 2009; Do, N.A. et al., (2014); Mollon, G. et al., (2013); Pelizza, S. et al., (2010); Sirivachiraporn & Phienwej, 2012; Suwansawat, 2002; Zhang, D., & Ng, C. W. W. (2015)).
The key research objectives include:
Assessing the impact of TBM pressures, including face pressure (P1), shield pressure (P2), and shield tail pressure (P3), on settlement magnitudes.
Evaluating the influence of grouting volumes injected into the shield (Vshield) and segment tails (Vtail) on settlement mitigation.
Identifying potential sources of increased ground volume loss, including singular points such as station entrances/exits, geological transitions, and hyperbaric maintenance stops.
Refining predictive models of settlement behavior based on observed field data and comparing them with established empirical frameworks (O’Reilly & New, 1992; Lin et al., 2013).
By addressing these factors, this study aims to enhance the understanding of EPB tunneling performance in soft deltaic deposits and improve best practices for minimizing surface impacts in future tunneling projects worldwide.
2. Geological Conditions and Instrumentation Layout
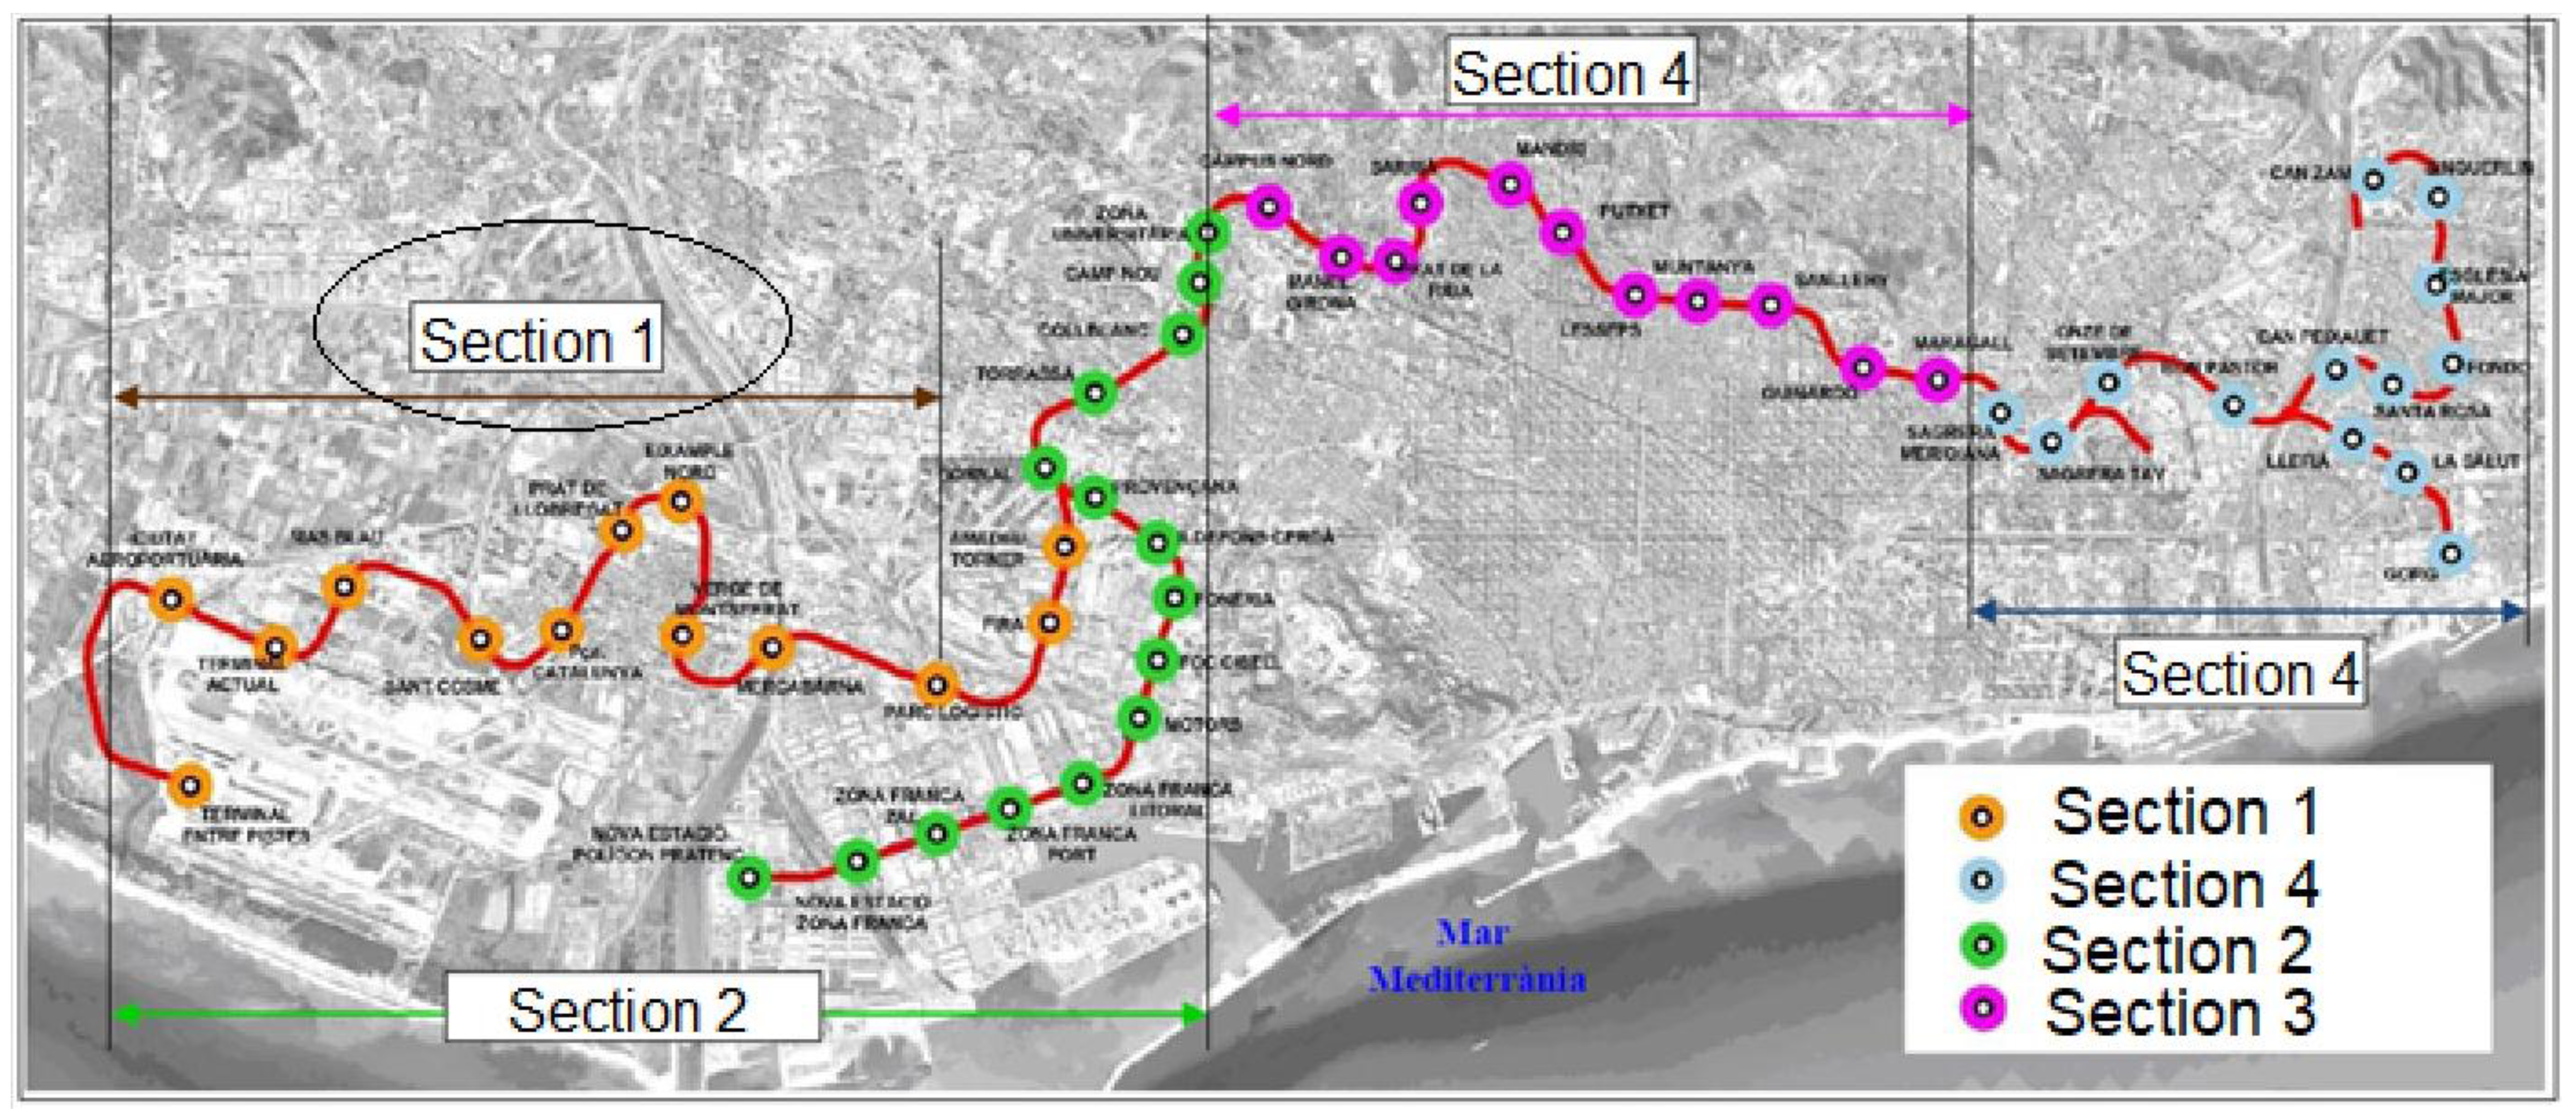
The part of the Line 9 (L9) route described in this paper was constructed, under L9 Contract T1 that starts at Mas Blau Station, with two EPB type TBMs in opposite directions. The first one started at Mas Blau Station and ended at Terminal entre Pistes Station, inside the Barcelona Airport facilities at El Prat de Llobregat. The second TBM started at Mas Blau station but continued in the opposite direction to the Parc Logístic station in Barcelona (
Figure 1).
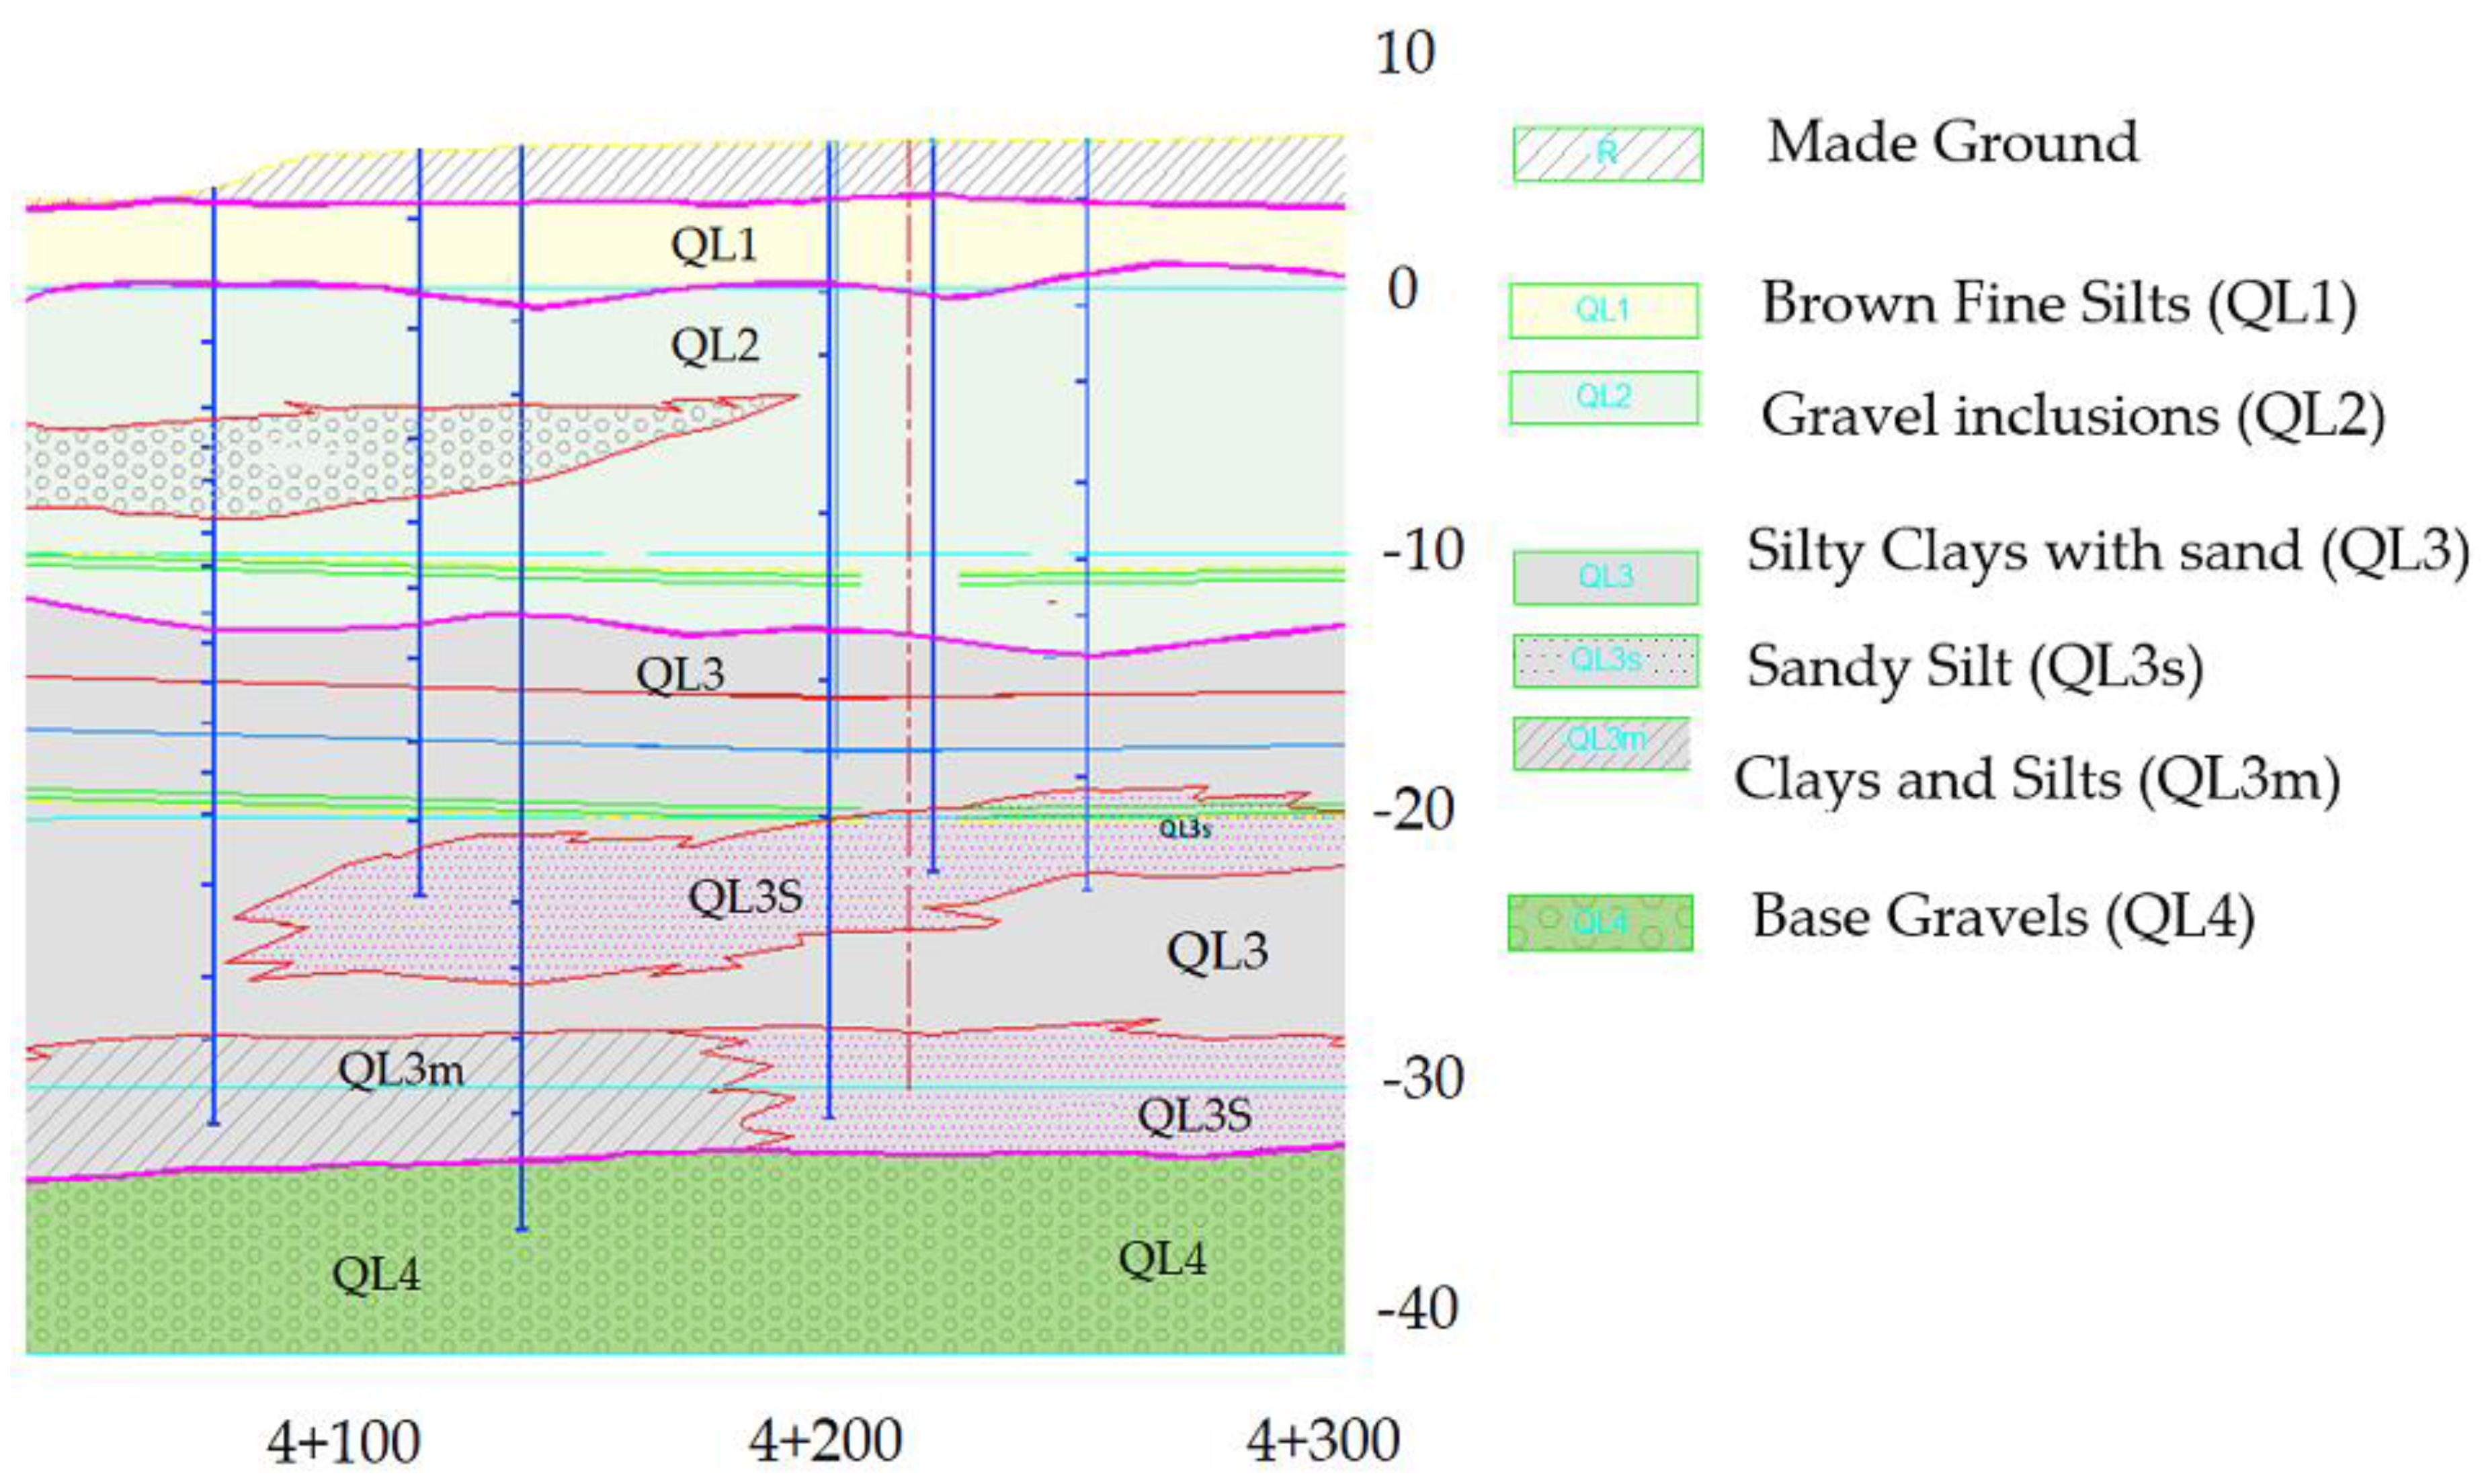
Figure 2 presents a longitudinal section summarizing the geological conditions encountered along the tunnel route of Contract T1.
The top layer comprises made ground (R) of varying thickness overlying a thin stratum of brown fine silts (QL1). Below it, gray fine sands, with some gravel inclusions (QL2) are encountered which are in turn underlain by a gray layer (QL3) of mixed composition: silty clays with some interlayered sands, sandy silts, clays and silts. The QL3 layer is the main soft deposit and it reaches depths of approximately 50 m below ground level. It overlies the base gravels (QL4) where a confined aquifer is located. All of these materials are of Quaternary age and layers QL2 to QL4 belong to the deltaic deposits of the Llobregat River. The water table is nearly horizontal and is located 0-2 m above sea level.
Except in the proximity of the stations, the ground cover of the tunnel is about 5 to 16 m, with a cover/diameter (C/D) ratio of approximately 1.7. Around the stations this ratio decreases reaching a minimum value of 1.0 in the area of Terminal Actual Station.
3. Tunnelling Details
3.1. Earth Pressure Machines (EPB)
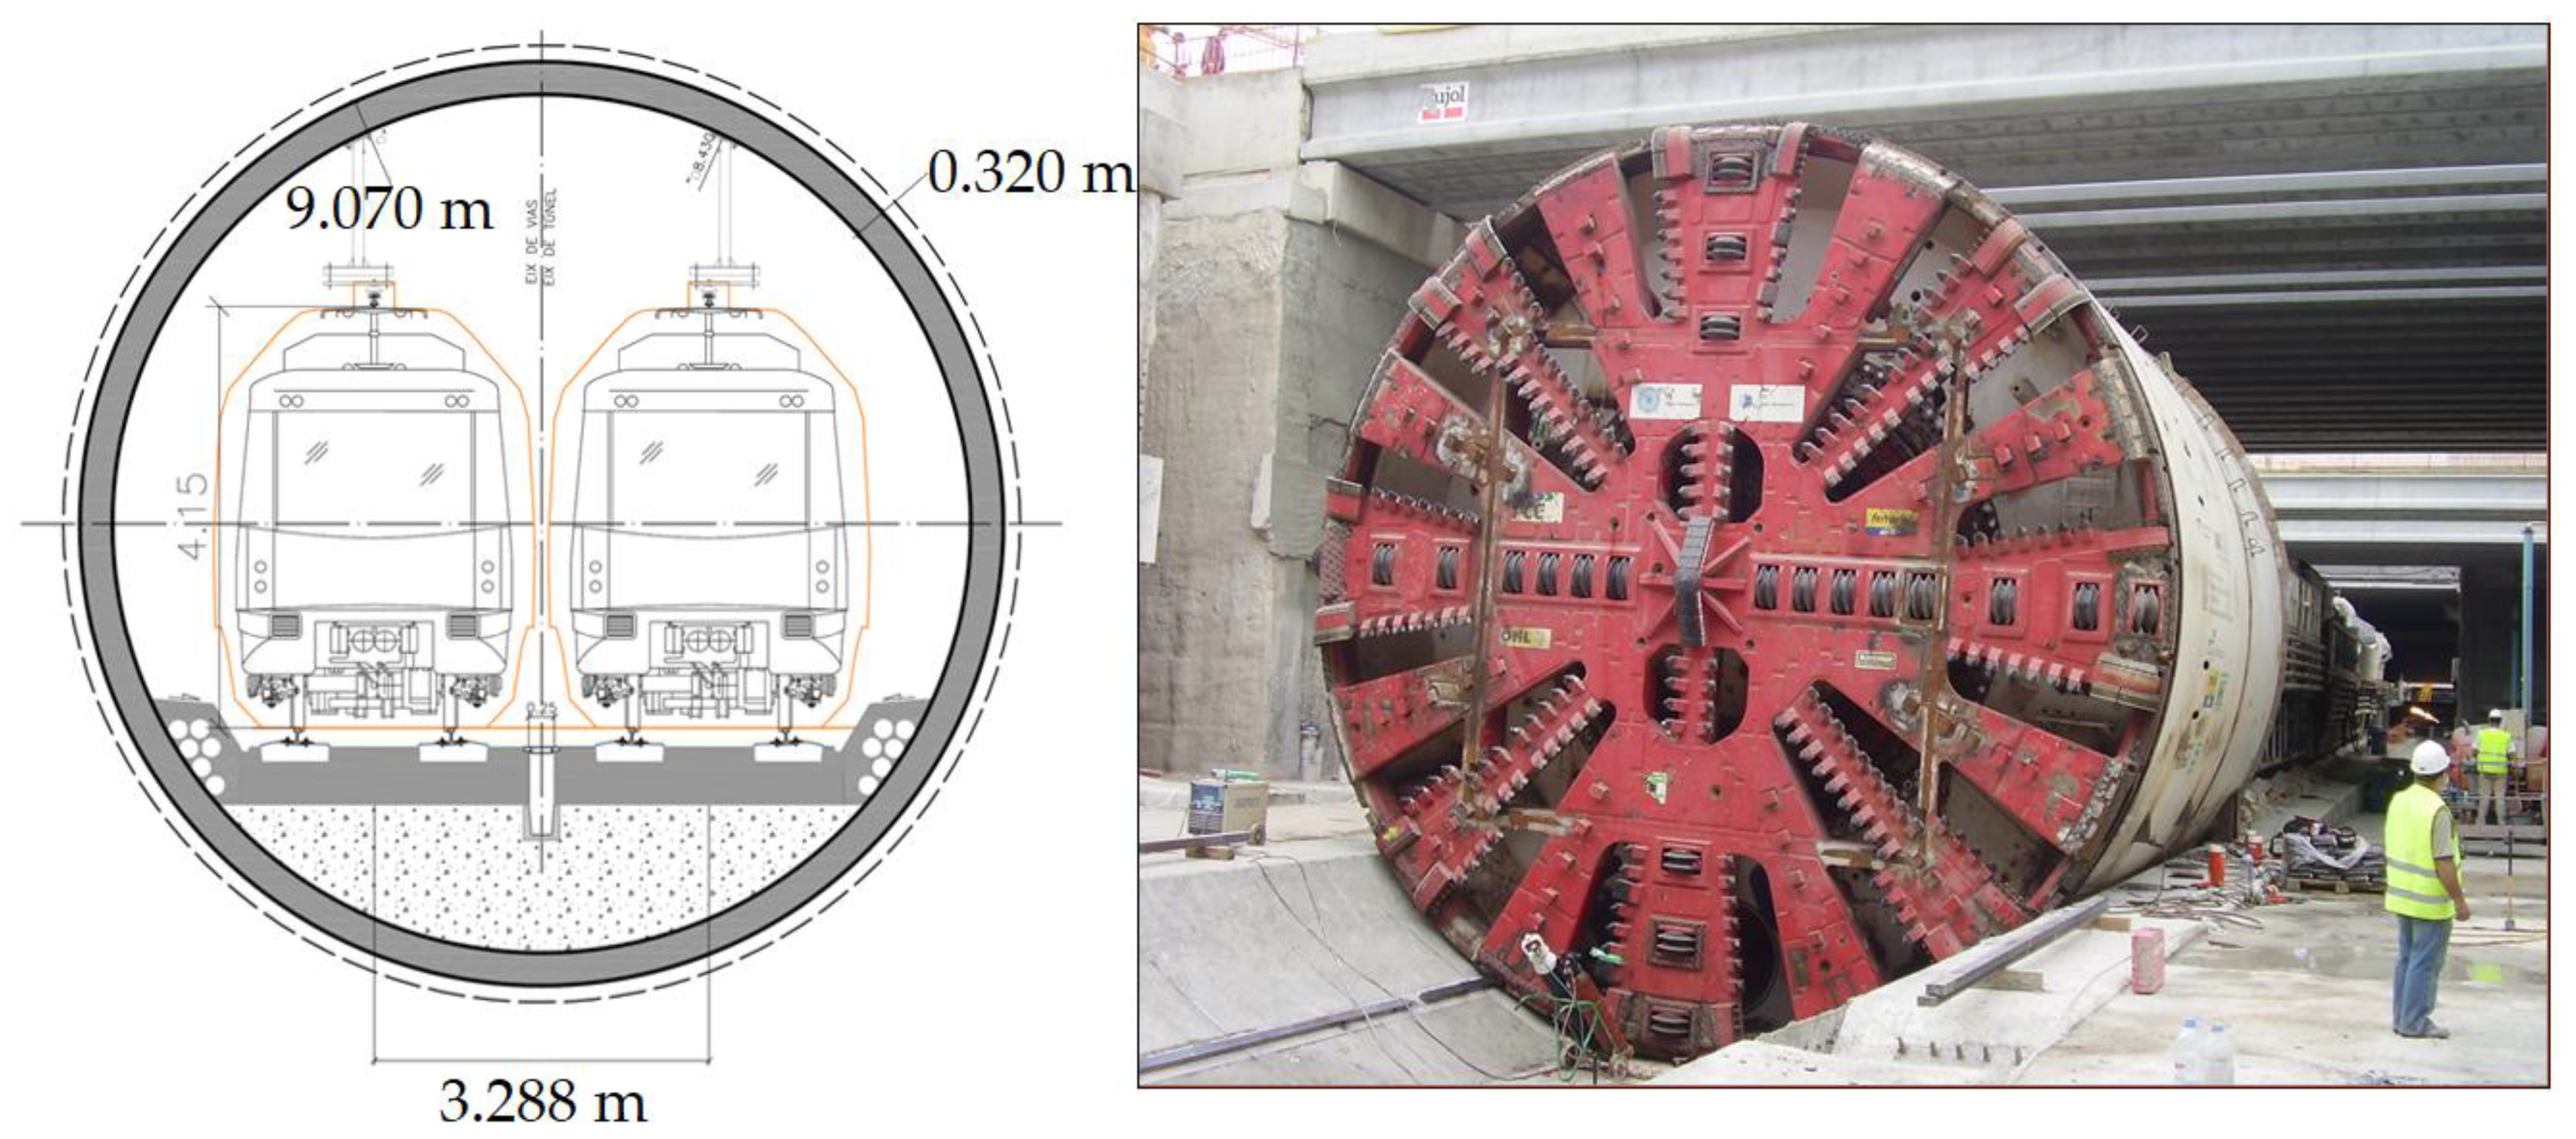
In the construction of Line 9, specifically, Section 1 from “Terminal 1 Station” to “Parc Logístic Station”, the solution adopted was to use two HERRENKNECHT tunnel boring machines, both of EPB type with identical characteristics. It is well known that these machines are designed for the excavation of unstable soils below the phreatic level, as is the case of the deltaic materials traversed.
The nominal diameter of the cutter wheel is 9.40 m which represents an area of 70.0 m
2 and the openings for the entry of the excavated material into the chamber represent 31.4 % of the total surface of the wheel. The inner diameter is 8.42 once the final support is in place. The support is formed by segments, specifically 6+1, that is, 6 segments of equal dimensions plus one segment placed in a keystone of variable dimension. The length of each segment is 1.5 m. The cycle corresponding to 1500 mm of excavation followed by the placement of the segmental support will be called " ring ". Thus, this arrangement allows the excavation of a single tunnel with double lane.
Figure 3 shows a section of Section 1 tunnel excavated with double lane. Furthermore, the shield of the TBM in both cases has a length of 10 m excluding the cutterhead, approximately 11 m if we count the length of the cutterhead. During the excavation cycles, the cutterhead and the screw conveyor stop to allow the placement of the support.
The first of the TBMs to begin excavation, called Hades or S-269, excavated 8174,479 m in a northerly direction from Mas Blau station towards Parc Logístic station. And, the second TBM, called Guster or S-461, excavated 4325,521 m in the opposite direction from Mas Blau station towards Terminal entre Pistes station, now known as Terminal T1 (
Figure 1).
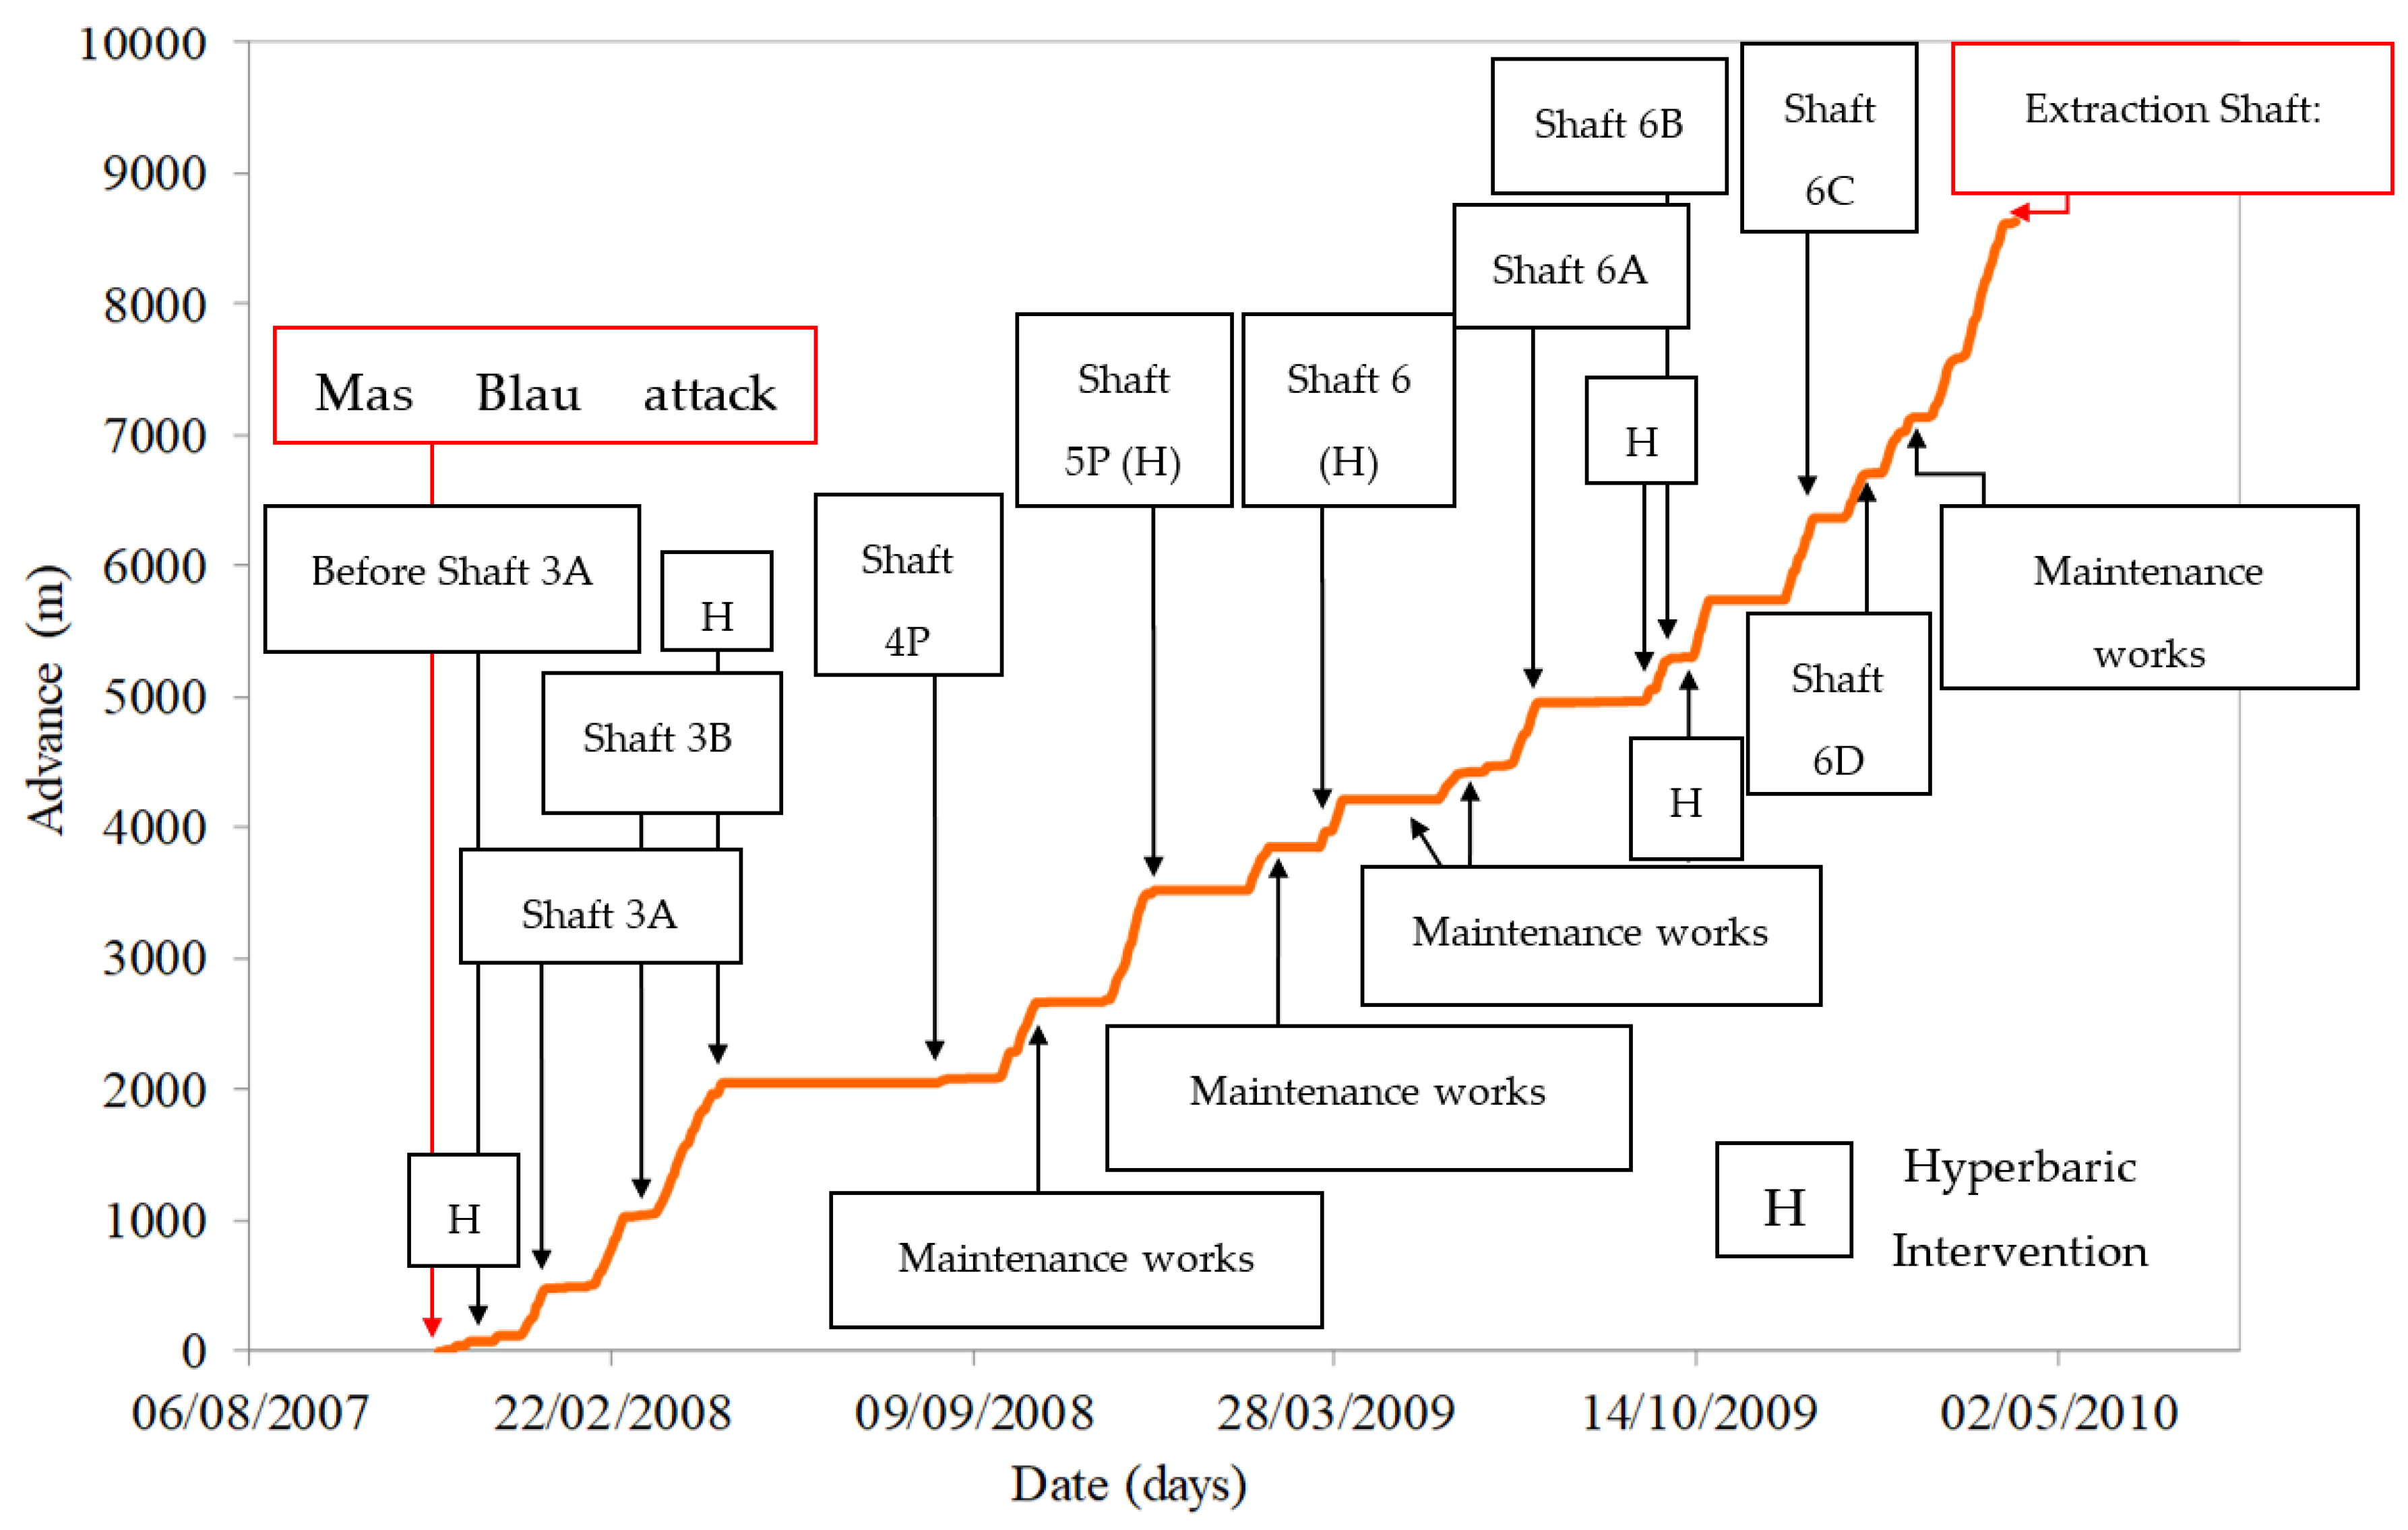
The average advance speed of the Hades TBM, along its more than 8 km of route, has been 26.37 m/day, equivalent to almost 18 rings per day (not including the periods in which the machine has remained stopped). The maximum advance recorded by this same machine was 72 m/day, that is, 48 rings/day. This is a high performance if we compare it with records in deltaic grounds also excavated with a TBM of the EPB type and with similar characteristics, as in the case of the construction of the Bangkok subway, where its best advance record was of the order of 20 m/day (Phienwej, N. et al., 2006). Hence,
Figure 4 shows the advance of the TBM as a function of the excavation time employed, and the average speed reached with this TBM.
Regarding the stops of the tunnel boring machine, throughout the tunnel excavated, 77 stops of more than one day's duration were made in shafts and stations. These stops were mainly for technical-mechanical maintenance of the machine, logistical problems, dismantling of structures and complementary installations of the machine and stops to adapt the shaft before the TBM passing through. Of all these stops, only 9 were interventions in hyperbaric conditions, in which, not in all cases, it was necessary to change tools.
Figure 4 shows all the stops carried out for maintenance and tool change, in those cases where it has been needed.
The Guster tunnel boring machine (UTE Tunnel Airport 2, UTE Line 9), began excavation in the Mas Blau attack shaft (KP 4+330) to the Prat airport, Terminal entre pistes (KP 0+214) (
Figure 1).
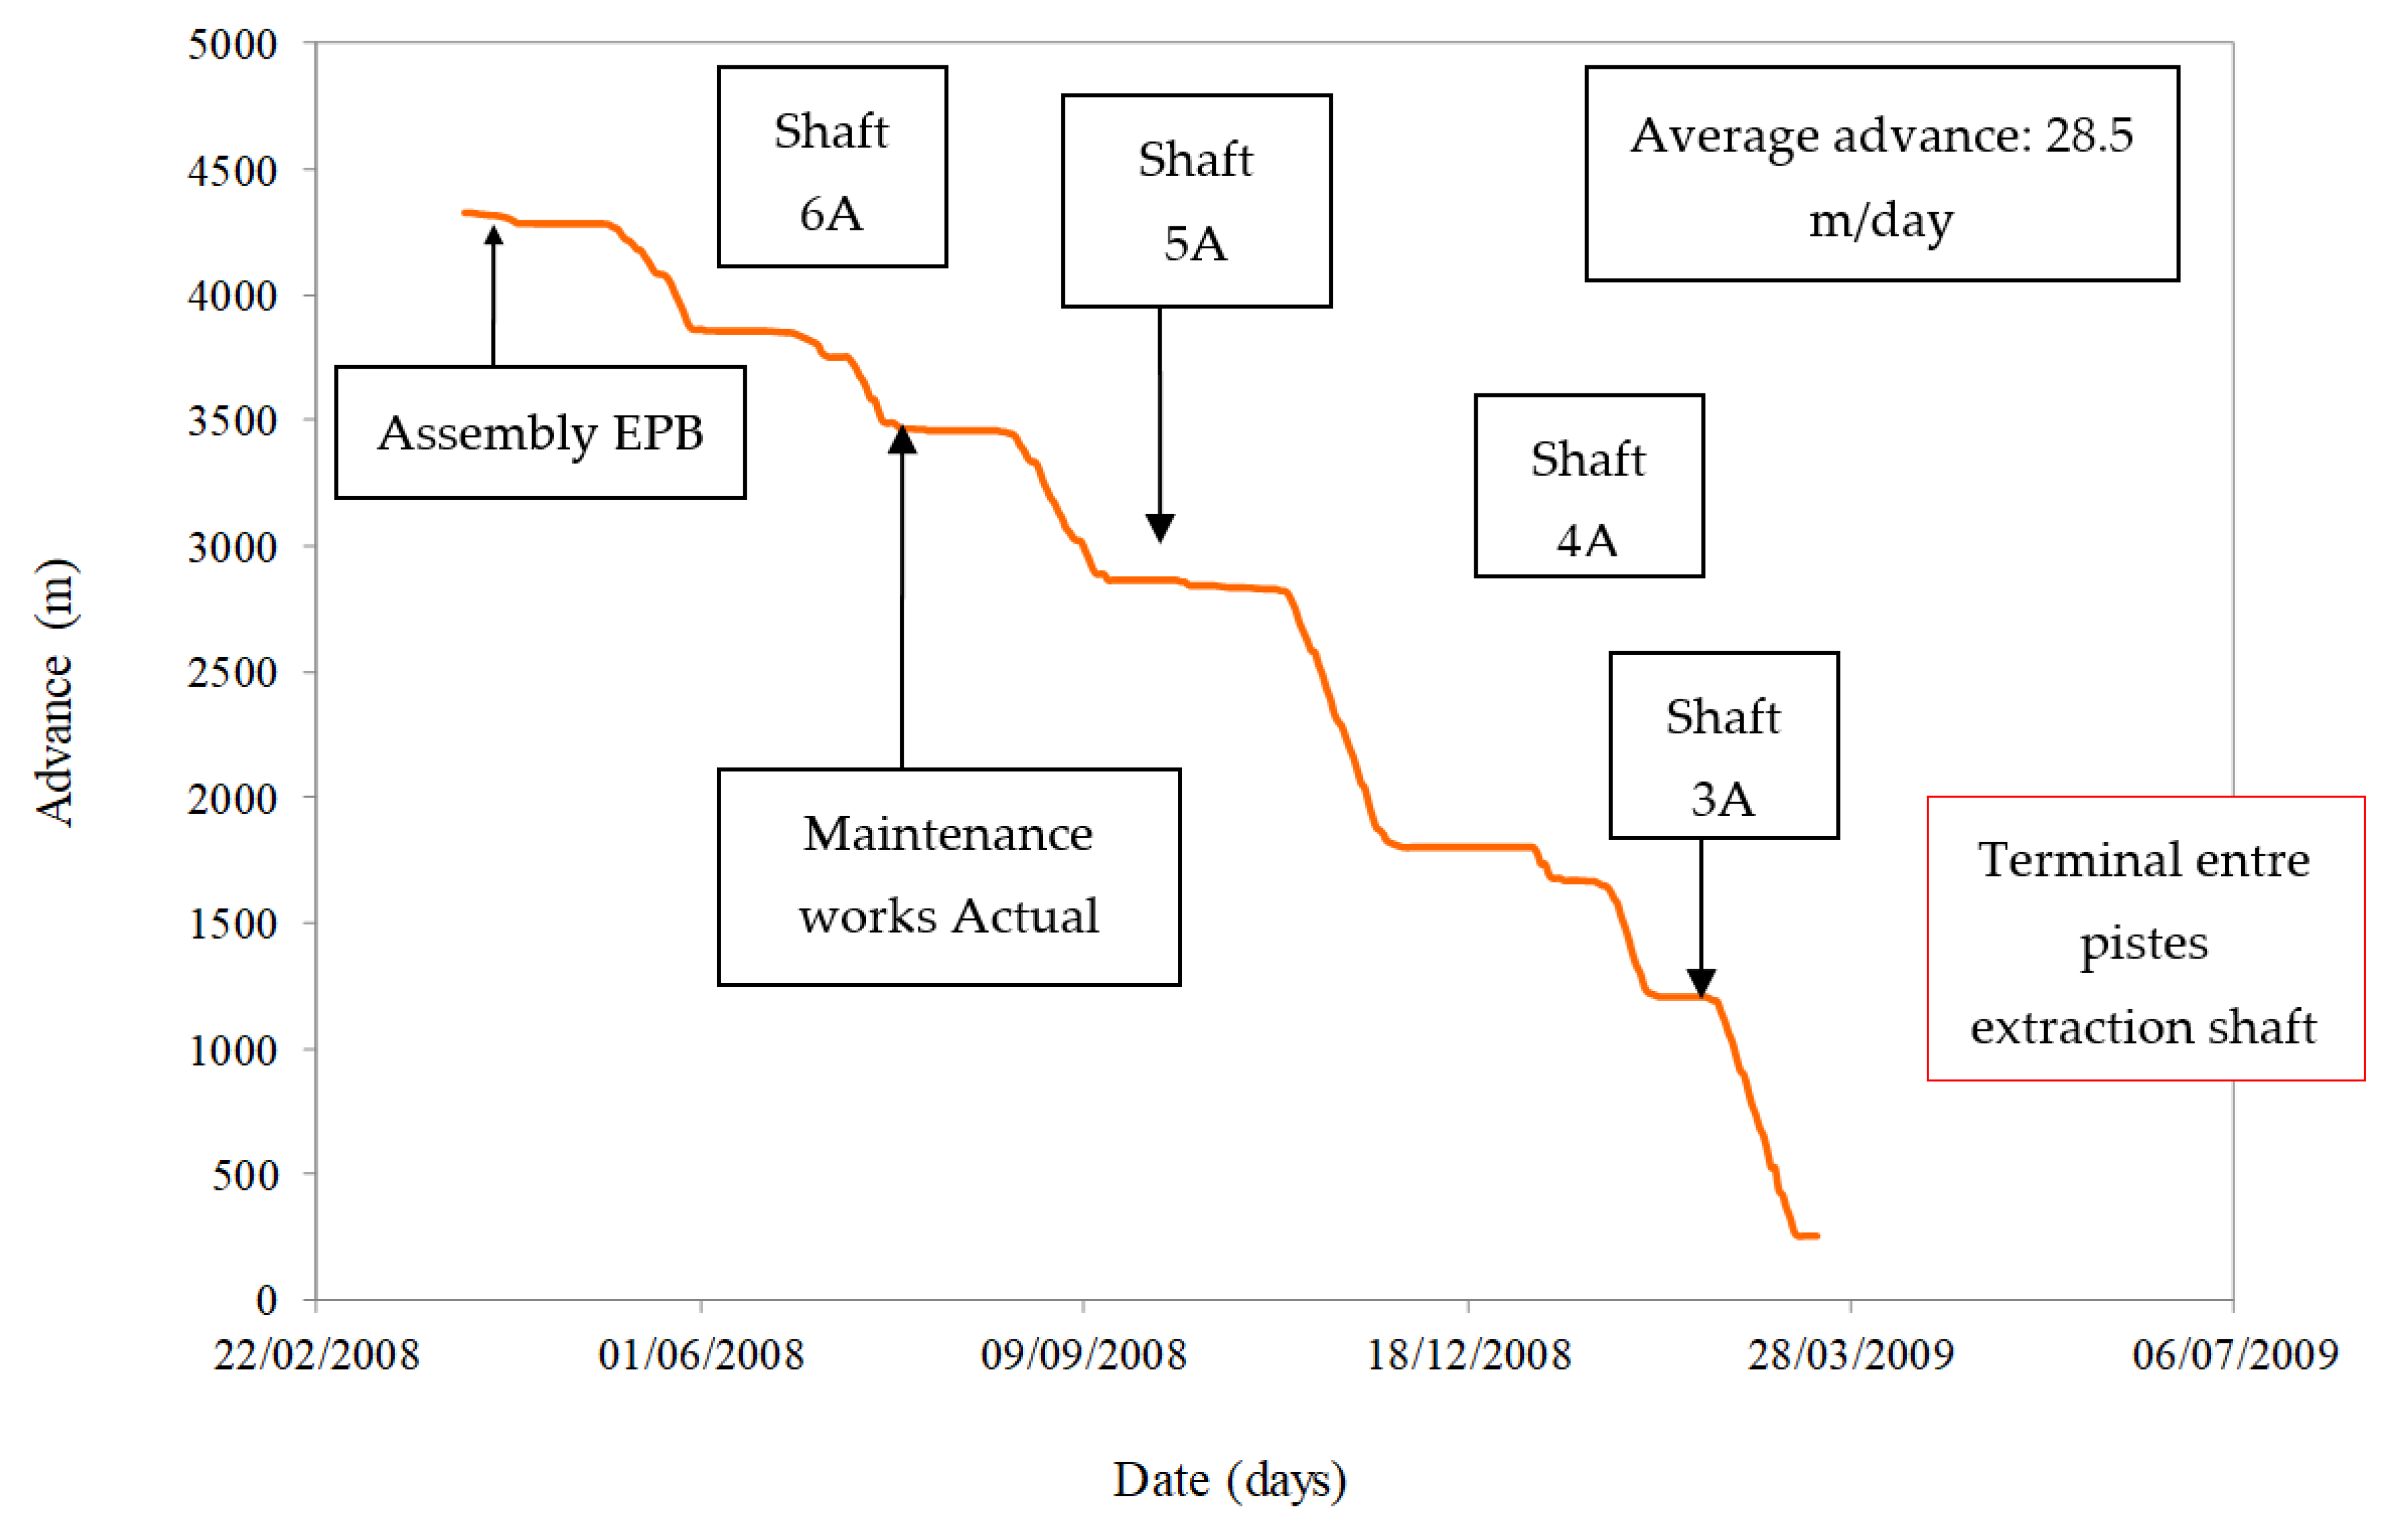
The average advance speed along the entire Section 1D was 28.5 m/day, equivalent to 19 rings per day (not including the periods when the machine was stopped). Additionally, it was the maximum advance recorded by this machine, which was also a world record, was 90 meters or 60 rings. Besides,
Figure 5 shows the advance of the TBM in relation to the excavation time employed and the average speed reached with this TBM. In this case, five stops were made, in shafts and stations, for tool changes on the cutter wheel and one hyperbaric intervention, where a head check was performed, but no tools were changed.
3.2. Main Factors Associated to Ground Movements due to EPB Excavation
Many research projects had been focused, not only on the study of the movements generated by the EPB machine in the tunnelling process but also, on the control mechanisms that the TBM has at its disposal to minimize such movements. Some of these projects are presented in: Clough, G.W. et al. 1983, Do, N.A. et al., 2014; Lee, H. et. al 1999, Lee, H. et al., 2021; Cording, E.J. 1991; Matsushita, Y., et al., 1995, Mair, R.J. & Taylor, R. N. 1997; Dimmock, P.S. 2003; Wongsaroj, J. et al., 2005; Wongsaroj, J. et al. 2006, Gens, A. et al., 2011.
The process of excavating a tunnel involves an alteration in the original tensional state of the soil. These changes can be continuous or in stages and are prolonged until a new state of equilibrium is reached. This stress alteration causes movements in the ground both at surface and at depth. Those movements are extended in the ground until a considerable distance from the excavation face, and they have a marked three-dimensional character, except in areas far from the excavation face, where the behaviour is close to plane deformation (Medina, 2000).
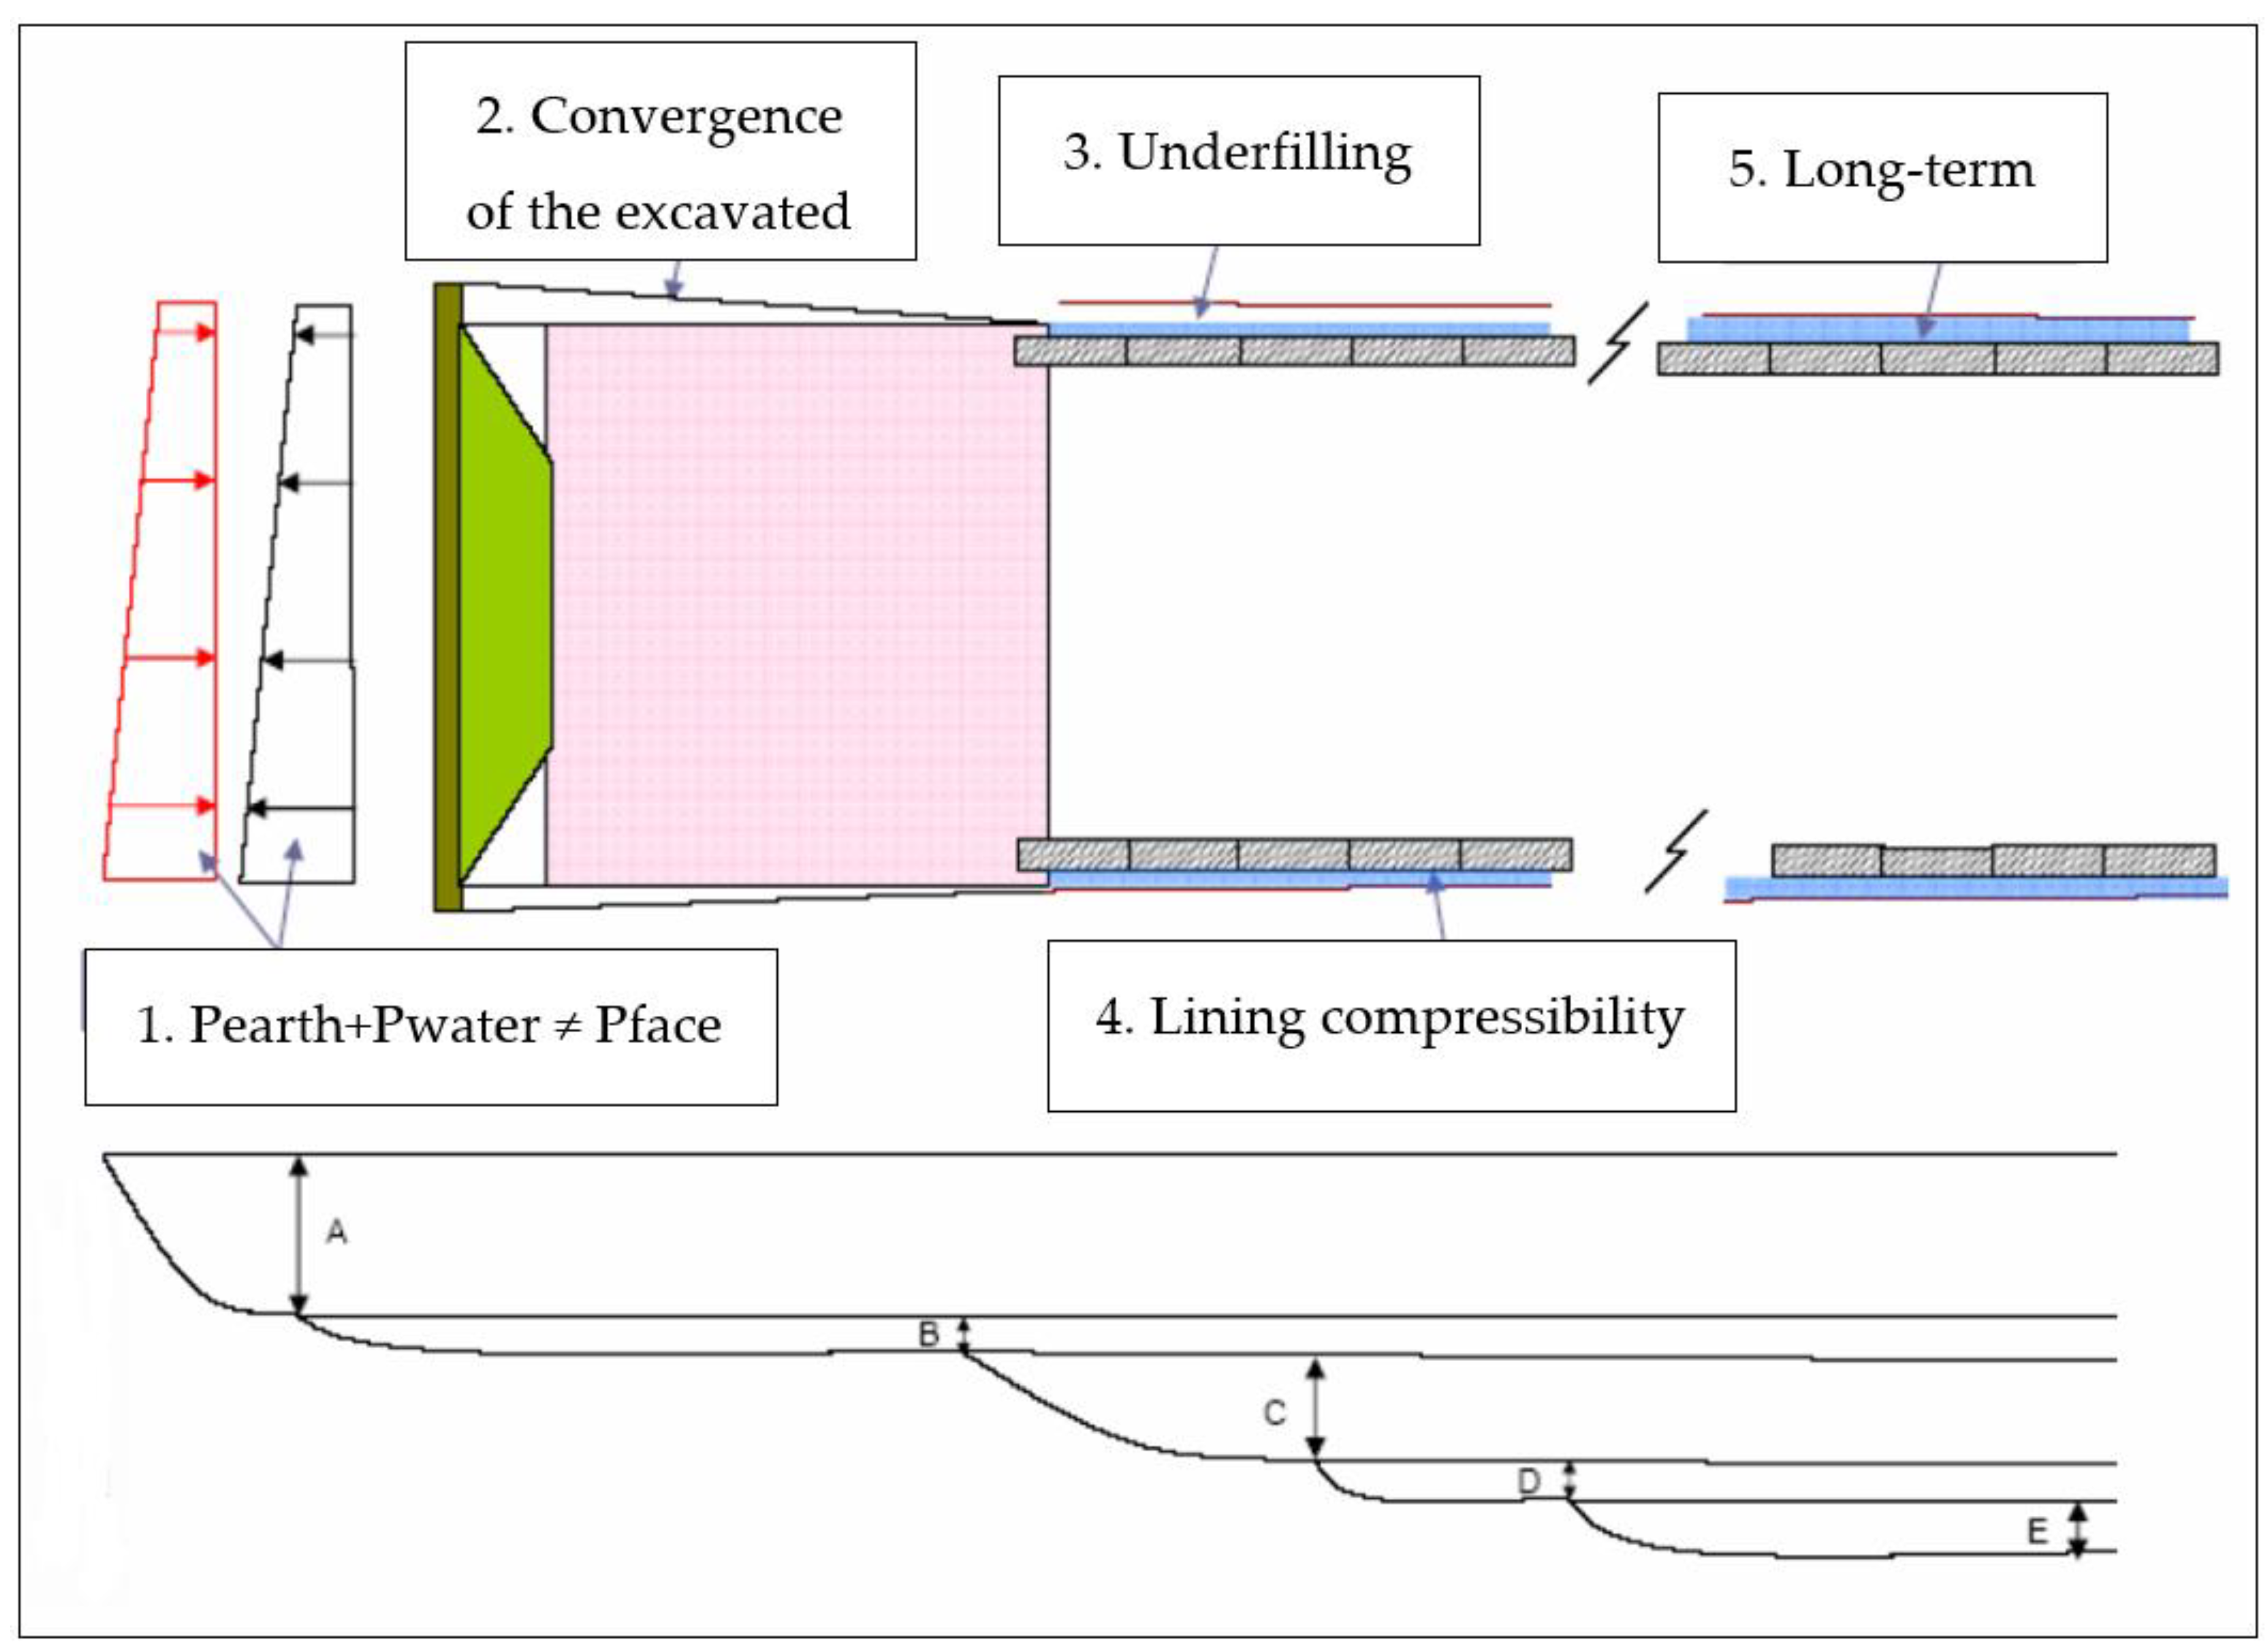
According to Mair and Taylor, 1997, there are five main differentiated factors associated to the generation of movements (
Figure 6).
Deformation at the excavation face caused by relaxation of in-situ stresses during excavation. In
Figure 6 the settlements originated before the passage of the cutting wheel are represented by the letter "A".
Convergence of the excavated surface. There is an over-excavation due to the outermost tools of the cutter wheel and then, a convergence of the ground due to the conicity of the shield since the excavation diameter is greater than the one of the backs of the shield.
Figure 6 shows the settlement induced during the passage of the shield, represented by the letter "B".
Underfilling of the space between the back of the segments and the outside of the shield, called, gap: After the passage of the shield tail, the space between the excavation profile and the installed liner tends to close, generating movements in the ground. In
Figure 6 this settlement is represented by the letter “C”.
Compressibility of the lining (segmental ring): This name includes the deformations of the loading of the lining. These movements are represented by the letter "D" in
Figure 6. However, in relation to the magnitudes of components "B" and "C", this movement can be considered as negligible and very difficult to see in practical terms for the case of Section 1 of Line 9 (Bono et. al, 2008).
Deferred deformations mainly attributed to the consolidation process: Fundamentally, the soil consolidation process in the construction of a tunnel with a TBM is due to the interstitial overpressures generated during the excavation process. The overpressure generated by the machine is transmitted through the porosity of the material and it dissipates over time. These deformations are represented by the letter "E" in
Figure 6.
Of the five factors mentioned above, 1 and 3 are the two most important factors to consider in order to minimize the generation of settlements when excavating with TBMs. The final magnitude of the settlement will be given by the sum of all the components “A, B, C, D and E”.
3.3. Operational Control Parameters Used in HADES and GUSTER
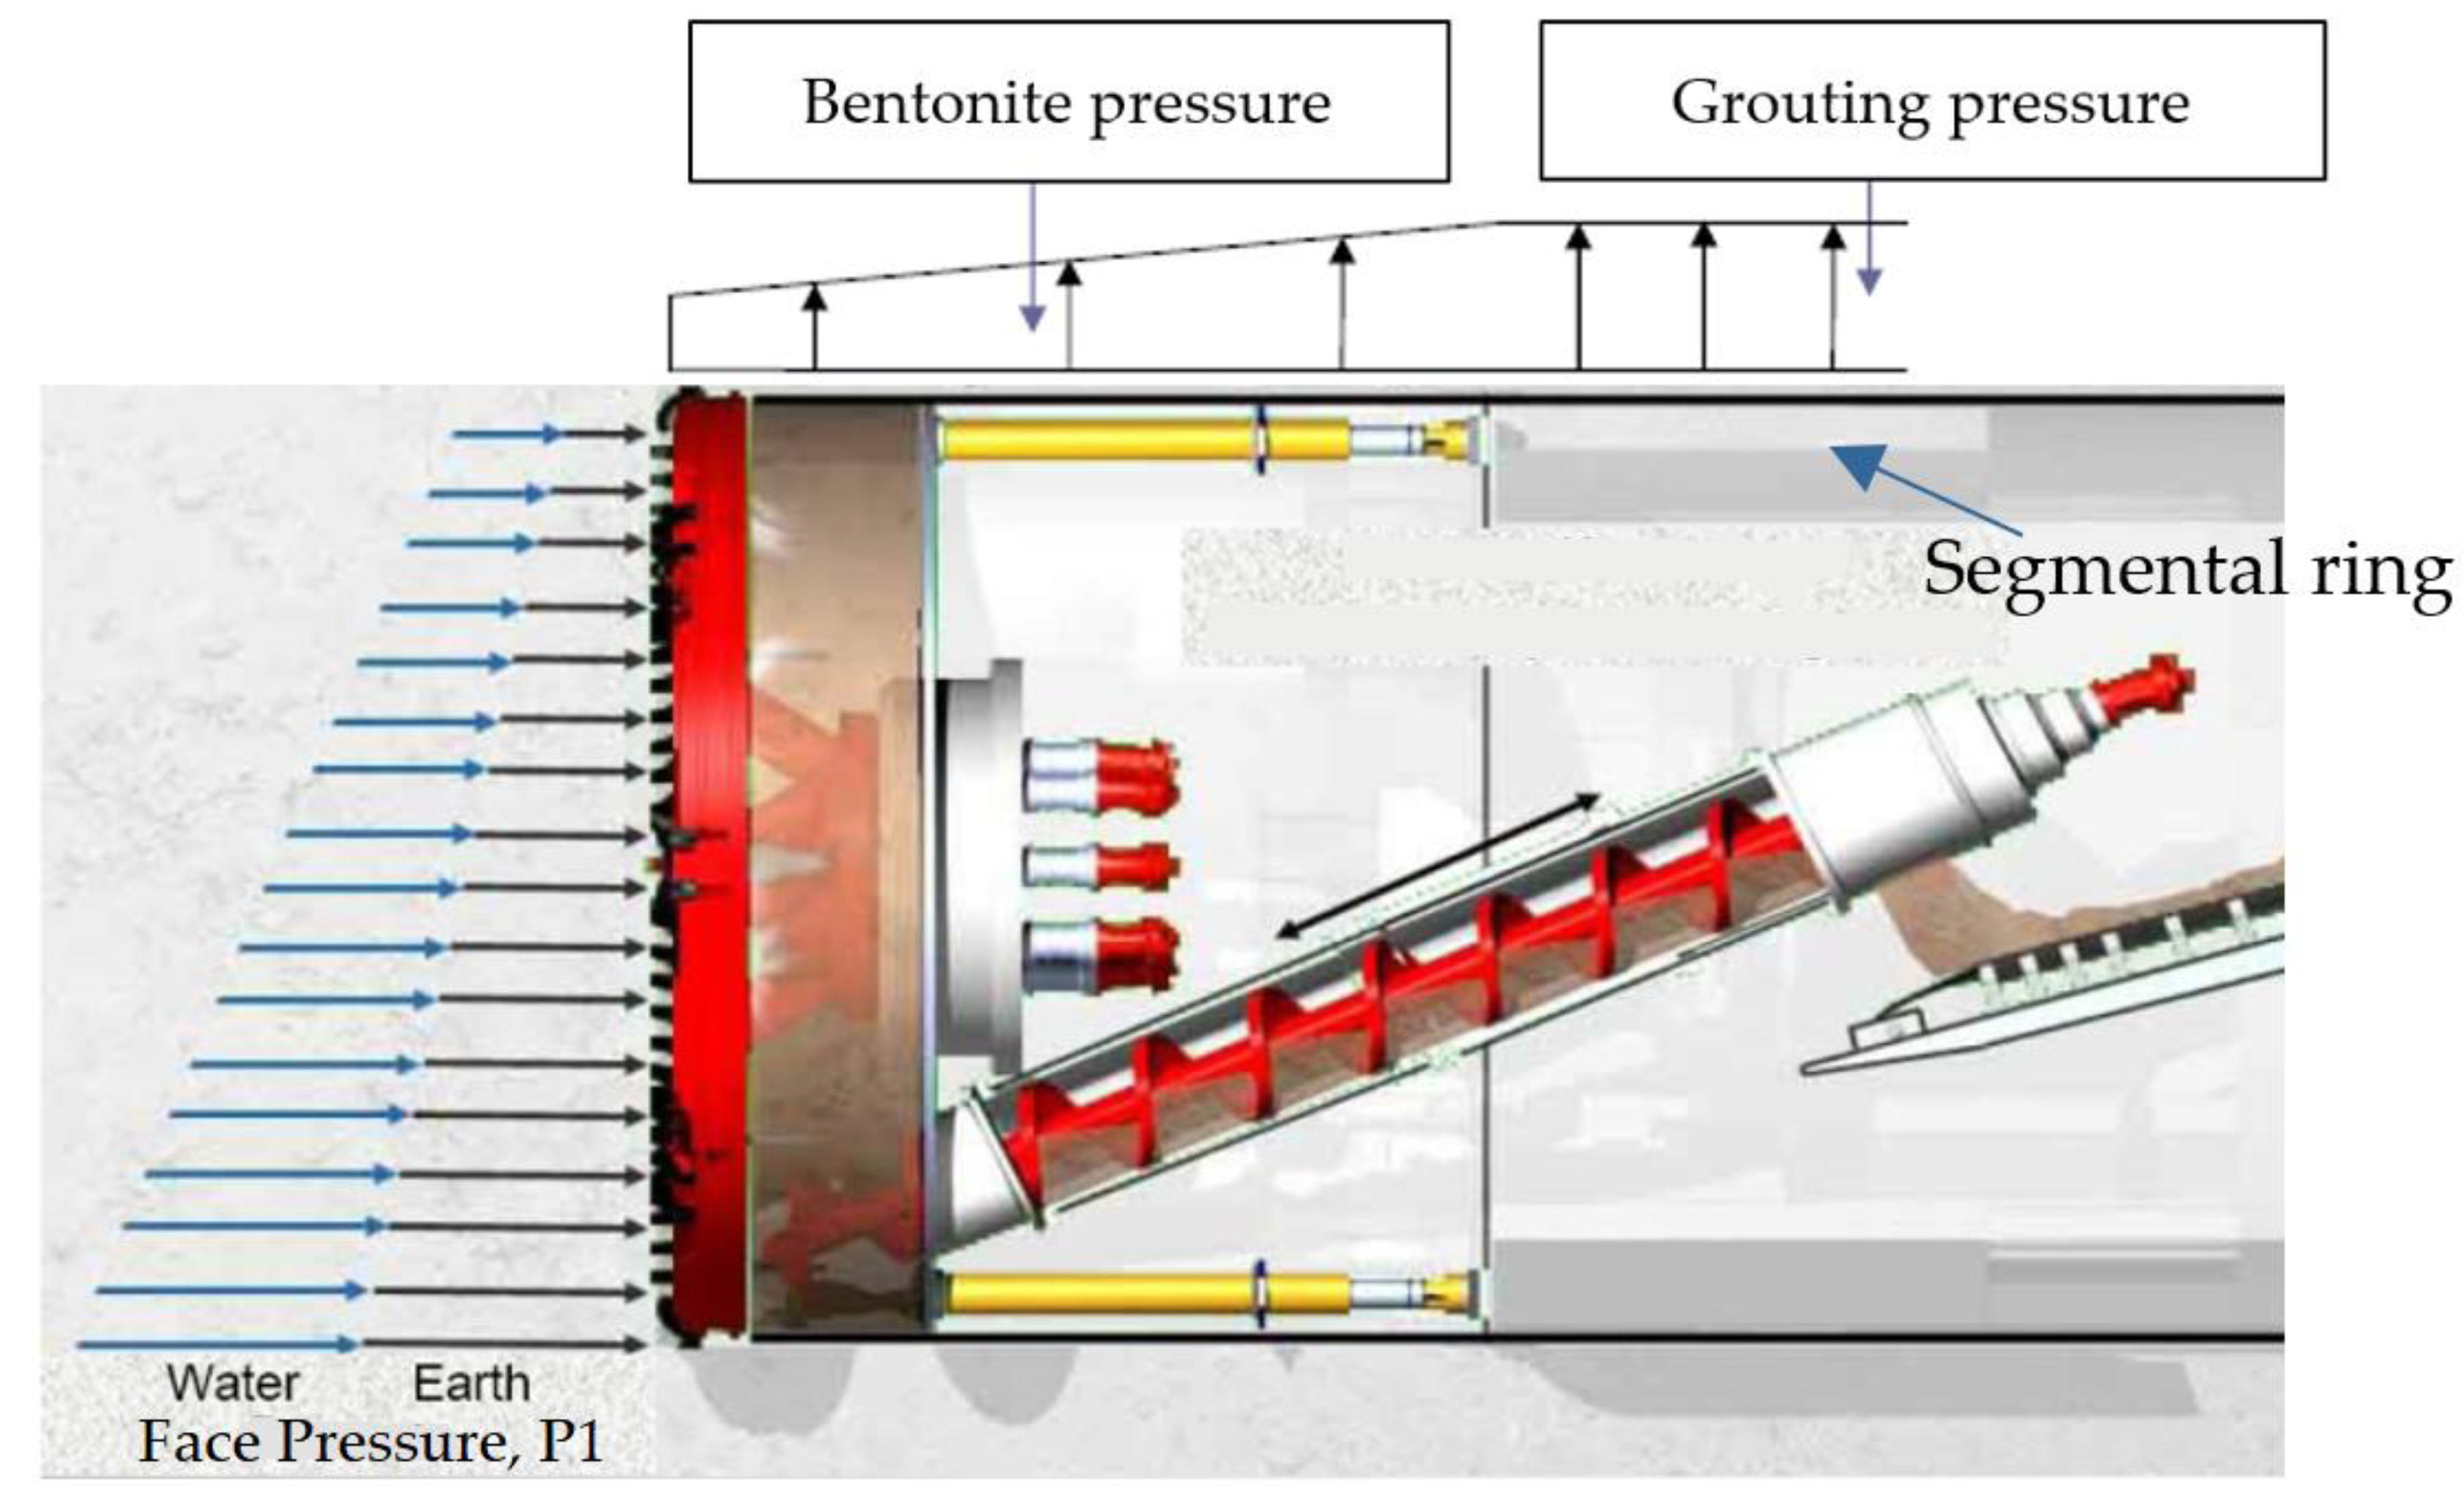
To minimize the possible movements generated by the excavation, TBMs have several mitigation systems related to the management of pressures and injection volumes, as shown in
Figure 7, and described below:
Face Pressure (P1)
To start with, a pressure called P1 is applied to the face of the excavation. This pressure represents the pressure at which the excavated material is located in the excavation chamber, measured at all times by seven sensors or pressure measuring cells located at the back side of the EPB machine's cutter wheel. The pressure is controlled by the shield advance speed, the excavated material removal rate and the density of the material in the earth chamber (
Figure 7).
In addition, the values of the face pressure (P1) along Section 1 vary between 1.00-3.50 bar approximately, with an average pressure of 2.60 bar. In areas where the TBM was stopped, bentonite was injected to maintain this face pressure.
Bentonite slurry pressure around the shield (P2) and (V2)
In some areas of Line 9 of Barcelona Metro, the difference between the excavation diameter and the outer diameter of the shield tail can reach up to 6 cm of separation (Bono et. al, 2008) causing large movements in the ground. To solve this problem, the first thought was to inject a product with a gel structure that would harden over time. Finally, the initial tests carried out on Line 9 of the Barcelona Metro allowed the successful development of the filling of this "gap" with bentonite slurry at a pressure similar to that existing in the chamber, a pressure controlled by cells attached to the inner face of the metal shield wall (Mendaña, 2009) and which will be called (P2). The main reason for this volume of injected bentonite slurry (V2) is to provide additional support in the middle zone between the cutter wheel and the shield tail. In addition to decreasing the friction between the shield and the surrounding ground, also reducing the total thrust that the TBM must exert in the advance.
The bentonite injection pressure system of both the HADES TBM and the GUSTER TBM is regulated by 6 pressure measuring cells attached to the inner face of the metal shield wall. The bentonite injection pressure in the shield varies between 1.5 and 2.5 bar.
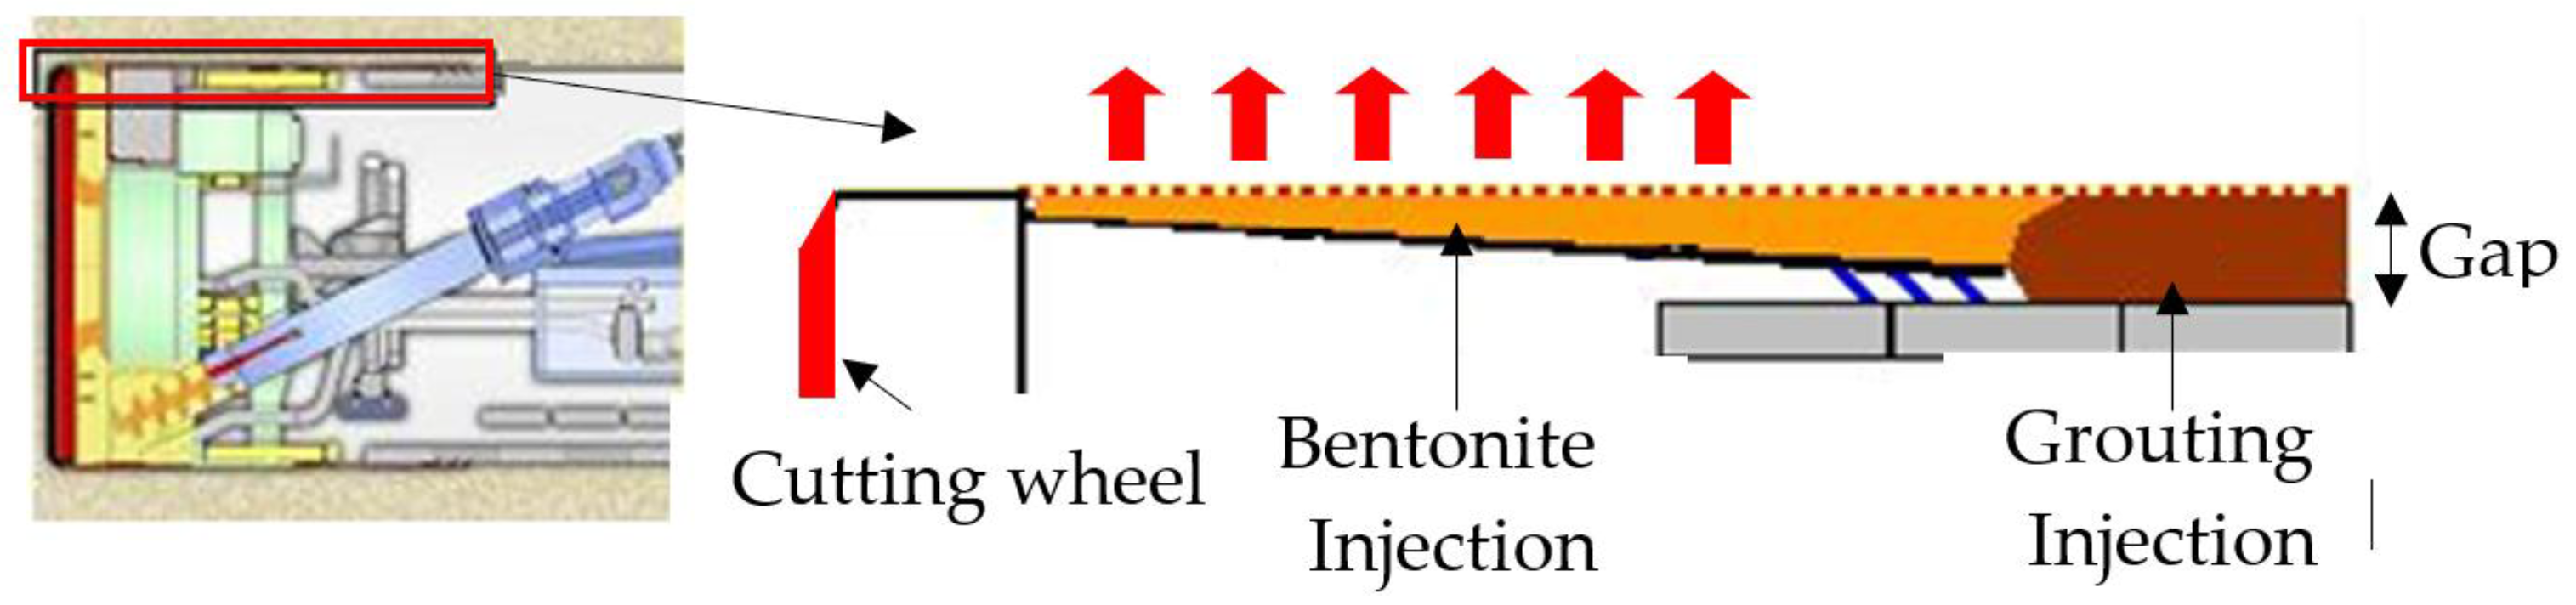
Pressure and volume of grouting injected into the shield tail (P3) and (V3)
The excavation section of the HADES TBM as well as the GUSTER TBM is 69.84 m² (Ø maximum diameter = 9.43 m), while the outer section of the lining ring once in place is 64.61 m² (Ø = 9.07 m). Given that the advance per ring is 1.5 meters, this results in a maximum theoretical gap of 7.85 m³ per installed ring.
Considering a correction factor of 1.15—accounting for pressure loss in injection lines, groundwater seepage, and additional material injected through the shield—the final injected volume per ring is adjusted to 8.26 m³.
Moreover, the EPB TBMs in charge of excavating Section 1 of Line 9 have six injection points for grouting, distributed around the perimeter of the shield tail. The injection pressure at these points typically ranges between 2.5 and 3.5 bar.
Figure 8 illustrates the process of bentonite injection to fill the excavation gap and the subsequent grouting injection at the shield tail to ensure proper contact between the tunnel lining and the surrounding soil.
Therefore, the TBMs record other parameters such as: the thrust made by the machine to advance, the torque of the cutting wheel, etc.
Table 1 summarizes the average values of the most relevant operational parameters in relation to the generation of possible movements in the ground of the two EPB machines used in the excavation of Section 1 of Line 9.
4. Surface Ground Movements
4.1. Components of Ground Settlement due to EPB Tunnelling
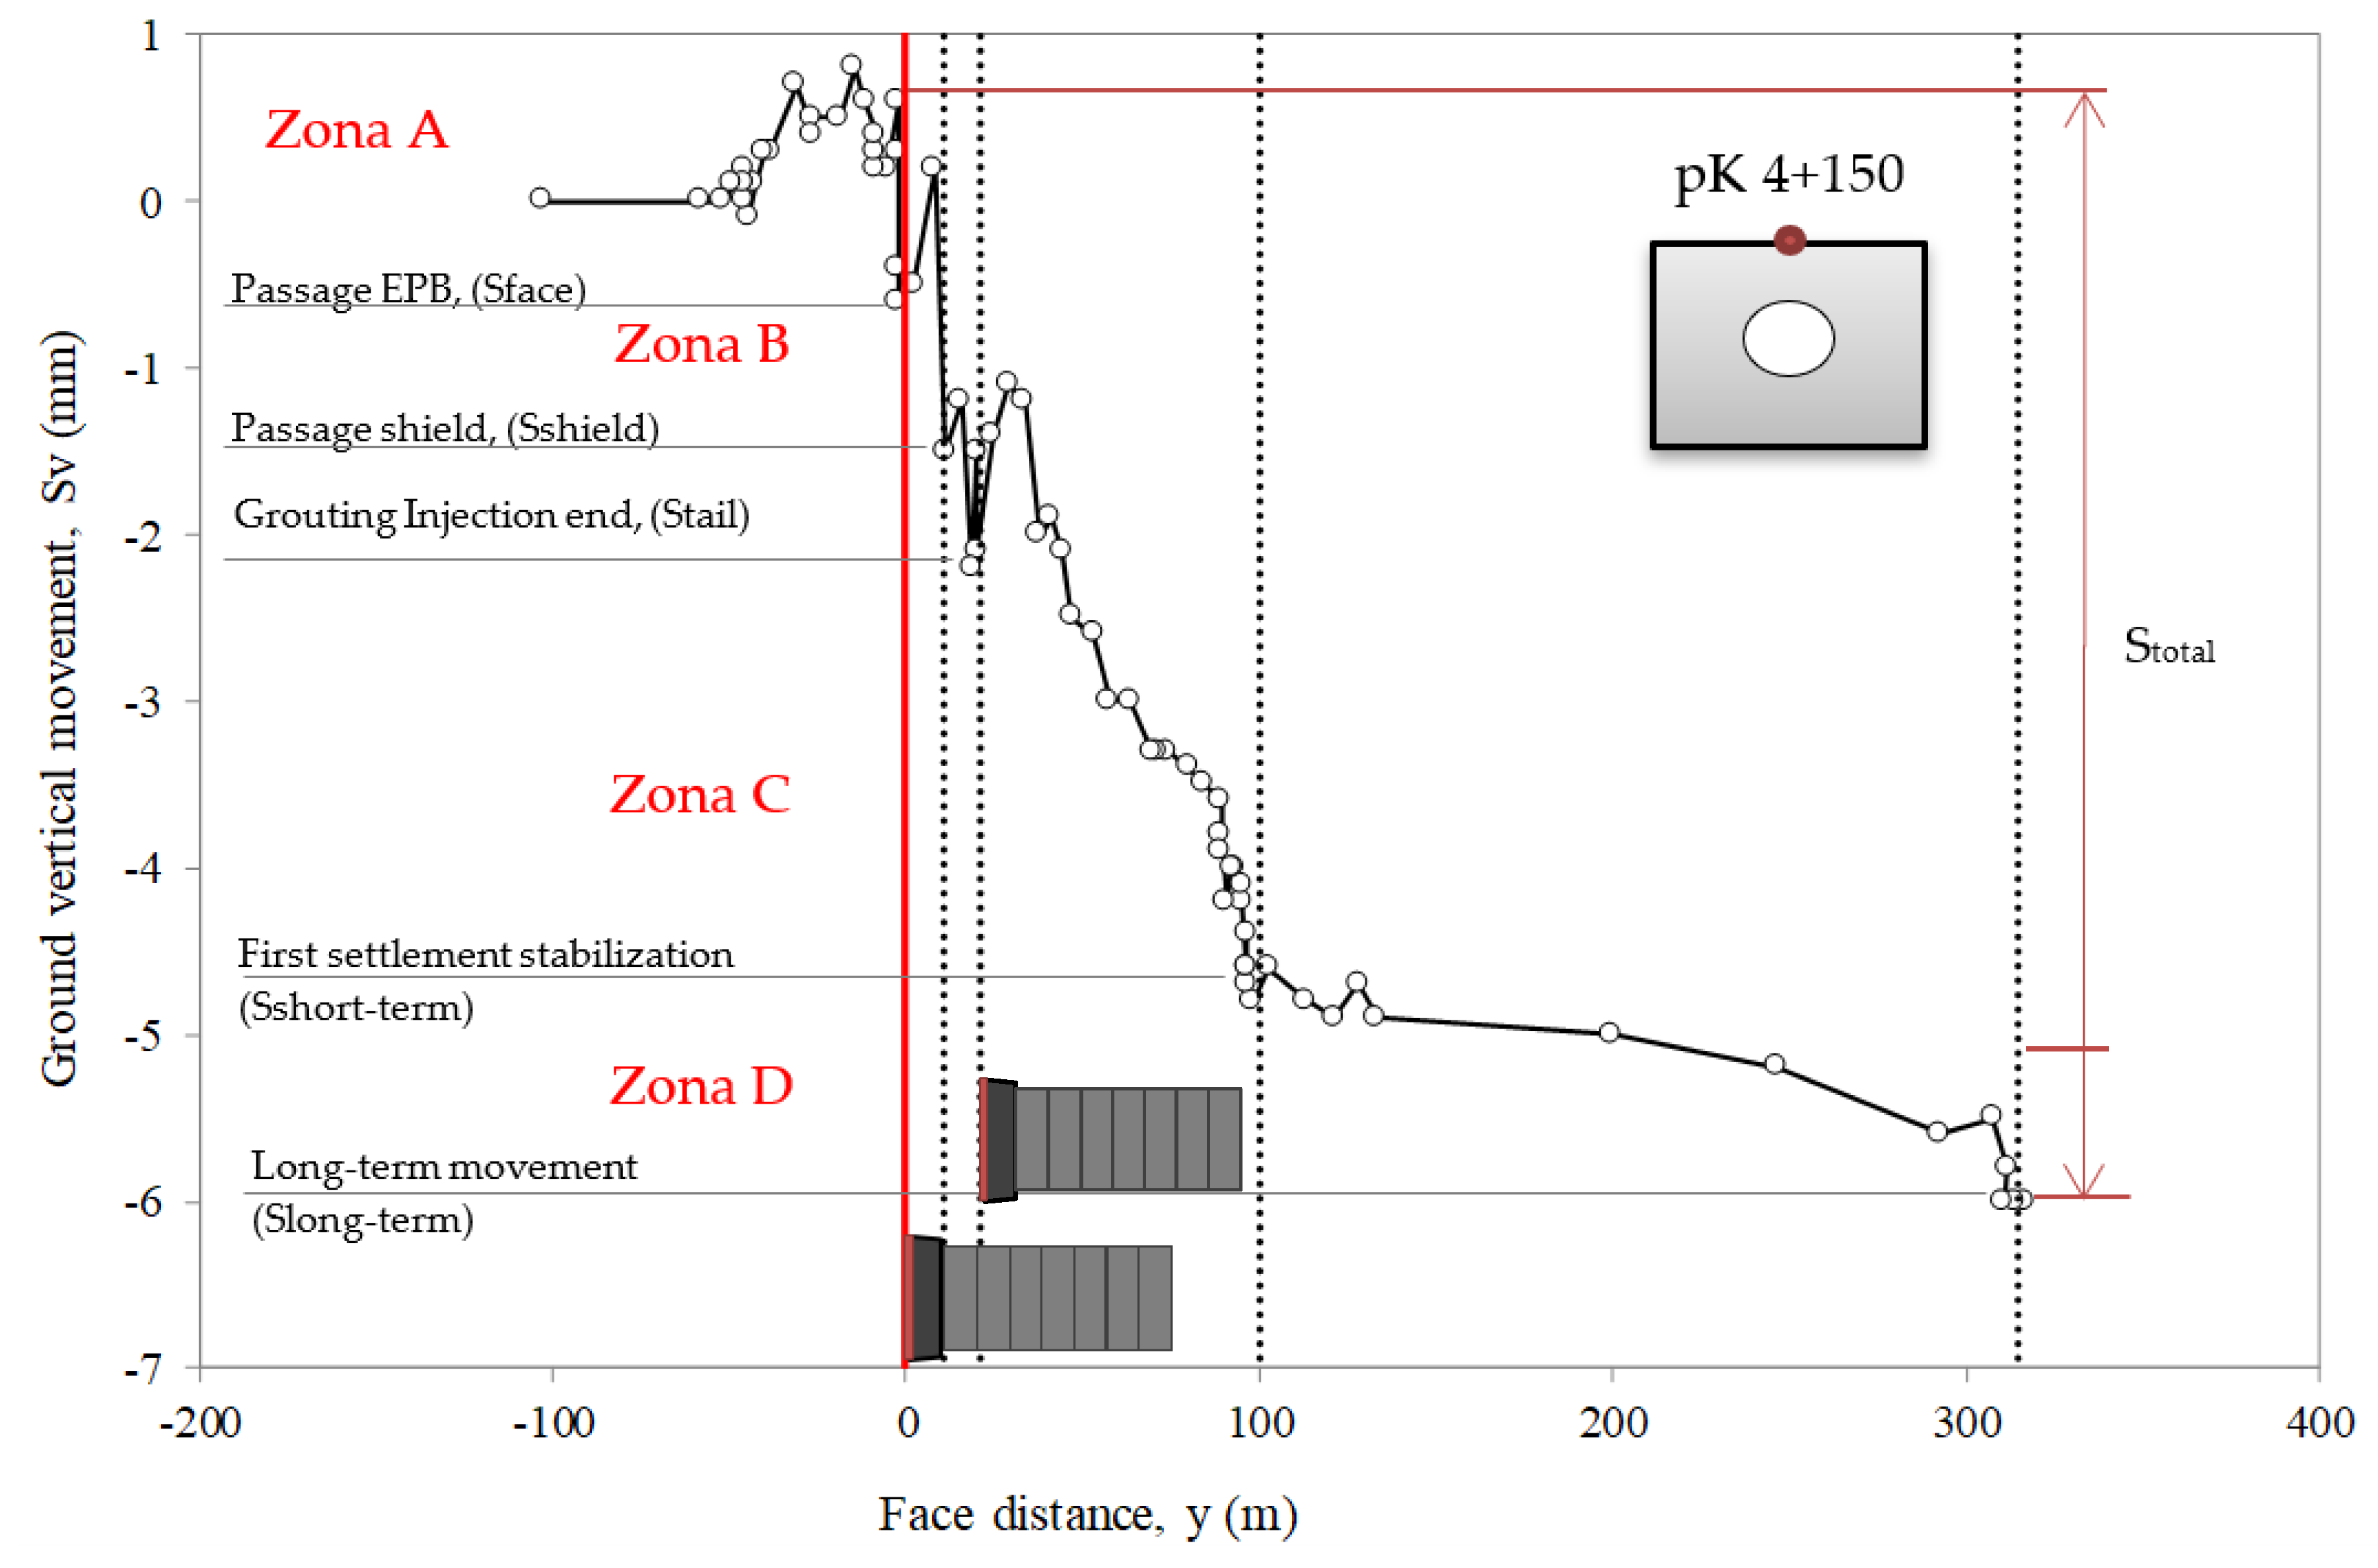
In order to define how the excavation process influences the ground settlement, five settlement components have been defined. Firstly, the one measured at the excavation face (∆S1) associated with the relaxation of the state of stresses in the face associated with the excavation process (1). Secondly, the settling due to the shield passage (∆S2), associated with the over-excavation around the shield and the machine operator's own experience (2). Thirdly, the seating due to the closure of the space at the tail of the shield and the possible deformation of the liner (∆S3), associated with the closure of the space between the external diameter of the shield and the excavation known as "gap" (3) and with the deformations of the own installed support (4). This is a fourth component that occurs until the settlement temporarily stabilizes (∆S4), being (Sshort-term =∆S1+∆S2+∆S3+∆S4). The fifth and last component is the settlement that occurs in the long-term due to consolidation processes. (∆S5), generated after the excavation process (5), being the sum of all of them, the total or long-term settlement. (Stotal =∆S1+∆S2+∆S3+∆S4 +∆S5).
Figure 9 shows the variation of vertical ground settlement as a function of distance from the tunnel face at a surface point above the tunnel crown. The magnitude of the displacements is small, but the measurement recording frequency of the levelling milestones is sufficient to identify the different individual responses previously mentioned. Moreover, in the
Figure 9 we can see how the ground movements on the surface begin to occur when the distance between the TBM and the monitored section is less than about 50 meters. At several points along the route, it is noticed that the ground surface shows small elevations in these meters close to the excavation face. The rise shortly before the excavation face decreases to settlement values in most cases. During the passage of the shield through the monitored section it has been observed in many of the cases studied that during these 10 meters of length of the shield zone the settlement decreases or stabilizes with the injection in the shield zone, and then continues to increase. After the passage of the shield through the monitored section, approximately 10-20 m, the ground surface movement slows down again with the injection at the back of the shield. At 100-150 m after the TBM passes through the monitored section, the surface settlement is partially stabilized (S
a short-term) and finally at about 300 - 500 m after the passage of the machine, the surface settlement can already be considered as final settlement (S
a long-term), as it can be considered to have finished the entry due to the consolidation process. The sum of all journal entry components is the total entry (S
total).
4.2. Ground Movement in Section 1
According to Wongsaroj. A. et al., (2006) the proportion of seats generated up to the passage of the EPB, at the excavation face (Sface) is estimated to be between 0.1-0.4 times the maximum seat.
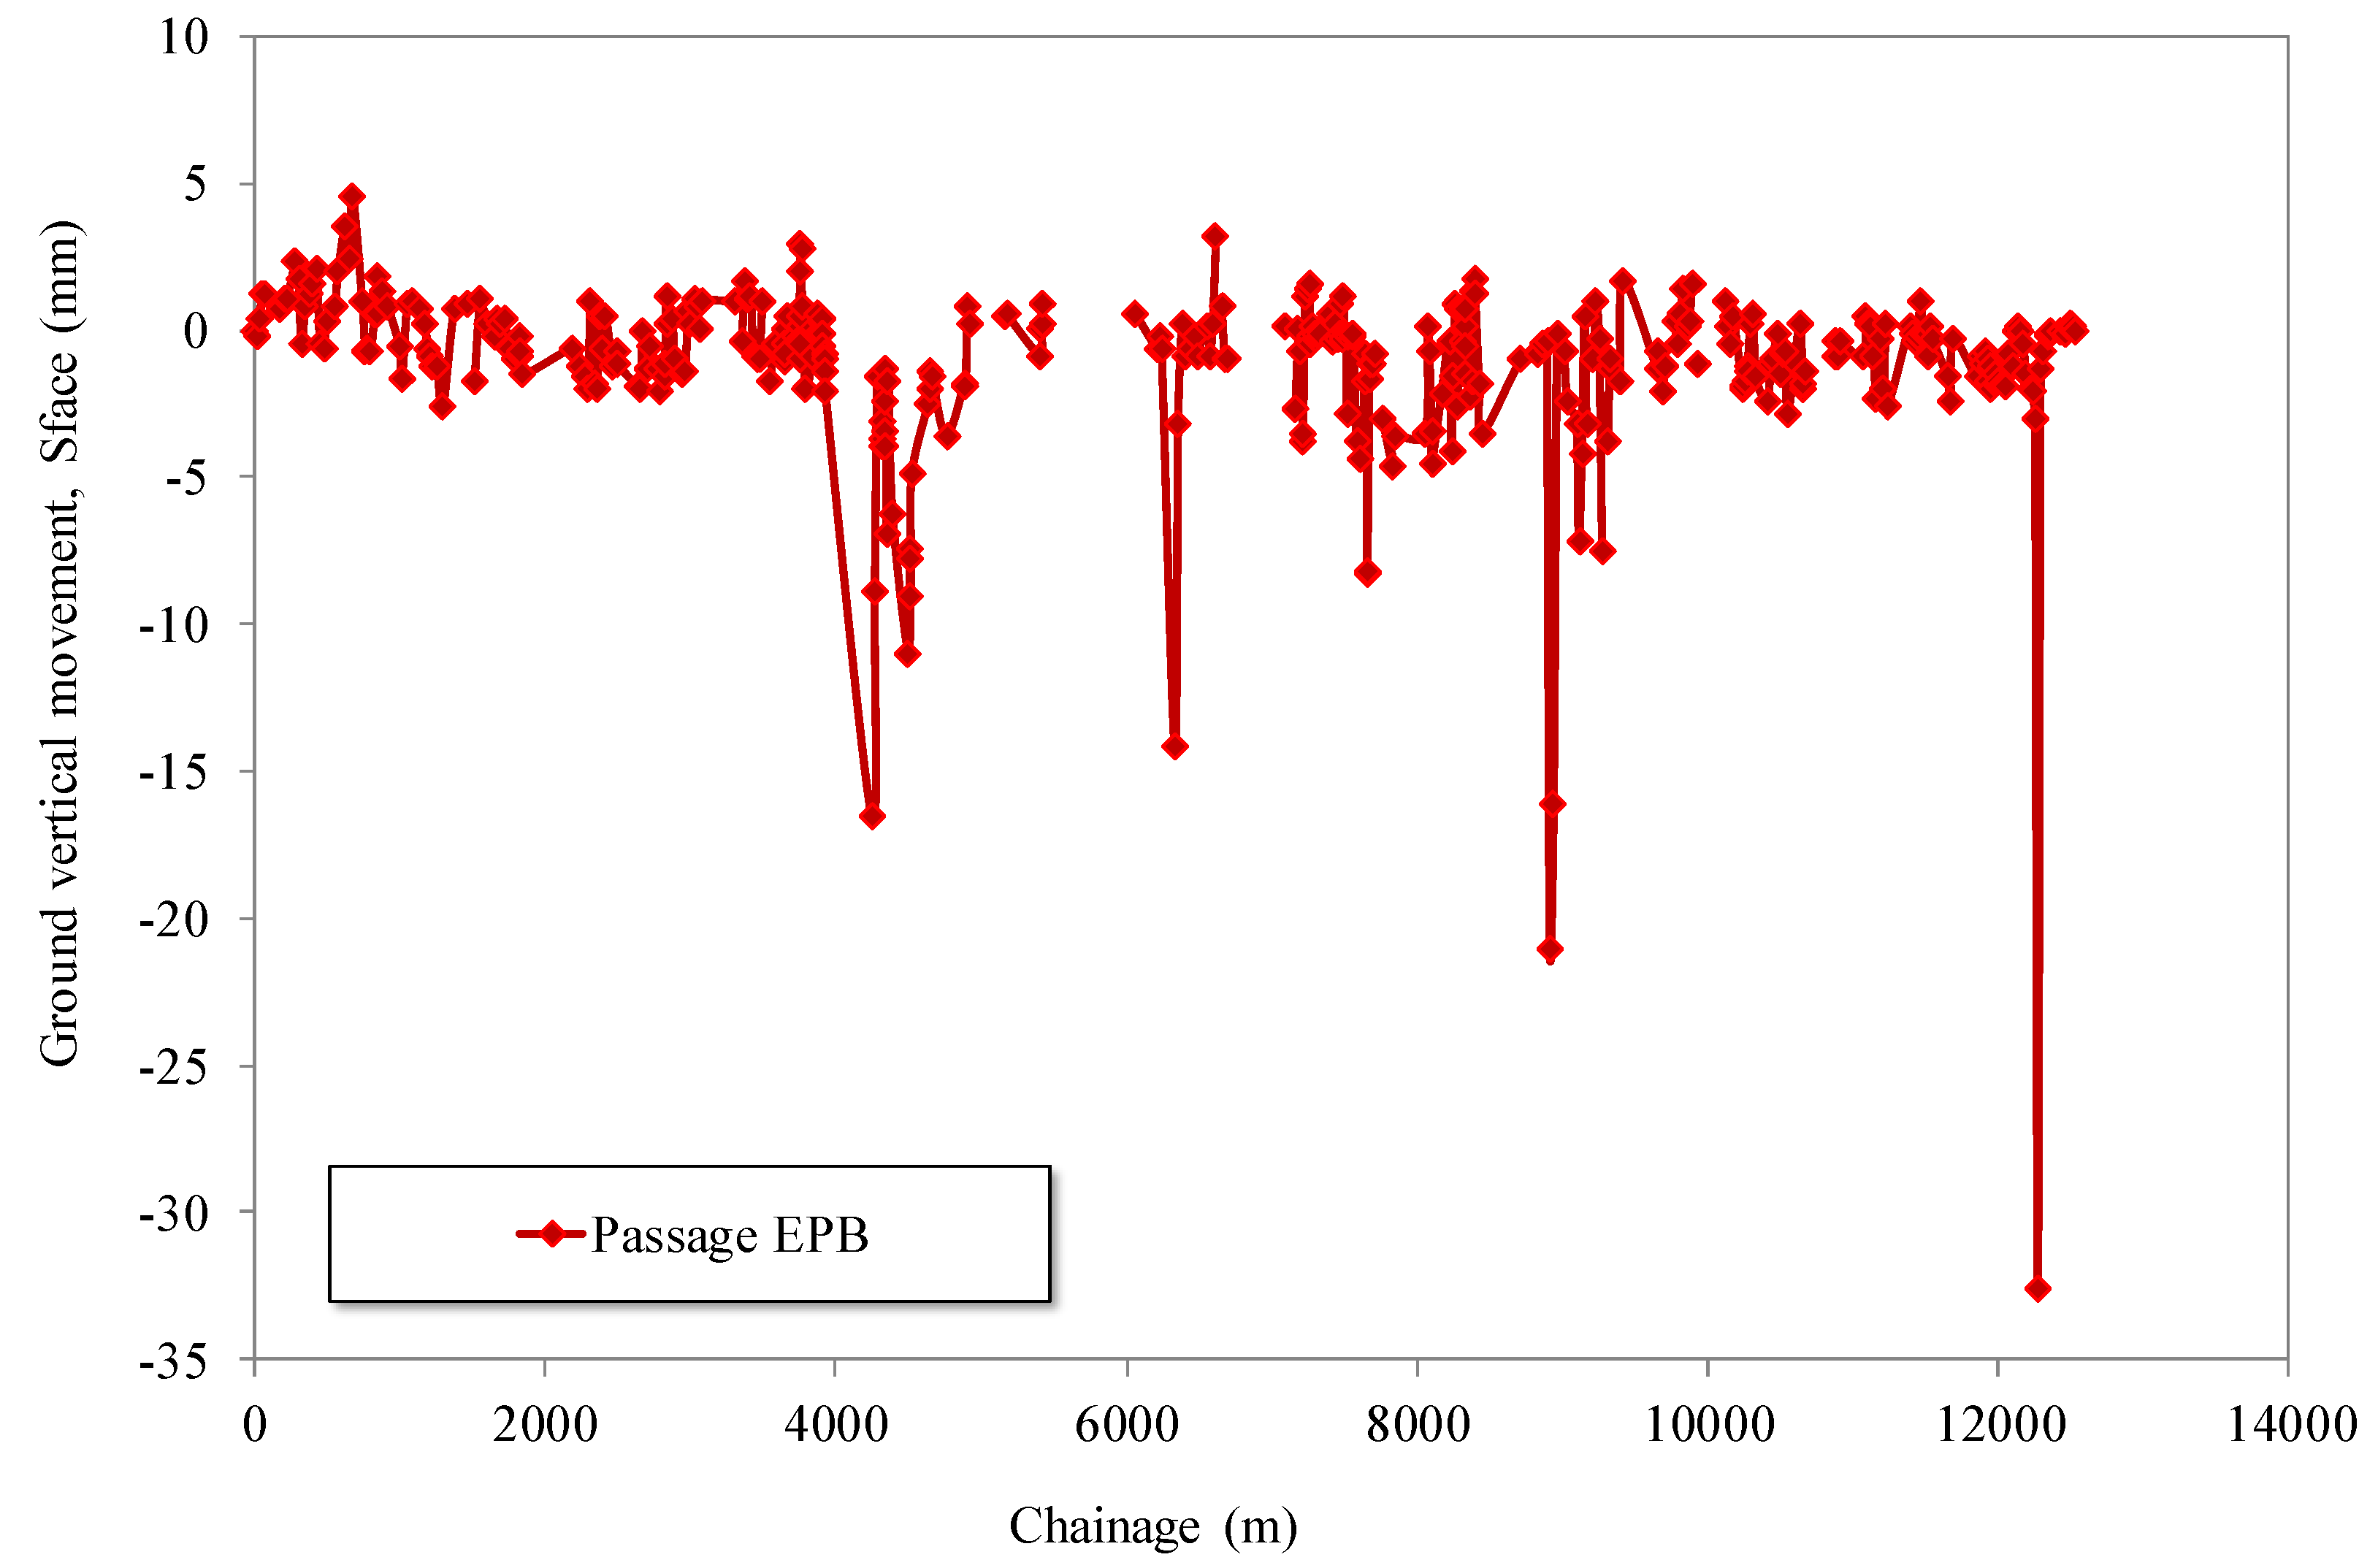
Figure 10 and
Figure 11 show the settlement measured up to the excavation face and the total settlement along the route of the tunnel in Section 1 of Line 9 of the Barcelona Metro. The settlement at the excavation face (S
face) does not exceed -5 mm in most cases and corresponds to 10% of the total settlement (S
total), a value that falls within the lower range proposed by Wongsaroj et al. (2006). There are some specific points where this measure is clearly exceeded, as shown in
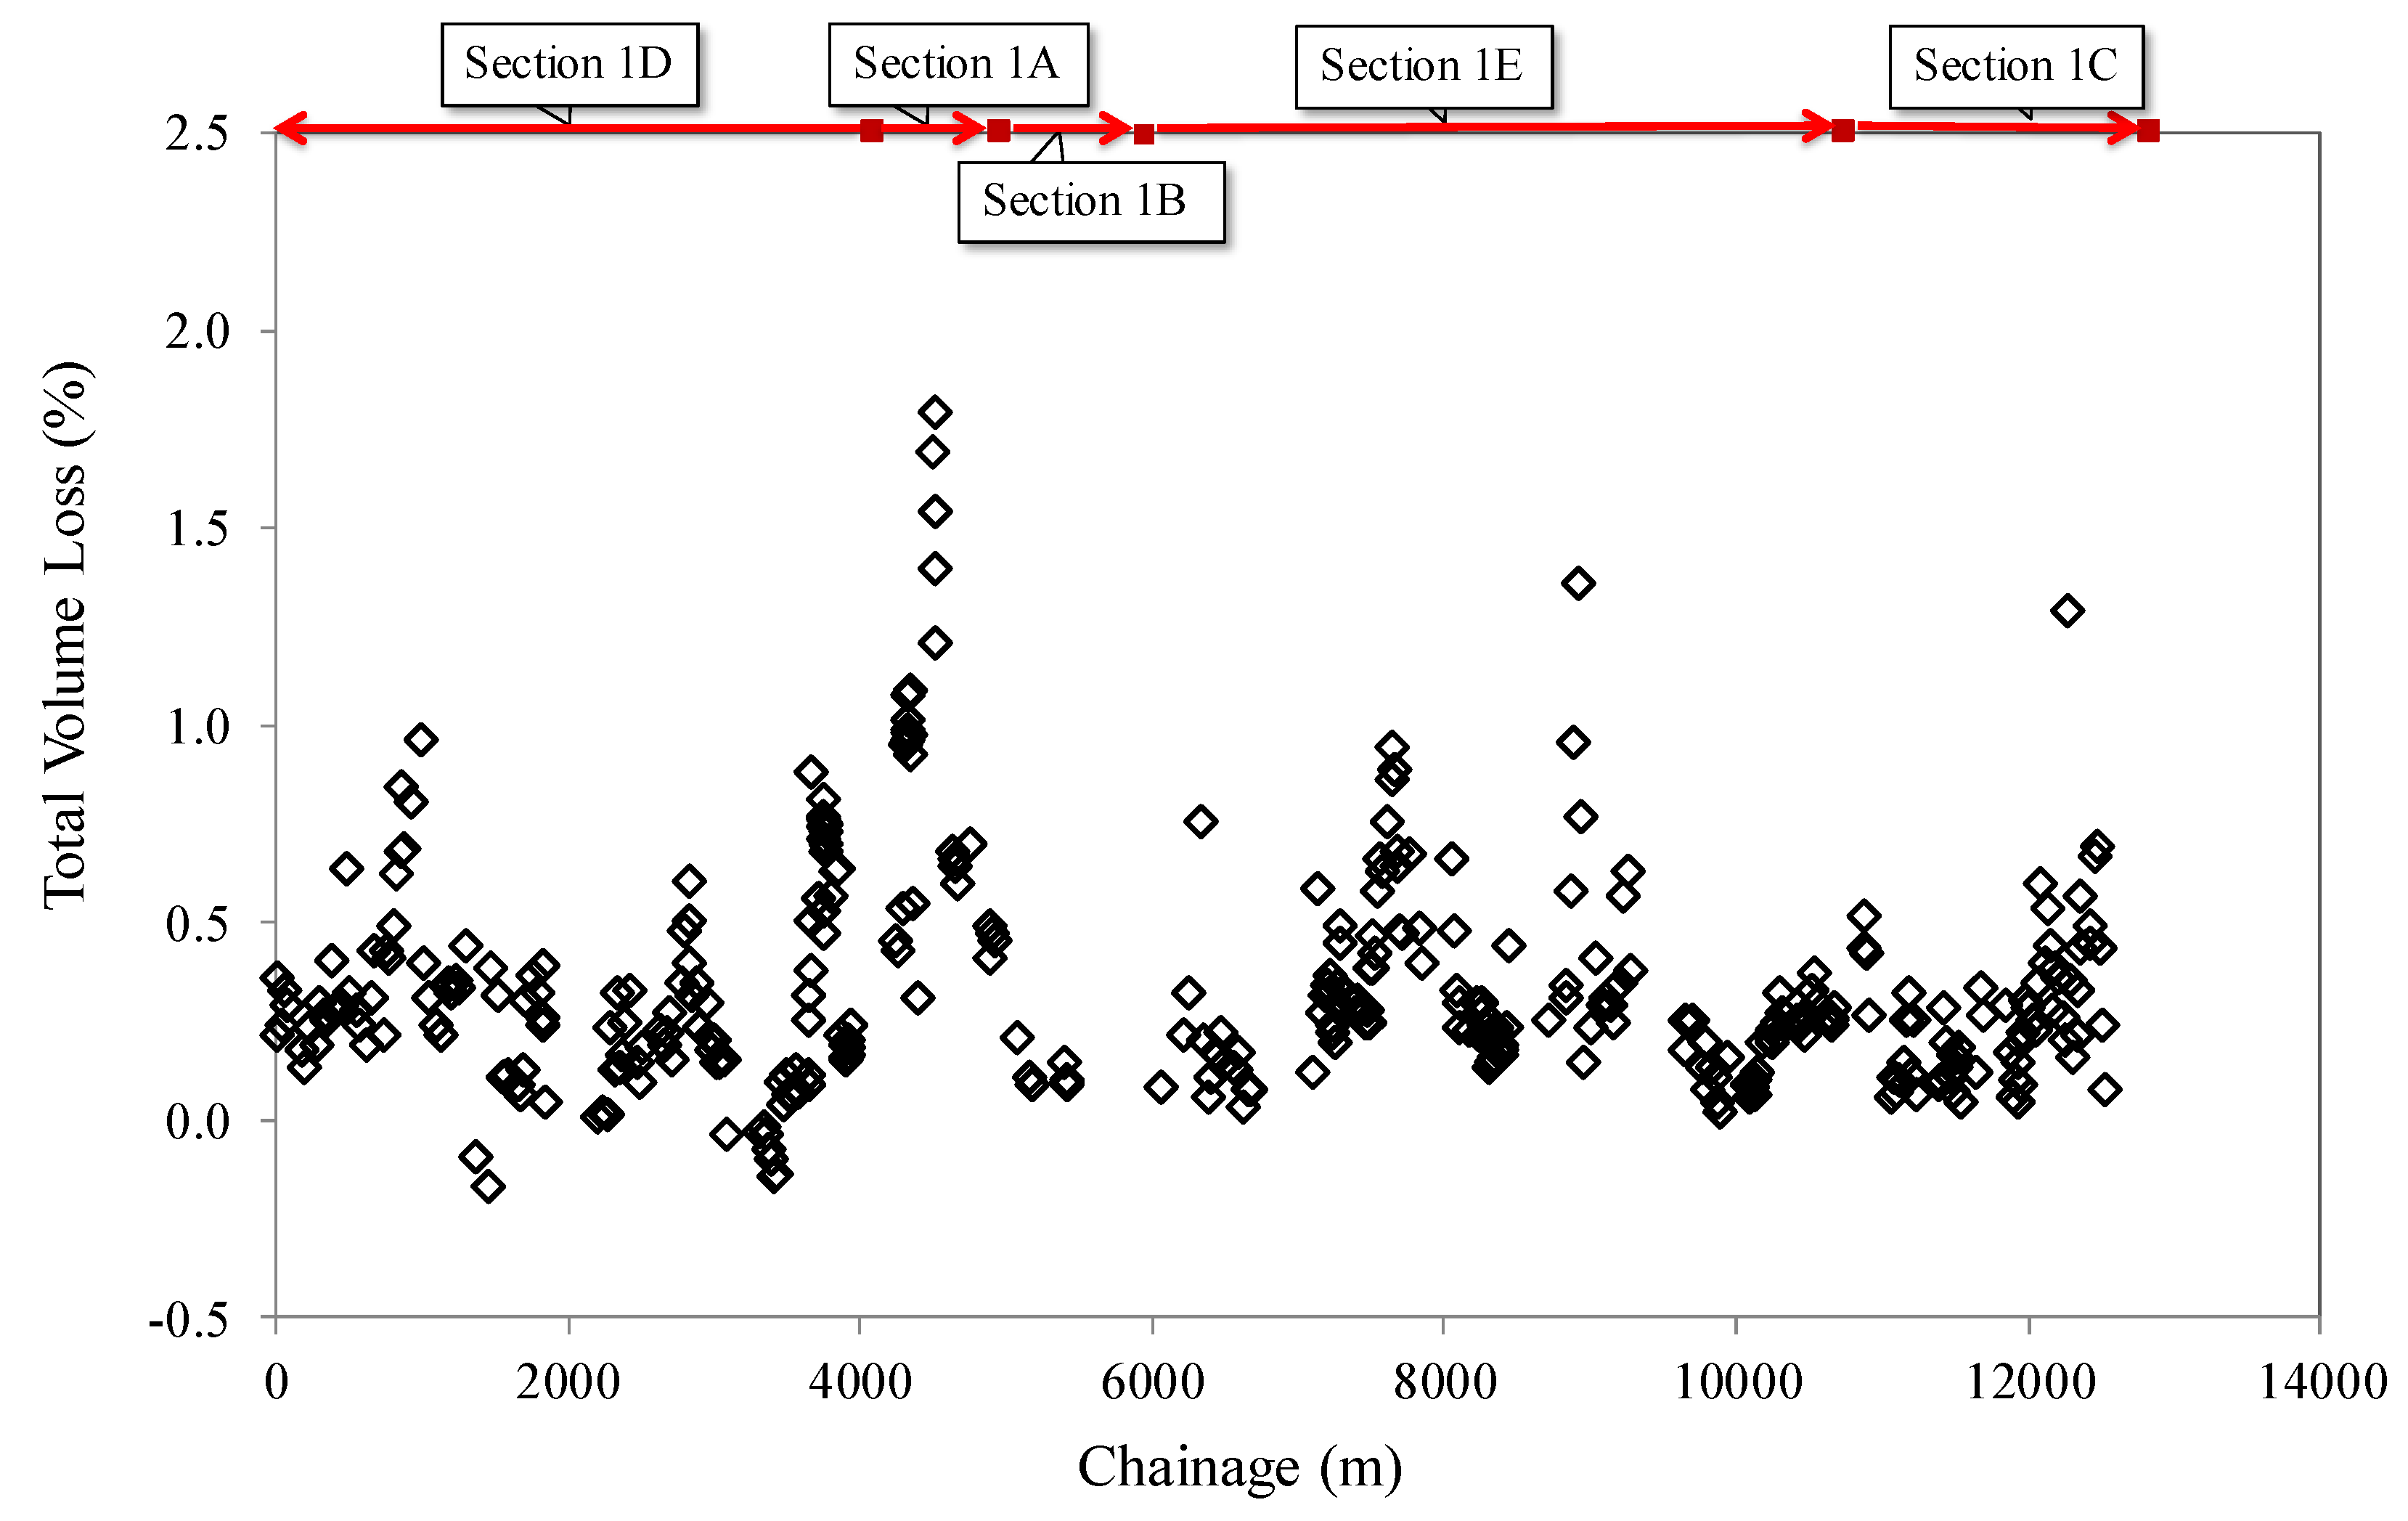
Figure 10. All these points with a higher value of settlement are called singular points of the layout and, except for one of them, all the rest are due to construction problems.
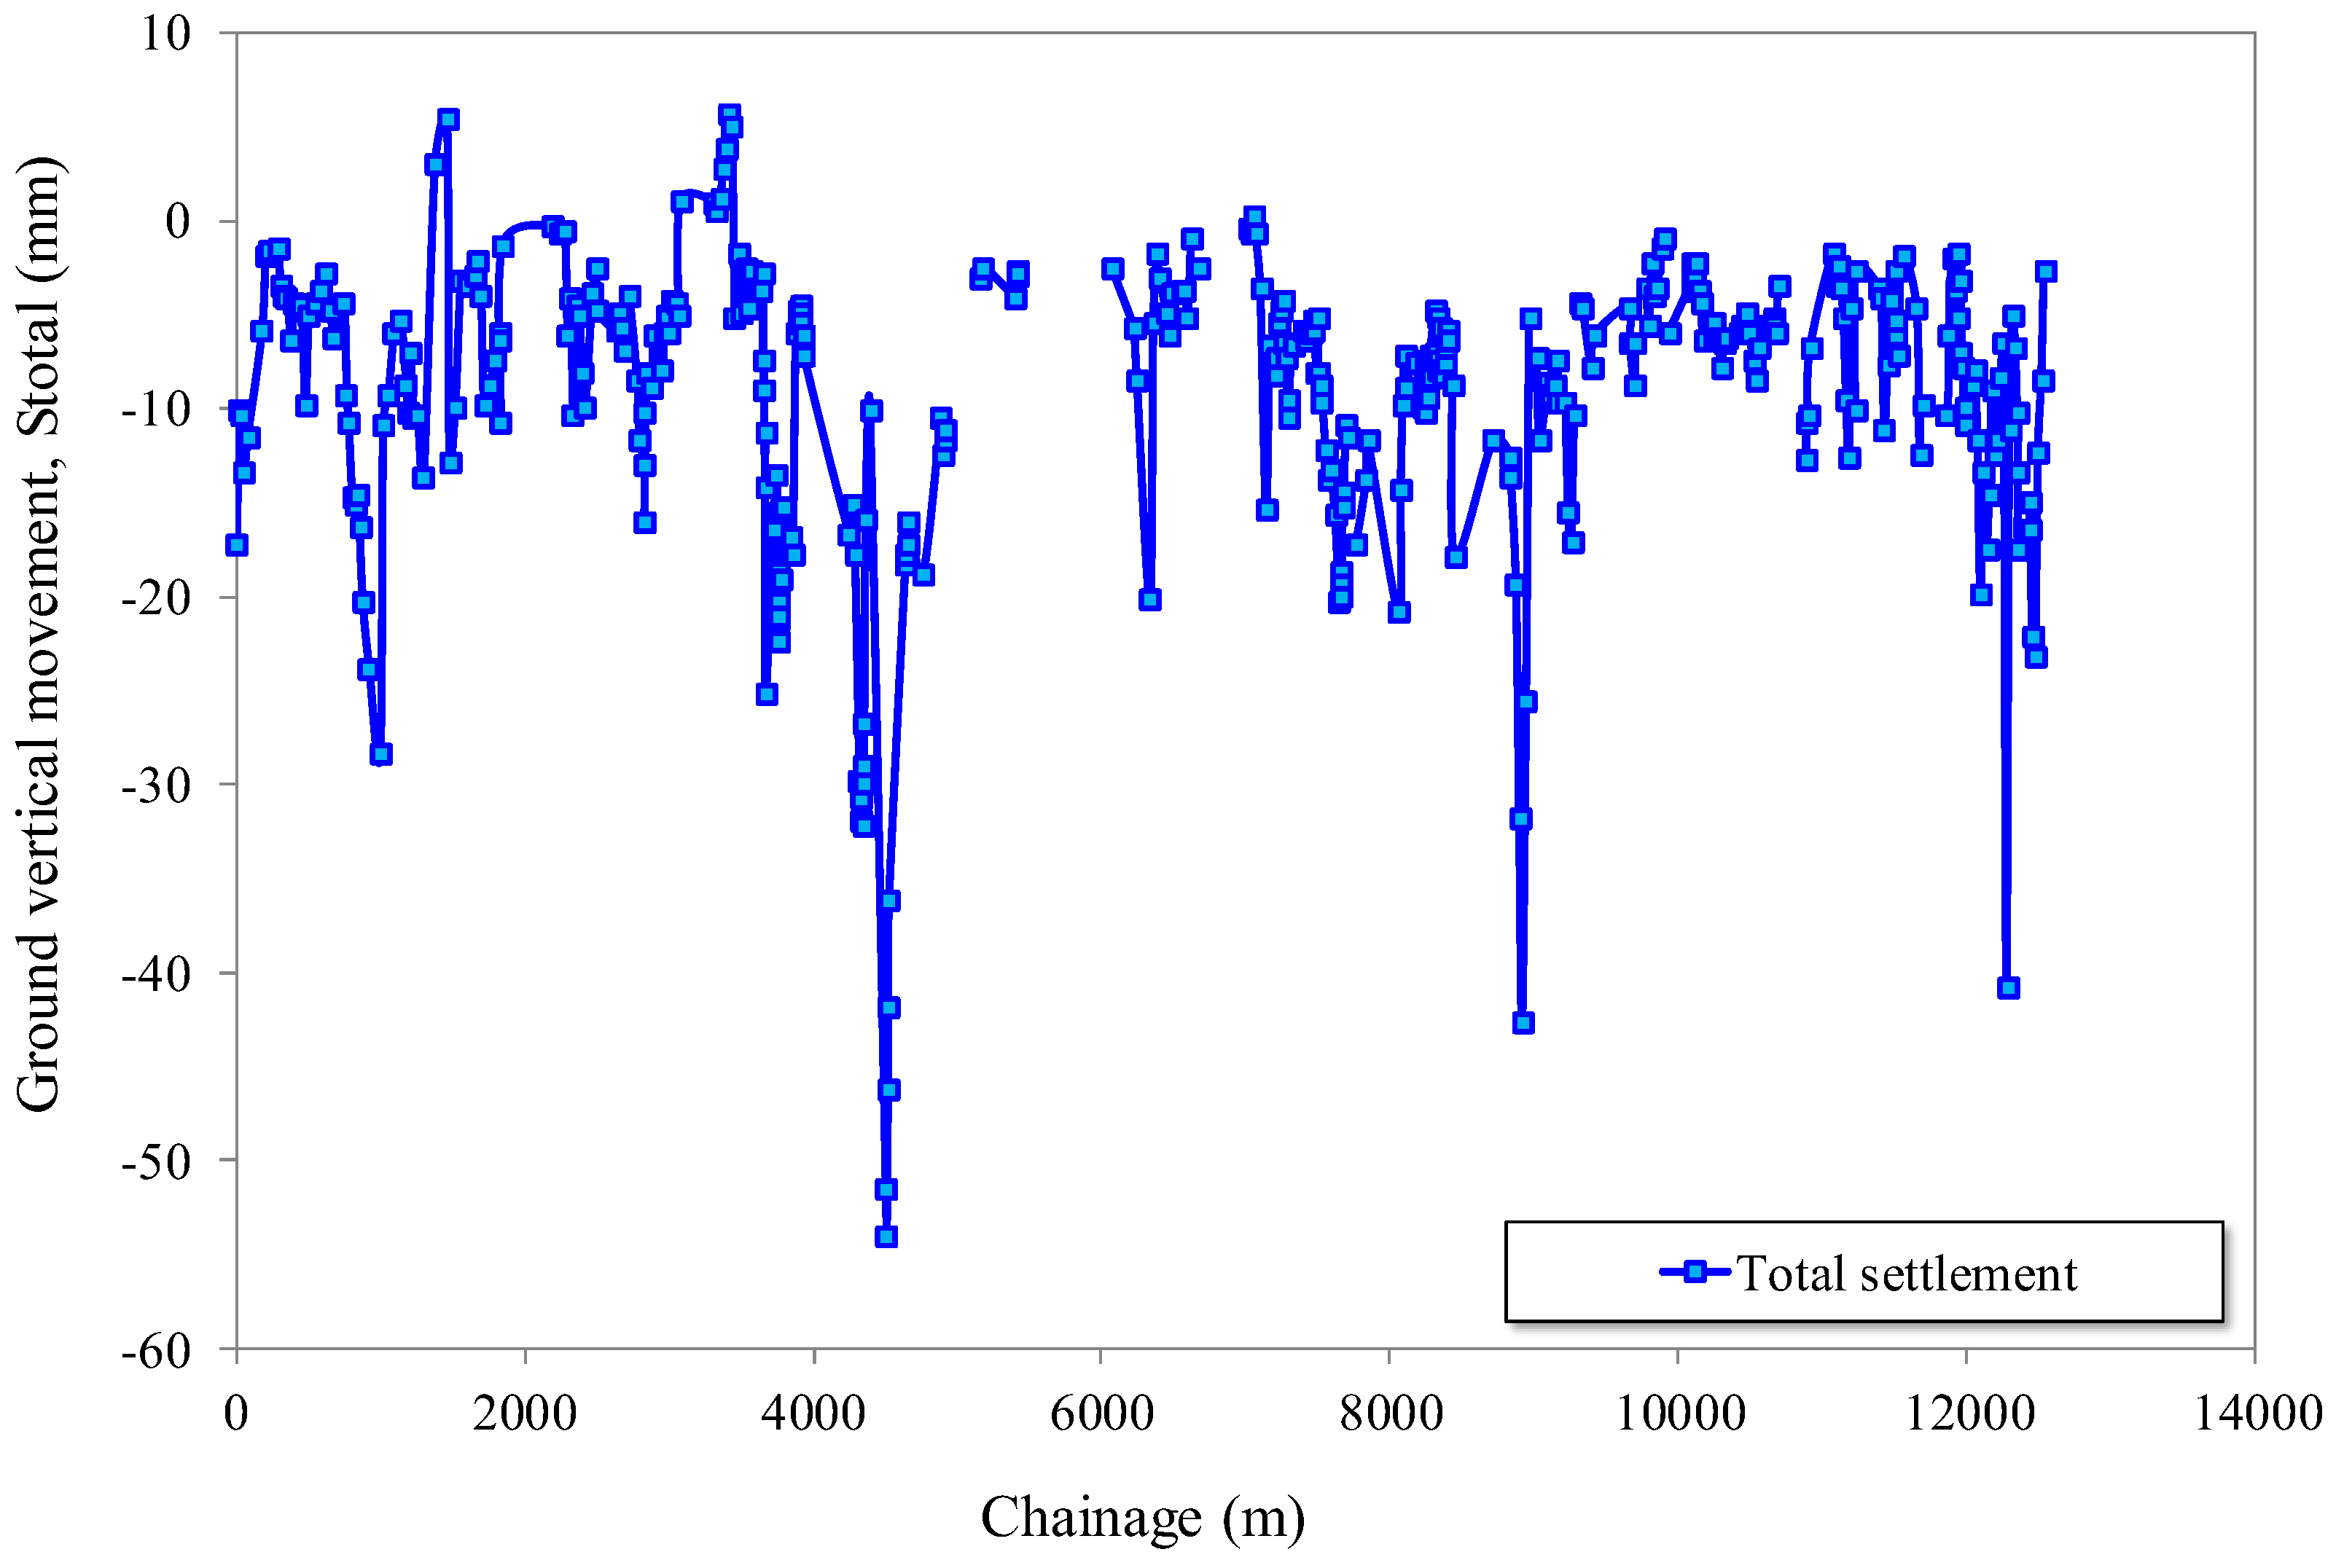
In the case of the total settlement (S
total) produced by the excavation process (
Figure 11), the same points with higher settlements in the excavation face also give way to higher total settlements sometime after the passage of the TBM. In addition to these already known points, some more are added, due to waterproofing problems in some of the maintenance shafts or grouting injection errors in the shield tail (S
tail).
According to Wongsaroj et al., (2006) the settlement produced at the shield tail (Stail) is equivalent to 40-50% of the total settlement (Stotal). In the case of settlements collected on Line 9, of the 86 sections studied, for which seating data are available in the shield area and/or at the shield tail, the highest proportion of settlements also occurs at the shield tail (Stail). This is due to the closing of the gap (space between the outer diameter of the tail of the TBM shield and the excavated ground) in this area, these settlements in the tail of the shield represent an average value of 37.23% with respect to the total settlement (Stotal), very close to the percentage of 40-50% of the total settlement (Stotal) mentioned in Wongsaroj in 2006. In addition, this settlement continues to increase until approximately 100-300 m past the excavation face (Sa short-term). In this case, the short-term settlement reaches 100% over the total settlement (Stotal) in many cases, with an average value of 83.5 %.
4.3. Measurement of Volume Loss Above the EPB Crown
O'Reilly and New (1982) established that the K parameter varies between 0.4 and 0.7 for stiff to soft clays, respectively, and between 0.2 and 0.3 for granular materials. Based on their findings, they proposed an average K value of 0.5 for cohesive soils and 0.25 for granular soils.
In Section 1 of Line 9 of the Barcelona Metro, the geological profile consists of clay and silt with sandy intercalations, as well as sandier materials with gravel intercalations. Given this stratigraphy, the entire profile was initially considered as a uniform unit along the tunnel alignment. A preliminary assumption was made that a K value of 0.5 would be representative of the ground conditions. This hypothesis was subsequently validated through an analysis of 43 settlement basins, confirming that K=0.5 provides a reliable estimation for calculating ground volume loss based on actual field data (Yubero, M.T., 2021).
Using K=0.5 and applying the equation proposed by O'Reilly and New (1982) (1), a theoretical value for the parameter "i" (the width of the surface Gaussian settlement trough) was determined. This theoretical "i" value, combined with the maximum settlement recorded by the monitoring data along the tunnel route, allowed for the calculation of ground volume loss according to Equation (2). The results, presented in
Figure 12, depict the evolution of volume loss along the tunnel alignment in Section 1, expressed as a percentage, and plotted against tunnel advance in meters. The settlement data used in this analysis correspond to the total recorded settlements (Stotal).
4.4. Correlation Between Ground Volume Loss and EPB Operation Variables
Many tunnel construction cases worldwide have demonstrated that excavation parameters in shield-type TBMs significantly influence ground movements induced by excavation, and precise control of these parameters helps minimize settlements (Lin et al., 2013; Dias & Kastner, 2013; Bel et al., 2022).
In the case of Section 1 of Line 9 of the Barcelona Metro, these operational parameters were recorded by the TBM at 10-second intervals and subsequently processed using the FORTRAN program. This section of the case study examines the possible influence of these parameters on ground volume loss.
Regarding face pressure (P1), several authors have studied its effect on volume loss (Dimmock, 2003; Shirlaw et al., 2003; Suwansawat, 2002; Phienwej et al., 2006; Talmon & Bezuijen, 2009; Sirivachiraporn & Phienwej, 2012). Additionally, studies by Kasper & Meschke (2006) and Franza et al. (2019) further analyze the effects of face pressure and TBM operation on soil displacements. Experimental approaches, such as those by Berthoz et al. (2018), have also investigated the TBM–soil interaction under controlled conditions. However, in our analysis of pressure data, no clear evidence was found that an increase in both face pressure and volume injection leads to a reduction in ground volume loss.
According to Antiga & Chiorboli (2009), an increase in pressure improves face stability but does not necessarily result in reduced settlements. This finding aligns with the data presented in
Figure 13, which shows total volume loss as a function of face pressure (P1), normalized with respect to tunnel overburden pressure. As observed, there is no clear trend indicating that higher face pressure values lead to a decrease in total ground loss, a conclusion also supported by Fargnoli et al. (2003). Similar findings have been noted in other tunnel projects, where settlement patterns do not always correlate directly with applied pressures (Melis & Medina, 2005; Melis et al., 2002; Marshall et al., 2012).
In our case study, this lack of correlation may be attributed to the low variability of recorded log data. Fargnoli suggested that it could also be due to the limited amount of monitoring data analyzed. Nevertheless, it has been observed that when face pressure is within the range of 1.8–3.2 bar—or, in other terms, when the face pressure relative to overburden pressure is between 0.53% and 0.90%—total ground volume loss remains below 0.8%. In some instances, this threshold was exceeded, as shown in
Figure 13. However, these anomalies were caused by specific issues, referred to as Singular Points, which were previously mentioned in
Section 4.2 and will be further explained below.
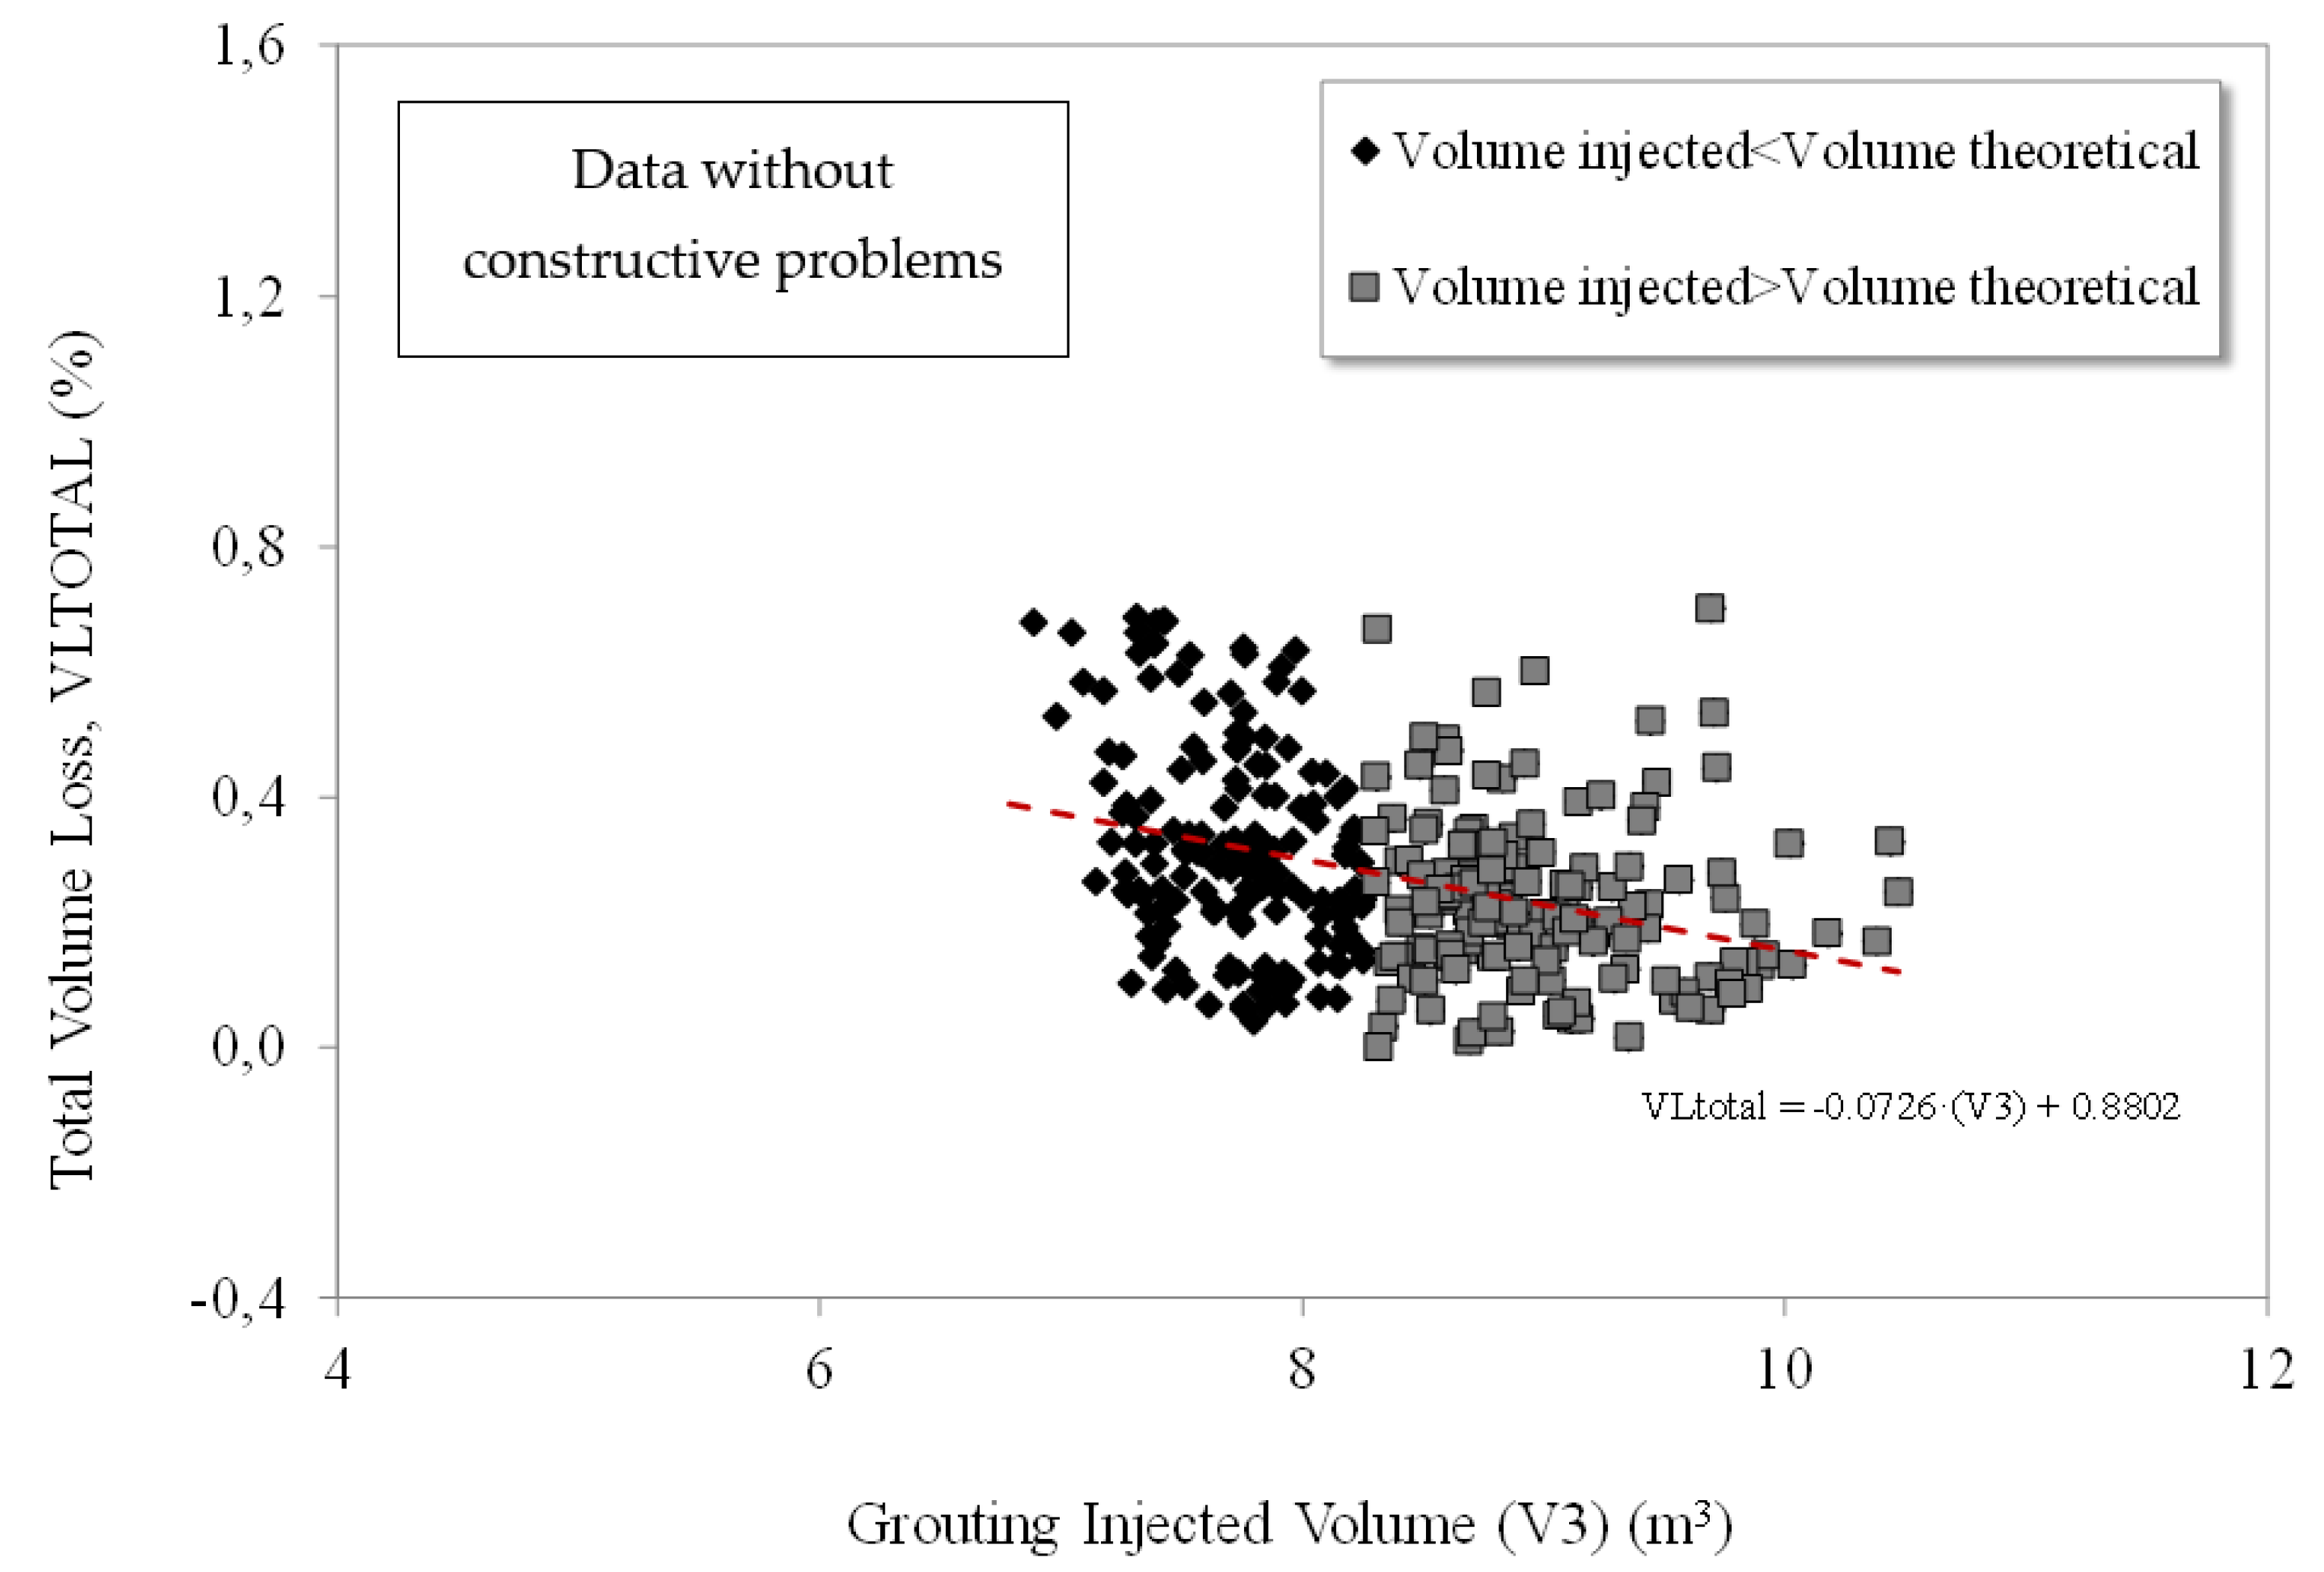
Influence of Injection Volumes
Many authors have analyzed the influence of injection volumes on volume loss, with relevant work found in Talmon & Bezuijen (2009), Sirivachiraporn & Phienwej (2012), and Fargnoli et al. (2013). These studies demonstrate that tail-grout pressure plays a direct role in settlements, a phenomenon also examined through numerical and experimental approaches (Berthoz et al., 2018; Xu et al., 2011; Wongsaroj, 2005).
In our case, we estimated the theoretical injected volume (m³) per installed ring as a function of the outer and inner diameters per segment length. In some instances, the actual injected volume was lower than the theoretical value, leading to slightly higher settlements that affected both short-term and total ground volume loss (
Figure 14). Similar observations have been reported in studies of TBM tunneling in urban environments (Melis et al., 2002; Kasper & Meschke, 2004).
Figure 14 illustrates that when the injected volume exceeds the theoretical value, there are very few cases in which total ground volume loss exceeds 0.5%. Moreover, the regression line in
Figure 14 indicates that, in most cases, the injected volume is lower than the theoretical value. This aligns with previous research showing that inadequate grouting pressures can lead to increased settlements (Kasper & Meschke, 2006; Marshall et al., 2012). The role of soil properties in this behavior has also been explored by Franza et al. (2019) and Xu et al. (2011), who highlighted the effect of soil density and permeability on volume loss control.
Furthermore, experimental studies have provided valuable insights into TBM-induced settlements in greenfield conditions, as seen in the physical modeling work by Bel et al. (2022). These findings, along with numerical models (Kasper & Meschke, 2004; Dias & Kastner, 2013), reinforce the importance of considering multiple factors—beyond just face pressure and injection volume—when assessing tunnel-induced settlements.
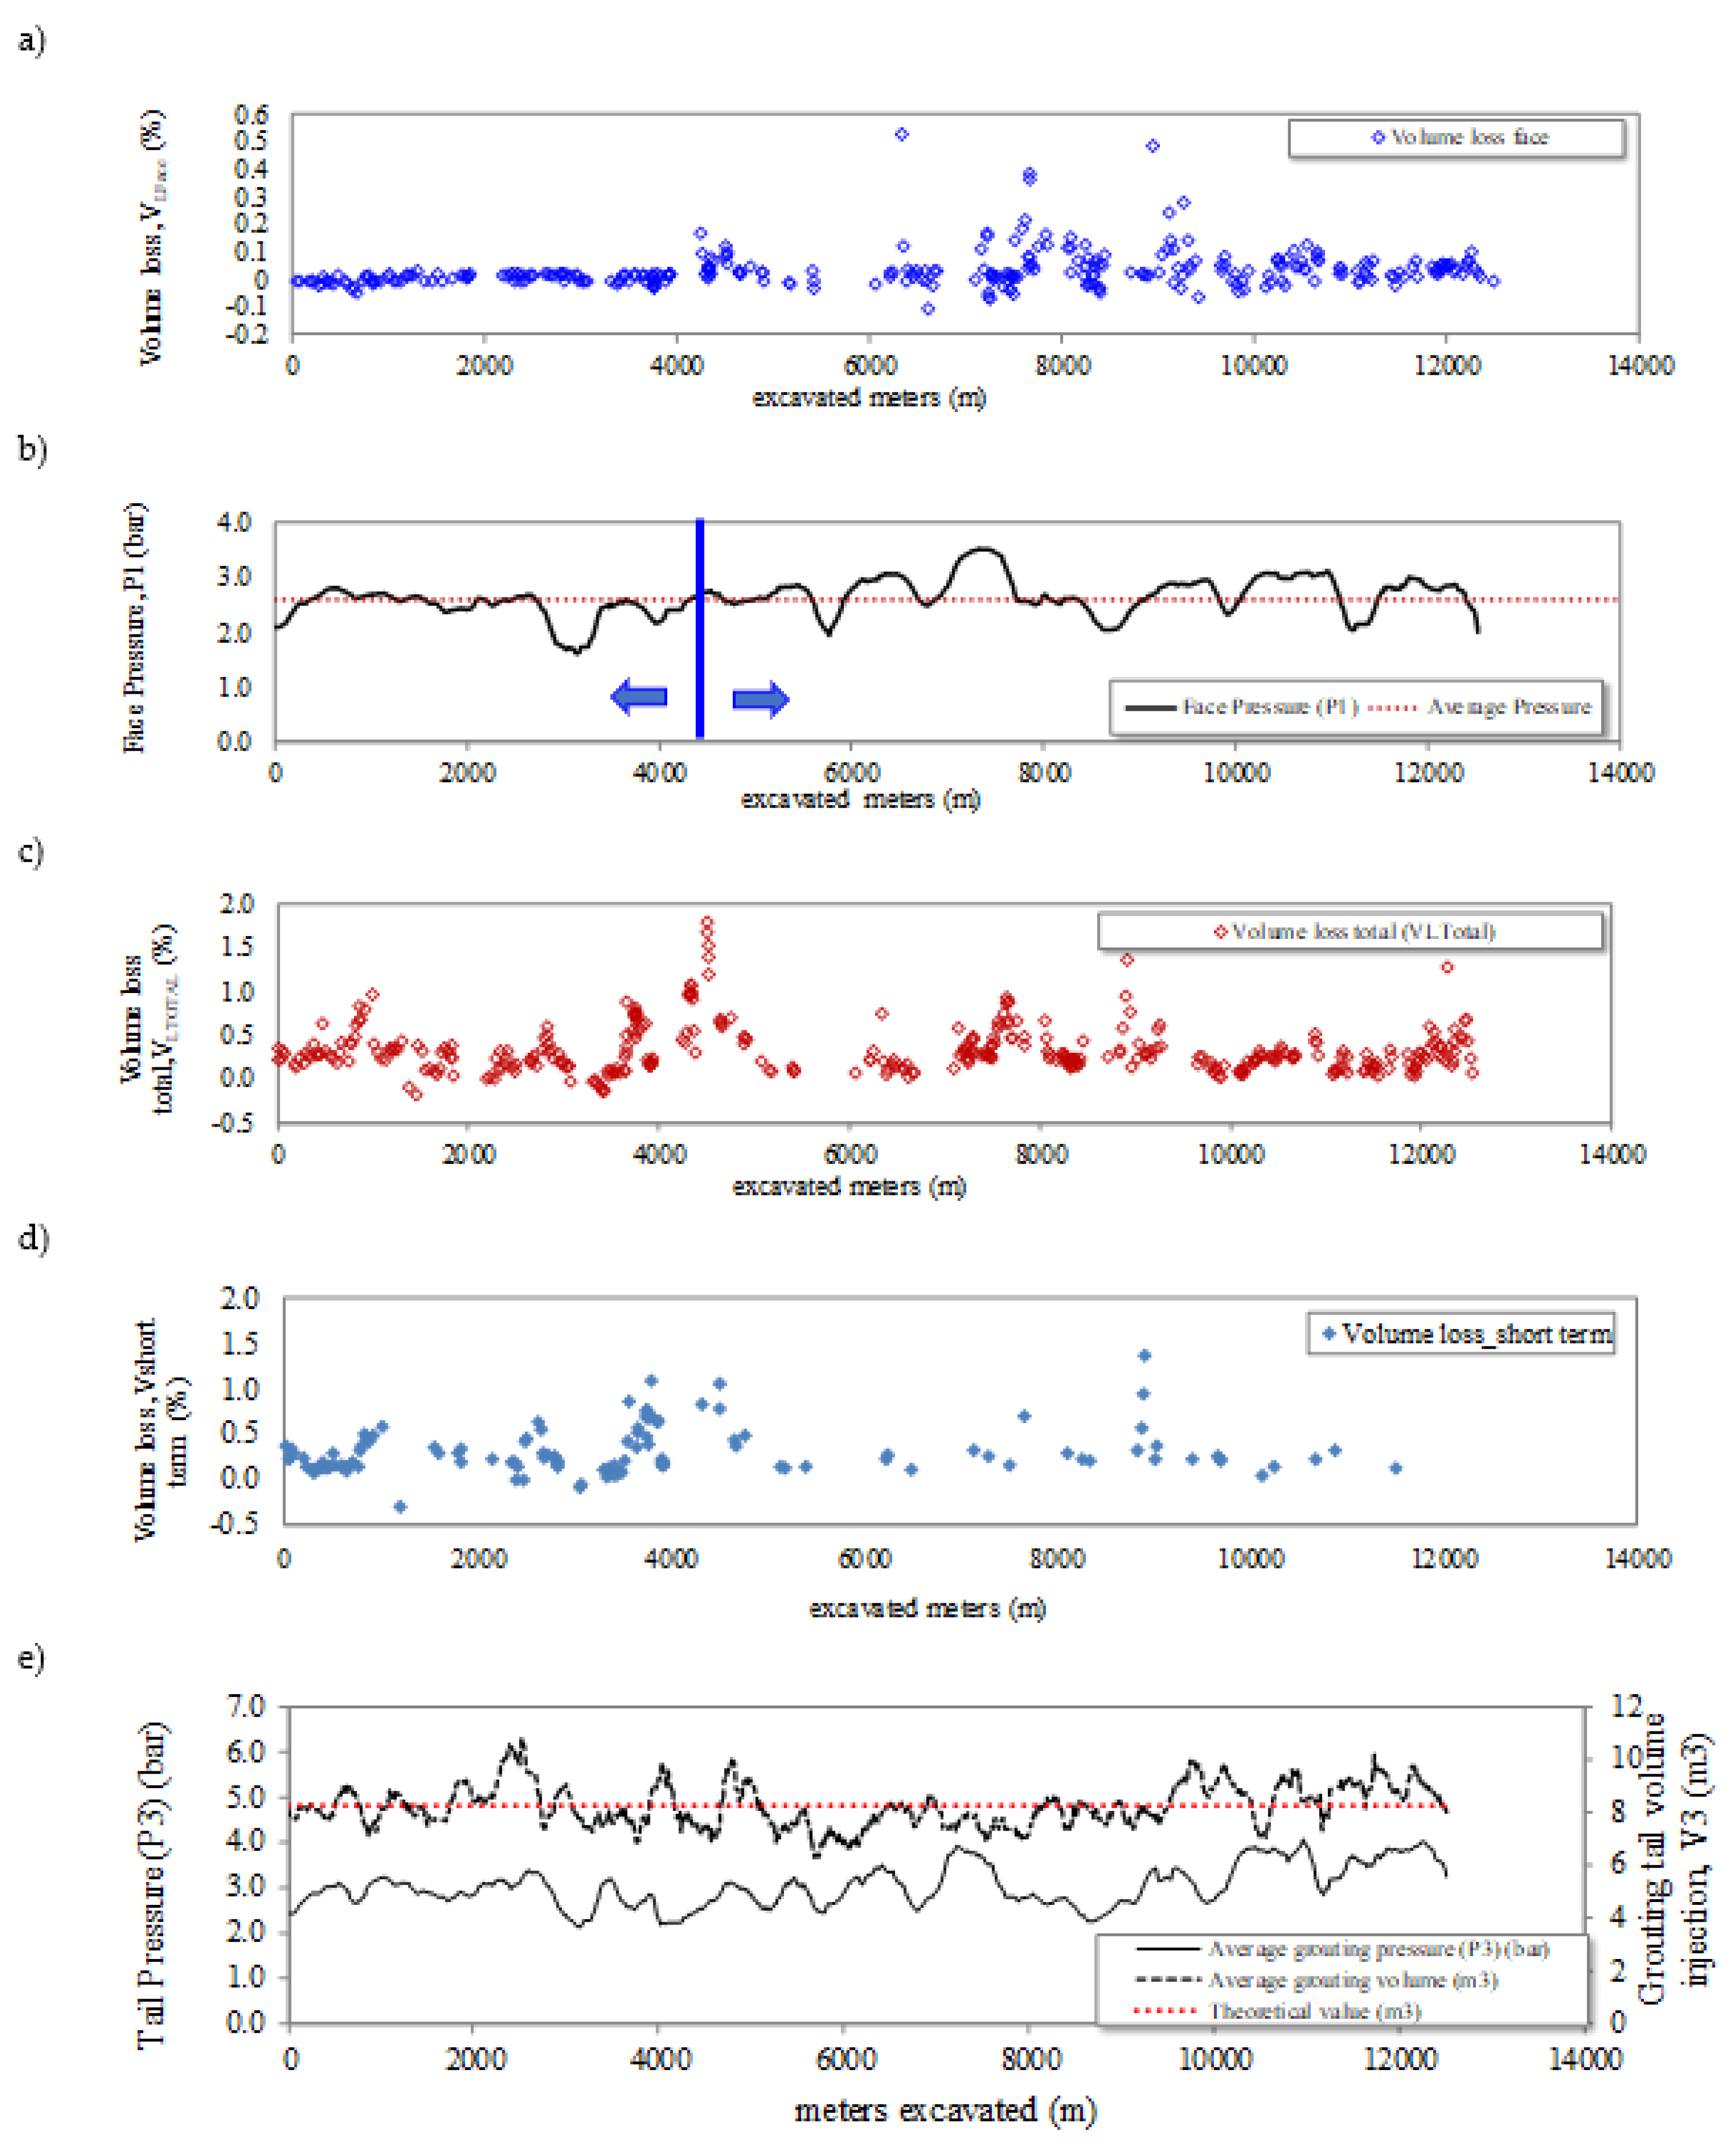
In addition,
Figure 15 presents the variations of certain EPB performance variables during the advance through Section 1. The pressure and injection values shown are the moving average values for each 100 values recorded by the EPB. The volume losses derived from the surface settlement measurements range between 0.0% and 1.8% (
Figure 15a). The face pressures (P1) range between 1.00-3.50 bar (
Figure 15b), and the pressure at the shield tail range between 2.5 and 3.5 bar with volume of injection of 6.5 and 10.0 m
3 and a theoretical value of 7.85 m
3 (
Figure 15c). As we can see, and as we have already commented, there is no clear relationship between the loss of ground volume and the face pressure or the tail injection pressure.
Variations in the average weight of excavated material, measured on the conveyor belt, are presented in
Figure 14d with values given in tones per lining ring advancement (1.5 m). Although the excavated soil was mixed with soil conditioning foams, which would have changed its bulk density (
Figure 14d), the resulting weights give a useful indication of the amount of excavated soil. The weight of excavated materials was more or less constant, although with some irregularity, ranging from (160-240 t/ring). with a theoretical weight value (around 210 t/ring) of soil excavated by a 9.43 m cutter wheel head, assuming an average unit weight of 20 kN/m
3 for the deltaic materials of El Prat de Llobregat (dashed line,
Figure 14d). Apart from the added conditioning, the weight is in some cases higher than the theoretical value of "over-excavation" by the cutterhead as a consequence of the difference in dimensions of the shield at the front and back of the machine respectively. Furthermore, the points where over-excavation occurs correlate with points where the loss of ground volume was greater (
Figure 13 and
Figure 14a,d) though this was not the only reason, as we will see below. The volumes of tail-grout injected during the breakthrough are also shown in
Figure 14c. This grout was injected to minimize the ground movement in the gap created between the outside diameter of the tunnel lining ring and the outside diameter of the lining ring. The theoretical volume of the gap is 7.85 m
3/ring. Consequently, it can also be seen in the Figure that the volume of tail-grout applied was in many cases lower than this theoretical value, matching with higher ground volume loss values.
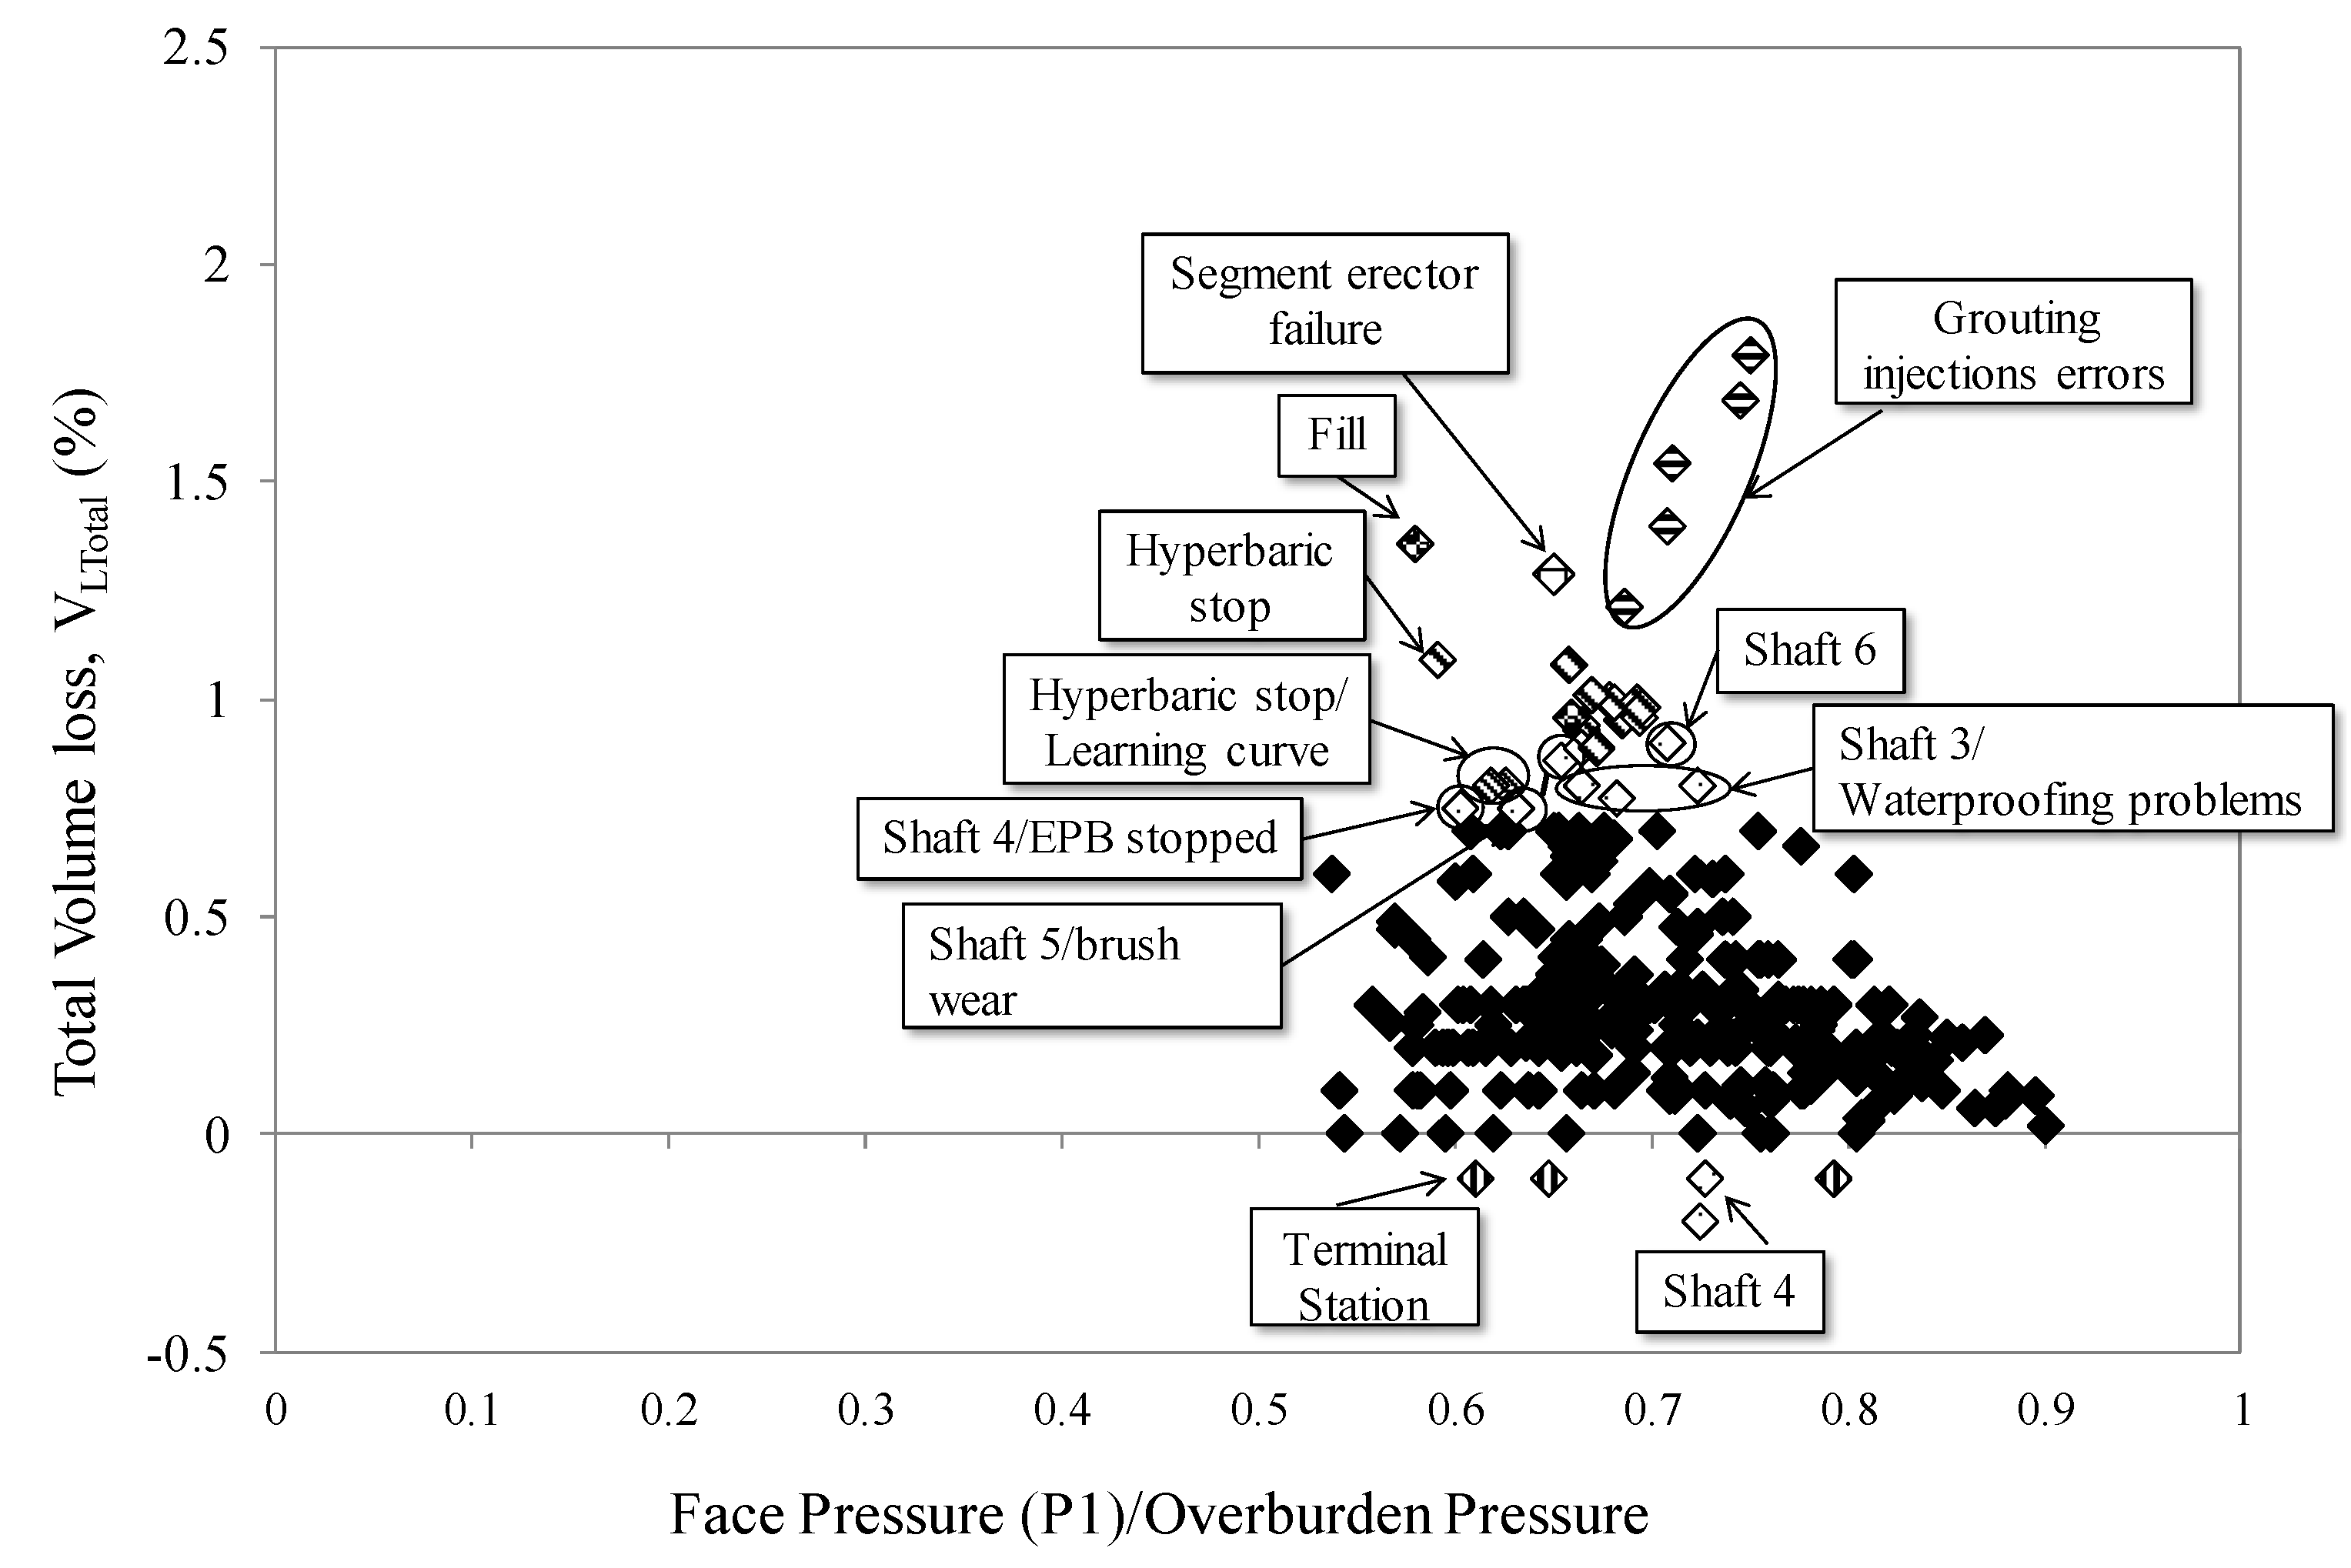
5. Study of the Singulars Points
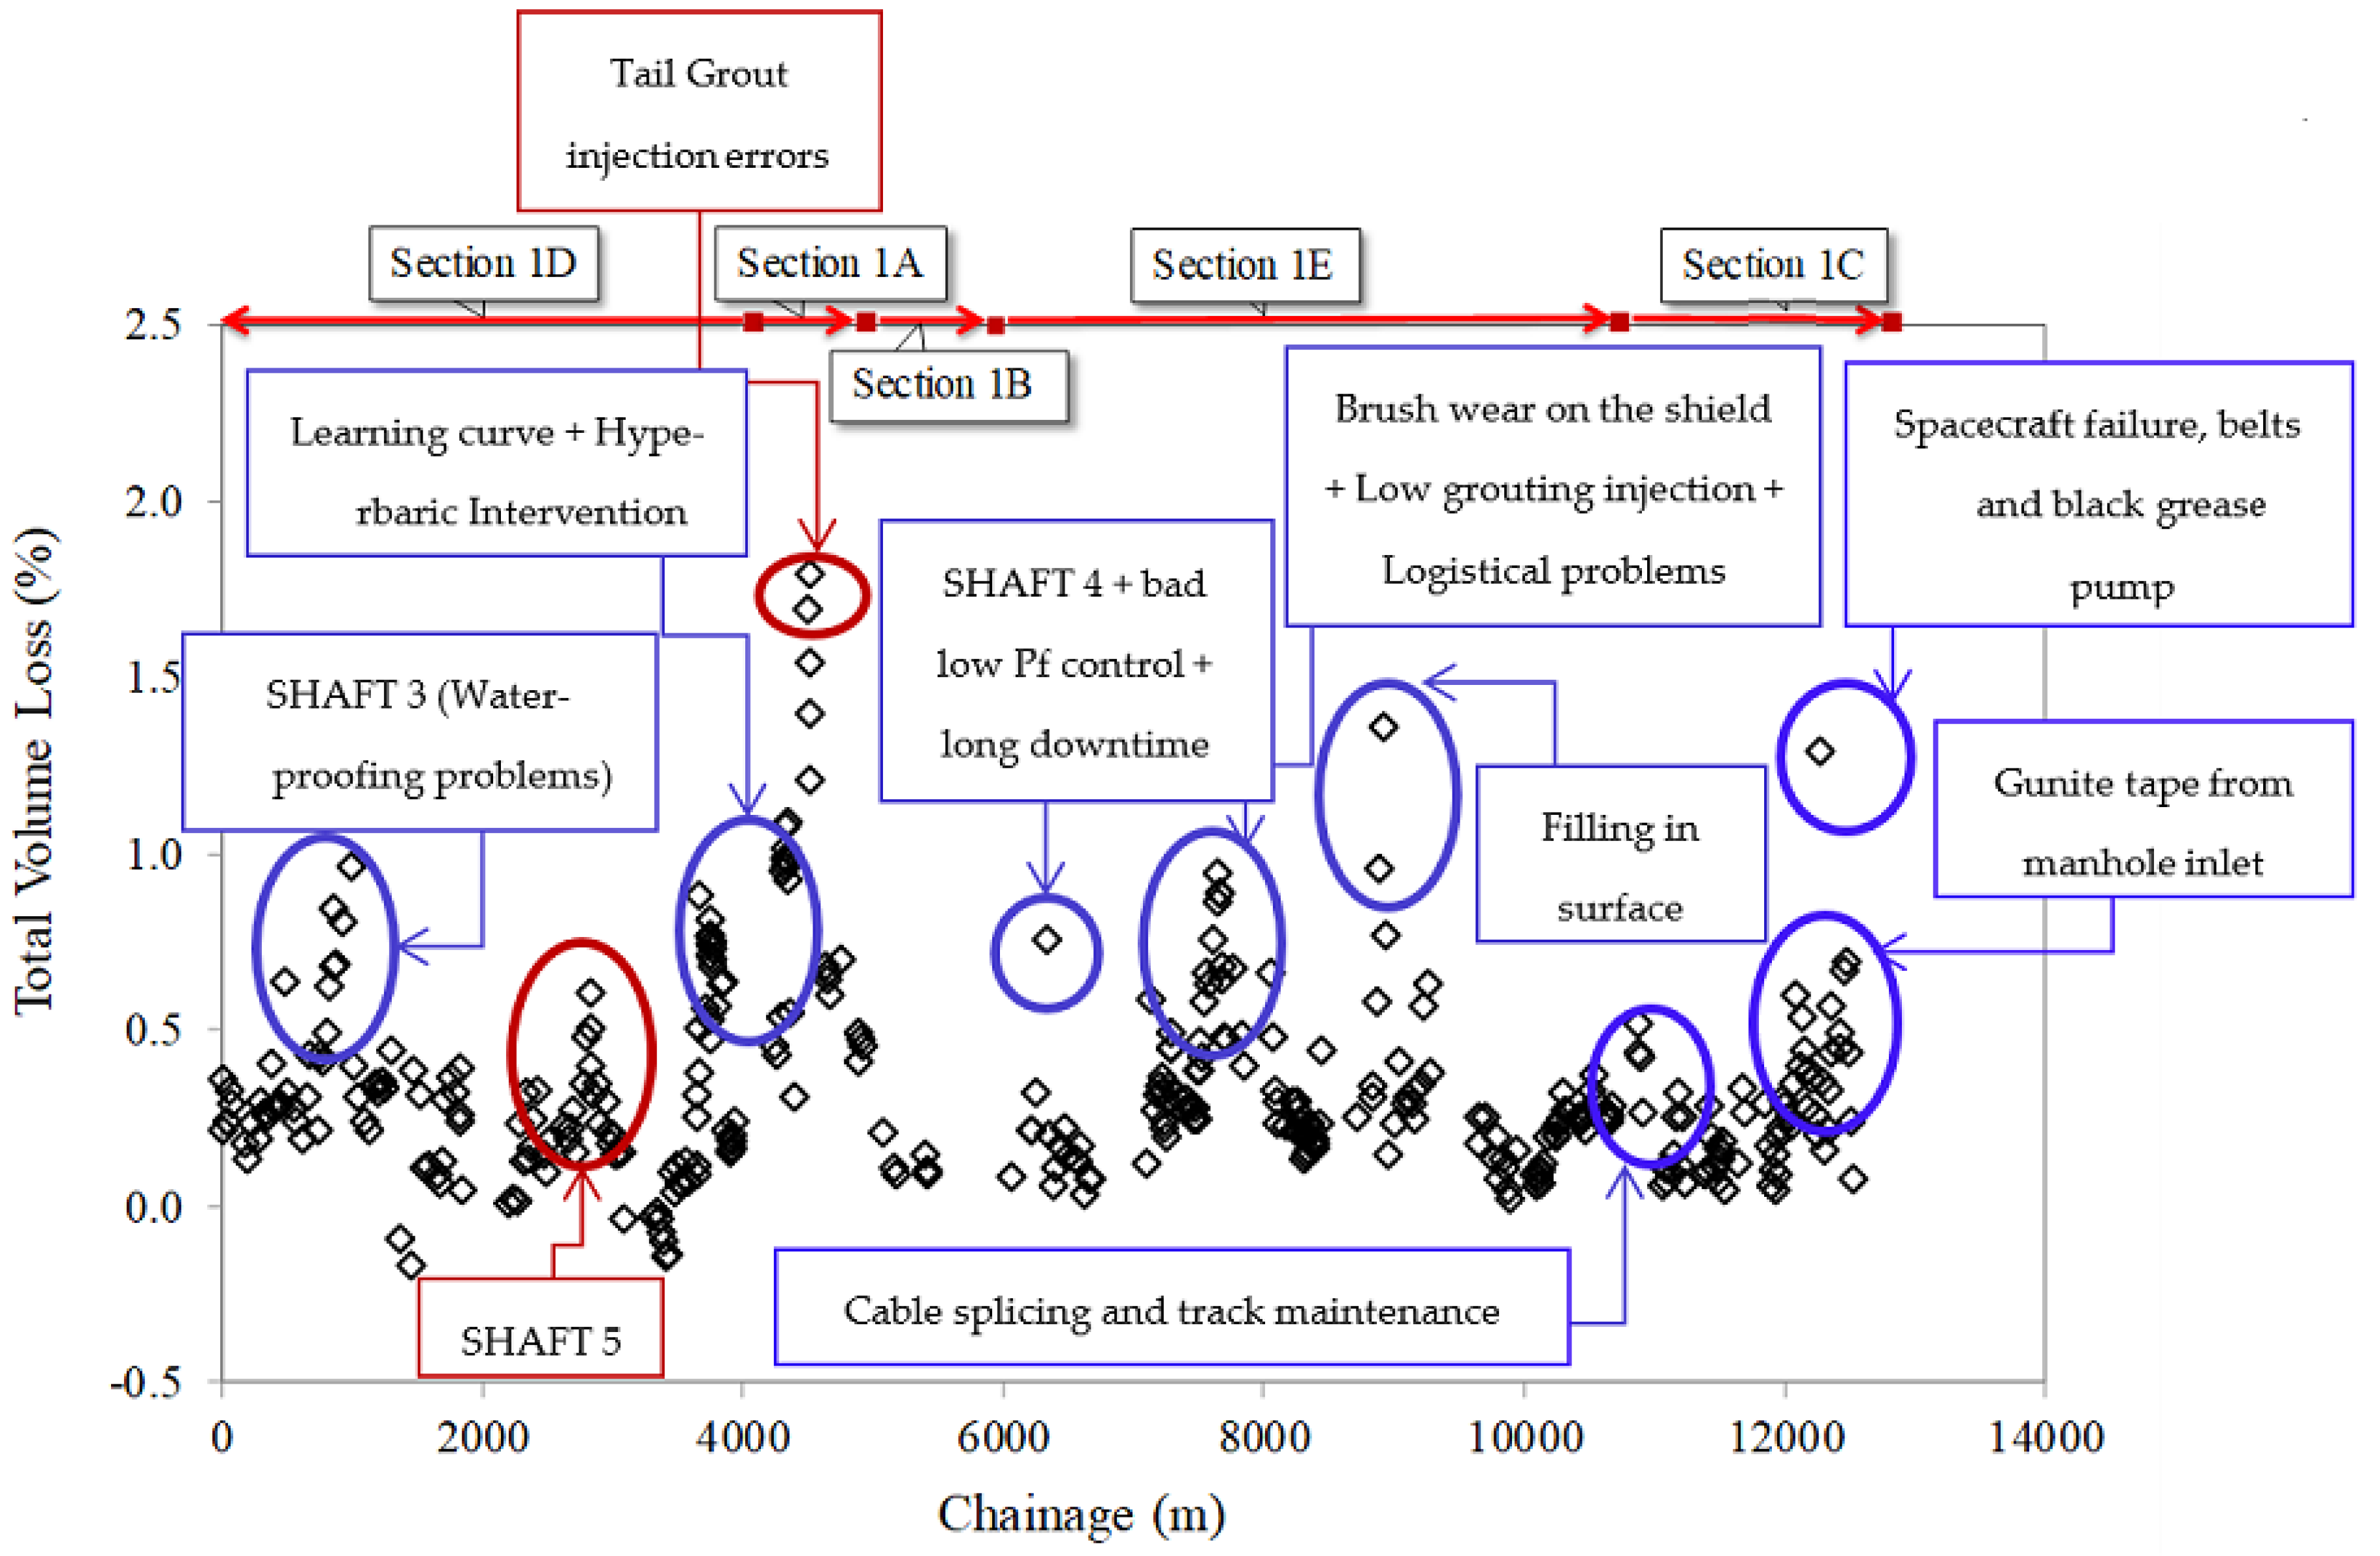
We have seen that, if the operating parameters of the EPB machine such as the face pressure and the tail grout volume and pressure are well controlled, the construction of tunnels with this type of machine provides very low ground losses. Consequently, in the construction of Section 1 of Line 9 of the Barcelona Metro, we have noticed that most of the ground loss values are below 0.8%. To show that, there are fifteen points on Section 1 of Line 9 with a higher ground volume loss value. These fifteen points, which we have called singular points, are due to construction problems in most of the cases (
Figure 16) and include: machine learning curve, entry and exit of maintenance shafts, hyperbaric stops, grout injection errors, little coverage, poorly compacted backfill material, brush and cutting tools wear and logistical problems.
In the case of the learning curve of the EPB, the running-in of the machine-equipment set causes anomalies during the first kilometres in which experience is acquired. In the first EPB (Guster) this process takes a little over three months to reach average speed and covers a distance of approximately one Kilometre. In the case of the second EPB (Hades), this process is much faster and it is carried out in just over a month and the distance covered is less than half a kilometre. Therefore, causing in both TBMs a volume loss of over 1%.
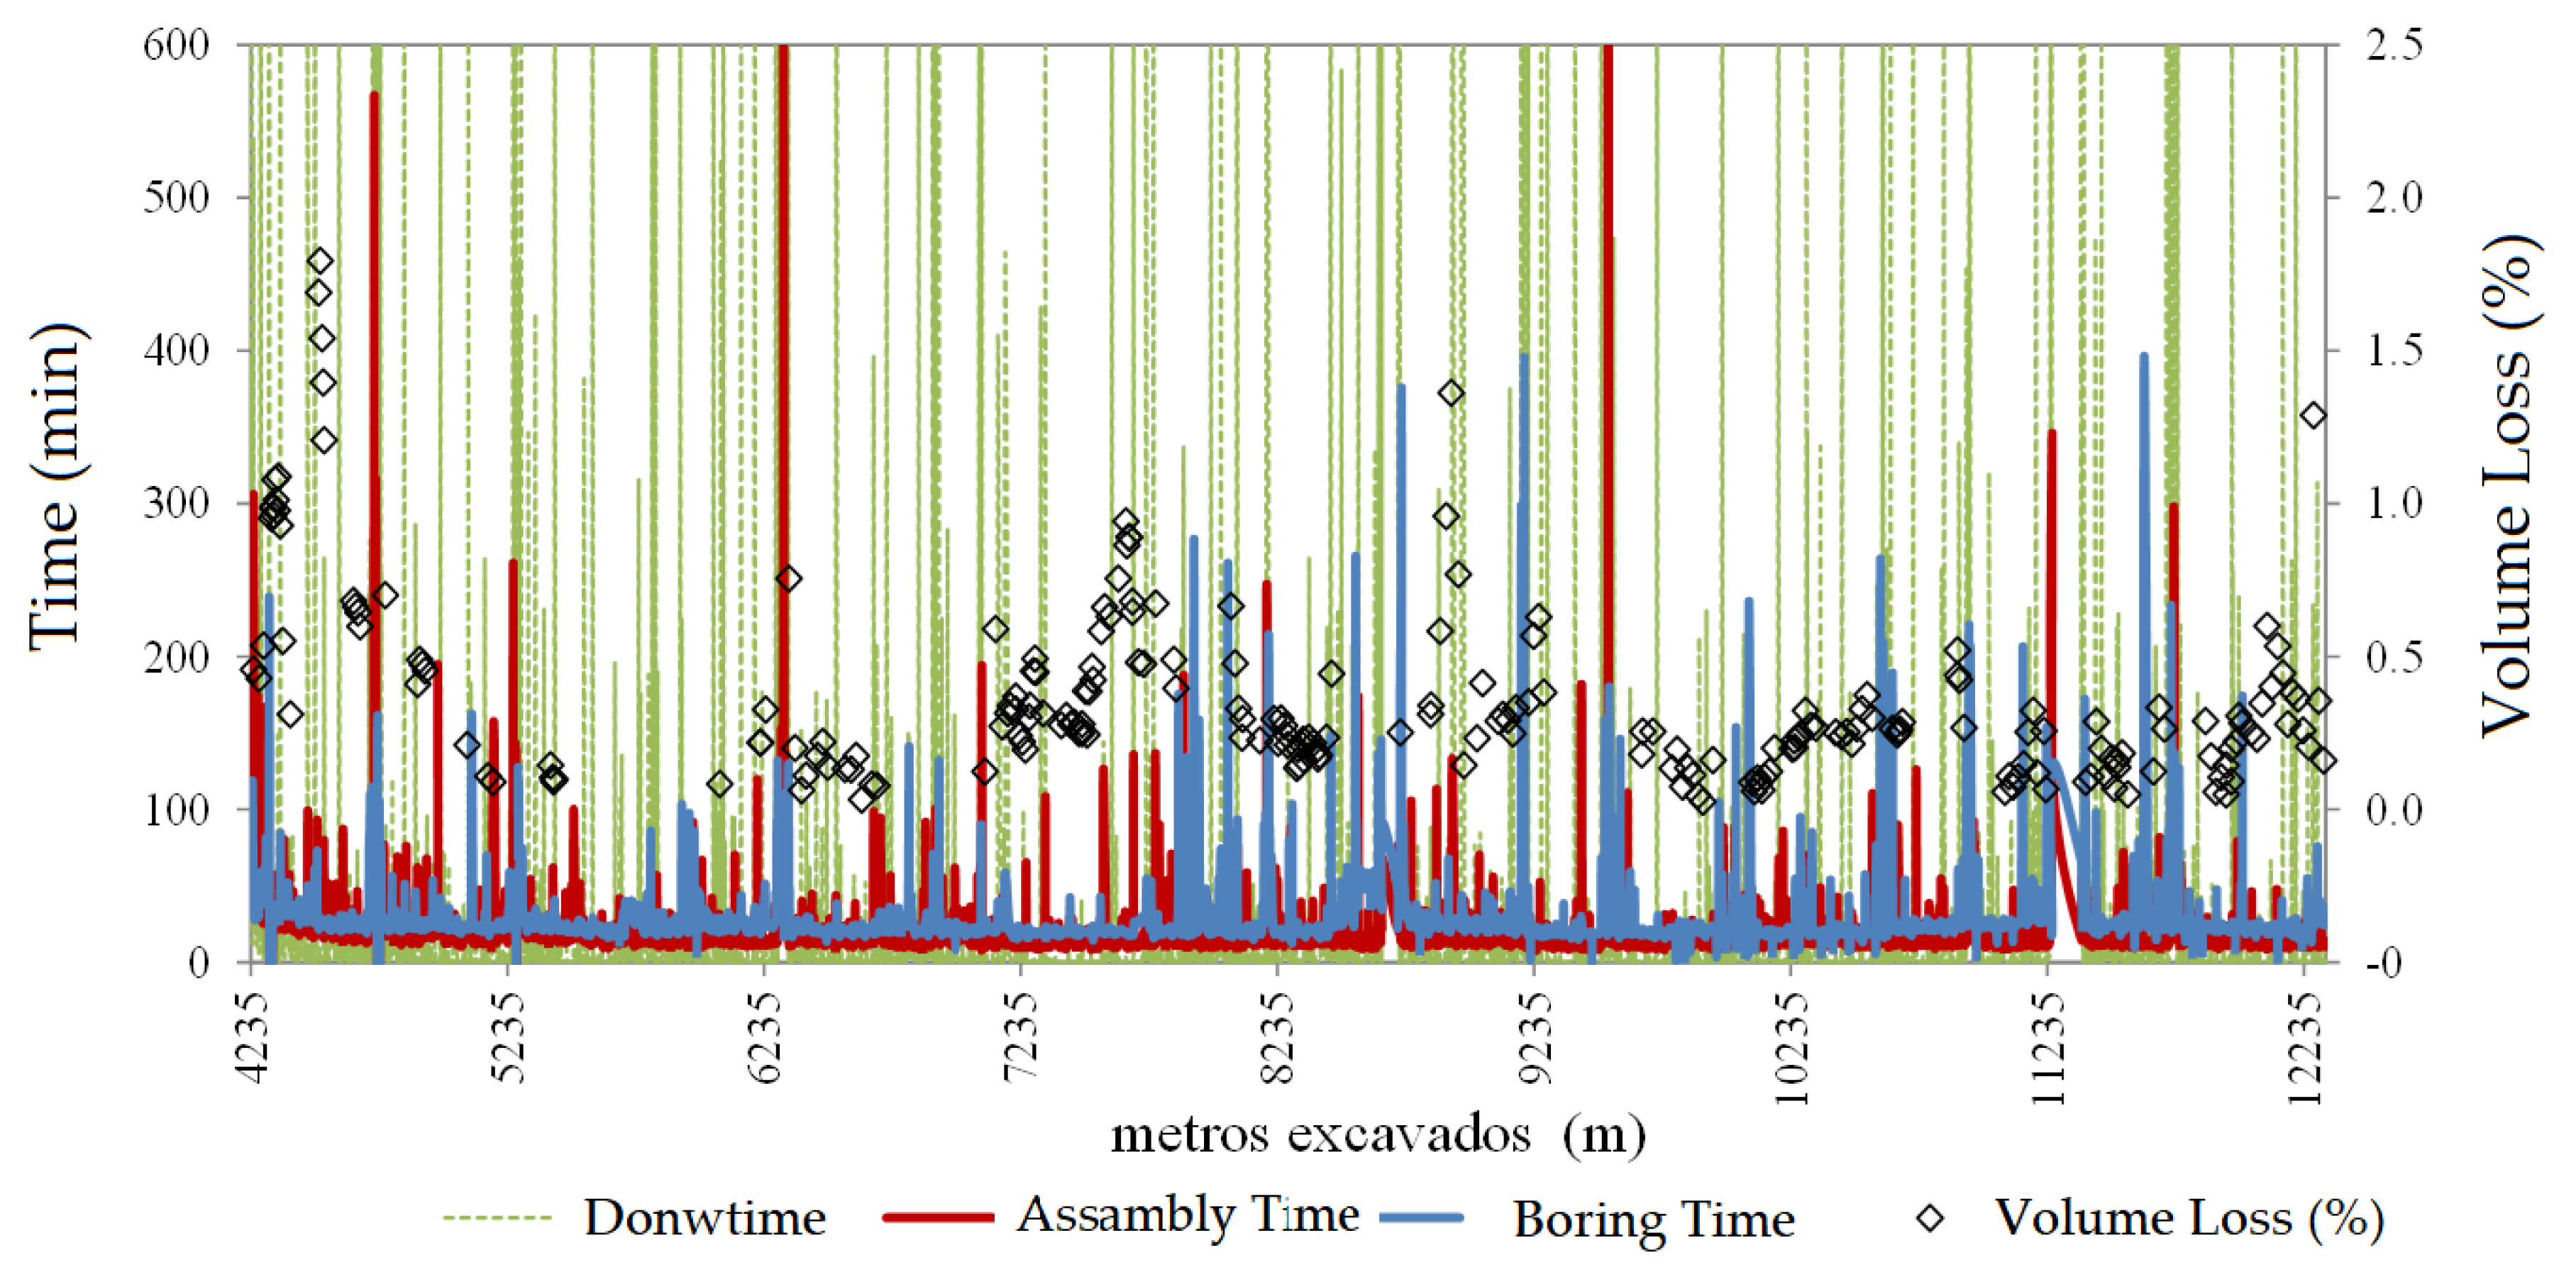
Although one of the main disadvantages distinguished has been when the TBM is stationary, it is understood that in the advancement of the TBM, the time when the machine is stopped and also the time when the machine remains stopped while the segments are being assembled until the advance ring is formed, are excluded. Hence,
Figure 17 shows the relationship of the time of each EPB machine activity: stopping time, segment assembly time and drilling time as a function of the ground volume loss. It can be seen that the highest ground losses match the times when the EPB machine is stopped.
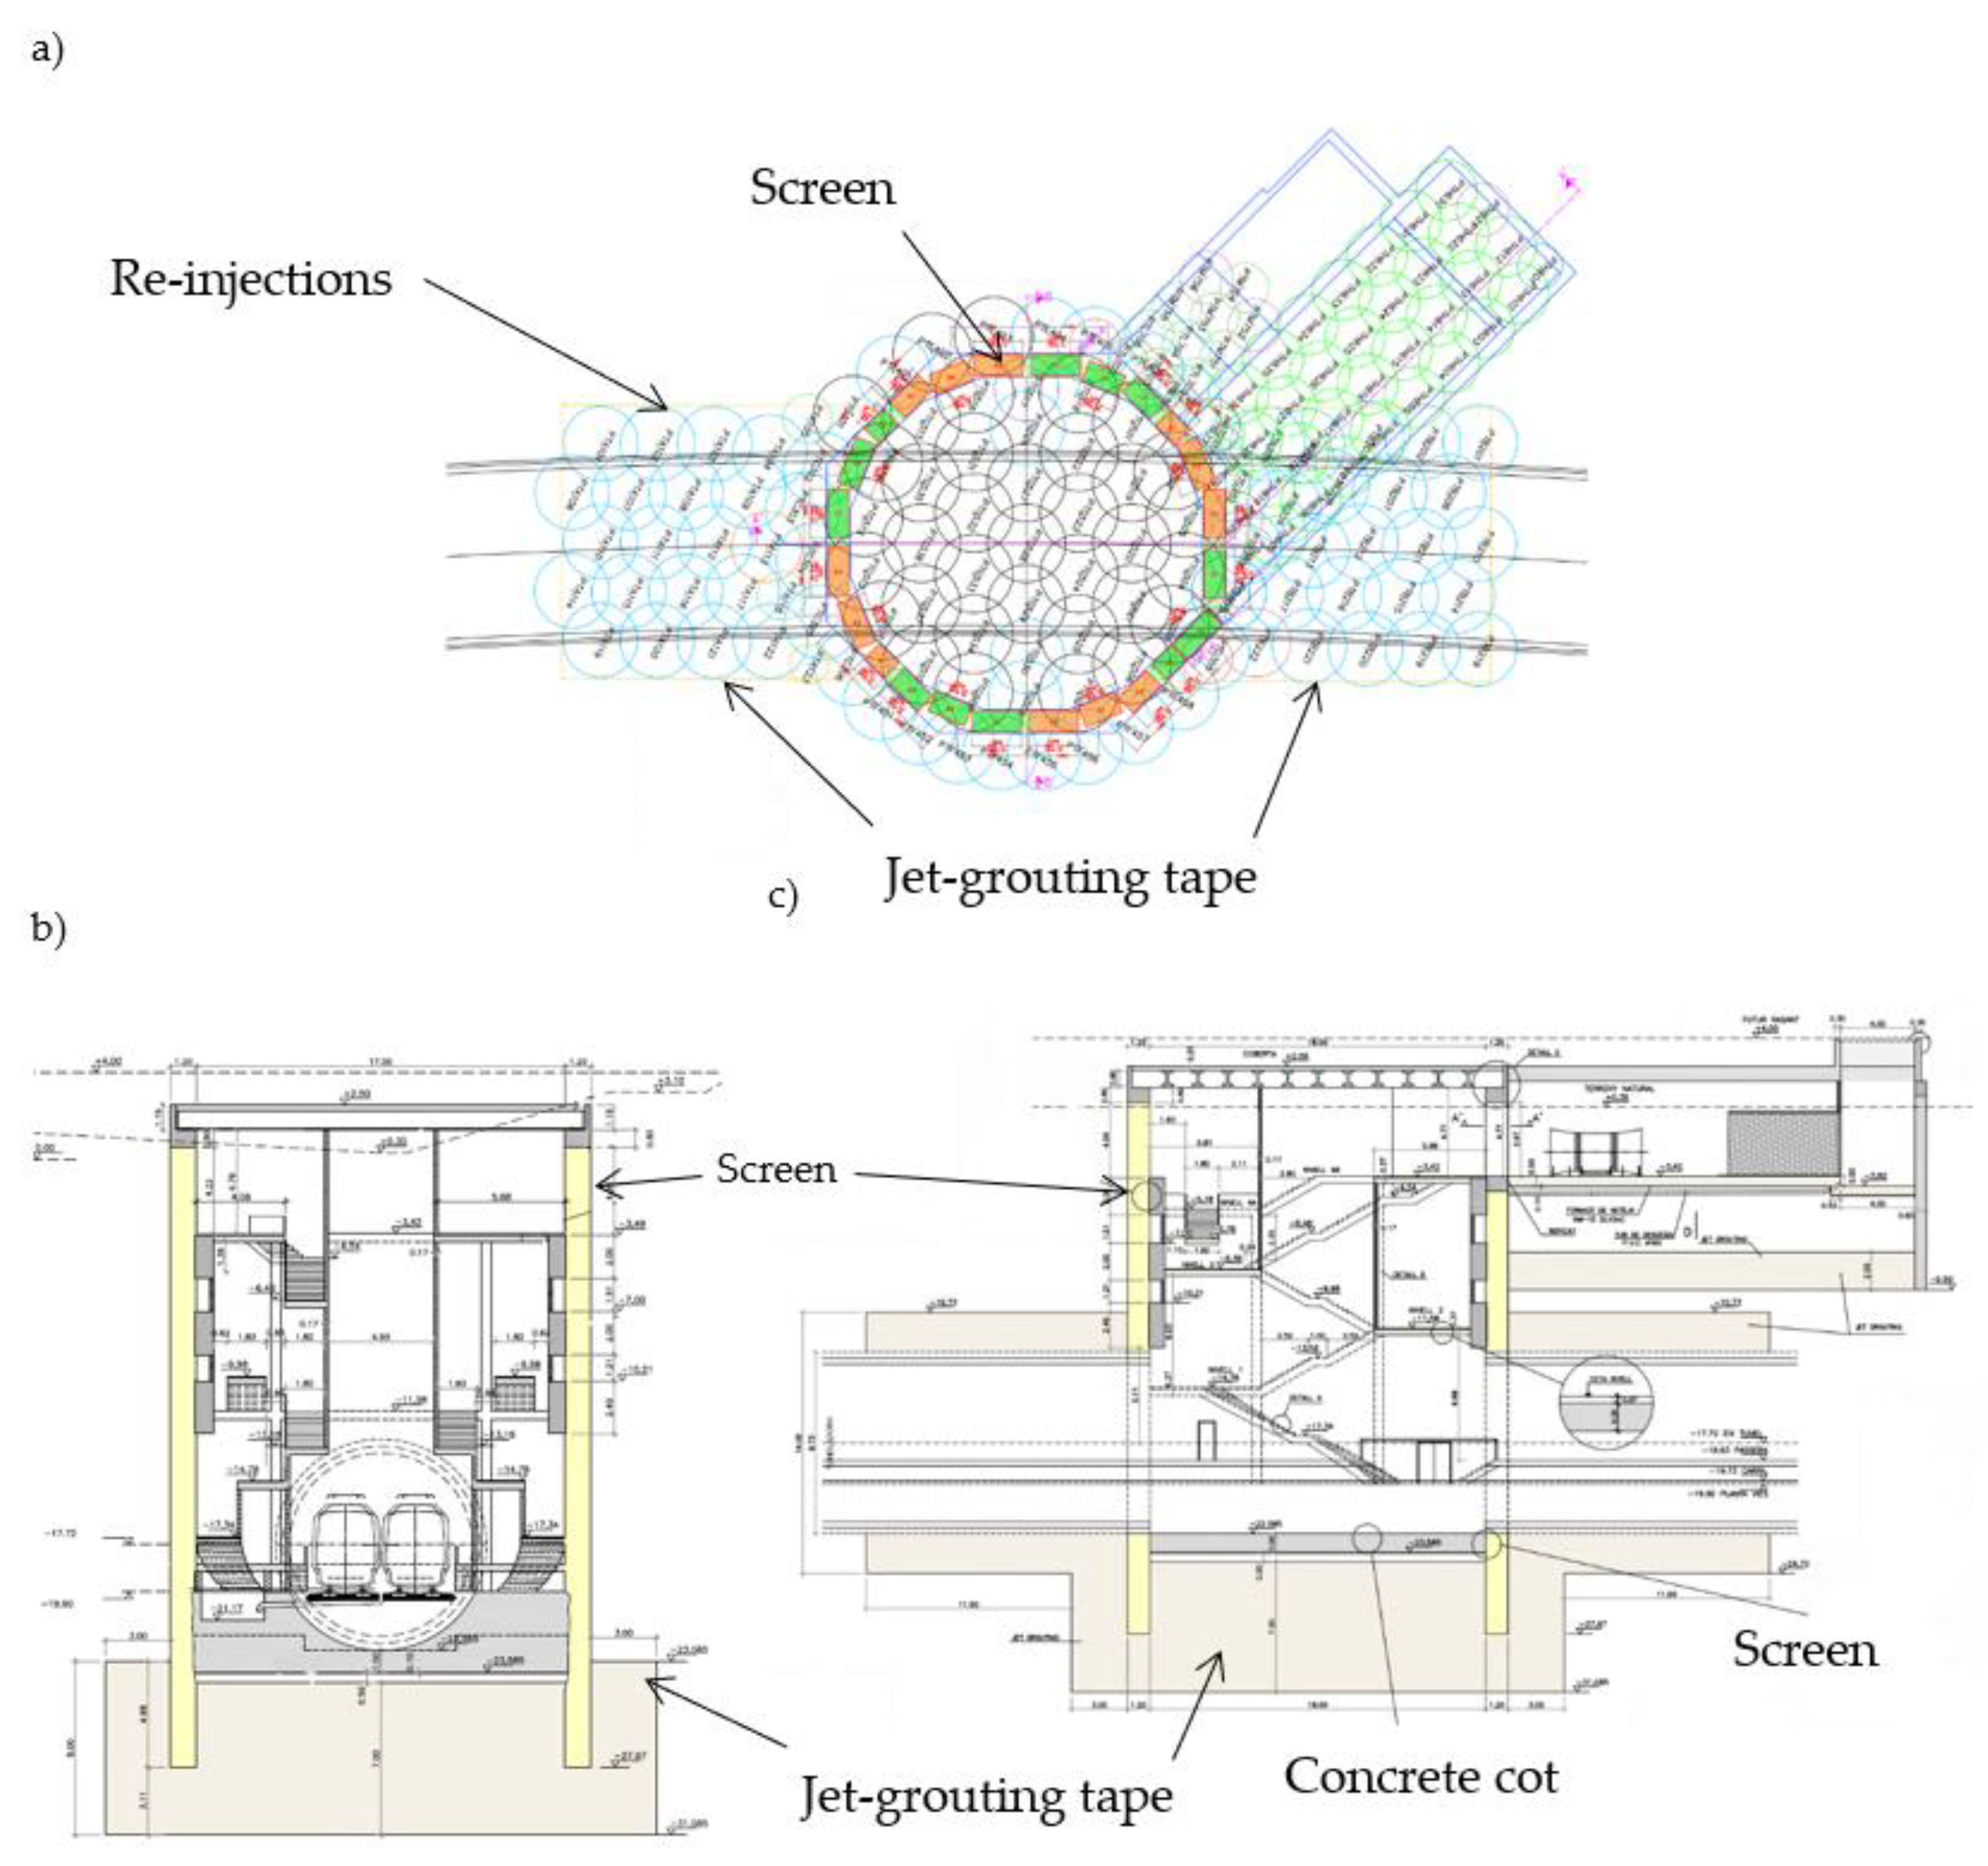
One of the times when the TBM stopped was at the exit and entrance to the maintenance shafts and stations. These stops in the shafts were made by means of jet-grouting blocks built at the entrance and exit of the shaft, where the wheel is embedded in them. These tapes are approximately 14 metres long and the shafts are made of mass concrete shields. Thus, they are used for maintenance work on the machine and the cutter wheel at atmospheric pressure. In addition, they serve as emergency exits and ventilation ex post facto. The internal diameter of the shafts is approximately 18 metres. The concrete cot, which allows the advance into the shaft through the assembly of the false tunnel rings, is already in place before the EPB arrives.
A few days before the TBM passes through the jet-grouting tapes, the watertightness of these tapes is improved by re-injection and their watertightness is checked. The following
Figure 18 shows, as an example, one of the shafts of Section 1 studied and the jet-grouting tapes developed. It represents the tunnel in plan (
Figure 18a) (cross section,
Figure 18b and longitudinal,
Figure 18c).
When the EPB has drilled the shield to a thickness of approximately 1.2 metres, it is considered that the TBM shim has been done in the shaft. During this process, a denser than usual grouting (with 120 kg/m3 of cement) is injected through the tail of the shield. Additionally, it is ensured that, at the time of the EPB breakthrough, the grouting injected behind the first ring, placed inside the jet-grouting block, is set.
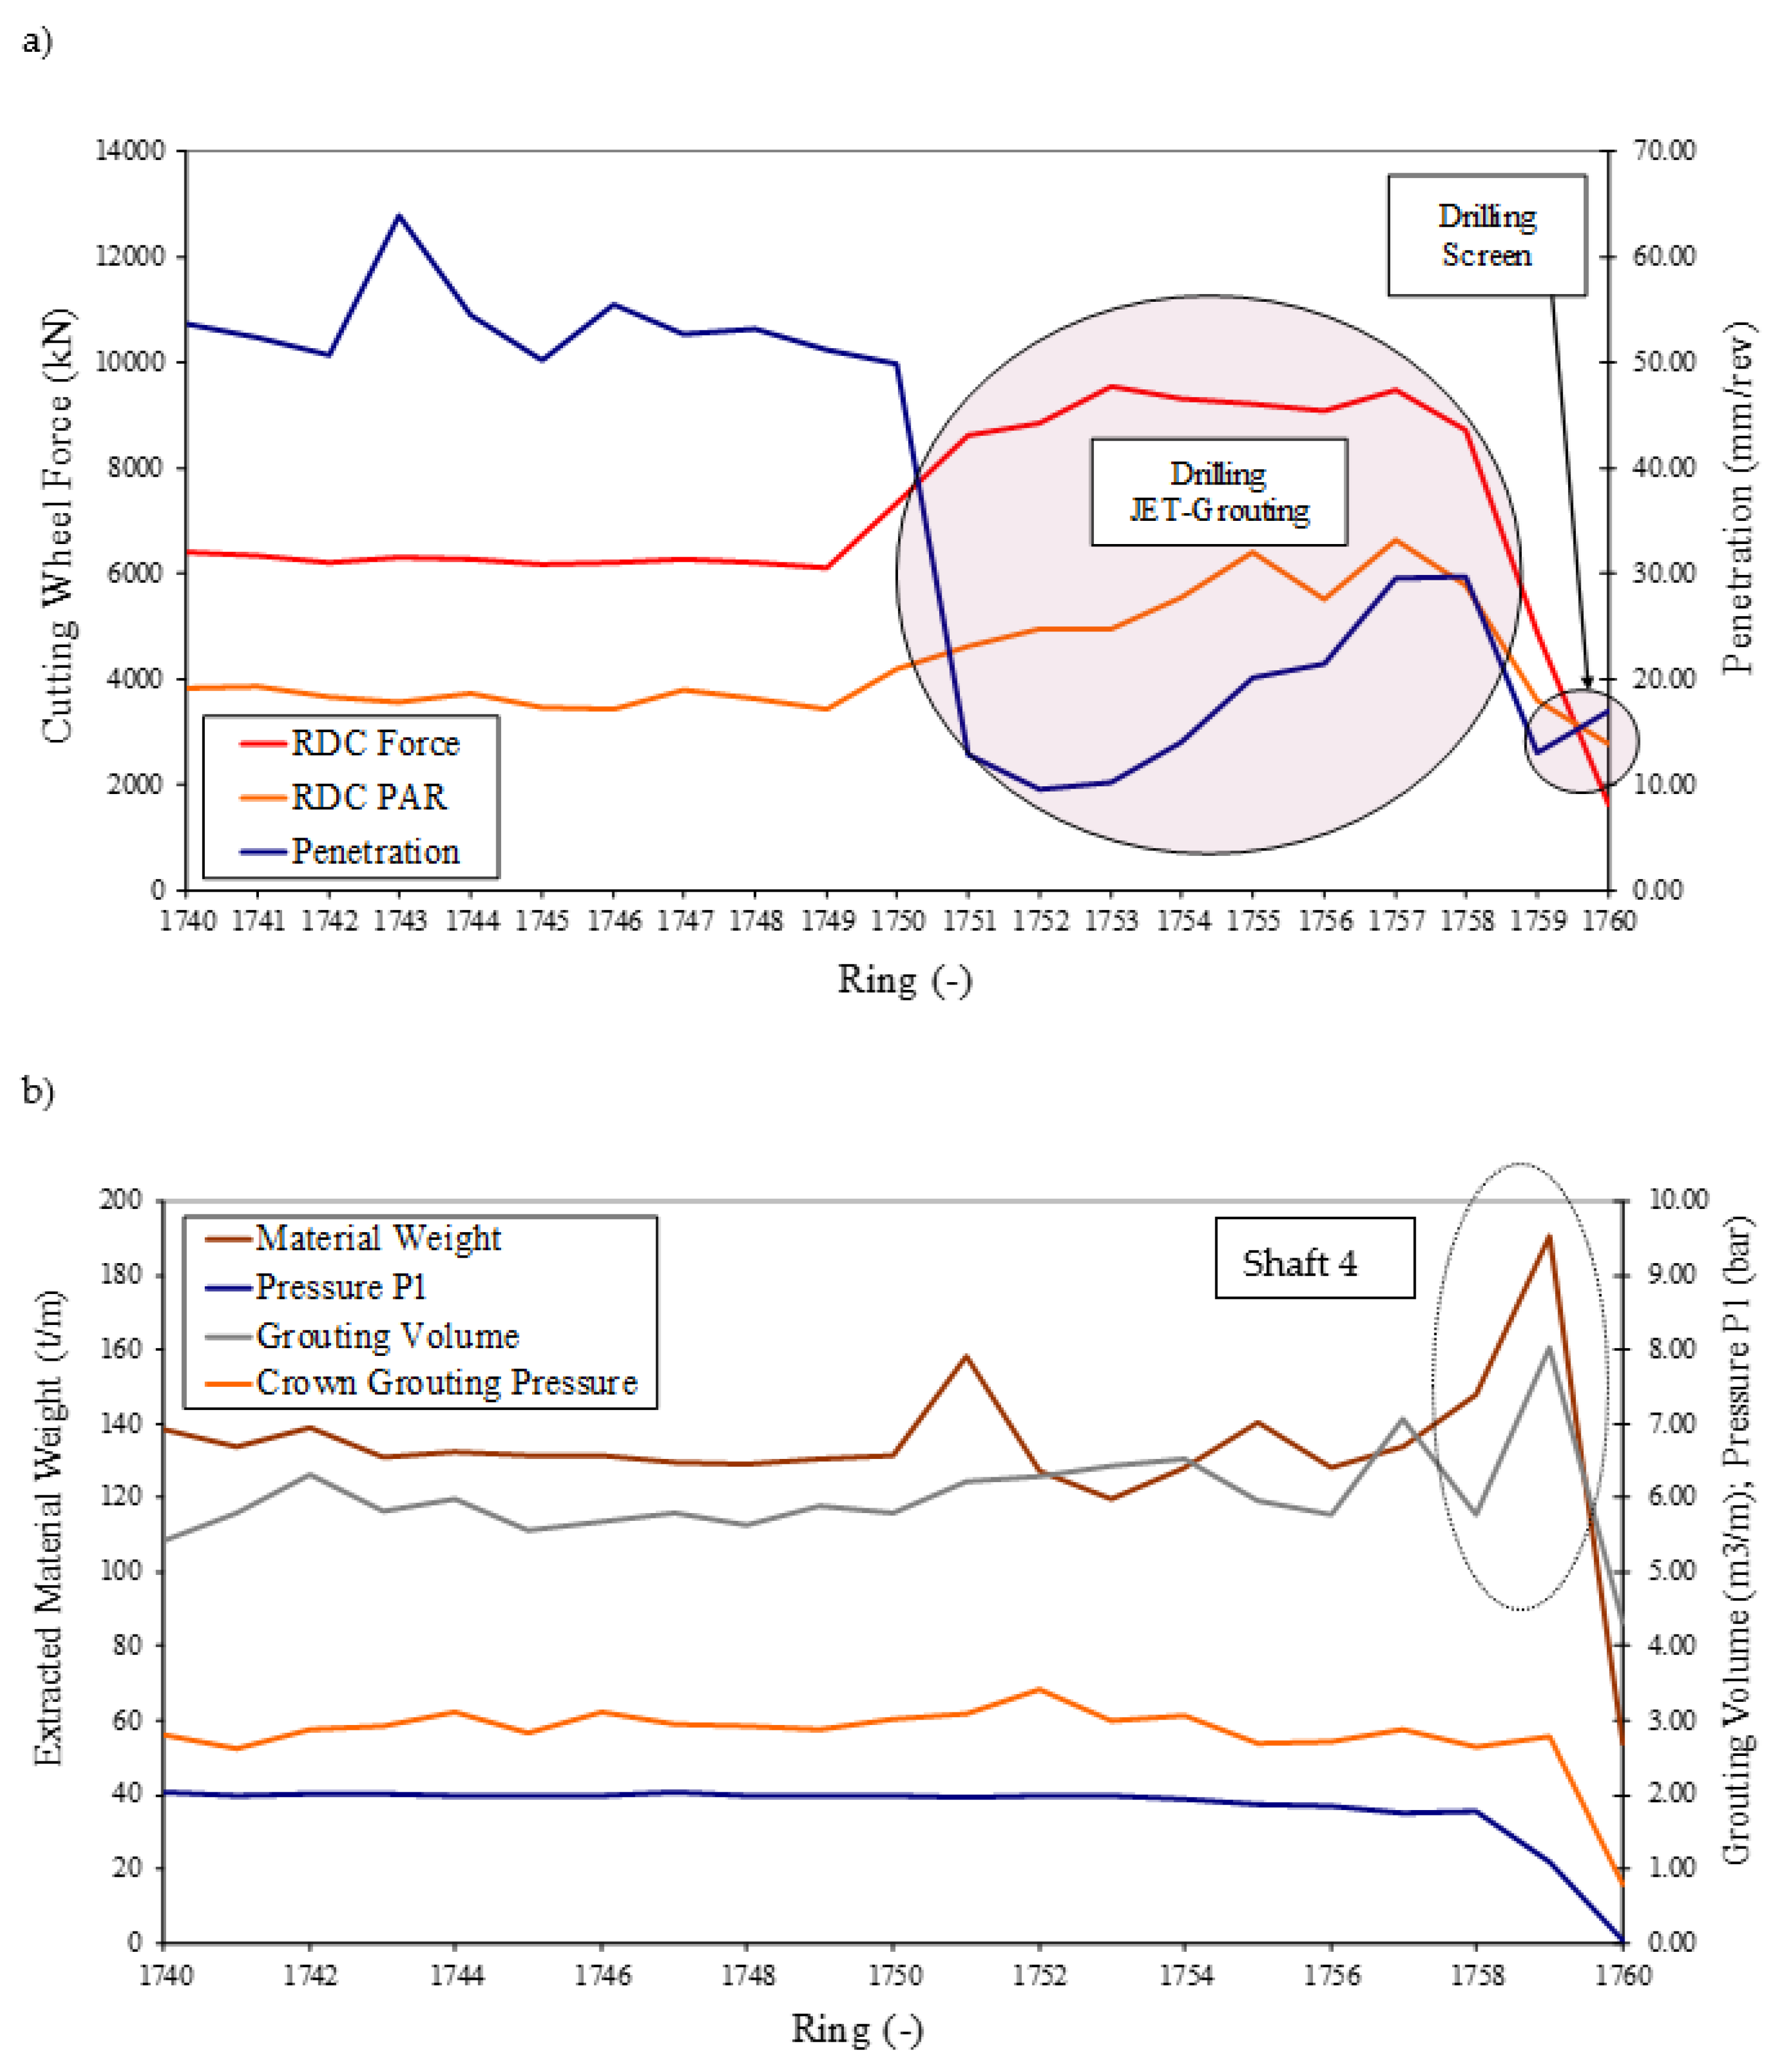
In the case of Shaft 4 (
Figure 16), there were problems with water intrusion into the tunnel, as the jet-grouting tape was not completely watertight. Further re-injections were carried out which led to small upheavals days before the entrance of the EPB into the shaft. These upheavals were increased with the entry of the shield tail into the watertight block, where an increase in the volume of grouting was realised due to a slight over-excavation of the theoretical profile. As a consequence of the water entry, rigid and brittle Jet-grouting blocks were developed (
Figure 19).
Figure 22 presents the cutting wheel force, the PAR (torque) and the drilling during excavation from ring 1740 (before contact with the jet-grouting blocks) to ring 1760 (where the TBM breakthrough occurs in one of the maintenance shafts). Before having contact with the jet-grouting blocks, the parameters remain constant with a drilling value between 50 and 60 mm/rev, a perforation force slightly above 6000 kN and a PAR with values below 4000 kNm. However, there was a significant change in these values during the drilling of the jet-grouting blocks due to its contact with the TBM cutter wheel, thus decreasing the value of the wheel force to 2000 KN, the PAR (torque) up to 6000 kNm and increasing the penetration up to 30 mm/rev. Once the jet tape is excavated, the shaft shield is drilled and all values decrease.
Moreover, the case of the weight of the extracted material, the pressure and the volume of grout injected into the shield tail is detailed in
Figure 19b. What can be noticed is that before and during the drilling of the jet-grouting blocks, the parameters are quite constant. However, at the entry of the shield tail into the jet-grouting block, an increasement of the grout injected volume and a slight over-excavation of the theoretical profile can be noticed. Thus, the weight of material extracted increases to 190 t/m and coincides with an increase in grouting injection volume from 6 m
3 to 8 m
3.
In other cases, infiltration of clean water and water with fine-grained material occurs at the joint between the jet and the shaft shield during the entrance and exit process of the shafts. It has been noticed that, in several shafts, these contacts between jet-grouting block and diaphragm wall have not been properly sealed. This has led to water infiltration causing inflow of fine ground fractions, resulting in an increasement of ground settlements and higher ground losses. In the case of Section 1, several shafts were found to have waterproofing problems. To palliate this occurrence, the use of geofam injections from the shaft by means of lances placed directly into the annular gap is employed. Moreover, the use of cement grout injections through shafts and gunite tapes is also employed from inside the shaft. Another approach is injection through the shield, using bentonite injection lines or injecting directly into the rings located inside the jet-grouting block.
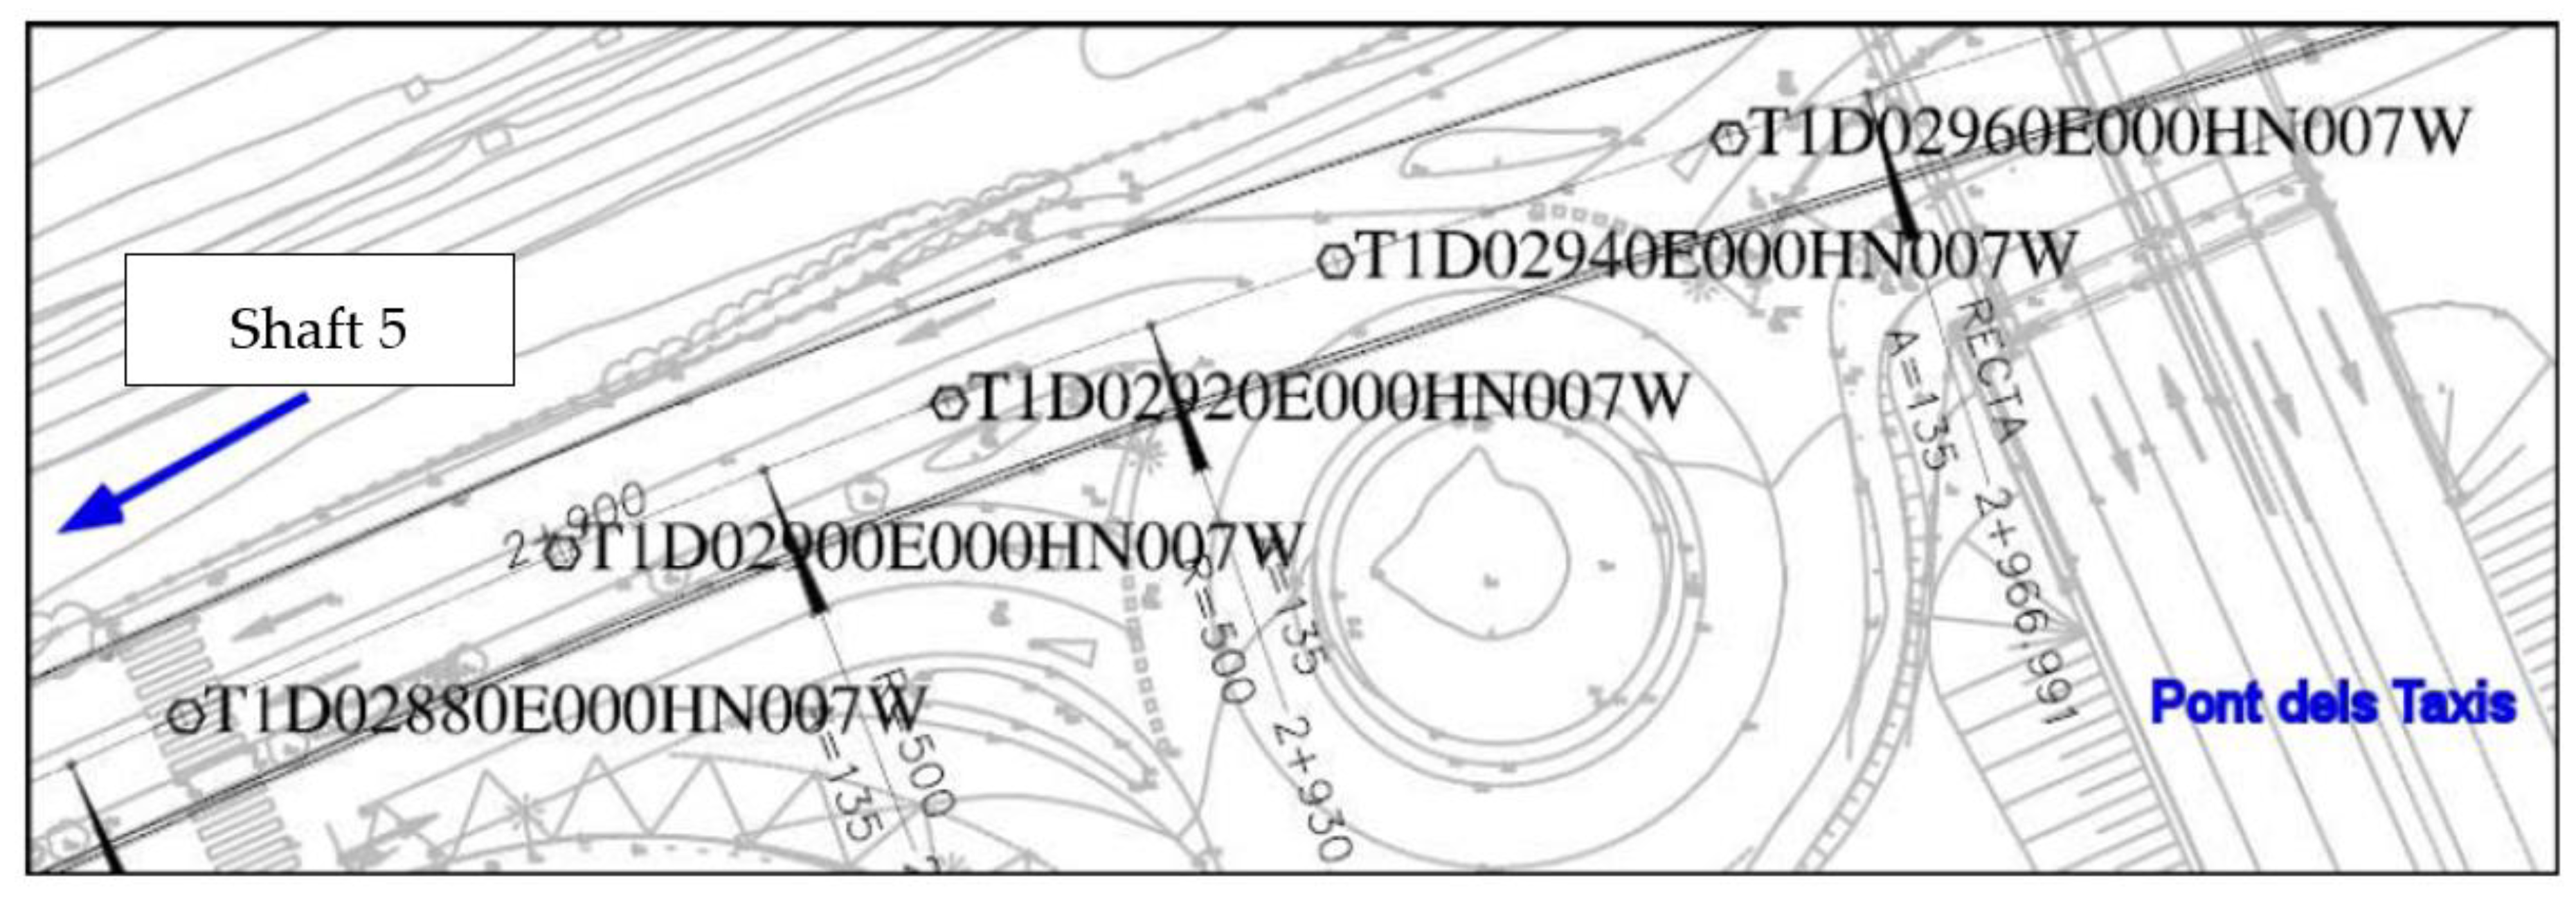
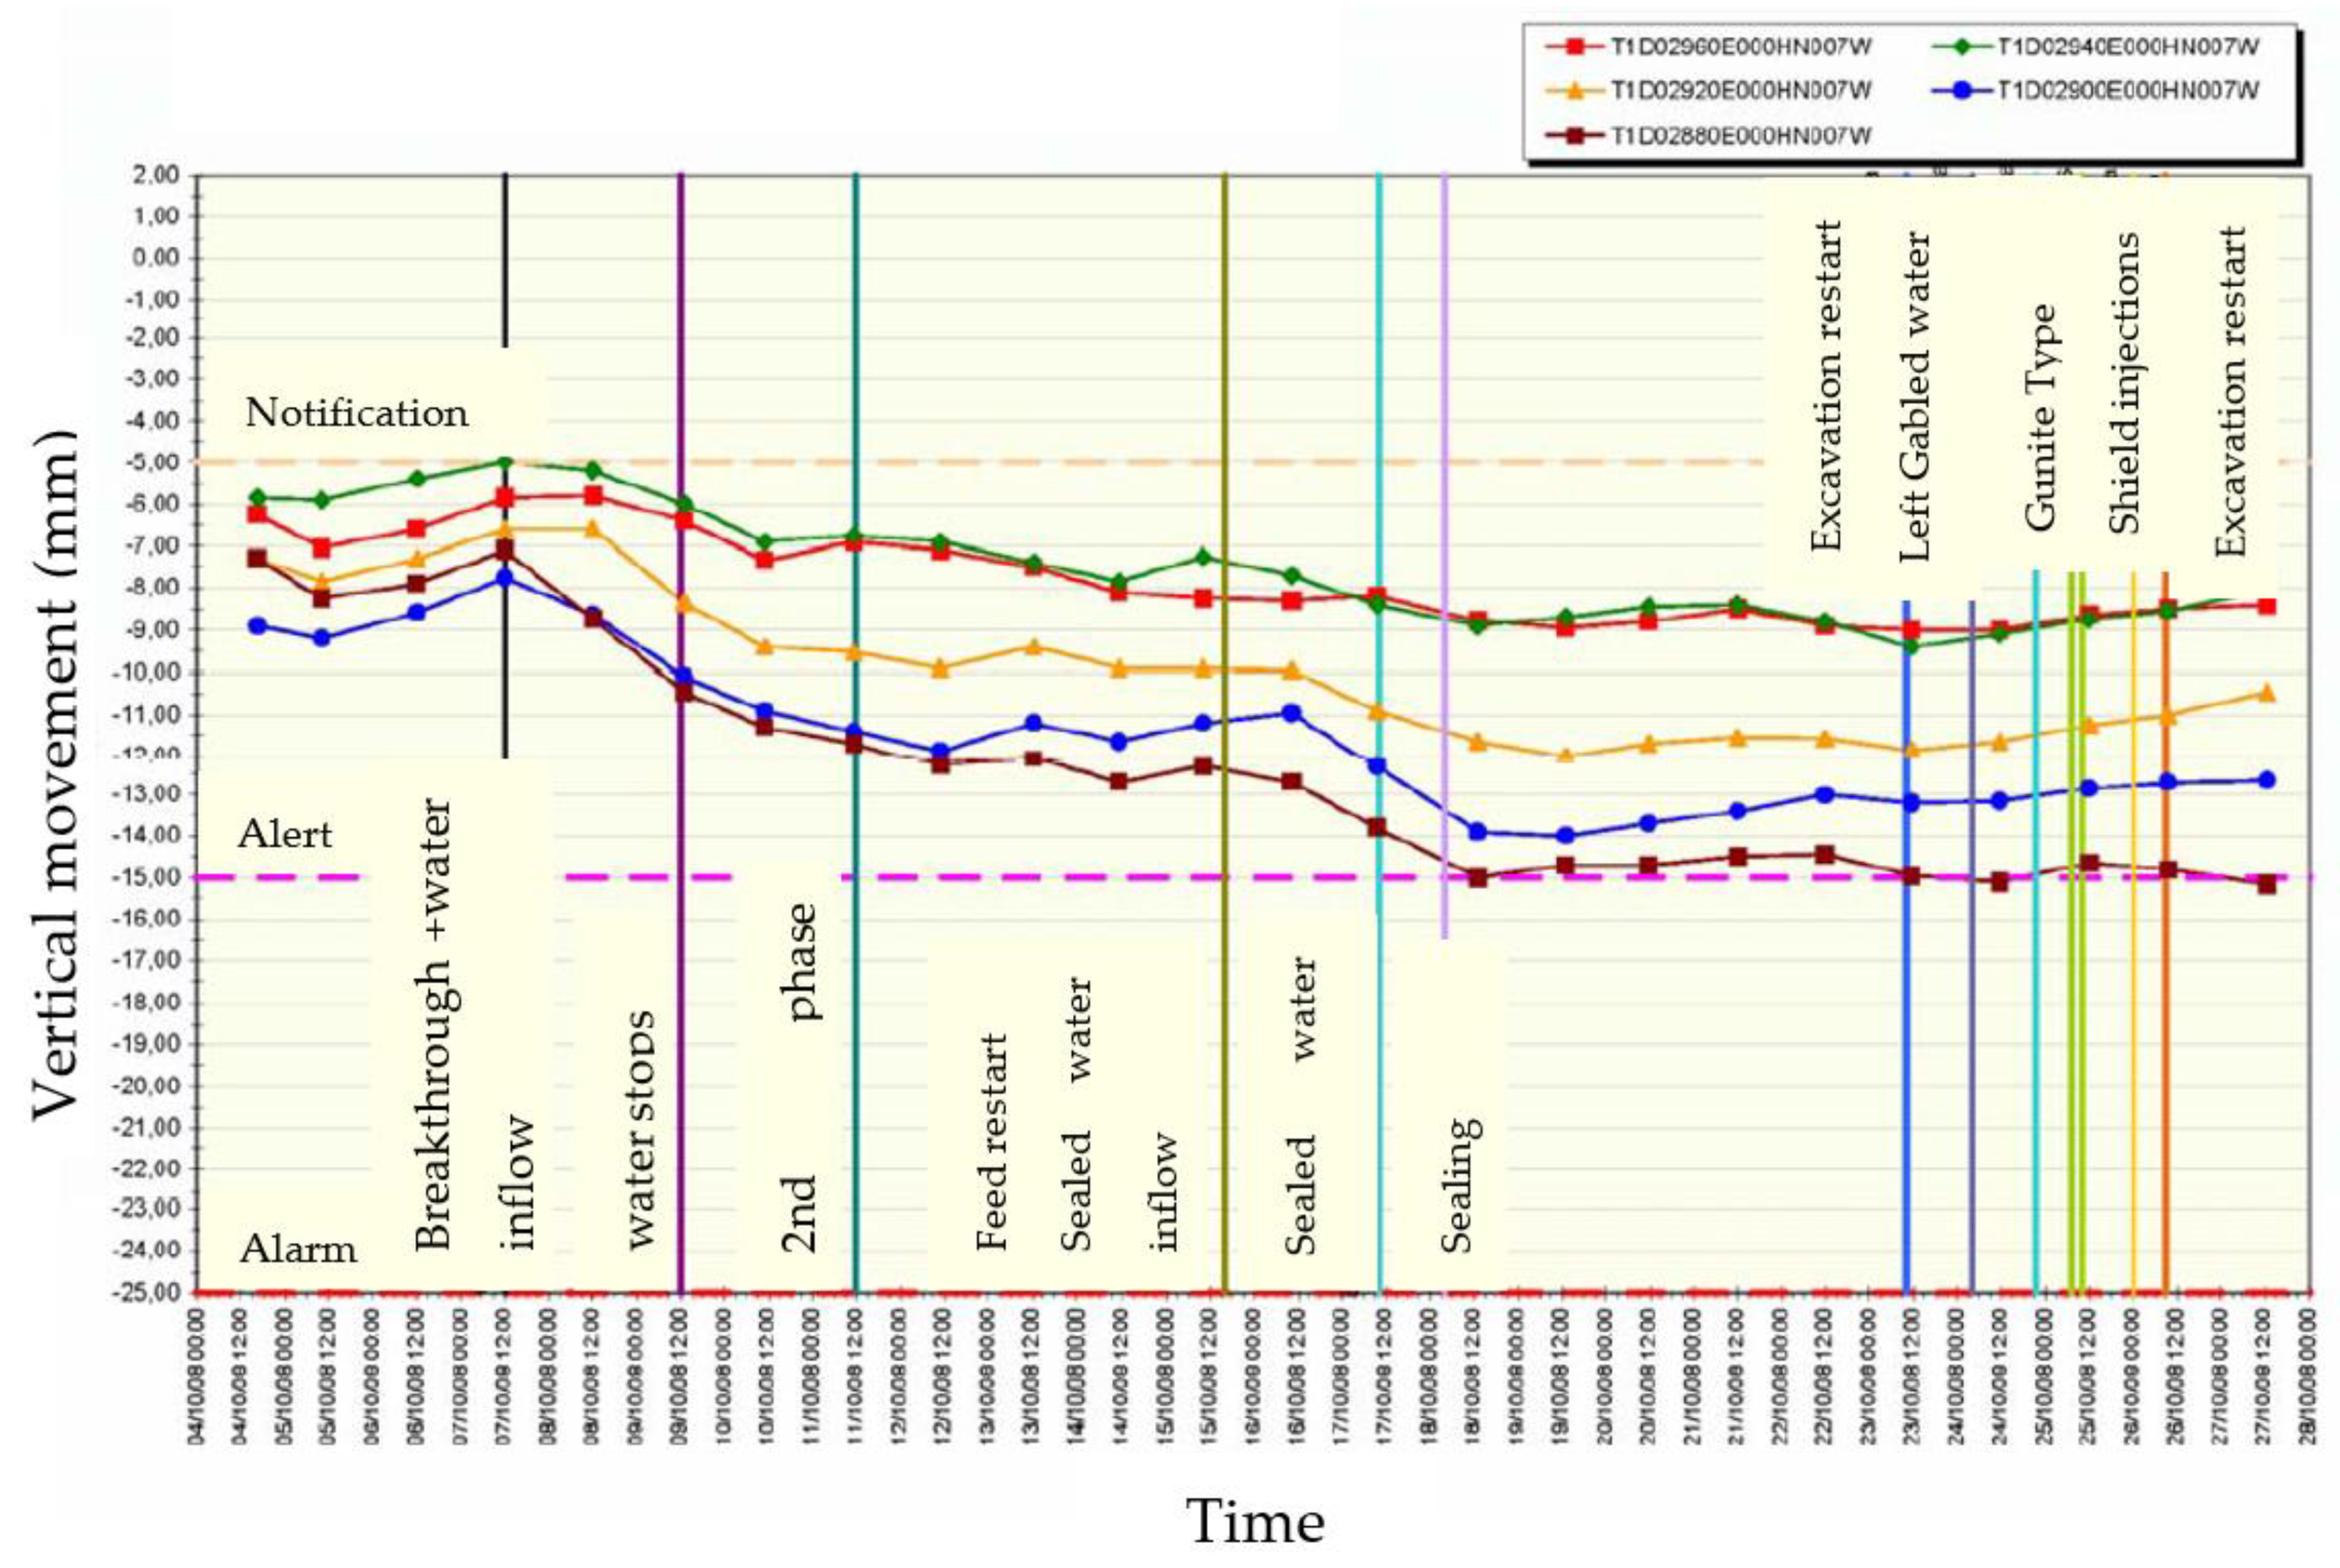
Furthermore,
Figure 20 shows the surface milestones located in the vicinity of Shaft 5 and as an example, the actions that were carried out against the entry of water and water with fines in Shaft 5 of Section 1 are presented in
Figure 21, where the surface soil settlements that caused these seepages and how they were stabilised after the actions carried out are also shown. Thus, in
Figure 21, practically all the movement detected by these milestones arises between the moment when the inflow of water with entrained fines into the shaft occurs, until the inflow of entrained water into the shaft and tunnel stops, as a result of the actions explained above, causing a loss of volume of approximately 0.6 %.
In particular, the exit of the EPB machine from the shafts is also a trouble spot, as the shield is drilled to enter the jet-grouting tape and it is necessary to backfill the excavation cavity with the excavated material.
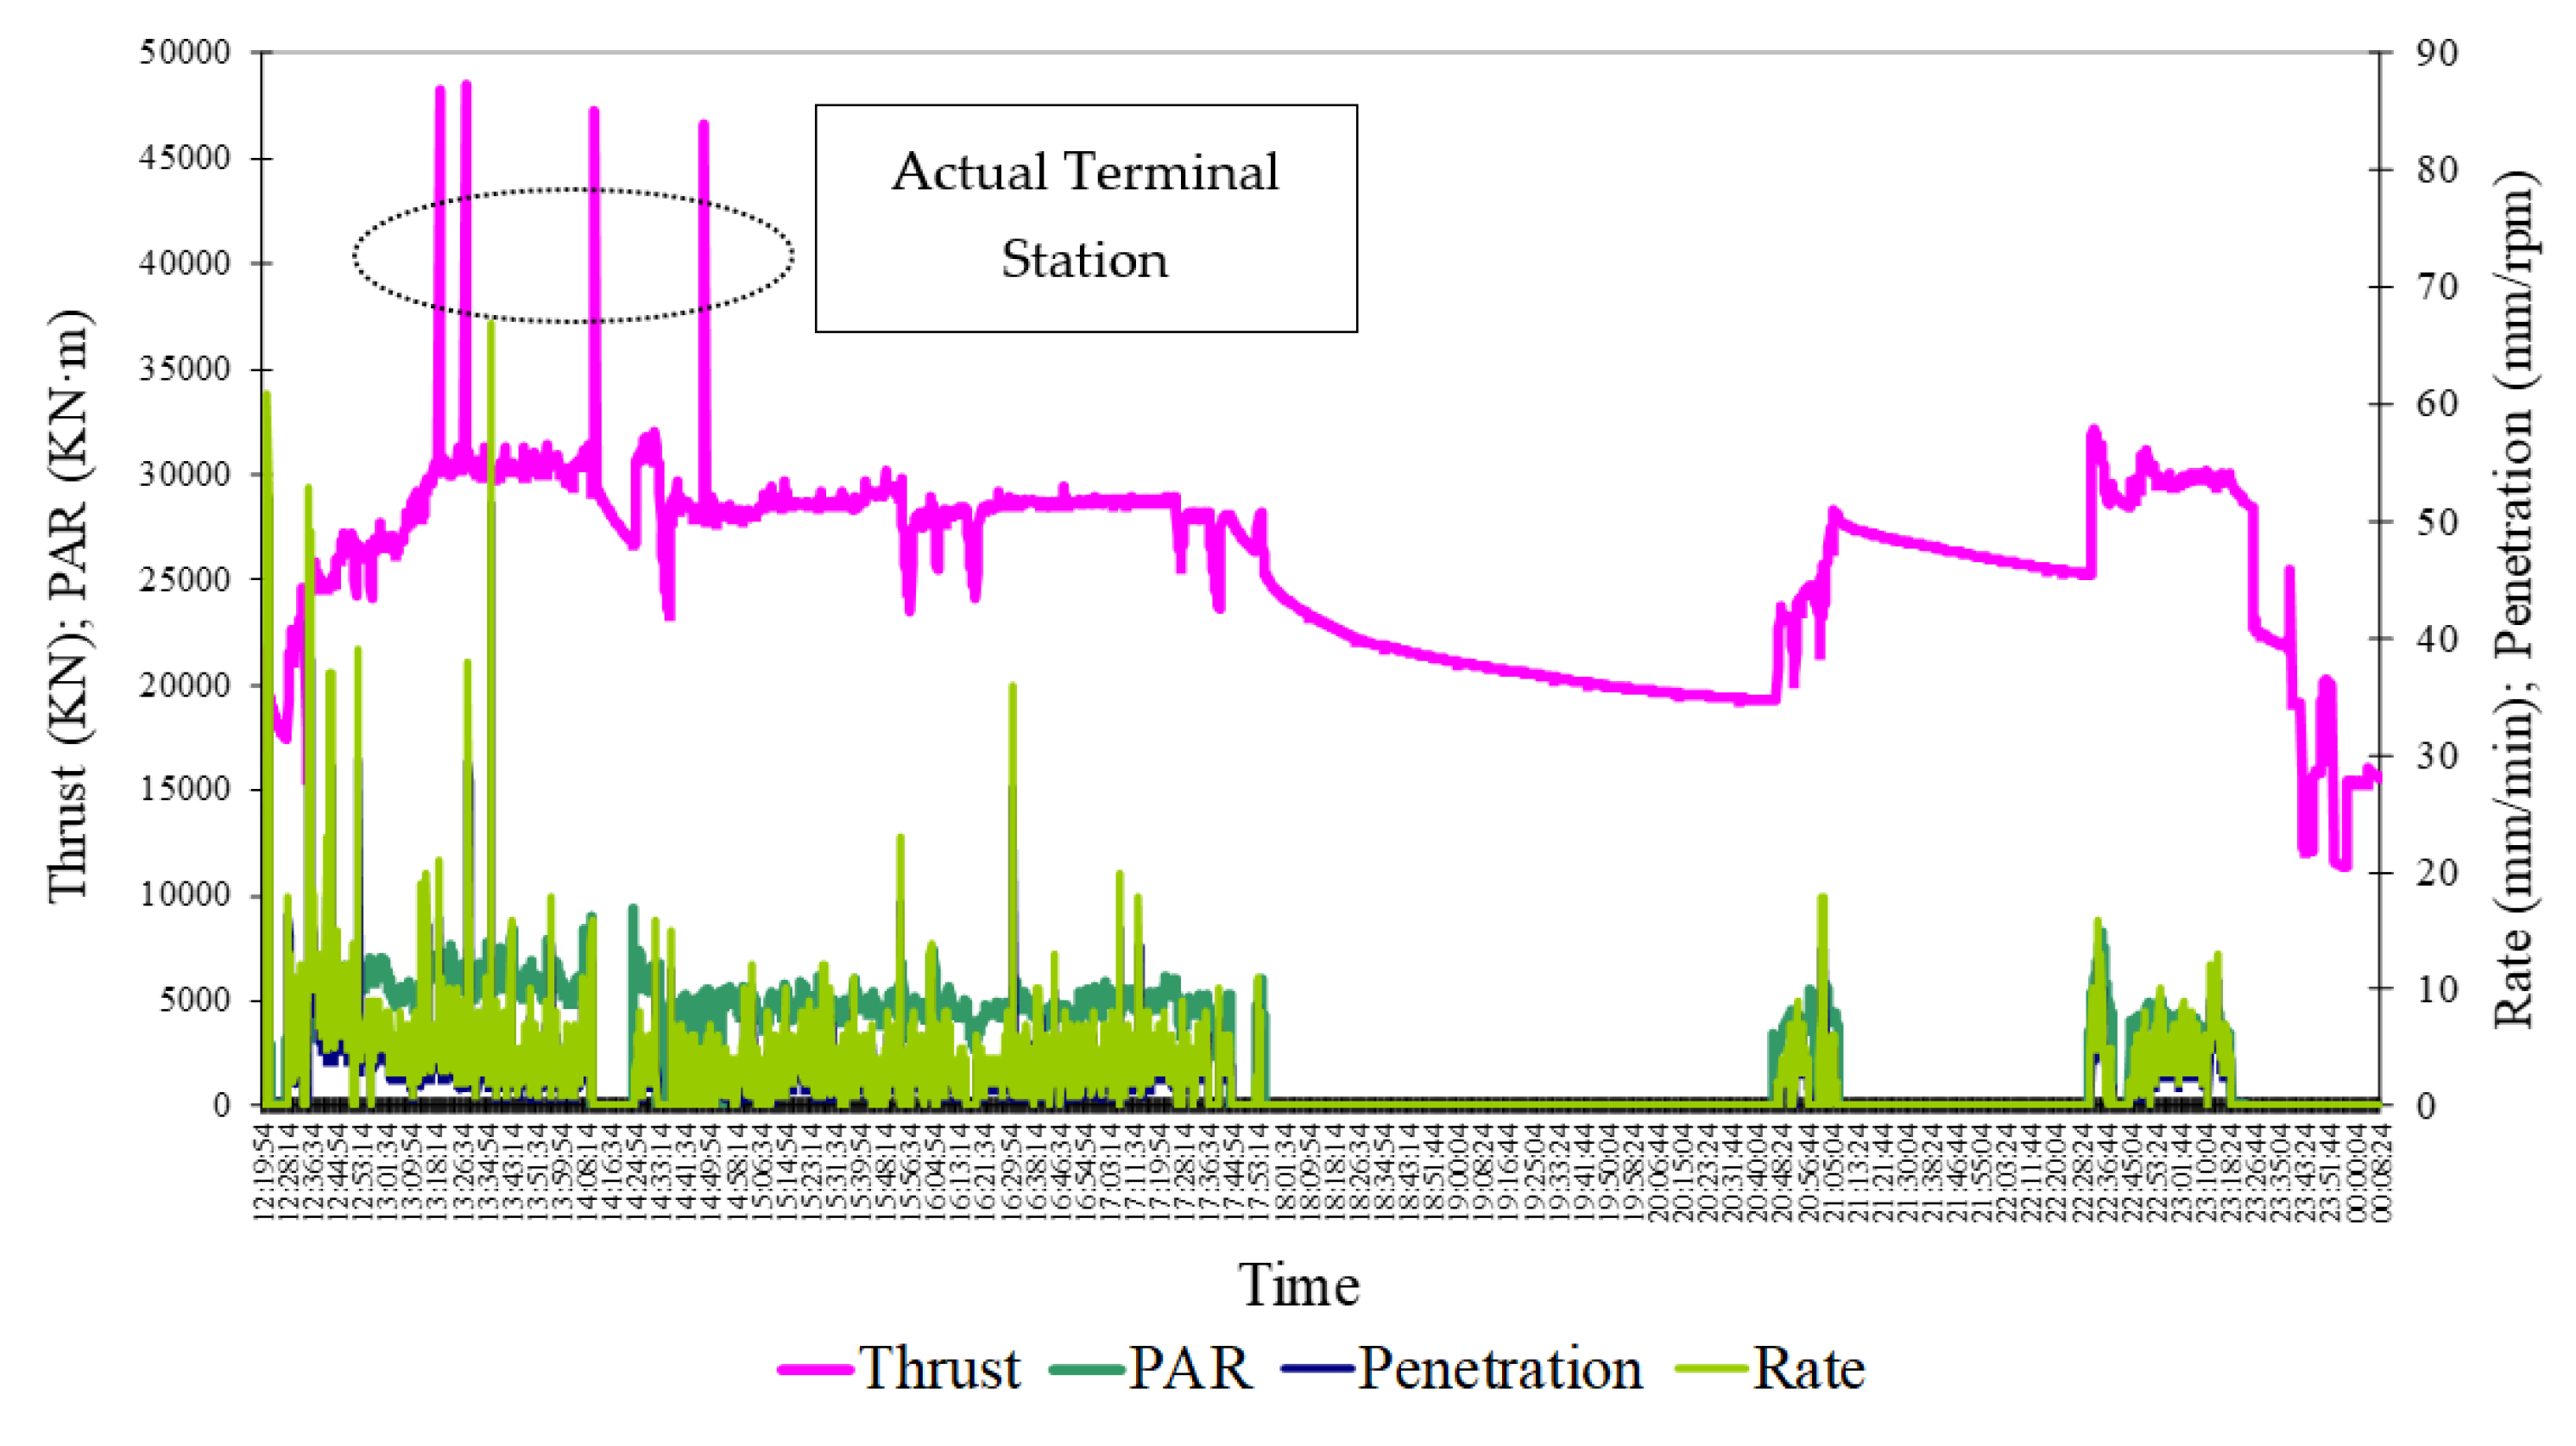
Figure 22 shows the case of the exit of the watertight enclosure of Actual Terminal during the drilling of the exit shield. This area of the layout is very superficial, with a relation between tunnel depth vs. tunnel diameter (z/D) ratio of 1.04. Moreover, the recorded thrust values are slightly higher than those established as the usual working values (25,000 KN), reaching values of 48,000 KN. In this case, days before, the repair of half of the upper section of the exit shield was carried out, requiring a greater thrust force, and for this reason the thrust presents higher values which caused small surface uplifts and which were favoured due to the fact that the coverage of the tunnel was only (z/D=1.04).
Figure 22.
Excavation parameters of a ring in the vicinity of the Actual Terminal station.
Figure 22.
Excavation parameters of a ring in the vicinity of the Actual Terminal station.
There are other cases where the TBM is also stopped for maintenance; we call them Interventions in Hyperbaric Conditions. In these cases, it involves emptying part of the earth chamber and injecting bentonite, maintaining the face pressure (P1) constant at all times. As an example,
Figures 23a,b show different points along the route where hyperbaric conditions have been carried out and, as it can be seen, the loss of ground at these points is higher.
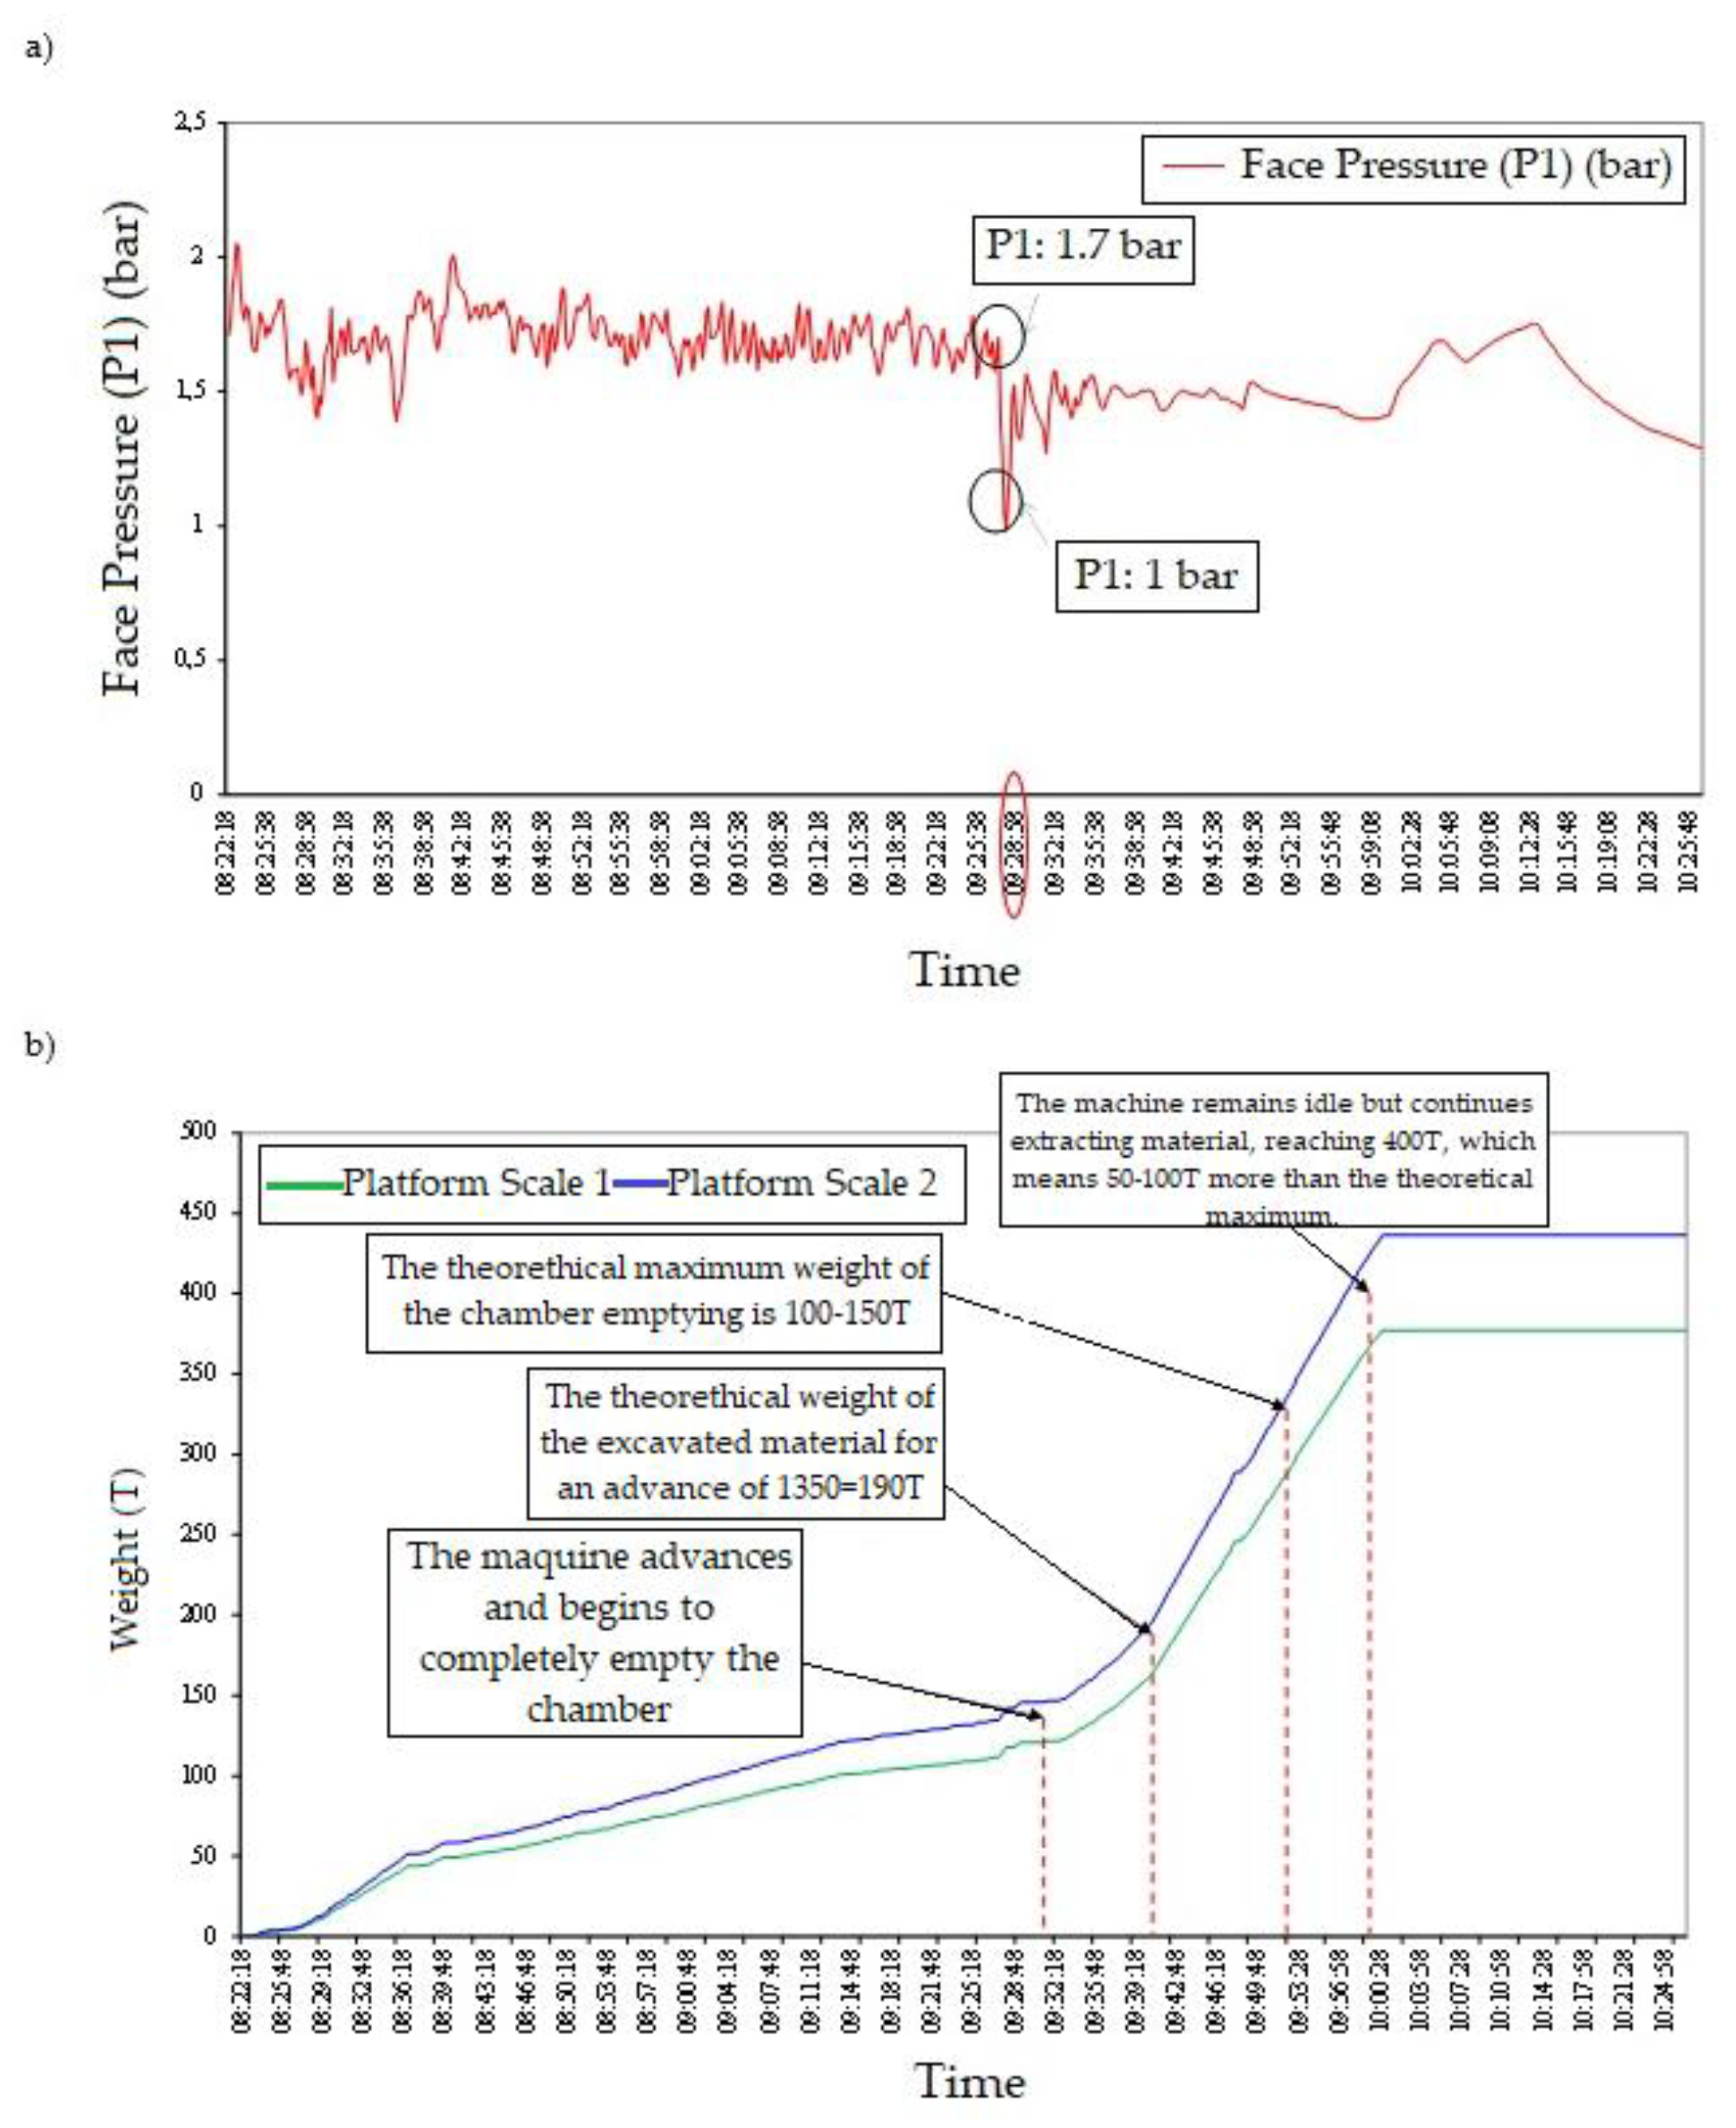
These losses are caused by poor control of the face pressure (P1) during stoppage and restart of the excavation work.
Figure 23 shows, as an example, a case where the pressure at the excavation face could not be maintained. In this case, there is a sudden drop in this pressure (P1) from 1.7 bar to 1.0 bar (
Figure 23a). The average pressure P1 required, in this zone, is 1.35 bar. Furthermore, it is observed that the extracted material was higher than the theoretical value calculated at that point (
Figure 23b), causing an increasement in the ground volume loss in that area.
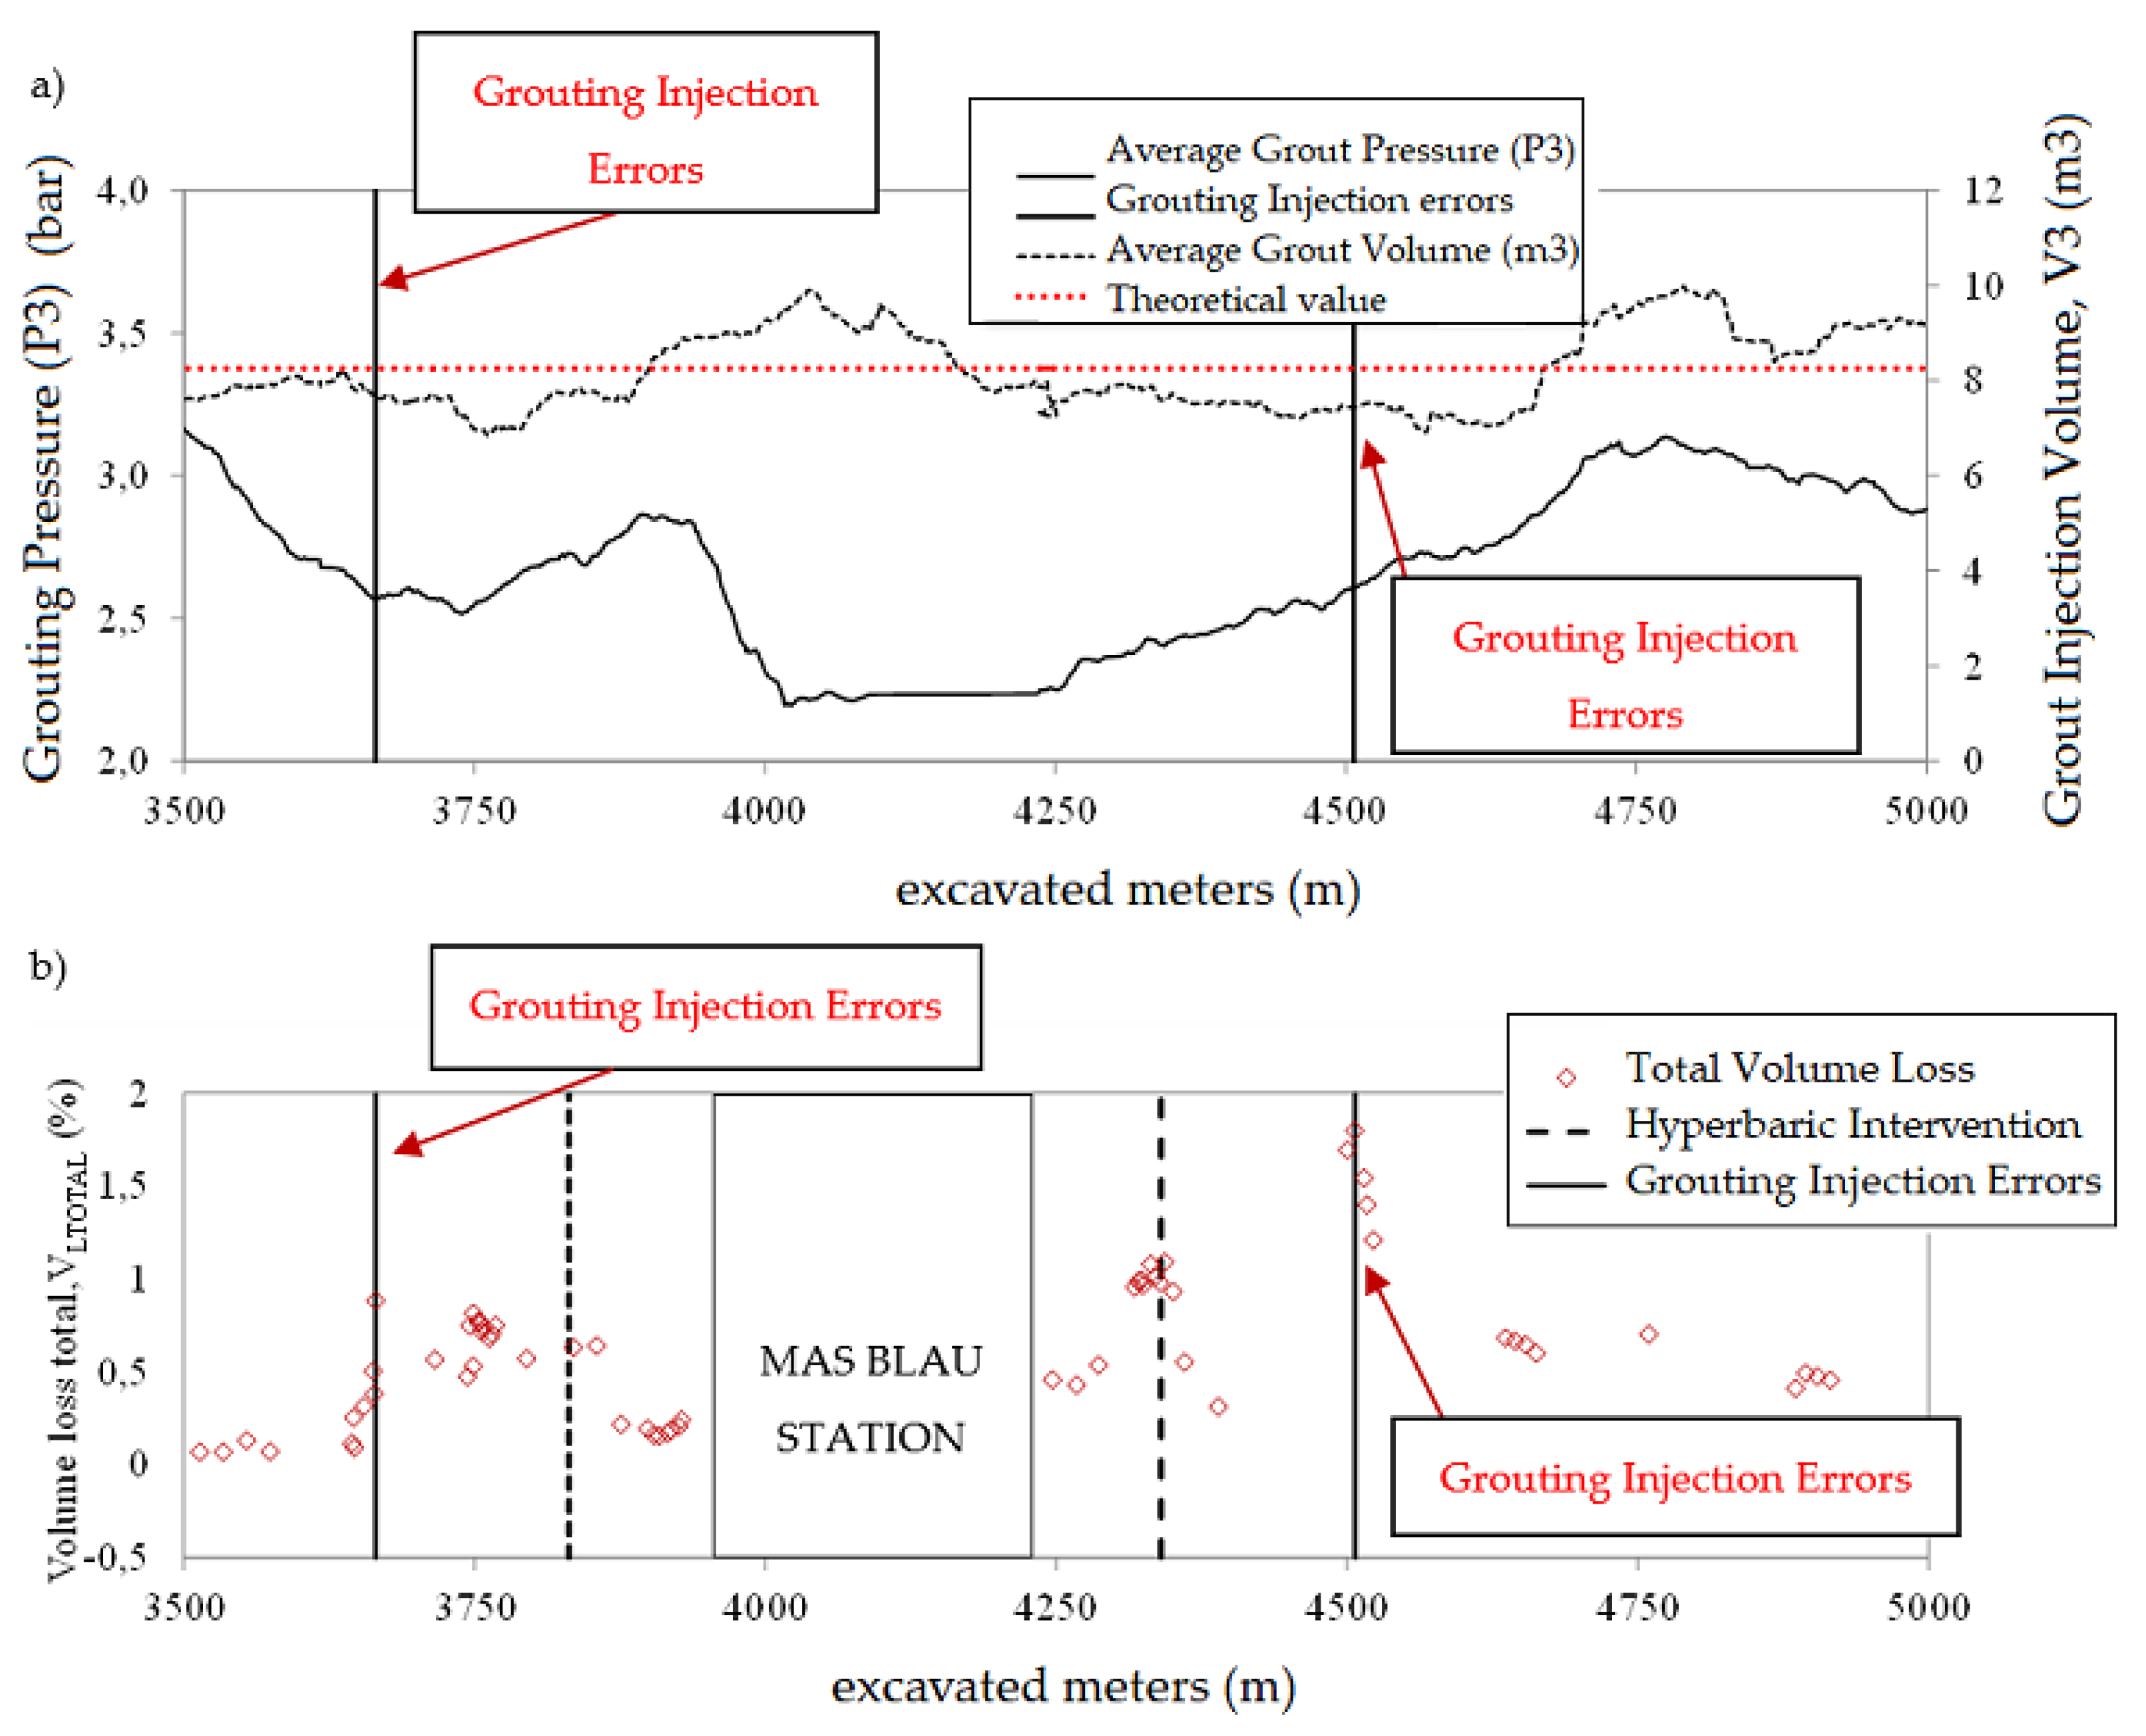
Another cause that can lead to a greater loss of ground volume is related to excessive wear of the brushes located at the tail of the shield. This generates a decrease in the injection of tail-grout (m
3) lower than the theoretical injection calculated for the excavation. It has been observed at several points that, when this injection volume is lower than the theoretical volume, the loss of ground volume is greater (
Figure 24). To show that,
Figure 24a reveals two points on the Line 9 layout, where it is known that there were problems with the grout injection, resulting in insufficient grouting and generating ground volume losses of more than 1% (
Figure 24b).
Finally, a little more loss of ground volume, around 0.3-0.4%, have been distinguished in relation to the wear of the cutters of the cutting wheel. From the airport's Actual Terminal station towards Terminal entre pistes (
Figure 1), the material is sandier with slightly higher quartz content than in the rest of the section 1 layout studied. Quartz causes greater wear on the cutting tools. To avoid this wear and prevent greater losses of ground volume foam-type additives were used, which helped to keep these losses to a minimum.
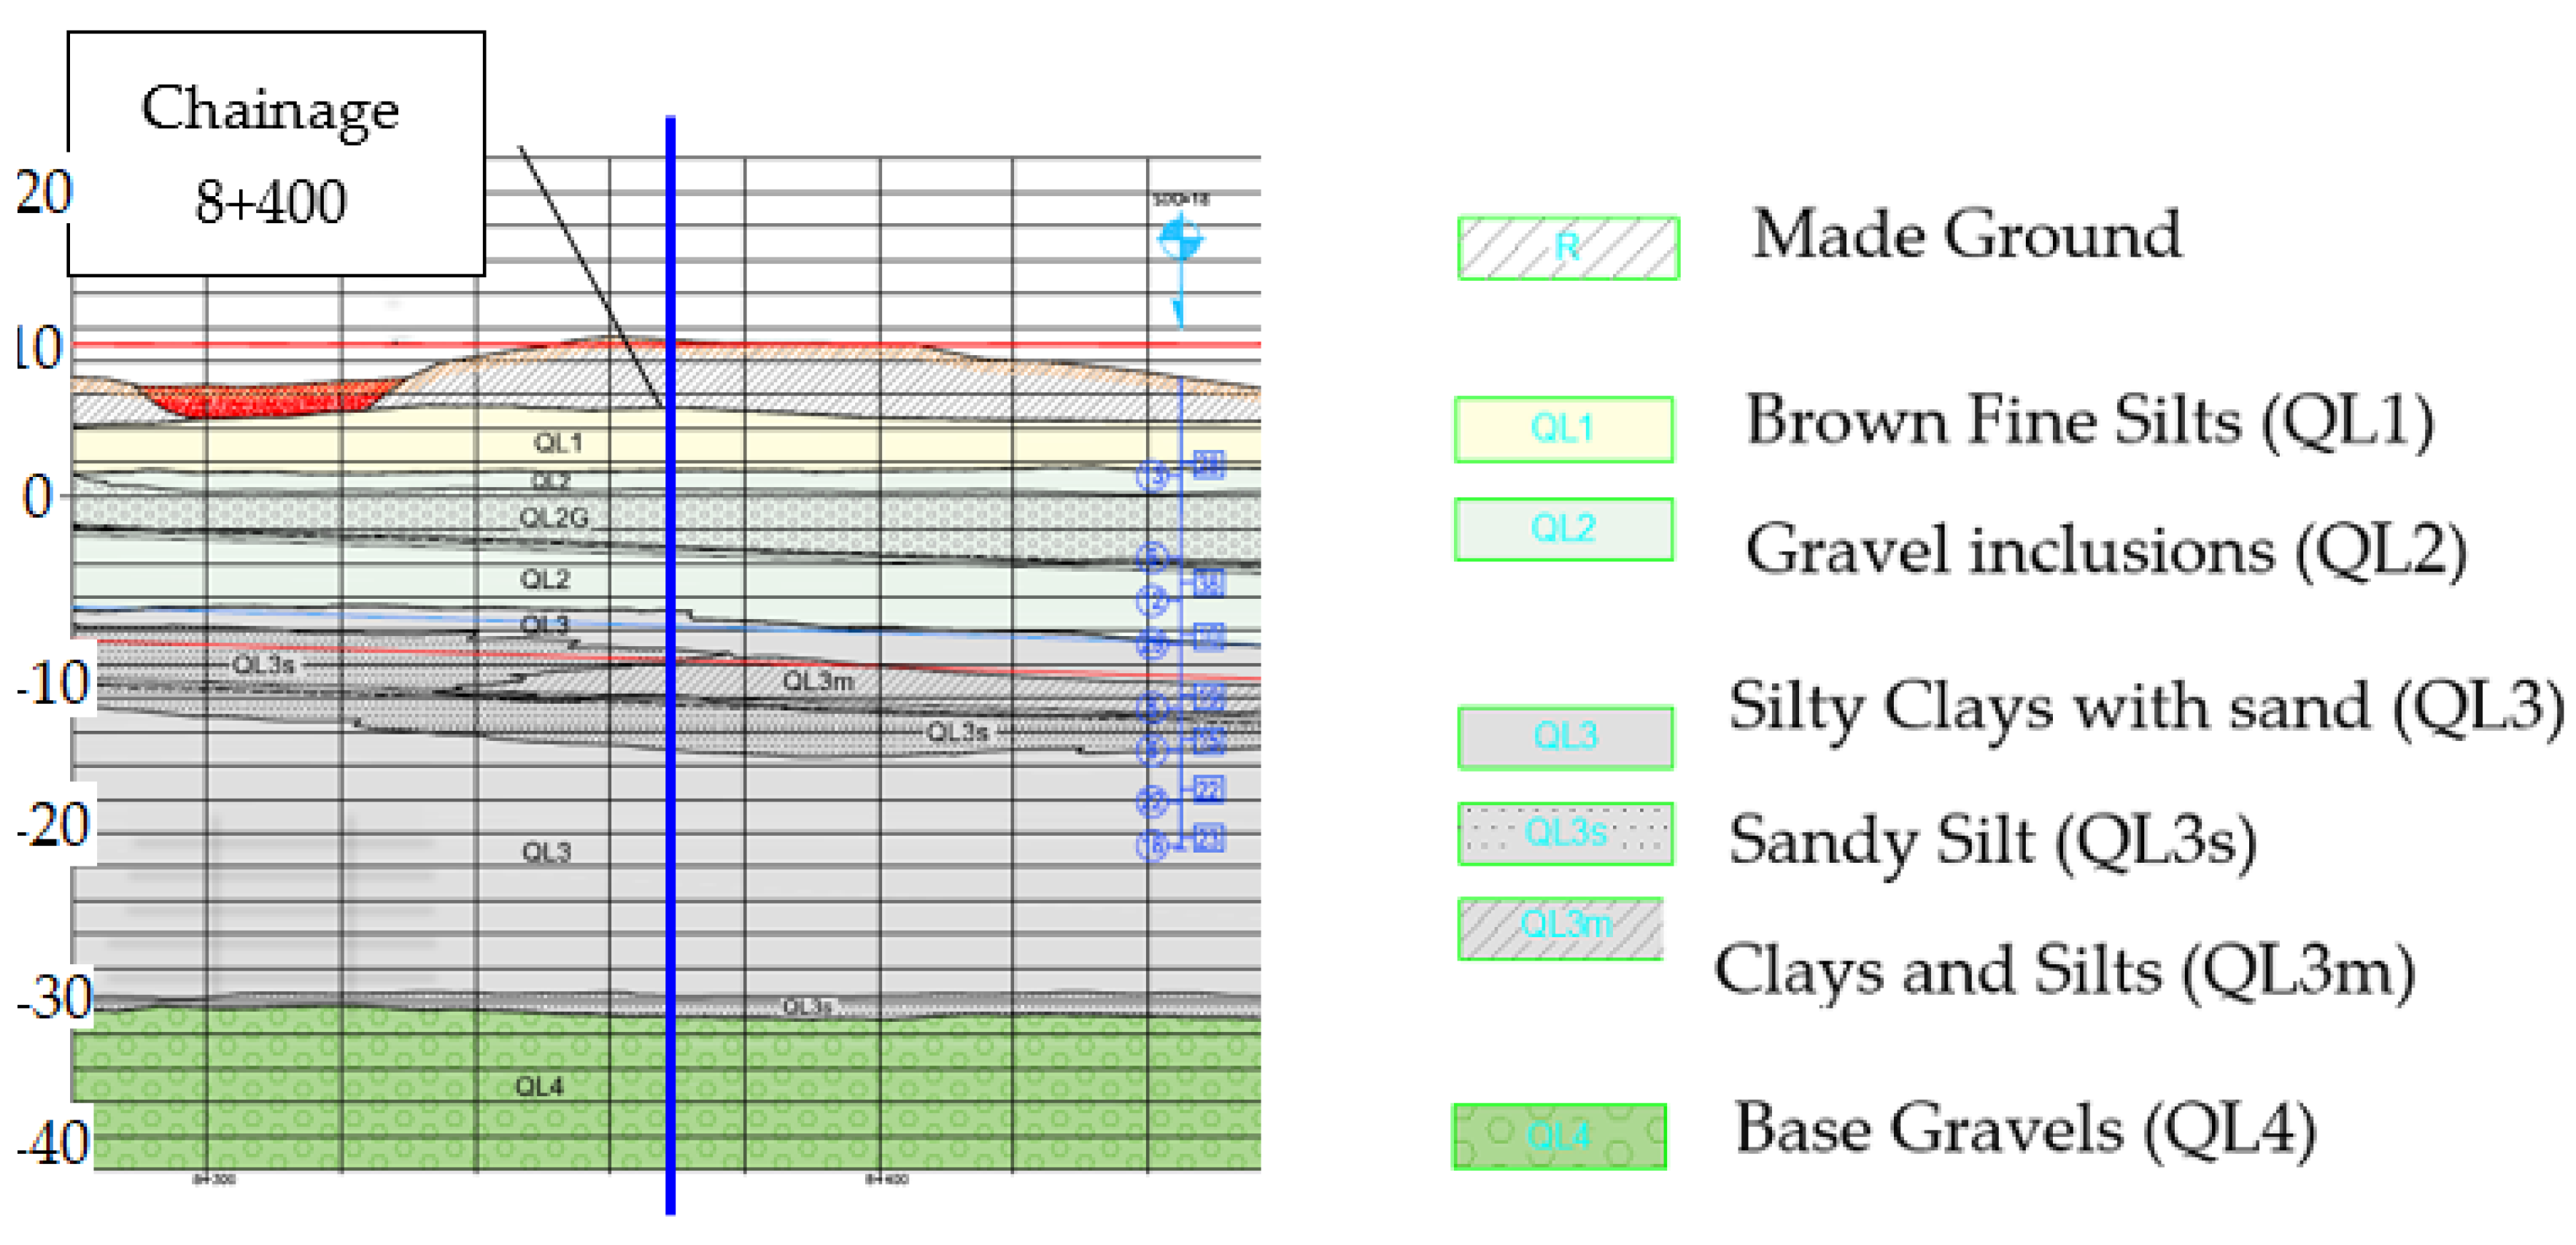
All cases, so far, with higher ground losses are due to construction problems related to the TBM. The last case to be presented is related to excavation under poorly compacted backfill material on the surface, which has nothing to do with the handling and operating parameters of the machine. In Section 1 of Line 9 of the Barcelona Metro, there were two sections that were excavated underneath previously removed material. In both cases, the ground had been lifted approximately 3 metres deep for the maintenance of water and gas pipes. In addition, a previously compacted backfill had been placed to gain cover in these areas during the excavation of the tunnel, and the geological profile of one of the zones is shown in
Figure 25. The figure shows the layer of compacted anthropic backfill placed prior to the passage of the TBM.
The behaviour of a fill material is not the same as natural ground. According to Leca, L. et al., 2000, surface settlement in loose or compressible soils can lead to a higher amount of settlement in the soil surface and this has been proved in these areas where higher settlement occurs.
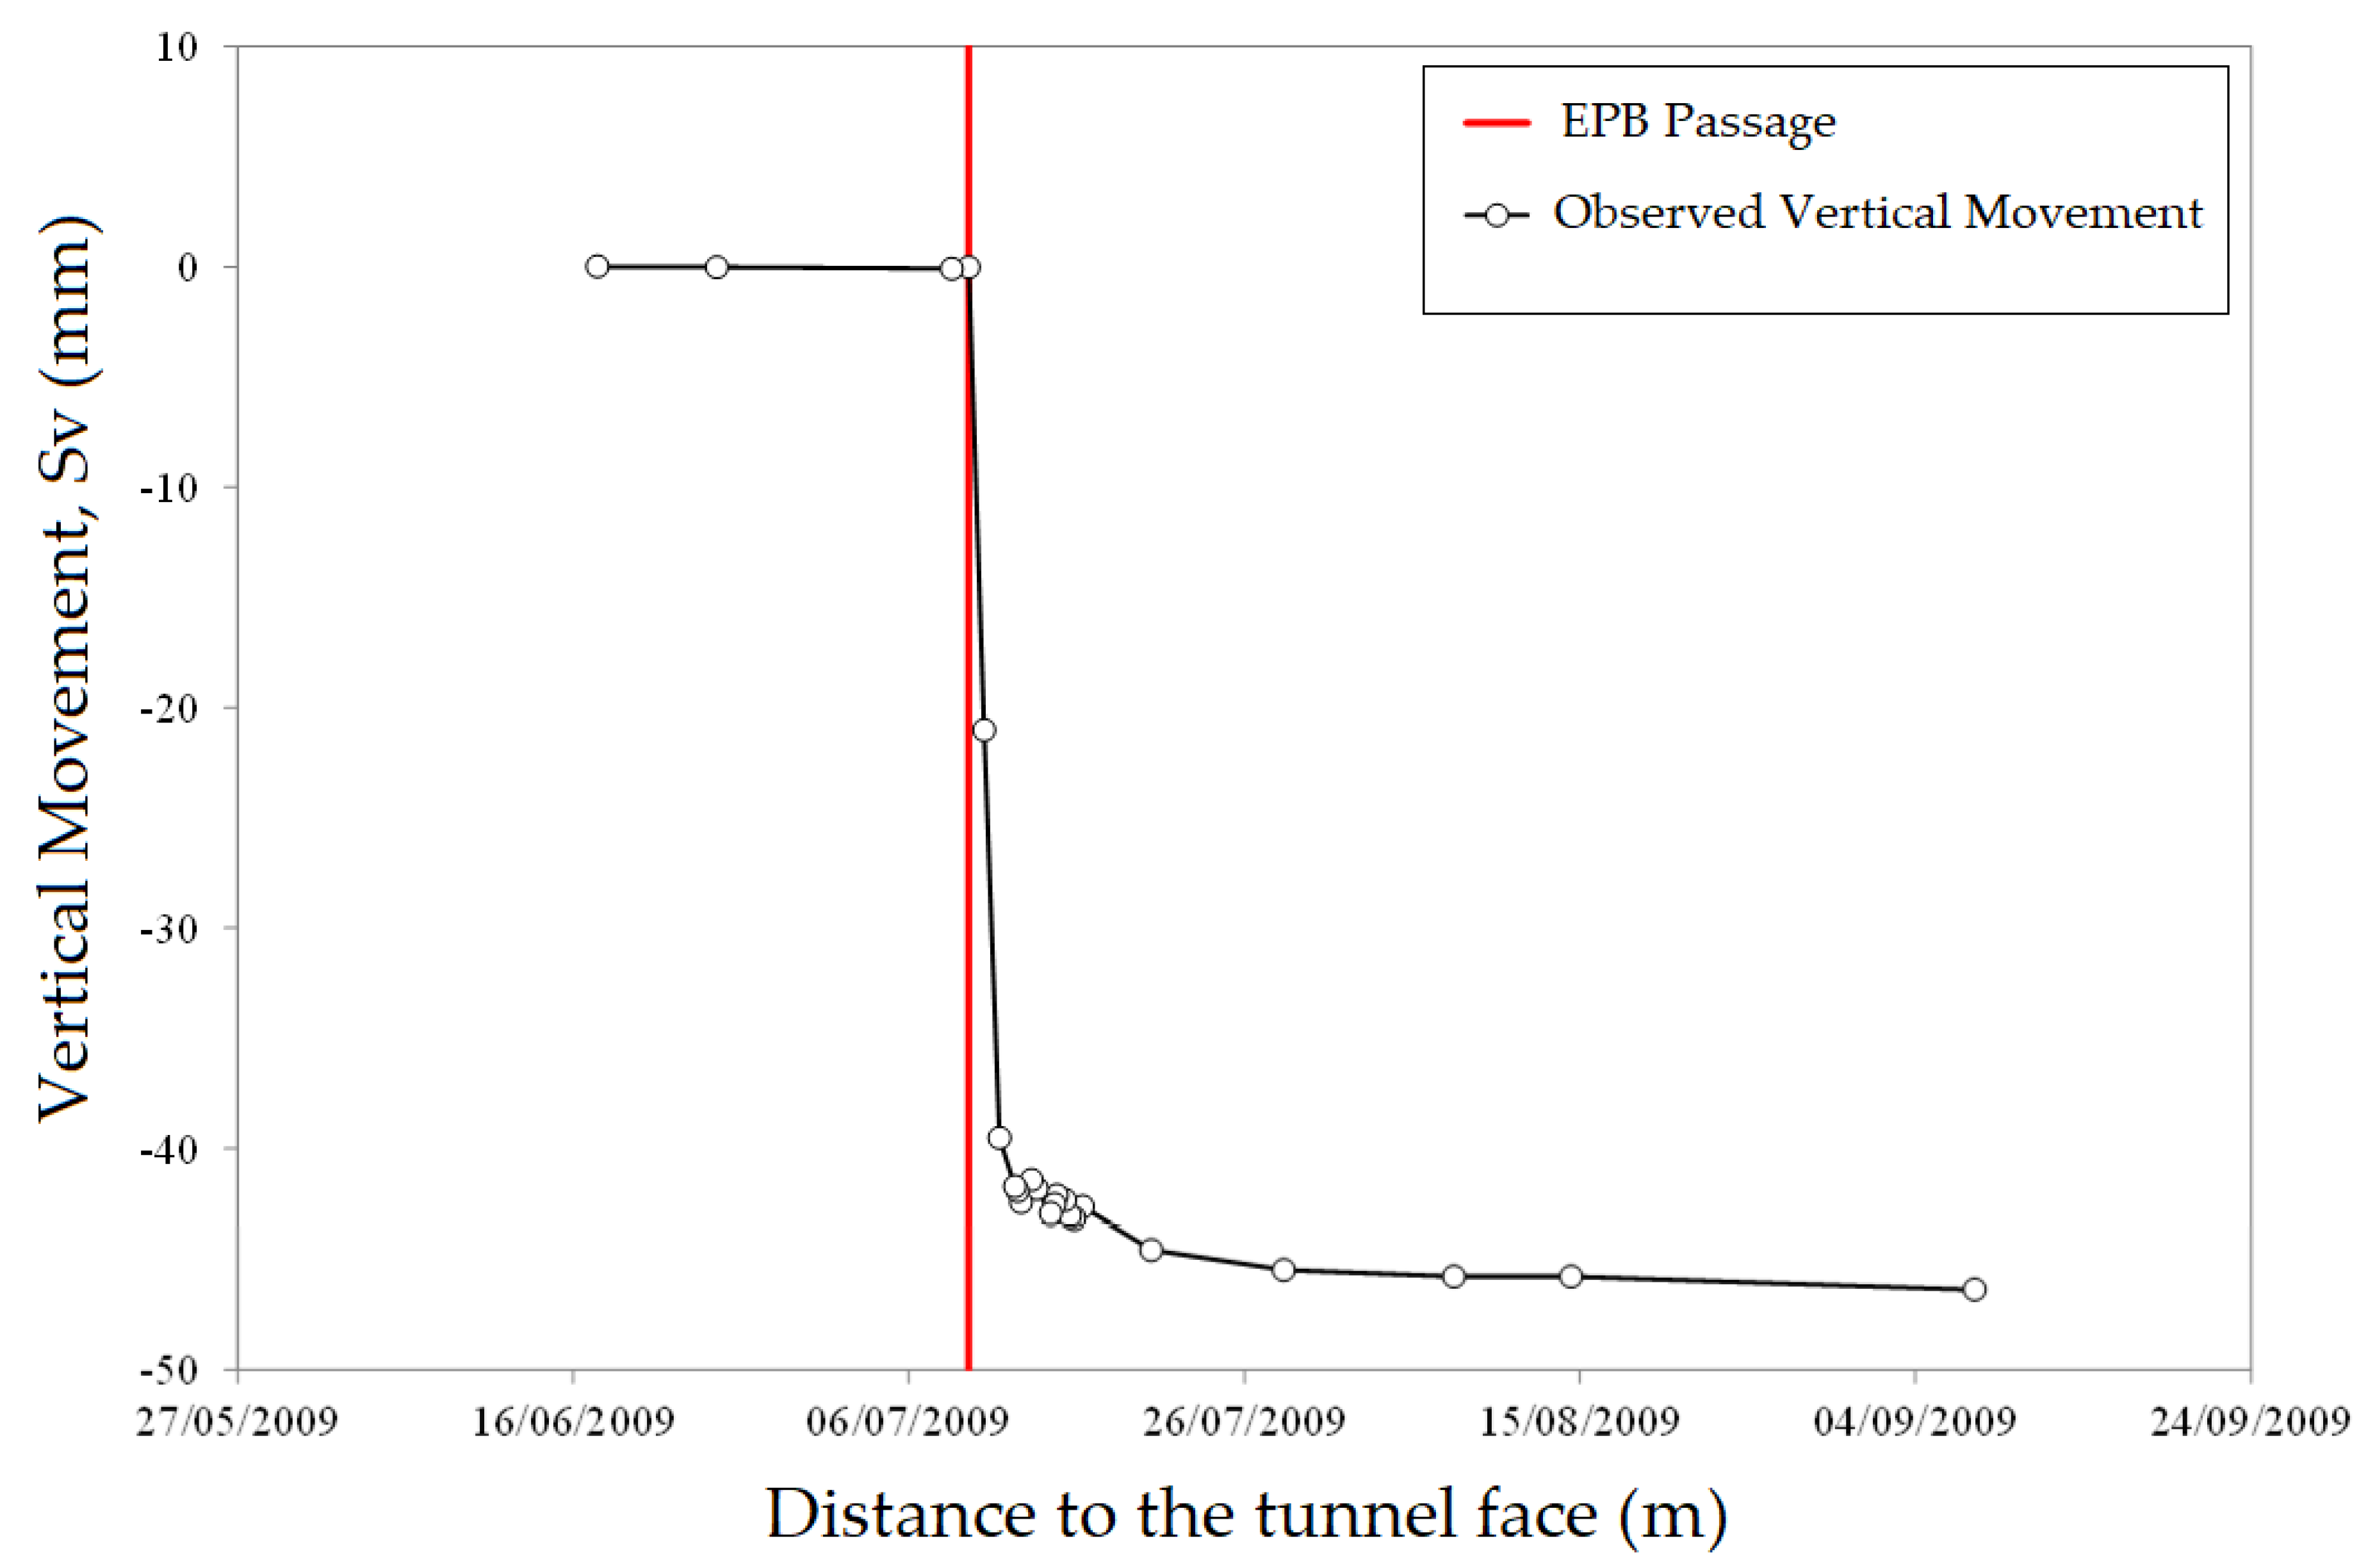
Figure 26 shows the total vertical settlement that resulted is S
vmax =-43.13 mm. We can see how the vertical settlement is immediate when crossing this less compacted area and increases very little in time.
Finally, mechanical and logistic problems such as failures in the conveyor belts of the material excavated outside the TBM, blockages with the lubrication grease pumps and problems with the segment driving crane contributed to a loss of ground volume somewhat higher than the average in all cases. Concerning the failure with the keystone drive, the loss of ground was 1.30%, due to a cutting wheel thrust higher than the average values, which caused, on the one hand, wear of the wheel cutters and, on the other hand, a stop in shaft 7A where the cutting tools were replaced.
5. Conclusions
The results of this study confirm that mechanized excavation with EPB shields is an effective tunneling method that minimizes ground movements and volume losses. The achieved average excavation rate was 26.37 m/day in deltaic soils, with minimal hyperbaric interventions and efficient tool maintenance during station and shaft accesses.
Monitoring data indicate that the majority of settlements occur when the TBM cutterhead is between 50 meters ahead and 100–300 meters behind the monitoring section. The largest portion of settlements is observed at the shield tail due to gap closure, extending up to 300 meters. Beyond 100 meters, vertical movements are negligible.
Ground volume loss remained consistently below 1%, typically under 0.5%, with K = 0.5 proving to be a representative value for deltaic soils. Higher losses were linked to specific factors such as TBM learning curves, grouting inefficiencies, face pressure drops, transitions at shafts and stations, logistical setbacks, and tool wear.
Operational parameters such as face pressure and grout injection volumes significantly influenced ground movements. While an increase in face pressure is generally expected to reduce ground volume loss, the limited variability of applied pressures during excavation constrained the ability to analyze this effect comprehensively. However, when face pressure was maintained between 1.8 and 3.2 bar, ground volume loss at the face rarely exceeded 0.20%, provided that TBM operational parameters were well controlled. Conversely, reductions in face pressure during hyperbaric interventions led to increased settlements.
The total closure of the annular gap (the space between the excavation diameter and the outer diameter of the shield tail) was found to be crucial for maintaining pressure stability and controlling grout injection volumes. Cases where injected grout volume was lower than the theoretical requirement resulted in increased settlements and higher ground volume loss. On the other hand, when the injected volume exceeded the theoretical value, ground volume loss rarely surpassed 0.5%.
Shaft entry and exit points posed the greatest challenge in controlling ground movements. The jet-grouting sealing system used in Section 1 was insufficient to fully prevent water ingress and fines migration, requiring frequent remedial injections. This led to significant delays in TBM advancement and increased settlement risks, potentially compromising adjacent structures.
Additionally, localized ground uplifts were observed due to over-excavation, excessive grout injection, and increased cutterhead thrust, particularly in shallow cover sections. In some instances, excessive ground volume loss was attributed not only to TBM operation but also to poorly compacted fill material, tool wear, and logistical challenges.
Ultimately, this study demonstrates that occurrences of high ground volume loss are typically the result of a combination of multiple factors, emphasizing the need for optimized TBM control strategies to minimize localized disturbances and ensure excavation stability.
Acknowledgments
The authors would like to thank Infraestructures de la Generalitat de Catalunya (Infraesructures.cat) under the collaboration of the International Centre for Numerical Methods in Engineering (CIMNE) and ALECTORS grant from the UPC and the RIIS research group.
References
- Antiga, A.; Chiorboli, M. Tunnel face stability and settlement control using earth pressure balance shield in cohesionless soil. In Geotechnical Aspects Underground Construction Soft Ground, Balkema, Shangai (China); H., Ng, Li, Eds.; Taylor & Francis Group; Shangai (China), 2009; pp. 365–371. [Google Scholar]
- Bel, J.; Branque, D.; Camus, T. Physical modelling of EPB TBM in dry sand and greenfield conditions. European Journal of Environmental and Civil Engineering 2022, 27(10), 3236–3259. [Google Scholar] [CrossRef]
- Berthoz, N.; Branque, D.; Subrin, D.; Wong, H. TBM soft ground interaction: Experimental study on a 1 g reduced-scale EPBS model. Tunnelling and Underground Space Technology 2018, 72, 189–209. [Google Scholar] [CrossRef]
- Bono, R.; et al. Surface settlement minimization in soft soil when excavating with an E.P.B.S. Jornada Técnica Túneles con EPB, UPC, Barcelona, Mayo 2008.
- Broere, W.; Brinkgreve, R. Phased simulation of a tunnel boring process in soft soil. In Numerical methods in geotechnical engineering; 2002; pp. 529–536. [Google Scholar]
- 6, Clough G.W.; Sweene, B.P.; Finno, R.J. Measured soil response to EPB shield tunnelling. ASCE J. Geotech. Eng. 1983, 109(2), 131–149. [Google Scholar]
- Cording, E. J. Control of ground movements around tunnels in soil. 2244. In Proc. 9th Pan-American Conf. Soil Mech. Found. Engng, Valparaiso; 1991; pp. 2195–2244. [Google Scholar]
- Dias, D.; Kastner, R. Movements caused by the excavation of tunnels using face pressurized shields—Analysis of monitoring and numerical modeling results. Engineering Geology 2013, 152(1), 17–25. [Google Scholar] [CrossRef]
- Dimmock, P. S. Tunnelling-Induced Ground and Building Movement on the Jubilee Line Extension; University of Cambridge, 2003. [Google Scholar]
- Do, N.A.; Dias, D.; Oreste, P.; Djeran-Maigre, I. Three-dimensional numerical simulation of a mechanized twin tunnels in soft ground. Tunnelling and Underground Space Technology 2014, 42, 40–51. [Google Scholar] [CrossRef]
- 11. Fargnoli, V.; Boldini, D.; Amorosi, A. TBM tunnelling-induced settlements in coarse-grained soils: The case of the new Milan underground line 5. Tunnelling and Underground Space Technology 2013, 38, 336–347. [Google Scholar] [CrossRef]
- Franza, A.; Marshall, A. M.; Zhou, B. Greenfield tunnelling in sands: The effects of soil density and relative depth. Geotechnique 2019, 69(4), 297–307. [Google Scholar] [CrossRef]
- Gens, A.; Mariano; Di, A.; Yubero, M. T. EPB tunneling in deltaic deposits : observations of ground movements. In book: Geotechnical Aspects of Underground Construction in Soft Ground; Viggiani, Giulia, Ed.; Publisher: Taylor & Francis Group, 2011. [Google Scholar]
- Kasper, T.; Meschke, G. A 3D finite element simulation model for TBM tunnelling in soft ground. International Journal for Numerical and Analytical Methods in Geomechanics 2004, 28(14), 1441–1460. [Google Scholar] [CrossRef]
- Kasper, T.; Meschke, G. On the influence of face pressure, grouting pressure and TBM design in soft ground tunnelling. Tunnelling and Underground Space Technology 2006, 21(2), 160–171. [Google Scholar] [CrossRef]
- Leca, E.; Leblais, Y.; Kuhnhenn, K. Underground works in soils and soft rock tunneling. International Journal on Geotechnical and Geological Engineering 2000, 1, 220–268. [Google Scholar]
- Lee, H.; Choi, H.; Choi, S.-W.; Chang, S.-H.; Kang, T.-H.; Lee, C. "Numerical Simulation of EPB Shield Tunnelling with TBM Operational Condition Control Using Coupled DEM–FDM. Applied Sciences 2021, 11(6), 2551. [Google Scholar]
- Lee, K.M.; Ji, H.W.; Shen, C.K.; Liu, J.H.; Bai, T.H. Ground response to the construction of Shanghai Metro Tunnel-Line 2. Soil and Foundations 1999, 39(3), 113–134. [Google Scholar]
- Lin, C. G.; Zhang, Z. M.; Wu, S. M.; Yu, F. Key techniques and important issues for slurry shield under-passing embankments: A case study of Hangzhou Qiantang River Tunnel. Tunnelling and Underground Space Technology 2013, 38, 306–325. [Google Scholar] [CrossRef]
- Mair, R.J.; Taylor, R. N. “Theme Lecture: Bored tunnelling inthe urban environment” Plenar Session 4. In Proc. 14th Int. Conf. on SMFE; Hamburg, 1997; Vol.4, pp. 2353–2385. [Google Scholar]
- Marshall, A. M.; Farrell, R. P.; Klar, A.; Mair, R. J. Tunnels in sands: The effect of size, depth, and volume loss on greenfield displacements. Geotechnique 2012, 62(5), 385–399. [Google Scholar] [CrossRef]
- Matsushita, Y.; Iwasaki, Y.; ashimoto, T.; Imanishi, H. Behaviour of subway tunnel driven by large slurry shield. In Underground Construction in Soft Ground; 1995; pp. 253–256. [Google Scholar]
- Medina, L. Estudio de los movimientos originados por la excavación de túneles con escudos de presión de tierras en los suelos tosquizos de Madrid. Thesis, University of La Coruña (Spain)., 2000. [Google Scholar]
- Melis, M.; Medina, L. Predicted versus measured soil movements induced by shield tunnelling in the Madrid Metro extension. Canadian Geotechnical Journal 2005, 42, 1160–1172. [Google Scholar]
- Melis, M.; Medina, L.; Rodriguez, J. M. Prediction and analysis of subsidence induced by shield tunnelling in the Madrid Metro extension. Canadian Geotechnical Journal 2002, 39(6), 1273–1287. [Google Scholar] [CrossRef]
- Mendaña, F. La construcción de túneles en terrenos mixtos con tuneladoras de gran diámetro. Experiencias recientes de algunas obras. Revista de Obras Públicas 2009, 65–78. [Google Scholar]
- Mollon, G.; Dias, D.; Soubra, A. H. Probabilistic analysis of tunneling-induced ground movements. Tunnelling and Underground Space Technology 2013, 37, 1–14. [Google Scholar]
- O´Reilly, M. P.; New, B. M. Settlements above tunnels in the U.K--their magnitude and prediction. Tunneling 1992, 82, 173–181. [Google Scholar]
- Pelizza, S.; Peila, D.; Grasso, P. TBM tunneling in difficult ground conditions. Geological Society, London, Engineering Geology Special Publications 2010, 25(1), 213–218. [Google Scholar]
- Phienwej, N.; Sirivachiraporn, A.; Timpong, S.; Tavaranum, S. Characteristics of Ground Movements from Shield. Tunnelling of the First Bangkok Subway Line, (February) 2006, (February), 319–330. [Google Scholar]
- Shirlaw, J. N.; Ong, J. C. W.; Rosser, H. B.; Tan, C. G.; Osborne, N. H.; Heslop, P. E. Local settlements and sinkholes due to EPB tunnelling. In Proceedings of the Institution of Civil Engineers, Geotechnical Engineering; 2003; 156, pp. 193–211. [Google Scholar]
- Sirivachiraporn, A.; Phienwej, N. Ground movements in EPB shield tunneling of Bangkok subway project and impacts on adjacent buildings. Tunnelling and Underground Space Technology 2012, 30, 10–24. [Google Scholar] [CrossRef]
- Suwansawat, S. Earth pressure balance (EPB) shield tunneling in Bangkok: Ground Response and Prediction of Surface Settlements Using Artificial Neural Networks; Massachusetts Institute of Technology: Cambridge, MA, 2002. [Google Scholar]
- Talmon, A.M.; Bezuijen, A. Backfill grouting research at Groene Hart Tunne. In International Symposium on Geotechnical Aspects of Undergroung Construction in Soft Ground; Ng, G. B., Huang, C.C.W., Lui, H.W., Eds.; Shanghai: Taylor & Francis Group; London, 2009; pp. 349–356. [Google Scholar]
- Yubero, M.T. Ejecución de túneles en terreno deltaico mediante tuneladora EPB. El caso de la Línea 9. PhD thesis, Universitat Politècnica de Catalunya, Barcelona, 2021. [Google Scholar]
- Yubero, M. T.; Bonet, E. Ground Surface Effect of Earth Pressure Balance Tunnelling in Deltaic Deposits: A Case Study of Line 9 of the Barcelona Metro. Sustainability 2024, 16(18), 8275. [Google Scholar] [CrossRef]
- Wongsaroj, J. Three-dimensional finite element analysis of short and long-term ground response to open-face tunnelling in stiff clay. PhD thesis, University of Cambridge, 2005. [Google Scholar]
- Wongsaroj, J.; Borghi, F.X.; Soga, K.; Mair, R.J.; Sugiyama, T.; Hagiwara, T.; Bowers, K.H. Effect of TBM driving parameters on ground surface movements. In Proceedings of the International Symposium on Geotechnical Aspects of Underground Construction in Soft Ground; 2005; pp. 5–7. [Google Scholar]
- Wongsaroj, A.; Borghi, F. X.; Soga, K.; Mair, R. J.; Sugiyama, T.; Hagiwara, T.; Bowers, K. H. Effect of TBM driving parameters on ground surface movements: Channel Tunnel Rail Link Contract 220. Geotechnique 2006, 56(9), 641–655. [Google Scholar] [CrossRef]
- Xu, Q.; Zhu, H.; Ding, W.; Ge, X. Laboratory model tests and field investigations of EPB shield machine tunneling in soft ground in Shanghai. Tunnelling and Underground Space Technology 2011, 26(1), 1–14. [Google Scholar] [CrossRef]
- Zhang, D.; Ng, C. W. W. Effects of stress-induced anisotropy and structure on undrained behavior of reconstituted and intact soft clay. Journal of Geotechnical and Geoenvironmental Engineering 2015, 141(5), 04015012. [Google Scholar]
Figure 1.
Section 1 of Line 9 Metro between Terminal entre pistes and Parc Logistic.
Figure 1.
Section 1 of Line 9 Metro between Terminal entre pistes and Parc Logistic.
Figure 2.
Sketch geological profile along the tunnel route of Contract T1.
Figure 2.
Sketch geological profile along the tunnel route of Contract T1.
Figure 3.
a) Tunnel section of 9.40 m diameter double lane at level used in Section 1 b) EPB machine of 9.40 m diameter used in Section 1 between Mas Blau and Terminal Entre Pistes stations.
Figure 3.
a) Tunnel section of 9.40 m diameter double lane at level used in Section 1 b) EPB machine of 9.40 m diameter used in Section 1 between Mas Blau and Terminal Entre Pistes stations.
Figure 4.
Stops and interventions carried out for the revision and change of cutting tools in relation to the excavation progress Section between Mas Blau and Parc Logístic stations.
Figure 4.
Stops and interventions carried out for the revision and change of cutting tools in relation to the excavation progress Section between Mas Blau and Parc Logístic stations.
Figure 5.
Progress of the tunnel boring machine in Section 1 between Mas Blau station and Terminal entre pistes.
Figure 5.
Progress of the tunnel boring machine in Section 1 between Mas Blau station and Terminal entre pistes.
Figure 6.
Settlement control systems (Paymacotas, 2008).
Figure 6.
Settlement control systems (Paymacotas, 2008).
Figure 7.
Seating control systems through applied pressures (Paymacotas, 2008).
Figure 7.
Seating control systems through applied pressures (Paymacotas, 2008).
Figure 8.
Injection of bentonite and grouting into the shield and shields' tail.
Figure 8.
Injection of bentonite and grouting into the shield and shields' tail.
Figure 9.
Ground vertical movement versus face distance at pK 4+150 (3945 excavated meters) and settlement components of settlement.
Figure 9.
Ground vertical movement versus face distance at pK 4+150 (3945 excavated meters) and settlement components of settlement.
Figure 10.
Vertical settlement on the ground surface during the passage of the EPB along Section 1.
Figure 10.
Vertical settlement on the ground surface during the passage of the EPB along Section 1.
Figure 11.
Vertical total settlement on the ground surface along the route of the tunnel in Section 1.
Figure 11.
Vertical total settlement on the ground surface along the route of the tunnel in Section 1.
Figure 12.
Long-term evolution of ground volume loss in Section 1.
Figure 12.
Long-term evolution of ground volume loss in Section 1.
Figure 13.
Loss ratio of total ground volume to the normalised face pressure as a function of the overburden pressure.
Figure 13.
Loss ratio of total ground volume to the normalised face pressure as a function of the overburden pressure.
Figure 14.
Total ground loss as a function of the injected volume of grouting together with construction problems.
Figure 14.
Total ground loss as a function of the injected volume of grouting together with construction problems.
Figure 15.
Loss ratio of ground volume and pressure at the excavation face and tail as a function of meters excavated.
Figure 15.
Loss ratio of ground volume and pressure at the excavation face and tail as a function of meters excavated.
Figure 16.
Evolution of the loss of ground volume in Line 9 of the Barcelona Metro with causes that led to a greater loss of ground outside the excavation process.
Figure 16.
Evolution of the loss of ground volume in Line 9 of the Barcelona Metro with causes that led to a greater loss of ground outside the excavation process.
Figure 17.
Time (in minutes) of the different TBM processes vs. volume loss.
Figure 17.
Time (in minutes) of the different TBM processes vs. volume loss.
Figure 18.
a) Tunnel in plan of the shaft 3 of Section 1. b) Cross-section B-B’ c) Longitudinal section A-A’.
Figure 18.
a) Tunnel in plan of the shaft 3 of Section 1. b) Cross-section B-B’ c) Longitudinal section A-A’.
Figure 19.
a) Cutting wheel force, penetration and cutting wheel PAR. b) Working pressure, extracted material and grout injection (average values per ring) in Shaft 4 of Section 1 of Line 9.
Figure 19.
a) Cutting wheel force, penetration and cutting wheel PAR. b) Working pressure, extracted material and grout injection (average values per ring) in Shaft 4 of Section 1 of Line 9.
Figure 20.
Location of the surface levelling points on the ground near one of the maintenance shafts of Section 1.
Figure 20.
Location of the surface levelling points on the ground near one of the maintenance shafts of Section 1.
Figure 21.
Movements recorded by the tunnel surface markers in the vicinity of Shaft 5.
Figure 21.
Movements recorded by the tunnel surface markers in the vicinity of Shaft 5.
Figure 23.
a) Pressure applied at the front with respect to time b) Weight of excavated and extracted material with respect to time at the exit of the San Cosme station.
Figure 23.
a) Pressure applied at the front with respect to time b) Weight of excavated and extracted material with respect to time at the exit of the San Cosme station.
Figure 24.
a) Grout injection pressure and volume b) Loss of ground volume at the beginning of the excavation works of the Guster and Hades TBMs.
Figure 24.
a) Grout injection pressure and volume b) Loss of ground volume at the beginning of the excavation works of the Guster and Hades TBMs.
Figure 25.
Geological profile of the kilometre point PK 8+400 of the layout of Section 1 of Line 9.
Figure 25.
Geological profile of the kilometre point PK 8+400 of the layout of Section 1 of Line 9.
Figure 26.
Longitudinal profile of the seat at KP 8+400 of the layout of Section 1 of Line 9.
Figure 26.
Longitudinal profile of the seat at KP 8+400 of the layout of Section 1 of Line 9.
Table 1.
Average excavation values recorded during tunnel construction.
Table 1.
Average excavation values recorded during tunnel construction.
| Excavation parameter |
Average value |
| Pressure at the excavation face (bar) |
2.6 |
| Bentonite injection Pressure (bar) |
2.0 |
| Bentonite injection Volume (m3) |
1.0-2.5 |
| Tail Pressure (bar) |
3.1 |
| Grouting injection Volume (m3) |
8.23 |
| Machine Stops/ring (min) |
178 |
| Installation ring Time (min) |
19 |
| Drilling Time /ring (min) |
28 |
| Cycle Time /ring (min) |
225 |
| Wheel thrust Force (kN) |
6217.57 |
| Propulsion Force (kN) |
25600 |
| PAR (kNm) |
4475 |
| Ratio Advance (mm/min) |
63 |
| Penetration (mm/rpm) |
53 |
| Excavation chamber Temperature (ºC) |
29.5 |
|
Disclaimer/Publisher’s Note: The statements, opinions and data contained in all publications are solely those of the individual author(s) and contributor(s) and not of MDPI and/or the editor(s). MDPI and/or the editor(s) disclaim responsibility for any injury to people or property resulting from any ideas, methods, instructions or products referred to in the content. |
© 2025 by the authors. Licensee MDPI, Basel, Switzerland. This article is an open access article distributed under the terms and conditions of the Creative Commons Attribution (CC BY) license (http://creativecommons.org/licenses/by/4.0/).