1. Introduction
Branched-chain amino acids (BCAAs), comprising leucine (Leu), isoleucine (Ile), and valine (Val), are essential amino acids that must be obtained through dietary sources [
1,
2]. BCAAs are among the most abundant amino acids in proteins and play pivotal roles in protein synthesis, as well as key serving as carbon and nitrogen sources in metabolic pathways [
3]. Maintaining a precise balance between BCAAs intake and metabolism is critical for physiological health.
Aberrant metabolism or incomplete oxidation of BCAAs, particularly Ile and Val, has been associated with catabolic stress and impaired mitochondrial function [
4]. Multiple studies conducted on mammals, including humans, have shown that feeding high-fructose diets combined with elevated BCAAs levels increased cardiac myocyte apoptosis in mice [
5]. Similarly, excessive BCAAs intake has been linked to adverse effects such as insulin resistance and mitochondrial dysfunction [
4,
6]. Conversely, other studies have highlighted the beneficial effects of BCAAs supplementation, including reduced muscle damage biomarkers and alleviated muscle soreness [
7,
8,
9,
10,
11,
12,
13,
14]. Diets with appropriate BCAAs levels have also been shown to promote metabolic health in rodents and humans by enhancing hepatic insulin sensitivity, inhibiting hepatic fat production, reducing protein degradation, and increasing energy expenditure [
15,
16,
17,
18].
Spotted seabass (
Lateolabrax maculatus) is a carnivorous marine fish of significant economic value in China. However, feeding carnivorous fish high-carbohydrate diets has been shown to increase liver glycogen accumulation, lipid deposition, liver damage, and disrupt in glucose metabolism [
19,
20,
21]. Similarly, prolonged high-fat diets intake impair lipid transport, compromise liver function, and can lead to fatty liver disease, threatening the physiological health of fish [
22,
23,
24].
Given these challenges, spotted seabass serves as an excellent model for studying amino acid metabolism in fish. To better understand the metabolic effects of BCAAs in aquaculture species, this study investigated the impacts of BCAAs on the mitochondria of spotted seabass hepatocytes under high-glucose or high-fat conditions. Using isolated hepatocytes, the study aimed to elucidate the metabolic response of farmed fish to BCAAs, providing valuable insights into the regulation of BCAAs metabolism in marine fish.
2. Materials and Methods
2.1. Model Establishment
The cells used in this study were derived from a spotted seabass hepatocyte cell line, which was established through tissue block migration and multiple passages during the initial culture stages and maintained in our laboratory. Before the experiment, the cells were cultured in DMEM/F12 medium supplemented with 20% fetal bovine serum and 1% penicillin-streptomycin at 28°C under 5% CO2 conditions. Prior to experimental treatments, the cells were grown to 70-80% confluence.
The experiment consisted of six experimental groups: control, high glucose (HG), HG + BCAAs (Leu 0.8 mM, Ile 0.4 mM, Val 0.8 mM), high fat (HF), and HF + BCAAs (Leu 0.8 mM, Ile 0.8 mM, Val 0.8 mM) groups, with three replicates per group. The control group was cultured in standard DMEM/F12 medium. The HG group was cultured in DMEM/F12 medium supplemented with 40 mM glucose [
25], while the HF group was cultured in DMEM/F12 medium containing 0.1 mM fatty acids (prepared by mixing oleic acid and palmitic acid at a ratio of 1:1 from a 10 mM stock solution) [
26] for 72 h. Following the treatments, the supernatant was collected. The cells were then washed twice with PBS, harvested using trypsin digestion, and washed again twice with PBS before further analysis.
2.2. Measurement of Indicators
2.2.1. Cellular Biochemical Analyses
Hepatocytes were seeded in 6-well cell culture plates and cultured until stable adhesion was achieved before initiating the experimental treatments. After treatments, cells were collected for subsequent analyses. Glycogen content in each group was measured using Nanjing Jiancheng reagent kits (A043-1-1), following the manufacturer's instructions.
Cell culture supernatants were collected and centrifuged at 4°C at 1000 r/min for 10 minutes to separate the supernatant. Alanine aminotransferase (ALT) and aspartate aminotransferase (AST) levels were quantified using Nanjing Jiancheng reagent kits following the provided protocols.
Hepatocytes were seeded in 24-well cell culture plates and cultured until stable adhesion was achieved prior to experimental treatments. After treatment, the culture medium was removed, and the cells were washed twice with PBS. The cells were then fixed with Oil Red O fixative for 20-30 minutes. Following fixation, the fixative was discarded, and the cells were washed twice with distilled water. To prepare for staining, 60% isopropanol was added for 20-30 seconds and then discarded. Freshly prepared Oil Red O staining solution was applied, and the cells were stained for 10-20 minutes. After removing the staining solution, the cells were washed with 60% isopropanol for 20-30 seconds until the interstitial spaces were clear. This was followed by 2-5 washes with distilled water. For nuclear counterstaining, Mayer's hematoxylin staining solution was applied for 1-2 minutes. The staining solution was then discarded, and the cells were washed 2-5 times with distilled water. Subsequently, Oil Red O buffer was applied for 1 minute and discarded. Finally, distilled water was added to cover the cells, and they were observed under an optical microscope (DM5000B, Leica).
2.2.2. Oxidative Stress-Related Indicators
Measurement of Antioxidant and Oxidative Stress Markers
Superoxide dismutase (SOD, A001-3-2) and catalase (CAT, A007-1-1) activities, malondialdehyde (MDA, A03-1-2) concentration, and total antioxidant capacity (T-AOC, A015-2-1) in hepatocytes were assessed using Nanjing Jiancheng reagent kits, according to the manufacturer’s instructions.
Measurement of Reactive Oxygen Species (ROS) Concentration
After cell collection, the samples were washed twice with PBS. A DCFH-DA probe, diluted 1:1000 in serum-free culture medium, was added to the cells. The samples were incubated at 37°C for 20 minutes, followed by three washes with serum-free culture medium. Finally the cells were analyzed quantitatively using a flow cytometer (CytoFLEX, Beckman Coulter).
2.2.3. Key Enzymatic Activities in Hepatocyte Metabolism
The activities of citrate synthase (CS, BC1065), α-ketoglutarate dehydrogenase (α-KGDHC, BC0715), succinate dehydrogenase (SDH, BC0955), phosphoenolpyruvate carboxykinase (PEPCK, BC3315), and lipase (LPS, BC2345) in hepatocytes were measured using reagent kits from Beijing Solebao Technology Co., Ltd.
Fatty acid synthase (FAS, H231-1-1) activity and ATP (S0027) content in hepatocytes were assessed using reagent kits from Nanjing Jiancheng Co., Ltd. and Biyun Tian Biotechnology Co., Ltd., respectively.
2.2.4. Mitochondrial Status
Mitochondrial Membrane Potential Detection
Cells were cultured in 6-well plates and allowed to adhere stably before undergoing experimental treatments. At the end of the experiment, the cells were collected and resuspended in 0.5 ml of cell culture medium. An equal volume (0.5 ml) of JC-1 staining working solution was added, and the mixture was gently inverted several times to ensure thorough mixing. The cells were incubated at 37°C in a cell culture incubator for 20 minutes. Following incubation, the cells were centrifuged at 600 ×g for 3-4 minutes at 4°C, and the pellet was collected. The cells were washed twice with JC-1 staining buffer and resuspended in 1 ml of the same buffer. This process was repeated twice, involving centrifuging at 600 ×g for 3-4 minutes at 4°C, discarding the supernatant, and resuspending the cells in JC-1 staining buffer. Finally, the cells were resuspended in an appropriate volume of JC-1 staining buffer and analyzed using a flow cytometer (CytoFLEX, Beckman Coulter).
Mitochondrial Activity Staining
Cells were cultured on glass coverslips (cell climbing slices). After the experimental treatments, the cell culture medium was removed, and Mito-Tracker Red CMXRos (C1035, Beyotime) working solution was added. The cells were incubated at 37°C for 15-30 minutes. Following incubation, the Mito-Tracker Red CMXRos working solution was removed, and the cells were stained with culture medium containing 1X Hoechst 33342 (C1027, Beyotime) live-cell staining solution. The cells were incubated at room temperature for 10 minutes. The staining solution was aspirated, and the cells were washed 2-3 times with PBS. An appropriate amount of anti-fluorescence quenching mounting medium was then applied. A coverslip was placed over the cells, which were subsequently observed using a laser confocal microscope (TCSSP8, Leica).
DNA Damage Detection
Cells were cultured on glass coverslip. Following experimental treatment, the medium was removed, and the cells were washed once with PBS. Then, 1 ml of fixing solution was added, and the cells were fixed for 5-15 minutes. After fixation, the fixing solution was aspirated, and the cells were washed three times with washing solution, with each wash lasting 3-5 minutes. Subsequently, 1 ml of immunostaining blocking solution was added, and the cells were blocked at room temperature for 10-20 minutes. The blocking solution was aspirated, and 1 ml of γ-H2AX mouse monoclonal antibody was added. The cells were incubated at room temperature for 1 hour. After incubation, the antibody solution was carefully removed, and the cells were washed three times with washing solution, each wash lasting 5-10 minutes. Next, 1 ml of anti-mouse 488 was added, and the cells were incubated at room temperature for 1 hour. Following this, the secondary antibody was aspirated, and the cells were washed twice with washing solution, with each wash lasting 5-10 minutes. For Nuclear staining, 1 ml of DAPI staining solution was added, and the cells were stained at room temperature for approximately 5 minutes. The staining solution was then aspirated, and the cells were washed three times with washing solution, with each wash lasting 3-5 minutes. Finally, an appropriate amount of anti-fluorescence quenching mounting medium was applied. A coverslip was placed over the cells, which were then observed under a laser confocal microscope (TCSSP8, Leica).
2.2.5. Fluorescence Quantification
Total RNA was extracted using the Trizol method, following the manufacturer's instructions. RNA concentration and purity were assessed using a microplate spectrophotometer at an absorbance ratio of 260/280 nm. The integrity of the RNA was confirmed through 1% agarose gel electrophoresis. To eliminate genomic DNA contamination, RNA samples were treated with RQ1 RNase-Free DNase. cDNA synthesis was performed using the Novozyme kit, in accordance with the manufacturer’s protocol.
Real-time fluorescence quantitative PCR (qPCR) was conducted using the SYBR Green I fluorescence method on a QuantStudio Flex real-time PCR system (Thermo Scientific). The cycling conditions were set according to the kit instructions. Primer sequences were designed using Primer 5.0 software and synthesed by Shanghai Shenggong Biological Engineering Co., Ltd. The relative expression of target genes was calculated using the 2−ΔΔCt method, with β-actin as the reference gene. The amplification efficiency of primers was validated for both the target and the reference genes. Each reaction was performed in triplicate to ensure accuracy. The primer sequences used in this study are listed in
Table 1.
2.3. Data Analysis
Variance analysis was performed using SPSS version 23.0. Statistical significance was assessed through one-way ANOVA or t-test. Differences among the experimental groups were evaluated using Dunnett's Test for multiple comparisons. Results are presented as the mean ± standard deviation (SD), with statistical significance set at P < 0.05.
3. Results
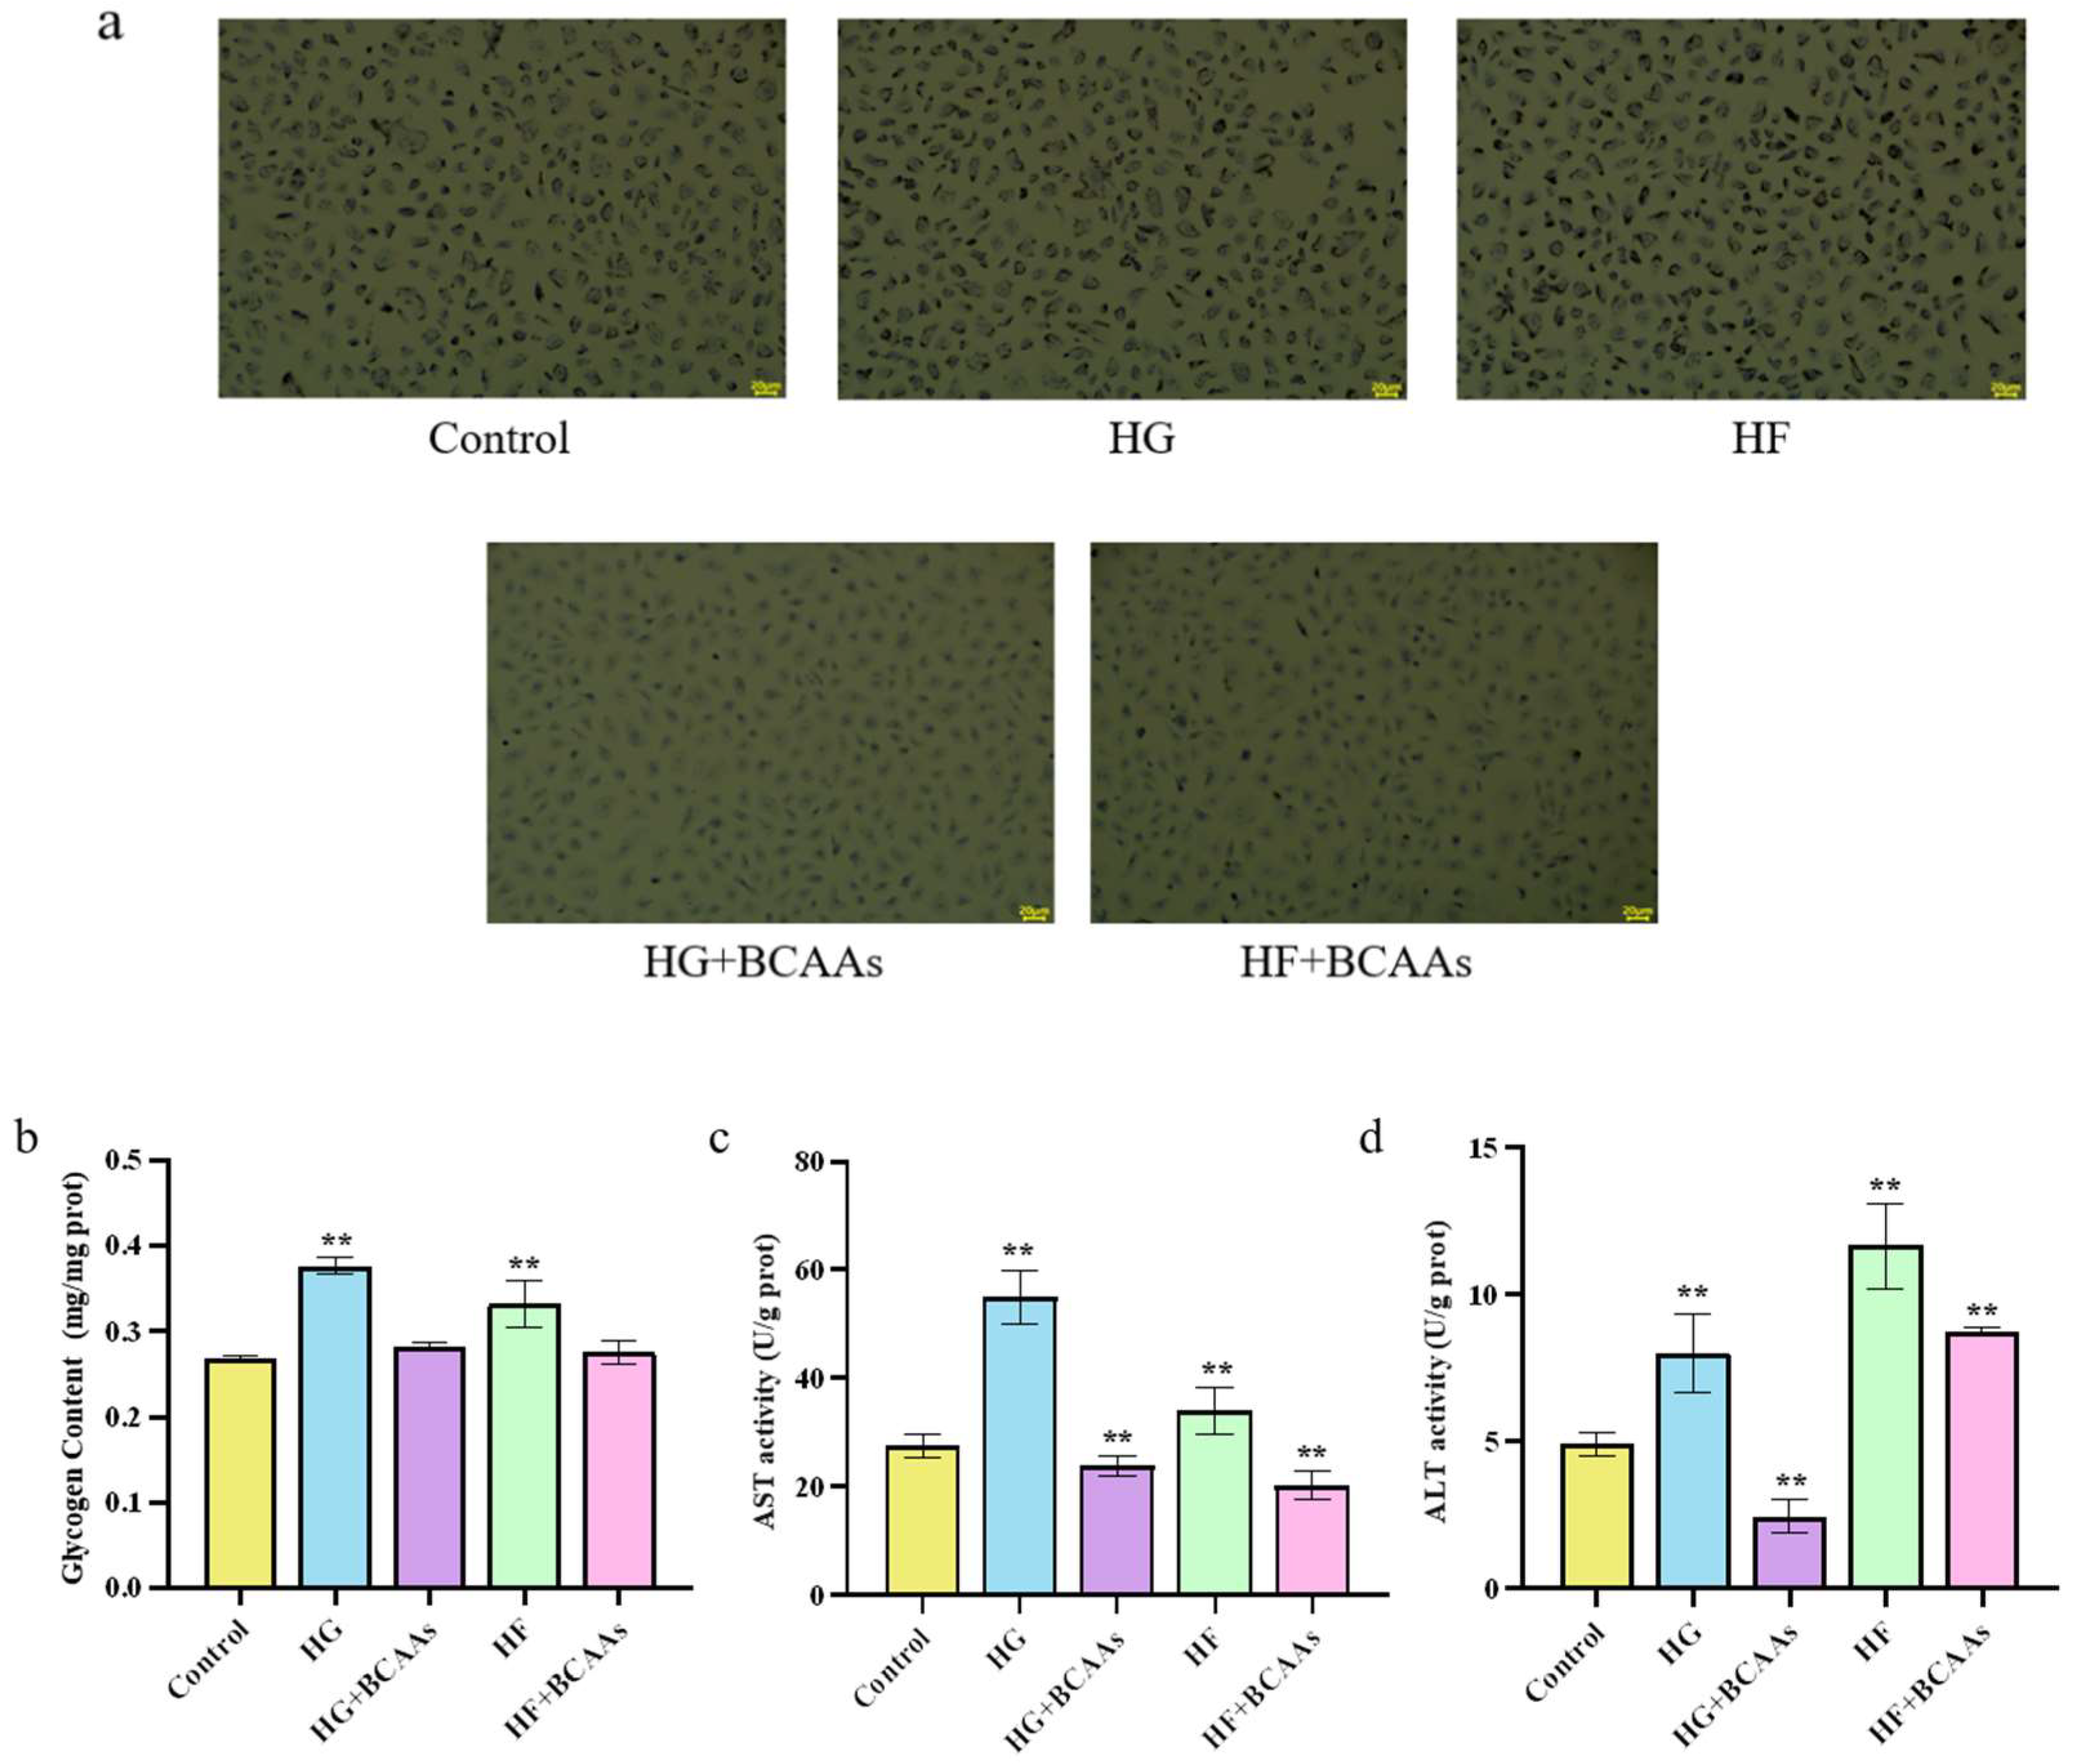
3.1. Cellular Biochemistry
The addition of BCAAs during cell culture effectively alleviated lipid droplet formation and reduced glycogen accumulation in hepatocytes induced by high-glucose or high-fat exposure. Furthermore, ALT and AST activities in the culture medium were significantly lower in the BCAAs-treated group compared to the HG and HF groups (
P <0.05;
Figure 1).
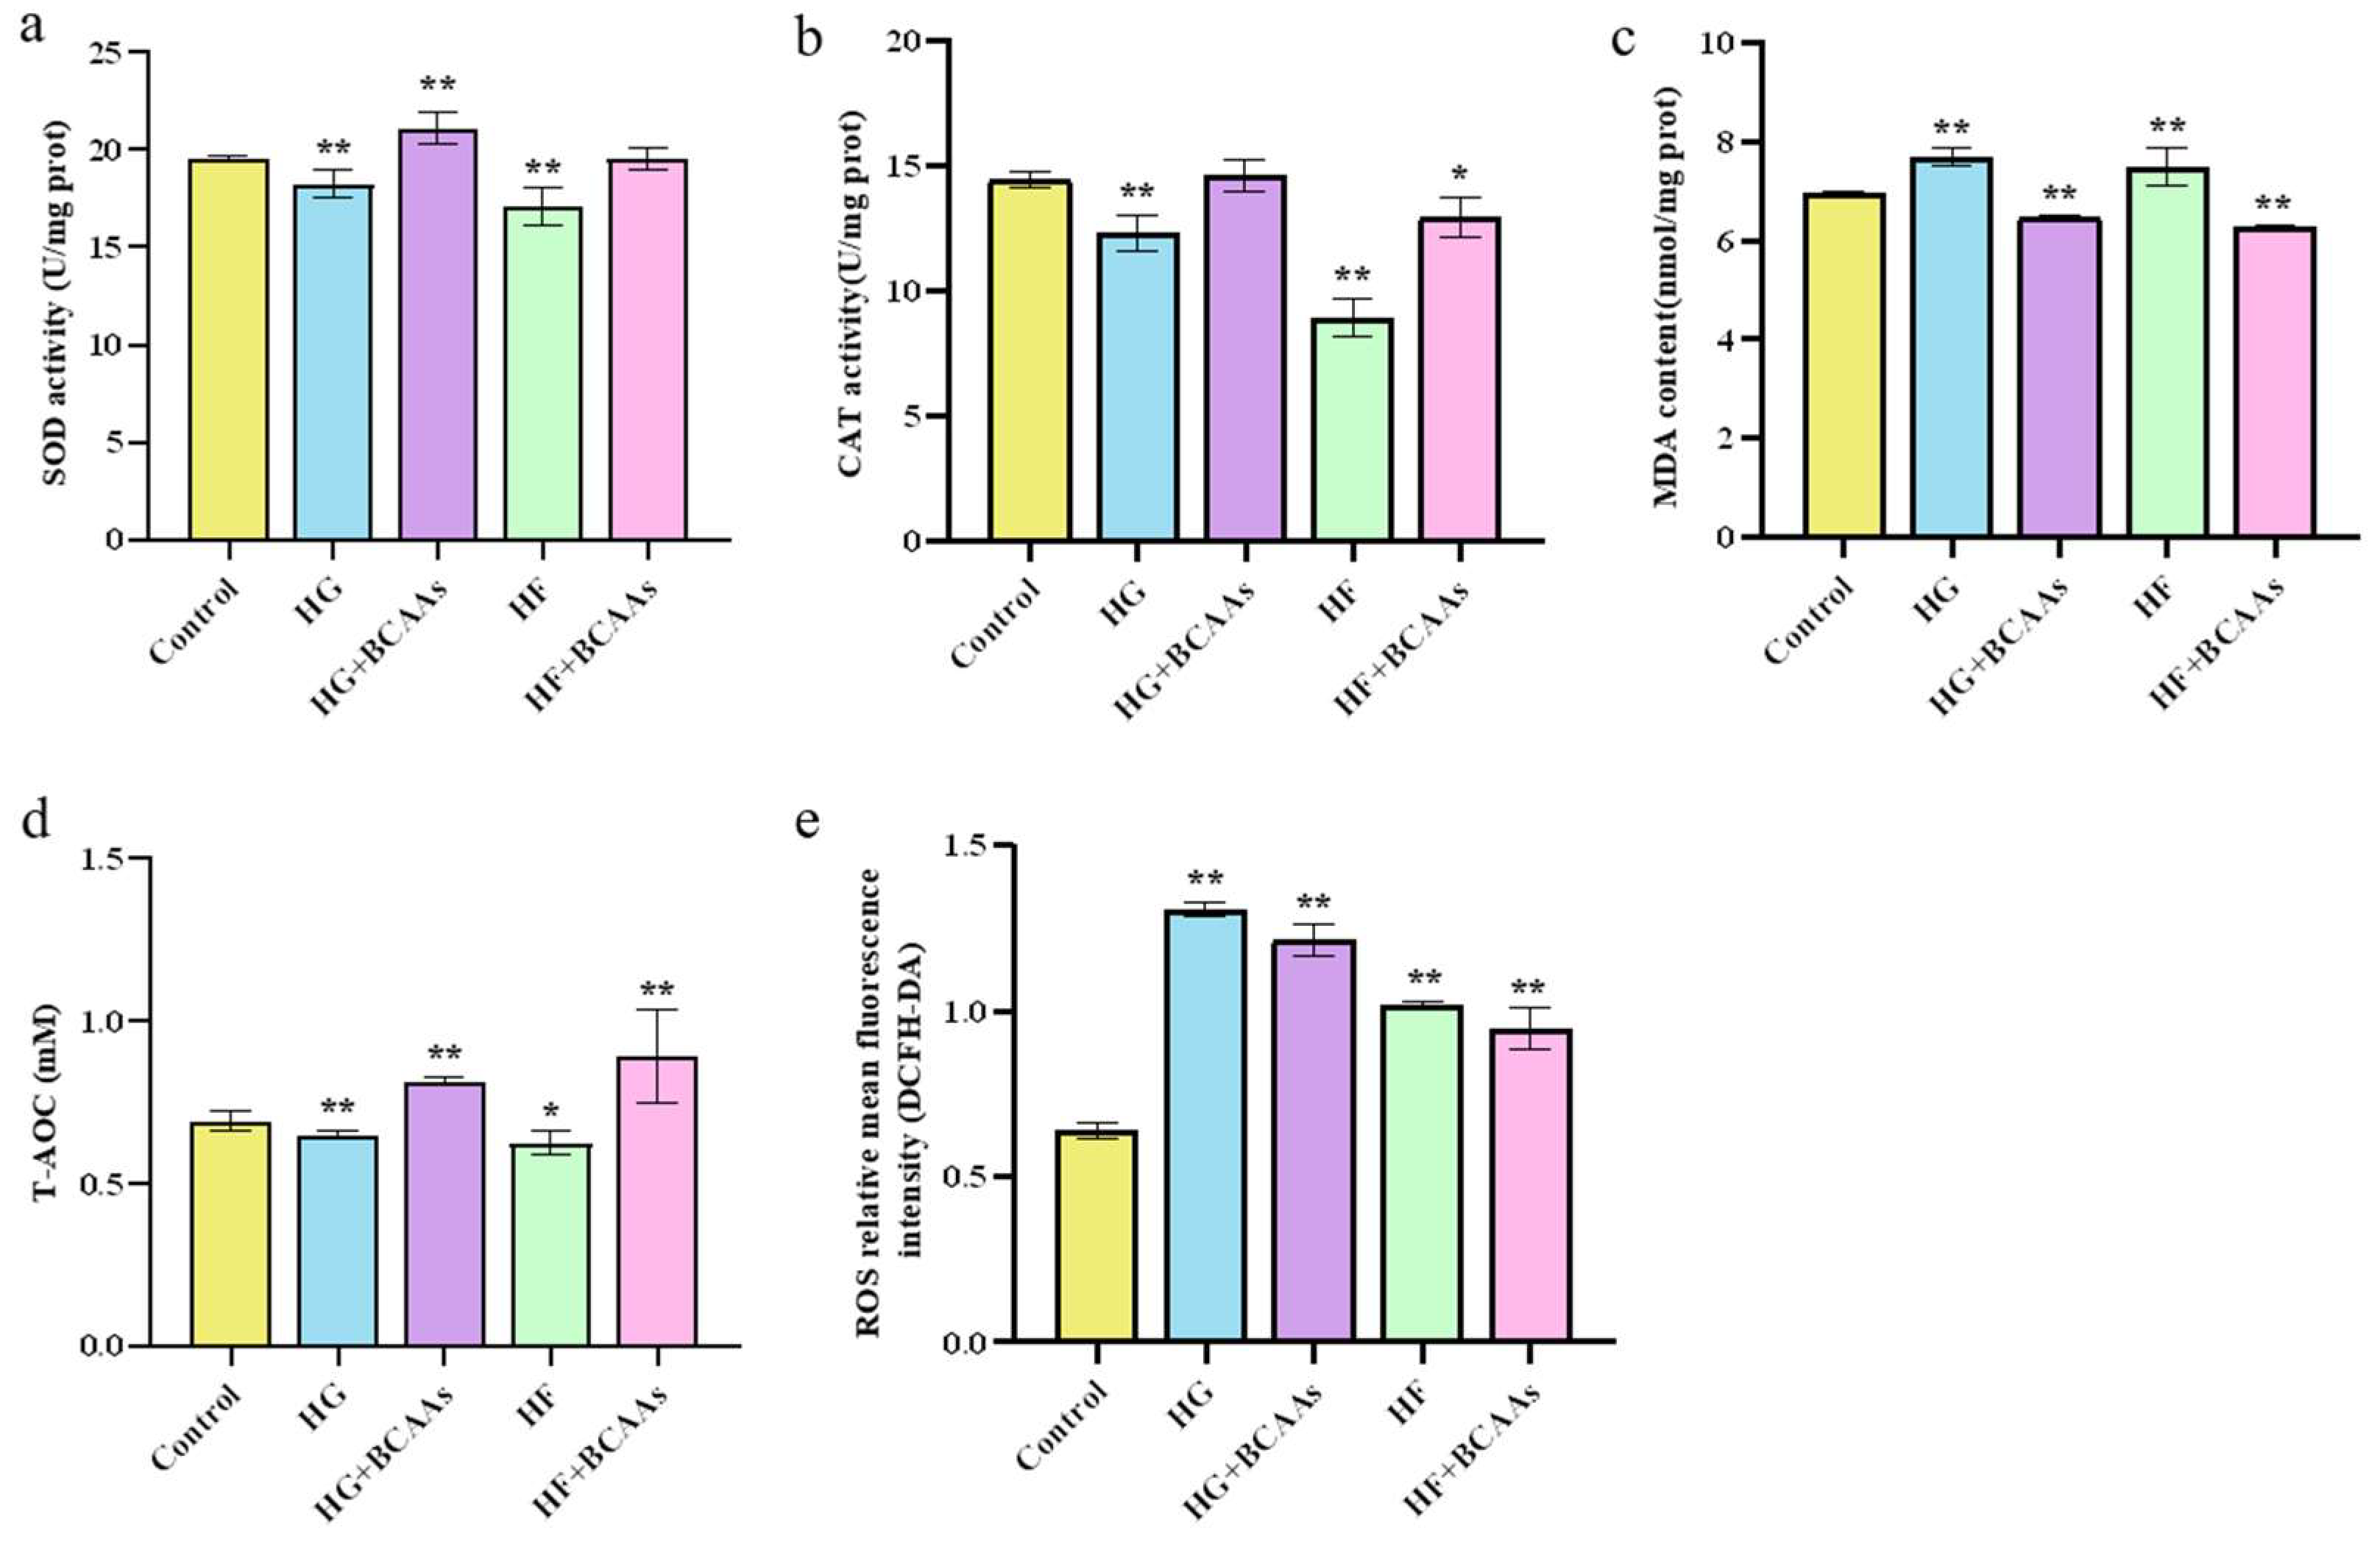
3.2. Cellular Antioxidant Defense
As shown in
Figure 2, BCAAs supplementation under high-glucose or high-fat conditions significantly enhanced SOD activity (
P < 0.05), and T-AOC (
P < 0.05) in hepatocytes. Additionally, it markedly reduced MDA content (
P < 0.05) and decreased the ROS production.
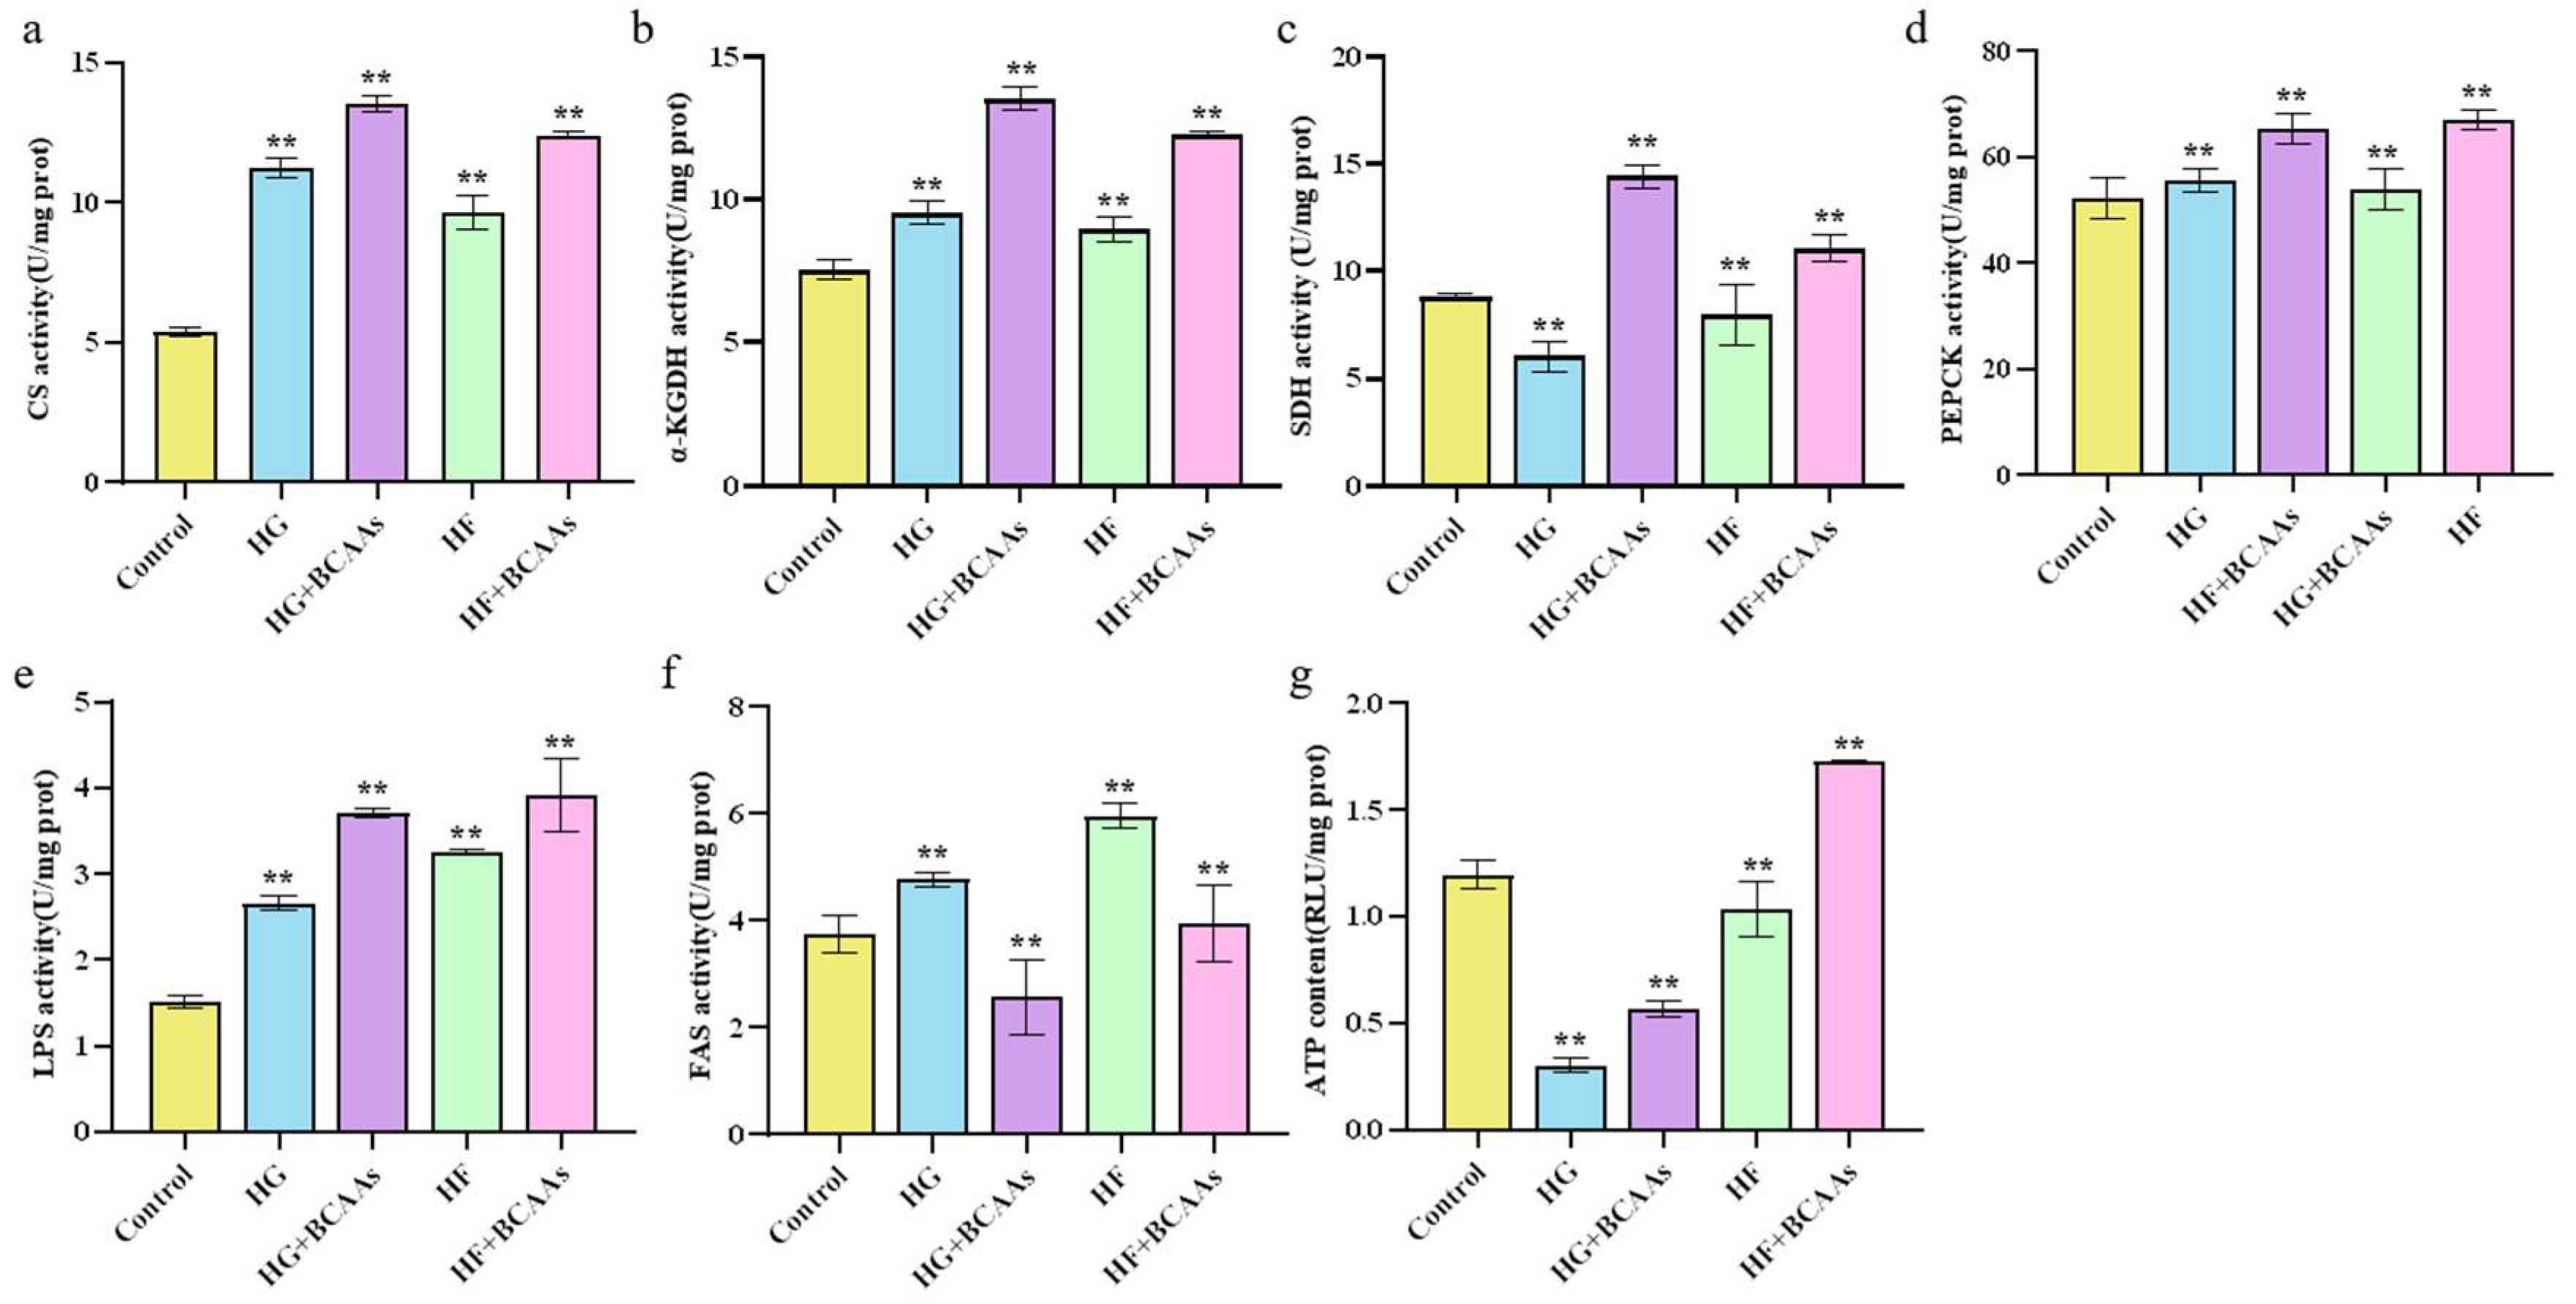
3.3. Cellular Metabolism
The activity of key metabolic enzymes involved in the citric acid cycle is presented in
Figure 3. Under high-glucose or high-fat conditions, BCAAs supplementation significantly increased the activity of CS, α-KGDHC, SDH, PEPCK, and LPS (
P < 0.05) while reducing FAS activity (
P < 0.05). This was accompanied by a significant increase in ATP content (
P < 0.05).
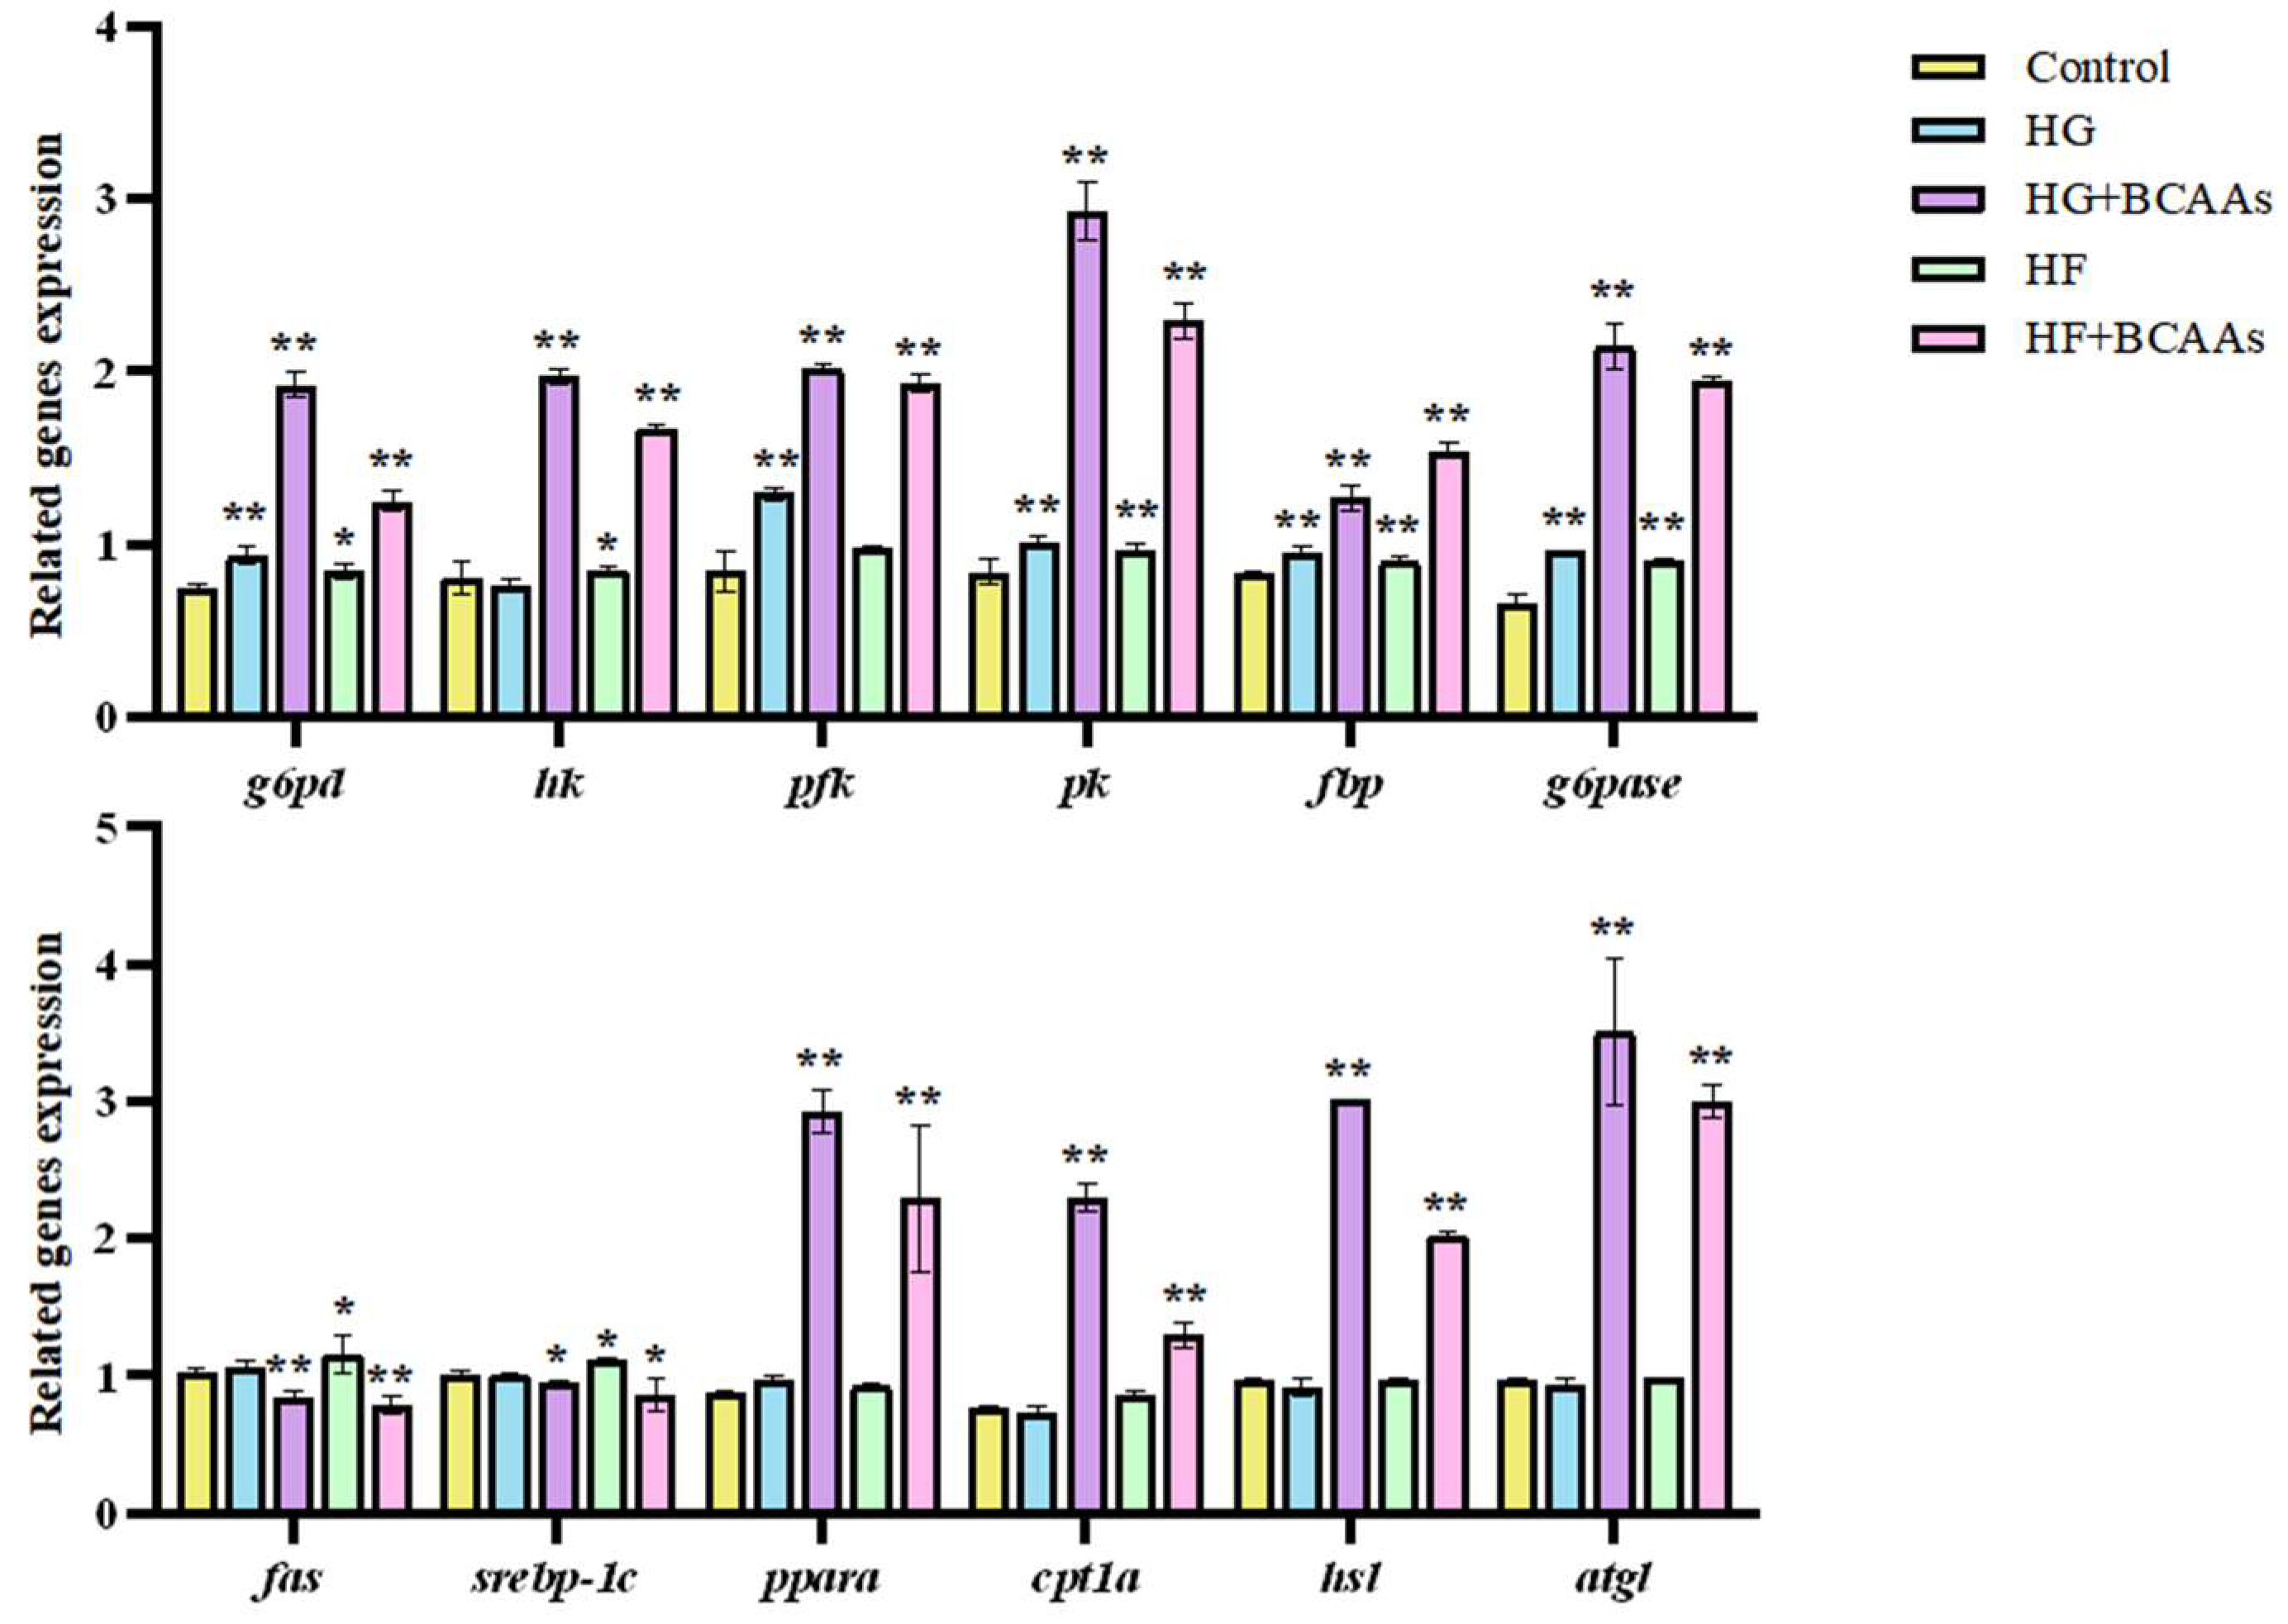
The expression of genes related to glucose and lipid metabolism in hepatocytes is shown in
Figure 4. Compared to the control group, BCAAs supplementation significantly downregulated the expression of lipogenic genes
fas and
srebp-1c (
P<0.05), while significantly upregulating the expression of lipolytic genes
ppaα and
atgl (
P < 0.05). Furthermore, genes involved in glucose metabolism, including
g6pd,
hk,
pfk,
pk,
fbp, and
g6pase, were significantly upregulated (
P < 0.05).
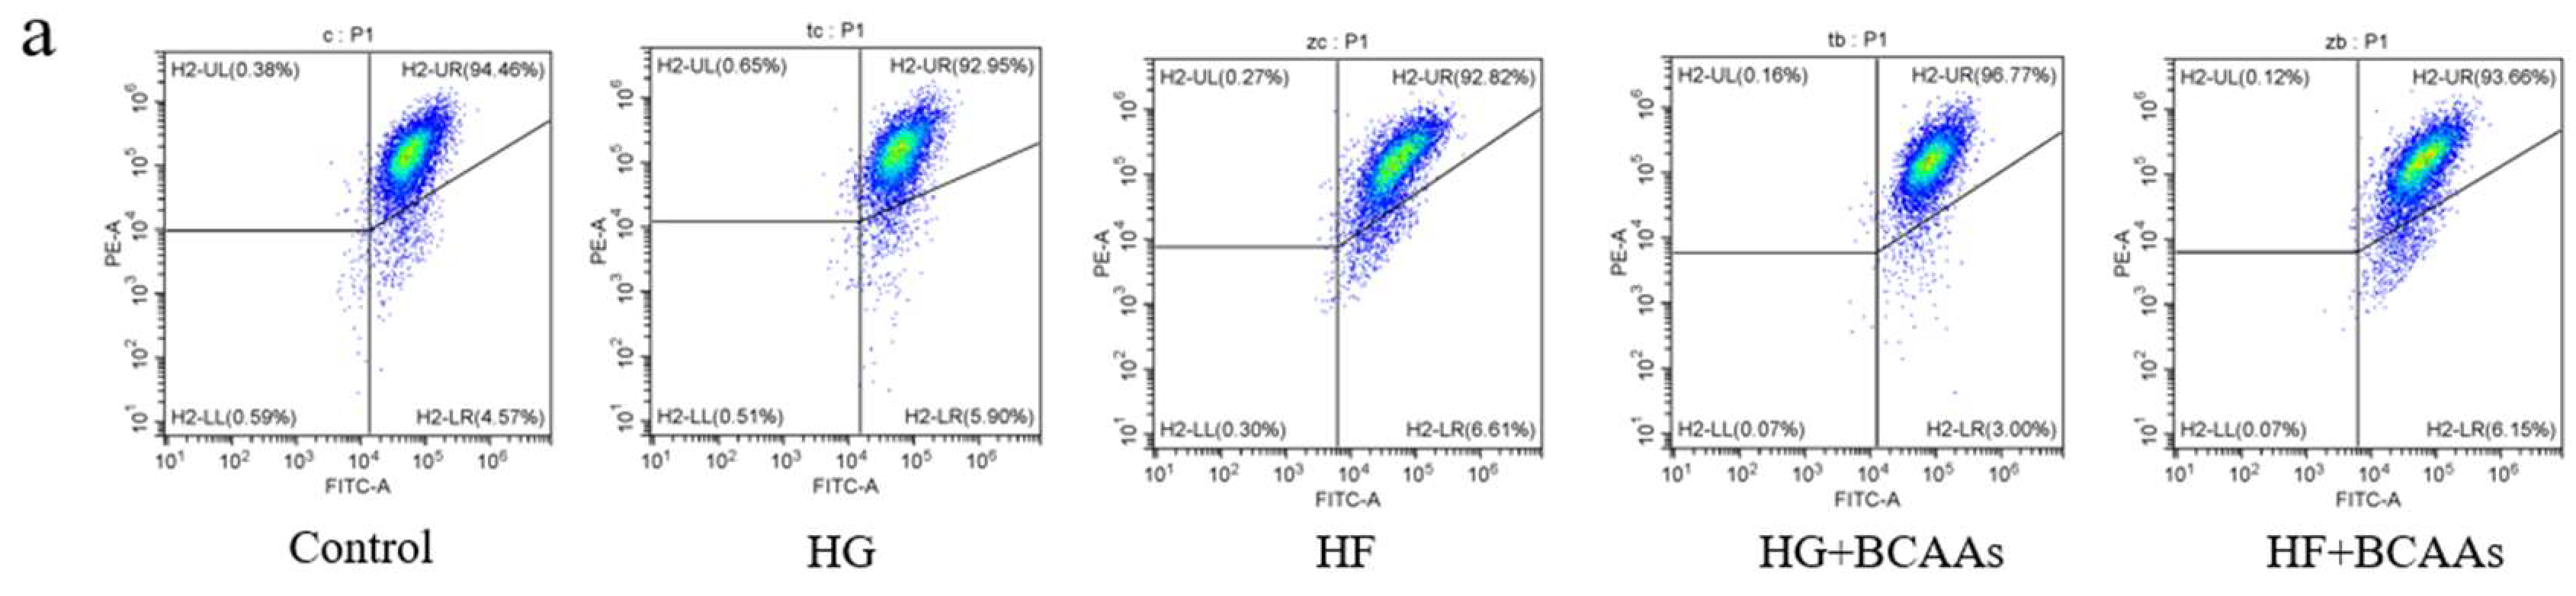
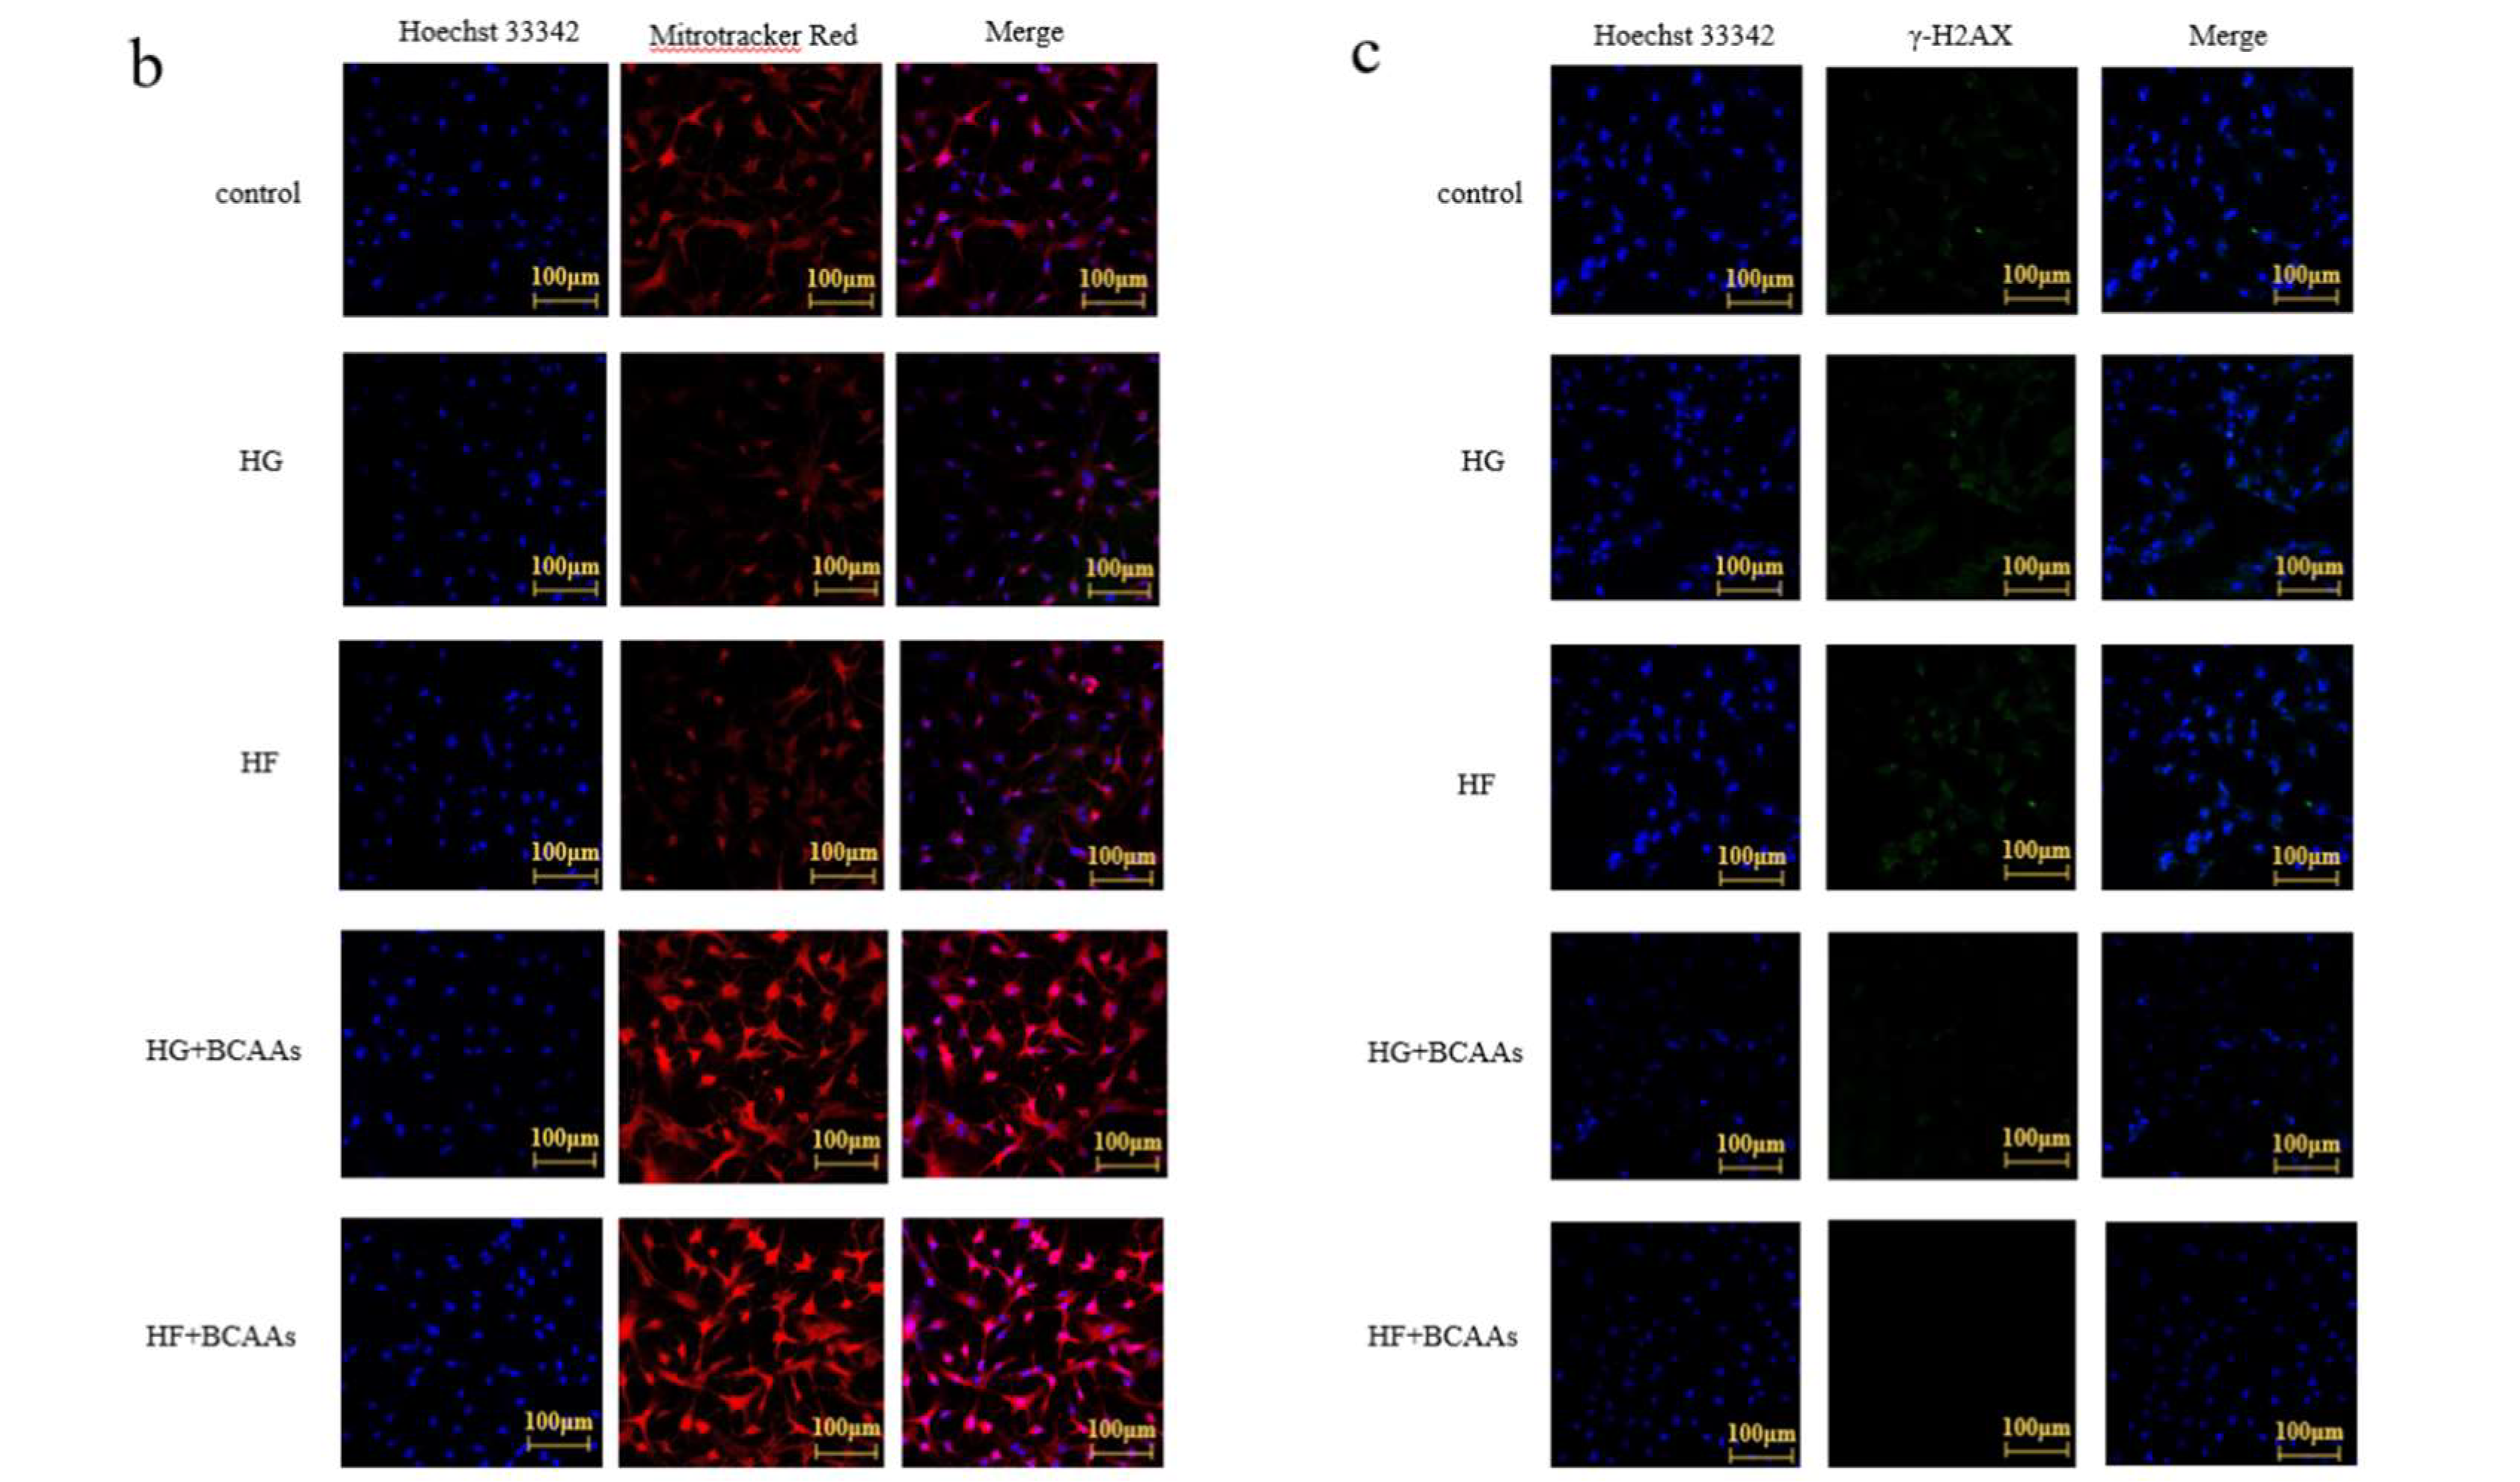
3.4. Mitochondrial Function
The effects of BCAAs supplementation on the mitochondrial membrane potential of
L. maculatus are shown in
Figure 5. BCAAs incorporation alleviated the reduction in membrane potential induced by high-glucose or high-fat conditions, enhanced mitochondrial activity, and reduced DNA damage in hepatocytes.
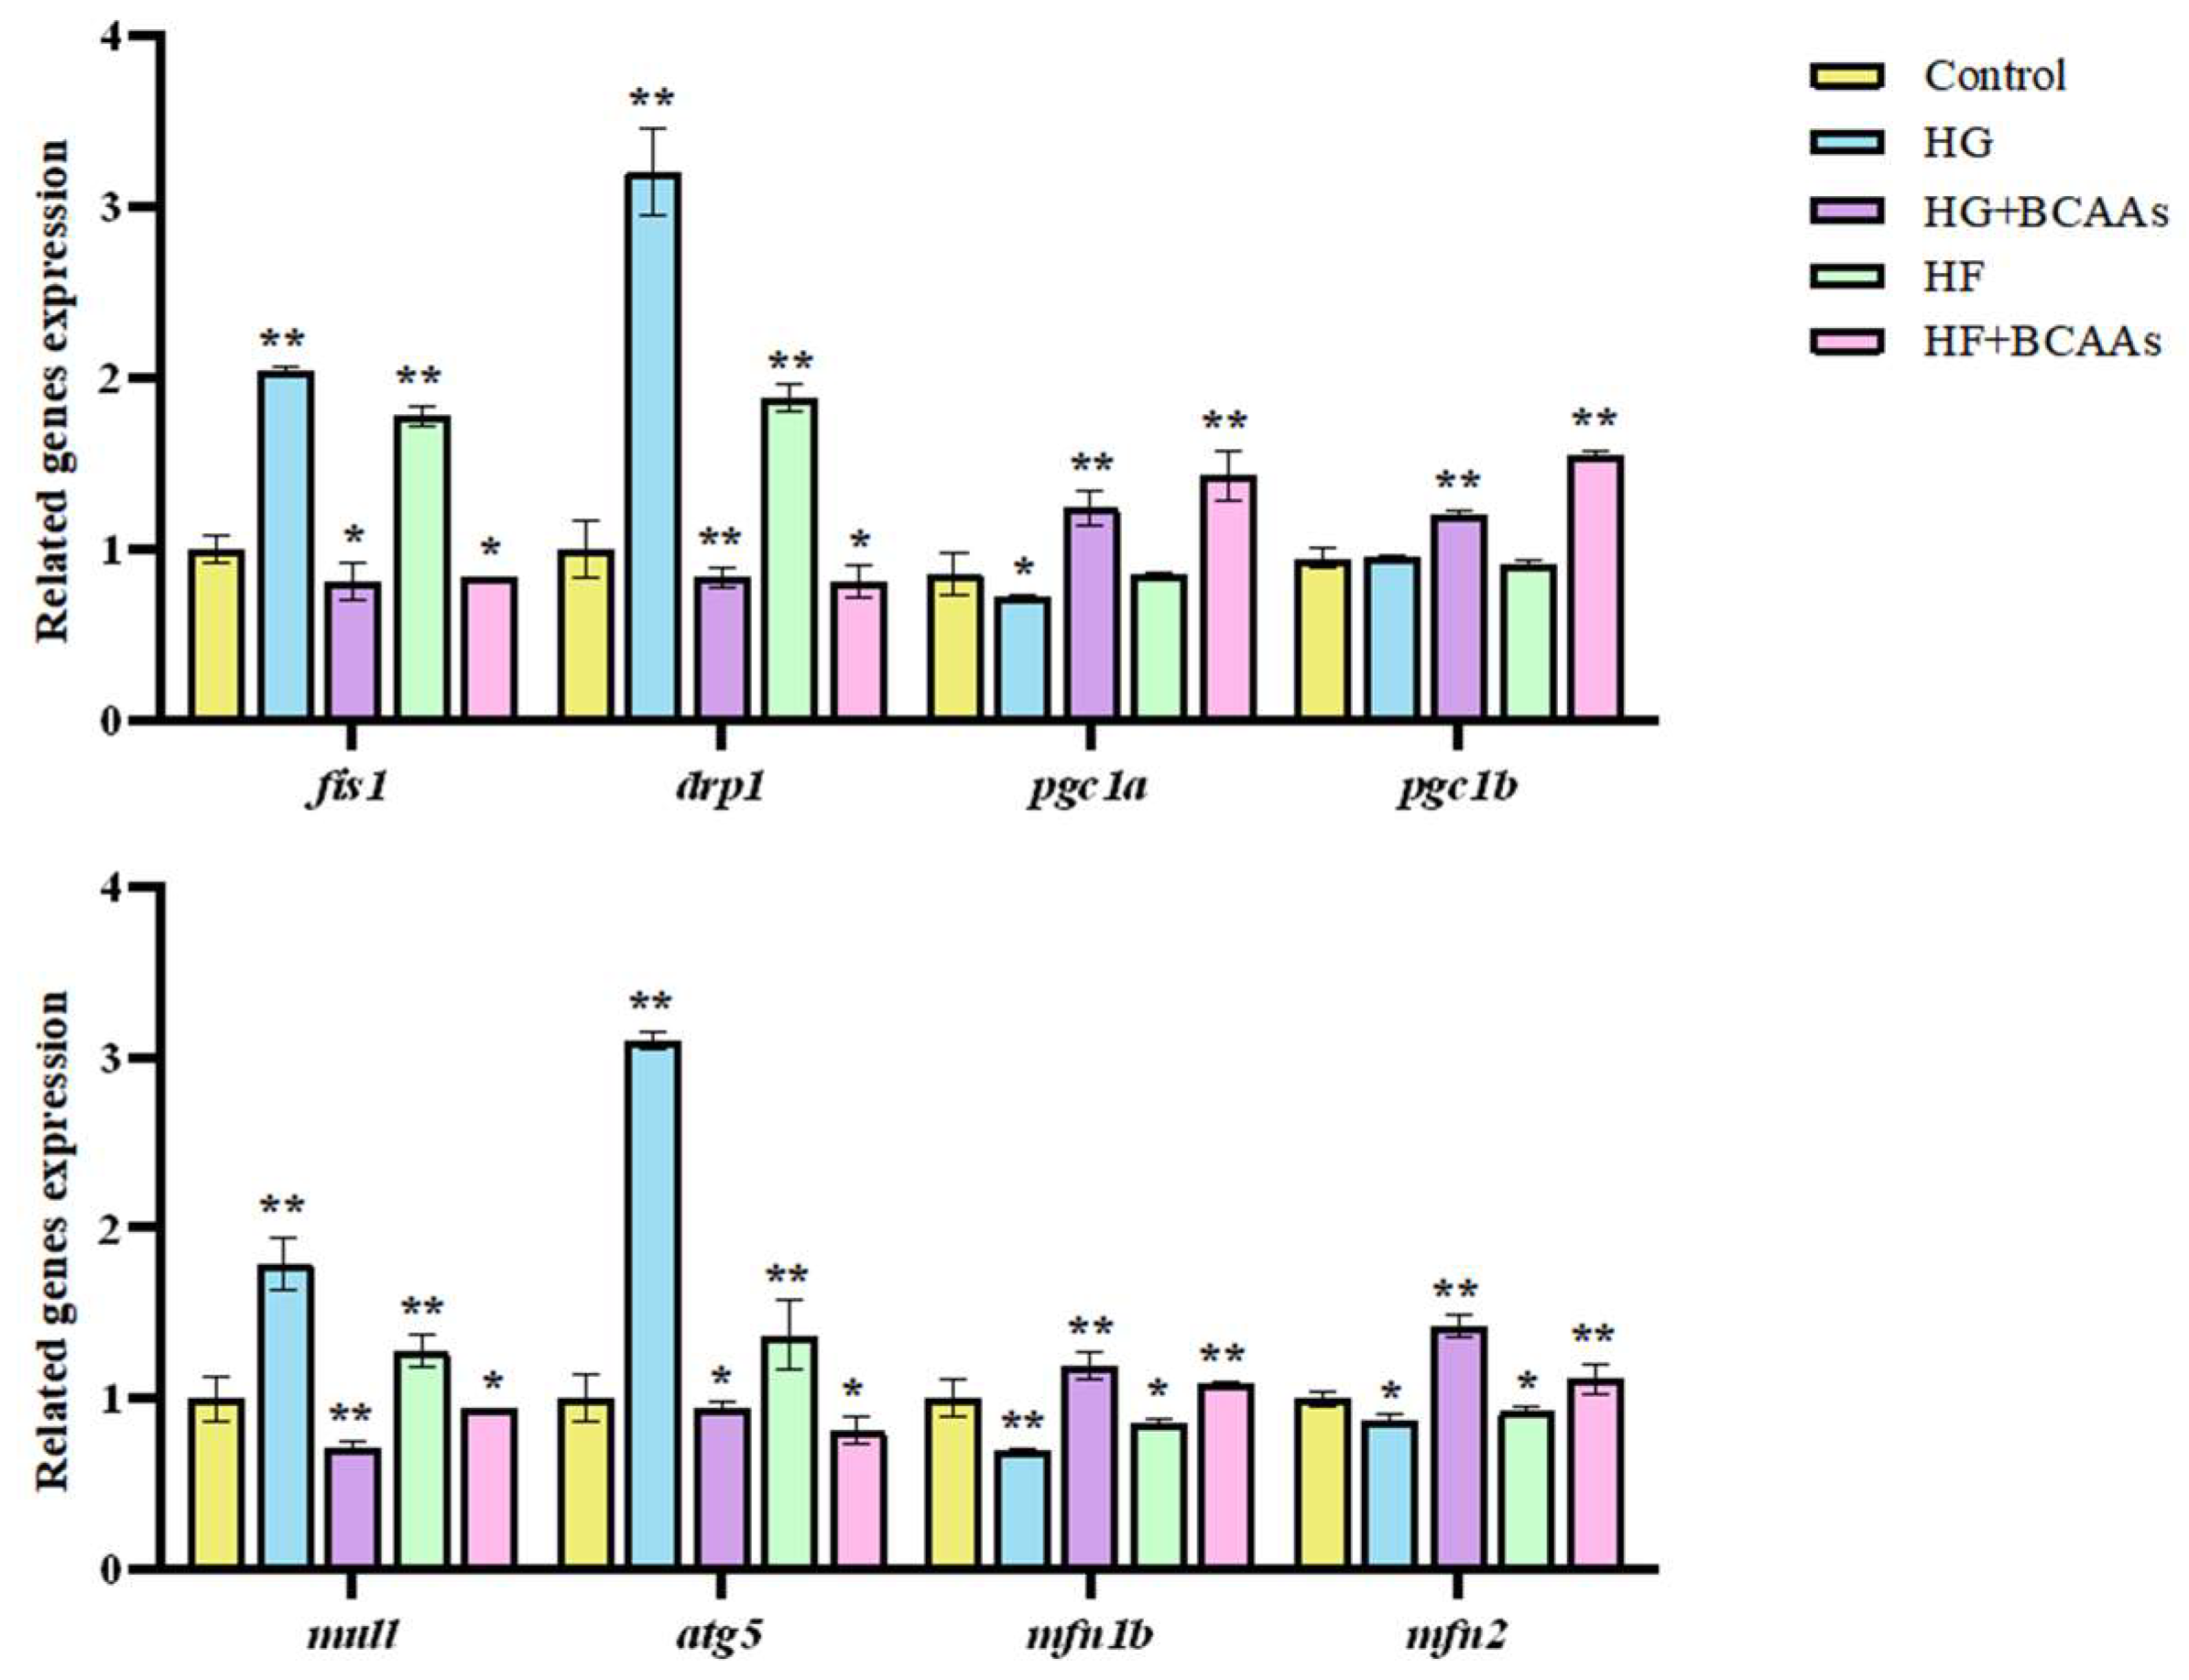
The expression of genes associated with hepatocyte mitochondrial fusion, fission, biogenesis, and autophagy is displayed in
Figure 6. BCAAs supplementation significantly promoted the expression of mitochondrial fusion genes
pgc1α and
pgc1b, as well as biogenesis genes
mfn1b and
mfn2 (
P<0.05). Conversely, it suppressed the expression of fission-related genes
fis1 and
drp1, along with autophagy-related genes
mul1 and
atg5 (
P<0.05).
4. Discussion
4.1. BCAAs Supplementation Mitigated Metabolic Disorders in Hepatocytes Induced by High-Glucose or High-Fat Load
The liver is a critical metabolic organ in fish and other animals, making it a frequent focus of metabolism-related studies. Previous research has demonstrated that high-glucose or high-fat diets can lead to glycogen and lipid deposition, resulting in liver damage [
27,
28]. In the present study, ALT and AST activities in the supernatant of hepatocytes significantly increased under high-glucose or high-fat conditions, indicating liver damage. However, the addition of BCAAs alleviated lipid deposition and glycogen accumulation in hepatocytes subjected to these conditions, while also reducing ALT and AST activities. This finding aligns with studies in mice fed high-fructose or high-fat diets, suggesting that isolated hepatocytes exhibit metabolic behavior similar to
in-vivo conditions.
Enzymes in the liver provide the catalytic foundation for physiological metabolism in fish [
29]. To better understand the effects of BCAAs on glucose and lipid metabolism in hepatocytes, the activities of key enzyme involved in the citric acid cycle, gluconeogenesis, and lipid metabolism were evaluated. BCAAs supplementation significantly increased the activities of CS, α-KGDHC, SDH, PEPCK, and LPS while reducing FAS activity. Enhanced activities of CS, α-KGDHC, and SDH indicate increasedentry of glucose and lipids into the citric acid cycle. PEPCK, a rate-limiting enzyme in gluconeogenesis [
30,
31], also showed higher active in the BCAA-supplemented groups, reflecting accelerated gluconeogenesis and reduced glycogen accumulation.
HK, G6pd, PFK, and PK are pivotal glycolytic enzymes essential for energy production. FBP and G6Pase, key regulators of gluconeogenesis, play critical roles in glycogen breakdown and maintaining blood glucose homeostasis [
32,
33,
34]. The study demonstrated that in the BCAAs-supplemented groups, gene expression of glycolysis-promoting enzymes (
g6pd, hk, pfk, pk) and gluconeogenesis-related enzymes
(fbp, g6pase) were significantly upregulated. These findings suggest that BCAAs supplementation enhances both glycolysis and gluconeogenesis in hepatocytes, thereby strengthening energy metabolism and reducing glycogen accumulation.
Sterol regulatory element-binding protein (SREBP) family members are key regulators of cholesterol, fatty acids, triglycerides, and glycerophospholipids synthesis, with SREBP-1c specifically controlling the transcription of lipogenic genes such as
fas and
acc. FAS and acetyl-CoA carboxylase (ACC) are major enzymes involved in fatty acid biosynthesis [
35,
36,
37]. ATGL plays a critical role in lipolysis, initiating triglyceride catabolism. Reduced ATGL expression can lead to triglyceride accumulation, contributing to obesity and other metabolic disorders [
38,
39,
40,
41]. This study found that BCAAs supplementation significantly downregulated the expression of lipogenic genes
fas and
srebp-1c, while upregulating lipolytic genes
ppaα and
atgl. These findings suggest that BCAAs promote lipid breakdown and inhibit lipid synthesis, thereby alleviating fat deposition in the liver of
L. maculatus. BCAAs likely modulate the expression of SREBP precursors, reducing
srebp-1c expression and its downstream targets
fas and
acc. Simultaneously, BCAAs enhanced the expression of lipolysis-related genes such as
atgl, thereby improving lipid homeostasis by reducing triglyceride accumulation.
Antioxidant markers provide valuable insights into organismal health. AOC reflects the cumulative antioxidant potential from substances and enzymes, with SOD and CAT serving as key enzymes for neutralizing free radicals [
42,
43]. MDA, a product of lipid peroxidation, serves as a marker of oxidative stress [
44,
45]. In this study, high-glucose and high-fat conditions caused a significant decline in T-AOC, and activities of SOD, and CAT, along with increased MDA levels, indicating oxidative stress in
L. maculatus hepatocytes. However, BCAAs supplementation effectively alleviated oxidative stress, restoring antioxidant capacity and enzyme activity.
4.2. Adding BCAAs Alleviated Mitochondrial Damage Caused by High-Glucose or High-Fat Loads
The structure and function of mitochondria are intricately linked to liver metabolism [
46]. The mitochondrial membrane acts as a critical barrier, protecting the organelle from damage. However, its permeability increases significantly when mitochondria are compromised [
47,
48]. In this study, high-glucose or high-fat exposure caused a decrease in mitochondrial membrane potential and a decline in mitochondrial activity in hepatocytes. Conversely, BCAAs supplementation helped maintain normal mitochondrial membrane potential and activity, suggesting that BCAAs stabilize the mitochondrial membrane and preserve mitochondrial function.
In cells, the mitochondrial respiratory chain is the primary site of ROS production. Disruption of this chain can lead to electron leakage, which combines with oxygen and other molecules to generate ROS. This study found that high-glucose or high-fat conditions inhibited ATP production and increased ROS levels. However, BCAAs supplementation significantly alleviated these adverse effects.
Mitochondrial DNA (mt DNA), a circular DNA located within mitochondria, encodes proteins essential for energy metabolism. Unlike nuclear DNA, mt DNA is highly susceptible to oxidative damage caused by ROS, which can impair mitochondrial function and overall cellular health. This study demonstrated that BCAAs supplementation significantly mitigated mt DNA damage induced by high-glucose or high-fat conditions, reducing oxidative stress and preserving mitochondrial integrity in hepatocytes.
Mitochondria are highly dynamic organelles that undergo constant renewal under normal physiological conditions. Two key processes—mitochondrial biogenesis (the generation of new mitochondria) and mitochondrial autophagy (the clearance of damaged or aged mitochondria)—work together to maintain mitochondrial homeostasis [
49,
50]. PGC-1α and PGC-1β, are crucial transcriptional regulators of mitochondrial biogenesis. They coordinate the activation of downstream transcription factors, enhancing mt DNA transcription and the synthesis of key mitochondrial enzymes, thereby promoting mitochondrial generation [
51]. Notably, PGC-1β has been found to be more effective than PGC-1α in driving mitochondrial biogenesis in fish.
This study demonstrated that high-glucose or high-fat exposure significantly downregulated the expression of pgc-1α and pgc-1β, while BCAAs supplementation restored their expression levels. These findings indicate that BCAAs can reverse the inhibition of mitochondrial biogenesis caused by high-glucose or high-fat conditions in the liver of L. maculatus, thereby promoting mitochondrial generation.
Mitochondrial autophagy, regulated by PINK1/Parkin pathway, is another critical process for maintaining mitochondrial health, with genes such as
mul1 and
atg5 playing essential roles in this pathway [
52]. This study revealed that high-glucose or high-fat exposure significantly suppressed the expression of
mul1 and
atg5. However, BCAAs supplementation upregulated these genes, thereby activating mitochondrial autophagy in the liver of
L. maculatus. A balanced relationship between mitochondrial autophagy and biogenesis is vital for maintaining mitochondrial function. Disruption of this balance can impair mitochondrial homeostasis and biogenesis. The findings of this study underscore the protective effects of BCAAs in maintaining this balance, reducing mitochondrial damage, and promoting overall mitochondrial health in hepatocytes under high-glucose or high-fat stress.
5. Conclusion
In summary, the isolated hepatocytes of L. maculatus exhibited physiological responses comparable to those observed in-vivo under high-glucose or high-fat conditions, establishing them as a reliable model for studying fish metabolism. BCAAs supplementation effectively alleviated mitochondrial damage in hepatocytes exposed to high-glucose or high-fat loads, promoted mitochondrial biogenesis, and preserved oxidative phosphorylation processes. These effects mitigated oxidative stress-induced damage to both hepatocytes and mitochondria, thereby supporting the maintenance of normal cellular metabolic homeostasis. In the future, aquaculture production can benefit from optimizing feed formulations by incorporating appropriate amounts of BCAAs. This strategy has the potential to improve feed utilization, reduce the incidence of metabolic diseases during the breeding process, and promote the healthy growth and production efficiency in fish.
Author Contributions
Draft manuscript, H.R. and Y.K.; methodology, H.R. and X.L.; laboratory analysis, H.R., K.S. and L.W.; statistical analysis, H.R.; supervision, K.L. and C.Z.; writing—reviews and editing, H.R. K.L. F.A.G. and S.R. All authors have read and agreed to the published version of the manuscript.
Funding
This work was supported by the Science Fund for Distinguished Young Scholars of Fujian Province (2023J06035), the Natural Science Foundation of Fujian Province of China (grant number: 2023J01766). Samad Rahimnejad was supported financially by a Maria Zambrano contract of University of Murcia (UMU) within the framework of the programme for the requailification of the Spanish university system (Ministry of Universities) during the period 2021–2023 funded by the European Union-Next Generation EU.
Institutional Review Board Statement
Ethical approval is not necessary, as this study only uses the liver cell line of the spotted sea bass.
Informed Consent Statement
Not applicable.
Data Availability Statement
The datasets generated and/or analyzed during the current study are available from the corresponding author upon reasonable request.
Conflicts of Interest
The authors declare no conflicts of interest.
References
- Tamanna, N.; Mahmood, N. Emerging Roles of Branched-Chain Amino Acid Supplementation in Human Diseases. Int. Sch. Res. Not. 2014, 2014, 1–8. [Google Scholar] [CrossRef]
- De Bandt, J.-P.; Coumoul, X.; Barouki, R. Branched-Chain Amino Acids and Insulin Resistance, from Protein Supply to Diet-Induced Obesity. Nutrients 2022, 15, 68. [Google Scholar] [CrossRef] [PubMed]
- Bonvini, A.; Rogero, M.M.; Coqueiro, A.Y.; Raizel, R.; Bella, L.M.; Fock, R.A.; Borelli, P.; Tirapegui, J. Effects of different branched-chain amino acids supplementation protocols on the inflammatory response of LPS-stimulated RAW 264.7 macrophages. Amino Acids 2021, 53, 597–607. [Google Scholar] [CrossRef] [PubMed]
- Valerio, A.; D'Antona, G.; Nisoli, E. Branched-chain amino acids, mitochondrial biogenesis, and healthspan: an evolutionary perspective. Aging 2011, 3, 464–478. [Google Scholar] [CrossRef] [PubMed]
- Blair, M.C. ; Neinast,M. D.; Arany,Z. Whole-body metabolic fate of branched-chain amino acids. Biochemical.J. 2021, 478, 765–776. [Google Scholar]
- Ra,S. G.; Miyazaki,T.; Ishikura.K.; Nagayama,H.; Komine,S.; Nakata,Y.; et al. Combined effect of branched-chain amino acids and taurine supple-mentation on delayed onset muscle soreness and muscle damage inhigh-intensity eccentric exercise.J. Int. Soc. Sports Nutr. 2013, 10, 51.
- Fouré, A.; Bendahan, D. Is Branched-Chain Amino Acids Supplementation an Efficient Nutritional Strategy to Alleviate Skeletal Muscle Damage? A Systematic Review. Nutrients 2017, 9, 1047. [Google Scholar] [CrossRef]
- Holeček, M. Branched-chain amino acid supplementation in treatment of liver cirrhosis: Updated views on how to attenuate their harmful effects on cataplerosis and ammonia formation. Nutrition 2017, 41, 80–85. [Google Scholar] [CrossRef]
- Weber, M.G.; Dias, S.S.; de Angelis, T.R.; Fernandes, E.V.; Bernardes, A.G.; Milanez, V.F.; Jussiani, E.I.; Ramos, S.d.P. The use of BCAA to decrease delayed-onset muscle soreness after a single bout of exercise: a systematic review and meta-analysis. Amino Acids 2021, 53, 1663–1678. [Google Scholar] [CrossRef]
- Doma, K.; Singh, U.; Boullosa, D.; Connor, J.D. The effect of branched-chain amino acid on muscle damage markers and performance following strenuous exercise: a systematic review and meta-analysis. Appl. Physiol. Nutr. Metab. 2021, 46, 1303–1313. [Google Scholar] [CrossRef]
- Hormoznejad, R.; Javid, A.Z.; Mansoori, A. Effect of BCAA supplementation on central fatigue, energy metabolism substrate and muscle damage to the exercise: a systematic review with meta-analysis. Sport Sci. Heal. 2019, 15, 265–279. [Google Scholar] [CrossRef]
- Khemtong, C.; Kuo, C.-H.; Chen, C.-Y.; Jaime, S.J.; Condello, G. Does Branched-Chain Amino Acids (BCAAs) Supplementation Attenuate Muscle Damage Markers and Soreness after Resistance Exercise in Trained Males? A Meta-Analysis of Randomized Controlled Trials. Nutrients 2021, 13, 1880. [Google Scholar] [CrossRef] [PubMed]
- Rahimi, M.H.; Shab-Bidar, S.; Mollahosseini, M.; Djafarian, K. Branched-chain amino acid supplementation and exercise-induced muscle damage in exercise recovery: A meta-analysis of randomized clinical trials. Nutrition 2017, 42, 30–36. [Google Scholar] [CrossRef]
- Rahimlou,M. ; Ramezani,A.; Mahdipour,M.; Palimi,E. Moradipoodeh B. Reduction of muscle injuries and improved post-exercise recovery by branched-chain amino acid supplementation: a systematic review and meta-analysis. J Nutr Health Aging. 2020, 8, 1–16.
- McGarrah, R.W.; White, P.J. Branched-chain amino acids in cardiovascular disease. Nat. Rev. Cardiol. 2022, 20, 77–89. [Google Scholar] [CrossRef] [PubMed]
- Lauer, S.M.; Omar, M.H.; Golkowski, M.G.; Kenerson, H.L.; Lee, K.-S.; Pascual, B.C.; Lim, H.C.; Forbush, K.; Smith, F.D.; Gordan, J.D.; et al. Recruitment of BAG2 to DNAJ-PKAc scaffolds promotes cell survival and resistance to drug-induced apoptosis in fibrolamellar carcinoma. Cell Rep. 2024, 43, 113678–113678. [Google Scholar] [CrossRef]
- Lo, E.K.K.; Felicianna; Xu, J. -H.; Zhan, Q.; Zeng, Z.; El-Nezami, H. The Emerging Role of Branched-Chain Amino Acids in Liver Diseases. Biomedicines 2022, 10, 1444. [Google Scholar] [CrossRef]
- Ananieva, E.A.; Van Horn, C.G.; Jones, M.R.; Hutson, S.M. Liver BCATm transgenic mouse model reveals the important role of the liver in maintaining BCAA homeostasis. J. Nutr. Biochem. 2016, 40, 132–140. [Google Scholar] [CrossRef]
- Kamalam, B.S.; Medale, F.; Panserat, S. Utilisation of dietary carbohydrates in farmed fishes: New insights on influencing factors, biological limitations and future strategies. Aquaculture 2017, 467, 3–27. [Google Scholar] [CrossRef]
- Sari, D.N.; Ekasari, J.; Nasrullah, H.; Suprayudi, M.A.; Alimuddin, A. High carbohydrate increases amylase, plasma glucose, and gene expression related to glycolysis in giant gourami Osphronemus goramy. Fish Physiol. Biochem. 2022, 48, 1495–1505. [Google Scholar] [CrossRef]
- Lin, S.-M.; Shi, C.-M.; Mu, M.-M.; Chen, Y.-J.; Luo, L. Effect of high dietary starch levels on growth, hepatic glucose metabolism, oxidative status and immune response of juvenile largemouth bass, Micropterus salmoides. Fish Shellfish. Immunol. 2018, 78, 121–126. [Google Scholar] [CrossRef] [PubMed]
- Lu, K.-L.; Wang, L.-N.; Zhang, D.-D.; Liu, W.-B.; Xu, W.-N. Berberine attenuates oxidative stress and hepatocytes apoptosis via protecting mitochondria in blunt snout bream Megalobrama amblycephala fed high-fat diets. Fish Physiol. Biochem. 2016, 43, 65–76. [Google Scholar] [CrossRef]
- Xia, T.; Mao, X.-J.; Zhang, J.; Rahimnejad, S.; Lu, K.-L. Effects of quercetin and hydroxytyrosol supplementation in a high-fat diet on growth, lipid metabolism, and mitochondrial function in spotted seabass (Lateolabrax maculatus). Aquaculture 2024, 582. [Google Scholar] [CrossRef]
- Dong, Y.; Yu, M.; Wu, Y.; Xia, T.; Wang, L.; Song, K.; Zhang, C.; Lu, K.; Rahimnejad, S. Hydroxytyrosol Promotes the Mitochondrial Function through Activating Mitophagy. Antioxidants 2022, 11, 893. [Google Scholar] [CrossRef]
- Ren,H. J.; Ke,Y.X.; Lu,K.L.; Li,X.S.; Wang,L.; Song,K.; Zhang,C.X. Effects of high-glucose load on energy metabolism and mitochondrial function of hepatocytes from spotted seabass (Lateolabrax maculatus). Journal of Fishery Sciences of China, 2024, 31, 513–523.
- Mao,X.J. Alleviation effect and mechanism of coenzyme Q10 on excessive fat deposition in liver of Lateolabrax maculatus induced by high-fat diet. Jimei University, China, Xiamen,2024.
- Jung, S.M.; Doxsey, W.G.; Le, J.; Haley, J.A.; Mazuecos, L.; Luciano, A.K.; Li, H.; Jang, C.; Guertin, D.A. In vivo isotope tracing reveals the versatility of glucose as a brown adipose tissue substrate. Cell Rep. 2021, 36, 109459–109459. [Google Scholar] [CrossRef]
- Zhu, J.; Pan, J.; Wang, X.; Huang, Y.; Qin, C.; Qiao, F.; Qin, J.; Chen, L. Alleviation of the Adverse Effect of Dietary Carbohydrate by Supplementation of Myo-Inositol to the Diet of Nile Tilapia (Oreochromis niloticus). Animals 2020, 10, 2190. [Google Scholar] [CrossRef]
- Li,S. L.; Li,Z.Q.; Zhang,J.C.; et al. The impacts of dietary carbohydrate levels on growth performance, feed utilization, glycogen accumulation and hepatic glucose metabolism in hybrid grouper (Epinephelus fuscoguttatus ♀ × E. lanceolatus♂). Aquaculture. 2019, 512, 734351.
- Bornstein, M.R.; Neinast, M.D.; Zeng, X.; Chu, Q.; Axsom, J.; Thorsheim, C.; Li, K.; Blair, M.C.; Rabinowitz, J.D.; Arany, Z. Comprehensive quantification of metabolic flux during acute cold stress in mice. Cell Metab. 2023, 35, 2077–2092.e6. [Google Scholar] [CrossRef]
- Qian, L.; Li, N.; Lu, X.-C.; Xu, M.; Liu, Y.; Li, K.; Zhang, Y.; Hu, K.; Qi, Y.-T.; Yao, J.; et al. Enhanced BCAT1 activity and BCAA metabolism promotes RhoC activity in cancer progression. Nat. Metab. 2023, 5, 1159–1173. [Google Scholar] [CrossRef]
- Wang, J.; Liu, Y.; Lian, K.; Shentu, X.; Fang, J.; Shao, J.; Chen, M.; Wang, Y.; Zhou, M.; Sun, H. BCAA Catabolic Defect Alters Glucose Metabolism in Lean Mice. Front. Physiol. 2019, 10, 1140. [Google Scholar] [CrossRef] [PubMed]
- Hui, S.; Cowan, A.J.; Zeng, X.; Yang, L.; TeSlaa, T.; Li, X.; Bartman, C.; Zhang, Z.; Jang, C.; Wang, L.; et al. Quantitative Fluxomics of Circulating Metabolites. Cell Metab. 2020, 32, 676–688.e4. [Google Scholar] [CrossRef]
- Yoneshiro,T. ; Kataoka,N.; Walejko,J.M.; Ikeda,K.; Brown,Z.; Yoneshiro,M.; Crown,S.B.; Osawa,T.; Sakai,J.; McGarrah,R.W.; et al. Meta-bolic flexibility via mitochondrial BCAA carrier SLC25A44 is required for optimal fever. Elife, 2021, 10, 66865.
- Espenshade,P. J. SREBPs:Sterol-Regulated Transcription Factors. J Cell Sci. 2006, 119, 973–976.
- Brown,M. Lipid Res. 2009, 50 Suppl, S15–S27.
- Dong,Y.Z.; Wei,Y.; Wang,L.; Song,K.; Zhang,C.X.; Lu,K.L.; Rahimnejad,S. Dietary n-3/n-6 PUFA ratio modulates growth performance in spotted seabass (Lateolabrax maculatus) through regulating lipid metabolism, hepatic antioxidant capacity and intestinal health. Anim Nutr. 2023, 20-31.
- Athanikar, J.N.; Sanchez, H.B.; Osborne, T.F. Promoter Selective Transcriptional Synergy Mediated by Sterol Regulatory Element Binding Protein and Sp1: a Critical Role for the Btd Domain of Sp1. Mol. Cell. Biol. 1997, 17, 5193–5200. [Google Scholar] [CrossRef]
- Wilentz, R.E.; Witters, L.A.; Pizer, E.S. Lipogenic Enzymes Fatty Acid Synthase and Acetyl-Coenzyme A Carboxylase are Coexpressed with Sterol Regulatory Element Binding Protein and Ki-67 in Fetal Tissues. Pediatr. Dev. Pathol. 2000, 3, 525–531. [Google Scholar] [CrossRef]
- Zimmermann, R.; Strauss, J.G.; Haemmerle, G.; Schoiswohl, G.; Birner-Gruenberger, R.; Riederer, M.; Lass, A.; Neuberger, G.; Eisenhaber, F.; Hermetter, A.; et al. Fat Mobilization in Adipose Tissue Is Promoted by Adipose Triglyceride Lipase. Science 2004, 306, 1383–1386. [Google Scholar] [CrossRef]
- Schreiber, R.; Xie, H.; Schweiger, M. Of mice and men: The physiological role of adipose triglyceride lipase (ATGL). 1864. [CrossRef]
- Calabrese, G.; Morgan, B.; Riemer, J. Mitochondrial Glutathione: Regulation and Functions. Antioxid. Redox Signal. 2017, 27, 1162–1177. [Google Scholar] [CrossRef]
- Zhan, Q.; Han, T.; Li, X.; Wang, J.; Yang, Y.; Yu, X.; Zheng, P.; Liu, T.; Xu, H.; Wang, C. Effects of dietary carbohydrate levels on growth, body composition, and gene expression of key enzymes involved in hepatopancreas metabolism in mud crab Scylla paramamosain. 529, 7356; 38. [Google Scholar] [CrossRef]
- Forman,H. J.; Zhang,H.; Rinna,A.; Glutathione: Overview of its protective roles, measurement, and biosynthesis. Mol. Aspects Med. 2009, 30, 1–12.
- Pfanner, N.; Warscheid, B.; Wiedemann, N. Mitochondrial proteins: from biogenesis to functional networks. Nat. Rev. Mol. Cell Biol. 2019, 20, 267–284. [Google Scholar] [CrossRef]
- Palikaras, K.; Lionaki, E.; Tavernarakis, N. Balancing mitochondrial biogenesis and mitophagy to maintain energy metabolism homeostasis. Cell Death Differ. 2015, 22, 1399–1401. [Google Scholar] [CrossRef]
- Yu, E.P.; Bennett, M.R. The role of mitochondrial DNA damage in the development of atherosclerosis. Free. Radic. Biol. Med. 2016, 100, 223–230. [Google Scholar] [CrossRef] [PubMed]
- Mao,S. ; Leone,T.C.; Kelly,D.P.; et al. Mitochondrial Transcription Factor A is Increased but Expression of ATP Synthase Beta Subunit and Medium-Chain Acyl-CoA Dehydrogenase Genes are Decreased in Hearts of Copper-Deficient Rats. J Nutr. 2000, 130, 2143–2150.
- Bremer, K.; Kocha, K.; Snider, T.; Moyes, C. Sensing and responding to energetic stress: The role of the AMPK-PGC1α-NRF1 axis in control of mitochondrial biogenesis in fish. Comp. Biochem. Physiol. Part B: Biochem. Mol. Biol. 2016, 199, 4–12. [Google Scholar] [CrossRef]
- Lazarou,M. ; Sliter,D.A.; Kane,L.A.;et al. The Ubiquitin Kinase PINK1 Recruits Autophagy Receptors to Induce Mitophagy. Nature (London). 2015, 524, 309–314.
- Palikaras,K. ; Taverarakis,N. Mitochondrial Homeostasis: The Interplay between Mitophagy and Mitochondrial Biogenesis. Exp. Gerontol. 2014, 56, 182–188.
- Beaulant, A.; Dia, M.; Pillot, B.; Chauvin, M.-A.; Ji-Cao, J.; Durand, C.; Bendridi, N.; Chanon, S.; Vieille-Marchiset, A.; Da Silva, C.C.; et al. Endoplasmic reticulum-mitochondria miscommunication is an early and causal trigger of hepatic insulin resistance and steatosis. J. Hepatol. 2022, 77, 710–722. [Google Scholar] [CrossRef]
- Watanabe, T. Strategies for further development of aquatic feeds. Fish. Sci. 2002, 68, 242–252. [Google Scholar] [CrossRef]
|
Disclaimer/Publisher’s Note: The statements, opinions and data contained in all publications are solely those of the individual author(s) and contributor(s) and not of MDPI and/or the editor(s). MDPI and/or the editor(s) disclaim responsibility for any injury to people or property resulting from any ideas, methods, instructions or products referred to in the content. |
© 2025 by the authors. Licensee MDPI, Basel, Switzerland. This article is an open access article distributed under the terms and conditions of the Creative Commons Attribution (CC BY) license (http://creativecommons.org/licenses/by/4.0/).