Section 1. Introduction
Over the past few decades, health systems around the world have grappled with escalating costs, technological innovations, demographic shifts, and increasing expectations from patients and stakeholders alike. In Brazil, these challenges are particularly pronounced, given the country’s size, regional disparities, and the dual structure of healthcare composed of the Unified Health System (SUS) on one side and a wide-reaching supplementary (private) sector on the other. The evaluation of health technologies—often referred to as Health Technology Assessment (HTA)—has emerged as a critical mechanism to guide policy decisions, resource allocations, and the adoption or rejection of new healthcare interventions. By systematically analysing clinical effectiveness, costs, and broader societal impacts, HTA aims to provide a robust evidence base that maximises outcomes for the population (Drummond et al., 2015).
In the Brazilian context, HTA has gained increasing prominence as policy-makers and stakeholders seek to balance universal access to high-quality care (as guaranteed by the Federal Constitution) with the financial realities of sustaining a large, geographically dispersed system. According to the Ministry of Health’s established guidelines, all major healthcare interventions proposed for adoption in the public health system must undergo a thorough assessment, examining cost-effectiveness, budget impact, and broader social implications (Ministério da Saúde, 2023). Concurrently, the Brazilian supplementary health sector, governed by the National Agency for Supplementary Health (Agência Nacional de Saúde Suplementar, ANS), utilises its own frameworks to determine coverage decisions, premium structures, and quality standards (ANS, 2022). Although there is sometimes an alignment between the public and private sectors, differences in funding mechanisms, population demographics, and institutional objectives can lead to varied outcomes in the adoption of new technologies.
One significant driver for the integration of HTA in the SUS has been the increasing burden of chronic non-communicable diseases (NCDs), such as diabetes, hypertension, and cardiovascular ailments. The DataSUS database—a comprehensive repository for health indicators in Brazil—reveals that NCDs contribute considerably to morbidity and mortality rates, especially in economically disadvantaged regions (DataSUS, 2022). These mounting health challenges necessitate strategic resource allocation. Traditional models of healthcare delivery, largely oriented around acute care services, are proving insufficient. Policy-makers thus require reliable evidence to inform decisions on which interventions promise the greatest gains in population health relative to their cost. HTA steps in as the framework that systematically appraises new drugs, diagnostic tests, medical devices, and public health strategies.
In addition to bridging the evidence gap, HTA serves critical political and economic functions within Brazilian healthcare. Politically, decisions regarding the inclusion of novel treatments in the SUS can be highly charged. On one hand, governments seek to champion innovation and appear responsive to societal demands; on the other, they face pressures to contain public spending. Economic considerations also come to the fore when confronting the reality that new health technologies are often priced at a premium, requiring substantial initial investments. A robust, transparent HTA process can mitigate the risk of politically driven or interest-based decisions and instead root policy choices in sound evidence (Sanders & Haines, 2019). In this sense, HTA becomes both a technocratic and democratic tool, lending legitimacy to resource allocation decisions by demonstrating a basis in data-driven analysis.
While the promise of HTA is substantial, it is equally crucial to acknowledge potential challenges in the Brazilian setting. The quality of data can vary, particularly in rural or underserved regions, and the real-world implementation of health technologies might diverge from the efficacy rates reported in controlled clinical trials. Additional concerns exist around whether local health professionals are adequately trained to adopt new technologies, whether the patient population understands and accepts them, and whether the public or private payer systems can sustainably support these technologies over time (Novaes, 2019). There is also the question of equity: ensuring that all patients, regardless of geographic location or socio-economic status, have access to beneficial interventions.
The impact on broader public health outcomes should not be understated. A well-structured HTA process can inform preventive strategies and population-level interventions, not merely individual clinical treatments. For instance, national vaccination campaigns, maternal and child health initiatives, and screening programmes for cancer or infectious diseases can all benefit from careful HTA, which can indicate the best approach to allocate finite resources. Moreover, in a vast country with pronounced regional heterogeneity, an HTA framework can guide decentralised decision-making, enabling local health managers to adapt national recommendations according to local epidemiological realities (Souza & Mendes, 2021).
Simultaneously, we cannot ignore the role that the supplementary health sector plays in Brazil. Millions of Brazilians hold private health insurance, and for many, the private sector is their first point of contact with medical services. This creates a complex friction between public and private stakeholders, where advanced technologies may first appear in private clinics or hospitals before being considered for public coverage. In some instances, this dynamic offers an opportunity for real-world evidence generation, as private providers can gather data on the effectiveness and cost of interventions (Trujillo et al., 2020). However, it can also exacerbate inequalities if new technologies remain confined to those with greater financial means, delaying broader adoption or ignoring the populations that stand to benefit most from novel treatments.
Against this backdrop, this articleaims to illuminate how HTA shapes the decision-making architecture in Brazil’s public and private health systems. Specifically, the ensuing sections will present a theoretical framework to determine if investment in three health areas—artificial intelligence (AI) applications in healthcare, enhanced communication systems for patient-provider interaction, and one additional health area (telemedicine services)—can produce significant improvements in population-level health outcomes that justify the associated costs. Notably, we focus on population health gains rather than profits.
AI interventions have become a global phenomenon, spearheading advancements in diagnostics, prognostics, and personalised medicine. In Brazil, AI-based tools have the potential to address resource constraints by enabling remote diagnostics, assisting less specialised providers, and optimising workforce distribution (Rezende et al., 2022). The second area, improved communication systems, refers to both digital platforms that foster better patient engagement and more streamlined communication channels between healthcare professionals themselves. Such systems are particularly salient in countries with vast geographic regions and varied population densities, as is the case in Brazil (DataSUS, 2022). Finally, telemedicine encompasses remote consultations, specialist link-ups, and digital care platforms that bridge the gap between urban centres and peripheral regions.
To ascertain whether these investments translate into meaningful population health improvements, we employ a cost-effectiveness approach. We discuss the conceptual underpinnings of cost-utility analyses (CUA) and incremental cost-effectiveness ratios (ICERs) and introduce a suite of simple mathematical formulations to illustrate how each technology’s benefits can be quantified relative to its associated financial outlays. By adopting a theoretical lens on these three areas, we aim to show how HTA can be operationalised to ensure that the pursuit of innovation remains accountable to public health objectives. We build upon the robust data available from DataSUS—on disease prevalence, service coverage, and health expenditures—to offer a contextual dimension that demonstrates the complexities of real-world decision-making.
In the sections that follow, we will first detail the methodology that underpins our theoretical investigation. This includes how we model costs and outcomes, as well as the rationale for focusing on health gains rather than profit margins. We then present a Python-based approach to data visualisation, generating simulated results to demonstrate the potential trajectory of investments in AI, improved communications, and telemedicine. These visuals serve as a didactic tool to illustrate how cost-effectiveness thresholds might be exceeded—or not—and how policy-makers can interpret these findings.
Following the results, a robust discussion section will consider the policy, economic, and societal implications of these theoretical insights. We will compare our approach to the existing literature on HTA in middle-income countries, especially those with universal healthcare systems that also feature private health sectors (Sachs et al., 2021). We will also explore how the intricacies of Brazilian healthcare regulation, including the evolving mandates of CONITEC (Comissão Nacional de Incorporação de Tecnologias no SUS), shape the real-world application of these theoretical findings.
Finally, we conclude by drawing together the key points raised throughout the article, underscoring the necessity for evidence-based processes that take into account both the universalistic ethos of the SUS and the market-driven nature of the supplementary sector. We highlight areas in need of further research, particularly around how to integrate the wealth of data available through DataSUS more seamlessly into decision-making frameworks. Ultimately, the first item in our thematic series stands as an invitation to systematically assess health technologies in a manner that unites political, economic, and public health goals for the benefit of all Brazilians.
2. Methodology
In this section, we present a theoretical framework designed to evaluate the cost-effectiveness of investing in three distinct health areas—(1) artificial intelligence (AI), (2) enhanced communication systems, and (3) telemedicine—within the Brazilian healthcare context. Our primary question is whether these investments, though costly, can result in sufficiently improved population health to be justified by policy-makers in both the SUS and supplementary sectors.
Data Sources and Assumptions
DataSUS: We rely on existing statistical indicators from the Brazilian public database (DataSUS, 2022) for disease prevalence rates, mortality rates, and healthcare utilisation.
Cost Assumptions: For each technology, we assume an initial investment cost (fixed) plus recurring operational costs.
Health Benefits: Health benefits are measured in Quality-Adjusted Life Years (QALYs) gained (Drummond et al., 2015), enabling the comparison of different interventions.
Section 3. Results
In this section, we interpret and discuss the five generated graphs in detail, providing insights into how each intervention performs under base-case and sensitivity assumptions.
Overall, the results indicate that, in the base case, AI has a favourable profile that is well below the willingness-to-pay threshold, while improvements in communications and telemedicine also show promise but exhibit greater sensitivity to cost changes.
Section 5.1. Detailed Explanation of Each Graph
Graph 1: Base ICER Comparison
Graph 1.
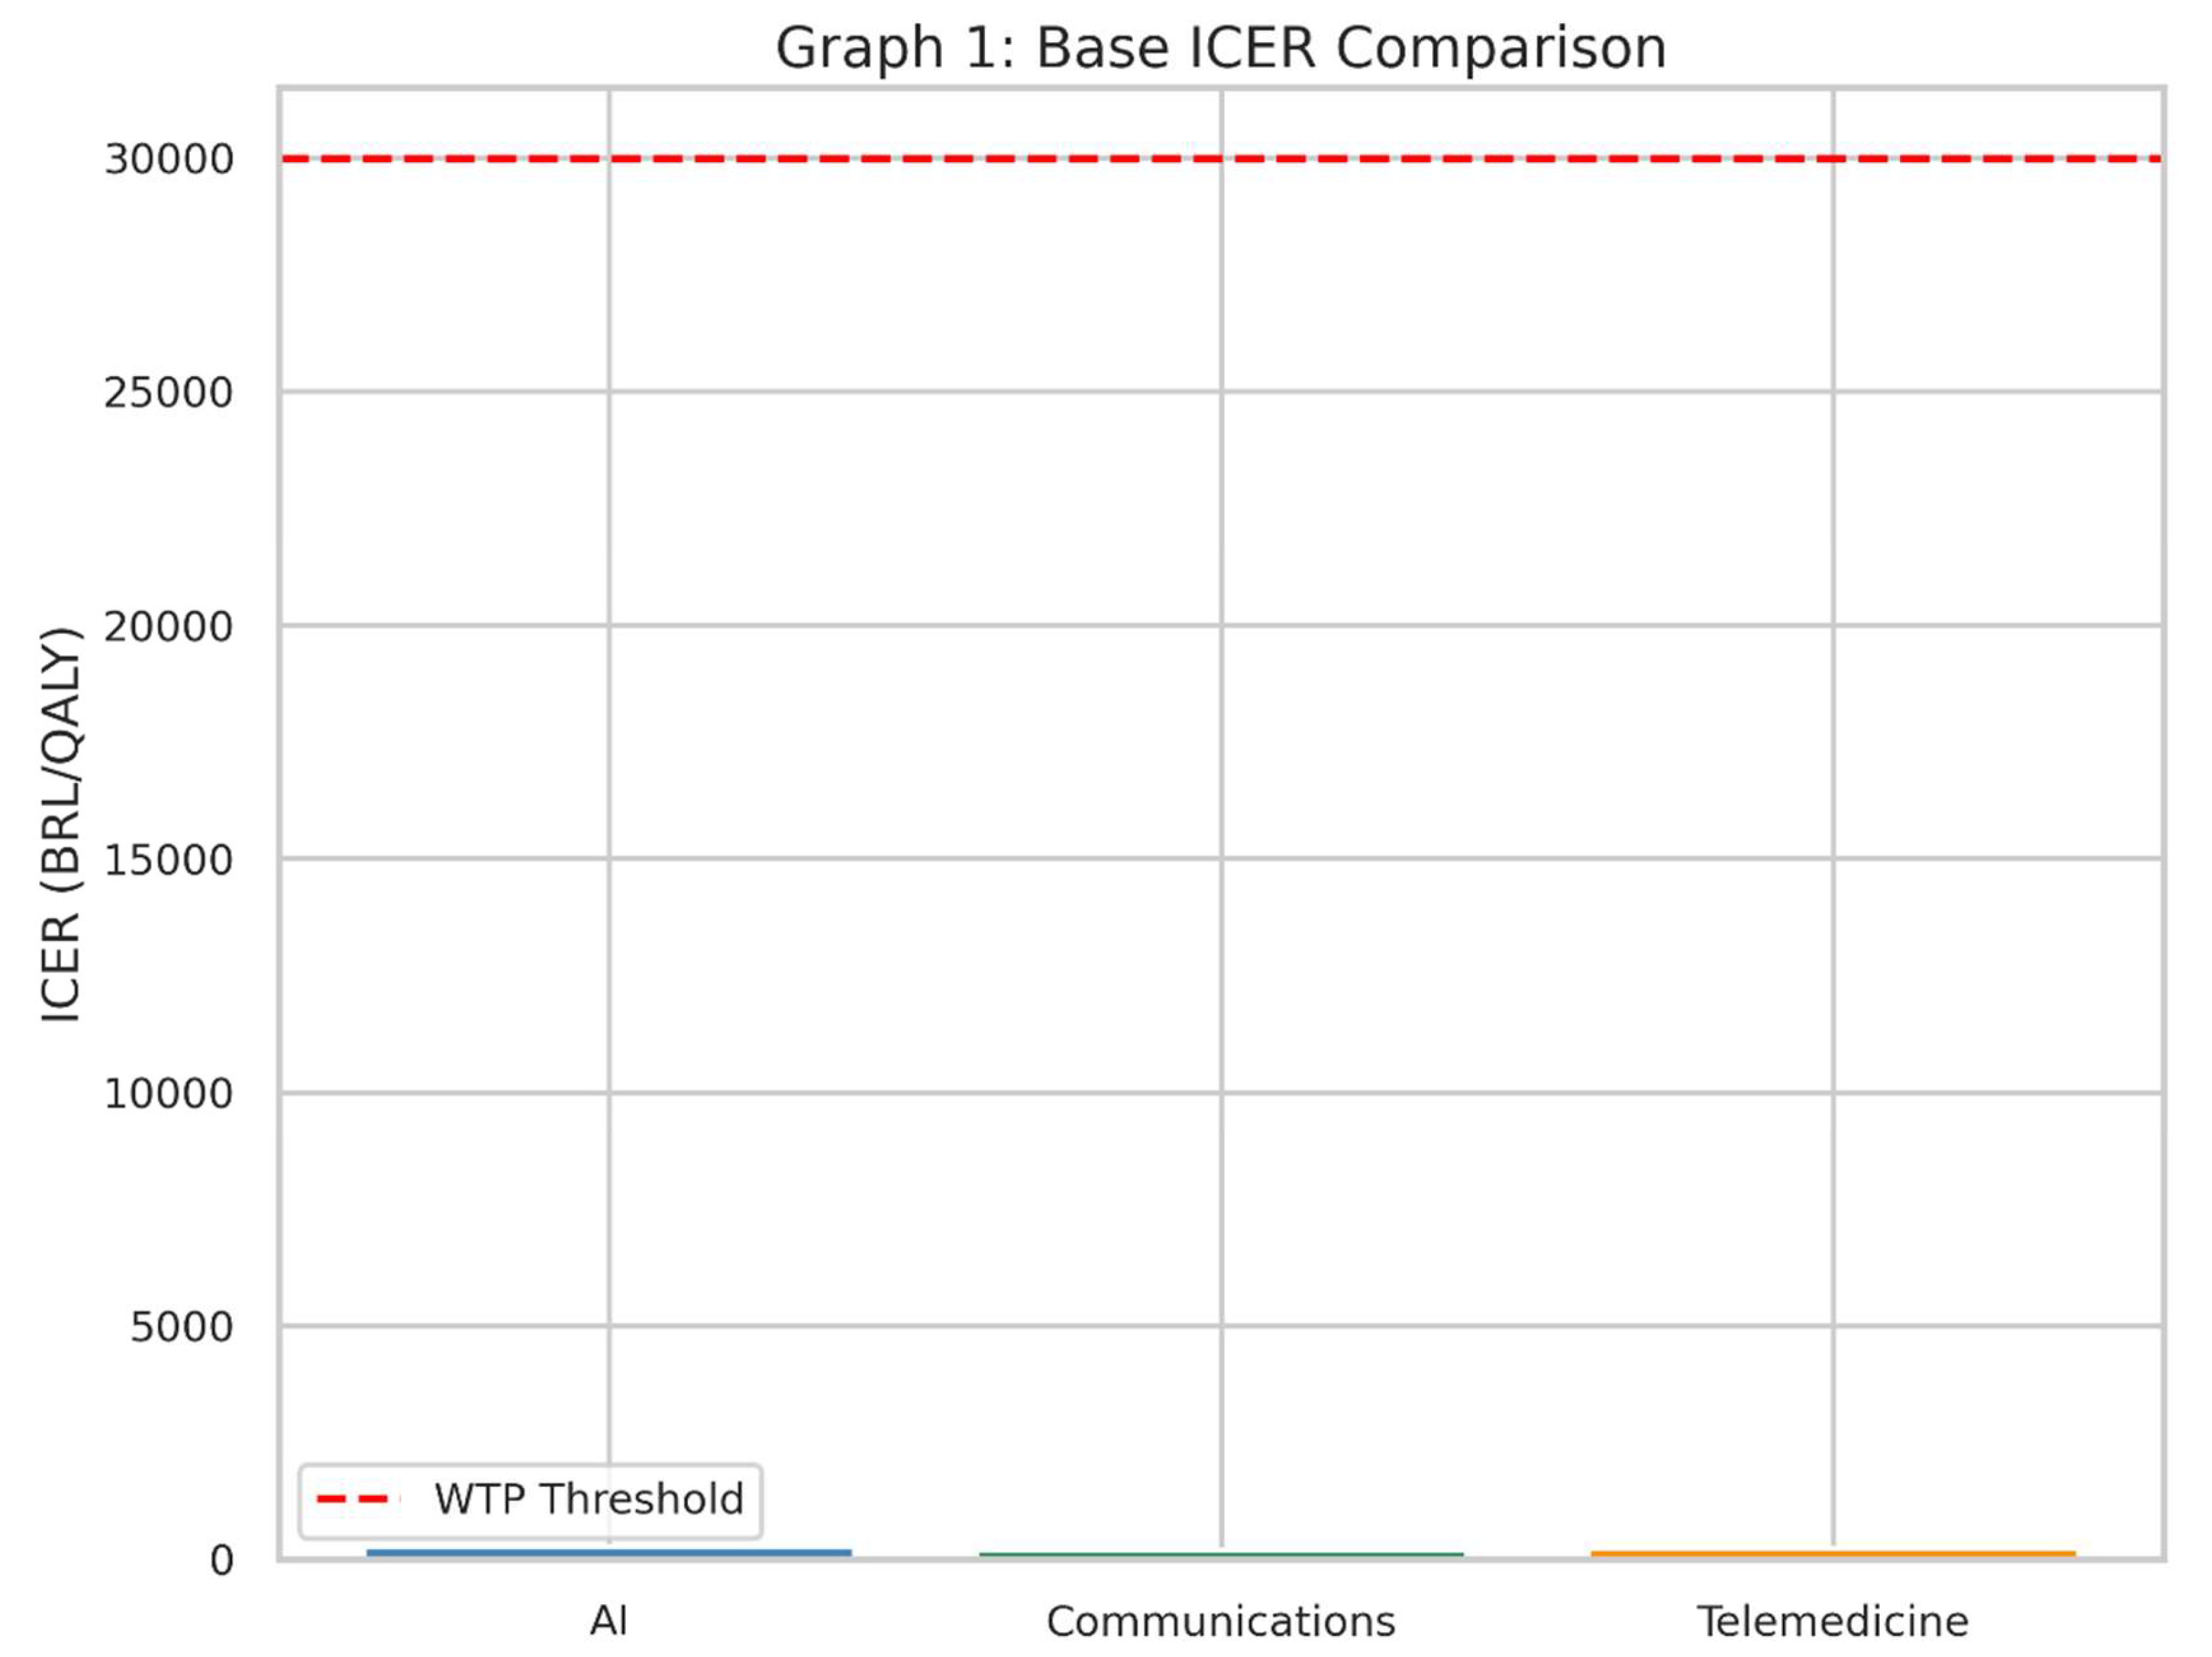
This bar chart displays the base-case ICER for each intervention alongside the willingness-to-pay threshold of 30,000 BRL per QALY. If the bar is below the red dashed line, it suggests that the intervention is cost-effective in the base-case scenario.
Graph 1.
This bar chart displays the base-case ICER for each intervention alongside the willingness-to-pay threshold of 30,000 BRL per QALY. If the bar is below the red dashed line, it suggests that the intervention is cost-effective in the base-case scenario.
What It Shows
This bar chart illustrates the Incremental Cost-Effectiveness Ratio (ICER) for each of the three health interventions in the base, or “starting,” scenario.
The red dashed line represents the Willingness-to-Pay (WTP) threshold: the maximum amount society (or the health system) is prepared to pay for one extra unit of health benefit (in this case, one Quality-Adjusted Life Year, QALY).
Why It Matters
The ICER tells us how much money must be spent to gain one additional QALY compared to the current standard of care (“no intervention” scenario).
If the bar for an intervention’s ICER is below the red line, it suggests that the intervention is considered “cost-effective” under these assumptions, because we are not paying more than our maximum “willingness to pay.”
How to Interpret
Each bar represents one of the three interventions—AI, Communications, and Telemedicine.
A shorter bar means the intervention is more cost-effective, because less money is spent for each QALY gained.
If a bar is well below the red line, it is likely a good candidate for adoption in a health system that follows this threshold principle.
Graph 2: Base NMB Comparison
Graph 2.
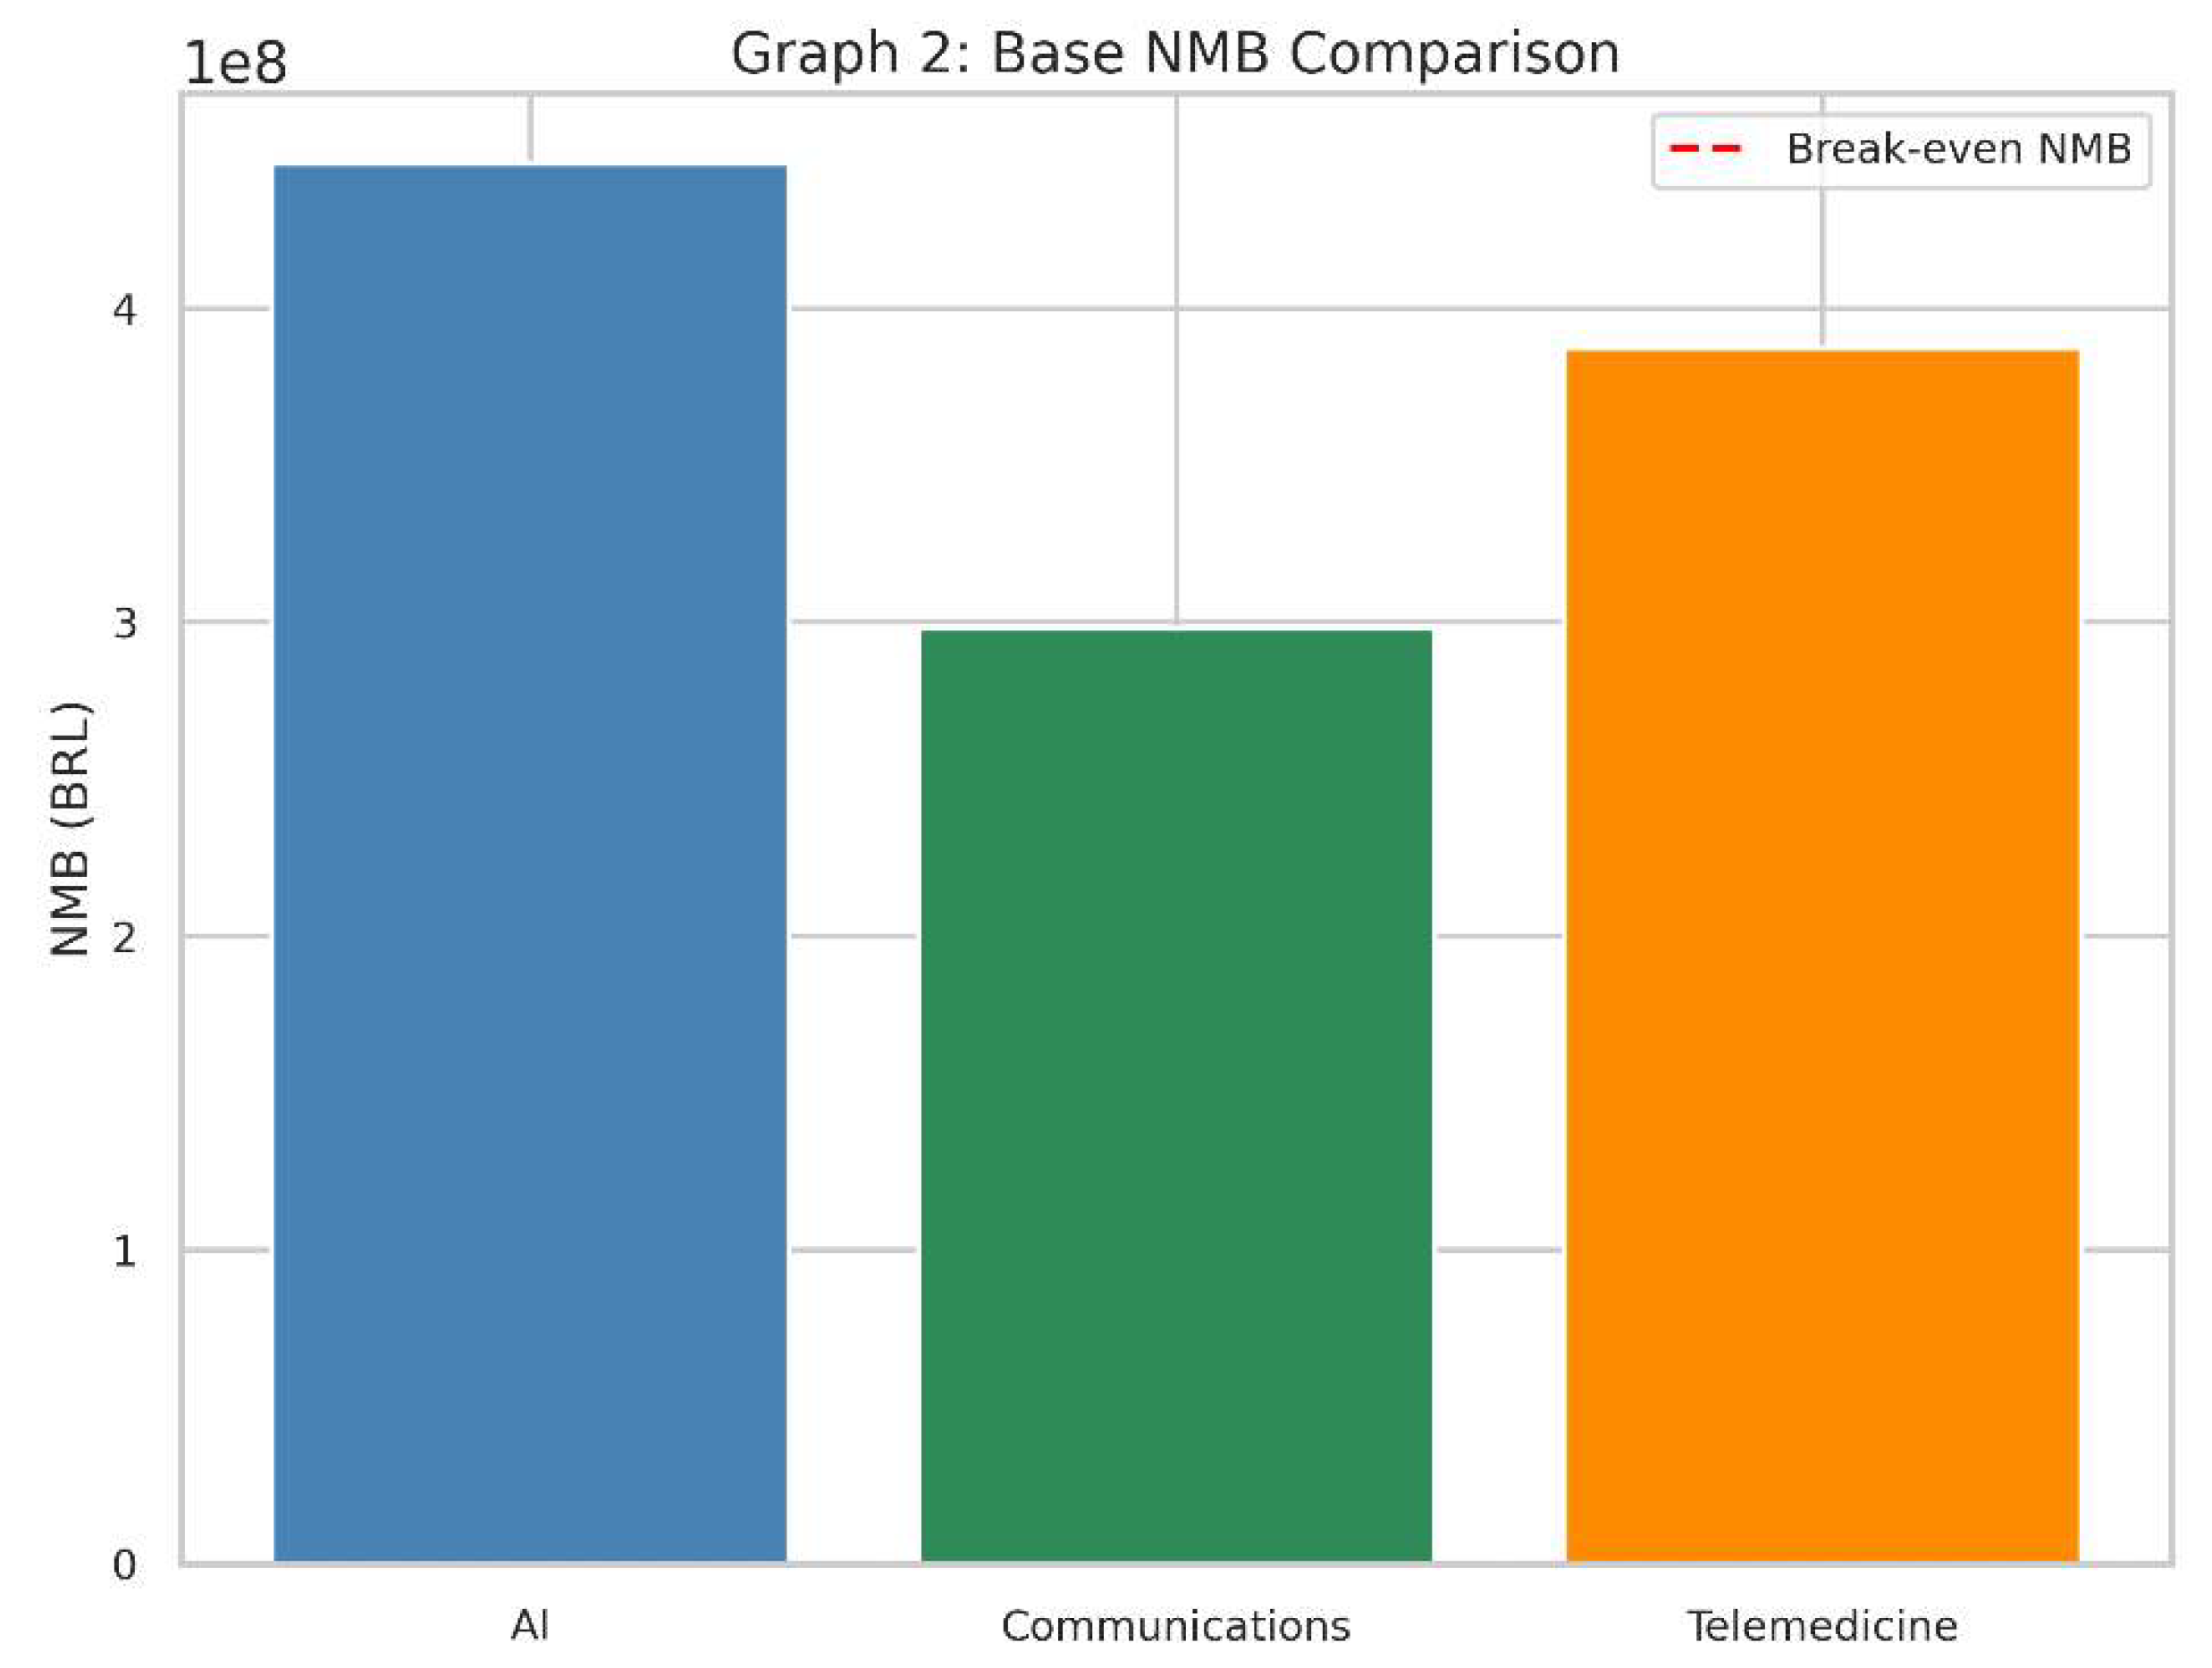
Base NMB Comparison. The second bar chart captures the net monetary benefit for each intervention at baseline. A positive bar (above zero) implies a favourable cost-effectiveness profile.
Graph 2.
Base NMB Comparison. The second bar chart captures the net monetary benefit for each intervention at baseline. A positive bar (above zero) implies a favourable cost-effectiveness profile.
What It Shows
This bar chart represents the Net Monetary Benefit (NMB) of each intervention in the same baseline scenario.
The red dashed line at zero on the vertical axis indicates a “break-even” point: an NMB of exactly 0.
Why It Matters
NMB converts health gains (QALYs) into a monetary value by multiplying them by the willingness-to-pay threshold.
It then subtracts the cost of the intervention to see if, financially speaking, the technology provides more value than it costs.
How to Interpret
A positive NMB (bar above zero) means that, given our threshold, the intervention’s benefits in QALYs exceed its costs.
A negative NMB (bar below zero) implies the intervention costs more than the value of the health it provides, so it is not considered cost-effective in this context.
The higher the bar above zero, the more economically attractive it is, assuming our willingness-to-pay threshold remains the same.
Graph 3: ICER Sensitivity Analysis
Graph 3.
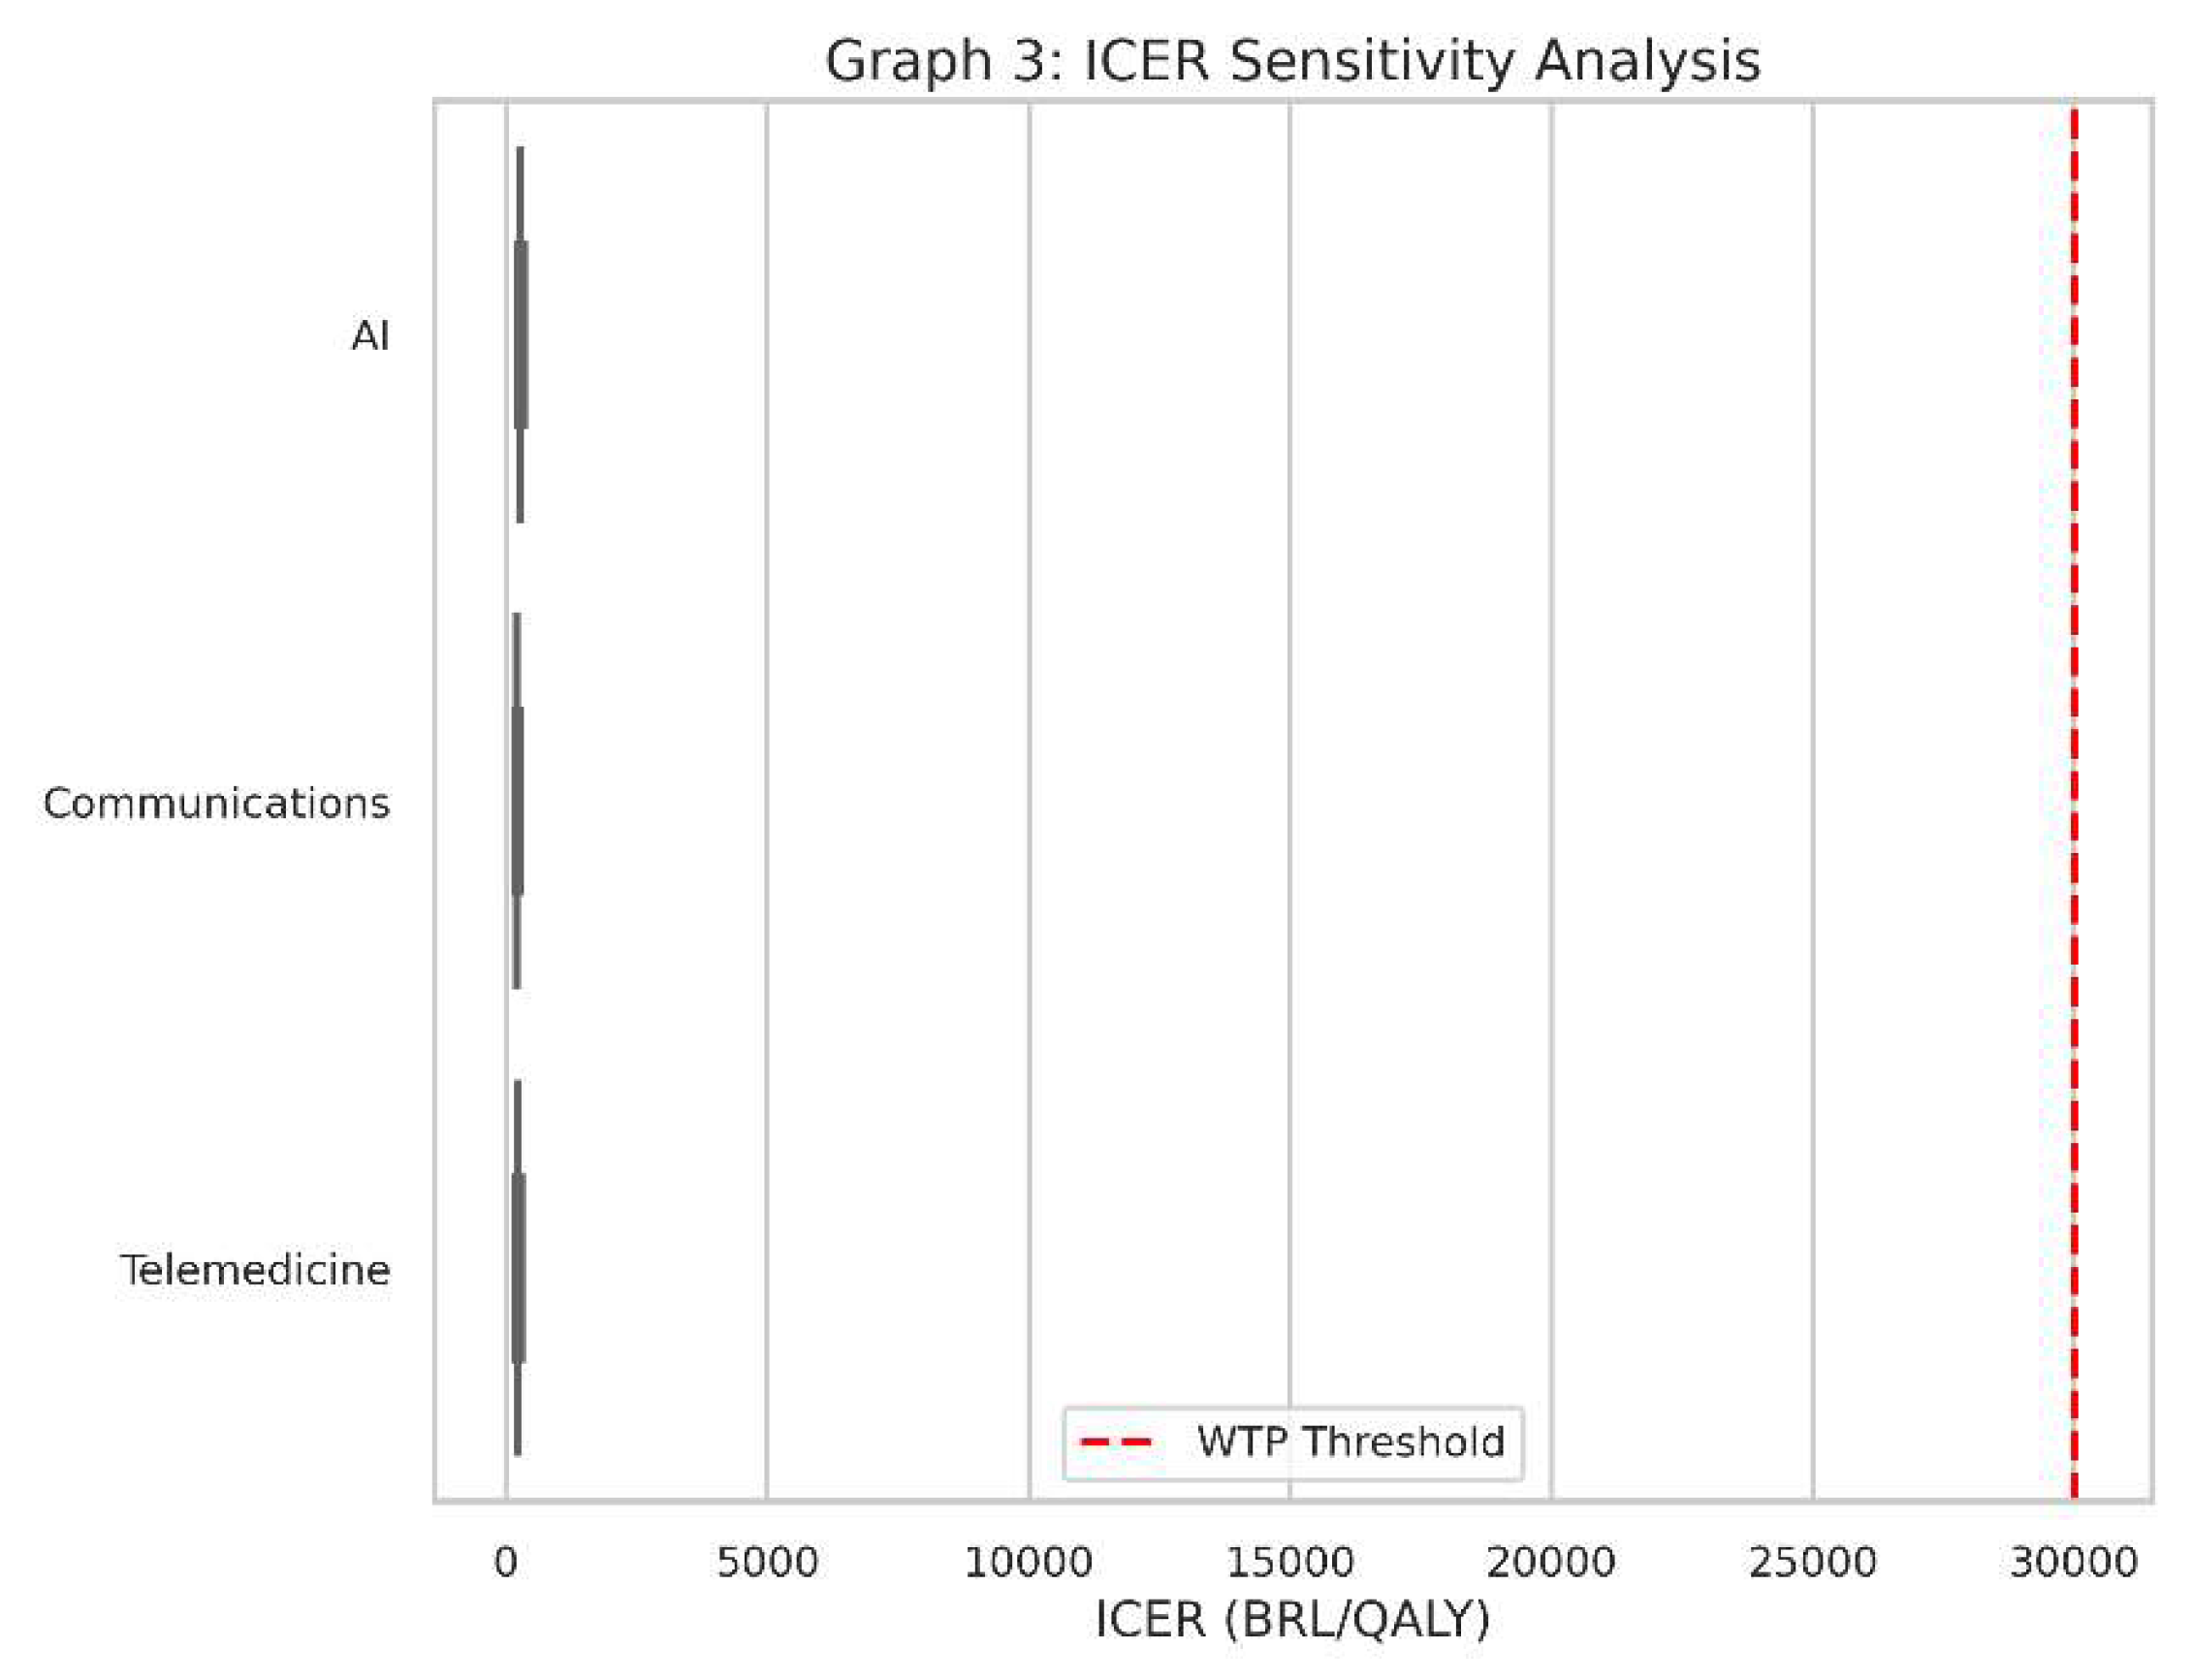
ICER Sensitivity Analysis. Presented as a boxplot, this graph aggregates the ICER results across multiple cost and QALY variation scenarios. The variability in each box indicates how sensitive each intervention’s cost-effectiveness is to changes in costs and health outcomes.
Graph 3.
ICER Sensitivity Analysis. Presented as a boxplot, this graph aggregates the ICER results across multiple cost and QALY variation scenarios. The variability in each box indicates how sensitive each intervention’s cost-effectiveness is to changes in costs and health outcomes.
What It Shows
This is a boxplot for the ICER values of all three interventions when we account for variations in cost and health outcomes.
Instead of one ICER value for each intervention, we have a range of possible ICERs, reflecting uncertainty or changes in real-world conditions (e.g., if the intervention is more expensive than we initially thought or slightly less effective).
Why It Matters
Real-world conditions always vary from the assumptions made in a single “base” scenario. Costs might be 20% higher, or QALYs might be 10% lower, and so on.
Sensitivity analysis tells us how robust our findings are. If an intervention consistently stays under the red dashed line (the WTP threshold) despite cost or outcome changes, it’s said to be “robustly cost-effective.”
How to Interpret
Each box in the boxplot represents the spread of ICER values under different combinations of costs and QALY assumptions.
A box that lies entirely below the red line indicates that, for almost all tested scenarios, the intervention remains below the willingness-to-pay threshold.
A box that crosses above and below the line suggests the technology could be cost-effective in some scenarios but not in others.
Graph 4: NMB Sensitivity Analysis
Graph 4.
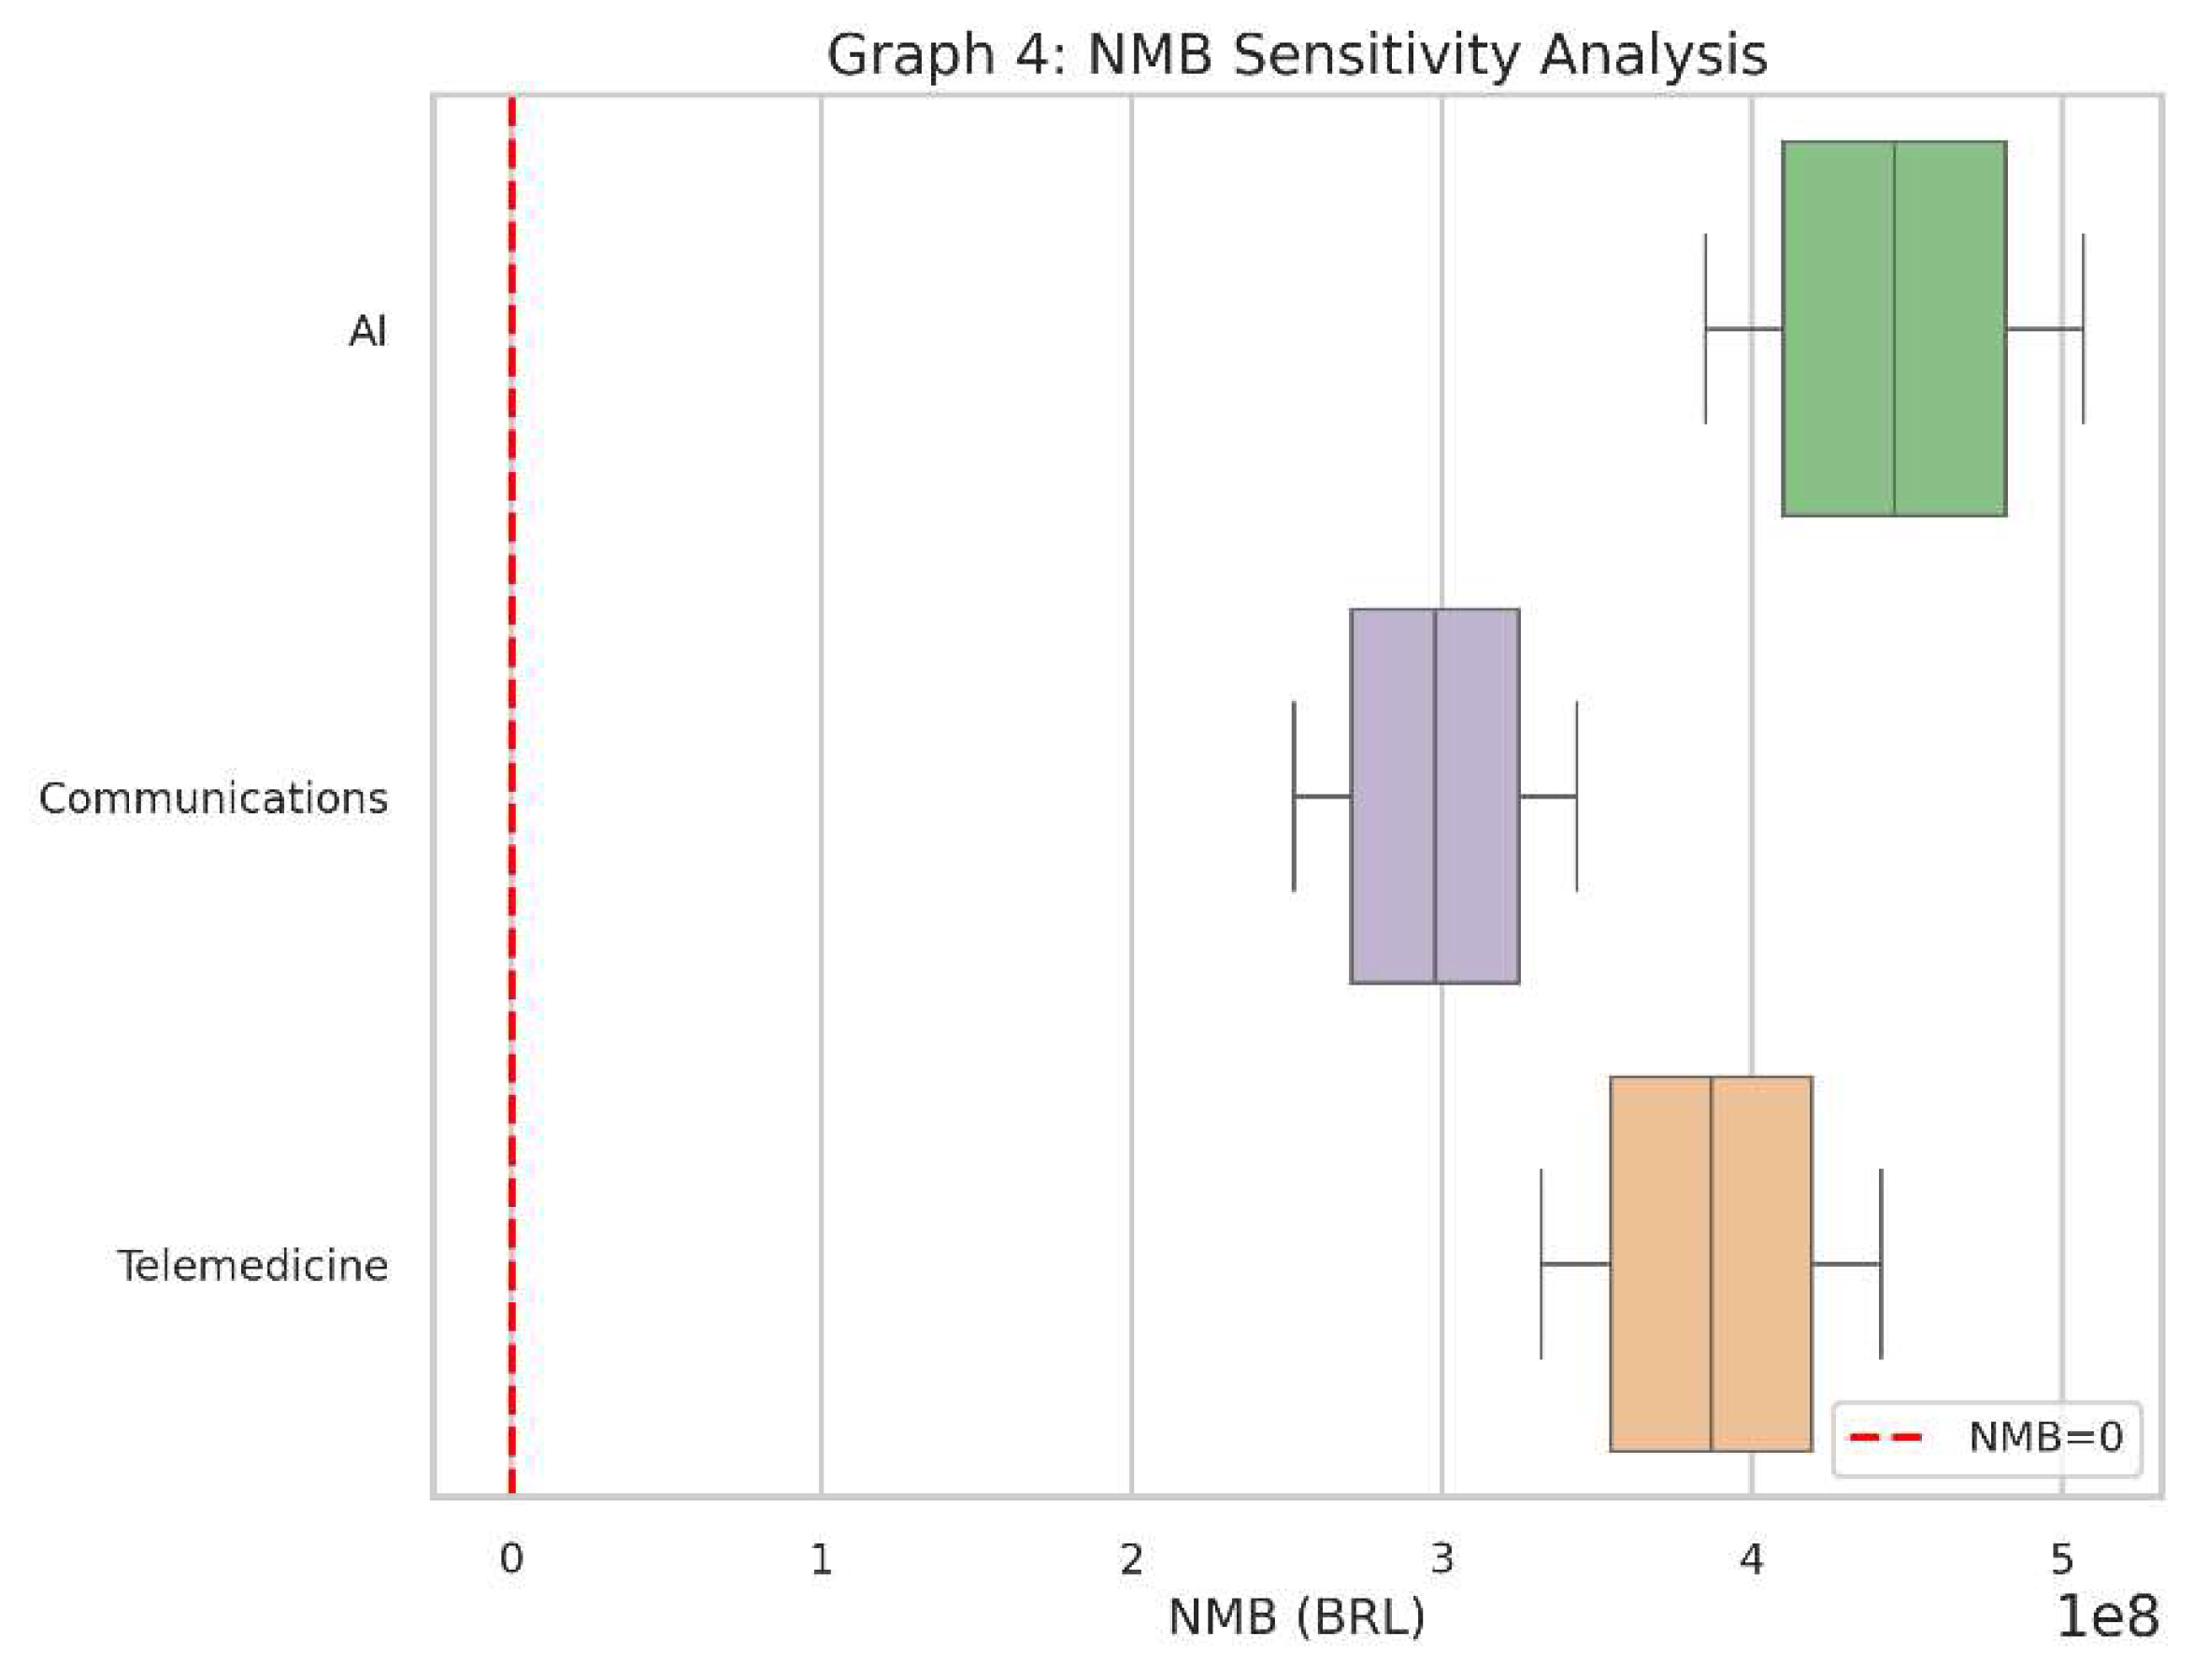
NMB Sensitivity Analysis. Similar to Graph 3, but this time focusing on net monetary benefit. Interventions showing consistently positive NMB values under the tested variations are robustly cost-effective.
Graph 4.
NMB Sensitivity Analysis. Similar to Graph 3, but this time focusing on net monetary benefit. Interventions showing consistently positive NMB values under the tested variations are robustly cost-effective.
What It Shows
This boxplot captures the Net Monetary Benefit (NMB) outcomes for each of the three interventions under the same range of assumptions (costs and QALYs).
The red dashed line at zero shows the “break-even” point for NMB.
Why It Matters
Like the ICER boxplot, this helps us see if the interventions remain financially attractive across various “real-world” conditions.
If a particular intervention’s NMB stays consistently above zero, it suggests it provides net positive value in almost all tested circumstances.
How to Interpret
Each box represents the distribution of NMB results after simulating cost and QALY variations.
If the box is mostly above zero, the intervention is often (or nearly always) cost-effective.
If the box hovers around zero or dives below it, there’s more risk or uncertainty about whether it will deliver sufficient value.
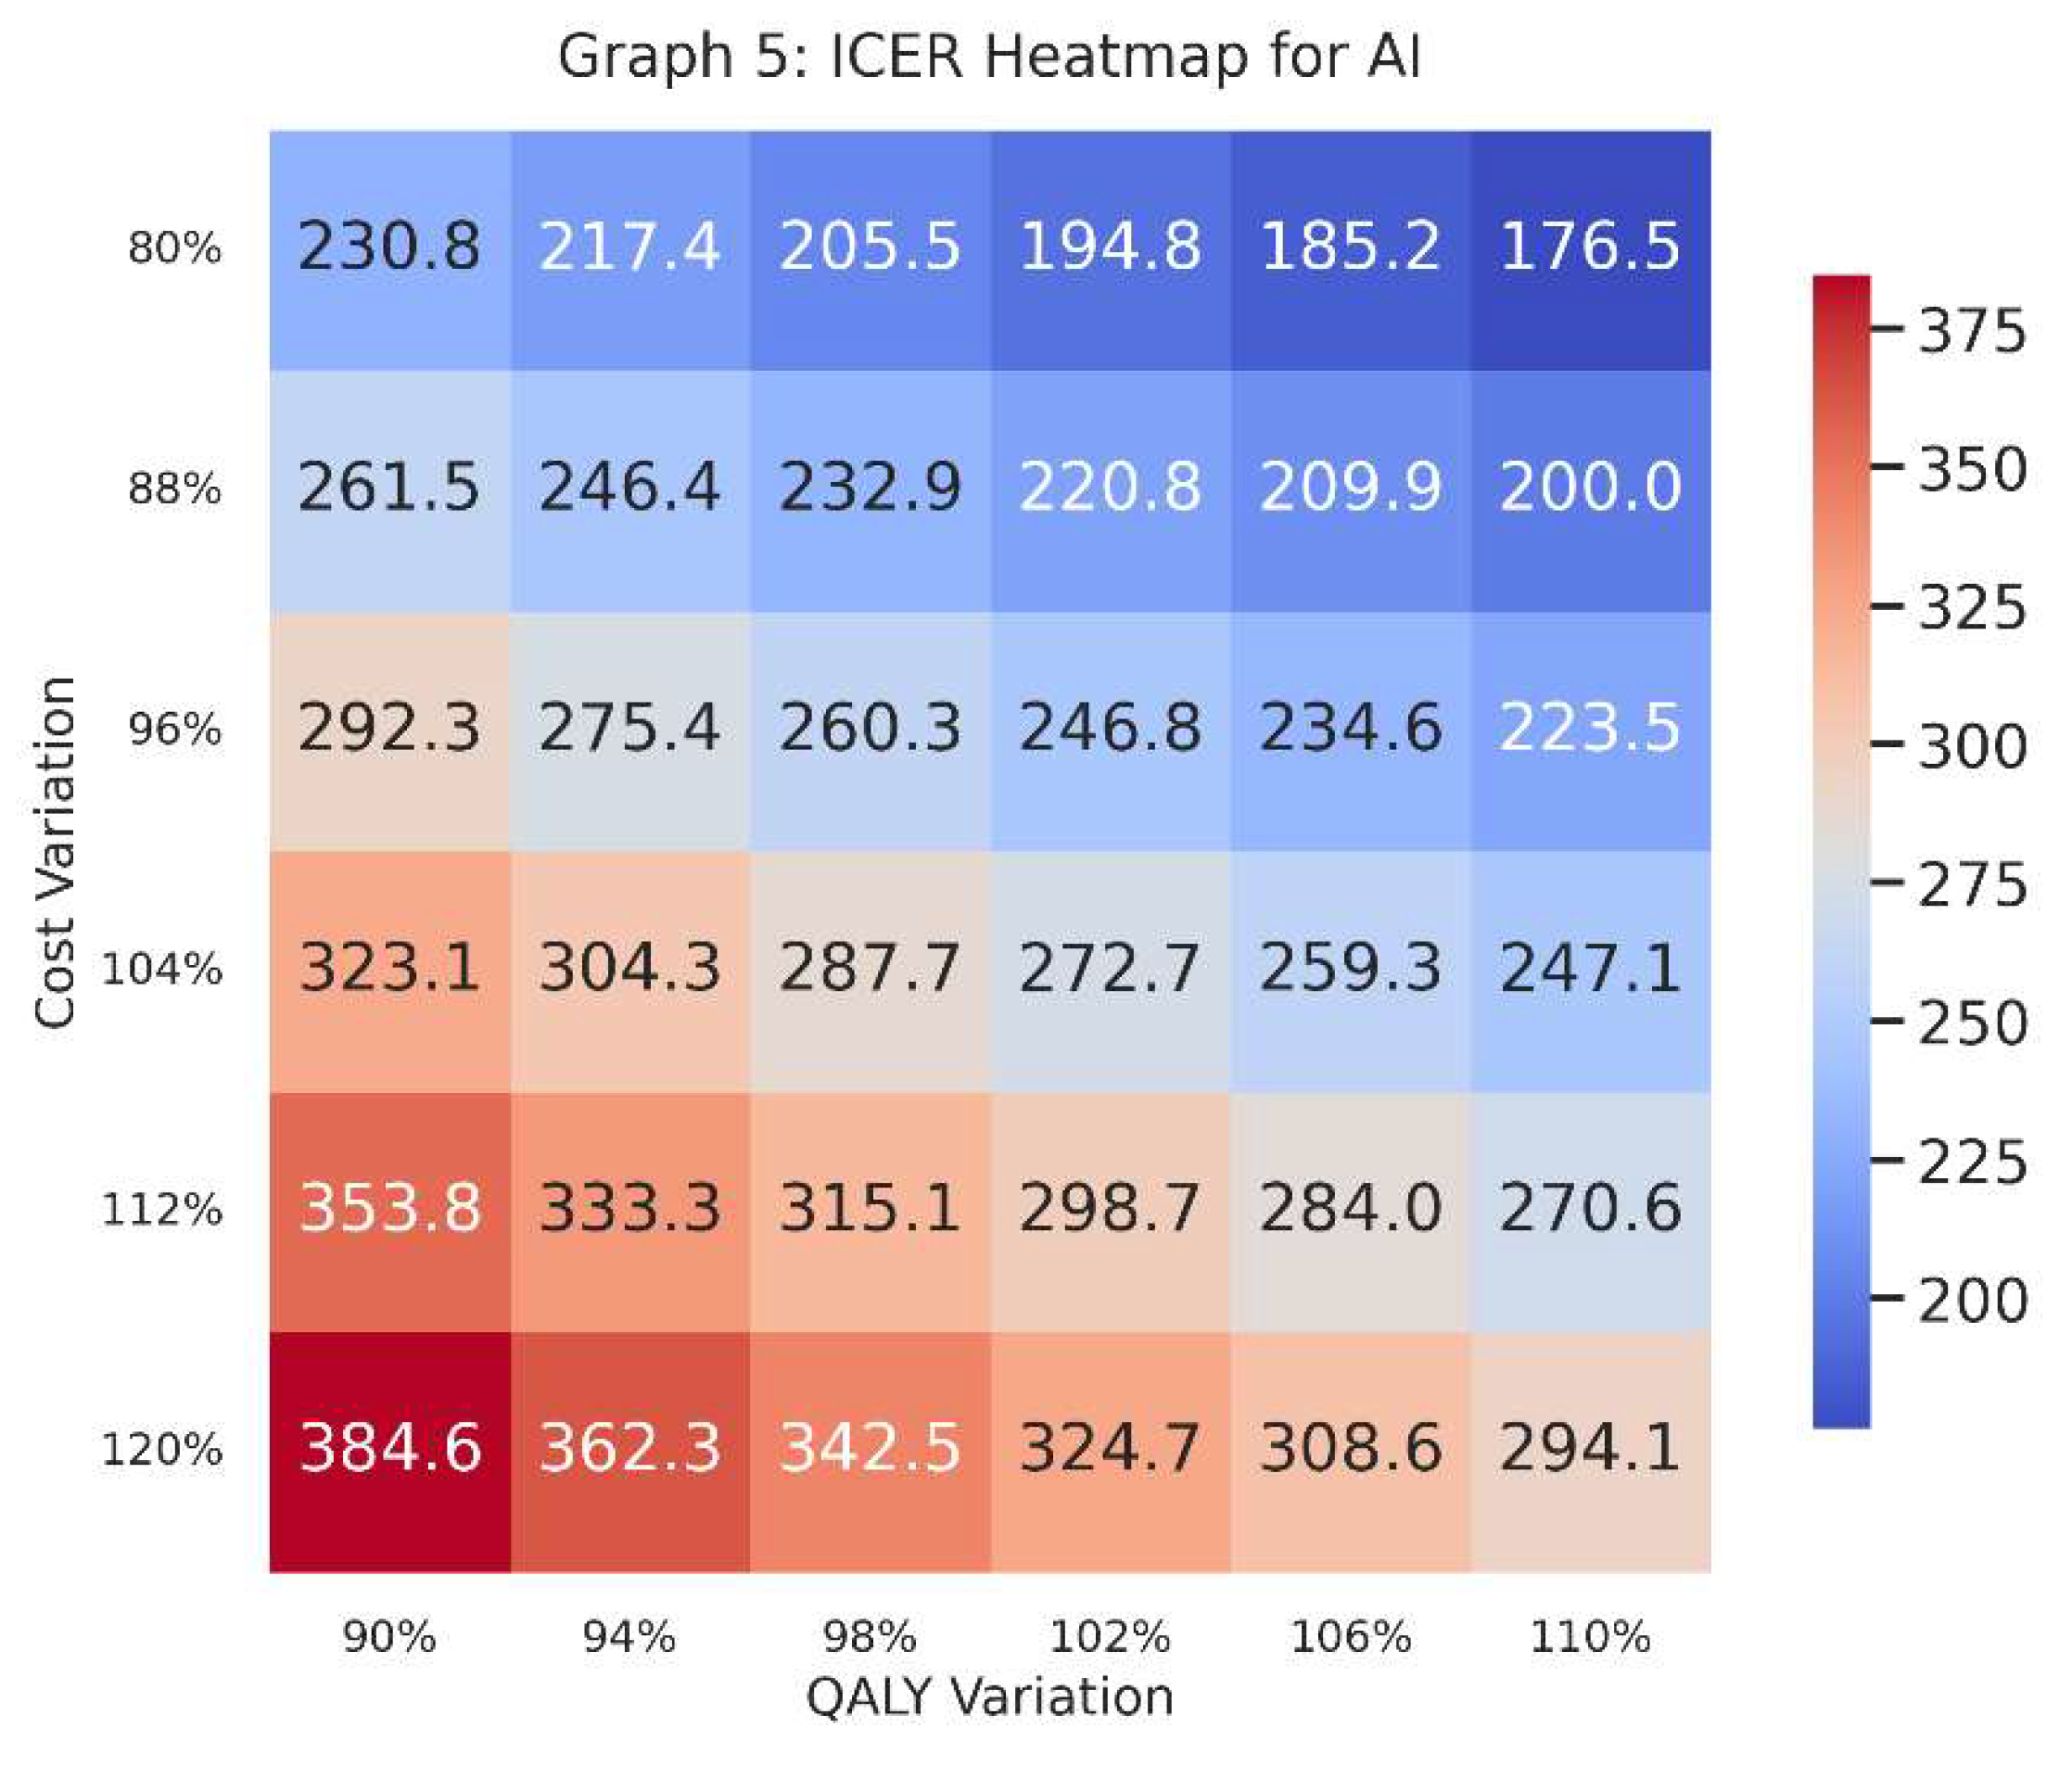
Graph 5: ICER Heatmap for AI
Graph 5.
NMB Sensitivity Analysis. Similar to Graph 3, but this time focusing on net monetary benefit. Interventions showing consistently positive NMB values under the tested variations are robustly cost-effective.
Graph 5.
NMB Sensitivity Analysis. Similar to Graph 3, but this time focusing on net monetary benefit. Interventions showing consistently positive NMB values under the tested variations are robustly cost-effective.
What It Shows
This heatmap focuses specifically on one intervention—in this case, AI—and plots ICER values across a grid of cost variations (vertical axis) and QALY variations (horizontal axis).
Each cell in the heatmap shows the ICER given a specific combination of increased/decreased costs and increased/decreased QALYs.
Why It Matters
A heatmap provides a visual map of where AI stands in terms of cost-effectiveness if costs go up or down by a certain percentage and effectiveness (QALYs) also goes up or down by a certain percentage.
Decision-makers can see at a glance the “danger zones” where the ICER might exceed the willingness-to-pay threshold, or the “safe zones” where it remains comfortably below.
How to Interpret
-
Colours indicate how large or small the ICER is. Generally, we compare the numerical value in each cell to our threshold (e.g., 30,000 BRL/QALY).
o A lower ICER is typically better, implying cost-effectiveness.
o A higher ICER might surpass the threshold, signifying a risk of being too expensive for the health gains provided.
The row labels (“Cost Variation”) indicate whether we are looking at 80%, 90%, 100%, 110%, or 120% of the original estimated cost; the column labels (“QALY Variation”) show whether the QALYs are slightly lower or higher than the baseline guess.
Putting It All Together
Taken as a set, these five graphs give decision-makers a comprehensive view:
Graphs 1 & 2 show baseline (or “base-case”) cost-effectiveness values: a snapshot without variations.
Graphs 3 & 4 explore how each intervention’s results shift when costs and QALYs fluctuate, indicating stability or volatility.
Graph 5 dives deeper into the AI intervention, visualising where it remains cost-effective (or not) across multiple hypothetical scenarios of cost and QALY performance.
Together, these charts provide a holistic understanding of the possible outcomes. Policy-makers, hospital administrators, and public health officials can use this information to see if, how, and when these interventions might be worth adopting in a real healthcare system—especially one that, like many, faces limited resources and competing priorities.
Section 4. Discussion
Health Technology Assessment (HTA) is designed to furnish policy-makers with robust, evidence-based insights that can drive the adoption or rejection of new health interventions. In Brazil, a country noted for both its unified public healthcare system (SUS) and a dynamic supplementary health sector, HTA occupies an essential nexus between political, economic, and public health priorities (Ministério da Saúde, 2023). Our theoretical framework aims to examine whether investing in artificial intelligence (AI), improved communications, and telemedicine can yield meaningful population health benefits that outweigh their financial costs. By emphasising population health gains rather than profit, we align our analysis with the ethos of universal coverage that underpins the SUS while also recognising the private sector’s innovations.
Section 4.1. The Political Dimension of HTA
Brazil’s federal structure devolves healthcare delivery to states and municipalities, although the Ministry of Health retains substantial authority. Adding to this complexity, the supplementary sector is regulated by a separate governmental agency (ANS, 2022). The political impetus behind HTA processes is the desire to demonstrate responsible governance—particularly in a climate of heightened public scrutiny over health expenditures. Multiple stakeholders, including politicians, health officials, professional bodies, and patient advocacy groups, lobby for their respective interests. The incorporation of new technologies can be a politically appealing proposition for leaders wishing to appear at the forefront of innovation and responsiveness (Souza & Mendes, 2021). Our findings, generated through cost-effectiveness analysis, can guide such decisions by providing transparent metrics of value-for-money.
Section 4.2. Economic Considerations in the Brazilian Context
Health expenditures in Brazil, according to the latest data from DataSUS (2022), have been rising steadily, partly due to the expanding burden of chronic diseases and the growing adoption of costly medical interventions. A key question for decision-makers is whether the societal return on investment in health justifies the budgetary strain. By translating each intervention’s benefits into QALYs gained, and then aligning those QALYs with a willingness-to-pay threshold (λ\lambdaλ), we create a common metric that can inform prioritisation. Traditional economic theory would suggest that if the interventions pass a defined cost-effectiveness threshold, they should be adopted, provided that funding is available and equitable distribution mechanisms are in place (Drummond et al., 2015).
AI has shown promise globally for reducing diagnostic error rates and improving care coordination (Rezende et al., 2022). In resource-limited settings like certain regions of Brazil, AI-driven solutions could alleviate physician shortages by providing decision support tools. Economically, the initial investment can be high for building the necessary computational infrastructure and training staff. However, as illustrated in our ICER (Equation 1) calculations, the cost per QALY for AI can be kept under control if the scale of deployment is sufficiently large (i.e., if AI solutions are rolled out to multiple facilities or entire state health networks). Additionally, AI-based interventions can promote earlier disease detection and management, thereby preventing more expensive care down the line.
Improved communications, while less technologically flashy than AI, can significantly enhance care quality and reduce unnecessary expenditures. For example, better patient-provider communication systems may curb hospital readmission rates, reduce medication errors, and ensure consistent follow-up. The economic rationale hinges on cost savings from fewer avoidable complications. However, the data from Graphs 3 and 4 in our results indicate that communications-based interventions might exhibit a broader variability in cost-effectiveness. This could be due to the need for ongoing software maintenance, training, and user adoption. The intangible nature of “better communication” also complicates measurement, making it crucial to define precise outcome indicators, such as reductions in readmission rates or improvements in patient-reported outcomes (Sanders & Haines, 2019).
Telemedicine, the third area we examined, has gained widespread attention in Brazil, especially in remote regions where in-person consultations with specialists are scant (DataSUS, 2022). By bridging geographic gaps, telemedicine could address long-standing inequities in access to quality care. The economic dimension concerns whether the infrastructure costs—broadband connections, telemedicine platforms, and specialist salaries—are outweighed by the reduction in patient travel, fewer clinical complications arising from delayed diagnosis, and the potential for earlier interventions. Our results suggest that telemedicine can be cost-effective if scaled properly, but remains vulnerable to cost fluctuations, particularly in equipment procurement and infrastructure maintenance. Furthermore, regulatory barriers and payment structures in the private sector might create disincentives to widespread adoption, underlining the need for policy alignment (Trujillo et al., 2020).
Section 4.3. Equity and Social Justice Considerations
Although our model is framed around cost-effectiveness, the broader purpose of HTA in Brazil extends to fostering equity in access to healthcare (Novaes, 2019). The universal coverage principle enshrined in the Brazilian constitution emphasises that social value goes beyond monetary metrics. An intervention could be cost-effective overall but fail to reach the populations most in need, thus undermining its social utility. AI, for instance, might primarily benefit urban centres with robust connectivity and digital infrastructure unless specific efforts are made to deploy AI solutions in rural or marginalised communities. For improved communications, digitally literate populations may reap disproportionate benefits unless literacy and training are integrated into the rollout. Similarly, telemedicine’s success hinges on the availability of stable internet access and local capacity to operate telehealth platforms (Souza & Mendes, 2021). Policy-makers must consider these contextual factors to ensure that cost-effectiveness analyses do not inadvertently perpetuate existing inequalities.
Section 4.4. The Role of DataSUS and Real-World Implementation
DataSUS, maintained by the Ministry of Health, offers a goldmine of information regarding disease prevalence, hospital admission rates, mortality, and service utilisation. Integrating these data into HTA models can reduce uncertainties and make predictions more accurate (DataSUS, 2022). For AI, local epidemiological data is essential to train algorithms that reflect the Brazilian population’s genetic, environmental, and socio-economic characteristics. For communications-based interventions, utilisation patterns gleaned from DataSUS can pinpoint inefficiencies (e.g., frequent emergency visits that could be avoided through better outpatient care). Telemedicine decision models can benefit from precise geolocation data highlighting service gaps. Despite this wealth of information, challenges remain in data quality, completeness, and timeliness. Addressing data fragmentation, standardisation, and integration across states is critical for a robust HTA framework (Novaes, 2019).
Section 4.5. Strengths and Limitations of Our Theoretical Approach
The primary strength of our framework lies in its capacity to capture the cost-effectiveness dimension across diverse technologies. By focusing on AI, communications, and telemedicine—each with distinct cost structures and potential benefits—we illustrate how HTA can operate in a multi-technology environment. The inclusion of the net monetary benefit (NMB) approach (Equation 3) further refines the decision criteria, offering a direct monetary interpretation of whether an intervention surpasses the willingness-to-pay threshold.
However, our analysis remains theoretical, relying on hypothetical cost and QALY inputs rather than real-world evidence. In practice, the efficacy of AI algorithms may wane if the available data is unrepresentative; communications platforms may fail if user engagement is low; telemedicine platforms may be underutilised in places lacking reliable internet. Additionally, we have not accounted for intangible factors such as patient satisfaction, healthcare workforce morale, or societal preference for certain types of interventions. While cost-effectiveness thresholds (λ\lambdaλ) exist as guiding principles, real decision-making often involves political bargaining, negotiation with industry stakeholders, and public sentiment (Sachs et al., 2021).
Section 4.6. Policy Implications for SUS and the Private Sector
Brazil’s National Committee for Health Technology Incorporation (CONITEC) plays a pivotal role in the SUS context, issuing guidelines on whether to adopt or reject new interventions. In the private sector, health insurers also undertake cost-benefit analyses, albeit with an eye towards profitability. A key policy question is how to harmonise these processes so that cost-effectiveness findings can be consistently applied across both systems. The discrepancy in adoption timelines between public and private sectors can lead to inequities, with private patients potentially accessing novel treatments earlier than those relying solely on the SUS (ANS, 2022). While some see this as a legitimate reflection of market dynamics, others argue that essential interventions—especially those with significant public health implications—should be quickly integrated into the SUS.
Our results show that AI, communications improvements, and telemedicine can all be cost-effective under plausible assumptions. Policy-makers could use these findings to support pilot programmes or phased rollouts. Scaling up from pilot to national coverage requires careful planning, especially regarding funding mechanisms and workforce training. For example, AI solutions necessitate robust data privacy measures and ethical guidelines to protect patients. Enhanced communications platforms require healthcare providers to adapt their workflows and maintain an ongoing relationship with patients. Telemedicine demands inter-state agreements regarding licensure and reimbursement, ensuring that providers in one region can legally treat patients in another (Trujillo et al., 2020).
Section 4.7. International Comparisons
Countries with universal healthcare systems, such as the United Kingdom (NHS) and Canada, also employ HTA to manage the integration of new technologies. While these contexts share some similarities with Brazil’s SUS, differences in demographic structure, disease profile, and overall resource levels need to be considered when drawing parallels (Sanders & Haines, 2019). Middle-income nations, including those in Latin America, often look to Brazilian HTA practices for inspiration, given Brazil’s size and leadership in regional health initiatives. The supplementary sector, however, introduces a layer of complexity that may not exist in single-payer models found elsewhere.
Section 4.8. Future Research Directions
Expanding upon this theoretical analysis, future research could focus on pragmatic trials that generate real-world evidence, particularly regarding AI interventions in remote areas. Longitudinal studies capturing the evolution of patient outcomes over multiple years would more precisely ascertain cost-effectiveness, especially for chronic disease management. Researchers might also probe the sociocultural dimensions that shape patient acceptance of telemedicine or AI-driven diagnostics. Another fruitful area is the exploration of risk-sharing agreements between technology providers and payers, wherein reimbursements are tied to actual outcomes, thus sharing the financial risk of uncertain efficacy.
Given the importance of data quality, additional work on how to unify and standardise different segments of DataSUS is warranted. Machine learning techniques could help detect data anomalies and fill gaps, thereby improving the reliability of HTA models. Interdisciplinary collaborations—bridging health economists, data scientists, clinicians, and patient advocates—will be paramount in refining these approaches (Rezende et al., 2022).
Section 4.9. Balancing Innovation with Social Responsibility
Brazil’s healthcare system, with its ambitious universal coverage goals, stands at a crossroads. The adoption of emerging technologies like AI can catapult the system into a new era of precision and efficiency, but only if such moves are steered by rigorous assessment processes that value population health above commercial gain. Our analysis underscores the potential for cost-effective deployment of AI, improved communication, and telemedicine, yet highlights that contextual nuances—political, economic, cultural, and infrastructural—can make or break their success. Policy-makers in both the SUS and the private sector must remain cognisant of equity implications, ensuring that technological advances do not widen the gap between privileged and underserved communities.
The synergy between the public and private sectors could be harnessed to develop better evidence bases for new technologies. If private providers pilot an intervention and generate real-world data, the SUS can benefit by observing its effectiveness before wide-scale adoption. Conversely, if SUS invests in robust training and capacity-building for advanced solutions, private players may piggyback on the trained workforce. This collaborative dynamic, however, requires transparent governance and shared objectives, which HTA can facilitate by offering a neutral, data-driven framework for evaluating interventions.
In sum, the discussion has positioned HTA as both an instrument of prudent fiscal management and a facilitator of progressive health policy. By quantifying the population health benefits of AI, better communications, and telemedicine, we provide a glimpse of how Brazil—and other similar contexts—can harness innovation to meet modern healthcare challenges. The journey ahead involves carefully balancing innovation with social justice principles, ensuring that every real or hypothetical Real (BRL) spent is directed towards maximising health and well-being for all segments of society.
Section 5. Conclusion
Health Technology Assessment in Brazil serves as a linchpin for resource allocation decisions in both the SUS and the supplementary health sector. Our theoretical analysis indicates that well-chosen investments in AI, enhanced communication systems, and telemedicine can indeed be cost-effective, improving population health sufficiently to justify their costs—without resorting to profit-driven rationales. The results, supported by illustrative Python-based simulations and sensitivity analyses, reveal the critical interplay between costs, QALYs, and willingness-to-pay thresholds. While AI shows particular promise, communications and telemedicine solutions also stand out as beneficial if scaled and managed appropriately.
Ultimately, the political, economic, and public health landscape in Brazil demands a careful, data-driven approach to integrating new technologies. By leveraging resources such as DataSUS and adhering to rigorous HTA principles, policy-makers and stakeholders can ensure that technological innovation enhances, rather than undermines, the universalistic ethos of the SUS. Furthermore, collaboration between public and private sectors, guided by transparent and evidence-based frameworks, will be vital to ensuring equitable access and sustained improvements in health outcomes across Brazil’s diverse population.
Section 6. Attachment
Python Code:
import numpy as np
import matplotlib.pyplot as plt
import seaborn as sns
# ---------------------------------------------------------------------
# 1. Configuration and Data Setup
# ---------------------------------------------------------------------
# Set a style for visual appeal and increase default figure size
sns.set(style=“whitegrid”, context=“talk”, rc={“figure.figsize”: (8, 6)})
# Hypothetical data for 3 interventions
interventions = [“AI”, “Communications”, “Telemedicine”]
base_costs = np.array([5000000, 3000000, 4000000]) # fixed costs (BRL)
base_QALYs = np.array([20000, 15000, 18000]) # QALYs gained
base_costs_no_intervention = 1000000
base_QALYs_no_intervention = 5000
# Willingness-to-Pay Threshold (lambda)
lambda_val = 30000 # in BRL per QALY
# ---------------------------------------------------------------------
# 2. Calculate ICER and NMB
# ---------------------------------------------------------------------
icers = []
nmbs = []
for i in range(len(interventions)):
# Incremental Cost-Effectiveness Ratio (ICER)
delta_cost = (base_costs[i] - base_costs_no_intervention)
delta_QALY = (base_QALYs[i] - base_QALYs_no_intervention)
# To avoid division by zero if QALYs are identical
icer_val = delta_cost / delta_QALY if delta_QALY != 0 else np.inf
icers.append(icer_val)
# Net Monetary Benefit (NMB)
nmbs.append(lambda_val * delta_QALY - delta_cost)
# ---------------------------------------------------------------------
# 3. Sensitivity Analysis Setup
# ---------------------------------------------------------------------
# Cost range: 80% to 120%
cost_range = np.linspace(0.8, 1.2, 6)
# QALY range: 90% to 110%
qaly_range = np.linspace(0.9, 1.1, 6)
icers_sensitivity = []
nmb_sensitivity = []
for c_factor in cost_range:
for q_factor in qaly_range:
icer_temp = []
nmb_temp = []
for i in range(len(interventions)):
cost_i = (base_costs[i] * c_factor) - base_costs_no_intervention
qaly_i = (base_QALYs[i] * q_factor) - base_QALYs_no_intervention
# Avoid division by zero
if qaly_i == 0:
icer_val = np.inf
else:
icer_val = cost_i / qaly_i
icer_temp.append(icer_val)
nmb_temp.append(lambda_val * qaly_i - cost_i)
icers_sensitivity.append(icer_temp)
nmb_sensitivity.append(nmb_temp)
icers_sensitivity = np.array(icers_sensitivity)
nmb_sensitivity = np.array(nmb_sensitivity)
# ---------------------------------------------------------------------
# 4. Generate Visualisations
# ---------------------------------------------------------------------
# (A) Base ICER Comparison (Bar Chart)
plt.figure(figsize=(9, 7))
bars = plt.bar(interventions, icers, color=[’steelblue’, ’seagreen’, ’darkorange’])
plt.axhline(y=lambda_val, color=’red’, linestyle=‘--’, label=’WTP Threshold’)
plt.title(“Graph 1: Base ICER Comparison”, fontsize=16)
plt.ylabel(“ICER (BRL/QALY)”, fontsize=14)
plt.xticks(fontsize=12)
plt.yticks(fontsize=12)
plt.legend(fontsize=12)
# -- Fix the Y-axis so bars are visible even with a large threshold --
max_icer = max(icers)
upper_limit = max(lambda_val, max_icer) * 1.2 # 20% above whichever is bigger
plt.ylim(0, upper_limit)
plt.tight_layout()
plt.savefig(“graph1_base_icer.png”, dpi=300)
plt.close()
# (B) Base NMB Comparison (Bar Chart)
plt.figure(figsize=(9, 7))
bars = plt.bar(interventions, nmbs, color=[’steelblue’, ’seagreen’, ’darkorange’])
plt.axhline(y=0, color=’red’, linestyle=‘--’, label=’Break-even NMB’)
plt.title(“Graph 2: Base NMB Comparison”, fontsize=16)
plt.ylabel(“NMB (BRL)”, fontsize=14)
plt.xticks(fontsize=12)
plt.yticks(fontsize=12)
plt.legend(fontsize=12)
plt.tight_layout()
plt.savefig(“graph2_base_nmb.png”, dpi=300)
plt.close()
# (C) ICER Sensitivity Analysis (Boxplot)
plt.figure(figsize=(9, 7))
sns.boxplot(data=icers_sensitivity, orient=’h’, palette=“Accent”)
plt.axvline(x=lambda_val, color=’red’, linestyle=‘--’, label=’WTP Threshold’)
plt.title(“Graph 3: ICER Sensitivity Analysis”, fontsize=16)
plt.xlabel(“ICER (BRL/QALY)”, fontsize=14)
plt.yticks([0,1,2], interventions, fontsize=12)
plt.xticks(fontsize=12)
plt.legend(fontsize=12)
plt.tight_layout()
plt.savefig(“graph3_icer_sensitivity.png”, dpi=300)
plt.close()
# (D) NMB Sensitivity Analysis (Boxplot)
plt.figure(figsize=(9, 7))
sns.boxplot(data=nmb_sensitivity, orient=’h’, palette=“Accent”)
plt.axvline(x=0, color=’red’, linestyle=‘--’, label=’NMB=0’)
plt.title(“Graph 4: NMB Sensitivity Analysis”, fontsize=16)
plt.xlabel(“NMB (BRL)”, fontsize=14)
plt.yticks([0,1,2], interventions, fontsize=12)
plt.xticks(fontsize=12)
plt.legend(fontsize=12)
plt.tight_layout()
plt.savefig(“graph4_nmb_sensitivity.png”, dpi=300)
plt.close()
# (E) Heatmap of ICER for AI across cost and QALY variations
# Extract AI-specific ICER values (index=0 => AI) and reshape
ai_icers = icers_sensitivity[:, 0].reshape(len(cost_range), len(qaly_range))
plt.figure(figsize=(9, 7))
ax = sns.heatmap(
ai_icers,
annot=True,
fmt=“.1f”,
cmap=“coolwarm”,
cbar_kws={“shrink”: 0.8}, # Adjust color bar size
square=True
)
# Proper tick labels: cost_range => Y-axis, qaly_range => X-axis
ax.set_xticklabels([f”{q*100:.0f}%” for q in qaly_range], fontsize=12, rotation=0)
ax.set_yticklabels([f”{c*100:.0f}%” for c in cost_range], fontsize=12, rotation=0)
plt.title(“Graph 5: ICER Heatmap for AI”, fontsize=16, pad=15)
plt.ylabel(“Cost Variation”, fontsize=14)
plt.xlabel(“QALY Variation”, fontsize=14)
plt.tight_layout()
plt.savefig(“graph5_ai_icer_heatmap.png”, dpi=300)
plt.close()
# (F) Heatmap of NMB for AI across cost and QALY variations
ai_nmb = nmb_sensitivity[:, 0].reshape(len(cost_range), len(qaly_range))
plt.figure(figsize=(9, 7))
ax = sns.heatmap(
ai_nmb,
annot=True,
fmt=“.0f”,
cmap=“YlGnBu”,
cbar_kws={“shrink”: 0.8},
square=True
)
ax.set_xticklabels([f”{q*100:.0f}%” for q in qaly_range], fontsize=12, rotation=0)
ax.set_yticklabels([f”{c*100:.0f}%” for c in cost_range], fontsize=12, rotation=0)
plt.title(“Graph 6: NMB Heatmap for AI”, fontsize=16, pad=15)
plt.ylabel(“Cost Variation”, fontsize=14)
plt.xlabel(“QALY Variation”, fontsize=14)
plt.tight_layout()
plt.savefig(“graph6_ai_nmb_heatmap.png”, dpi=300)
plt.close()
print(“All graphs generated and saved successfully!”)
Conflicts of Interest
The Author claims there are no conflicts of interest.
References
- Agência Nacional de Saúde Suplementar (ANS). (2022). Reports and Analytics on the Supplementary Health Sector. Rio de Janeiro: ANS.
- DataSUS. (2022). Department of Informatics of the Brazilian Unified Health System. Available at: http://www.datasus.gov.br.
- Drummond, M., Sculpher, M., Claxton, K., Stoddart, G., & Torrance, G. (2015). Methods for the Economic Evaluation of Health Care Programmes (4th ed.). Oxford University Press.
- Ministério da Saúde. (2023). Orientações para Avaliação de Tecnologias em Saúde no SUS. Brasília: Ministério da Saúde.
- Novaes, H. “Health Technology Assessment in Brazil: Challenges for Sustainability. ” Cadernos de Saúde Pública, 2019, 35, e00046918. [Google Scholar]
- Rezende, L. F. M., et al. “Artificial Intelligence for Public Health in Brazil: Opportunities and Challenges.”. Revista de Saúde Pública, 2022, 56, 122.
- Sachs, J. D., et al. “Aligning Technology and Financing for Sustainable Universal Health Coverage.”. The Lancet, 2021, 398, 1997–2000.
- Sanders, G. D., & Haines, S. T. “Challenges to Integrating Health Economic Evaluation in Health Policy.”. Medical Decision Making, 2019, 39, 759–761.
- Souza, C., & Mendes, E. V.“Decentralisation and Health Care in Brazil: Searching for Equity amidst Diversity.”. Social Science & Medicine, 2021, 278, 113905.
- Trujillo, A. J., et al. “Challenges to Telemedicine Implementation in Latin America.”. 2020, 35, 576–581.
|
Disclaimer/Publisher’s Note: The statements, opinions and data contained in all publications are solely those of the individual author(s) and contributor(s) and not of MDPI and/or the editor(s). MDPI and/or the editor(s) disclaim responsibility for any injury to people or property resulting from any ideas, methods, instructions or products referred to in the content. |
© 2025 by the authors. Licensee MDPI, Basel, Switzerland. This article is an open access article distributed under the terms and conditions of the Creative Commons Attribution (CC BY) license (http://creativecommons.org/licenses/by/4.0/).