Submitted:
07 February 2025
Posted:
08 February 2025
Read the latest preprint version here
Abstract
This study examines the perceived levels of customer satisfaction and service quality associated with NIAZI express. This sector has not been the focus of prior work or research. This study aims to identify the factors contributing to the acquisition of loyal clients. This quantitative study collects data from respondents using survey research. Data is collected via self-visits to the NIAZI express Lahore terminal using a self-structured questionnaire. All transport users are our research population. A large percentage of Pakistanis use transport providers. Since middle-class people use transportation, many use it. Findings reveal that most passengers express satisfaction, it is essential to devise strategies to address the needs of neutral and dissatisfied customers within the organization. Consistent service, enhanced communication, and incremental improvements in transport services can ensure sustained patronage and a competitive edge for transport operators in Pakistan.
Keywords:
Introduction
Statement of the Problem
Objectives of the Study
- To find out the factors influence of the service quality on customer satisfaction towards local transport company.
Literature Review
Theoretical Framework
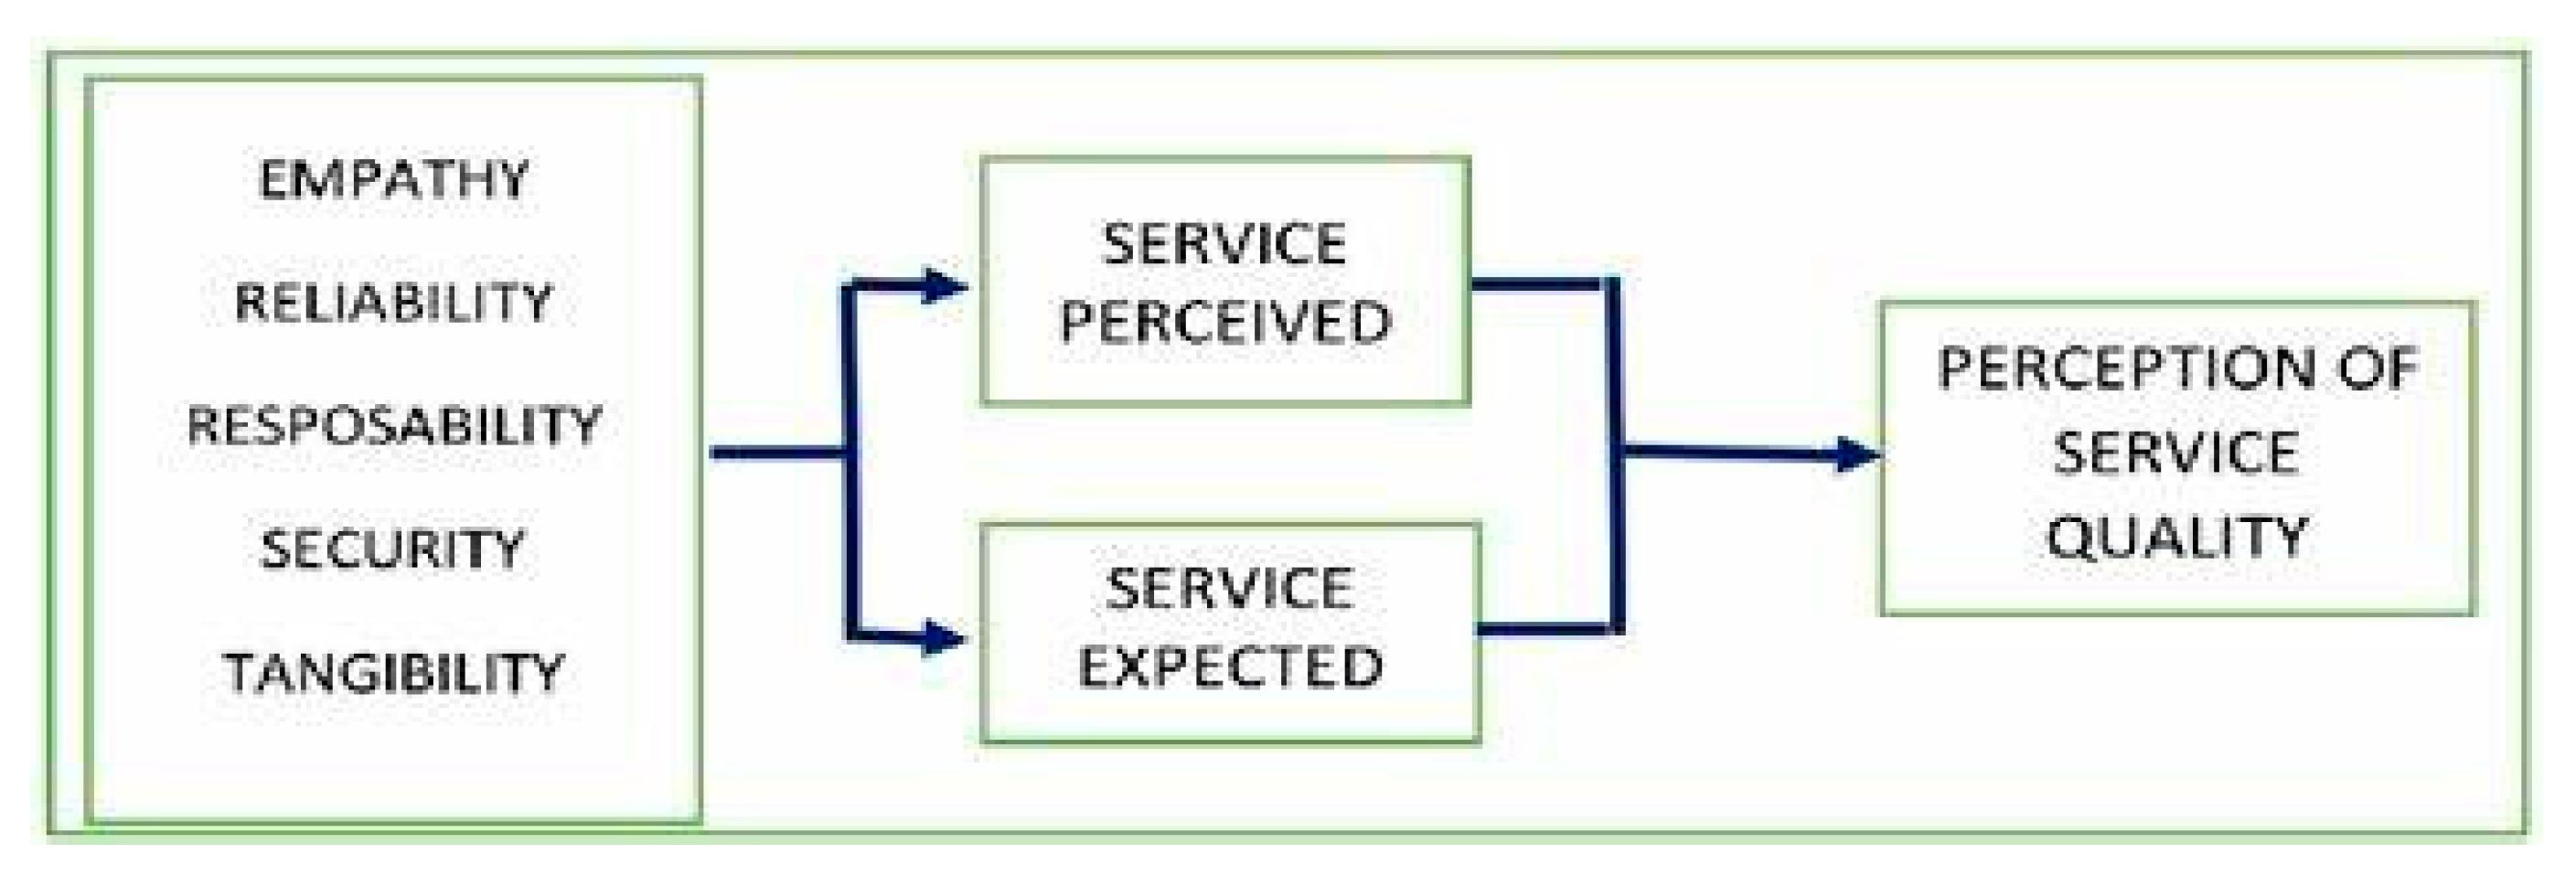
SERVQUAL Model and Service Quality Dimensions
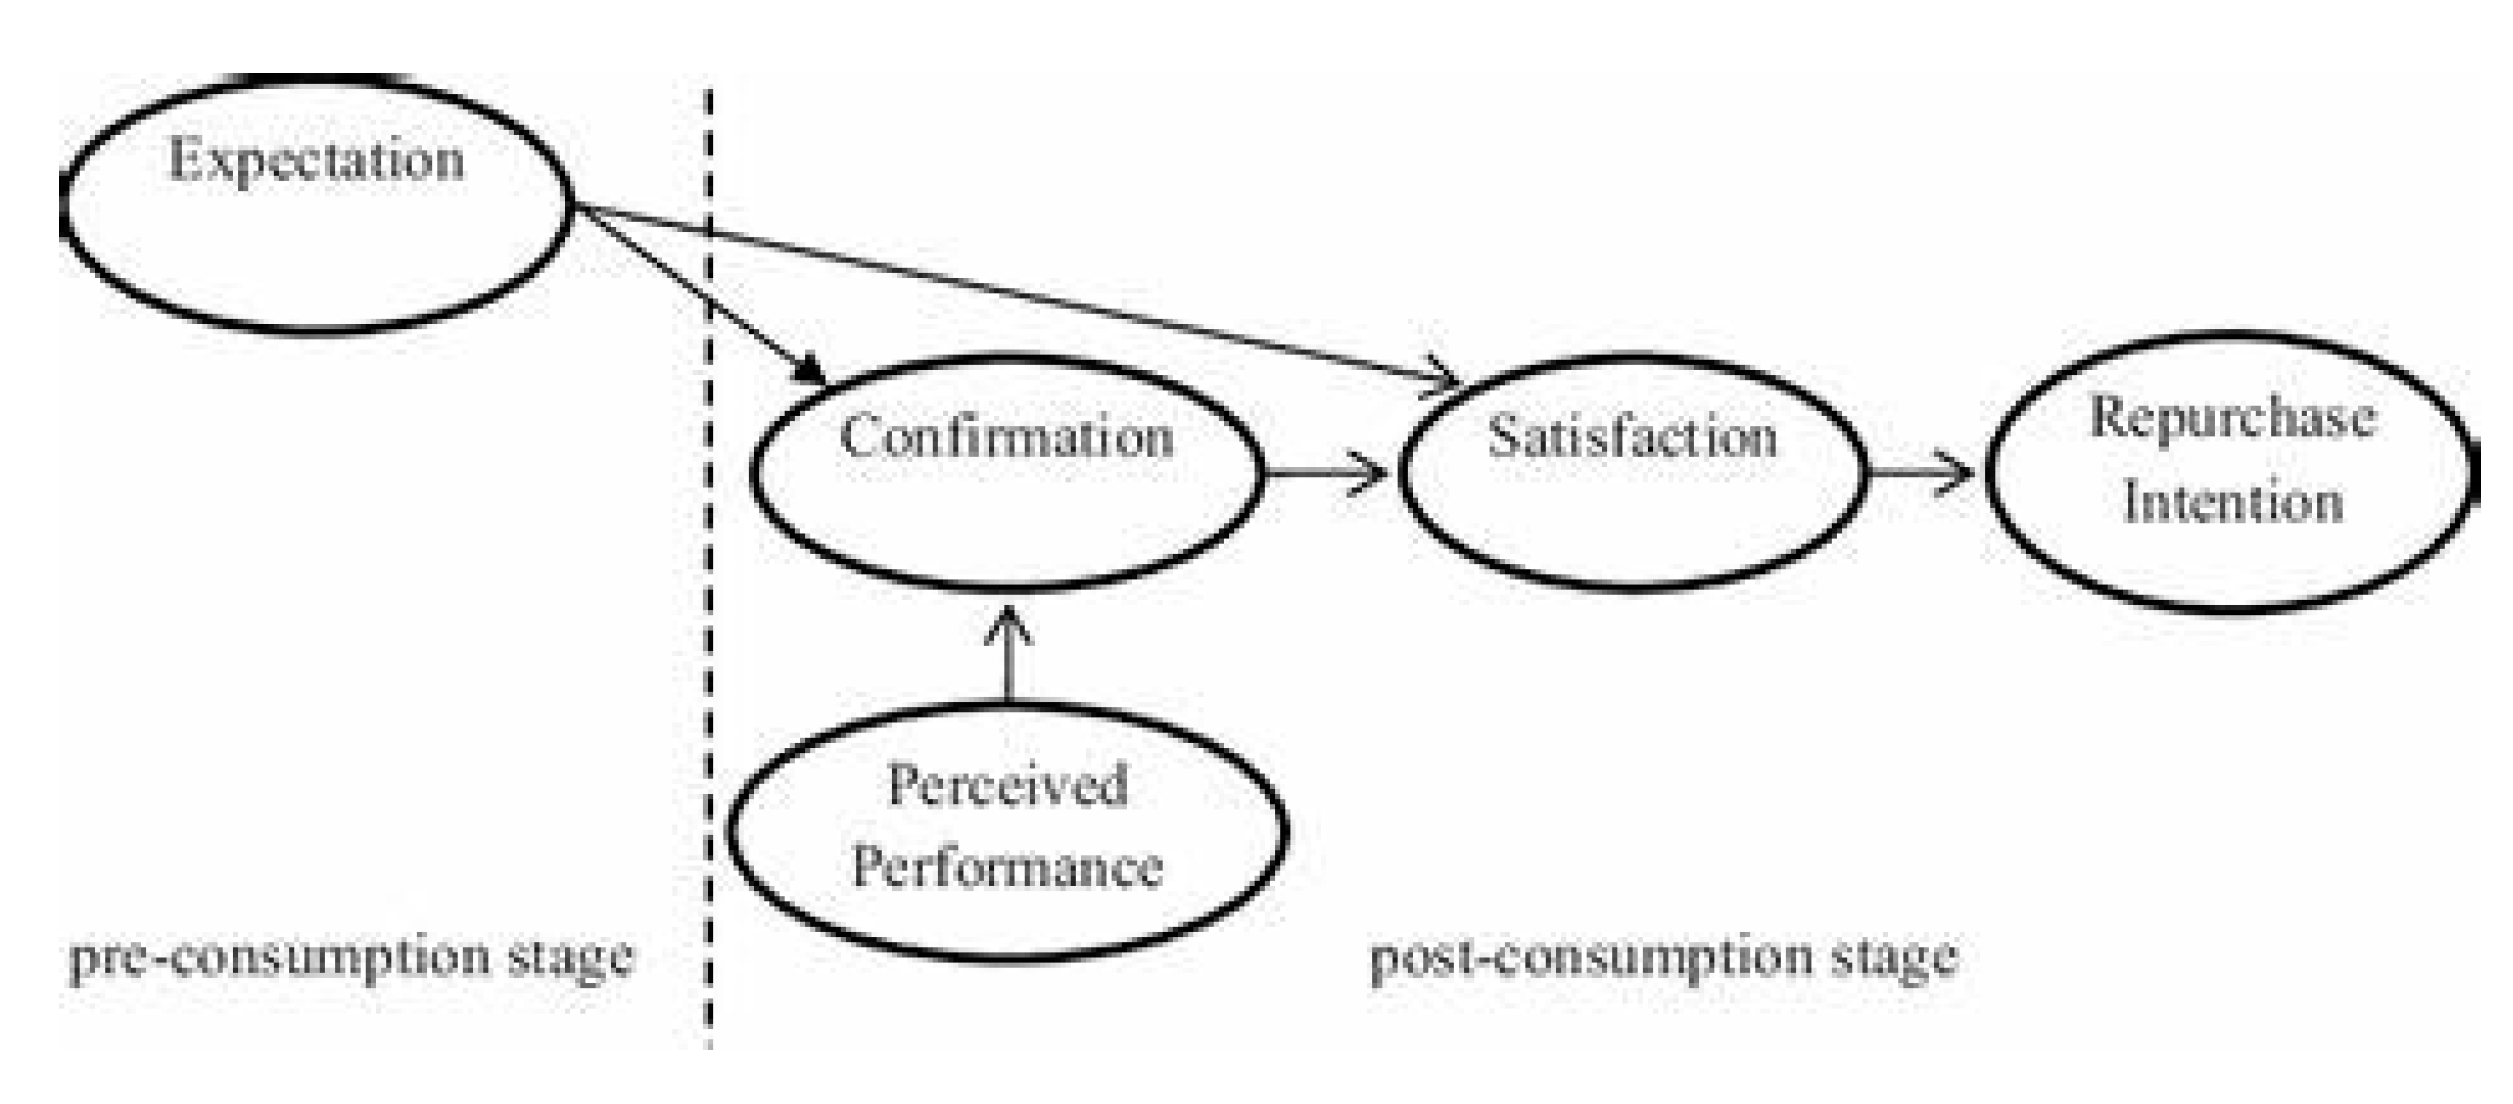
Expectation-Confirmation Theory (Oliver, 1980)
3. Customer Loyalty and Behavioral Intentions
Conceptual Framework
Formulation of Conceptual Model
Conceptual Research Model
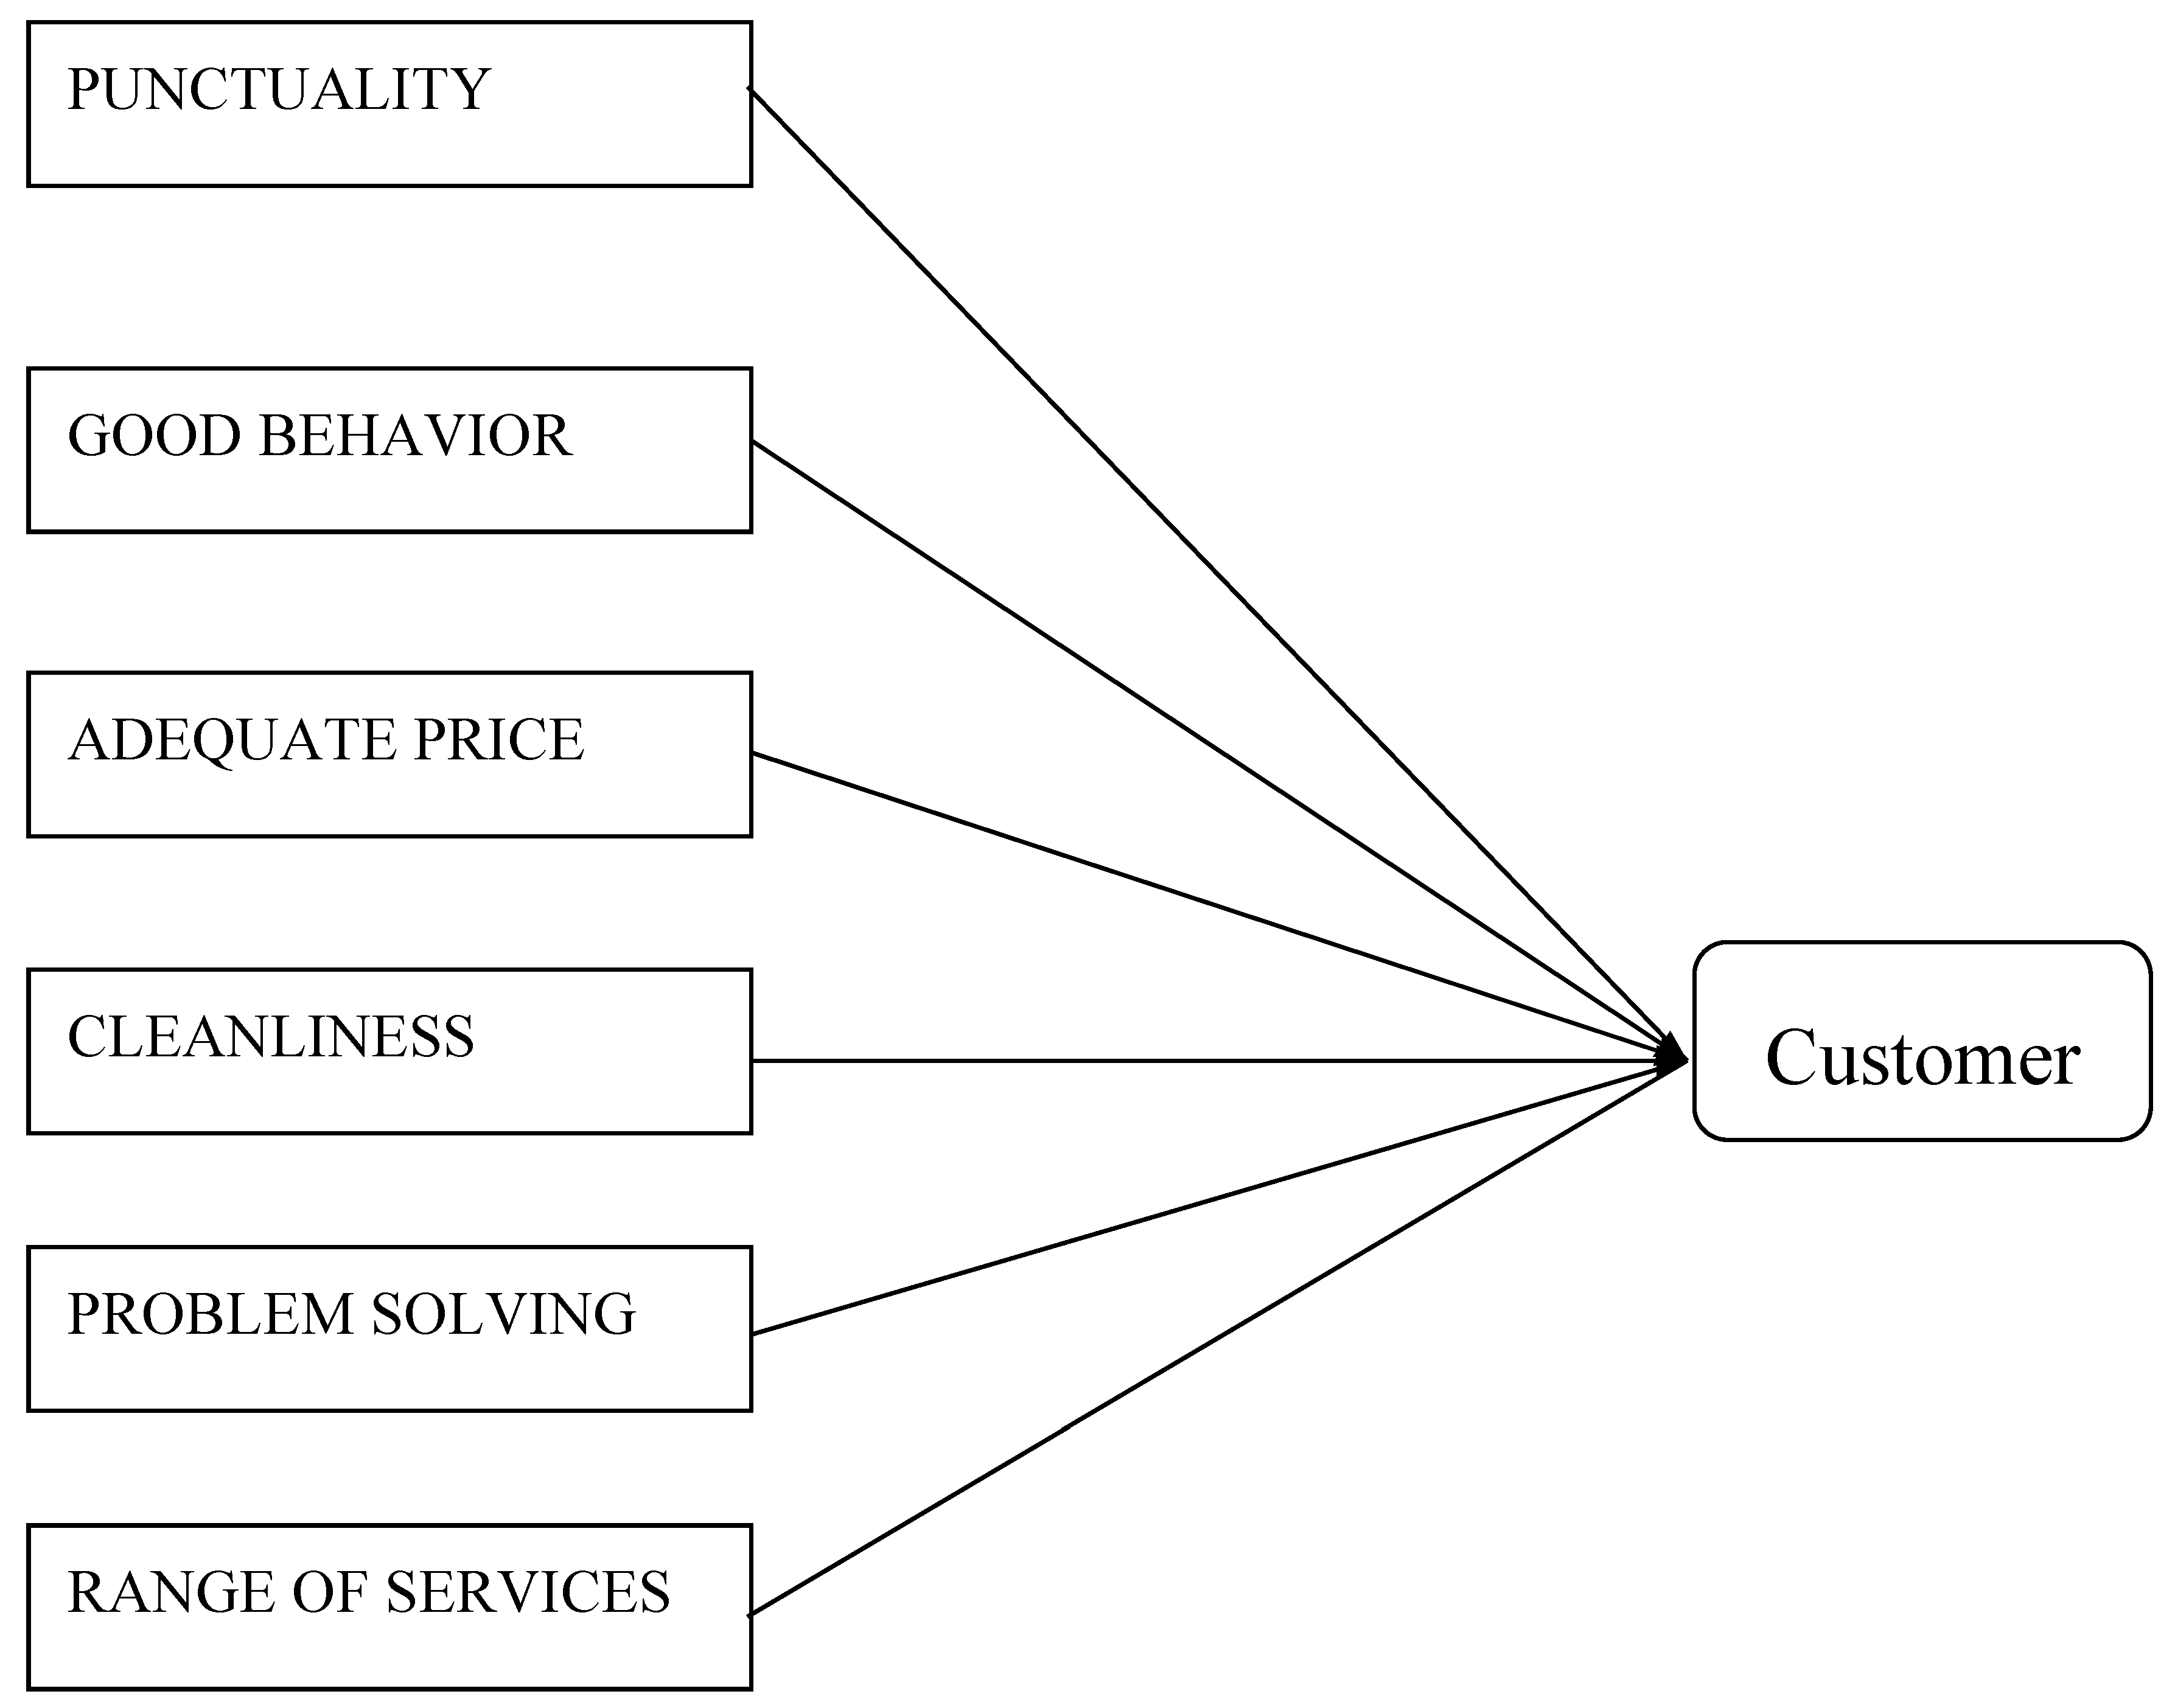
Hypothesis Formulation
- H1=Perceived service quality have positive influence on the customer satisfaction.
- H1-a= Punctuality of bus service has positive influence on the customer Satisfaction
- H1-b=employee good behavior with passengers has influence on the customer loyalty.
- H1-c=Adequate price of ticket has influence on the customer loyalty.
- H1-d=terminal environment has influence on the customer loyalty.
- H1-e=cleanliness at terminal and in bus has influence on the customer loyalty.
Research Methodology
Data Analysis and Results
Age Wise Distribution
Gender Wise Distribution
Education Wise Distribution of the Respondents
Descriptive Statistics of Income
Results Related to Study Variables
Customer Satisfaction from Punctuality of Bus Service
Customer Satisfaction from Employee Good Behavior
Customer Satisfaction from Adequate Price of Ticket
Customer Satisfaction from Terminal Environment and Cleanliness
Hypothesis Validation
Discussion
Conclusion
Recommendations
- Define clear mechanism for regular maintenance of vehicles to ensure local safety standards.
- Provide staff training, to meet and exceed passengers’ expectations.
- Periodically collect customer feedback on received services to measure the CSAT score.
- Increase social media presence for soft image building and brand reputation.
- Introduce the weekly/monthly packages for frequent travelers.
- Launch loyalty program and to increase Customer lifetime value (CLTV) and customer volume.
- Establish strategic partnerships for enhanced service offerings and incremental revenues.
- Ensure seamless customer journey throughout all touch points i.e. ticket counters, bus stations and during commute/travelling etc.
- Addition of latest comfortable buses in fleet like other big player i.e. Faisal movers.
- Switch to reduced emission buses for example (Hybrid, Electric) in order to synchronize with Go green global trend and fulfill social responsibility.
- Niazi express can introduce the insurance of passengers like Daewoo.
- They should upgrade the security systems as per current requirements.
- Niazi Express can introduce online/App tickets booking.
- Niazi express can serve the hot meal during long journeys like Karachi, Multan, Islamabad.
References
- Abdi, F., Abolmakarem, S., & Yazdi, A. K. (2025). Forecasting Car Repair Shops Customers’ Loyalty based on SERVQUAL Model: An Application of Machine Learning Techniques. Spectrum of Operational Research, 2(1), 180-198.
- Ahijo, T. M. (2022). Assessing social sustainability in urban road transportation of Abuja, Nigeria University of Central Lancashire].
- Ahmed, S., Al Asheq, A., Ahmed, E., Chowdhury, U. Y., Sufi, T., & Mostofa, M. G. (2023). The intricate relationships of consumers’ loyalty and their perceptions of service quality, price and satisfaction in restaurant service. The TQM Journal, 35(2), 519-539.
- Al-Rashid, M. A., Nadeem, M., Campisi, T., Shamsul Harumain, Y. A., & Goh, H. C. (2022). How do psychosocial barriers shape public transport use? A mixed-method study among older adults in Pakistan. Sustainability, 14(19), 12471.
- Al-Rashid, M. A., Shamsul Harumain, Y. A., Goh, H. C., & Ahmad, Z. (2021). Psychosocial factors of public transport users and social inclusion implications among older women in Pakistan. Journal of Urban Planning and Development, 147(4), 04021046.
- Arslan, I. K. (2020). The importance of creating customer loyalty in achieving sustainable competitive advantage. Eurasian Journal of Business and Management, 8(1), 11-20.
- Cruz, C. O., & Sarmento, J. M. (2020). “Mobility as a service” platforms: A critical path towards increasing the sustainability of transportation systems. Sustainability, 12(16), 6368.
- Gonçalves, L., Patrício, L., Grenha Teixeira, J., & Wuenderlich, N. V. (2020). Understanding the customer experience with smart services. Journal of Service Management, 31(4), 723-744.
- Habib, A., Ali, T., Nazir, Z., Muskan, F., Jawed, I., & Akilimali, A. (2024). Unveiling Pakistan’s transport problems: a call to safeguard public health. Frontiers in Public Health, 12, 1325193.
- Ibrahim, A. N. H., Borhan, M. N., Osman, M. H., Mat Yazid, M. R., & Md. Rohani, M. (2022). The influence of service quality on user’s perceived satisfaction with light rail transit service in Klang Valley, Malaysia. Mathematics, 10(13), 2213.
- Iqbal, S., Woodcock, A., & Osmond, J. (2020). The effects of gender transport poverty in Karachi. Journal of transport geography, 84, 102677.
- Javid, M. A., Shah, S. A. H., Ali, N., & Abdullah, M. (2021). Commuters' satisfaction with service quality of Airlift and Swvl bus services in Lahore. Engineering & Applied Science Research, 48(3).
- Kumari, A., & Perera, T. (2021). Service Quality and User Satisfaction of Makumbura Multimodal Transport Centre of Sri Lanka University of Sri Jayewardenepura.
- ]. Sri Lanka.
- Kuo, Y.-H., Leung, J. M., & Yan, Y. (2023). Public transport for smart cities: Recent innovations and future challenges. European Journal of Operational Research, 306(3), 1001-1026.
- Mikhaylov, A. S., Gumenuk, I. S., & Mikhaylova, A. A. (2015). The SERVQUAL model in measuring service quality of public transportation: evidence from Russia. Calitatea, 16(144), 78.
- Njelita, C. I., & Opara, P. C. (2023a). Influence of Reliability and Responsiveness to Service Quality on Commuters ‘satisfaction in a Road Transportation Firms in Anambra State, Nigeria. Nnadiebube Journal of Social Sciences, 4(2), 76-121.
- Njelita, C. I., & Opara, P. C. (2023b). INFLUENCE OF RELIABILITY AND RESPONSIVENESS TO SERVICE QUALITY ON COMMUTERS’SATISFACTION IN A ROAD TRANSPORTATION FIRMS IN ANAMBRA STATE, NIGERIA. Nnadiebube Journal of Social Sciences, 4(2), 76-121.
- Ojekunle, J. A., Ibrahim, S., Oluwole, M., & Owoeye, A. S. (2021). Evaluating Customers’ Satisfaction of Service Quality of State-Owned Transport Company: A Case of Kano State Transport Authority (Kano Line), Nigeria. Sustainable Education and Development 9.
- Oliver, R. L. (1980). A cognitive model of the antecedents and consequences of satisfaction decisions. Journal of marketing research, 17(4), 460-469.
- Parasuraman, A., Berry, L. L., & Zeithaml, V. A. (1991). Perceived service quality as a customer-based performance measure: An empirical examination of organizational barriers using an extended service quality model. Human resource management, 30(3), 335-364.
- Parasuraman, A., Berry, L. L., & Zeithaml, V. A. (1991). Refinement and reassessment of the SERVQUAL scale. Journal of retailing, 67(4), 420.
- Parasuraman, A., Zeithaml, V. A., & Berry, L. L. (1988). Servqual: A multiple-item scale for measuring consumer perc. Journal of retailing, 64(1), 12.
- Tanwar, R., & Agarwal, P. K. (2024). Analysis of the determinants of service quality in the multimodal public transport system of Bhopal city using structural equation modelling (SEM) and factor analysis. Expert Systems with Applications, 256, 124931.
- Vicente, P., Sampaio, A., & Reis, E. (2020). Factors influencing passenger loyalty towards public transport services: Does public transport providers’ commitment to environmental sustainability matter? Case Studies on Transport Policy, 8(2), 627-638.
- Vicente, P., Suleman, A., & Reis, E. (2020). Index of satisfaction with public transport: A fuzzy clustering approach. Sustainability, 12(22), 9759.
- Wisutwattanasak, P., Champahom, T., Jomnonkwao, S., Seefong, M., Theerathitichaipa, K., Kasemsri, R., & Ratanavaraha, V. (2023). Modeling Extended Service Quality for Public Transportation in the Post-Pandemic Period: Differentiating between Urban and Rural Areas: A Case Study of Intercity Railway, Thailand. Logistics, 7(4), 93.

| Service Dimension | Usability in Transport Sector | References |
|---|---|---|
| Tangibility | Tangibility involves physical objects and equipment, among others. In the transport sector, several tangible factors are involved, including cleanliness, terminal environment, and buses, among others. | (Javid et al., 2021) |
| Reliability | The dimension of reliability is fundamental within the SERVEQUAL framework. Reliability signifies the provision of accurate information and the effective execution of the company's obligations. The relationship between punctuality and reliability in the transport sector is significant. | (Tanwar & Agarwal, 2024) |
| Responsiveness | To respond to customers swiftly and handle their concerns promptly and accurately is known as responsiveness. The organization should train their personnel to respond to their clients in a better way. Problem-solving pertains to this dimension. | (Oliver, 1980) (Arslan, 2020) |
| Assurance | The assurance includes elements such as competence, respect, security, and credibility. Individuals within the organization are required to convey these characteristics to ensure the loyalty of customers. This is a crucial metric for companies to evaluate employee performance. In the transportation business, courteous workforce is essential for achieving client loyalty. The commendable conduct of employees is associated with assurance. | (Mikhaylov et al., 2015). |
| Empathy | Empathy involves comprehending how effectively employees recognize client needs and focus appropriately on their customers. The organization’s staff and management should comprehend and evaluate customer requirements, subsequently taking the necessary actions to fulfil those needs. The organization offers a variety of services that are closely linked to empathy. Management provides these diverse services while considering the unique needs of various customers. | (Arun Parasuraman et al., 1991) (Arslan, 2020) |
| Categories | Frequency | Percent | Cumulative Percent |
|---|---|---|---|
| 15-25 | 82 | 41 | 41.4 |
| 25-35 | 75 | 37.5 | 79.3 |
| 35-45 | 26 | 13 | 92.4 |
| 45-55 | 15 | 7.5 | 100 |
| Total | 198 | 99 |
| Categories | Frequency | Percent |
|---|---|---|
| males | 145 | 72.5 |
| females | 53 | 25.5 |
| Total | 196 | 100 |
| Education | |||
|---|---|---|---|
| Categories | Frequency | Percent | Cumulative Percent |
| Primary | 3 | 1.5 | 1.5 |
| Middle | 14 | 7 | 8.7 |
| Metric | 17 | 8.5 | 17.4 |
| Intermediate | 42 | 21 | 39 |
| Graduate | 65 | 32.5 | 72.3 |
| Master | 50 | 25 | 97.9 |
| PhD | 4 | 2 | 100 |
| Total | 195 | 97.5 | |
| Categories | Frequency | Percent |
|---|---|---|
| 5000-10000 | 48 | 24.5 |
| 10000-20000 | 52 | 26.5 |
| 20000-30000 | 40 | 20 |
| 30000-50000 | 13 | 6.5 |
| 50000-100000 | 11 | 5.5 |
| 100000-500000 | 3 | 1.5 |
| not employed | 31 | 15.5 |
| Total | 198 | 100% |
| Statements | Strongly Disagree | Disagree | Neutral | Agree | Strongly Agree | |
|---|---|---|---|---|---|---|
| Satisfied on timely departure of bus from terminal | 5% | 11% | 11% | 44% | 29% | |
| Satisfied on Timely arrival of bus at destination | 5% | 11% | 13% | 43% | 28% | |
| Satisfied on Less time taken to reach a destination | 5% | 13% | 13% | 44% | 24% | |
| Satisfied on in-time seat confirmation | 06% | 12% | 07% | 51% | 24% | |
| Satisfied on departure of bus with minimum number of passengers | 08% | 07% | 15% | 44% | 26% | |
| Satisfied from overall services provided by Niazi Bus services | 06% | 09% | 25% | 37% | 23% | |
| Statements | Strongly Disagree | Disagree | Neutral | Agree | Strongly Agree |
|---|---|---|---|---|---|
| Service providers, such as conductors and drivers, exhibit commendable behaviour during travels. | 7% | 11% | 12% | 48% | 21% |
| Service providers who exhibit good behaviour (booking clerk, carriers) Organization effectively oversees a wide array of services. |
08% | 07% | 14% | 45% | 26% |
| Company management guarantees that employees address customer issues swiftly. | 06% | 12% | 18% | 45% | 19% |
| Prompt attention to your concerns by the management of the transport company | 05% | 16% | 19% | 36% | 24% |
| Immediate response to your complaints by transport company management | 06% | 09% | 15% | 51% | 19% |
| Statements | Strongly Disagree | Disagree | Neutral | Agree | Strongly Agree |
|---|---|---|---|---|---|
| Low fare as compared to other bus services | 5% | 16% | 32% | 47% | 0% |
| No increases in fare on special occasions like Eid, etc. | 13% | 6% | 12% | 40% | 29% |
| No extra charges on ticket cancelation. | 07% | 08% | 15% | 41% | 29% |
| No extra charges of wifi, minial water, other extra services | 06% | 09% | 21% | 45% | 19% |
| No extra charges on advance booking. | 15% | 11% | 10% | 39% | 25% |
| Statements | Strongly Disagree | Disagree | Neutral | Agree | Strongly Agree |
|---|---|---|---|---|---|
| Diverse range of services (APV seven seater vehicle), (coach 24 seaters), (cargo service) | 07% | 08% | 24% | 44% | 17% |
| Well equipped waiting area (furniture, air conditioner) at the bus terminal) | 08% | 07% | 21% | 45% | 19% |
| Use of fragrance (air freshener) inside bus during travel | 07% | 06% | 12% | 51% | 24% |
| Buses with shock absorbers under every seat(Nishi parlor) | 06% | 09% | 25% | 24% | 36% |
| Neat and clean bus terminal environment | 07% | 11% | 14% | 46% | 19% |
| Neat and clean inside area of bus | 07% | 08% | 12% | 50% | 23% |
| Hypotheses | P. Value | Validation | |
|---|---|---|---|
| H-1 | Perceived service quality have positive influence on the customer satisfaction | 0.000 | >0.05 Accepted |
| H1a | Punctuality of bus service has positive influence on the customer Satisfaction | 0.000 | >0.05 Accepted |
| H1b | Employee good behavior with passengers has influence on the customer loyalty. | 0.034 | >0.05 Accepted |
| H1c | Adequate price of ticket has influence on the customer loyalty. | 0.000 | >0.05 Accepted |
| H1d | Terminal environment has influence on the customer loyalty. | 0.021 | >0.05 Accepted |
| H1e | Cleanliness at terminal and in bus has influence on the customer loyalty. | 0.000 | >0.05 Accepted |
Disclaimer/Publisher’s Note: The statements, opinions and data contained in all publications are solely those of the individual author(s) and contributor(s) and not of MDPI and/or the editor(s). MDPI and/or the editor(s) disclaim responsibility for any injury to people or property resulting from any ideas, methods, instructions or products referred to in the content. |
© 2025 by the authors. Licensee MDPI, Basel, Switzerland. This article is an open access article distributed under the terms and conditions of the Creative Commons Attribution (CC BY) license (http://creativecommons.org/licenses/by/4.0/).


