
Submitted:
07 February 2025
Posted:
10 February 2025
You are already at the latest version
Abstract
Chromatin accessibility is important for genome architecture and gene expression in plants. In this study, the ATAC-seq method was utilized to identify accessible chromatin regions (ACRs) across the chickpea (Cicer arietinum) genome, an important legume crop cultivated worldwide. A total of 11,555 ACRs were identified in the chickpea genome, enriched at gene transcription start sites (TSS) and positively correlated with gene expression. Furthermore, as expected, a number of known transcription factor (TF) binding motifs were enriched in these ACRs. Integrating histone modification data, ACRs were found to be closely associated with H3K27ac and H3K4me3 modifications to regulate gene expression. In addition, the gain and loss of ACRs have been demonstrated to have significant effects on the expression of homologous genes. Collectively, this study provides a comprehensive understanding of the genomic function of ACRs in chickpea.
Keywords:
Cicer arietinum
; Accessible chromatin region
; ATAC-seq
; histone modification
; Epigenetics
1. Introduction
Chromatin, a complex structure composed of DNA and proteins, is formed by the binding of DNA to histones to form nucleosomes, which are further folded and compacted [1-3]. These structures undergo dynamic changes during DNA replication or transcription, allowing the tight structure of chromosomes to become open [4, 5]. The accessible chromatin regions (ACRs) in the genome facilitate the binding of trans-acting factors to the cis-regulatory elements present in promoters, enhancers, insulators, and silencers. This property, which allows for the binding of transcription factors (TFs), is defined as chromatin accessibility [6-8]. In addition to being regulated by TFs, the chromatin is also subject to various histone modifications, which affect the chromatin structure and the subsequent gene expression [9, 10]. Currently, ATAC-seq (Assay for Transposase-Accessible Chromatin with high throughput sequencing) [4, 11], as a common method for ACR analysis, uses the transposase Tn5 [12], an enzyme capable of labeling ACRs, to fragment these sequences for library construction to improve the understanding of the regulatory mechanisms of gene expression across plant genomes.
Cicer arietinum (chickpea) is an herbaceous plant, belonging to the genus Cicer in the family Fabaceae. It is an important food crop in China, being rich in protein, various amino acids, vitamins, crude fiber, calcium, magnesium, iron, and other ingredients, and has a high economic value and extensive application prospects [13, 14]. However, studies on regulatory sequences in chickpea have remained limited. In this study, we have adopted ATAC-seq to identify the ACRs across the chickpea genome. Integrated with other data, our results provided a comprehensive understanding of the genomic features of these important cis-regulatory sequences and their impact on downstream gene expression. Furthermore, our data provided genomic resources for further exploration of non-coding regulatory ACRs for genetic diversity and crop improvement in chickpea.
2. Materials and Methods
2.1. Plant Materials
Chickpea (Cicer arietinum) were grown naturally in a greenhouse, and leaf samples were collected 15 days after germination for subsequent exprements.
2.2. RNA-sequencing (RNA-seq) data analysis
The RNA-seq raw data of chickpea leaves were downloaded from NCBI under accession number (PRJNA742483). Adapter trimming of the raw data was performed using TrimGalore (http://github.com/FelixKrueger/TrimGalore, default parameters), and then mapped to the chickpea reference genome [15] using the HISAT-StringTie pipeline [16]. Gene expression levels were calculated using the default parameters and expressed as fragments per kilobase per million mapped reads (FPKM).
2.3. Assay for Transposase-Accessible Chromatin Using Sequencing (ATAC-seq)
Leaf ATAC-seq library construction was performed as previously reported [17, 18]. Briefly, approximately 0.3 g of chickpea leaf sample was flash-frozen in liquid nitrogen, and then rapidly ground to powder. Nuclei were extracted by adding 10 mL of lysis buffer, followed by a washing step with 1 mL of Wash Buffer I and Wash Buffer II, respectively. Subsequently, about 105 nuclei were then resuspended in 50 μL of Tn5 reaction solution (TruePrep DNA Library Prep Kit V2 for Illumina, Vazyme, TD501) and incubated at 37 °C for 30 min. The tagged DNA was purified using the DNA Clean & Concentrator Kit (Zymo Research, D4014) and amplified using Q5 DNA polymerase (NEB, M0491) with indexed primers from the TruePrep Index Kit V2 for Illumina (Vazyme, TD202). The library was sent for sequencing on the Illumina NovaSeq PE150 platform.
Raw ATAC-seq data were filtered by TrimGalore and mapped to the chickpea genome by Bowtie2 [19] with the parameter set as: -X 1000. Samtools [20] was used to extract the reads with the MAPQ value above 30, which were further used for peak calling by MACS3 (parameters set as “--nomodel --shift 100 --extsize 200”) [21]. Chickpea genomic DNA, processed by the Tn5 enzyme, was used as an input control. The reproducible peaks between two replicates were defined as ACRs. Annotation of the ACRs was performed using HOMER (http://homer.ucsd.edu/homer). Visualization of ATAC-seq signals was performed using Deeptools [22] and IGV [23]. MEME Suite [24] was used for motif analysis.
2.4. Histone Chromatin Immunoprecipitation Sequencing (ChIP-seq)
Chickpea histone ChIP-seq was performed as described in the previous study with minor modifications [25-27], using ChIP-seq grade anti-H3K27ac (PTMA, PTM-116) and anti-H3K4me3 (PTMA, PTM-613) antibodies. Approximately 5 ng of ChIP-seq DNA and input DNA were utilized for library construction using the TruePrep DNA Library Prep Kit V2 for Illumina (Vazyme, TD501). Aptamer trimming and removal of low-quality reads was performed using Trim_Galore, and mapping of reads to the genome was performed using Bowtie2 [19]. The input library was used as a control. Mapped reads (MAPQ >30) were peaked using MACS3 with the narrow peak model [28].
3. Results
3.1. Identification of ACRs in the Chickpea Genome by ATAC-seq
In this study, ATAC-seq was employed to identify and characterize ACRs across the chickpea genome. Leaf ATAC-seq libraries from two biological replicates of chickpea generated approximately 99.6 million (M) and 100.8 M reads, respectively (Figure S1, Table S1). As expected, ATAC-seq signals were mainly enriched around the transcription start site (TSS) and exhibited a positive correlation with the expression levels of coding genes (Figure 1A and 1B), indicating that the chromatin accessibility is associated with gene activation, which is consistent with previous reports. A total of 11,555 ATAC-seq enriched regions were identified in two replicates and defined as ACRs, which were found to be associated with 7,609 coding genes (Figure 1C, Table S2). Genomic annotation of these ACRs revealed that the majority of ACRs were in the promoter (35%) and the distal intergenic regions (42%), while 12% of ACRs were observed in the downstream region and 11% in the exonic region (Figure 1D, Table S2).
3.2. Enrichment Analysis of Conserved Transcription Factor Motifs Enrichment in the ACRs
TFs can regulate gene expression by recognizing specific DNA sequences. During chromatin opening, TFs bind to DNA sequences (e.g. Motifs) in the open chromatin regions. Therefore, ACRs tend to enrich for conserved TF binding motifs [29, 30]. To assess the enrichment of TF binding motifs on chickpea ACRs, the TF binding motifs reported in the PlantPAN3.0 database were mapped to these ACRs [31]. The result showed that conserved TF binding motifs were significantly enriched on ACRs, with the top 10 enriched motifs being AP2/ERF, bHLH, bZIP, C2H2, Dof, MADS_box, MYB, NAC, TCP and WRKY (Figure 2A and 2D, Table S3). Subsequently, a potential TF regulatory network was then constructed using TF binding motifs enriched in ACRs and genes related to the downstream of ACRs (Figure 2B). In addition, a total of 5,881 (77.5%) genes were observed to be co-targeted by the MYB, NAC, and AP2/ERF families (Figure 2C). Taken together, these results suggest that there are several conserved TF-binding motifs in chickpea ACRs that could synergistically regulate the expression of downstream genes.
3.3. histone Modifications in ACRs
It has been reported that histone modifications are usually associated with ACRs to regulate gene expression [32-35]. In this study, ChIP-seq was adopted to investigate the distribution of H3K27ac and H3K4me3 in chickpea leaf ACRs and the relationship between these histone modifications and ACRs. A total of 32,260 H3K27ac-enriched peaks and 22,164 H3K4me3-enriched peaks were identified in chickpea (Tables S4 and S5). H3K4me3- and H3K27ac-modified ACRs were mainly enriched in the promoter region, and positively correlated with gene expression as expected (Figure 3A and S3, Table S4 and S5).
Using the K-mean algorithm, the histone-modified ACRs could be classified into two major clusters (Figure 3B). The results indicated that the majority of these ACRs were modified by H3K4me3, with a smaller number modified by H3K27ac in Cluster I, whereas most of the modified ACRs in Cluster II exhibited minimal modified signal. Furthermore, it was observed that 743 and 1,736 ACRs were modified only by H3K4me3 and H3K27ac, respectively, with 3,565 ACRs being dual-modified by these two histone marks (Figure 3C and 3D, Table S6). Interestingly, in the dual-modified ACRs regions, the overall signal coverage of H3K4me3 was higher than that of H3K27ac (Figure 3E). The expression of genes associated with dual-modified ACRs was higher than that of those with only a single modification (Figure 3F, Table S6). Taken together, these data suggest that dual modifications of H3K27ac and H3K4me3 at ACRs may play an important role in chromatin opening and gene activation.
Distal ACRs (dACRs), located in intergenic regions, might act as enhancers and also play an important role in regulating gene expression [36, 37]. In this study, a total of 3,639 dACRs were identified and mainly distributed in the 2-8 kb intergenic region in chickpea. In addition, 688 dACRs were detected in regions more than 20 kb away from the nearest TSS (Figure 4A, Table S2). In contrast to the proximal ACRs (pACRs), it was found that the majority of the dACRs (77.08%) were found to be unmodified by either H3K4me3 or H3K27ac ((Figure 4B and 4E, Table S4 and S5). The dACRs with H3K4me3 or H3K27ac modification were located in the regions close to the TSS (<10 kb) (Figure 4C). As previously reported, the expressions of genes associated with dACRs and pACRs were more significant than those with dACRs or pACRs only, indicating an enhancer role of dACRs in gene expression regulation (Figure 4D).
3.4. Effects of ACRs Absent on the Homologous Gene Expression in Chickpea
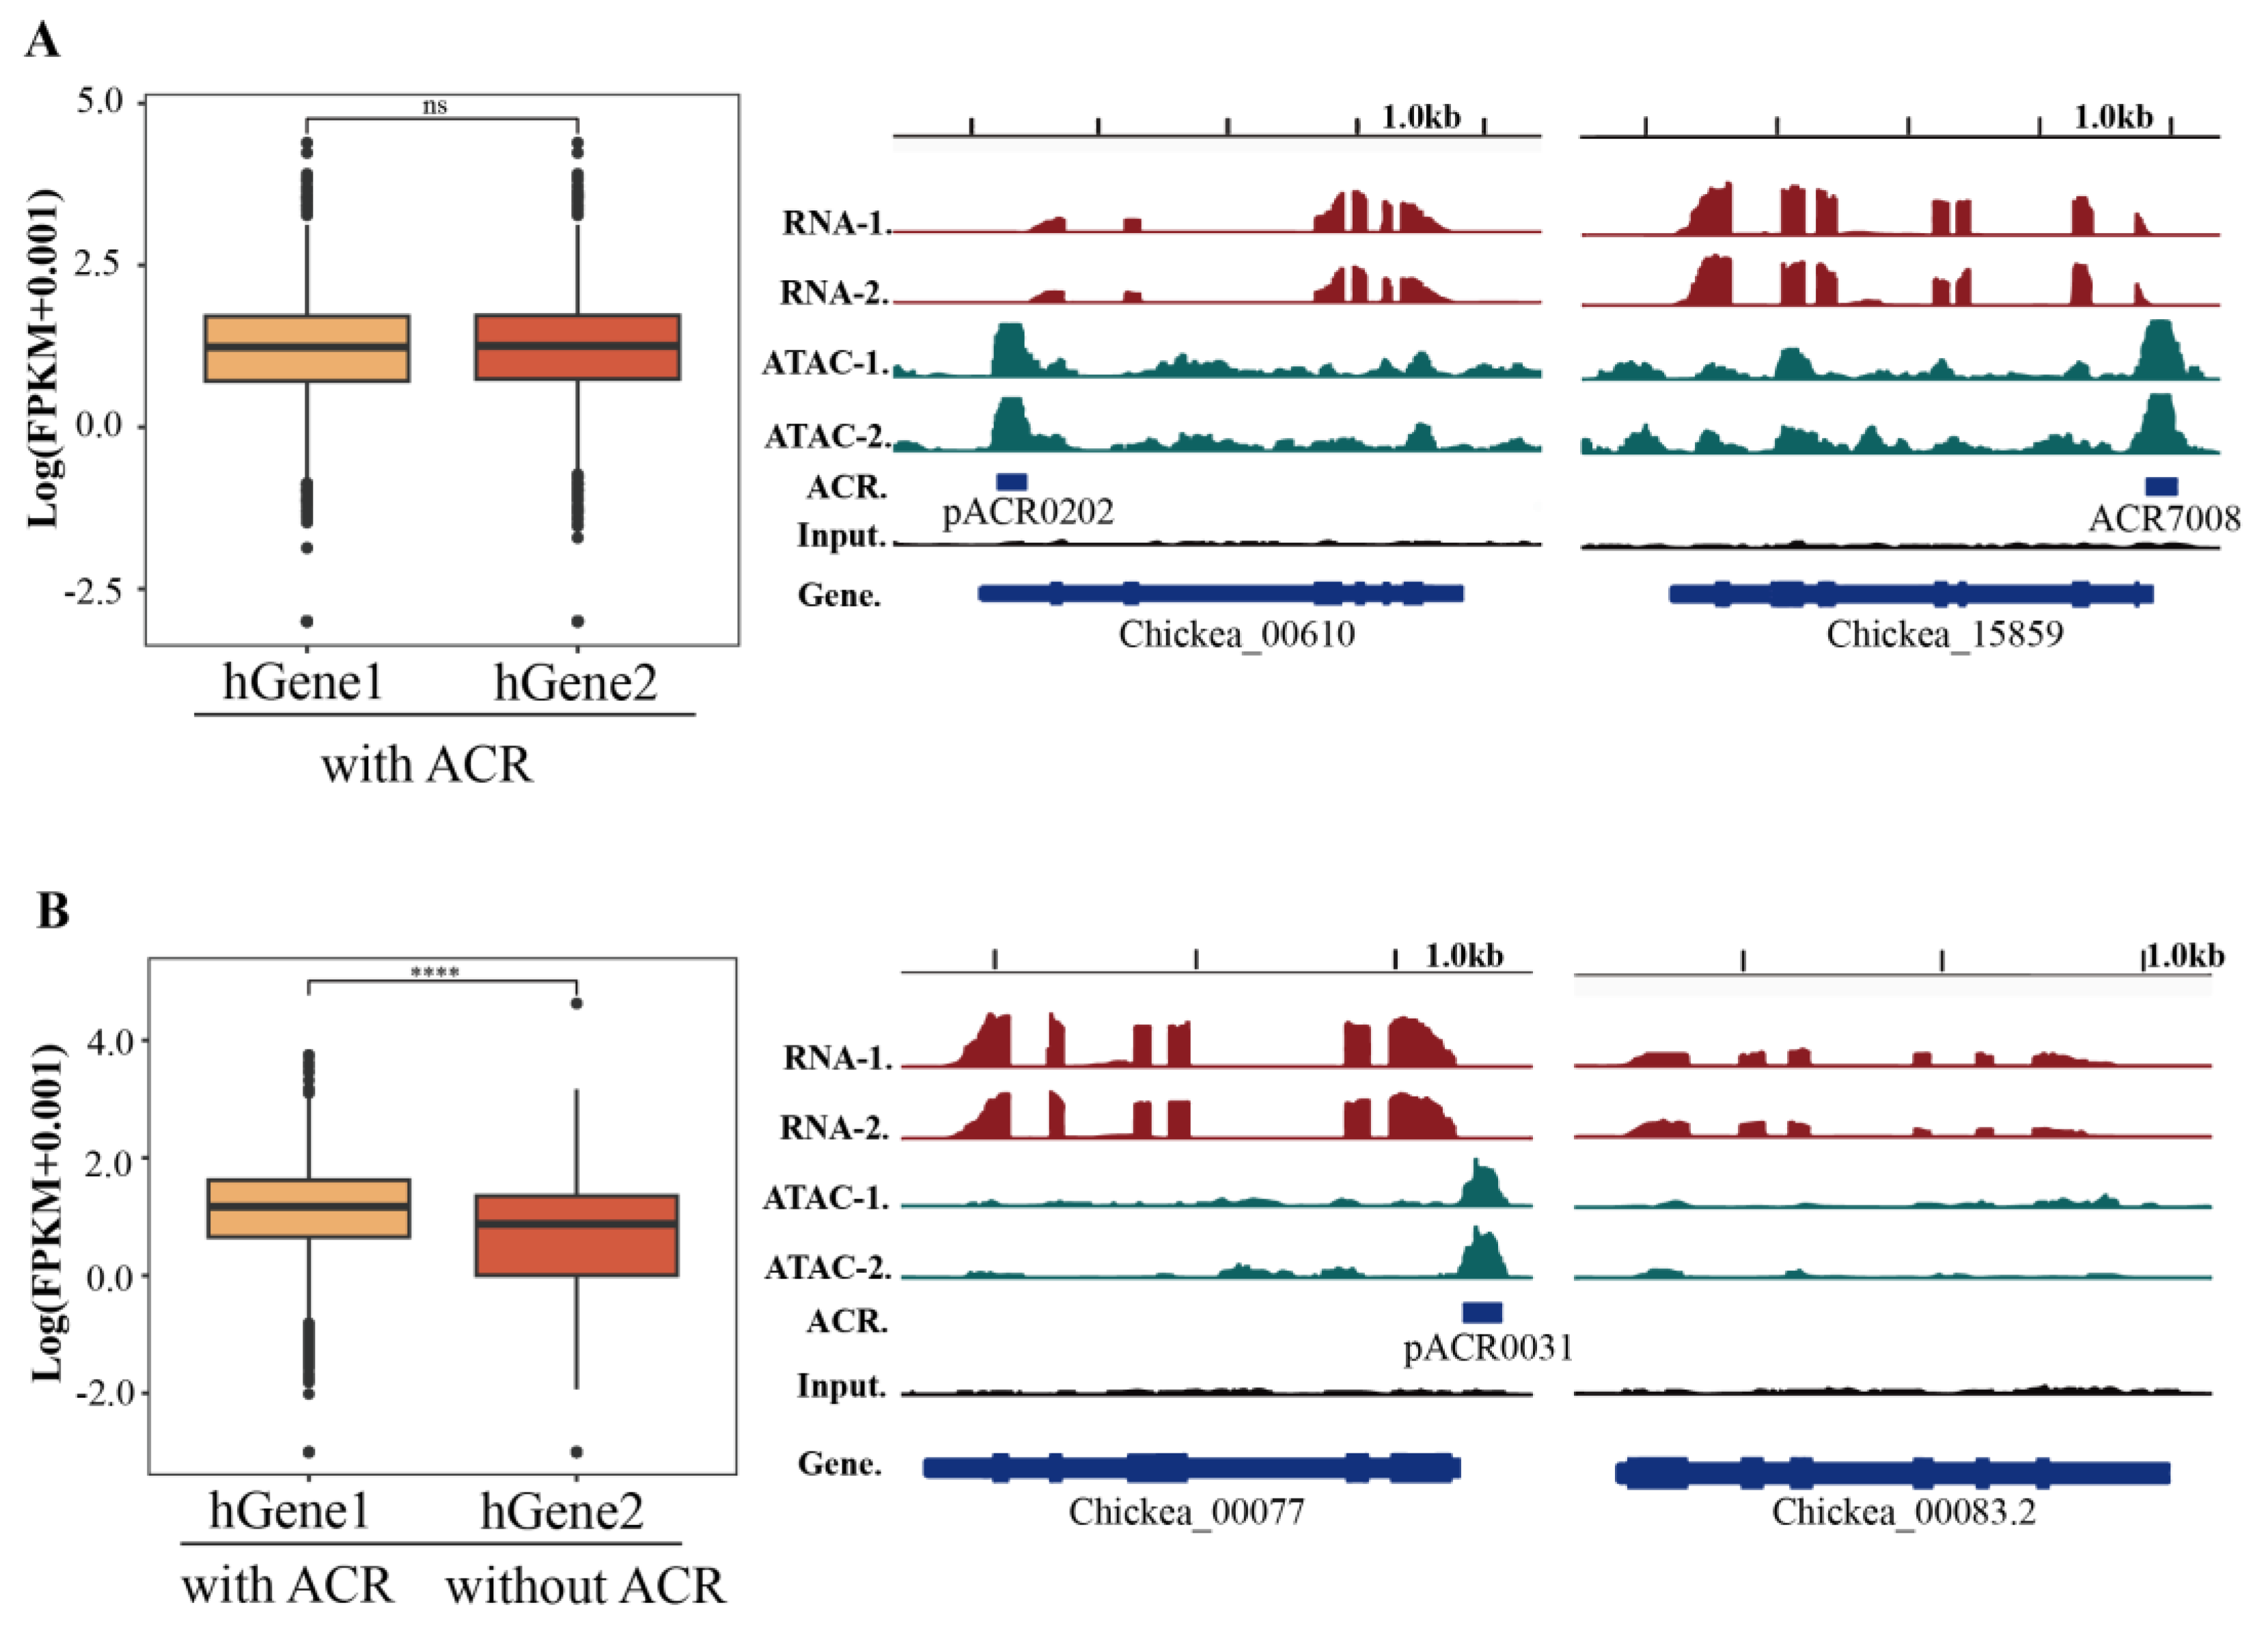
Gene duplications are prevalent during whole genome duplication, resulting in the divergence of the homologous genes (hGenes). Indeed, during the duplication of hGenes, the gain and loss of their corresponding cis-regulatory sequences, such as the promoter, could also affect their neofunctionalization [38, 39]. The hGene pairs were derived from the ACR-associated genes (E-value < 1e-5) (Table S7). Both hGenes associated with ACRs showed no significant difference in their gene expression, while the expression of the hGene without ACRs was significantly lower than that of their hGene with ACRs (Figure 5). Furt hermore, the absence of ACRs in hGenes also affected the histone modification status (Table S7). This observation suggests an important role for ACRs in maintaining hGene expression during the progress of hGene duplication.
4. Discussion
In this study, ATAC-seq has been employed for genome-wide characterization of ACRs in chickpea. The results revealed that ACRs were positively correlated with their associated gene expression, and were also enriched with many conserved TF motifs, suggesting that ACRs are important for gene regulation by acting as cis-regulatory sequences. In addition, ACRs were shown to be associated with active histone marks (e.g. H3K4me3 and H3K27ac) in the regulation of gene transcription. Finally, the presence or absence of ACRs could influence the expression levels of hGenes. Taken together, these data could be considered valuable genomic resources for future studies on gene regulation in chickpea.
ATAC-seq has been widely used as an efficient tool for gene regulation studies, such as TF-DNA interaction analysis and promoter-enhancer prediction in plants. For example, HSFA1a played an important role in the dynamic formation of promoter-enhancer contacts near the ACRs in response to heat stress in tomato, by ATAC-seq and other methods [40]. A total of 446 regeneration-related core TFs are associated with the open chromatin regions in wheat [7]. Moreover, ATAC-seq is currently being used to study a variety of plants, such as Arabidopsis thaliana [11, 41], maize [42-44], cultivated soybean [17, 43, 45-48], rice [49], grape [50], tomato [51] and the medicinal plant, Andrographis paniculata [52].
The function of distal ACRs has received much attention in recent investigations, as they may serve as enhancer-like elements that could mediate contact with proximal cis-regulatory sequences to promote gene expression [53, 54]. Similar to the proximal ACRs, the distal regions also contained conserved TF-binding motifs (e.g. AP2/ERF, bHLH, bZIP, etc.), through which the expression levels of genes could be precisely controlled, thereby affecting various biological processes in plants [55]. Therefore, several reports have indicated that variants in these non-coding regions, such as patch chromatin variants, single nucleotide polymorphisms, indels, etc., would affect the domestication of the plants and their final phenotype [39, 45], which has been reported in plants, such as wheat [21], tomato [38], maize [42], etc. In this study, several cases of gain and loss of hGenes were observed, which significantly affected gene expression. It was suggested that the non-coding ACRs may also play an important role in the adaptation and domestication of chickpea, but further investigation is required to confirm this hypothesis.
5. Conclusions
In this study, we have provided a comprehensive overview of ACRs and their genomic features across the chickpea genome, using ATAC-seq and histone ChIP-seq methods. Furthermore, this study has shown that ACRs play important roles in gene regulation and potential roles in plant domestication, and our data provide an important resource for further exploration of the chickpea genome.
Supplementary Materials
The following supporting information can be downloaded at the website of this paper posted on Preprints.org. Figure S1: Pearson correlation between two replicates of ATAC-seq data; Figure S2: Pearson correlation among the histone modification ChIP-seq data; Figure S3: Histone modification features of ACRs in chickpea genome genome; Table S1: The list of raw data in this study; Table S2: The genomic annotation of ATAC ACRs; Table S3: The TF motif PWM used in this study; Table S4: The genomic annotation of H3k27ac ACRs; Table S5: The genomic annotation of H3k4me3 ACRs; Table S6: The histone modification status of ACRs; Table S7: ACR associated with homologous genes.
Author Contributions
YFH and HY designed the experimental details. LY, LZ, XBL, SYT, YX and ZYZ performed the wet-lab experiments and QL, XBL, MKH, CF for the bioinformatic analyses. YFH and HY wrote the manuscript.
Competing interests
The authors declare that they have no competing interests.
Funding
This research was funded by Lushan Botanical Garden Research Funds, grant number 2022ZWZX01.
Ethics approval and consent to participate
Not applicable.
Consent for publication
Not applicable.
Data Availability Statement
The raw data in this study have summitted to The China National Center for Bioinformation (https://ngdc.cncb.ac.cn/) under the BioProject accession PRJCA035032.
References
- Ren, M., M. M. Greenberg, and C. Zhou, Participation of Histones in DNA Damage and Repair within Nucleosome Core Particles: Mechanism and Applications. Acc Chem Res 2022, 55, 1059–1073. [Google Scholar] [CrossRef]
- Lukauskas, S. , et al., Decoding chromatin states by proteomic profiling of nucleosome readers. Nature 2024, 627, 671–679. [Google Scholar] [CrossRef] [PubMed]
- Klemm, S.L., Z. Shipony, and W.J. Greenleaf, Chromatin accessibility and the regulatory epigenome. Nat Rev Genet 2019, 20, 207–220. [Google Scholar] [CrossRef] [PubMed]
- Buenrostro, J.D. , et al., Transposition of native chromatin for fast and sensitive epigenomic profiling of open chromatin, DNA-binding proteins and nucleosome position. Nat Methods 2013, 10, 1213–8. [Google Scholar] [CrossRef]
- Reeves, R. , Transcriptionally active chromatin. Biochim Biophys Acta 1984, 782, 343–93. [Google Scholar] [CrossRef] [PubMed]
- Brennan, K.J. , et al., Chromatin accessibility in the Drosophila embryo is determined by transcription factor pioneering and enhancer activation. Dev Cell 2023, 58, 1898–1916. [Google Scholar] [CrossRef]
- Liu, X. , et al., Uncovering the transcriptional regulatory network involved in boosting wheat regeneration and transformation. Nat Plants 2023, 9, 908–925. [Google Scholar] [CrossRef] [PubMed]
- Lu, Z. , et al., Combining ATAC-seq with nuclei sorting for discovery of cis-regulatory regions in plant genomes. Nucleic Acids Research 2016, 45, e41–e41. [Google Scholar] [CrossRef]
- Jenuwein, T. and C.D. Allis, Translating the histone code. Science 2001, 293, 1074–80. [Google Scholar] [CrossRef]
- Almouzni, G. and H. Cedar, Maintenance of Epigenetic Information. Cold Spring Harb Perspect Biol 2016, 8. [Google Scholar] [CrossRef]
- Bajic, M., K. A. Maher, and R.B. Deal, Identification of Open Chromatin Regions in Plant Genomes Using ATAC-Seq. Methods Mol Biol 2018, 1675, 183–201. [Google Scholar]
- Picelli, S. , et al., Tn5 transposase and tagmentation procedures for massively scaled sequencing projects. Genome Res 2014, 24, 2033–40. [Google Scholar] [CrossRef]
- Zhang, T.J., B. Wang, Z, Nutrition and Application of Chickpea. Cereals & Oils 2004, 18–20.
- Zhang, X.N.M., Y. Cui, B. Ren, G X., Research progress on characteristics and application of chickpea and chickpea protein. Journal of Food Safety and Quality 2018, 9, 1983–1988. [Google Scholar]
- Garg, V. , et al., Chromosome-length genome assemblies of six legume species provide insights into genome organization, evolution, and agronomic traits for crop improvement. J Adv Res 2022, 42, 315–329. [Google Scholar] [CrossRef]
- Pertea, M. , et al., Transcript-level expression analysis of RNA-seq experiments with HISAT, StringTie and Ballgown. Nat Protoc 2016, 11, 1650–67. [Google Scholar] [CrossRef]
- Huang, M. , et al., An expedient survey and characterization of the soybean JAGGED 1 (GmJAG1) transcription factor binding preference in the soybean genome by modified ChIPmentation on soybean protoplasts. Genomics 2021, 113, 344–355. [Google Scholar] [CrossRef] [PubMed]
- Huang, M.K. , et al., Genomic Features of Open Chromatin Regions (OCRs) in Wild Soybean and Their Effects on Gene Expressions. Genes (Basel) 2021, 12. [Google Scholar] [CrossRef]
- Langmead, B. and S. L. Salzberg, Fast gapped-read alignment with Bowtie 2. Nat Methods 2012, 9, 357–9. [Google Scholar]
- Li, H. , et al., The Sequence Alignment/Map format and SAMtools. Bioinformatics 2009, 25, 2078–9. [Google Scholar] [CrossRef]
- Yuan, J. , et al., Open chromatin interaction maps reveal functional regulatory elements and chromatin architecture variations during wheat evolution. Genome Biol 2022, 23, 34. [Google Scholar] [CrossRef]
- Ramirez, F. , et al. , deepTools: a flexible platform for exploring deep-sequencing data. Nucleic Acids Res, 2014, 42, W187–91. [Google Scholar] [CrossRef]
- Thorvaldsdottir, H., J. T. Robinson, and J.P. Mesirov, Integrative Genomics Viewer (IGV): high-performance genomics data visualization and exploration. Brief Bioinform 2013, 14, 178–92. [Google Scholar] [CrossRef]
- Bailey, T.L. , et al., MEME SUITE: tools for motif discovery and searching. Nucleic Acids Res 2009, 37, W202–8. [Google Scholar] [CrossRef] [PubMed]
- Wang, Q. , et al., The histone modification H3K4me3 marks functional genes in soybean nodules. Genomics 2020, 112, 5282–5294. [Google Scholar] [CrossRef] [PubMed]
- Zhang, L. , et al., Establishment of a convenient ChIP-seq protocol for identification of the histone modification regions in the medicinal plant Andrographis paniculata. Medicinal Plant Biology 2023, 2. [Google Scholar] [CrossRef]
- Chen, X., V. Bhadauria, and B. Ma, ChIP-Seq: A Powerful Tool for Studying Protein-DNA Interactions in Plants. Curr Issues Mol Biol 2018, 27, 171–180. [Google Scholar] [CrossRef]
- Zhang, Y. , et al., Model-based analysis of ChIP-Seq (MACS). Genome Biol 2008, 9, R137. [Google Scholar] [CrossRef]
- Lehti-Shiu, M.D. , et al., Diversity, expansion, and evolutionary novelty of plant DNA-binding transcription factor families. Biochim Biophys Acta Gene Regul Mech 2017, 1860, 3–20. [Google Scholar] [CrossRef]
- Zhang, Z. , et al., ATAC-Seq Reveals the Landscape of Open Chromatin and cis-Regulatory Elements in the Phytophthora sojae Genome. Mol Plant Microbe Interact 2022, 35, 301–310. [Google Scholar] [CrossRef] [PubMed]
- Chow, C.N. , et al., PlantPAN3.0: a new and updated resource for reconstructing transcriptional regulatory networks from ChIP-seq experiments in plants. Nucleic Acids Res 2019, 47, D1155–D1163. [Google Scholar] [CrossRef]
- Zhao, W. , et al., Investigating crosstalk between H3K27 acetylation and H3K4 trimethylation in CRISPR/dCas-based epigenome editing and gene activation. Sci Rep 2021, 11, 15912. [Google Scholar] [CrossRef]
- Sun, W. , et al., Epigenetic regulation of human-specific gene expression in the prefrontal cortex. BMC Biol 2023, 21, 123. [Google Scholar] [CrossRef]
- Wu, Y. and L. Tirichine, Chromosome-Wide Distribution and Characterization of H3K36me3 and H3K27Ac in the Marine Model Diatom Phaeodactylum tricornutum. Plants (Basel) 2023, 12. [Google Scholar]
- Li, Q.L. , et al., The hyper-activation of transcriptional enhancers in breast cancer. Clin Epigenetics 2019, 11, 48. [Google Scholar] [CrossRef]
- Zhu, B. , et al., Genome-Wide Prediction and Validation of Intergenic Enhancers in Arabidopsis Using Open Chromatin Signatures. Plant Cell 2015, 27, 2415–26. [Google Scholar] [CrossRef]
- Oka, R. , et al., Genome-wide mapping of transcriptional enhancer candidates using DNA and chromatin features in maize. Genome Biol 2017, 18, 137. [Google Scholar] [CrossRef] [PubMed]
- Hendelman, A. , et al., Conserved pleiotropy of an ancient plant homeobox gene uncovered by cis-regulatory dissection. Cell 2021, 184, 1724–1739.e16. [Google Scholar] [CrossRef] [PubMed]
- Huang, M., M. W. Li, and H.M. Lam, How noncoding open chromatin regions shape soybean domestication. Trends Plant Sci 2021, 26, 876–878. [Google Scholar] [CrossRef] [PubMed]
- Huang, Y. , et al., HSFA1a modulates plant heat stress responses and alters the 3D chromatin organization of enhancer-promoter interactions. Nat Commun 2023, 14, 469. [Google Scholar] [CrossRef]
- Tannenbaum, M. , et al., Regulatory chromatin landscape in Arabidopsis thaliana roots uncovered by coupling INTACT and ATAC-seq. Plant Methods 2018, 14, 113. [Google Scholar] [CrossRef]
- Ricci, W.A. , et al., Widespread long-range cis-regulatory elements in the maize genome. Nat Plants 2019, 5, 1237–1249. [Google Scholar] [CrossRef]
- Lu, Z. , et al., The prevalence, evolution and chromatin signatures of plant regulatory elements. Nat Plants 2019, 5, 1250–1259. [Google Scholar] [CrossRef]
- Galli, M. , et al., The DNA binding landscape of the maize AUXIN RESPONSE FACTOR family. Nat Commun 2018, 9, 4526. [Google Scholar] [CrossRef]
- Fang, C. , et al., Dynamics of cis-regulatory sequences and transcriptional divergence of duplicated genes in soybean. Proc Natl Acad Sci U S A 2023, 120, e2303836120. [Google Scholar] [CrossRef]
- Huang, M. , et al., Identification of the accessible chromatin regions in six tissues in the soybean. Genomics 2022, 114, 110364. [Google Scholar] [CrossRef]
- Zhang, C. , et al., The T2T genome assembly of soybean cultivar ZH13 and its epigenetic landscapes. Mol Plant 2023, 16, 1715–1718. [Google Scholar] [CrossRef]
- Wang, L. , et al., Altered chromatin architecture and gene expression during polyploidization and domestication of soybean. Plant Cell 2021, 33, 1430–1446. [Google Scholar] [CrossRef]
- Wang, G. , et al., The chromatin accessibility landscape of pistils and anthers in rice. Plant Physiol 2022, 190, 2797–2811. [Google Scholar] [CrossRef]
- Ren, C. , et al., Characterization of Chromatin Accessibility and Gene Expression upon Cold Stress Reveals that the RAV1 Transcription Factor Functions in Cold Response in Vitis Amurensis. Plant Cell Physiol 2021, 62, 1615–1629. [Google Scholar] [CrossRef]
- Hendelman, A. , et al., Conserved pleiotropy of an ancient plant homeobox gene uncovered by cis-regulatory dissection. Cell 2021. [Google Scholar] [CrossRef] [PubMed]
- Huang, M. , et al., Decoding the chromatin accessibility in Andrographis paniculata genome, a case study of genome-wide investigation of the cis-regulatory elements in medicinal plants. Acta Pharm Sin B 2024, 14, 4179–4182. [Google Scholar] [CrossRef]
- Schmitz, R.J., E. Grotewold, and M. Stam, Cis-regulatory sequences in plants: Their importance, discovery, and future challenges. Plant Cell 2022, 34, 718–741. [Google Scholar] [CrossRef] [PubMed]
- Huang, M. , et al., Molecular evidence for enhancer-promoter interactions in light responses of soybean seedlings. Plant Physiol 2023, 193, 2287–2291. [Google Scholar] [CrossRef]
- Oudelaar, A.M. and D.R. Higgs, The relationship between genome structure and function. Nat Rev Genet 2021, 22, 154–168. [Google Scholar] [CrossRef]
Figure 1.
Data summary of ATAC-seq in chickpea genome. (A) Overview of RNA-seq and ATAC-seq signal coverage, using the region 58,572,660-58,678,234 in chromosome 5 (Ca5) as an example. (B) Enrichment of ATAC-seq signal and a positive correlation with the gene expression levels were observed. TSS, transcription start site; TES, transcription end site. High, Middle, and Low indicate the high (FPKM ≥ 10), medium (1 ≤ FPKM < 10), and low (FPKM < 1) expression genes, respectively. (C) The number of ACRs in each chromosome. Ca1-Ca8 indicates the 8 chromosomes observed in chickpea. (D) Distribution of ACRs in the chickpea genome, including Promoter (35%), Downstream (12%), Intergenic (42%), and Exon (11%).
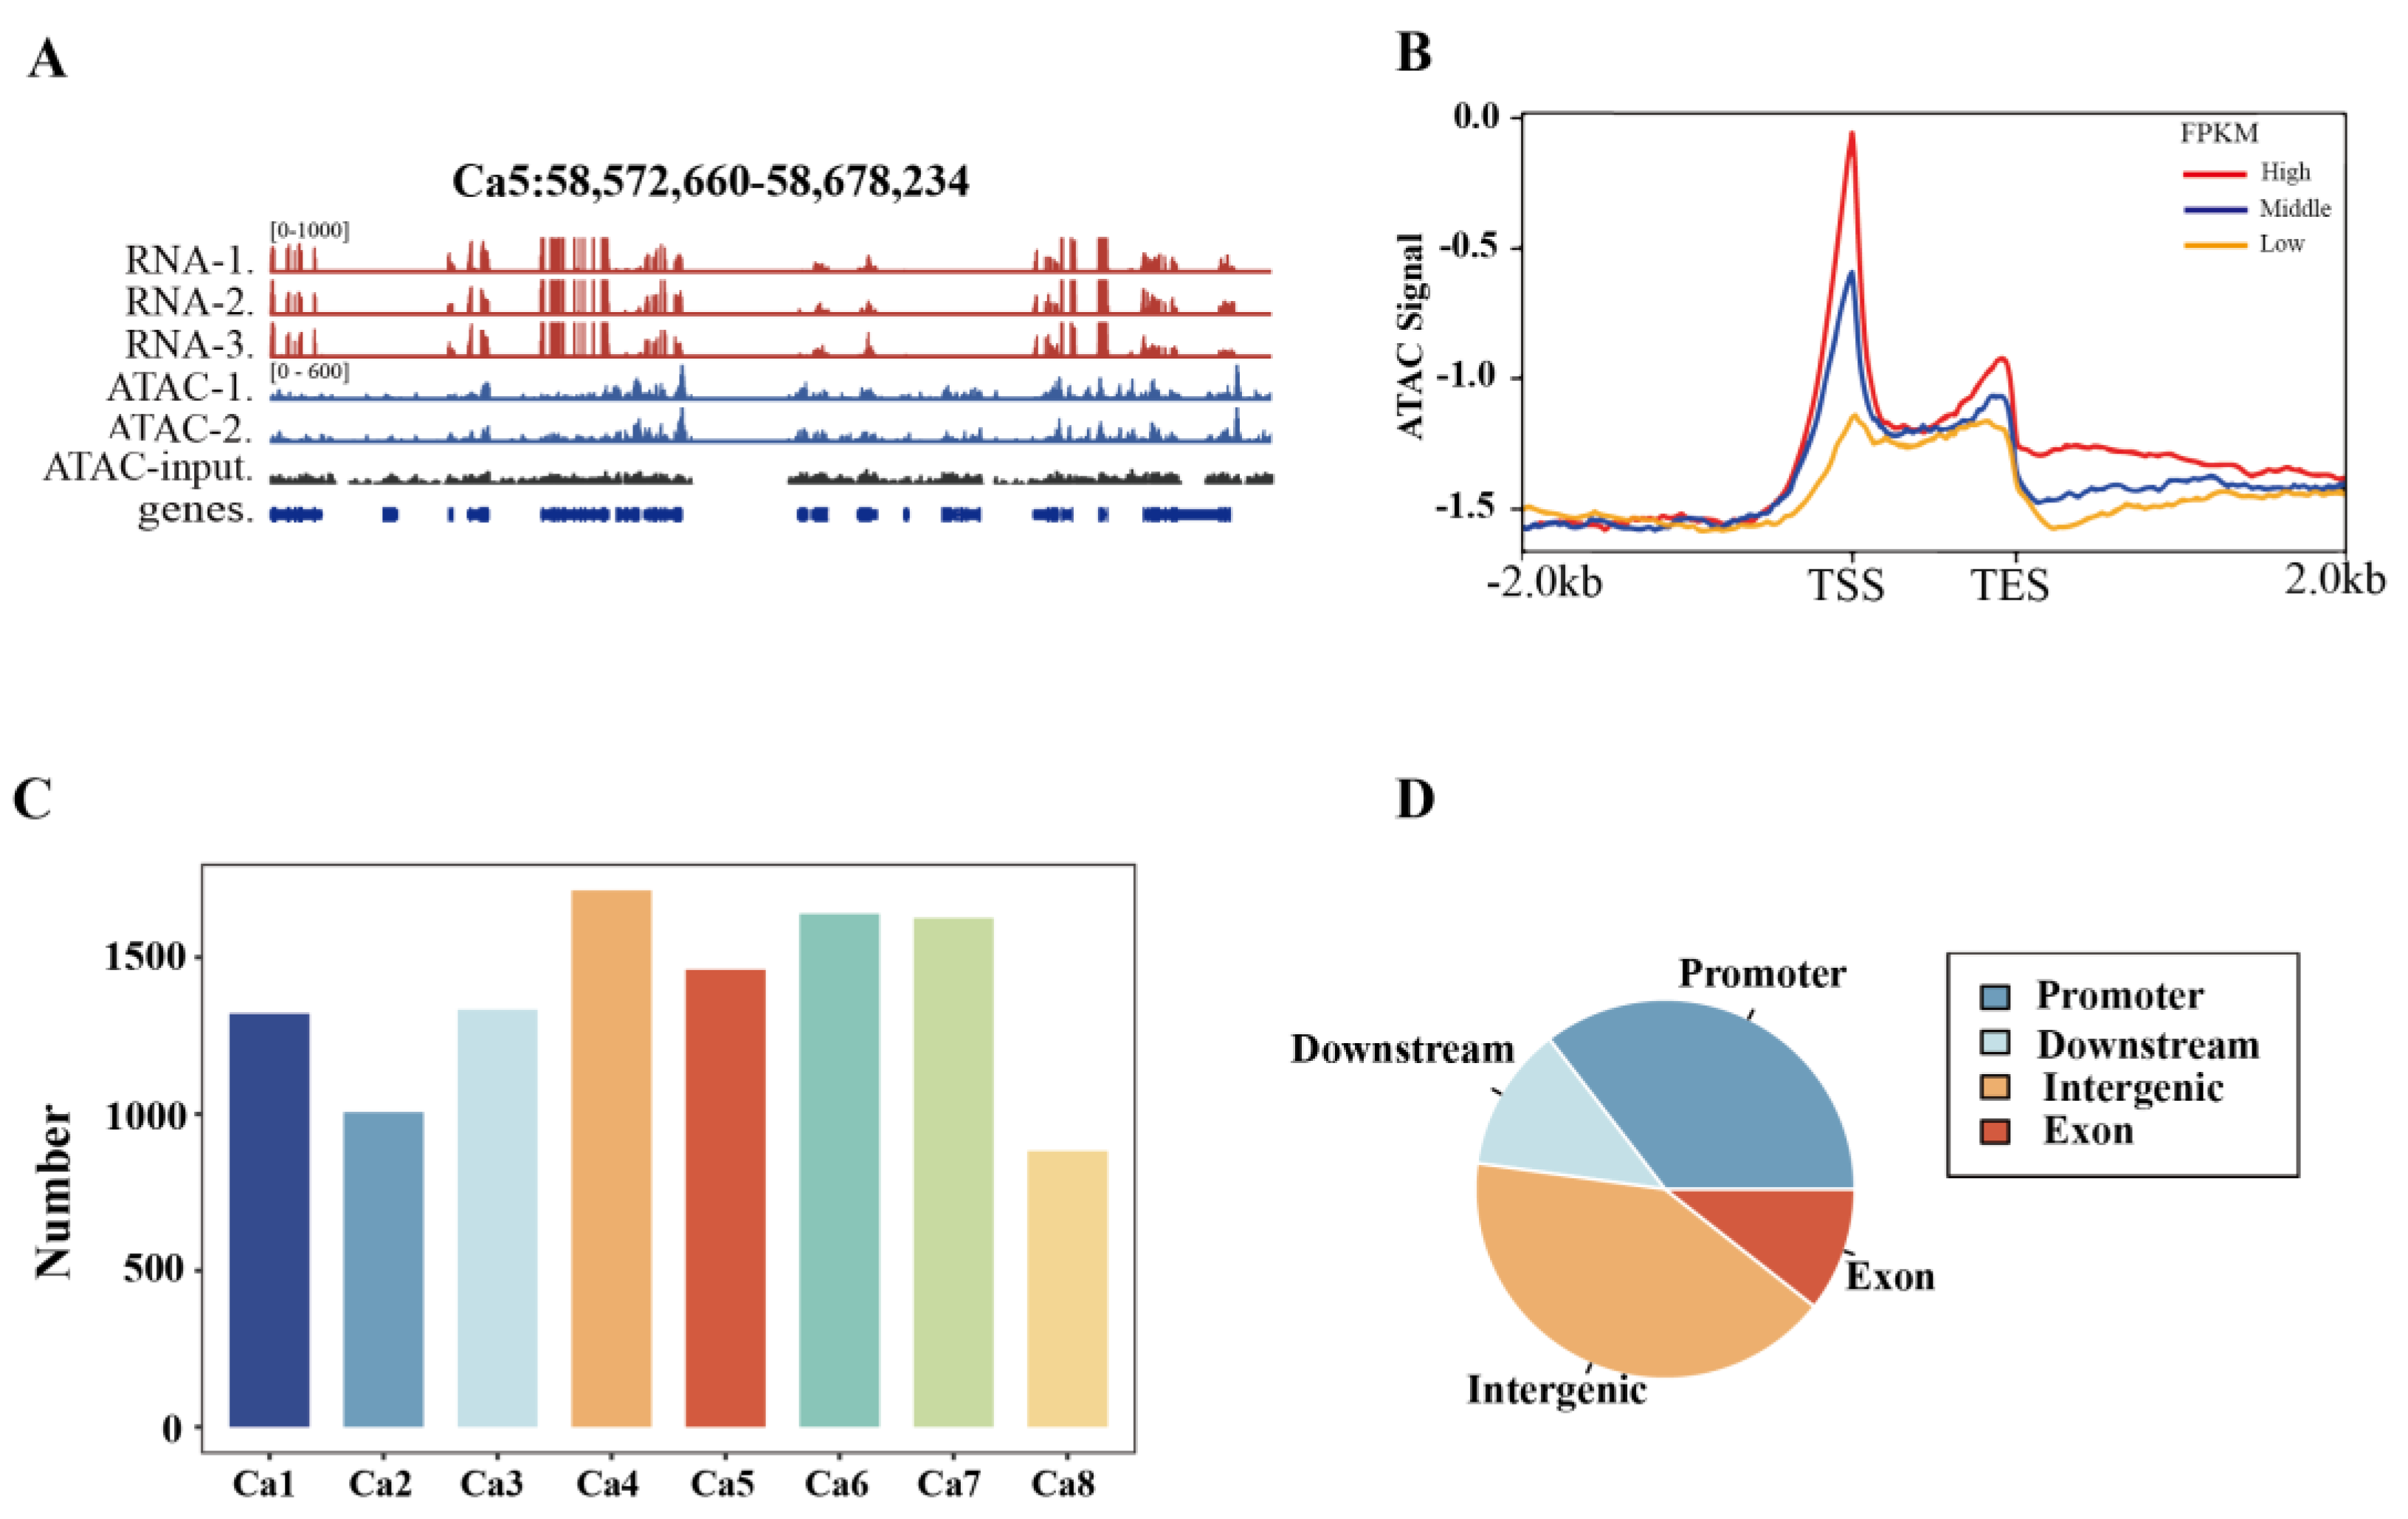
Figure 2.
Conserved transcription factor motifs enriched at ACRs in chickpea genome. (A) Top ten enriched transcription factor (TF) motifs detected in ACRs, including AP2, bHLH, bZIP, C2H2, Dof, MADS_box, MYB, NAC, TCP, and WRKY motifs. (B) Potential TF regulatory network predicted from genes associated with ACR enriched motifs. Yellow squares indicate corresponding TFs and purple squares indicate associated genes. (C) Number of potential co-targeted genes by the top three enriched TF motifs (MYB, NAC, and AP2) in ACRs. (D) Examples of TF motifs at an ACR, such as TCP (TFmatrix_ID1401), MYB (TFmatrix_ID0361), and bHLH (TFmatrix_ID0497).
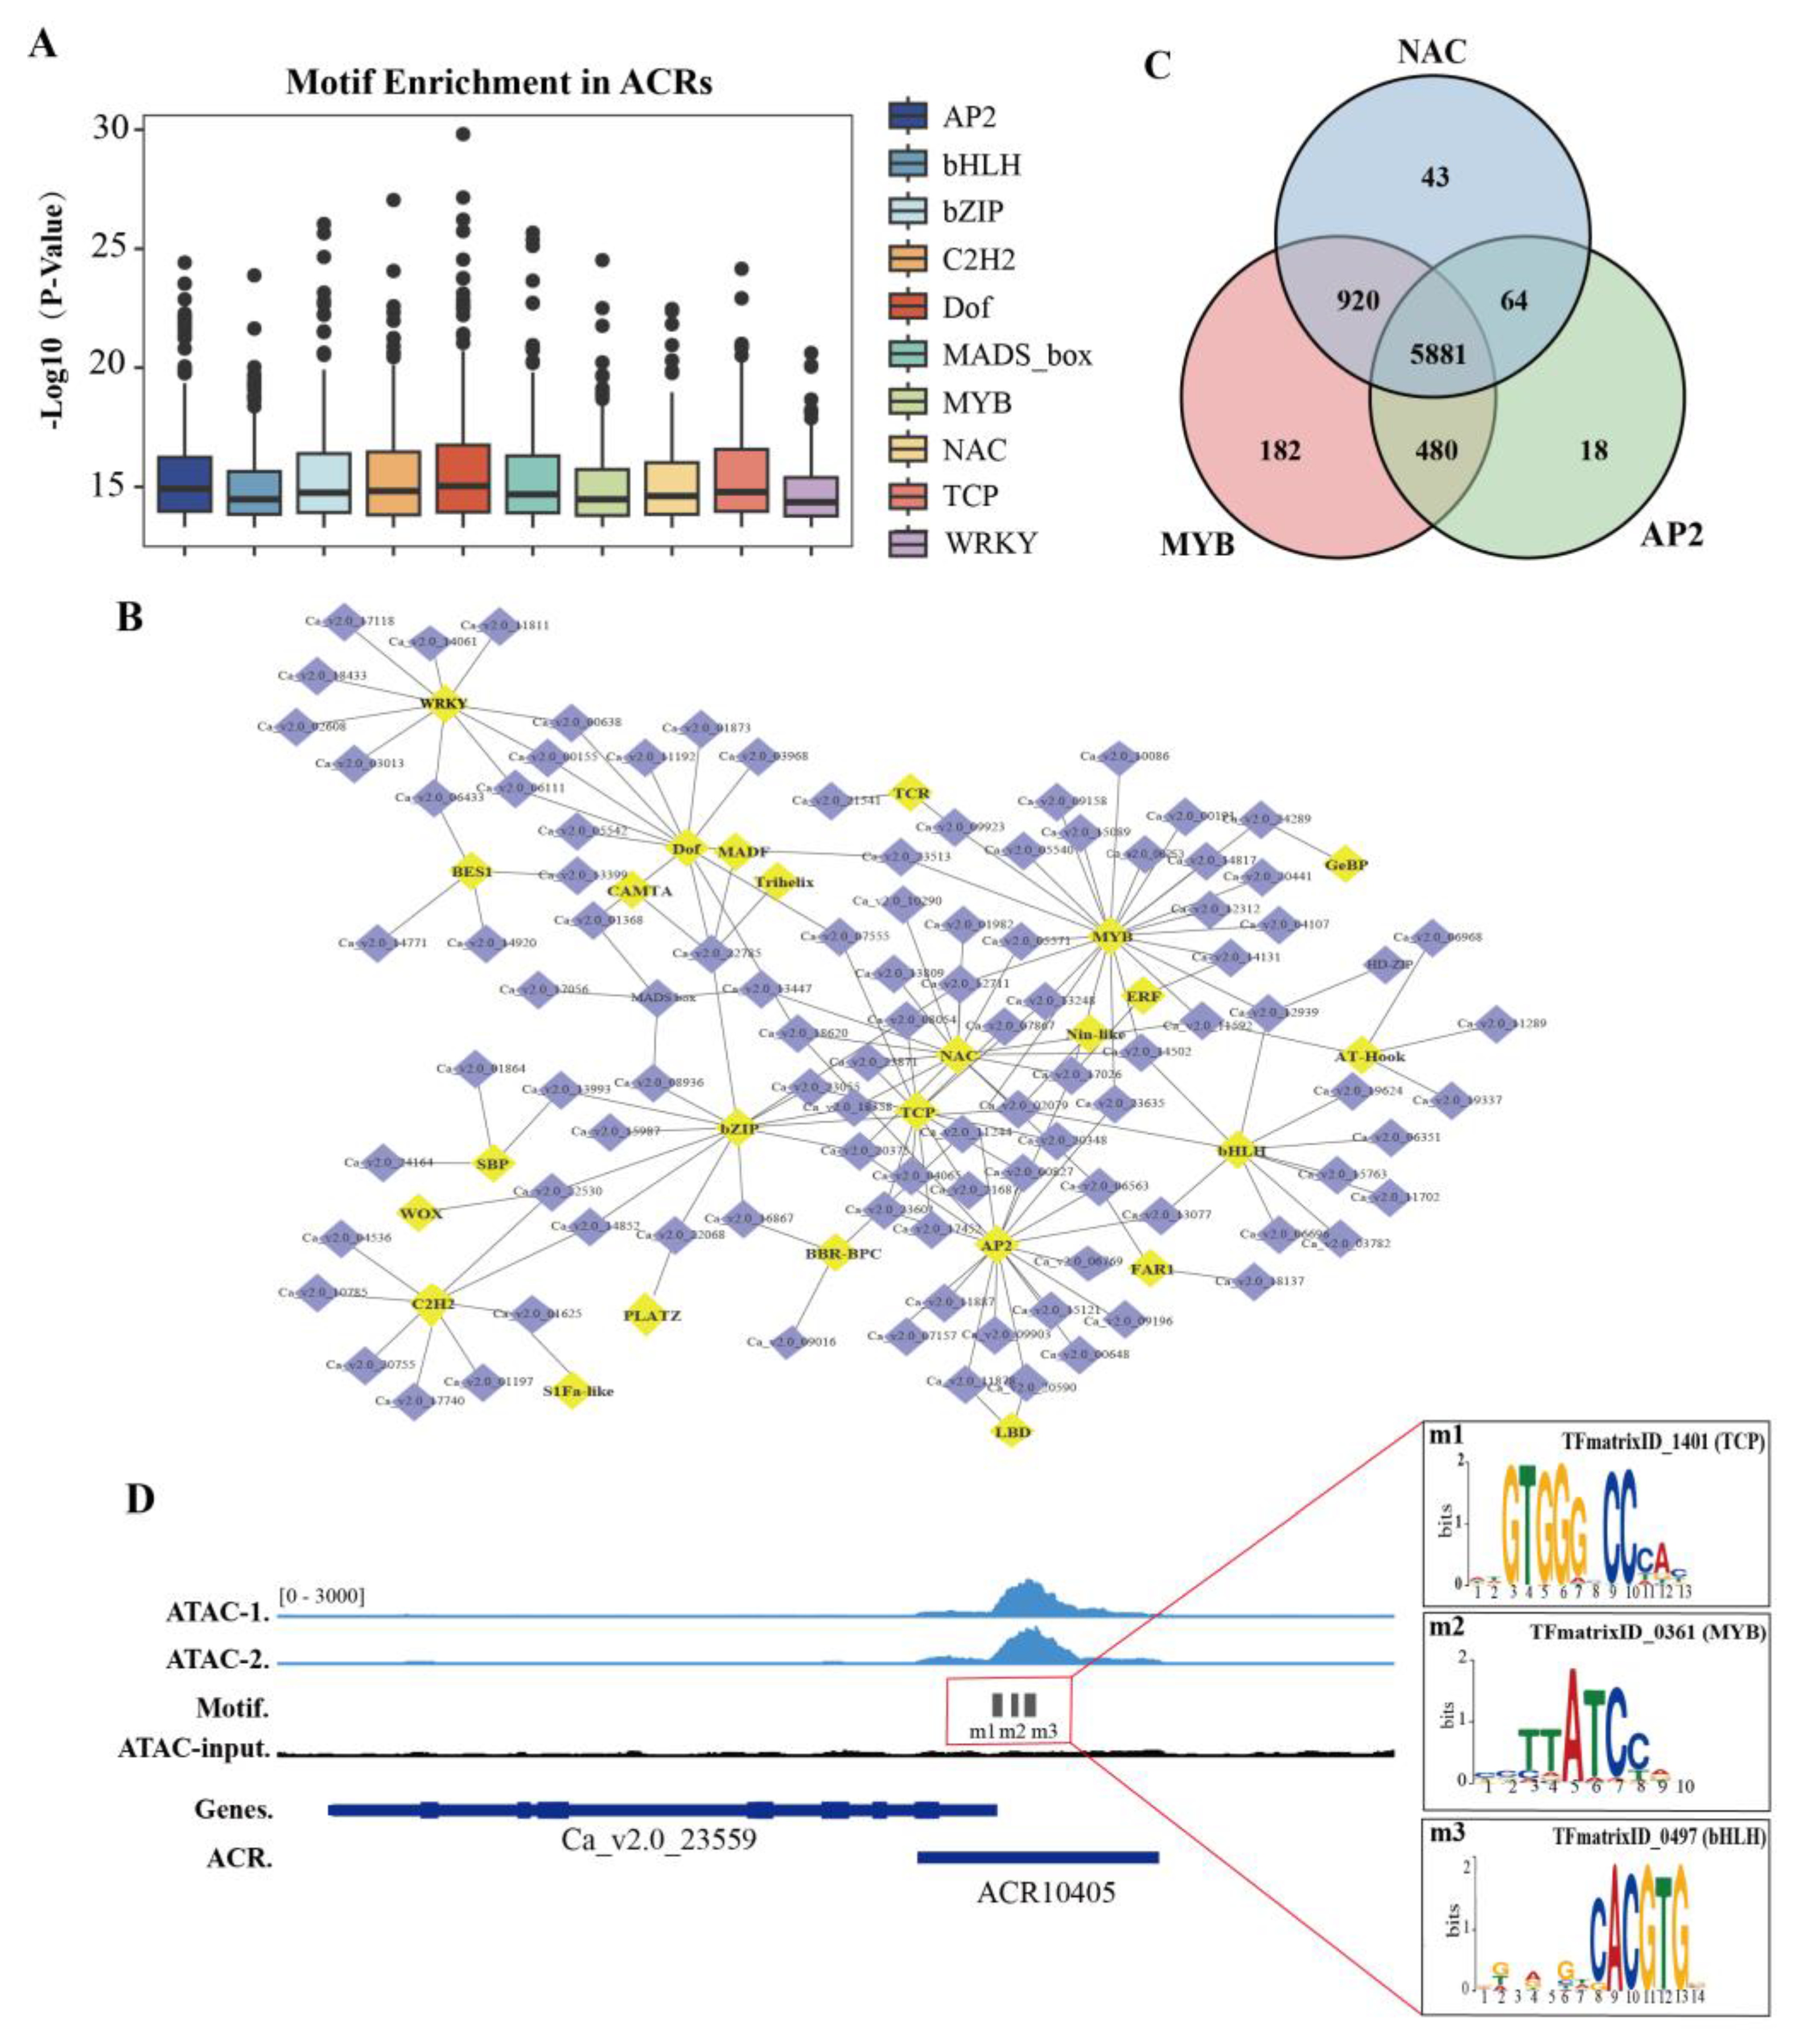
Figure 3.
Histone modifications features at ACRs in chickpea genome. (A) Histone ChIP signaling enrichments of H3K27ac and H3K4me3. High, Middle, and Low indicate the high (FPKM≥10), medium (1≤FPKM<10), and low expression (FPKM<1). TSS, transcription start site; TES, transcription end site. (B) Heatmap showing the ACRs are classified into two major clusters according to the H3K27ac and H3K4me3 signal intensities by the K-mean algorithm. (C) Venn diagram showing that 3,565 ACRs are dual-modified by both H3K4me3 (K4) and H3K27ac (K27). (D) Examples of the H3K4me3 (K4) and H3K27ac (K27) modified ACRs, K4 and K27 dual-modified ACRs. (E) H4K4me3 has more signal coverages than H3K27ac at K4 and K27 dual-modified ACRs. (F) Expression levels of genes associated with K4 and K27 dual-modified ACRs are significantly higher than those with either K27 or K4 modification only.
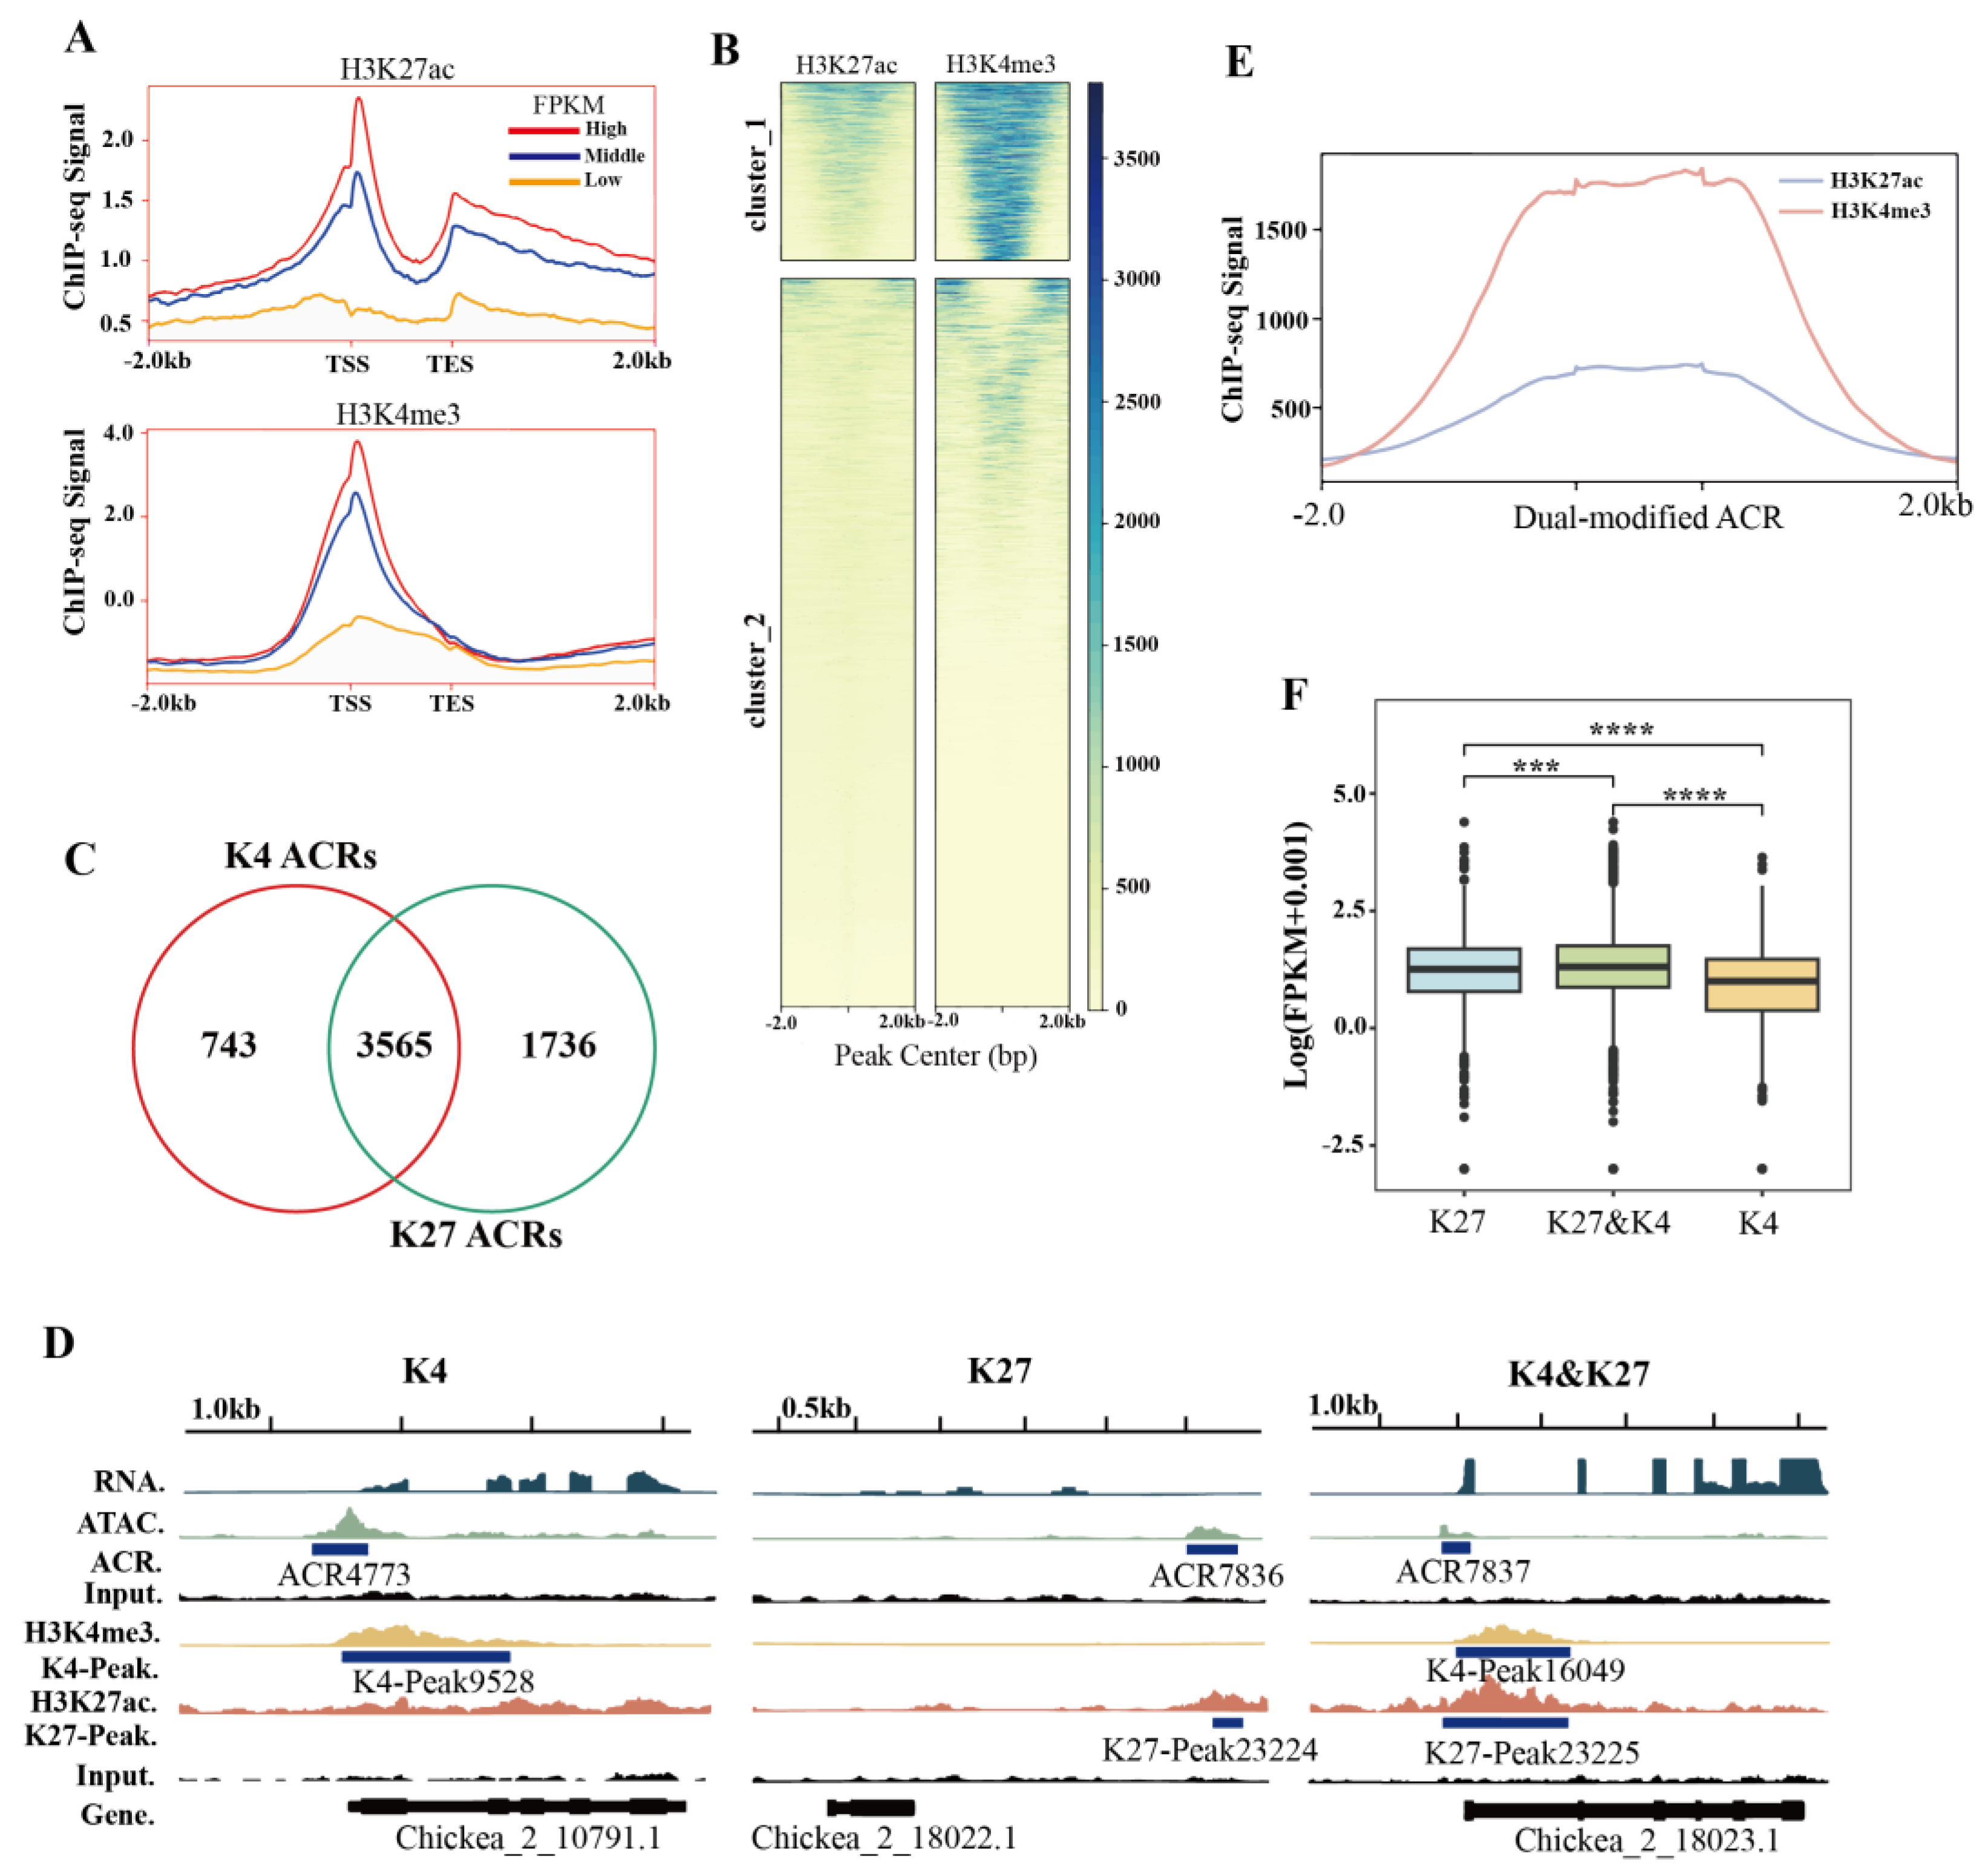
Figure 4.
Characterization of distal ACRs (dACRs) in chickpea genome. (A) The distance from dACRs to their nearest associated genes. (B) The percentage of unmodified, H3K4me3 (K4), H3K27ac (K27) modified, K4 and K27 dual-modified dACRs. (C) The distribution of K4 and K27 modified dACRs according to the distance to the transcription start site (TSS). (D) The expression levels of genes associated with both pACRs and dACRs were significantly higher than those with only dACRs or pACRs. (E) Examples of K4, K27 modified, K4 and K27 dual-modified dACRs, as well as the unmodified dACRs.
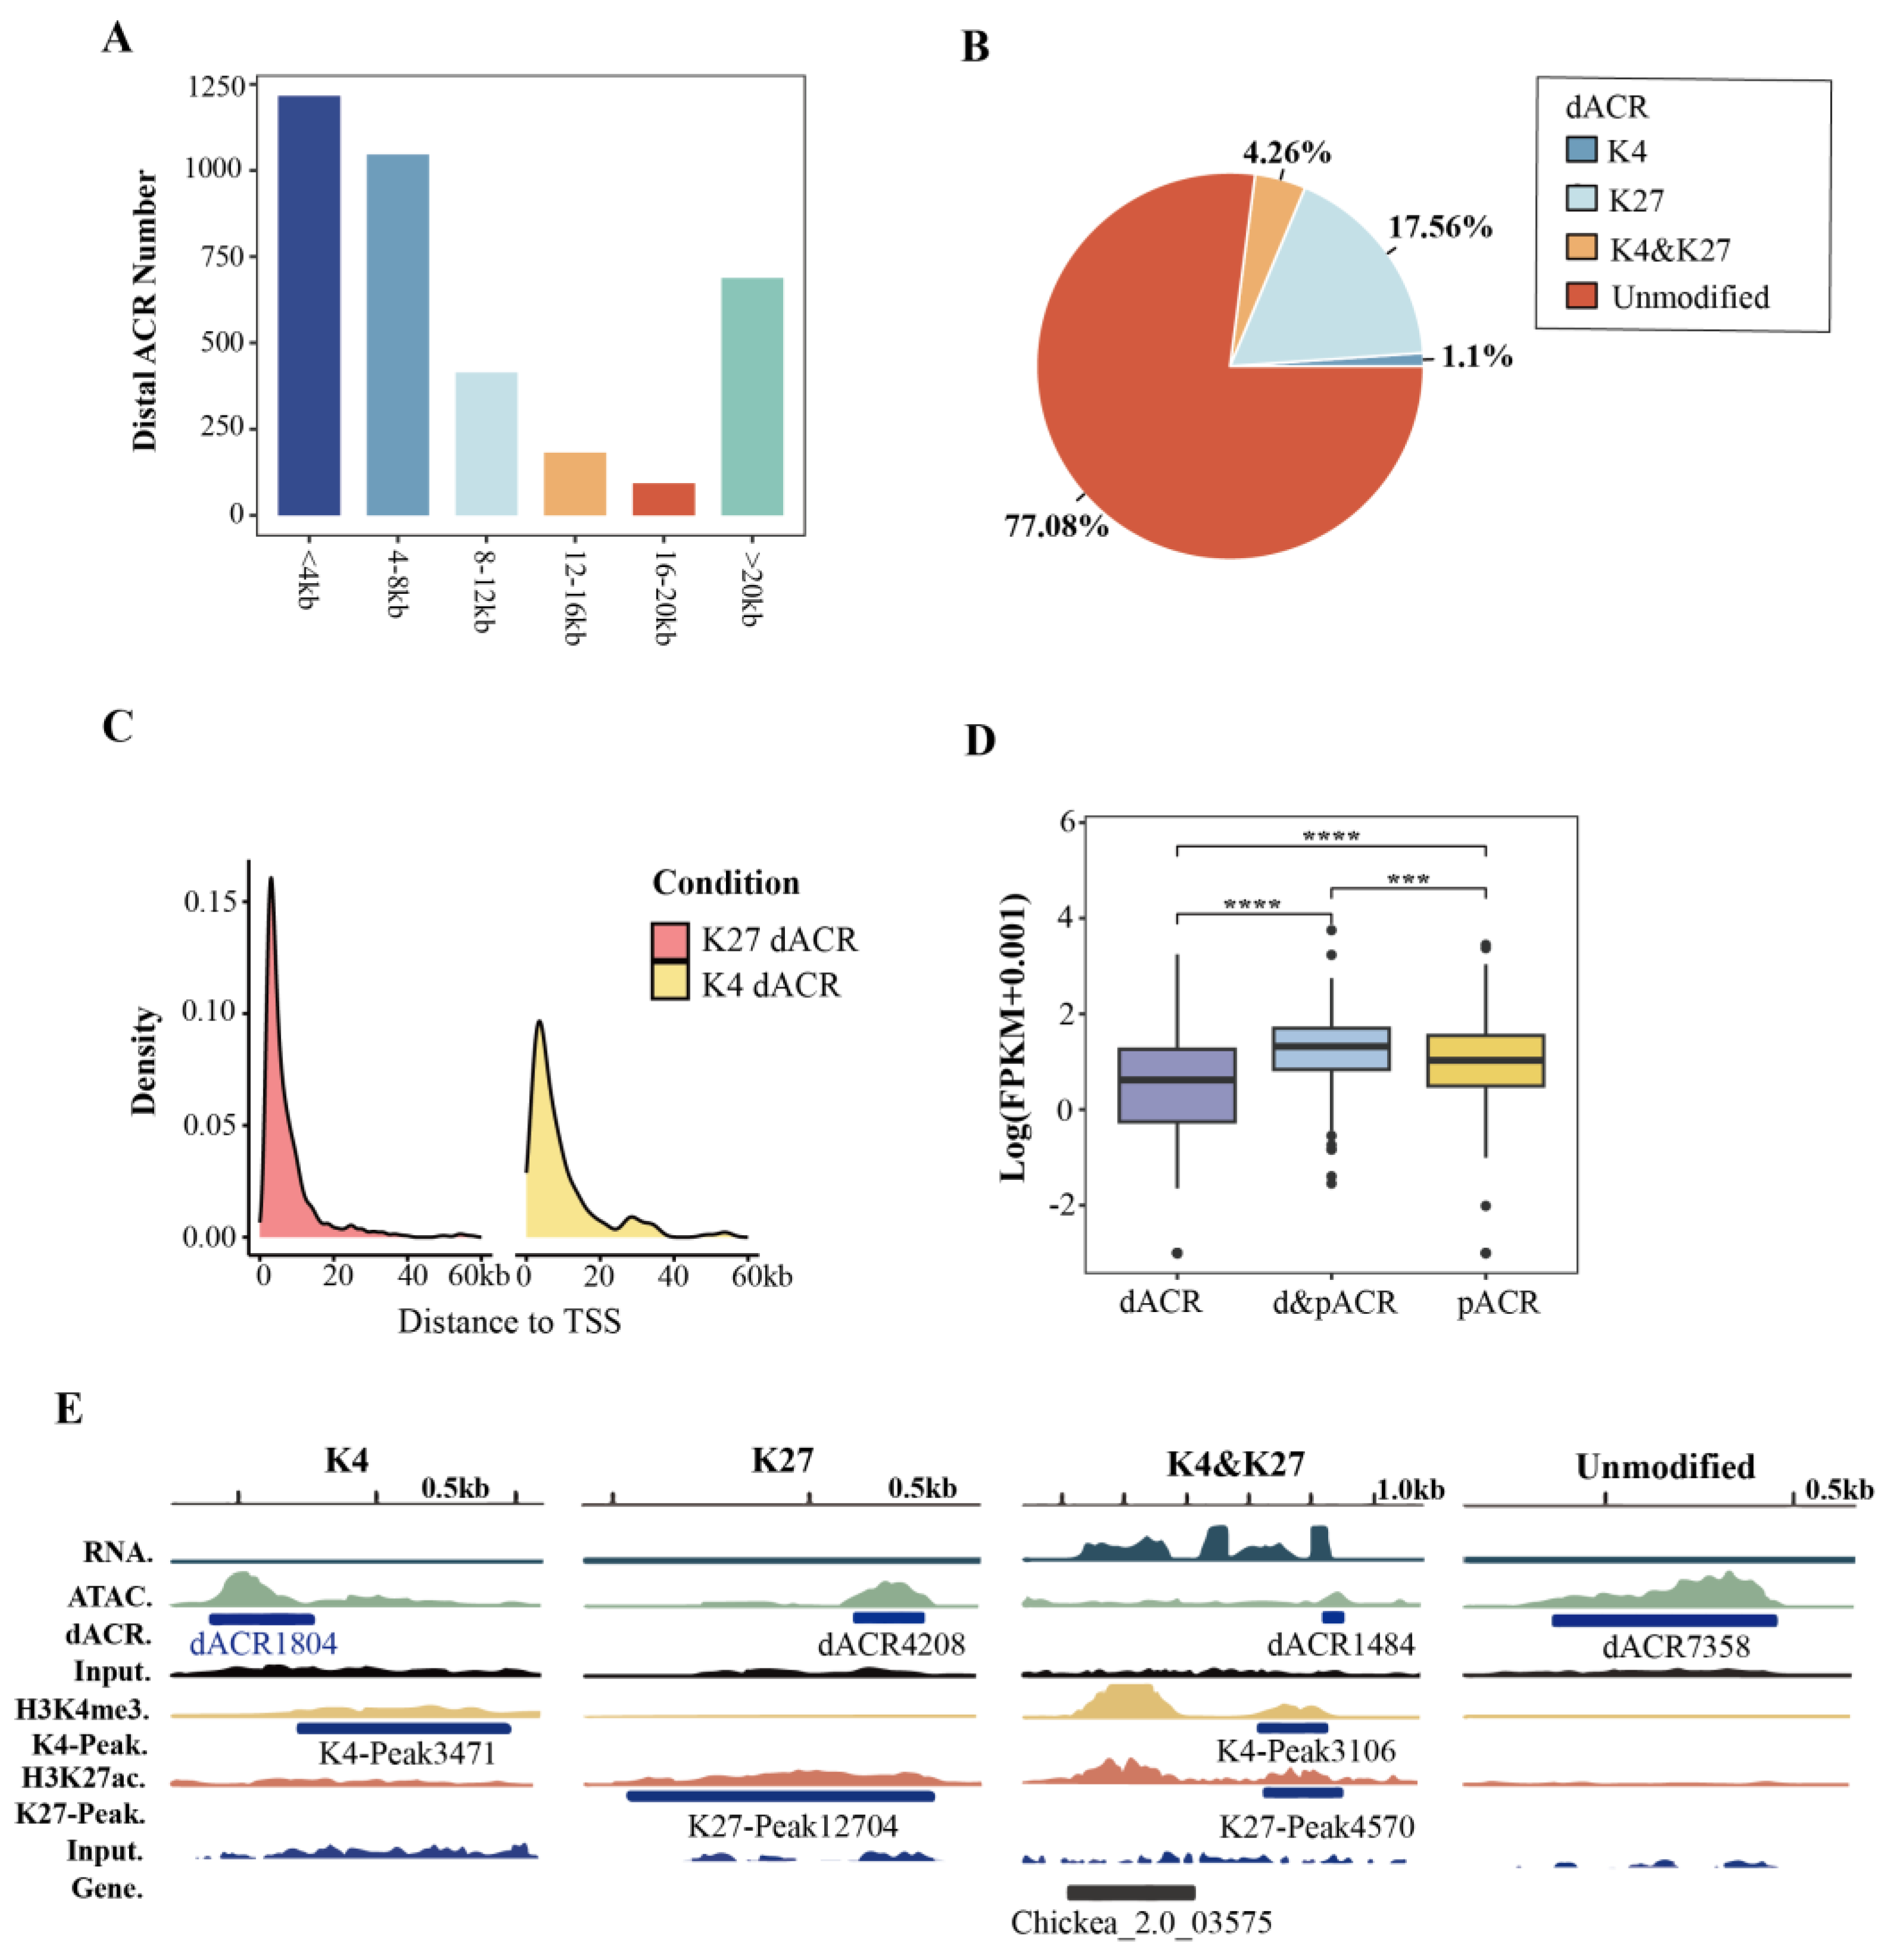
Figure 5.
Potential influences of pACRs on homologous gene (hGene) expression. (A) Expression levels of hGenes associated with ACRs showed no significant difference (left panel). Examples of hGenes are both associated with ACRs in the IGV screenshot (right panel). (B) Expression levels of hGenes in which one does not associate with an ACR (left panel). Examples of the hGenes pairs with or without ACRs (right panel).
Disclaimer/Publisher’s Note: The statements, opinions and data contained in all publications are solely those of the individual author(s) and contributor(s) and not of MDPI and/or the editor(s). MDPI and/or the editor(s) disclaim responsibility for any injury to people or property resulting from any ideas, methods, instructions or products referred to in the content. |
© 2025 by the authors. Licensee MDPI, Basel, Switzerland. This article is an open access article distributed under the terms and conditions of the Creative Commons Attribution (CC BY) license (http://creativecommons.org/licenses/by/4.0/).
Copyright: This open access article is published under a Creative Commons CC BY 4.0 license, which permit the free download, distribution, and reuse, provided that the author and preprint are cited in any reuse.


