
Submitted:
06 February 2025
Posted:
07 February 2025
You are already at the latest version
Abstract
This study evaluates the feasibility of employing motion capture technology to assess the biomechanical effects of an ankle-foot orthosis (AFO) with a customized varus control strap on lower-limb kinematics and kinetics during gait. While the biomechanical impacts of hindfoot-posted orthoses are well-documented, the influence of varus corrective strapping on proximal joint mechanics remains underexplored. To address this gap, a single-subject pilot study involving a healthy participant was conducted, with kinematic and kinetic data collected across five walking trials under three conditions: barefoot, shod, and shod+AFO. Results demonstrated that the AFO increased double-limb support time from 15% (barefoot) to 20% (shod+AFO) of the gait cycle and reduced peak ankle plantarflexion and dorsiflexion during the swing phase. Ipsilateral knee extension decreased, while heightened variability in joint moments was observed at the contralateral hip and knee. These findings suggest that varus corrective strapping induces sagittal plane kinematic alterations, with compensatory effects extending to the contralateral limb. This pilot study highlights the utility of motion capture systems in evaluating AFO interventions and underscores the need to assess bilateral biomechanical adaptations. Future research should expand to pathological populations, such as individuals with neuromuscular disorders, and investigate frontal plane mechanics to inform AFO customization for clinical populations.
Keywords:
Varus corrective strap
; Ankle-foot orthosis
; Motion capture analysis
; Gait biomechanics
; Subtalar joint control
; Lower limb kinematics
1. Introduction
The hindfoot, comprising the calcaneus and talus,
forms the subtalar joint—a critical articulation with the tibia that enables
multiplanar motion essential for gait adaptability and load distribution [1,2,3]. Dysfunction of this joint is implicated in
diverse pathologies, including running injuries, Achilles tendon tears,
posterior tibialis tendon dysfunction, and knee osteoarthritis [4,5,6],7]. Consequently, subtalar stabilization via
orthotic interventions is a cornerstone of treatment for these conditions [8,9,10],11].
In a closed kinetic chain (e.g., stance phase of
gait), the subtalar joint facilitates motion where the talus and tibia rotate
over a relatively fixed calcaneus, allowing the body to adapt to terrain or
postural demands [3]. Orthotic strategies
targeting this joint often employ hindfoot posting or wedging to modulate
alignment and kinetics [12,13,14,15,16]. For example,
lateral wedging combined with subtalar strapping has been shown to reduce knee
varus moments in medial compartment osteoarthritis, while medial posting
mitigates excessive hindfoot eversion in runners [8,14,15,16,17,18].
However, studies examining sagittal plane adaptations report mixed outcomes,
with some interventions altering ankle dorsiflexion but sparing proximal joints
[16,
19]. Systematic reviews further highlight
that orthotic effects vary by design, with lateral wedges increasing ankle
dorsiflexion and eversion, whereas medial posting reduces eversion moments [20].
Despite these advances, critical gaps persist.
First, most research focuses on plantar-surface interventions (e.g., insoles)
rather than devices encompassing the leg proximal to the ankle, such as
ankle-foot orthoses (AFOs). Second, while strapping techniques are occasionally
combined with wedging for osteoarthritis management [17,
18],
the isolated effects of subtalar strapping—particularly varus corrective
strapping integrated into AFOs—remain unexamined. Traditional AFOs often rely
on external dorsal straps for retention, but internal slotted straps could
directly apply mediolateral forces to the subtalar joint, potentially enhancing
biomechanical efficacy. To date, no studies have quantified the sagittal plane
kinematic and kinetic effects of such strapping on the ankle, knee, and hip nor
assessed bilateral adaptations.
Motion capture technology, integrated with force
plate data, is uniquely suited to address these gaps. Unlike isolated kinetic measurements,
motion capture provides high-resolution spatial and temporal data on
multi-joint coordination, enabling precise quantification of orthotic-induced
adaptations across the kinetic chain [12,
16].
This approach is critical for detecting compensatory mechanisms in proximal
joints, which may arise from altered subtalar mechanics [12,
20]. Furthermore, its ability to synchronize
kinematic (e.g., joint angles) and kinetic (e.g., moments) data makes it
indispensable for evaluating how AFOs influence both movement patterns and
underlying forces.
This study investigates the biomechanical effects
of a free-motion AFO with a varus corrective strap on sagittal plane kinematics
and kinetics at the ankle, knee, and hip during gait. Using motion capture and
force plate analysis, we evaluate bilateral adaptations to address two
questions: (1) How does varus strapping alter ankle kinematics and kinetics
compared to barefoot and shod conditions? (2) Does subtalar joint correction
propagate compensatory changes to ipsilateral or contralateral knee and hip mechanics?
Findings will inform the design of AFOs for pathologies requiring subtalar
control and underscore the utility of motion capture in orthotic assessment.
2. Materials and Methods
2.1. Subject and AFO Design
A healthy 29-year-old female (height: 1.58 m,
weight: 54.43 kg, BMI: 21.8 kg/m²) with no history of orthopedic or vestibular
impairments participated in this study. Written informed consent was obtained
in accordance with institutional ethical guidelines.
A custom articulated AFO was fabricated for the
left limb using 3/16” polypropylene. The design prioritized subtalar joint
control while preserving sagittal plane mobility. A certified orthotist
performed a plaster cast of the left leg with the calcaneus in neutral
alignment. Positive model rectification was conducted by an orthotic resident
(3 years of experience), followed by vacuum forming by a certified prosthetics
and orthotics technician (CPO). The AFO incorporated Tamarack Flexure Joints®
(Tamarack Habilitation Technologies, MN, USA), selected for their clinical
prevalence and ability to permit free dorsiflexion (unrestricted) and
controlled plantarflexion (20° limit). To minimize skin irritation, foam
padding was added at the malleoli, and a posterior heel cut-out was included to
facilitate calcaneal motion tracking (Figure 1).
The key innovation was a varus corrective strap (1”
Velcro®) routed from the lateral AFO shell through an internal slot
posterior and inferior to the medial malleolus, applying direct mediolateral
force to the subtalar joint (Figure 2).
The left shoe was modified with a heel cut-out to enable calcaneal marker
visibility during motion capture [21].
2.2. Motion Capture and Kinetic Data Acquisition
Kinematic data were collected using a 12-camera
Qualisys™ system (Qualisys AB, Sweden; sampling rate: 120 Hz) synchronized with
four AMTI™ force plates (Advanced Mechanical Technology Inc., MA, USA; sampling
rate: 1 kHz). A total of 56 retroreflective markers were placed bilaterally on
lower extremity anatomical landmarks, including the pelvis (L3 spinous process)
and feet. Marker placement followed the Oxford Foot Model (OFM) [23,24,25] for
the foot/ankle complex (11 markers per foot), enabling multi-segment foot
tracking [26,27,28]. For the shod and shod+AFO
conditions, foot markers were repositioned on shoe surfaces at approximate
anatomical locations.
Before dynamic trials, a static calibration trial
was captured to generate a subject-specific skeletal model in Visual3D™
(C-Motion, MD, USA). Dynamic trials involved the subject walking self-paced
across a 7.6 m walkway (five trials per condition: barefoot, shod, shod+AFO).
Marker trajectories and (ground reaction forces) GRFs were synchronized and
processed in Qualisys™ Track Manager.
2.3. Outcome Measures
Spatiotemporal, kinematic, and kinetic parameters
were analyzed using Visual3D™ (v6.01, C-Motion) and custom MATLAB®
(MathWorks, MA, USA) scripts. Spatiotemporal measures included:
- gait speed: stride length/stride time [22].
- stride length/time: heel strike to ipsilateral heel strike.
- stance/swing phase: heel strike to toe-off (stance), toe-off to heel strike (swing).
- double support duration: time with bilateral ground contact.
- Joint angles (ankle, knee, hip) were computed as segment orientations:
- Ankle: foot relative to shank.
- Knee: shank relative to thigh.
- Hip: thigh relative to trunk.
Net joint moments were derived via inverse dynamics
using GRFs and segment kinematics [22].
Moments reflect the net muscular torque at each joint, normalized to body
weight.
2.4. Experimental Protocol
Markers were applied bilaterally using the OFM [23,24,25], with additional proximal markers up to the
pelvis (Figure 3). After barefoot trials,
foot markers were transferred to shoes. During shod-to-shod+AFO transitions,
malleolar and left calcaneal markers were adjusted to accommodate the AFO.
Static and dynamic calibrations preceded each condition to ensure model consistency.
An additional 34 markers were placed up to the
pelvis, including the L3 marker (Figure 3).
The markers on the foot were removed after the barefoot condition and replaced
on the shoe at approximate positions. The malleoli markers on both legs and the
calcaneus marker on the left were removed and replaced during the transition
between the shod and shod with AFO conditions. A standing calibration was
conducted with the subject static and dynamic before each condition. After the
calibration, the subject performed five self-paced walking trials under three
conditions: barefoot, shod, and shod with AFO.
2.5. Data Analysis
Raw marker trajectories and GRFs were filtered
using a 4th-order Butterworth low-pass filter (cutoff: 6 Hz for kinematics, 50
Hz for kinetics). Gait events (heel strike/toe-off) were identified using a 20
N GRF threshold. Joint angles and moments were time-normalized to 100% of the
gait cycle. Descriptive statistics (mean ± SD) were calculated across five
trials per condition.
3. Results
3.1. Spatiotemporal
The step length, step time, stance time, and swing
time largely remained unchanged (Table 1).
There was an overall reduction in speed in the AFO trials (1.258m/s) compared
to shod (1.407m/s) and barefoot (1.383m/s) (Table 2). The main spatiotemporal deviation occurs with double limb support in
the shod with AFO condition. The double limb support time increased compared to
the barefoot condition. The time spent in double support for barefoot is
0.139(+/-0.013s), and the time spent in double support for the AFO condition is
0.206 (+/-0.030s). Stride width remained stable across conditions (0.119–0.147
m).
3.2. Kinematics
During the shod with AFO trials, the plantarflexion
peak angle decreased on both the left and right sides (Figure 4). During the loading response, the
plantarflexion angle on the left increased compared to the barefoot and shod
conditions. The peak dorsiflexion angle decreased on the left during the swing
phase for the shod with AFO trials. During the midswing on the right, the
dorsiflexion angle was reduced compared to the barefoot condition. However, it
continued to dorsiflex in preparation for the heel strike, while the barefoot
condition decreased into slight plantar flexion.
Knee extension angles decreased throughout most
stances for the left AFO condition (Figure 4).
The right-side knee angles were relatively uniform across all three conditions.
The peak knee extension angles bilaterally for all conditions were larger than
normative values [30]. The mean knee extension
angle for the left side in each condition was as follows: barefoot -11.19
(0.09)°, shod -11.92 (0.96)°, shod with AFO -14.25 (1.08)°. The mean knee
extension angle for the right side was as follows -15.04 (0.40), shod -15.19
(0.77), shod with AFO -13.25 (0.51), while normal knee extension is a maximum
of approximately -1° [30].
The left hip angle during the shod with AFO trials
demonstrated decreased flexion for the first 15% of the gait cycle, where the
angle changes from flexion to extension, then the left hip depicts a greater
extension at an earlier percentage of the gait cycle than the barefoot or shod
condition (Figure 4). The left peak hip
flexion angle is slightly greater than the other two conditions. The right hip
peak extension angle for the shod with AFO condition is decreased, while the
peak flexion angle is increased, compared to the shod and barefoot trials. Similarly
to the knee, the hip peak extension angles for all three conditions were
depicted as much greater than the normal range of approximately -2° to -15° [30]. In addition, the transition from flexion to
extension during stance on both limbs was achieved earlier (at 15-20% of the
gait cycle) for all three conditions compared to the normal 30-40% of the gait
cycle [30].
3.3. Kinetics
Overall, greater variances in joint moment were
observed in the bilateral hip and knee, with the right side being more impacted
than the left during the shod with AFO trial. Additionally, notable results
during this trial for joint moments were a lack of knee and hip flexion moments
during most of the gait cycle after the loading response, indicating a reduced
response of the hamstrings and hip flexors. Similarly, the ankle moments did
not follow normative patterns in that they maintained a dorsiflexion moment
until approximately 30% of the gait cycle instead of 10%, and the
plantarflexion moment occurred at 80% instead of 50% [31].
There was not a span of a neutral or zero moment, as is typically seen in
normal gait.
At the hip, the AFO and shod conditions exhibited
no extension moment at initial contact, though it was observed in barefoot
condition. A reduced flexion moment was observed at the hip during loading
response in the AFO and shod trials compared to the barefoot trials. Both hip
extension moment peaks occur at about 80% of the gait cycle, whereas normal
peak extension moment occurs during the loading response. In addition, the hip
extensor moment magnitudes are greater in this study [left: barefoot 3.44 (0.33)N*m/Kg,
shod 3.53 (1.49), AFO 3.10 (0.26); right: barefoot 5.56 (1.43), shod 4.74
(0.29), AFO 1.68 (0.11)] than normal [31]. At
the knee, there were also higher extension moment magnitudes than the normal [31].
The AFO trials demonstrated reduced peak knee flexion and extension moments on the right side compared to barefoot and shod. The left side shows similar peak magnitudes, between 20 and 25% of the gait cycle, within the three conditions. However, the AFO trials demonstrated a quicker reduction in extension moment at the knee and level out at a greater extension moment than the other two conditions. Normal gait has four transitions between flexion and extension moments. However, the AFO trials only mirror the transition at the beginning, around 7% of the gait cycle, during the loading response.
All three conditions follow normative graphs for vertical GRF during walking, however, only the barefoot condition exhibits the spike in amplitude shortly after initial contact. The first peak of the left side of GRF (loading response) is delayed in the AFO and shod conditions compared to the barefoot condition (Figure 5). In addition, the second peak (toe-off) was reduced in the AFO and shod conditions compared to barefoot. On the right, there was less of a difference in the percentage of the stance phase in which the initial peak occurs (Figure 5). The toe-off peak was also reduced in magnitude for the shod and AFO conditions compared to barefoot on the right side.
4. Discussion
This study explored the biomechanical effects of a varus corrective strap integrated into an articulated AFO on lower-limb kinematics and kinetics during gait. Contrary to our hypothesis—that the strap would mimic the sagittal plane effects of medial wedging (e.g., increased ankle dorsiflexion and knee extension moments) [16,19]—the strap induced distinct adaptations, highlighting unique mechanisms of subtalar joint control. Below, we contextualize key findings, discuss clinical implications, and address limitations.
4.1. Ankle Kinetics and Kinematics
The AFO with varus strapping reduced peak vertical GRFs during toe-off, consistent with diminished ankle plantarflexion angles and moments. This contrasts with studies of lateral wedges, which increased ankle dorsiflexion [16,20] and suggests that direct mediolateral force application via strapping may alter sagittal plane mechanics differently than plantar-surface interventions. The unrestricted Tamarack joints likely permitted compensatory strategies, such as reduced push-off intensity, to mitigate instability—a phenomenon observed in patients adapting to new orthoses [29]. These findings underscore the need to evaluate AFO designs not only for joint restriction but also for unintended kinetic trade-offs.
4.2. Contralateral Joint Adaptations
Notably, the contralateral (right) limb exhibited increased variability in hip and knee moments during AFO use, a finding absent in studies of bilateral orthotic interventions [17,18]. This asymmetry may reflect compensatory mechanisms to stabilize the pelvis or accommodate altered propulsion from the braced limb. For instance, reduced ipsilateral hip extension moments at heel strike could diminish gluteal engagement, potentially predisposing users to secondary musculoskeletal imbalances (e.g., low back pain) [30]. Such unilateral effects are critical in pathologies like stroke or unilateral osteoarthritis, where contralateral compensations exacerbate injury risk [31]. Future work should prioritize bilateral analyses to capture full-body adaptations to unilateral orthoses.
4.3. Knee Joint Mechanics
While lateral wedging increases early-stance knee extension moments [19], the AFO condition produced no such change. Instead, knee extension moments plateaued at higher magnitudes from mid-stance to pre-swing, suggesting prolonged quadriceps activation. This pattern diverges from the typical flexion-extension moment transition in late stance [32] and may indicate co-contraction of knee flexors (e.g., hamstrings) to counteract instability induced by the AFO. Surface electromyography (EMG) is warranted to clarify muscular coordination strategies during AFO use.
4.4. Gait Speed and Stability
The inverse relationship between gait speed and double-limb support [32] was disrupted in the shod condition, which exhibited the fastest speed (1.407 m/s) yet the highest double-support time (21%). This anomaly may reflect footwear-induced gait adjustments (e.g., rigid soles altering propulsion). Conversely, the AFO condition’s slower speed and prolonged double support (20%) align with the literature on orthotic unfamiliarity in healthy users [33]. Longitudinal studies are needed to determine whether prolonged AFO use improves gait efficiency or perpetuates compensatory patterns.
4.5. Feasibility of Motion Capture for Customized AFO Assessment
Motion capture technology demonstrated robust feasibility for evaluating the biomechanical effects of AFOs, particularly in capturing multi-joint adaptations across the kinetic chain. By synchronizing kinematic and kinetic data, the system enabled precise quantification of sagittal plane alterations at the ankle, knee, and hip—critical for understanding how subtalar joint interventions propagate proximally. The integration of force plates provided actionable insights into ground reaction forces and joint moments, revealing compensatory mechanisms (e.g., contralateral variability) that simpler systems (e.g., pedobarography) might overlook. However, challenges such as marker placement consistency, especially during transitions between barefoot, shod, and AFO conditions—and artifacts from reflective footwear highlight the need for standardized protocols to improve reliability. Despite these limitations, motion capture’s ability to resolve temporal-spatial gait parameters, coupled with inverse dynamics modeling, underscores its value as a gold standard for orthotic research. Future advancements in markerless systems or hybrid approaches (e.g., combining inertial sensors) could further enhance the practicality of clinical AFO tuning while retaining analytical rigor [12,16,34].
4.6. Limitations
This pilot study has several limitations. First, the single-subject design limits generalizability, particularly to pathological populations who may respond differently to AFOs. Second, marker placement inconsistencies—especially between barefoot and shod conditions—may have introduced kinematic inaccuracies, as evidenced by implausible knee hyperextension values (-12.45°). While the OFM improves foot kinematics [23,24,25], shoe-mounted markers can underestimate calcaneal motion [34]. Despite heel cut-outs, reflective shoe artifacts compromised calcaneal tracking, necessitating trial exclusions. Future studies should use non-reflective footwear and assess inter-rater marker placement reliability [33].
5. Conclusions
The varus corrective strap induced sagittal plane biomechanical adaptations distinct from traditional wedging, underscoring the need to evaluate orthotic mechanisms holistically—beyond plantar-surface interventions. Motion capture technology proved feasible and invaluable for this purpose, enabling precise, multi-joint analysis of kinematic and kinetic adaptations across the kinetic chain. Its capacity to synchronize ground reaction forces with joint angles and moments revealed critical insights, such as contralateral joint variability and prolonged knee extensor demands, which would remain undetected with isolated gait measures. However, technical challenges, including marker placement inconsistencies and reflective footwear artifacts—highlight the need for standardized protocols to enhance reliability in heterogeneous cohorts. Future integration of markerless systems or hybrid sensor arrays could mitigate these limitations while retaining motion capture’s analytical rigor. These advancements, paired with EMG integration, will further solidify motion capture’s role as a gold standard for AFO assessment, bridging research and clinical practice to optimize orthotic designs for subtalar pathologies.
Author Contributions
The manuscript is developed based on a course the author was teaching.
Funding
This research received no external funding.
Institutional Review Board Statement
The study was conducted in accordance with the Declaration of Helsinki and approved by the Institutional Review Board (or Ethics Committee) of the University of Oklahoma Institutional Review Board (#7400).
Informed Consent Statement
Informed consent was obtained from the case participant involved in the study.
Data Availability Statement
The raw data supporting the conclusions of this article will be made available by the author upon request.
Acknowledgments
The author would like to acknowledge the students who served the case and helped during the motion capture data collection. The author would like to acknowledge the technician who helped with the motion capture data collection and analysis.
Conflicts of Interest
The authors declare no conflicts of interest.
Abbreviations
The following abbreviations are used in this manuscript:
| AFO | ankle-foot orthosis |
| CPO | certified prosthetics and orthotics technician |
| EMG | electromyography |
| GRFs | ground reaction forces |
| OFM | Oxford Foot Model |
References
- Krähenbühl N, Horn-Lang T, Hintermann B, Knupp M. The subtalar joint: a complex mechanism. EFORT Open Rev. 2017;2(7):309-16. [CrossRef]
- Jastifer JR, Gustafson PA. The subtalar joint: biomechanics and functional representations in the literature. Foot Edinb. 2014;24(4):203-9. [CrossRef]
- Neumann DA, Kelly ER, Kiefer CL, Martens KA, Grosz CM. Kinesiology of the musculoskeletal system. 2nd ed. St. Louis: Elsevier; 2010. p. 585-7.
- Munteanu SE, Barton CJ. Lower limb biomechanics during running in individuals with achilles tendinopathy: a systematic review. J Foot Ankle Res. 2011;4:15. [CrossRef]
- Carr JB 2nd, Yang S, Lather LA. Pediatric Pes Planus: A State-of-the-Art Review. Pediatrics. 2016;137(3):e20151230. [CrossRef]
- Levinger P, Menz HB, Fotoohabadi MR, Feller JA, Bartlett JR, Bergman NR. Foot posture in people with medial compartment knee osteoarthritis. J Foot Ankle Res. 2010;3:29. [CrossRef]
- Houck JR, Neville CG, Tome J, Flemister AS. Ankle and foot kinematics associated with stage II PTTD during stance. Foot Ankle Int. 2009;30(6):530-9. [CrossRef]
- Mündermann A, Nigg BM, Humble RN, Stefanyshyn DJ. Foot orthotics affect lower extremity kinematics and kinetics during running. Clin Biomech Bristol Avon. 2003;18(3):254-62. [CrossRef]
- Wilson F, Walshe M, O’Dwyer T, Bennett K, Mockler D, Bleakley C. Exercise, orthoses and splinting for treating Achilles tendinopathy: a systematic review with meta-analysis. Br J Sports Med. 2018;52(24):1564-74. [CrossRef]
- Parkes MJ, Maricar N, Lunt M, et al. Lateral wedge insoles as a conservative treatment for pain in patients with medial knee osteoarthritis: a meta-analysis. JAMA. 2013;310(7):722-30. [CrossRef]
- Neville C, Lemley FR. Effect of ankle-foot orthotic devices on foot kinematics in Stage II posterior tibial tendon dysfunction. Foot Ankle Int. 2012;33(5):406-14. [CrossRef]
- Karandikar N, Vargas OO. Kinetic chains: a review of the concept and its clinical applications. PM R. 2011;3(8):739-45. [CrossRef]
- Shimada S, Kobayashi S, Wada M, et al. Effects of disease severity on response to lateral wedged shoe insole for medial compartment knee osteoarthritis. Arch Phys Med Rehabil. 2006;87(11):1436-41. [CrossRef]
- MacLean C, Davis IM, Hamill J. Influence of a custom foot orthotic intervention on lower extremity dynamics in healthy runners. Clin Biomech Bristol Avon. 2006;21(6):623-30. [CrossRef]
- MacLean CL, Davis IS, Hamill J. Short- and long-term influences of a custom foot orthotic intervention on lower extremity dynamics. Clin J Sport Med. 2008;18(4):338-43. [CrossRef]
- Kuroyanagi Y, Nagura T, Matsumoto H, et al. The lateral wedged insole with subtalar strapping significantly reduces dynamic knee load in the medial compartment gait analysis on patients with medial knee osteoarthritis. Osteoarthritis Cartilage. 2007;15(8):932-6. [CrossRef]
- Toda Y, Segal N, Kato A, Yamamoto S, Irie M. Effect of a novel insole on the subtalar joint of patients with medial compartment osteoarthritis of the knee. J Rheumatol. 2001;28(12):2705-10.
- Russell EM, Hamill J. Lateral wedges decrease biomechanical risk factors for knee osteoarthritis in obese women. J Biomech. 2011;44(12):2286-91. [CrossRef]
- Mølgaard CM, Graven-Nielsen T, Simonsen O, Kersting UG. Potential interaction of experimental knee pain and laterally wedged insoles for knee off-loading during walking. Clin Biomech Bristol Avon. 2014;29(8):848-54. [CrossRef]
- Hajizadeh M, Desmyttere G, Carmona JP, Bleau J, Begon M. Can foot orthoses impose different gait features based on geometrical design in healthy subjects? A systematic review and meta-analysis. Foot Edinb. 2020;42:101646. [CrossRef]
- Stacoff A, Reinschmidt C, Stüssi E. The movement of the heel within a running shoe. Med Sci Sports Exerc. 1992;24(6):695-701.
- Visual3D Wiki. Temporal distance calculations for gait [Internet]. C-Motion Inc; 2021 [cited 2021 May 2]. Available from: https://c-motion.com/v3dwiki/index.php?title=Temporal_Distance_Calculations_for_Gait.
- Carson MC, Harrington ME, Thompson N, O’Connor JJ, Theologis TN. Kinematic analysis of a multi-segment foot model for research and clinical applications: a repeatability analysis. J Biomech. 2001;34(10):1299-307. [CrossRef]
- Wright CJ, Arnold BL, Coffey TG, Pidcoe PE. Repeatability of the modified Oxford foot model during gait in healthy adults. Gait Posture. 2011;33(1):108-12. [CrossRef]
- Oxford Foot Model [Internet]. NHS Foundation Trust; 2021 [cited 2021 May 6]. Available from: https://www.ouh.nhs.uk/gait-lab/research/oxford-foot-model.aspx.
- Levinger P, Murley GS, Barton CJ, Cotchett MP, McSweeney SR, Menz HB. A comparison of foot kinematics in people with normal- and flat-arched feet using the Oxford Foot Model. Gait Posture. 2010;32(4):519-23. [CrossRef]
- McCahill J, Stebbins J, Koning B, Harlaar J, Theologis T. Repeatability of the Oxford Foot Model in children with foot deformity. Gait Posture. 2018;61:86-9. [CrossRef]
- Stebbins J, Harrington M, Thompson N, Zavatsky A, Theologis T. Gait compensations caused by foot deformity in cerebral palsy. Gait Posture. 2010;32(2):226-30. [CrossRef]
- Tekscan. The gait cycle: phases, parameters to evaluate & technology [Internet]. 2021 [cited 2021 May 7]. Available from: https://www.tekscan.com/blog/medical/gait-cycle-phases-parameters-evaluate-technology.
- Moon D, Esquenazi A. Instrumented Gait Analysis: A Tool in the Treatment of Spastic Gait Dysfunction. JBJS Rev. 2016;4(6):e4. [CrossRef]
- Eng JJ, Winter DA. Kinetic analysis of the lower limbs during walking: what information can be gained from a three-dimensional model? J Biomech. 1995;28(6):753-8. [CrossRef]
- Murray MP, Mollinger LA, Gardner GM, Sepic SB. Kinematic and EMG patterns during slow, free, and fast walking. J Orthop Res. 1984;2(3):272-80. [CrossRef]
- Gorton GE 3rd, Hebert DA, Gannotti ME. Assessment of the kinematic variability among 12 motion analysis laboratories. Gait Posture. 2009;29(3):398-402. [CrossRef]
- Alcantara RS, Trudeau MB, Rohr ES. Calcaneus range of motion underestimated by markers on running shoe heel. Gait Posture. 2018;63:68-72. [CrossRef]
Figure 1.
Varus corrective strap.
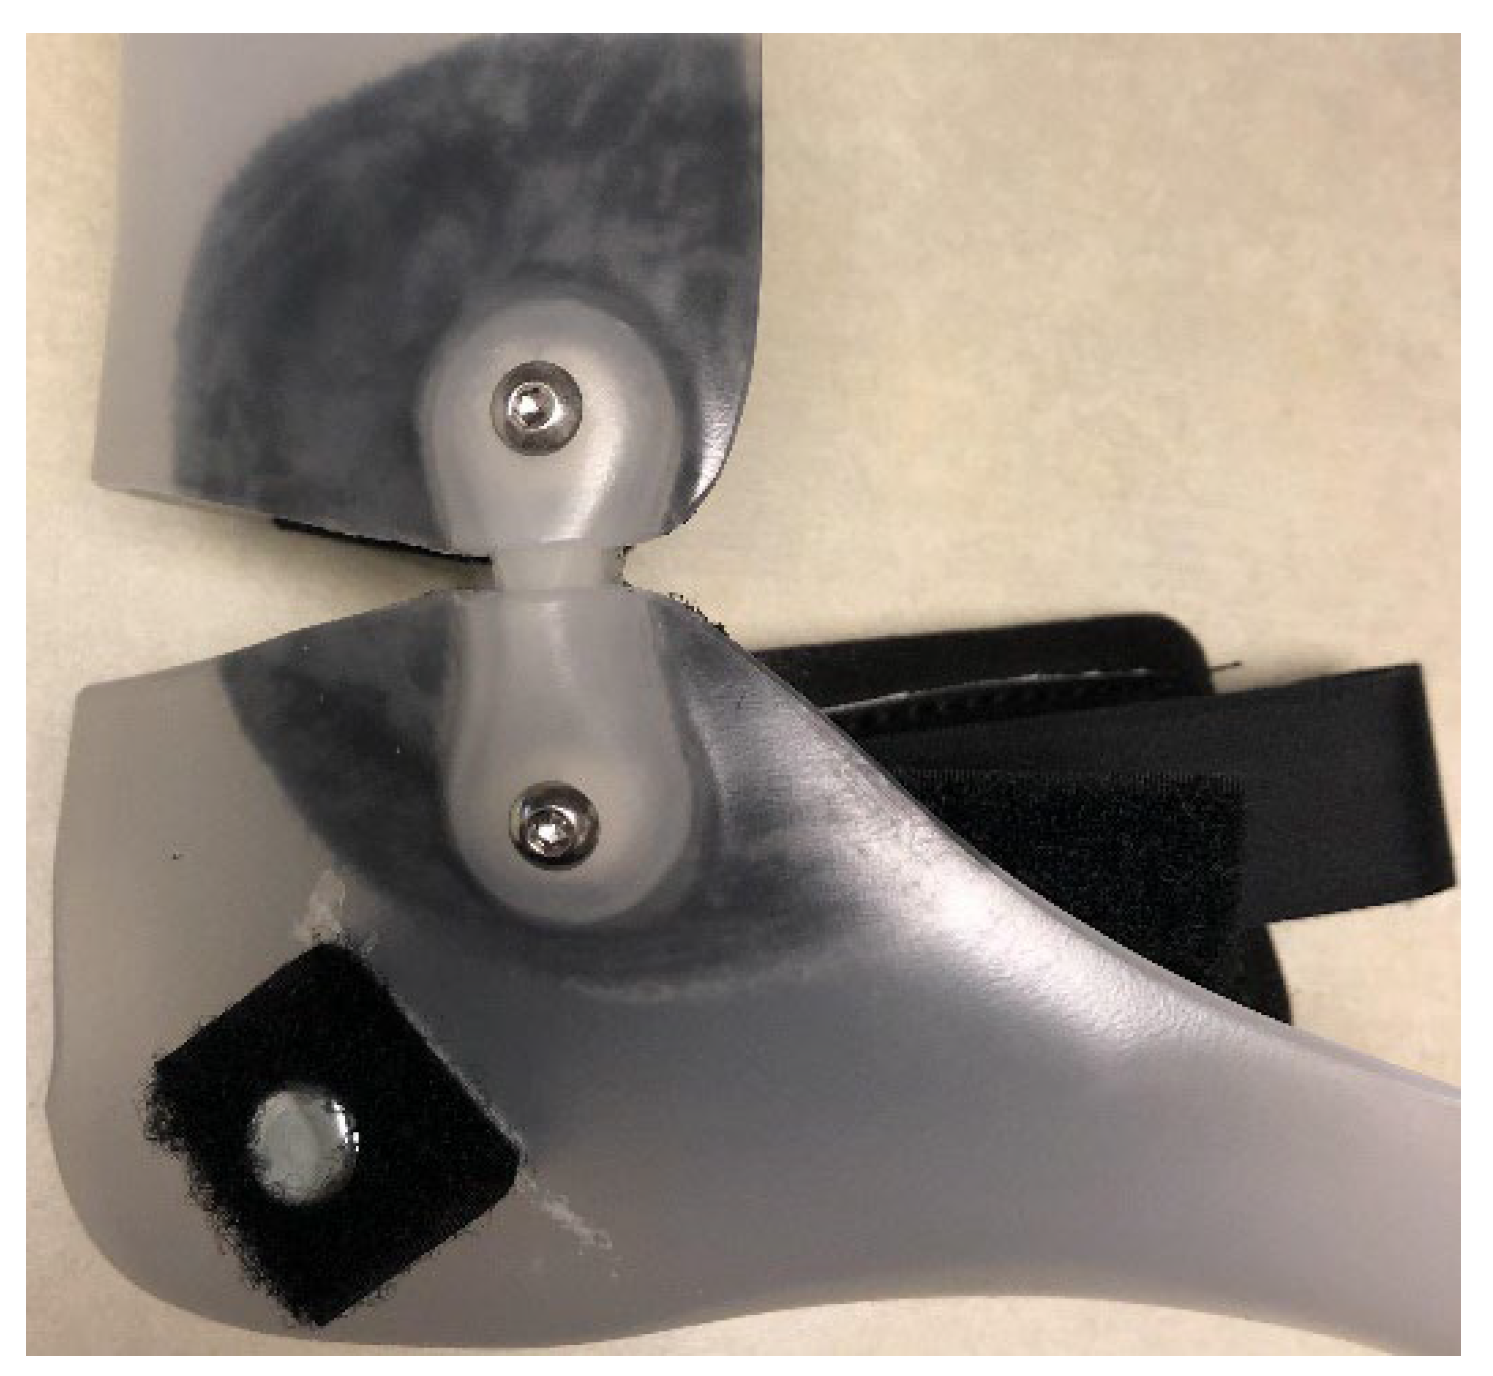
Figure 2.
Calcaneal cut-out 2.5cm at the widest point and 2.5cm tall.
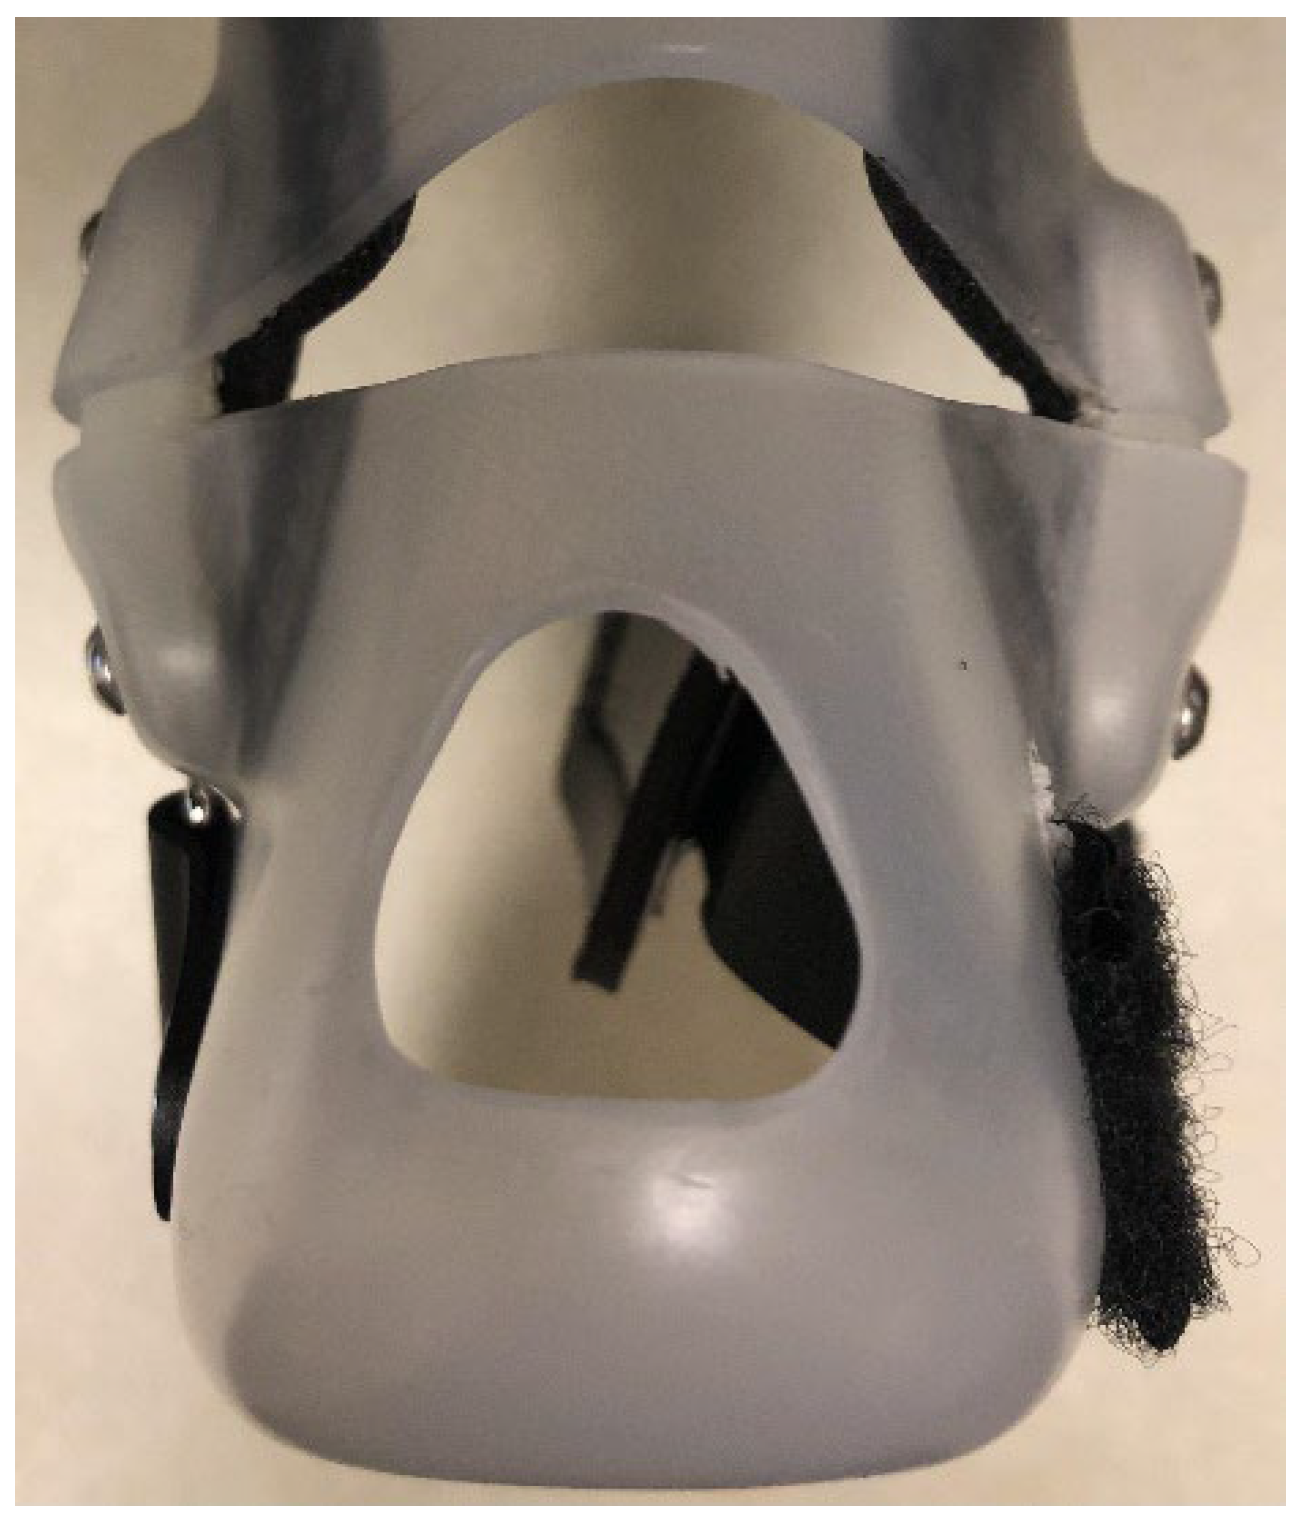
Figure 3.
Reflective marker placement for barefoot and shod with AFO conditions.
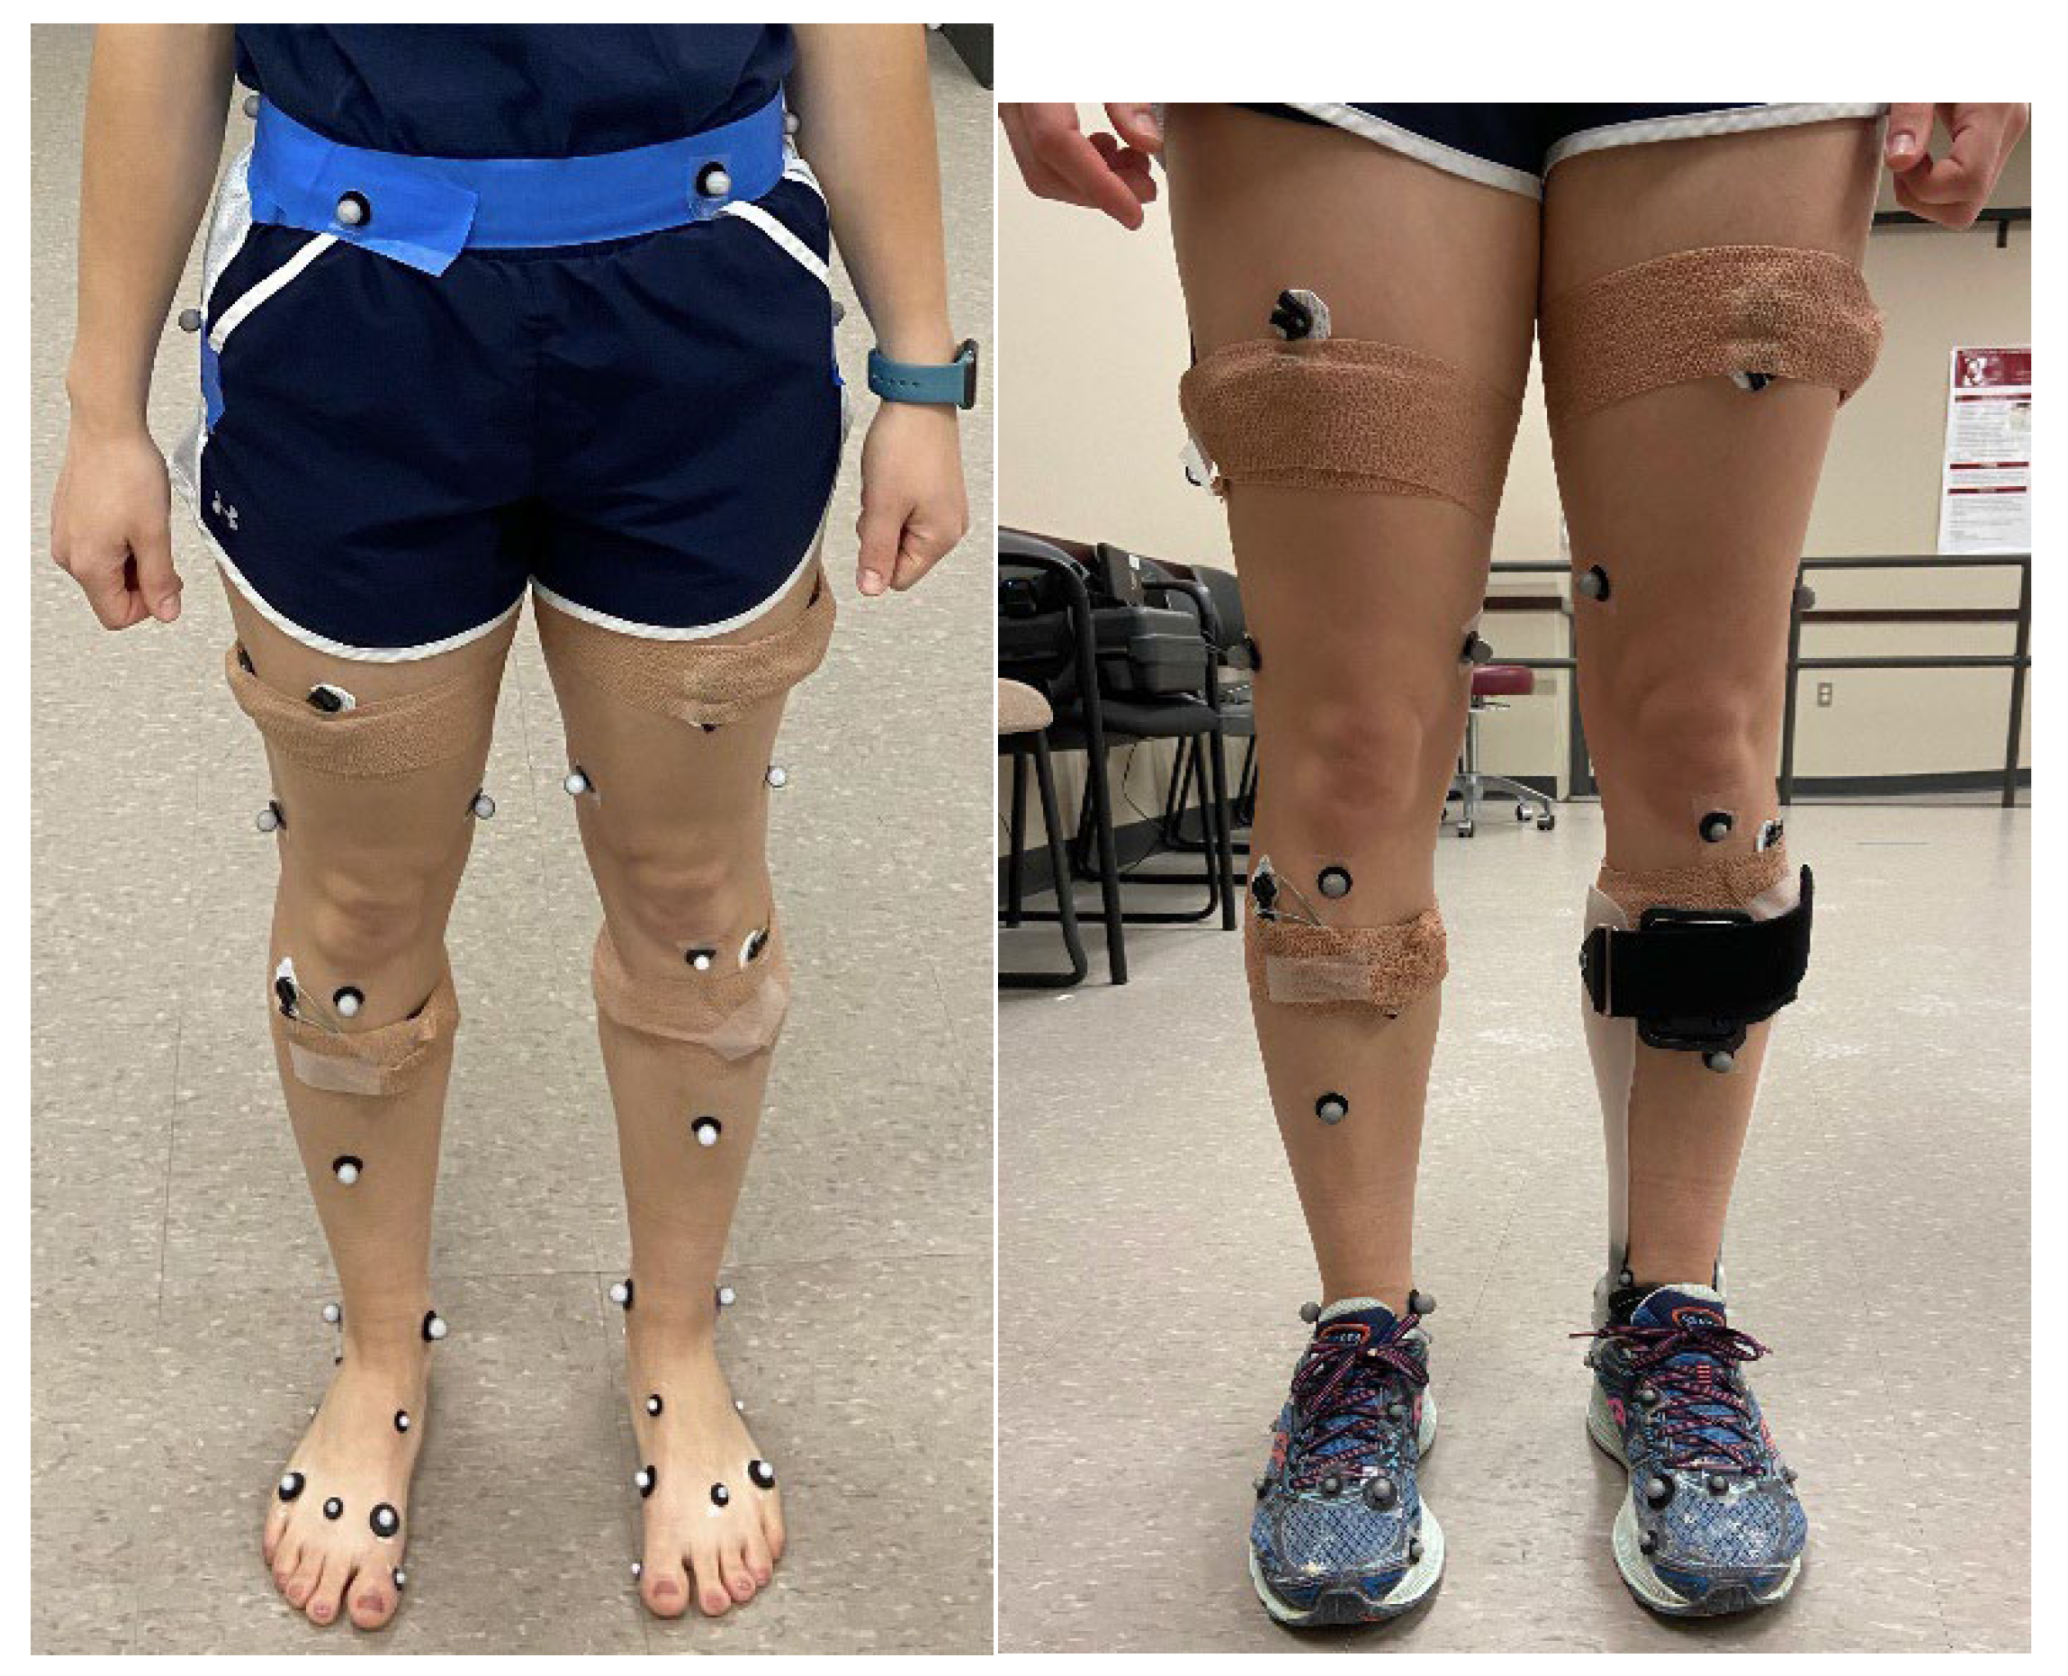
Figure 4.
Left and right ankle, knee, and hip angles throughout the gait cycle.
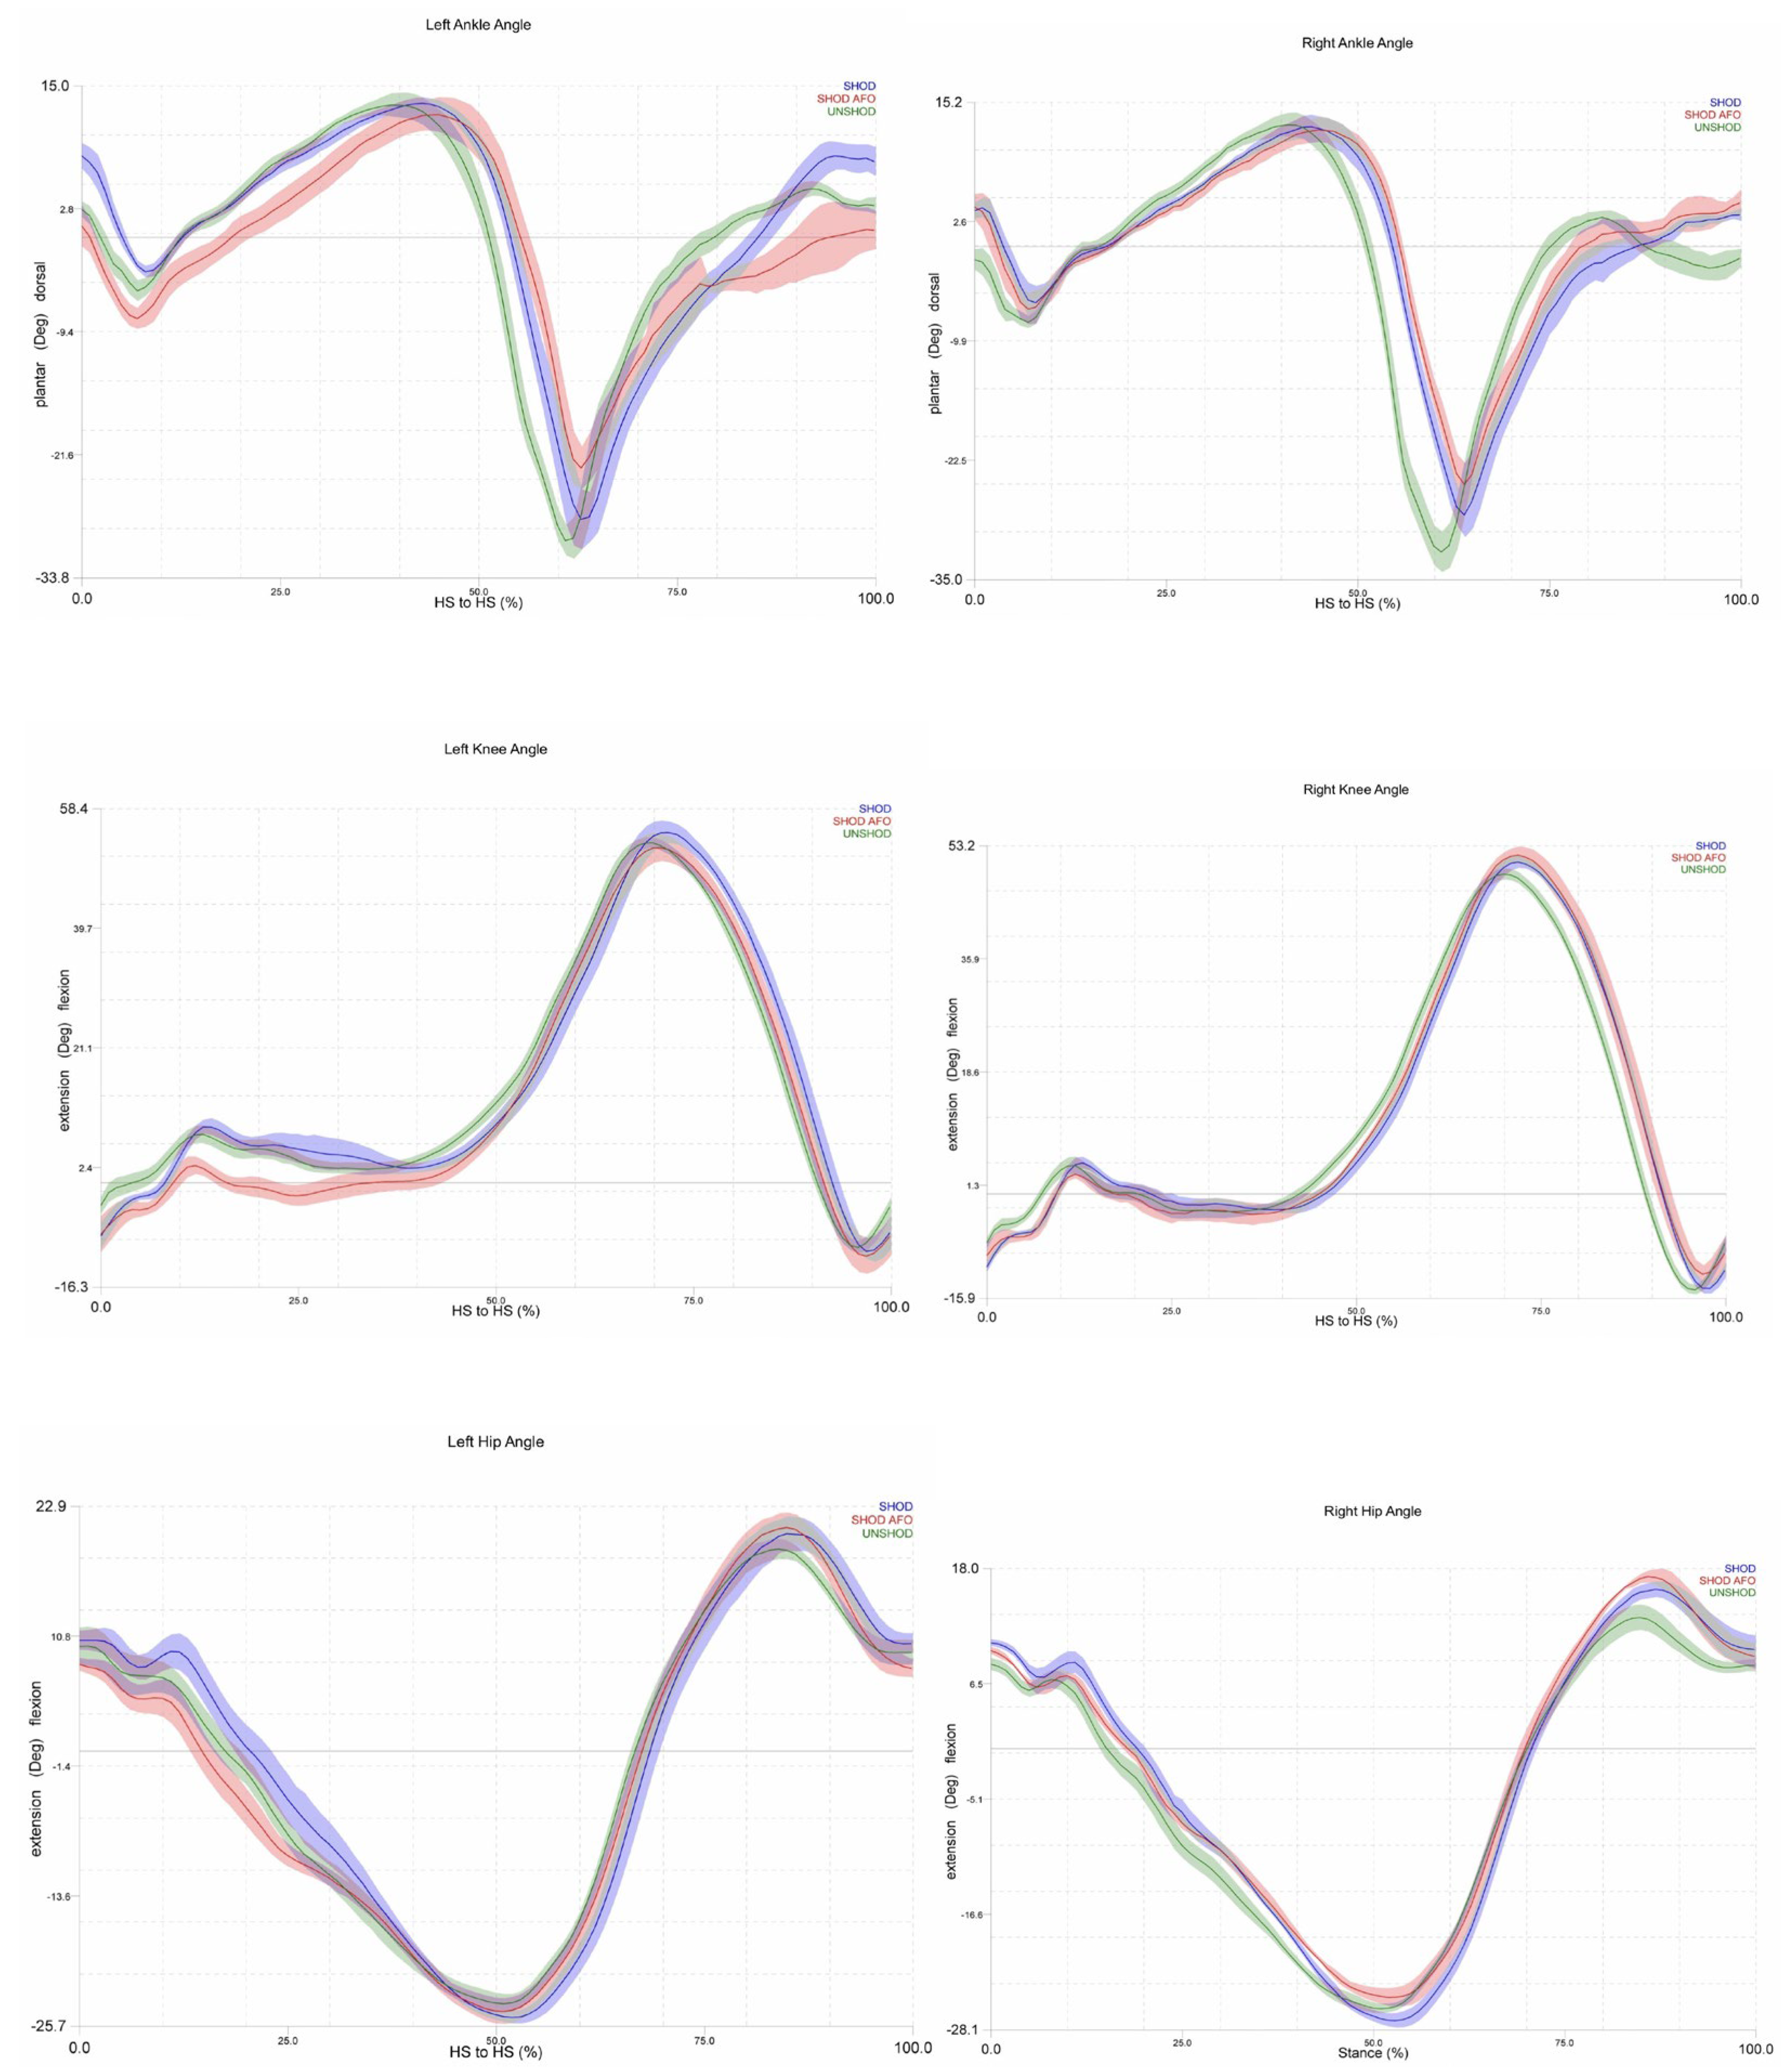
Figure 5.
Left and right vertical Ground Reaction Forces throughout the stance phase of gait.
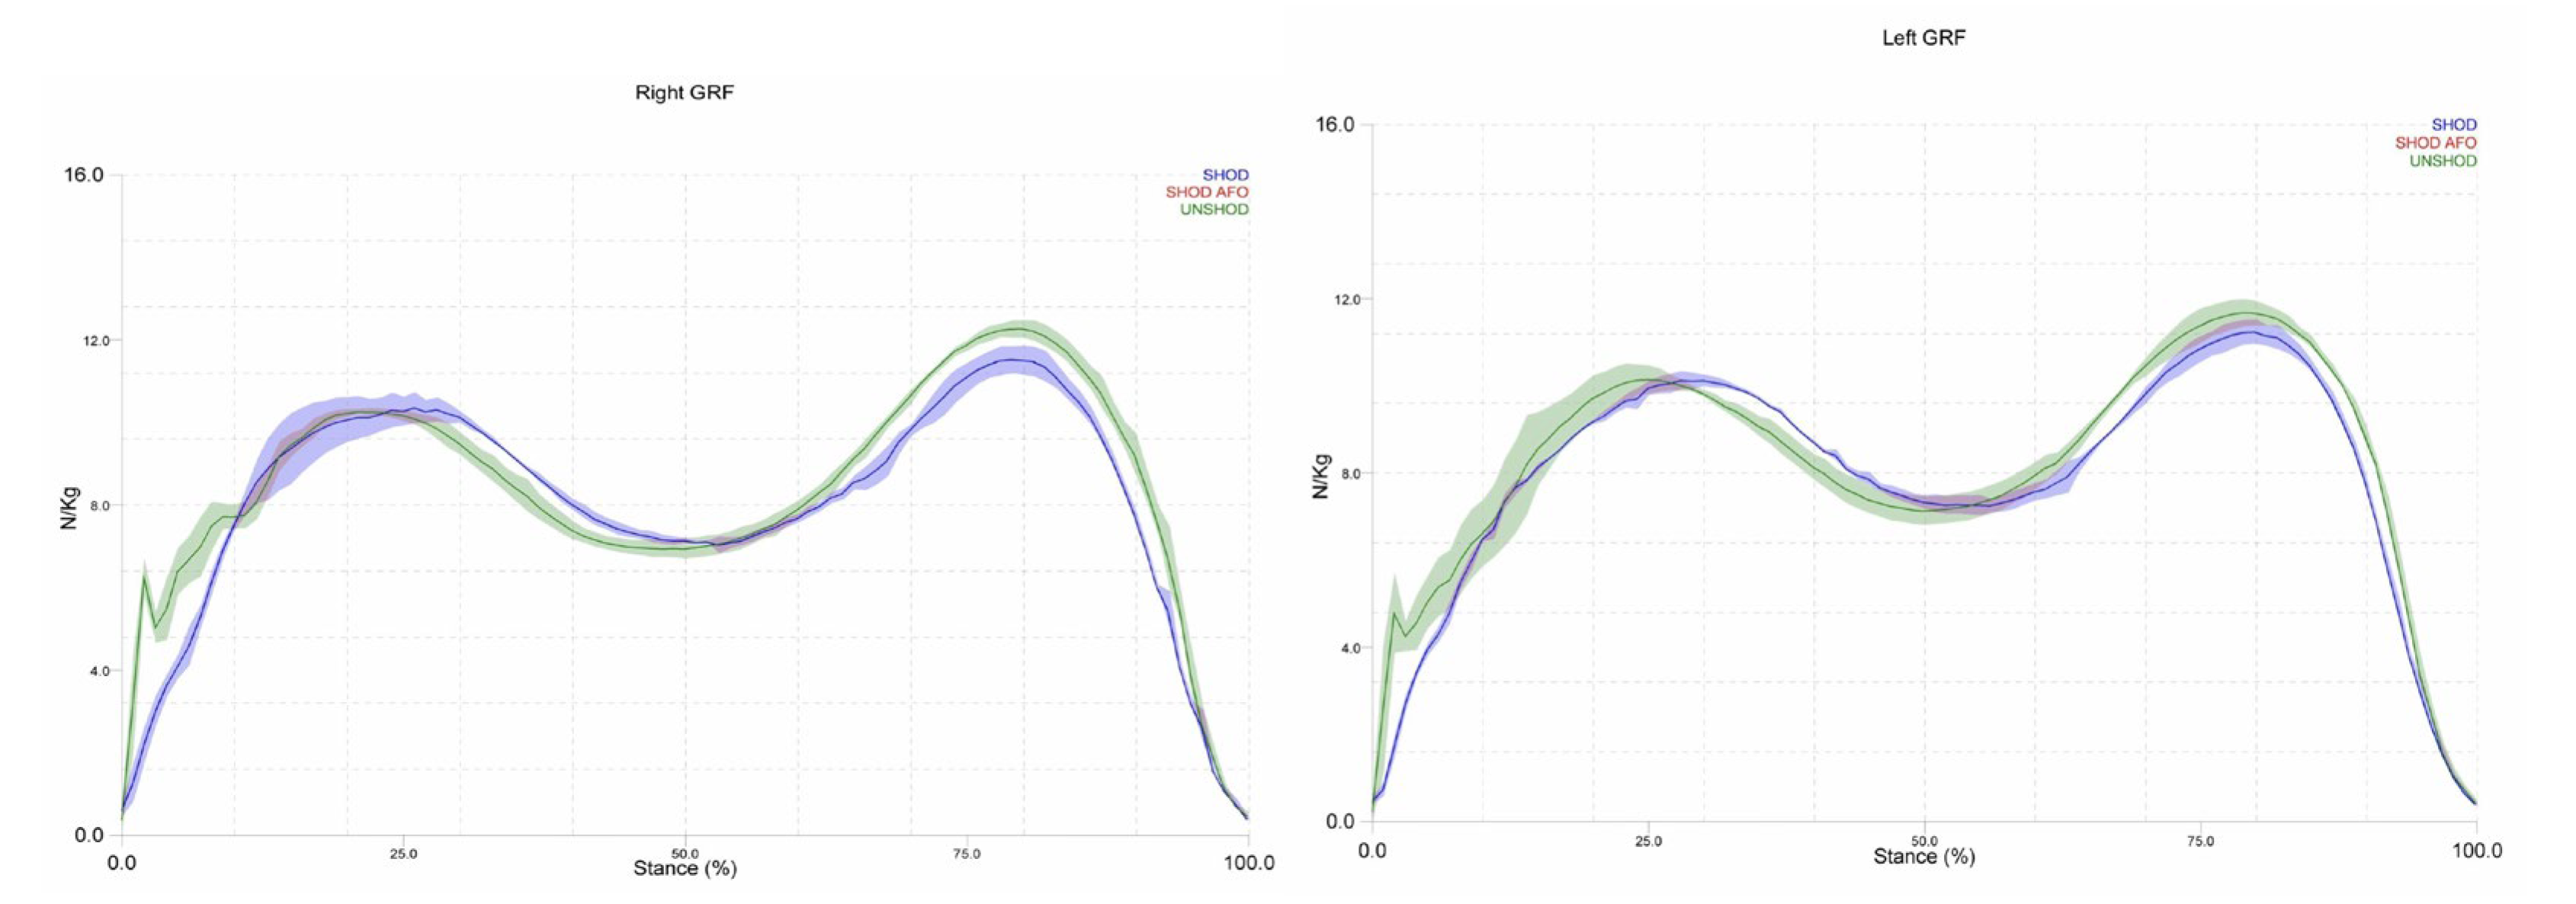

Table 1.
Gait parameters of the left and right sides in each testing condition.
| Condition | Side | Step length (m) | Step time (s) | Stance time (s) | Swing time (s) | Initial DBL Support (s) |
|---|---|---|---|---|---|---|
| Barefoot | Left | 0.645 ±0.020 | 0.470 ±0.010 | 0.539 ±0.012 | 0.401 ±0.008 | 0.069 ±0.008 |
| Right | 0.659 ±0.015 | 0.469 ±0.012 | 0.540 ±0.015 | 0.401 ±0.007 | 0.070 ±0.005 | |
| Shod | Left | 0.683 ±0.018 | 0.494 ±0.009 | 0.591 ±0.010 | 0.391 ±0.010 | 0.106 ±0.014 |
| Right | 0.705 ±0.017 | 0.490 ±0.011 | 0.602 ±0.010 | 0.384 ±0.006 | 0.103 ±0.006 | |
| Shod with AFO | Left | 0.644 ±0.047 | 0.502 ±0.050 | 0.619 ±0.016 | 0.406 ±0.011 | 0.095 ±0.016 |
| Right | 0.656 ±0.035 | 0.519 ±0.045 | 0.604 ±0.047 | 0.425 ±0.049 | 0.111 ±0.014 |
Table 2.
Spatiotemporal gait parameters for the three conditions.
| Condition | Speed (m/s) | Stride width (m) | Stride length (m) | Dbl Limb Support (s) |
|---|---|---|---|---|
| Barefoot | 1.383 | 0.119 ±0.011 | 1.302 ±0.031 | 0.139 ±0.013 |
| Shod | 1.407 | 0.142 ±0.016 | 1.387 ±0.027 | 0.210 ±0.020 |
| Shod with AFO | 1.258 | 0.147 ±0.013 | 1.287 ±0.067 | 0.206 ±0.030 |
Disclaimer/Publisher’s Note: The statements, opinions and data contained in all publications are solely those of the individual author(s) and contributor(s) and not of MDPI and/or the editor(s). MDPI and/or the editor(s) disclaim responsibility for any injury to people or property resulting from any ideas, methods, instructions or products referred to in the content. |
© 2025 by the authors. Licensee MDPI, Basel, Switzerland. This article is an open access article distributed under the terms and conditions of the Creative Commons Attribution (CC BY) license (http://creativecommons.org/licenses/by/4.0/).
Copyright: This open access article is published under a Creative Commons CC BY 4.0 license, which permit the free download, distribution, and reuse, provided that the author and preprint are cited in any reuse.


