
Submitted:
06 February 2025
Posted:
07 February 2025
You are already at the latest version
Abstract
Glioblastoma (GBM) is a particularly malignant brain tumour which carries a poor prognosis and presents limited treatment options. MRI is standard practice for differential diagnosis at initial presentation of GBM and can assist in both treatment planning and responses. MRI radiomics can generate mineable databases from radiological images providing sub-visual feature analysis capable to augment the morphological and functional tumour characteristics beyond traditional imaging techniques. Given that radiotherapy is part of the standard of care for GBM patients, establishing a platform for phenotyping radiation treatment responses using non-invasive methods is of high relevance. In this study, we modelled the responses to ionizing radiation across four orthotopic models of GBM using diffusion and perfusion radiomics. We have identified the optimal set of radiomic features that demonstrate significant correlations with tumour cellularity, microvascular organisation and blood flow alterations when directly compared with endpoint histopathological analysis. We showed that the selected radiomic features can quantify textural information and pixel interrelationships of tumour response to radiation therapy, revealing subtle image patterns that may reflect intra-tumoural spatial heterogeneity. When compared to GBM patients, similarities of selected radiomic features were noted between orthotopic tumours and non-enhancing central tumour areas of patients regarding tumour homogeneity, along with several differences in gray level nonuniformity and image complexity metrics. As the field evolves, radiomic profiling of GBM may enhance the evaluation of targeted therapeutic strategies, accelerate the development of new therapies and could be acting as a potential virtual biopsy tool.
Keywords:
glioblastoma
; radiomics
; histopathology
; MRI
1. Introduction
Glioblastoma (GBM) is a highly invasive brain tumour with poor prognosis and limited treatment options. Current standard of care consists of maximal safe resection of tumour followed by radiation and temozolomide chemotherapy [1,2]. Magnetic resonance imaging (MRI) provides excellent soft tissue contrast and can reveal details about water diffusivity, cellularity [3], blood flow [4], and tumour perfusion [5], making it standard practice for differential diagnosis at initial presentation of GBM, assisting in both treatment planning and response monitoring. Nonetheless, such evaluations can prove to be challenging. Quantitative MRI (qMRI), through the use of radiomics [6], can provide a better tool for characterising tissue properties at the microscale, capturing novel and valuable information about structural and vascular characteristics of tumour behaviour before and after treatments.
Several studies explored the use of MRI radiomics in GBM, focusing on various aspects of diagnosis, prognosis, and treatment monitoring. For instance, an integrative radiomic model was reported showing differentiation of GBM from metastases by utilising a combination of contrast enhanced T1- and T2-weighted images, along with diffusion weighted and apparent diffusion coefficient (ADC) mapping [7]. Improved prognostic capabilities of newly diagnosed GBM patients were outlined through the use of conventional diffusion-, and perfusion-weighted MR radiomics, demonstrating improved performance over clinical predictors alone [8]. In addition, several studies have shown promise in differentiating low-grade gliomas from high-grade ones using textural radiomic analysis[9,10], while others showed potential in predicting treatment outcomes and assessing pseudoprogression in high-grade gliomas [11,12].
Applying MRI radiomic analysis to experimental models of GBM, provides an opportunity to explore underlying mechanisms of disease and treatment, with a higher level of rigour and detail as compared to human GBM. In this study, we sought to establish a radiomic framework for modelling the responses to ionizing radiation (IR) across four orthotopic models of GBM (three syngeneic, GL261 [13], CT-2A [14], NPE-IE [15] and one patient-derived xenograft, GBM96 [16]), by incorporating qMRI protocols based on diffusion (ADC) and perfusion (CBF) mapping. By employing these quantitative MRI techniques, more reproducible analysis can be achieved, which may result in more consistent outcomes across different scanners and institutions [17,18]. Given that qMRI methods are expected to remain stable across different magnetic field strengths and are less affected by technical factors such as b-value selection, improved consistency can also be attained when translating preclinical qMRI-derived radiomic studies to patient settings.
We evaluated the feasibility of using ADC and CBF radiomics to improve classification of radiation treatment groups in the presented GBM models. We determined the optimal set of radiomic features that correlate with endpoint histopathology to identify potential imaging markers of tumour cellularity and vessel integrity. We showed that the selected radiomic features can quantify textural information and pixel interrelationships of tumour response to radiation therapy, revealing subtle image patterns that may reflect intra-tumoral spatial heterogeneity. Furthermore, we have identified a set of wavelet-transformed features as most relevant to indicate superior correlations with tumour cellularity and vessel organisation compared to ADC and CBF alone. When examining a set of twenty adult GBM patients, including individuals with and without O6-methylguanine-DNA methyltransferase (MGMT) methylation [19], similarities were noted between orthotopic tumours and non-enhancing central tumour areas of patients regarding tumour homogeneity (evaluated by texture analysis of ADC datasets), alongside discrepancies in gray level nonuniformity and image complexity metrics.
The results presented here create a unique MRI radiomics platform for phenotyping IR treatment responses in rodent models of GBM. This is valuable for gaining detailed insights into the efficacy of therapeutic strategies and for evaluating the suitability of different orthotopic models of GBM as representative preclinical models of human GBM.
2. Materials and Methods
All animal experiments were conducted in accordance with the UK Home Office Animals (Scientific Procedures) Act 1986 and conform to the guidelines from Directive 2010/63/EU of the European Parliament on the protection of animals used for scientific purposes or the NIH Guide for the Care and Use of Laboratory Animals. All animal procedures were reviewed and approved by the Imperial College Animal Welfare and Ethical Review Body.
2.1. Establishment of Orthotopic Glioma Tumours
Orthotopic models of glioma, including one patient-derived xenograft model, were established as follows. Eight to ten-week-old, female C57BL/6J mice, purchased from Charles River, were anaesthetised using isoflurane (1-5%), and given pre-operative analgesia of buprenorphine (0.1 mg/kg) and carprofen (5 mg/kg). The scalp was prepared for surgery by shaving and then the application of depilatory cream, followed by sterilisation with iodine. Mice were then moved to a stereotaxic frame, and a single incision was made along the midline of the scalp to expose the skull. A 10 µL Hamilton syringe with a glass needle was aligned to the following coordinates relative to the bregma: anteroposterior +1 mm, mediolateral +2 mm. A borehole was then drilled to expose the meninges, and the needle was loaded with either GL261, CT-2A, NPE-IE or primary GBM cells. The needle was lowered through the borehole to a depth of −3 mm relative to the bregma to reach the right striatum, and 2 µL of PBS containing 5 x 10⁴ cells were delivered using a micropump injector over 2 minutes. The needle was then retracted, the skin was sutured, and the mice were given water containing carprofen (33 ug/mL) for post-operative pain management. Tumours were allowed to establish for at least 3 days post-surgery prior to imaging and treatment.
2.2. Radiation Treatment
Tumour-bearing mice were subjected to radiotherapy as follows. Mice were anaesthetised using a combination of ketamine (50 mg/kg) and medetomidine (0.5 mg/kg). Once anaesthesia had set in, mice were placed on to plastic supports on their backs, then on to lead shielding placed within a radiation chamber, leaving their heads exposed. The entire mouse head was then exposed to 4-8 Gy gamma irradiation from a caesium-137 source. Anaesthesia was then reversed using atipamezole (2.5 mg/kg), and the mice were allowed to recover in a warming chamber.
2.3. MRI Experiment
For the MRI experiment, anaesthesia was initiated with 3% isoflurane mixed with oxygen in an induction chamber and maintained during the MRI procedure with 2% isoflurane delivered via a nose cone. Mice were placed on a dedicated mouse bed in prone position. Mouse body temperature was maintained at ~ 36.5°C using a warm water circulating heat mat. The respiration and body temperature were constantly monitored during the MRI scans (SA Instruments, Stony Brook, NY). In vivo MRI was performed at 1 day and 7-days post IR treatment. In parallel, the saline-treated (also referred to as untreated control) group was imaged at the same timepoints, for comparison.
MRI was performed on a 9.4T BioSpec scanner (Bruker BioSpin GmbH, Germany) equipped with a rat brain array receiver. Data was acquired with Paravision 7.0. All MRI protocols were set to cover the full tumour volume. A T1-weighted MRI protocol was performed for the morphological assessment of tumour volumes. Parameters included: TE =14.7 ms, TR = 1550 ms, 30 slices, in-plane resolution (145×145) µm2, slice thickness 400 µm, scan time 2 min 30 s. For the ADC measurement, a respiration-triggered echo-planar diffusion trace protocol was acquired with the following parameters: TE = 21 ms, TR = 5000 ms, two segments, 6 directions, b-value = 1000 s/mm2, gradient duration 3.5 ms, gradient separation 10.5 ms, in-plane spatial resolution (156×156) µm2, slice thickness 400 µm, scan time = 8 min. Perfusion images were acquired using an ASL-EPI protocol with: TE = 9 ms, TR = 4000 ms, 2 segments, in-plane spatial resolution (175×175) um2, slice thickness 1 mm, 45 dynamics, scan time 12 min; cerebral blood flow (CBF) maps were subsequently generated according to relevant literature [20,21]. For distortion correction, the echo-planar data were collected with reversed phase-encoding blips, resulting in pairs of images with distortions going in opposite directions. From these pairs, the susceptibility-induced off-resonance field was estimated [22] using FSL [23] and the two images were combined into a single corrected one. Manual tumour segmentation was performed using ITK-SNAP [24] software. Tumour radiomic features were extracted from the ADC and CBF maps using pyradiomics [25]. The features included shape, first- and second-order radiomics. Shape features indicate morphological characteristics of segmented tumours. First order features include measurements of voxel values and distribution of intensities, whereas second order features, also known as texture features, provide information about the relationships between neighbouring voxels within tumours. Second-order features include gray level co-occurrence matrix (GLCM), gray level size zone matrix (GLSZM), gray level run length matrix (GLRLM), neighbourhood gray-tone difference matrix (NGTDM), and gray level dependence matrix (GLDM) features. Wavelet and Laplacian of gaussian (LoG) filtered features were also extracted.
2.4. Histopathology
At the end of the MRI experiment, mice were euthanised using 20 mg pentobarbitone sodium and perfused through the heart with PBS followed by 4% paraformaldehyde (PFA) in PBS. Brains were removed, stored at 4℃ in 4% PFA, and subjected to FFPE (formalin-fixed paraffin-embedded) processing. Sections of 5 μm thickness were prepared using the HistoCore Multicut microtome (Leica Biosystems, USA) and mounted on Superfrost Plus Adhesion Microscope slides (J1800AMNZ, Epredia). For H&E staining, the sections were dewaxed, gradually rehydrated, stained with haematoxylin M (HEMM-OT, Biognost, Croatia) and eosin Y (152881000, Thermo Scientific, USA), and then dehydrated.
For immunostaining, the sections were dewaxed, rehydrated, and blocked with 1% H2O2 (23622.298, VWR, United States) for 30 mins. The antigen retrieval was performed by boiling the sections for 20 mins in Tris-EDTA (pH 9) containing 0.1% Tween 20 (437082q, VWR, USA). Following several PBS washes, the slices were blocked for 20 mins at room temperature with 2.5% normal horse serum (MP-7401, Vector laboratories, USA) and then incubated overnight with the anti-CD31 (1:400) primary antibody (77699, Cell Signaling Technology, United States) at 4℃. The following day, the sections were washed and incubated for 1 hr with the ImmPRESS (Peroxidase) Polymer Anti-Rabbit IgG Reagent (MP-7401, Vector laboratories, USA). The ImmPACT® DAB Substrate Kit (SK-4105, Vector Laboratories, USA) was used for the staining. The nuclei were counterstained with haematoxylin and the sections were dehydrated. Slides were then fixed under coverslips using the DPX mountant (06522, Sigma-Aldrich, USA). Images were acquired using the Aperio AT2 slide scanner and processed with QuPath [26].
The cell detection algorithm implemented in QuPath was applied to detect and count the nuclei from the H&E stains. The counts were subsequently normalised to the selected regions of interest (ROI) chosen within the tumour. For vessel quantification, capillaries were segmented in QuPath using a threshold-based pixel classifier. Vessel area was assessed by calculating the mean surface of detected vessels that covered the tumours. Vessel density was measured by dividing the number of detected vessels to the tumour area.
2.5. Patient Data
The University of California San Francisco Preoperative Diffuse Glioma MRI (UCSF-PDGM) dataset [27] was used in this study. Data collection was performed in accordance with relevant guidelines and regulations and was approved by the University of California San Francisco institutional review board with a waiver for consent. The dataset population consisted of 20 adult patients (8 females, 12 males) with histopathologically confirmed grade IV diffuse gliomas who underwent preoperative MRI, initial tumour resection, and tumour genetic testing at a single medical centre between 2015 and 2021 [27]. Patients with any prior history of brain tumour treatment were excluded; however, history of tumour biopsy was not considered an exclusion criterion. Tumours were tested for MGMT methylation status using a methylation-sensitive quantitative PCR assay. All preoperative MRI was performed on a 3.0 tesla scanner (Discovery 750, GE Healthcare, Waukesha, Wisconsin, USA) and a dedicated 8-channel head coil (Invivo, Gainesville, Florida, USA). The imaging protocol included pre- and post-contrast T1-weighted images, arterial spin labelling (ASL) perfusion images, and 2D diffusion ADC images. Tumour segmentation included two major tumour compartments: enhancing tumour and non-enhancing/necrotic tumour.
2.6. Statistical Analyses
Statistical analysis was performed using GraphPad Prism 7 (GraphPad Software, San Diego, California). All results are presented as means with the corresponding standard deviations (±SD). One-way analysis of variance (ANOVA) was employed for multi-group analysis with Dunnett test for multiple comparison testing. Histological analyses were performed using Student t-test. A p-value of <0.05 was taken to represent statistical significance.
2.7. Radiomic Feature Selection and Statistical Evaluation
A supervised statistical-based approach was implemented for feature selection (FS) [28]. Specifically, the maximum relevance, minimum redundance (mRMR) [29] algorithm was applied to identify the most optimal radiomic subset having the highest correlation with the GL261, CT-2A, NPE-IE, and GBM96 groups (relevance) and the least correlation between themselves (redundancy). The F-statistic calculated the correlation with the class while Pearson correlation coefficient, the correlation between features. The least absolute shrinkage and selection (LASSO) [30] regularisation algorithm was further applied to remove redundant features thereby enhancing the accuracy and interpretability of FS. All FS techniques were implemented using Python scikit-learn ML package (version 3.6) [31]. A support vector machine (SVM) was implemented for classification of GBM models, using the selected radiomic features. The performance of FS and SVM was evaluated and validated by means of confusion matrix analysis, stratified four-fold cross-validation (train/test of 75/25 split ratio) and accuracy measurement (scikit-learn, python 3.6).
3. Results
3.1. High Diffusion Coefficients and Low Perfusion Were Found in GL261, CT-2A, and GBM96 but Not in NPE-IE Tumours
Tumour morphology, microstructure and perfusion were assessed in the four orthotopic GBM models (Figure 1a) through measurements of tumour volume, ADC, and CBF (Figure 1b). CT-2A showed the highest level of tumour volume growth. Most animal models demonstrated significantly higher ADC values when compared to healthy, with GL261 displaying the highest ADC among them. Interestingly, maintained ADC and superior perfusion values were noticed in the NPE-IE model. GBM96 tumours showed slightly lower CBF in comparison, whereas CT-2A and GL261 had the lowest perfusion overall.
3.2. Diffusion and Perfusion Radiomic Profiling Demonstrates Notable Differences Among Orthotopic Glioma Tumours
The most relevant radiomic features selected using the mRMR algorithm and LASSO regularization were extracted from CBF and ADC maps to effectively characterize each animal model, with the aim of gaining a more detailed understanding of tumour characteristics through radiomic profiling. The dendrogram and heat map generated from the hierarchical clustering of selected radiomics indicated that NPE-IE and CT-2A display unique traits associated with specific CBF- and ADC-derived radiomics (Figure 1c), forming two distinct clusters, when compared with the other GBM models. There were resemblances observed among GBM96, NPE-IE, and certain GL261 tumours in terms of wavelet transformed GLDM_LargeDependenceEmphasis, GLDM_DependenceVariance, and GLRLM_RunVariance CBF radiomics. GBM96 revealed similitudes to NPE-IE regarding the mean and range values of CBF. GBM96 showed noticeable differences from the other GBM models in relation to ADC wavelet transformed features of LHL_GLCM_SumAverage, LHL_GLCM_Autocorrelation, and LHL_GLDM_HighGrayLevel_Emphasis. Furthermore, the four GBM models were distinctly different according to the first-order values of average, median, and 90th percentile ADC.
3.3. IR Therapy Leads to Increased ADC and Improved CBF in GL261 and CT-2A Tumours
Figure 2 illustrates representative examples of T1-weighted, CBF, and ADC maps collected at 1-day and 7-days following saline and IR treatment for the GL261 (Figure 2a), CT-2A (Figure 2b), and NPE-IE models (Figure 2c), respectively. The change in tumour ADC and CBF was very distinguishable, particularly at 7-days timepoint.
MRI indicated reduced tumour growth in the IR group compared to saline treated controls across all animal models. Diffusion-MRI showed increased ADC values at 7-days post-IR, particularly in the GL261 and CT-2A models (Figure 3a). The saline treated group initially presented restricted diffusion followed by moderate increase mid-stage. Tumour CBF significantly increased 1-day post-IR in GL261 and CT-2A, as opposed to controls which showed drastic CBF reduction (Figure 3b). GBM96 model showed similar trends, with lower intensity of change. Given that GBM96 tumours develop at a slower rate than the other, more aggressive, syngeneic models, it was expected that the impact of irradiation would be more pronounced on rapidly growing GL261, CT-2A and NPE-IE tumours.
Although tumour CBF presented slight decline 1-week post-IR, perfusion remained substantially higher in the NPE-IE model compared to GL261, CT-2A and GBM96.
3.4. Radiomic Descriptors of MRI Heterogeneity Show Specific Changes 1-Day and 7-Days Post IR
We further examined the capability of ADC and CBF radiomics to generate distinct signatures that could serve as indicators of treatment response following irradiation. Using the mRMR FS algorithm, radiomic features were selected based on their relevance to the target variable. LASSO regularisation further identified the most optimal subset of features for further classifying the GBM groups according to their treatment response. A total of twenty metrics (features), predominantly from wavelet transformed images, were obtained. The dendrogram and heat map resulting from the hierarchical clustering of selected features revealed treatment responses distinctively associated with each of the four GBM models. The accuracy of the here proposed classification was evaluated, at 1-day and 7-days post-IR timepoints, using a confusion matrix build for GL261, CT-2A, NPE-IE and GBM96 groups.
One-day post-IR: In general, the data demonstrated distinct separation between the classes (Figure 3c). Specifically, GL261, CT-2A, and NPE-IE groups were 100% correctly predicted (accuracy 100%) whilst few misclassified cases were found in the GBM96 group (accuracy 89%). Inspecting the dendrogram in Figure 3d, we noted some similarities between GBM96 - GL261 and GBM96 - CT-2A one day post-IR. Specifically, the GBM96 and CT-2A models exhibited comparable changes in mean, median and root mean squared of ADC values. Certain GBM96 tumours showed similarities to GL261, while others to CT-2A in terms of ADC wavelet-transformed GLRLM_GrayLevelNonUniformity (GLNU) radiomics, indicating comparable image heterogeneity (variability in size and gray intensity levels) of GMB96 akin to either CT-2A or GL261. NPE-IE provided a distinct profile response mainly determined by the CBF derived radiomic features. This difference may be attributed to the elevated blood perfusion observed in this model prior to - and following irradiation (Figure 3b).
One-week post-IR: the data showed good separation between the four classes as illustrated in Figure 3e. CT-2A, NPE-IE and GBM96 groups were 100% correctly predicted (accuracy 100%) whilst one misclassified case was obtained in the GL261 group (accuracy 94%). The dendrogram in Figure 3f shows that the CT-2A model displayed distinct responses compared to the other GBM models, as indicated by alterations in several ADC and CBF wavelet-transformed radiomics which may reflect increased tumour heterogeneity (GLRLM_GrayLevelNonUniformity - GLNU), larger tumour volume growth (firstorder_TotalEnergy), and greater variability in the size of homogeneous intra-tumoral zones (GLSZM_ZoneVariance, GLSZM_RunVariance) post IR. NPE-IE and GBM96 exhibited a degree of similarity in the following radiomics: GLRLM_differenceEntropy, GLRLM_RunPercentage, and GLRLM_ShortRunEmphasis, indicating comparable image homogeneity after irradiation.
3.5. High Tumour Cellularity Is Present in All Orthotopic Tumours Along with Dilated Vessels in GL261 and CT-2A Tumours
Magnified histology micrographs in Figure 4a show an example of H&E and CD31 staining highlighting differences in radiation treatment response between the saline treated and IR-treated group.
Histopathological analysis of H&E stains revealed increased nuclear counts across all untreated controls, confirming the increased cellularity of these tumours (Figure 4b). CD31 analysis showed chaotic blood vessel network distribution in saline treated control groups, particularly in the GL261 and CT-2A mice, which exhibited enlarged vessel diameters. Following IR treatment, decreased vessel dilation was observed in the CT-2A mice, as well as reduced nuclei counts across all animal models. No notable change in vessel diameter was observed post IR in the GL261, NPE, and GBM96 mice (Figure 4b).
3.6. Radiomics Yielded Higher Correlations with Histopathology than ADC and CBF Alone
We examined the features that most effectively characterised the 1-week post saline- and post IR treatment across all models to identify those that correlate strongly with histopathologic parameters related to cellular density, vessel dilation and density, CBF mean, and ADC mean. The correlation matrix displayed in Figure 4c illustrates the interdependencies among these wavelet-transformed MRI radiomic features. Seven features showed strong correlations with coefficients ranging from 0. 6 to 0. 73. The strength of correlations is illustrated in the correlation network of Figure 4d, where thicker lines represent stronger correlations. The wavelet_GLCM_Imc2, LLH_GLDM_GLNU, firtsorder_Kurtosis, and LLH_ GLSZM_ZoneVariance exhibited significant correlation with nuclei counts, whereas HLH_GLSZM_ZoneVariance was found to be correlated with vessel area. Furthermore, LLH_ GLDM_GLNU, LLH_NGTDM_Busyness, and LLH_GLSZM_ZoneVariance were associated with mean CBF, while wavelet_glcm_Imc2 correlated with mean ADC. These findings suggest that the identified features create a radiomic profile that is closely linked to the response to IR treatment of these tumour models in terms of tumour cellularity and vessel dilation. Moreover, features such as wavelet_GLCM_Imc2, LLH_ GLDM_GLNU, LLH_NGTDM_Busyness, and firstorder_Kurtosis displayed a more pronounced difference between treated and nontreated mice compared to ADC and CBF alone (Figure 5), while the others exhibited comparable results to both ADC and CBF metrics. Differentiating these characteristics using radiomics is of high value in preclinical research for assessing treatment responses over time, potentially eliminating (or reducing) the necessity for histopathology.
3.7. Mouse Orthotopic Tumours Share Similarities with Central Non-Enhancing Patient GBMs
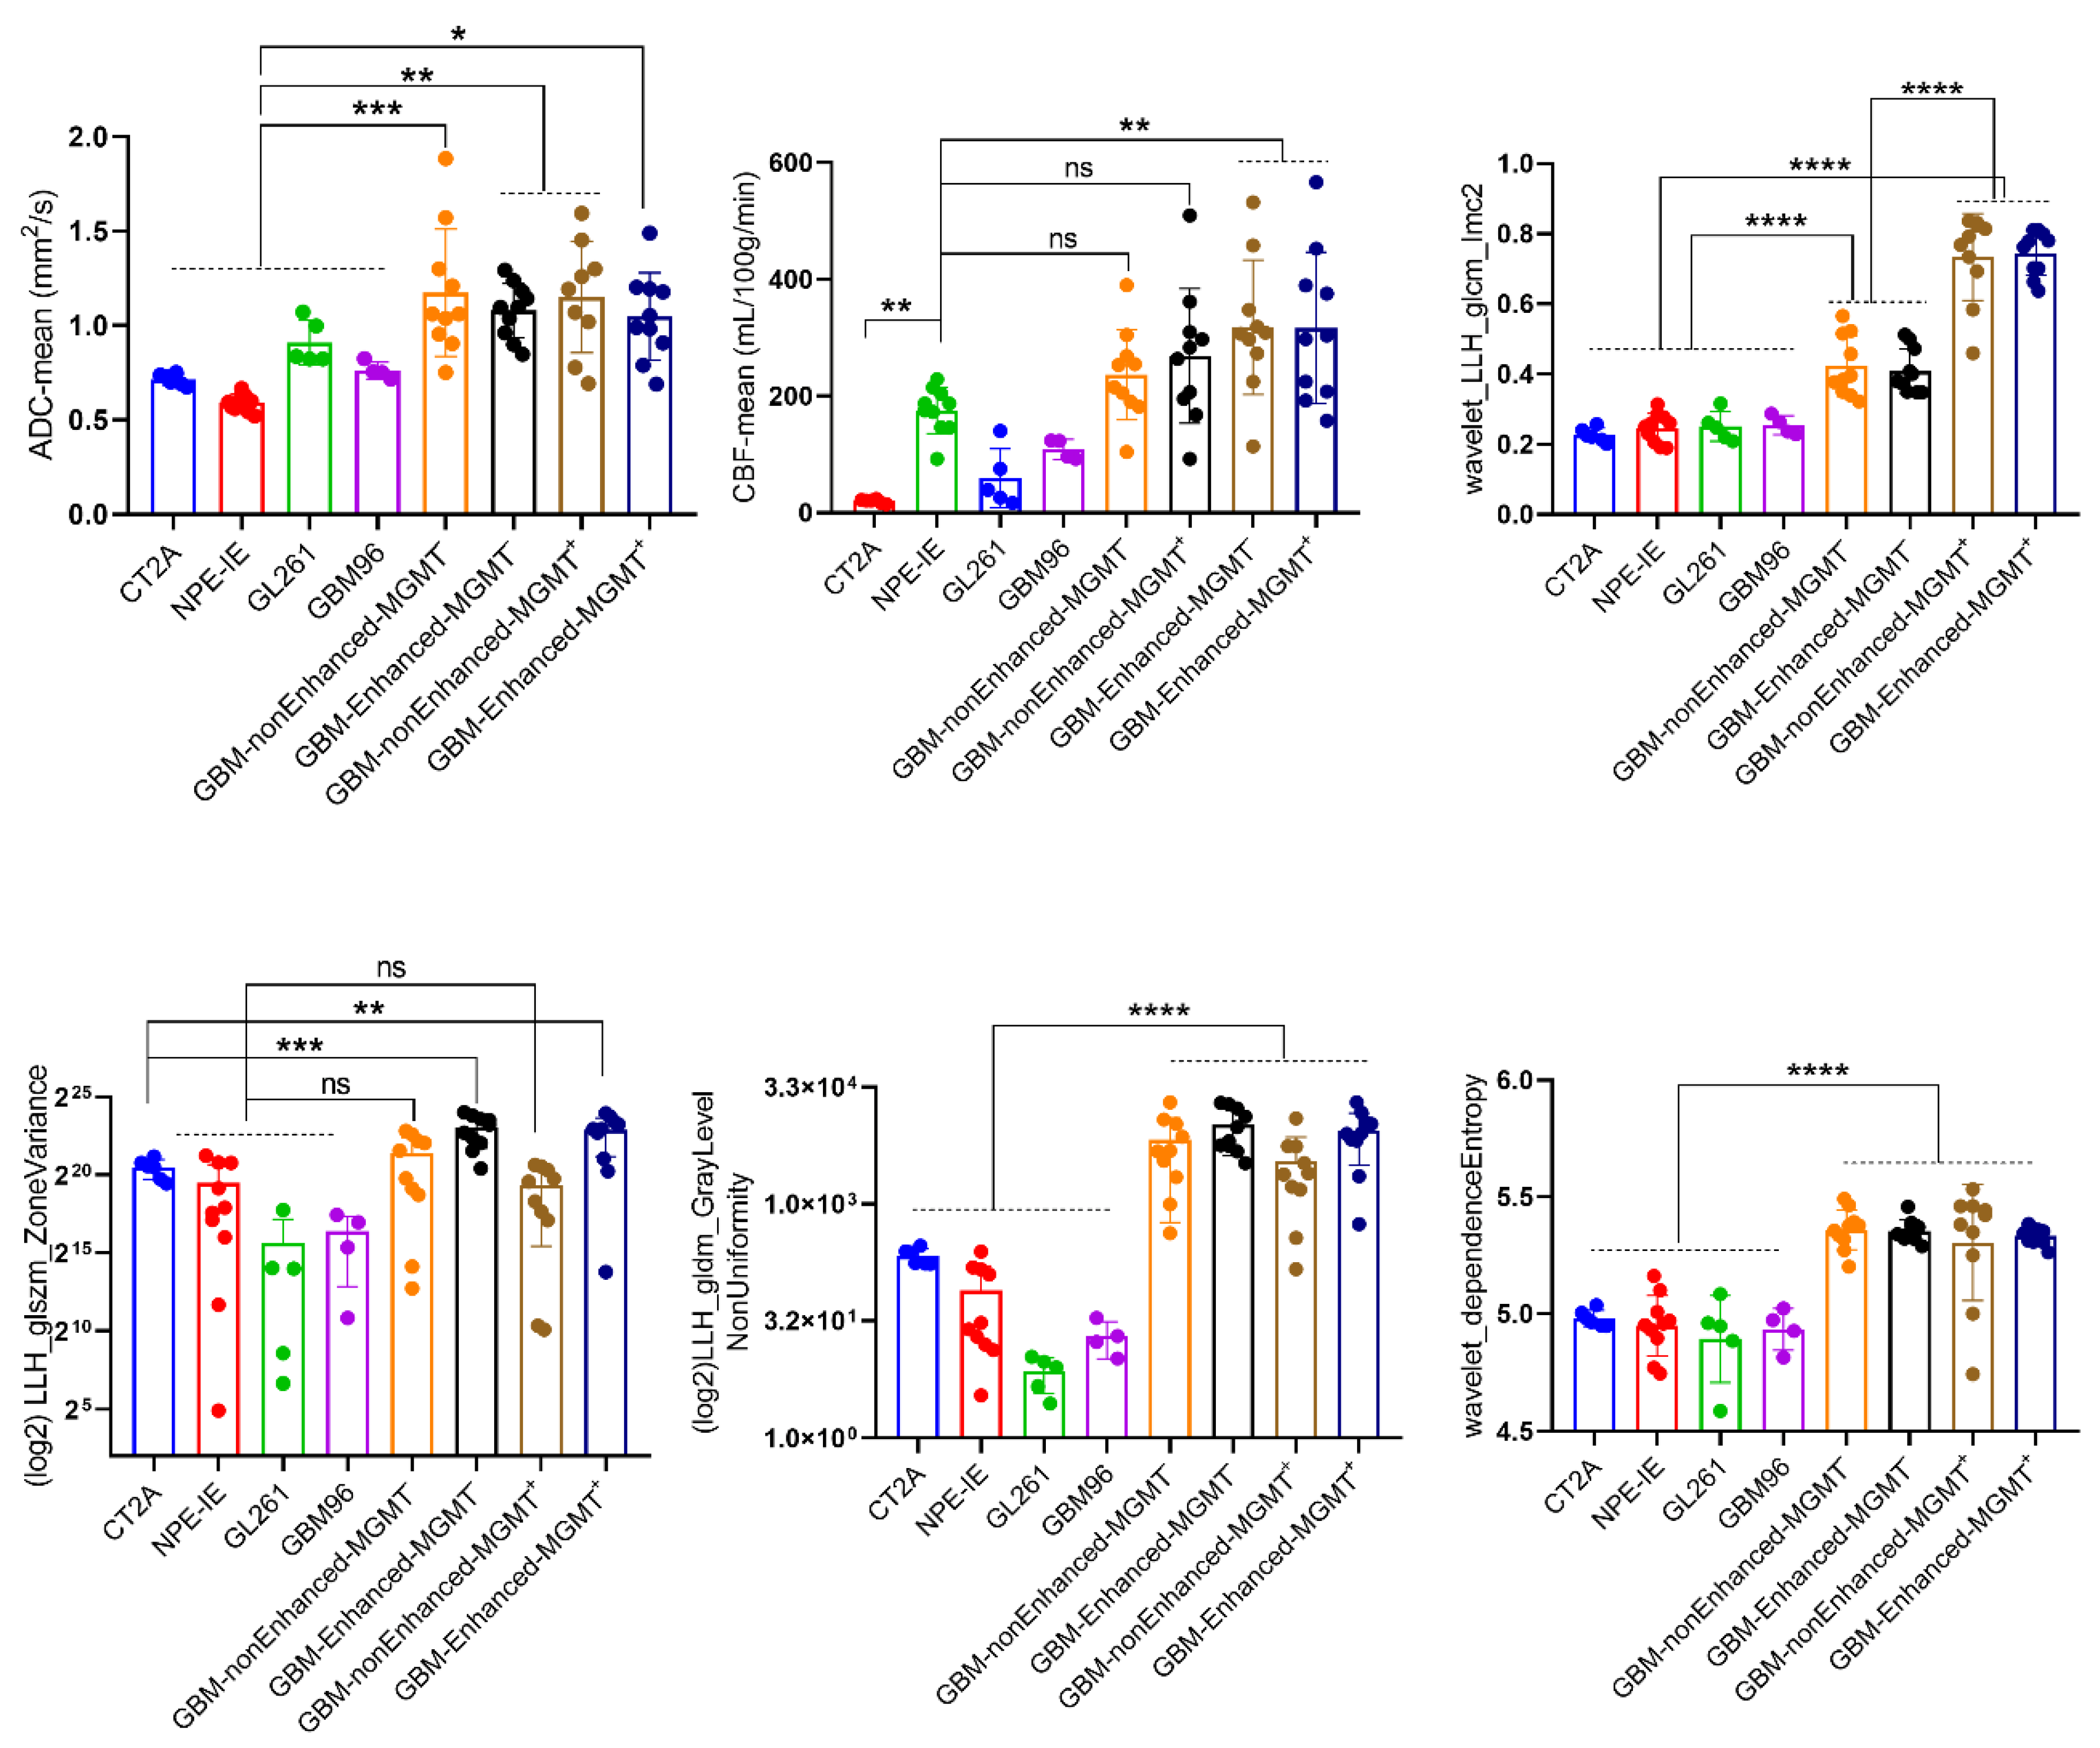
When comparing to the patients MRI data, we observed that only the NPE-IE model presented comparable CBF values to the non-enhanced central tumours in GBM patients (Figure 6). The other tumour models revealed significant lower perfusion values in comparison to the patient dataset. The ADC values of all orthotopic models were significantly lower than those of the patient dataset. This is primarily because orthotopic tumours are known to be highly solid, with very dense cell distribution, limiting the diffusion of water within them.
We further examined the behaviour of the wavelet-transformed radiomic set that exhibited stronger correlations with histopathological markers of vessel area and tumour cellularity in the orthotopic models when applied to patient data.
Overall, the patients showed more heterogeneous presenting tumours, with greater variability in the size and gray intensity levels of intra-tumoral pixel distribution. This was reflected by the markedly higher values of HLL_GLDM_dependenceEntropy, HLH_GLSZM_ZoneVariance, and LLH_GLDM_GrayLevelNonUniformity radiomic features. An interesting observation was that the variability in the size of homogeneous intra-tumoral zones in all orthotopic models closely resembled that of the non-enhanced central tumours of GBM patients. This was indicated by the similarly low values of LLH_GLSZM_ZoneVariance seen in both mouse and GBM patients.
Furthermore, we have observed a notable distinction between MGMT methylated, MGMT(-), and MGMT unmethylated, MGM(+), patient tumours in terms of the wavelet_GLCM_Imc2 feature. Namely, MGMT(+) patients exhibited a more complex texture pattern of wavelet transformed ADC maps, characterized by a wider range of intensity relationships among neighbouring pixels, in contrast to the MGMT(-) patients.
4. Discussion
Orthotopic models of GBM are essential tools for the preclinical evaluation of therapies. They can mimic features of tumour growth and invasion and have the ability to replicate certain traits of human GBM [32]. However, to date, results obtained in preclinical models of GBM have failed to translate in the clinical setting. Introducing novel methods for detailed non-invasive characterisation of these models could capture more intricate details of responses to treatments, thereby facilitating the discovery of new diagnostic biomarkers that may help assess the efficacy of therapies more robustly. In this study, we developed a thorough radiomic phenotyping analysis of four mouse orthotopic GBM models by utilising a combination of quantitative MRI protocols to assess tumour characteristic changes following irradiation. Of the 3 syngeneic models, 2 were chemically induced (CT2A and GL261) and 1 (NPE-IE) represented a spontaneous model of GBM. The fourth was a xenograft model using a human GBM primary cell line. We showed that: 1) MRI parameters of diffusion and perfusion provide information about tumour cellularity and degree of tumour vascularization; 2) the assessment of MRI textural features and spatial correlation of gray levels in ADC and CBF maps, in conjunction with analysis of coarseness and regularity of local variations in MR image intensity, offer further insights of tumour spatial heterogeneity responses post IR treatment. The histopathological examination provided further clarification on the interpretation of these selected radiomic features by showing high correlation with nuclear counts and vessel appearance / distribution.
CT-2A tumours are recognised for their haemorrhagic and infiltrative characteristics, marked by high cell density, rapid growth and expansion [33]. Our results indicated that, both with and without IR treatment, the CT-2A model exhibited increased heterogeneity in ADC values (high GLNU values) and greater blood perfusion heterogeneity (high values of LHL_GLSZM_ZoneVariance) when compared to the other models, with histopathologic correlations of 0. 7 and above. CD31 staining revealed a disordered network of blood vessels, characterised by tortuous, enlarged vessels with profoundly reduced branching and increased vessel diameter. This could lead to irregular blood perfusion and vascular leakage, which, in conjunction with the high cell density noted in this model, might account for the low perfusion values seen in CT-2A. Given that CT-2A showed the highest tumour growth in this study, the set of radiomic features showing elevated GLNU radiomic values, high total energy, and high LHL_ZoneVariance could serve as a diagnostic imaging biomarker for identifying more advanced orthotopic tumours.
The NPE-IE cells are known for their ability to form highly aggressive tumours with increased tumour growth [15]. This increased expansion likely requires an extensive blood supply to support rapid tumour expansion. Additionally, their similarities to the mesenchymal subtype of human GBM, which is known for its elevated angiogenic signatures relative to other subtypes, may explain the high perfusion values noted in the NPE-IE tumours, with values nearly reaching those seen in central non-enhancing tumours of GBM patients.
The GBM96 and GL261 tumours presented a higher degree of uniformity in tumour texture and finer image coarseness post IR when compared to CT-2A. This may be due to their comparable CBF values observed after IR, along with a diminished response in vessel area reduction post IR in contrast to CT-2A. Similarities were also noted between the NPE-IE and GBM96 models in terms of image homogeneity following irradiation. These are likely attributed to the high prevalence of elevated CBF/low ADC values in both models, leading to comparable intra-tumoral pixel intensity levels and uniformity in gray level size distribution.
A general observation was that the diffusion values of orthotopic tumours were significantly lower than those of GBM patients. This indicates that the tumours in the mouse models are highly solid, with denser cellularity in comparison to patients.
Overall, the radiomics analysis demonstrated clear differences in image heterogeneity between patient and mouse orthotopic tumours. GBM patient tumours exhibited greater heterogeneity in terms of several wavelet transformed ADC features, which may be explained by the greater diversity in cell populations and/or microenvironments at molecular [34], microscopic [35] and macroscopic [36] levels found in patients as opposed to animal models.
Interestingly, we have observed comparable lower values of ADC wavelet transformed LLH_GLSZM_ZoneVariance in both orthotopic and central non-enhancing patient tumours. Lower values of LLH_GLSZM_ZoneVariance indicate greater homogeneity in the size of areas with similar intensity within the tumour. The central non-enhancing GBM tumours do contain solid tissue composition with substantial areas of necrosis [37] and lower perfusion, which may reflect a more homogeneous distribution of pixel intensity, akin to that observed in mouse orthotopic tumours. Nonetheless, we should keep in mind that this homogeneous pattern seen in both cases, although similar, might arise from different processes. In addition, the differences in image texture and complexity observed between the two groups of GBM patients (MGMT(+) and MGMT(-)) are noteworthy as identifying MGMT promoter methylation status non-invasively through radiomics would be of great importance for GBM patients in evaluating their response to chemotherapy and for the improvement of their prognosis [38].
5. Conclusion
We showed that MRI radiomics can extract quantitative features from MRI parameters of diffusion and perfusion to capture information about the entire tumour volume, vascularisation, and cellularity, potentially addressing aspects of tumour heterogeneity that may be missed by traditional biopsies. As the field advances, it has the potential to greatly improve preclinical cancer research and accelerate the development of new therapies, serving as a valuable virtual biopsy alternative. All qMRI methods outlined here are implemented on clinical scanners facilitating the translation of preclinical radiomic studies to the clinical setting. Challenges continue to exist in the standardisation and biological validation of radiomic features across different studies and imaging protocols, making this an area of ongoing development.
Author Contributions
Conceptualization, N.B., R.P. and N.S.; methodology, N.B., R.P., M.C., and N.S.; validation, N.B.; formal analysis, N.B., R.P., and M.C.; investigation, N.B., R.P. and M.C.; resources, N.S.; data curation, N.B.; writing—original draft preparation, N.B.; writing—review and editing, N.S.; visualization, N.B., R.P., M.C.; supervision, N.S.; project administration, N.S.; funding acquisition, N.S. All authors reviewed the final manuscript.
Funding
This research was supported by the Brain Tumour Research (Registered charity number 1153487) and Brain Tumour Research Campaign (Registered charity number 295895).
Disclosures
The authors have nothing to disclose.
References
- Nabian, N.; Ghalehtaki, R.; Zeinalizadeh, M.; Balana, C.; Jablonska, P.A. State of the neoadjuvant therapy for glioblastoma multiforme-Where do we stand? Neurooncol Adv 2024, 6, vdae028. [Google Scholar] [CrossRef] [PubMed]
- Stupp, R.; Mason, W.P.; van den Bent, M.J.; Weller, M.; Fisher, B.; Taphoorn, M.J.; Belanger, K.; Brandes, A.A.; Marosi, C.; Bogdahn, U.; et al. Radiotherapy plus concomitant and adjuvant temozolomide for glioblastoma. N Engl J Med 2005, 352, 987–996. [Google Scholar] [CrossRef] [PubMed]
- Eidel, O.; Neumann, J.O.; Burth, S.; Kieslich, P.J.; Jungk, C.; Sahm, F.; Kickingereder, P.; Kiening, K.; Unterberg, A.; Wick, W.; et al. Automatic Analysis of Cellularity in Glioblastoma and Correlation with ADC Using Trajectory Analysis and Automatic Nuclei Counting. PLoS One 2016, 11, e0160250. [Google Scholar] [CrossRef] [PubMed]
- Andre, J.B.; Nagpal, S.; Hippe, D.S.; Ravanpay, A.C.; Schmiedeskamp, H.; Bammer, R.; Palagallo, G.J.; Recht, L.; Zaharchuk, G. Cerebral Blood Flow Changes in Glioblastoma Patients Undergoing Bevacizumab Treatment Are Seen in Both Tumor and Normal Brain. Neuroradiol J 2015, 28, 112–119. [Google Scholar] [CrossRef]
- Hu, L.S.; Eschbacher, J.M.; Heiserman, J.E.; Dueck, A.C.; Shapiro, W.R.; Liu, S.; Karis, J.P.; Smith, K.A.; Coons, S.W.; Nakaji, P.; et al. Reevaluating the imaging definition of tumor progression: perfusion MRI quantifies recurrent glioblastoma tumor fraction, pseudoprogression, and radiation necrosis to predict survival. Neuro Oncol 2012, 14, 919–930. [Google Scholar] [CrossRef]
- Hooper, G.W.; Ginat, D.T. MRI radiomics and potential applications to glioblastoma. Front Oncol 2023, 13, 1134109. [Google Scholar] [CrossRef]
- Zhang, L.; Yao, R.; Gao, J.; Tan, D.; Yang, X.; Wen, M.; Wang, J.; Xie, X.; Liao, R.; Tang, Y.; et al. An Integrated Radiomics Model Incorporating Diffusion-Weighted Imaging and (18)F-FDG PET Imaging Improves the Performance of Differentiating Glioblastoma From Solitary Brain Metastases. Front Oncol 2021, 11, 732704. [Google Scholar] [CrossRef]
- Park, J.E.; Kim, H.S.; Jo, Y.; Yoo, R.E.; Choi, S.H.; Nam, S.J.; Kim, J.H. Radiomics prognostication model in glioblastoma using diffusion- and perfusion-weighted MRI. Sci Rep 2020, 10, 4250. [Google Scholar] [CrossRef]
- Malik, N.; Geraghty, B.; Dasgupta, A.; Maralani, P.J.; Sandhu, M.; Detsky, J.; Tseng, C.L.; Soliman, H.; Myrehaug, S.; Husain, Z.; et al. MRI radiomics to differentiate between low grade glioma and glioblastoma peritumoral region. J Neurooncol 2021, 155, 181–191. [Google Scholar] [CrossRef]
- Kobayashi, K.; Miyake, M.; Takahashi, M.; Hamamoto, R. Observing deep radiomics for the classification of glioma grades. Sci Rep 2021, 11, 10942. [Google Scholar] [CrossRef]
- Kickingereder, P.; Gotz, M.; Muschelli, J.; Wick, A.; Neuberger, U.; Shinohara, R.T.; Sill, M.; Nowosielski, M.; Schlemmer, H.P.; Radbruch, A.; et al. Large-scale Radiomic Profiling of Recurrent Glioblastoma Identifies an Imaging Predictor for Stratifying Anti-Angiogenic Treatment Response. Clin Cancer Res 2016, 22, 5765–5771. [Google Scholar] [CrossRef] [PubMed]
- Mammadov, O.; Akkurt, B.H.; Musigmann, M.; Ari, A.P.; Blomer, D.A.; Kasap, D.N.G.; Henssen, D.; Nacul, N.G.; Sartoretti, E.; Sartoretti, T.; et al. Radiomics for pseudoprogression prediction in high grade gliomas: added value of MR contrast agent. Heliyon 2022, 8, e10023. [Google Scholar] [CrossRef] [PubMed]
- Maes, W.; Van Gool, S.W. Experimental immunotherapy for malignant glioma: lessons from two decades of research in the GL261 model. Cancer Immunol Immunother 2011, 60, 153–160. [Google Scholar] [CrossRef] [PubMed]
- Seyfried, T.N.; el-Abbadi, M.; Roy, M.L. Ganglioside distribution in murine neural tumors. Mol Chem Neuropathol 1992, 17, 147–167. [Google Scholar] [CrossRef]
- Gangoso, E.; Southgate, B.; Bradley, L.; Rus, S.; Galvez-Cancino, F.; McGivern, N.; Guc, E.; Kapourani, C.A.; Byron, A.; Ferguson, K.M.; et al. Glioblastomas acquire myeloid-affiliated transcriptional programs via epigenetic immunoediting to elicit immune evasion. Cell 2021, 184, 2454–2470. [Google Scholar] [CrossRef]
- Przystal, J.M.; Hajji, N.; Khozoie, C.; Renziehausen, A.; Zeng, Q.; Abaitua, F.; Hajitou, A.; Suwan, K.; Want, E.; Bomalaski, J.; et al. Efficacy of arginine depletion by ADI-PEG20 in an intracranial model of GBM. Cell Death Dis 2018, 9, 1192. [Google Scholar] [CrossRef]
- Grech-Sollars, M.; Hales, P.W.; Miyazaki, K.; Raschke, F.; Rodriguez, D.; Wilson, M.; Gill, S.K.; Banks, T.; Saunders, D.E.; Clayden, J.D.; et al. Multi-centre reproducibility of diffusion MRI parameters for clinical sequences in the brain. NMR Biomed 2015, 28, 468–485. [Google Scholar] [CrossRef]
- Petersen, E.T.; Mouridsen, K.; Golay, X.; all named co-authors of the, Q.t.-r.s. The QUASAR reproducibility study, Part II: Results from a multi-center Arterial Spin Labeling test-retest study. Neuroimage 2010, 49, 104–113. [Google Scholar] [CrossRef]
- Yu, W.; Zhang, L.; Wei, Q.; Shao, A. O(6)-Methylguanine-DNA Methyltransferase (MGMT): Challenges and New Opportunities in Glioma Chemotherapy. Front Oncol 2019, 9, 1547. [Google Scholar] [CrossRef]
- Alsop, D.C.; Detre, J.A.; Golay, X.; Gunther, M.; Hendrikse, J.; Hernandez-Garcia, L.; Lu, H.; MacIntosh, B.J.; Parkes, L.M.; Smits, M.; et al. Recommended implementation of arterial spin-labeled perfusion MRI for clinical applications: A consensus of the ISMRM perfusion study group and the European consortium for ASL in dementia. Magn Reson Med 2015, 73, 102–116. [Google Scholar] [CrossRef]
- Wong, E.C.; Buxton, R.B.; Frank, L.R. Quantitative imaging of perfusion using a single subtraction (QUIPSS and QUIPSS II). Magn Reson Med 1998, 39, 702–708. [Google Scholar] [CrossRef] [PubMed]
- Andersson, J.L.; Skare, S.; Ashburner, J. How to correct susceptibility distortions in spin-echo echo-planar images: application to diffusion tensor imaging. Neuroimage 2003, 20, 870–888. [Google Scholar] [CrossRef] [PubMed]
- Smith, S.M.; Jenkinson, M.; Woolrich, M.W.; Beckmann, C.F.; Behrens, T.E.; Johansen-Berg, H.; Bannister, P.R.; De Luca, M.; Drobnjak, I.; Flitney, D.E.; et al. Advances in functional and structural MR image analysis and implementation as FSL. Neuroimage 2004, 23 (Suppl. S1), S208–S219. [Google Scholar] [CrossRef] [PubMed]
- Yushkevich, P.A.; Piven, J.; Hazlett, H.C.; Smith, R.G.; Ho, S.; Gee, J.C.; Gerig, G. User-guided 3D active contour segmentation of anatomical structures: significantly improved efficiency and reliability. Neuroimage 2006, 31, 1116–1128. [Google Scholar] [CrossRef]
- van Griethuysen, J.J.M.; Fedorov, A.; Parmar, C.; Hosny, A.; Aucoin, N.; Narayan, V.; Beets-Tan, R.G.H.; Fillion-Robin, J.C.; Pieper, S.; Aerts, H.J.W.L. Computational Radiomics System to Decode the Radiographic Phenotype. Cancer Res 2017, 77, E104–E107. [Google Scholar] [CrossRef]
- Bankhead, P.; Loughrey, M.B.; Fernandez, J.A.; Dombrowski, Y.; McArt, D.G.; Dunne, P.D.; McQuaid, S.; Gray, R.T.; Murray, L.J.; Coleman, H.G.; et al. QuPath: Open source software for digital pathology image analysis. Sci Rep 2017, 7, 16878. [Google Scholar] [CrossRef]
- Calabrese, E.; Villanueva-Meyer, J.E.; Rudie, J.D.; Rauschecker, A.M.; Baid, U.; Bakas, S.; Cha, S.; Mongan, J.T.; Hess, C.P. The University of California San Francisco Preoperative Diffuse Glioma MRI Dataset. Radiol Artif Intell 2022, 4, e220058. [Google Scholar] [CrossRef]
- Anaraki, J.R.; Usefi, H. A Comparative Study of Feature Selection Methods on Genomic Datasets. Comp Med Sy 2019, 471–476. [Google Scholar] [CrossRef]
- Radovic, M.; Ghalwash, M.; Filipovic, N.; Obradovic, Z. Minimum redundancy maximum relevance feature selection approach for temporal gene expression data. BMC Bioinformatics 2017, 18, 9. [Google Scholar] [CrossRef]
- Tibshirani, R. Regression shrinkage and selection via the lasso: a retrospective. J R Stat Soc B 2011, 73, 273–282. [Google Scholar] [CrossRef]
- Tanaka, T. [[Fundamentals] 5. Python+scikit-learn for Machine Learning in Medical Imaging]. Nihon Hoshasen Gijutsu Gakkai Zasshi 2023, 79, 1189–1193. [Google Scholar] [CrossRef] [PubMed]
- Haddad, A.F.; Young, J.S.; Amara, D.; Berger, M.S.; Raleigh, D.R.; Aghi, M.K.; Butowski, N.A. Mouse models of glioblastoma for the evaluation of novel therapeutic strategies. Neurooncol Adv 2021, 3, vdab100. [Google Scholar] [CrossRef] [PubMed]
- Martinez-Murillo, R.; Martinez, A. Standardization of an orthotopic mouse brain tumor model following transplantation of CT-2A astrocytoma cells. Histol Histopathol 2007, 22, 1309–1326. [Google Scholar] [CrossRef] [PubMed]
- Sottoriva, A.; Spiteri, I.; Piccirillo, S.G.; Touloumis, A.; Collins, V.P.; Marioni, J.C.; Curtis, C.; Watts, C.; Tavare, S. Intratumor heterogeneity in human glioblastoma reflects cancer evolutionary dynamics. Proc Natl Acad Sci U S A 2013, 110, 4009–4014. [Google Scholar] [CrossRef]
- Ravi, V.M.; Will, P.; Kueckelhaus, J.; Sun, N.; Joseph, K.; Salie, H.; Vollmer, L.; Kuliesiute, U.; von Ehr, J.; Benotmane, J.K.; et al. Spatially resolved multi-omics deciphers bidirectional tumor-host interdependence in glioblastoma. Cancer Cell 2022, 40, 639–655. [Google Scholar] [CrossRef]
- Dextraze, K.; Saha, A.; Kim, D.; Narang, S.; Lehrer, M.; Rao, A.; Narang, S.; Rao, D.; Ahmed, S.; Madhugiri, V.; et al. Spatial habitats from multiparametric MR imaging are associated with signaling pathway activities and survival in glioblastoma. Oncotarget 2017, 8, 112992–113001. [Google Scholar] [CrossRef]
- Monsky, W.L.; Jin, B.; Molloy, C.; Canter, R.J.; Li, C.S.; Lin, T.C.; Borys, D.; Mack, W.; Kim, I.; Buonocore, M.H.; et al. Semi-automated volumetric quantification of tumor necrosis in soft tissue sarcoma using contrast-enhanced MRI. Anticancer Res 2012, 32, 4951–4961. [Google Scholar]
- Butler, M.; Pongor, L.; Su, Y.T.; Xi, L.; Raffeld, M.; Quezado, M.; Trepel, J.; Aldape, K.; Pommier, Y.; Wu, J. MGMT Status as a Clinical Biomarker in Glioblastoma. Trends Cancer 2020, 6, 380–391. [Google Scholar] [CrossRef]
Figure 1.
Assessment of tumour volume, diffusion ADC and perfusion CBF in GL261, CT-2A, NPE-IE and GBM96 orthotopic tumours. a) representative T1-weighted images highlighting the presence of tumours in all four GBM models. b) Tumour volume, ADC and CBF were evaluated in the mouse GBM models (mean ± SD, *p<0.05, **p<0.01, ***p<0.001, ****p<0.0001, one-way ANOVA, comparison to healthy controls, Dunnett correction for multiple comparisons): GL261 (n=6), CT-2A (n=6), NPE-IE (n=6), GBM96 (n=10). c) dendrogram and heat map of hierarchical clustering analysis.
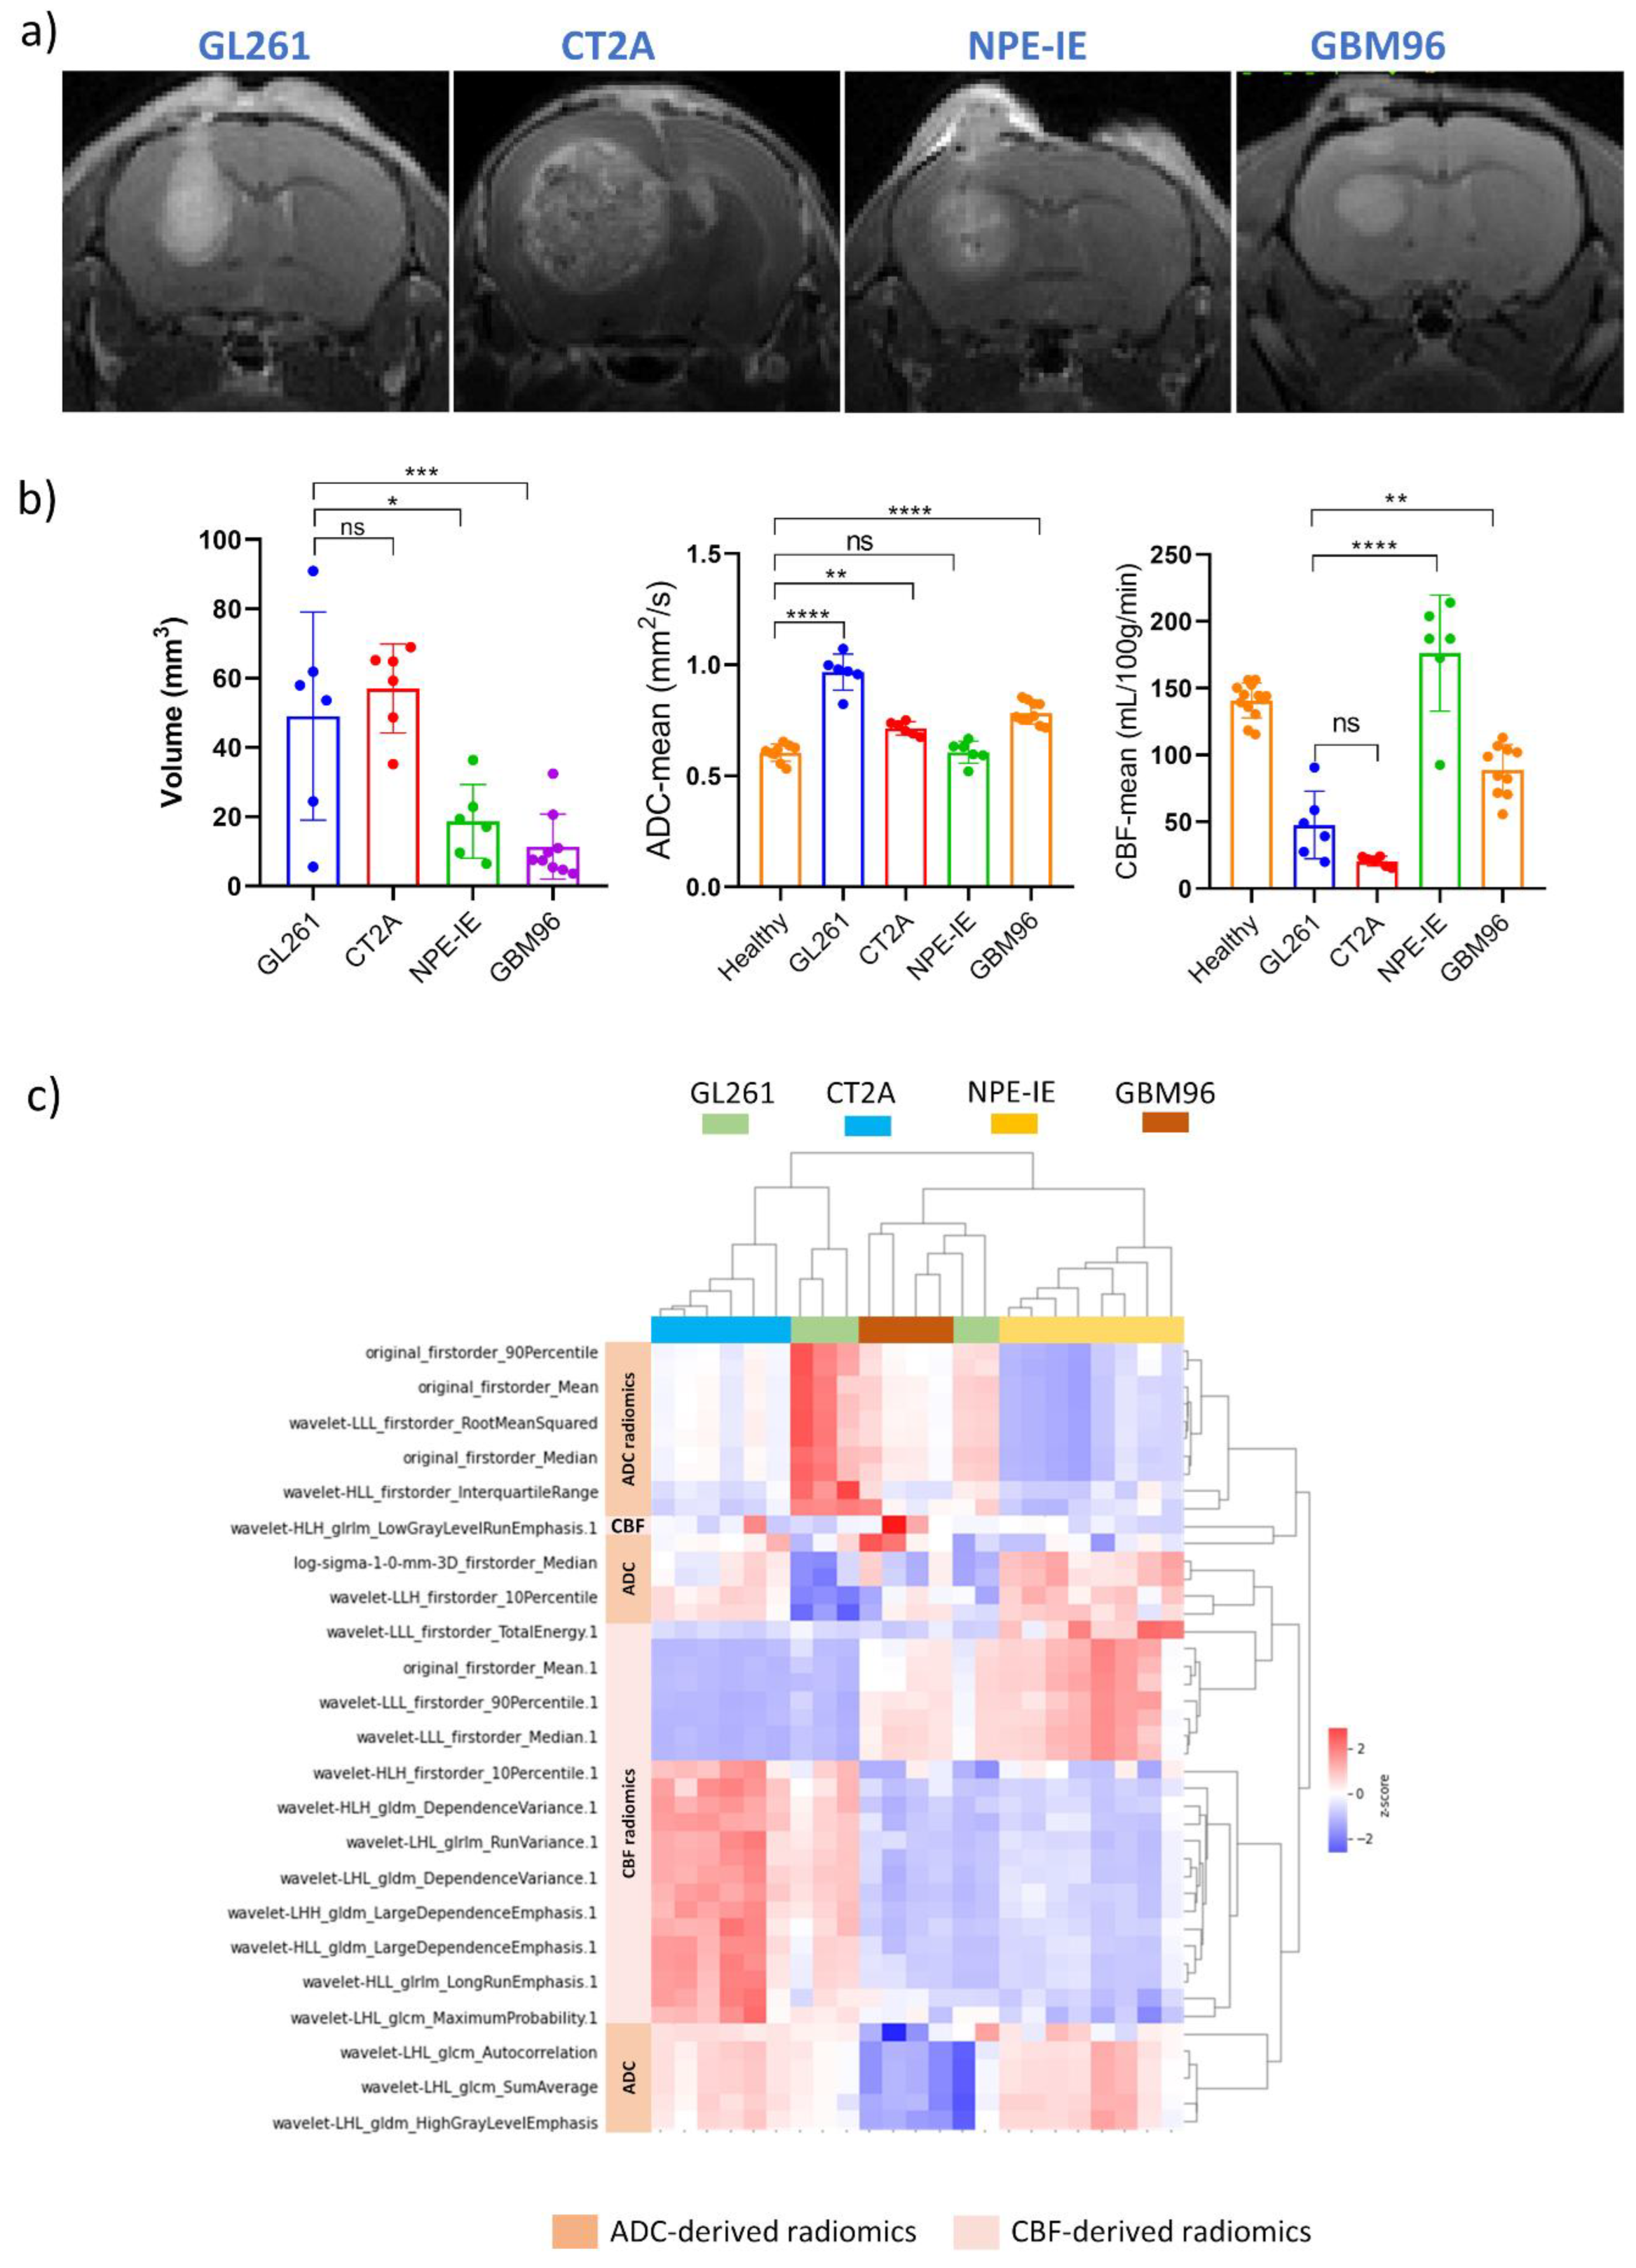
Figure 2.
Longitudinal evaluation of tumour response to saline– and IR treatment through MR imaging. Representative T1-weighted, CBF and ADC mapping of GL261 (a), CT-2A (b) and NPE-IE (c) models.
Figure 2.
Longitudinal evaluation of tumour response to saline– and IR treatment through MR imaging. Representative T1-weighted, CBF and ADC mapping of GL261 (a), CT-2A (b) and NPE-IE (c) models.
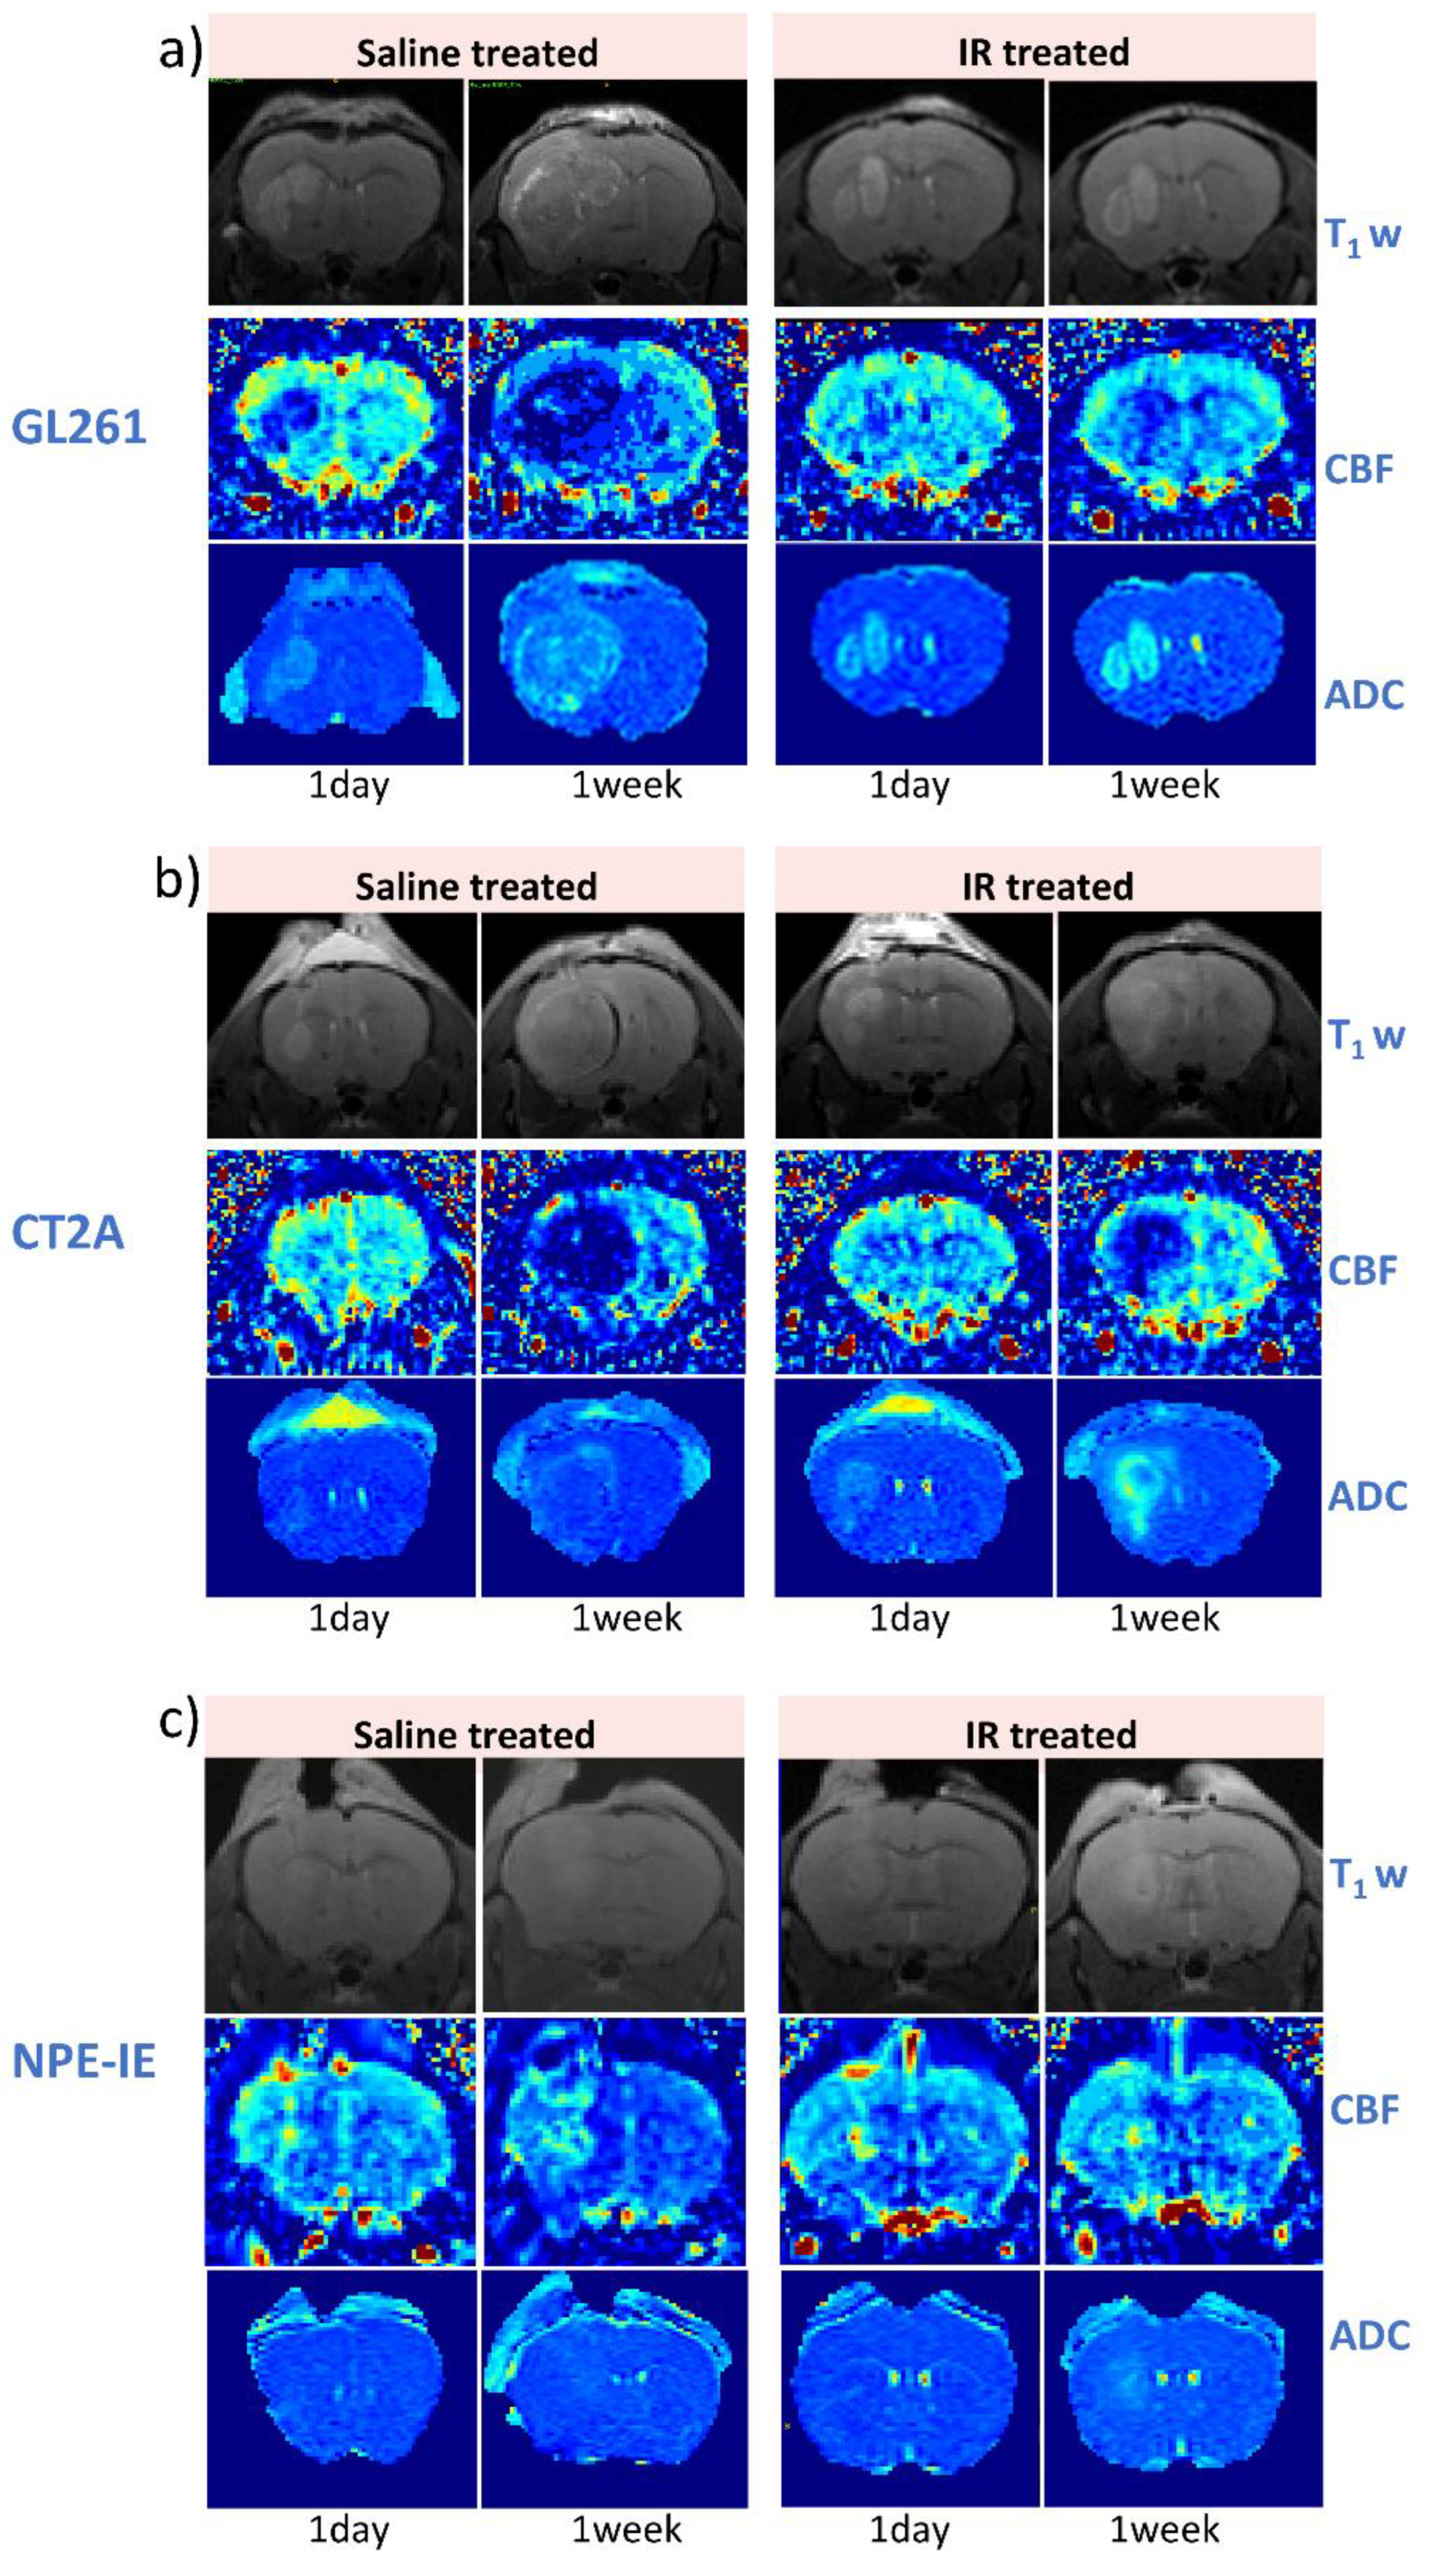
Figure 3.
Quantification of ADC and CBF changes following irradiation. a) ADC changes 1-day and 7-days following saline and IR treatment. b) CBF changes 1-day and 7-days following saline and IR treatment (mean ± SD, *p<0.05, **p<0.01, ***p<0.001, ****p<0.0001, one-way ANOVA, comparison between 1-day/7-days groups, Dunnett correction for multiple comparisons). GL261 (n=5 to 6 per treatment group, per MRI time point), CT-2A (n=5 to 6 per treatment group, per MRI time point), NPE-IE (n=10 for 1-week saline treated group, n=4 for remaining groups), GBM96 (n=4 per treatment group, per MRI point). Confusion matrices build from the mouse GBM models at 1-day (c) and 7-days (e) post IR. Dendrogram and heat map of hierarchical clustering analysis done at 1-day (d) at 7-days (f) post IR treatment.
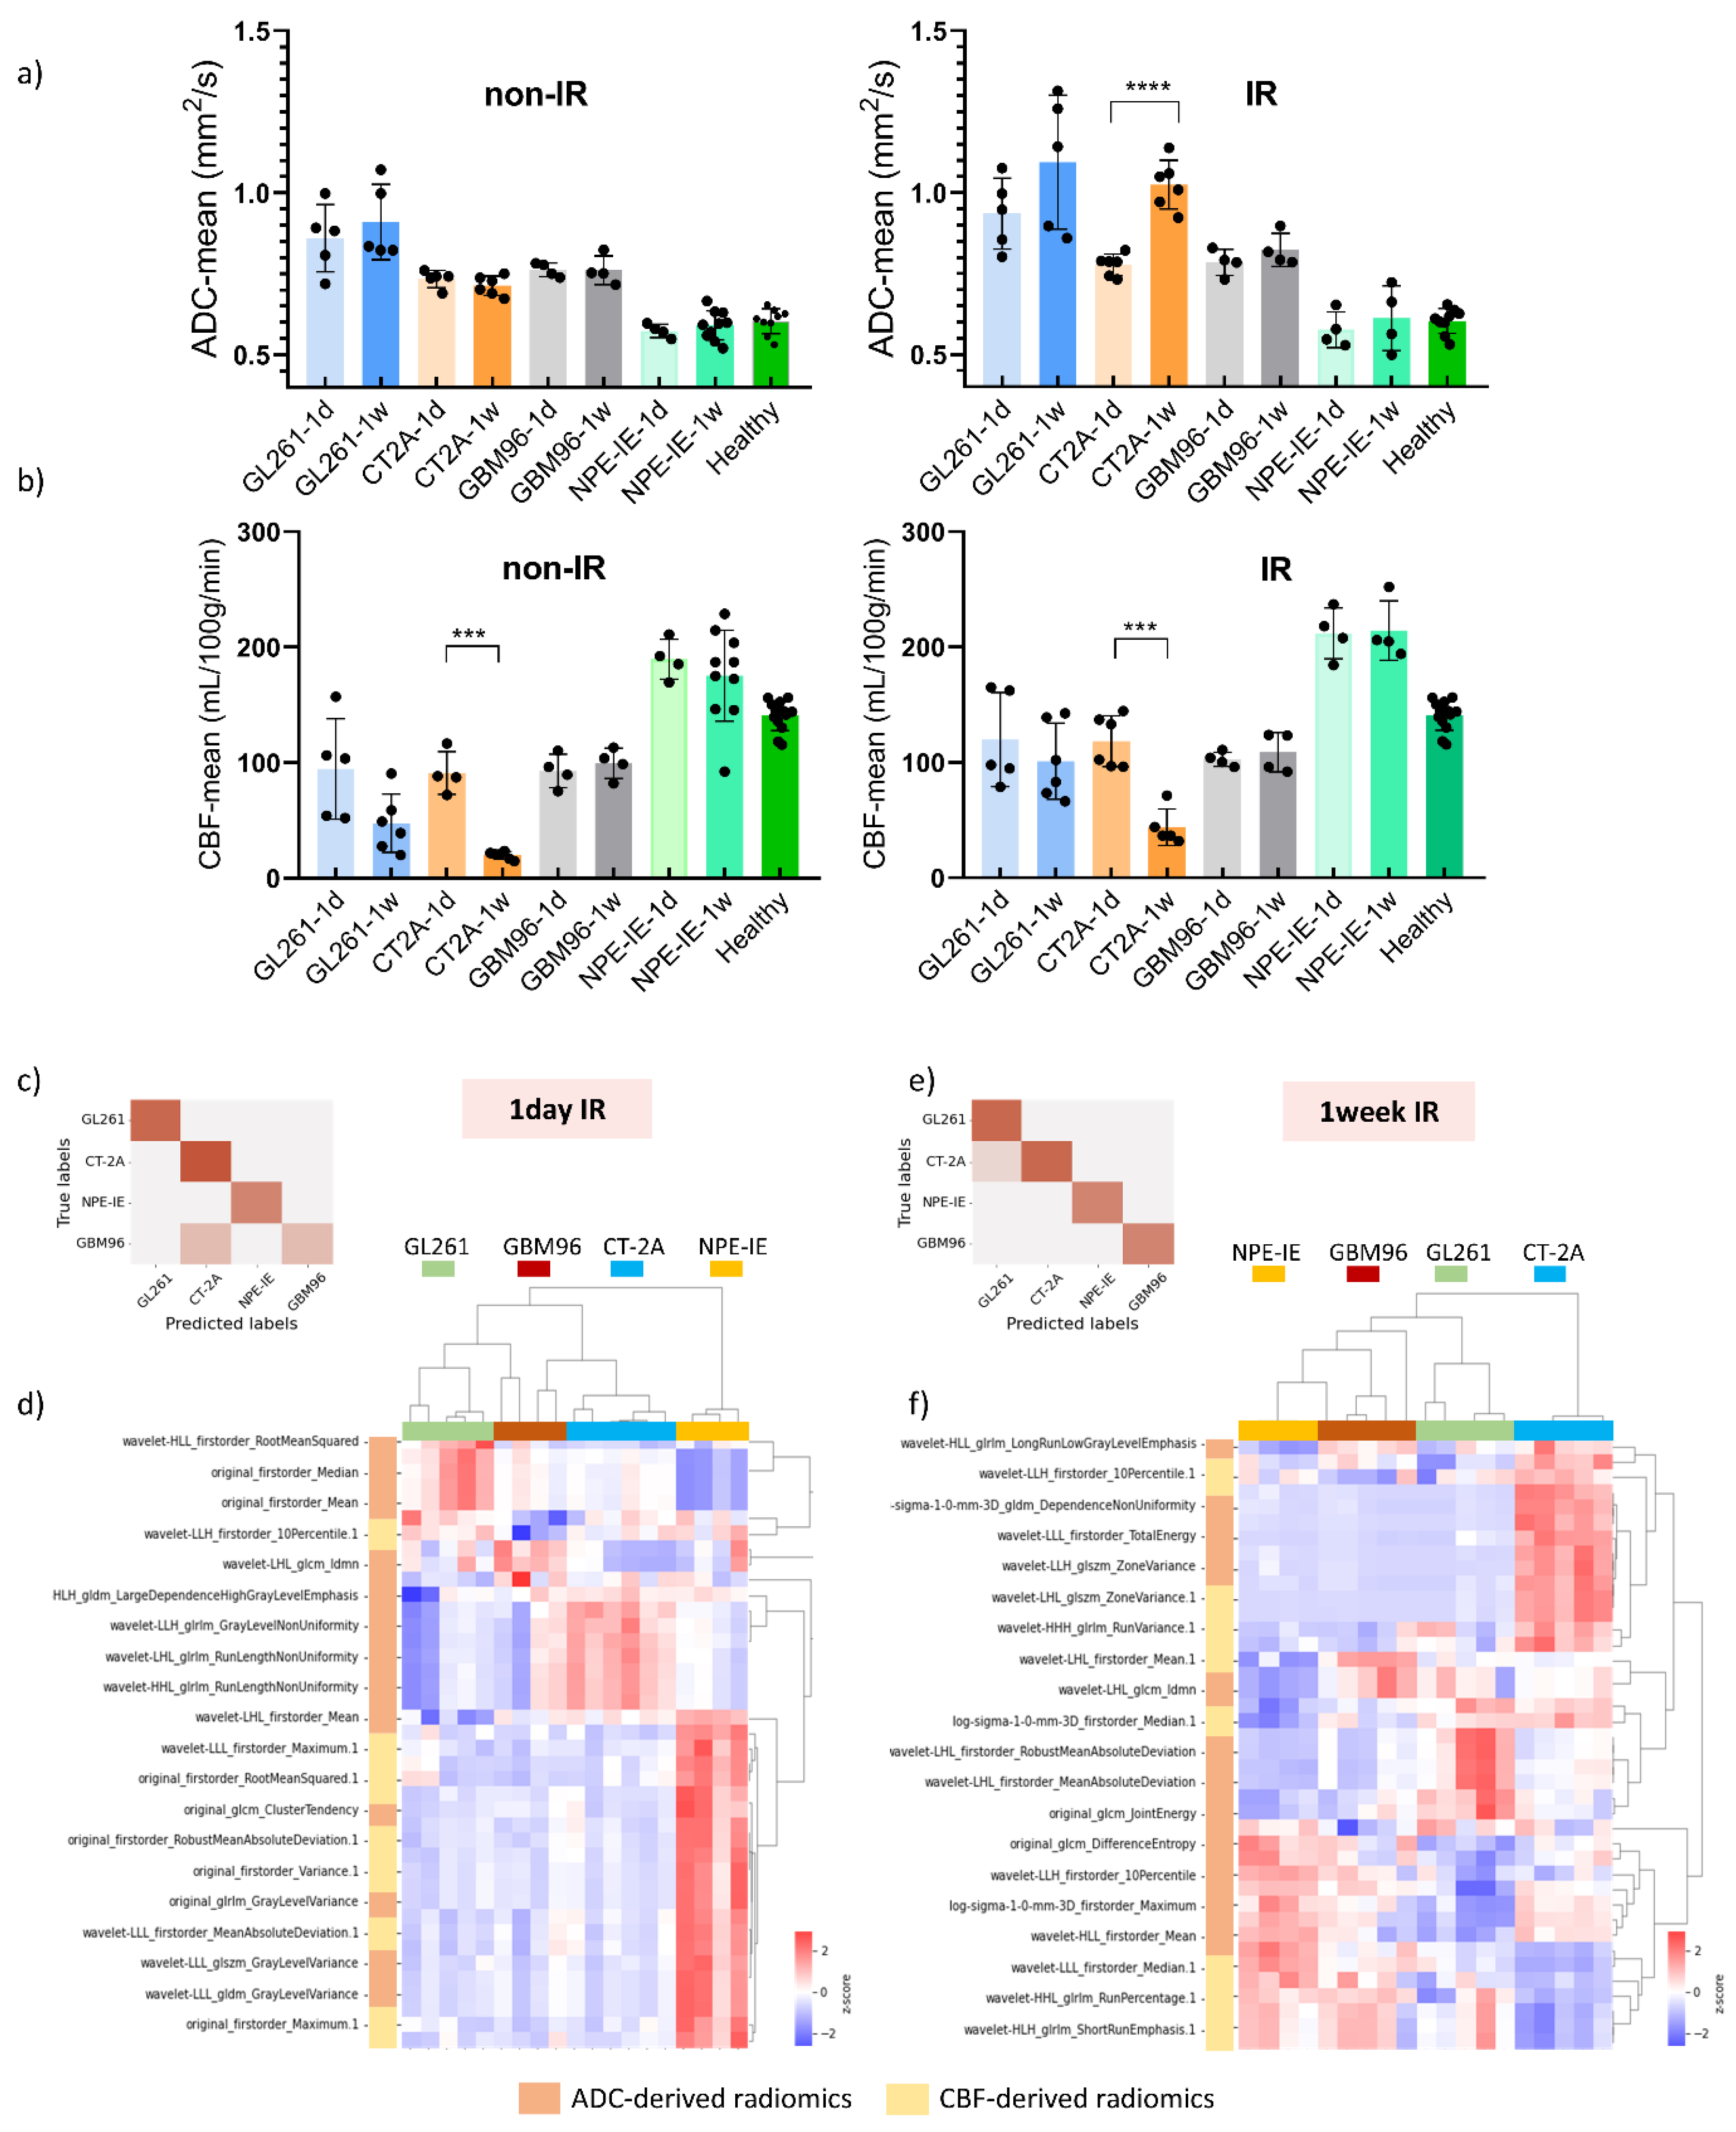
Figure 4.
Histopathology reveals high tumour cellularity and dilated vessels in orthotopic GBM tumours. a) Representative magnified histology micrographs are displayed showing an example of increased nuclear count (Hematoxylin and Eosin, scale bar 50 µm) and dilated vessels (CD31, scale bar 50 µm) in the saline-treated mice, as opposed to IR-treated and healthy cases. b) Quantification of nuclear count and vessel area changes in saline- and IR-treated mice, in comparison to healthy. (mean ± SD, *p<0.05, **p<0.01, ***p<0.001, ****p<0.0001, n = 4 - 5 per group, t-test). c) correlation matrix of radiomic features having highest correlation to histopathology. d) correlation network build from radiomics and histopathology markers of nuclear count, vessel area and vessel density illustrating the strength of correlations (thicker lines represent stronger correlations).
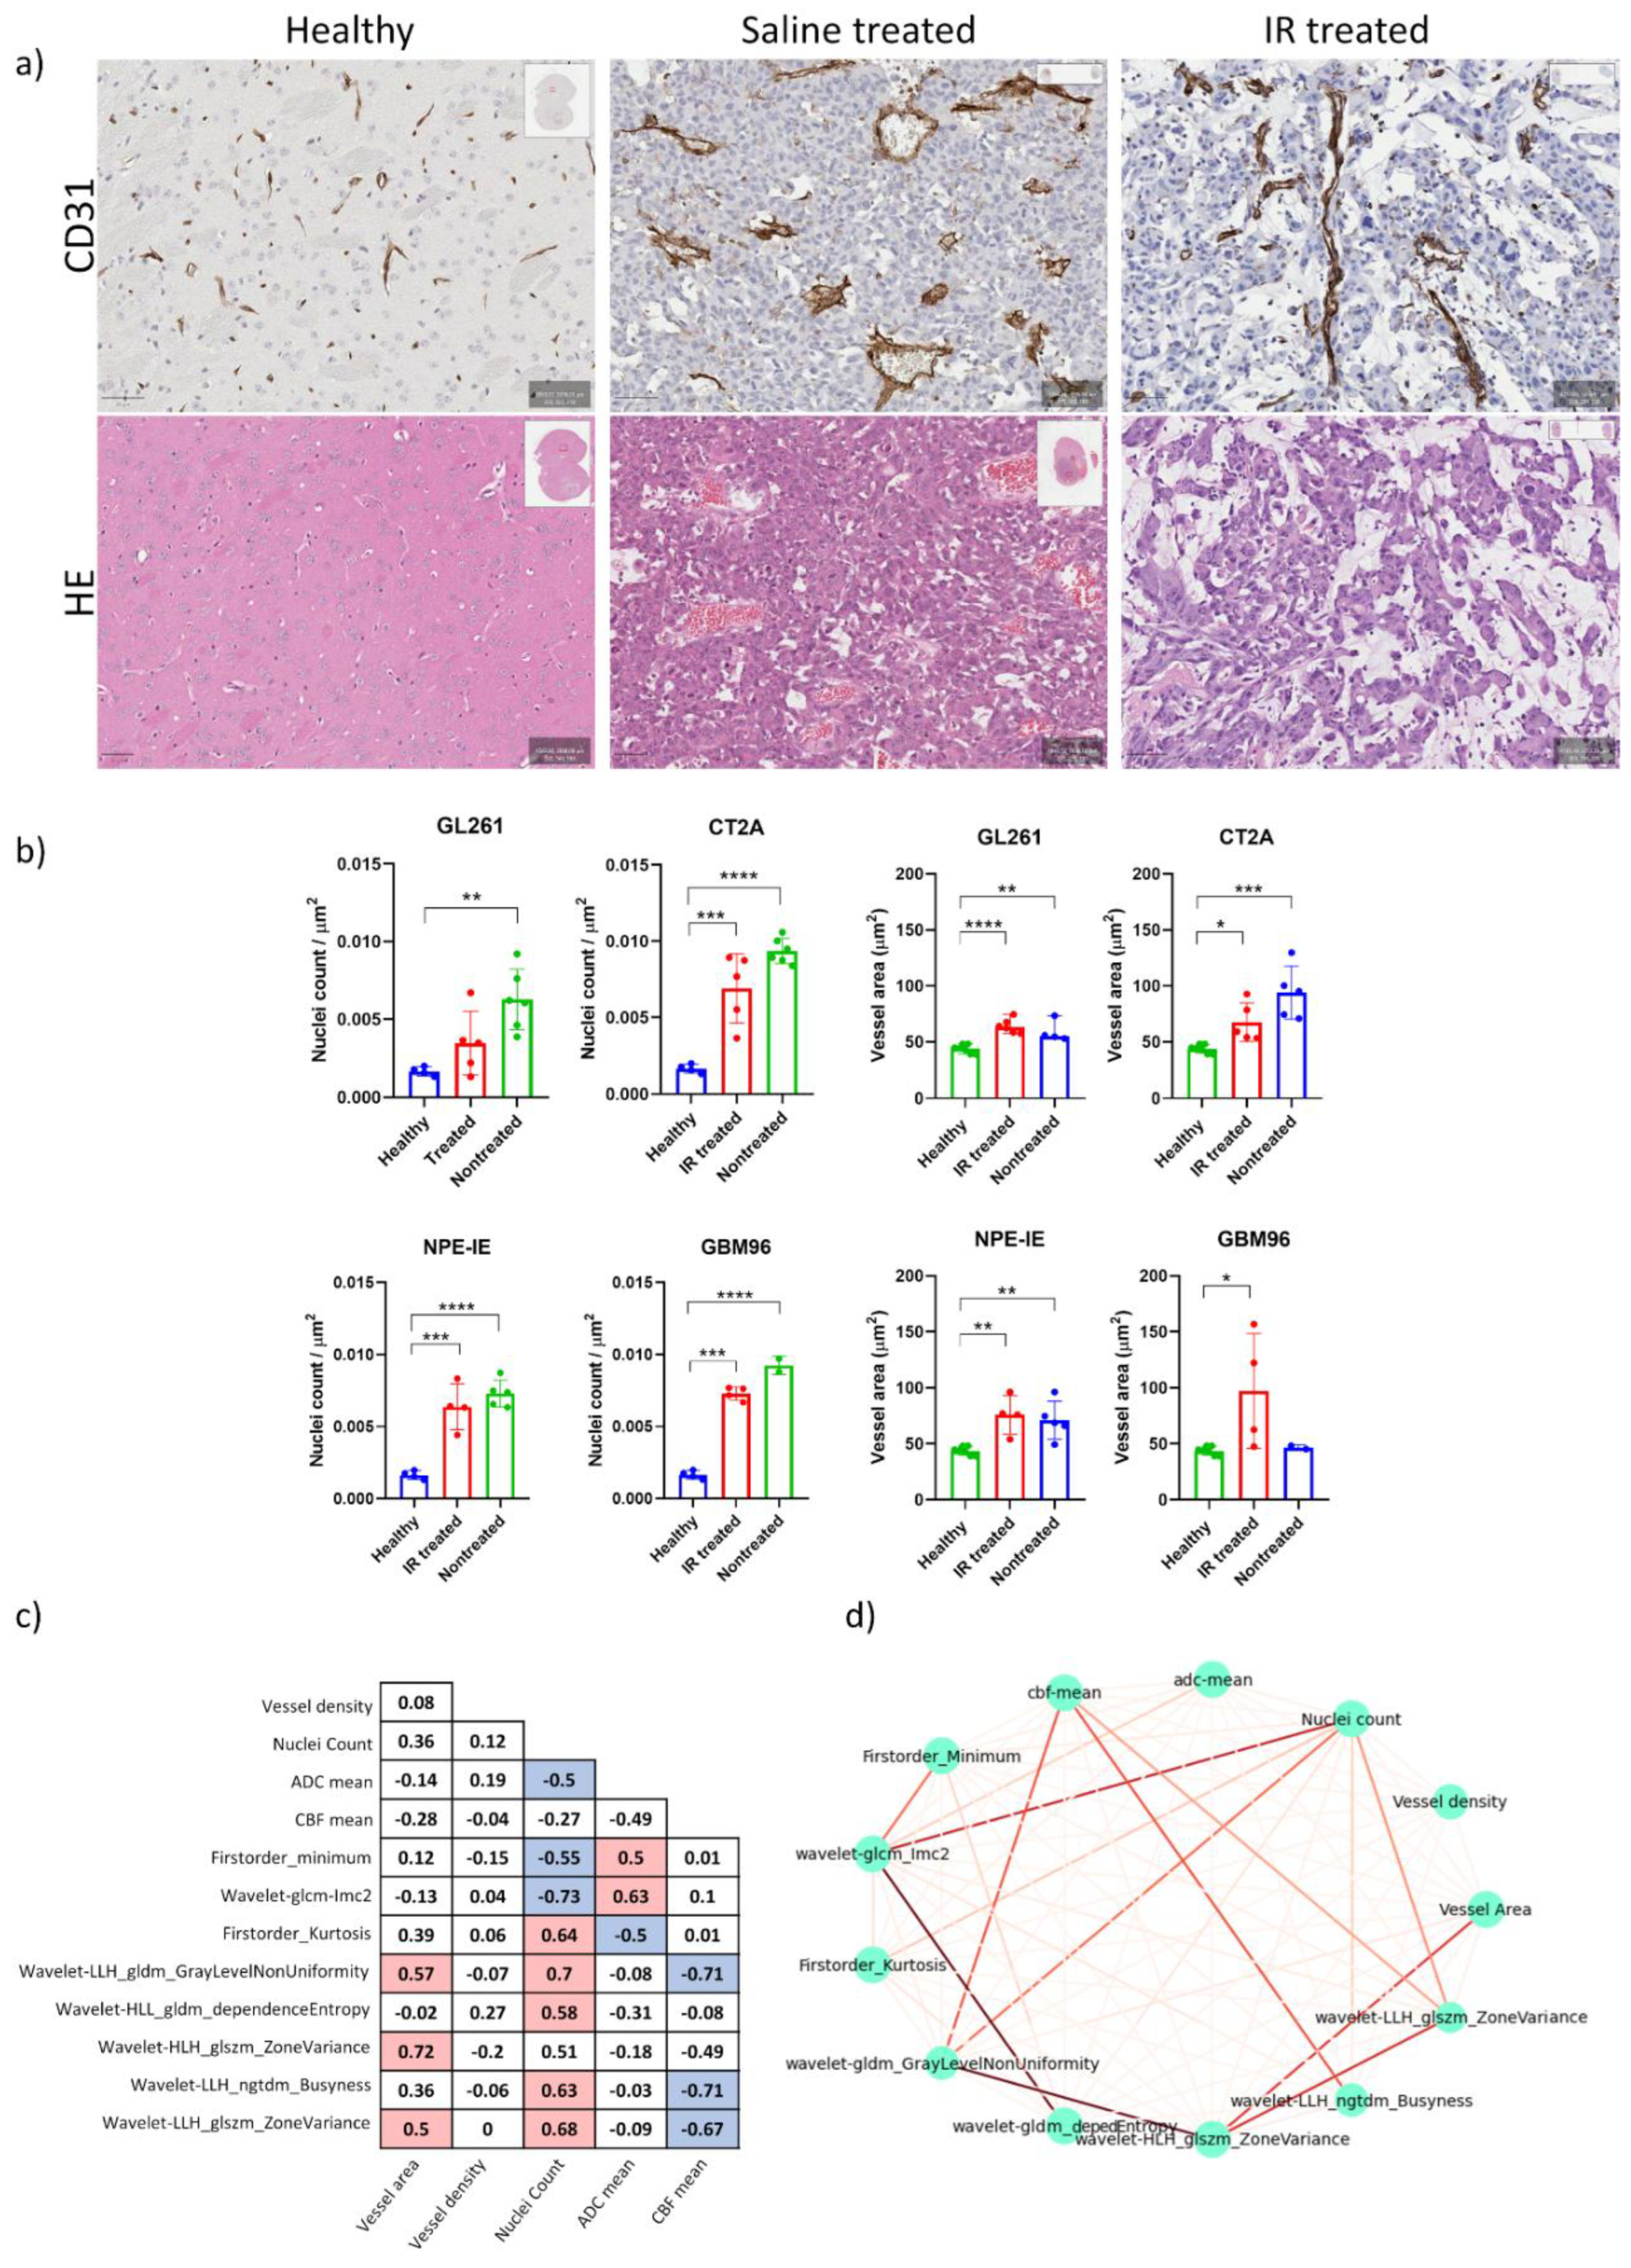
Figure 5.
Radiomics highlight differences between the IR treated and saline-treated groups. Comparison between saline- and IR-treated responses of selected radiomics along with the ADC and CBF responses (mean ± SD, *p<0.05, **p<0.01, ***p<0.001, ****p<0.0001, n = 4 per group, t-test).
Figure 5.
Radiomics highlight differences between the IR treated and saline-treated groups. Comparison between saline- and IR-treated responses of selected radiomics along with the ADC and CBF responses (mean ± SD, *p<0.05, **p<0.01, ***p<0.001, ****p<0.0001, n = 4 per group, t-test).
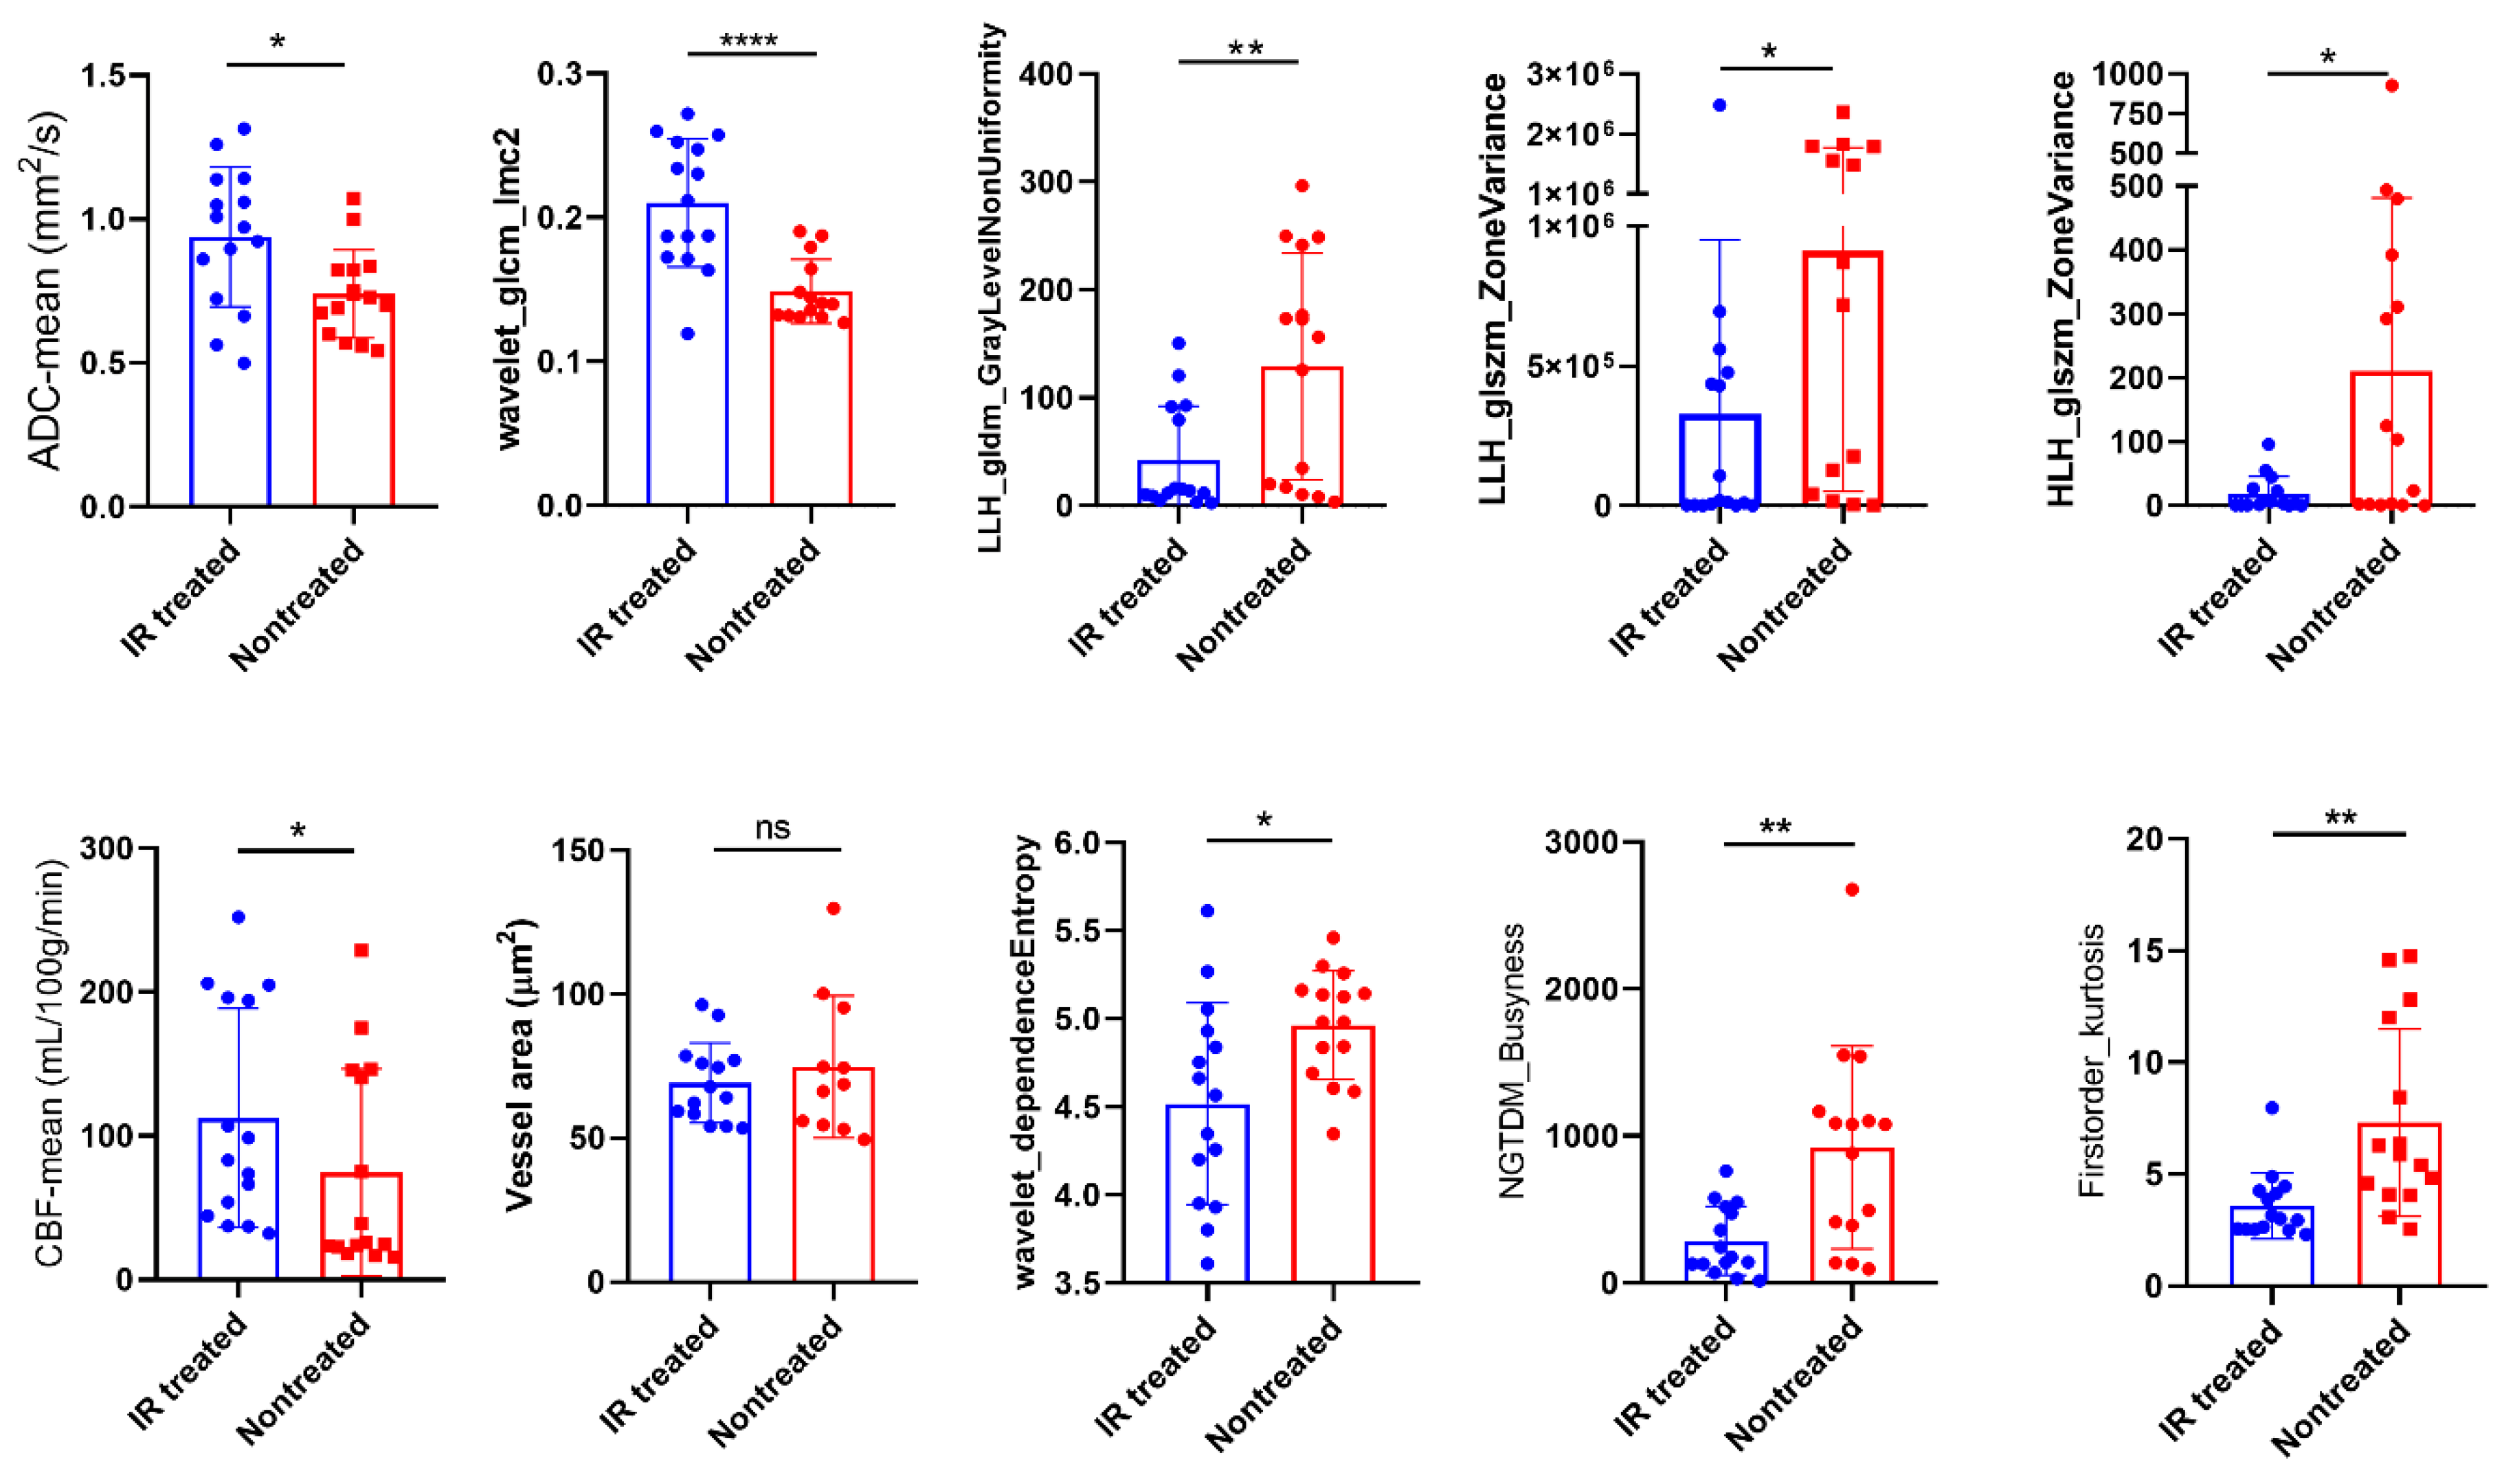
Figure 6.
Comparison of mouse orthotopic GBM tumours to GBM patients. Mouse orthotopic tumours share few similarities and several differences with central non-enhancing patient GBMs (mean ± SD, *p<0.05, **p<0.01, ***p<0.001, ****p<0.0001, one-way ANOVA, Dunnett correction for multiple comparisons): GL261 (n=5), CT-2A (n=6), NPE-IE (n=10), GBM96 (n=4), MGMT(+) (n=10), MGMT(-) (n=10).
Disclaimer/Publisher’s Note: The statements, opinions and data contained in all publications are solely those of the individual author(s) and contributor(s) and not of MDPI and/or the editor(s). MDPI and/or the editor(s) disclaim responsibility for any injury to people or property resulting from any ideas, methods, instructions or products referred to in the content. |
© 2025 by the authors. Licensee MDPI, Basel, Switzerland. This article is an open access article distributed under the terms and conditions of the Creative Commons Attribution (CC BY) license (http://creativecommons.org/licenses/by/4.0/).
Copyright: This open access article is published under a Creative Commons CC BY 4.0 license, which permit the free download, distribution, and reuse, provided that the author and preprint are cited in any reuse.


