
Submitted:
09 January 2025
Posted:
10 January 2025
You are already at the latest version
Abstract
Background/Objective:
This study investigates AI-driven radiomics for classifying and monitoring brain metastases progression and regression post-Gamma Knife radiosurgery (GKRS) using MRI imaging. A clinical decision support application was developed to enable real-time AI-based predictions for treatment monitoring.
Methods:
MRI scans from 60 patients (3194 images) were analyzed using a transfer learning-enhanced AlexNet deep learning model. Dynamic class weighting and data augmentation addressed class imbalance, ensuring fairness. Optimized preprocessing pipelines standardized datasets. Performance metrics—accuracy, precision, recall, F1-scores, and AUC—were evaluated with 95% confidence intervals. Longitudinal tumor volume analysis assessed predictive trends. A Streamlit-based application integrated AI predictions and visualizations for clinical usability.
Results:
The transfer learning model achieved 100% classification accuracy (95% CI: 100%–100%) with perfect precision, recall, and F1-scores. The AUC was 1.0000 (95% CI: 1.0000–1.0000), demonstrating flawless discrimination between progression and regression cases. Compared to a baseline AlexNet model (99.53% accuracy, 95% CI: 98.90%–100.00%), the TL model eliminated misclassifications. Tumor volume correlation analysis revealed baseline size as a key progression predictor (Pearson r = 0.795, p < 0.0001). Training time was 420.12 seconds, outperforming ResNet-50 (443.38s) and EfficientNet-B0 (439.87s) with identical metrics. While the model showed 100% accuracy, multi-center validation is needed for robustness.
Conclusions:
Transfer learning with dynamic class weighting provides an accurate and reliable framework for monitoring brain metastases post-GKRS. The AI-based application enhances diagnostic precision and reduces variability. Explainable AI techniques, such as Grad-CAM visualizations, improve interpretability and foster clinical adoption. These findings highlight AI’s potential in personalized treatment strategies, with applications in genomic profiling, survival modeling, and extended follow-ups. This study demonstrates AI’s role in reducing diagnostic variability and enabling personalized, data-driven treatment strategies for brain metastases management.
Keywords:
radiomics-based diagnosis
; deep learning in medical imaging
; brain metastases monitoring
; gamma knife radiosurgery outcomes
; ai-powered clinical decision support
1. Introduction
Artificial intelligence (AI) has emerged as a game-changing technology in medical imaging, enabling precise and automated analysis of complex patterns. Its applications range from cancer detection to treatment response monitoring, offering clinicians enhanced diagnostic accuracy and workflow efficiency.
Brain metastases (BM) represent the most common intracranial malignancies in adults, often originating from primary tumors in the lungs, breast, or skin (melanoma) [1]. Affecting approximately 20–40% of patients with advanced systemic cancers, BM significantly contribute to morbidity and mortality [2,3]. Accurate detection and monitoring of BM are critical for optimizing treatment strategies, especially for patients undergoing targeted therapies such as Gamma Knife radiosurgery (GKRS) [4,5].
Magnetic resonance imaging (MRI) remains the gold standard for diagnosing and tracking BM progression, offering high-resolution imaging through contrast-enhanced T1-weighted (CE T1w) and fluid-attenuated inversion recovery (FLAIR) sequences [6,7]. These techniques provide detailed visualization of lesion morphology, edema, and tumor activity. However, MRI interpretation poses challenges due to lesion complexity and variability among radiologists, leading to potential misdiagnoses, subjective evaluations, and diagnostic delays [8,9]. Such challenges highlight the urgent need for automated and objective evaluation tools to streamline clinical workflows.
1.1. Challenges in Post-Treatment Monitoring of BM
Following GKRS, differentiating between tumor progression and regression remains complex. Radiologists predominantly rely on visual inspection, which is susceptible to subjective biases and difficulties in distinguishing true progression from post-treatment effects like radiation necrosis. Consequently, there is a growing demand for advanced tools that enhance diagnostic precision and reduce inter-observer variability.
Despite promising results, AI applications in radiology face barriers to deployment, including variability in imaging protocols, interpretability of predictions, and compliance with regulatory standards. This study addresses these challenges by combining explainable AI techniques with a scalable and user-friendly application framework.
1.2. Artificial Intelligence (AI) and Radiomics in BM Classification
Artificial intelligence (AI), particularly deep learning (DL) approaches, has emerged as a transformative solution in medical imaging [10]. Convolutional neural networks (CNNs) have demonstrated superior performance in extracting and analyzing imaging features, surpassing traditional manual evaluation techniques [11,12]. AI-based radiomics enables the automated identification of complex patterns, reducing cognitive overload for radiologists and improving diagnostic consistency. Nevertheless, deep learning approaches often face overfitting issues when applied to small datasets, a prevalent constraint in medical imaging studies [13,14].
1.3. Transfer Learning as a Solution
To address dataset limitations, transfer learning leverages pre-trained models such as AlexNet, originally trained on large datasets, and fine-tunes them for specialized medical applications [15,16]. This approach retains general feature extraction capabilities while enabling adaptation to specific tasks, thus improving accuracy and reducing overfitting risks [17,18].
1.4. Study Objectives
While previous studies focused on static imaging features for BM classification, this work advances the field by incorporating longitudinal tumor volume analysis and survival trends, providing dynamic insights into treatment outcomes. Additionally, the development of a user-friendly decision-support tool bridges the gap between AI models and clinical applicability.
This study evaluates the performance of transfer learning using AlexNet for classifying BM progression and regression post-GKRS based on MRI imaging. The work further demonstrates the integration of AI-based radiomics with a user-friendly application, enabling real-time clinical decision support for BM monitoring. Unlike previous studies, this research incorporates longitudinal tumor volume analysis and survival trends, offering deeper insights into disease progression and patient outcomes.
1.5. Clinical Relevance
The accurate prediction of treatment responses and outcomes is pivotal in BM management. While GKRS effectively controls tumor growth and minimizes radiation-induced damage, assessing tumor evolution post-treatment remains challenging. Current reliance on subjective interpretations underscores the need for AI-driven radiomics to provide standardized, automated, and reproducible assessments. This study aims to fill this gap by presenting an innovative tool that facilitates precision medicine through automated classification and monitoring.
1.6. Key Contributions
This study introduces an AI-powered radiomics framework integrating transfer learning and longitudinal tumor volume analysis to improve BM monitoring. It further presents a user-friendly clinical decision support tool, paving the way for personalized treatment strategies.
1.7. Limitations and Future Directions
While this study demonstrates promising results, it is important to note limitations such as the small sample size, single-center data source, and reliance on MRI as the sole imaging modality. Future studies should focus on expanding datasets, incorporating multimodal imaging, and validating results prospectively to ensure broader clinical applicability [19,20].
- Dataset Constraints: The limited sample size (60 patients) necessitates validation on larger, multi-center datasets for improved generalizability.
- Single-Modality Imaging: Reliance solely on MRI excludes functional insights available from PET/CT scans, which could further refine predictions.
- Model Architecture: Although AlexNet performs well, newer architectures like ResNet and EfficientNet may offer enhanced performance and should be explored.
- Future research should focus on:
- Expanding datasets and validating findings across diverse populations.
- Incorporating multimodal imaging to enhance prediction accuracy.
- Integrating genomic and molecular data to develop multi-omics frameworks.
- Enhancing existing explainable AI (XAI) models to further improve transparency, clinician adoption, and interpretability of predictions.
- Extending follow-up studies to assess long-term recurrence and survival patterns.
1.8. Structure of the Paper
This paper is organized as follows:
- Chapter 2: Materials and Methods - Describes patient demographics, imaging protocols, and AI model implementation, including the development of the application.
- Chapter 3: Results - Presents classification performance, survival trends, and volumetric analyses.
- Chapter 4: Discussion - Evaluates findings in the context of prior research, emphasizing AI’s clinical implications and areas for further exploration.
- Chapter 5: Conclusions - Summarizes key findings, highlights limitations, and proposes future directions for advancing AI-based radiomics in BM monitoring.
2. Materials and Methods
2.1. Study Population
This study analyzed MRI scans from 60 patients diagnosed with brain metastases (BM) who underwent Gamma Knife radiosurgery (GKRS) (58 with mask, 1 with Vantage frame and 1 with G-frame) at the Gamma Knife Stereotactic Radiosurgery Laboratory between July 18, 2022, and July 18, 2024.
2.1.1. Inclusion Criteria
- Histologically confirmed primary cancer with evidence of brain metastases.
- Patients treated exclusively with GKRS without prior whole-brain radiation therapy.
- Availability of pre-treatment and follow-up MRI scans.
- Karnofsky Performance Status (KPS) score greater than 70.
2.1.2. Exclusion Criteria
- Presence of multiple neurological disorders unrelated to BM.
- Incomplete MRI imaging or clinical follow-up data.
- Prior neurosurgical resection before GKRS.
2.1.3. Demographics and Clinical Features
The patient cohort included 37 males and 23 females, aged between 40 and 82 years (median 65 years). Figure 1 illustrates the gender distribution within the study cohort, highlighting a clear predominance of male patients (61.67%).
Figure 2 shows the age distribution of participants, with the majority falling within the 50–79 age range, supporting a focus on middle-aged and elderly populations.
Tumor volumes ranged from 0.6 cm³ to 82 cm³ (9.2 cm3 median). Figure 3 illustrates the distribution of tumor volumes among the study population. The majority of tumors fell within the 0–30 cm³ range, indicating a predominance of small-to-medium-sized metastases. Notably, fewer patients exhibited tumor volumes exceeding 50 cm³, reflecting a lower prevalence of larger tumors in this cohort.
Figure 4 provides an overview of primary tumor origins, with lung cancer being the most common source of metastases (53%).
All patients had a Karnofsky score exceeding 70, indicating relatively preserved functional status at baseline.
While the dataset reflects a diverse range of tumor sizes and patient characteristics, the predominance of male patients (61.67%) and smaller tumors may introduce biases that limit generalizability. Future studies should validate these findings across larger, multi-center cohorts to account for demographic and clinical variability.
This study was conducted at a single-center Gamma Knife facility in Romania, which employs a unique three-stage treatment protocol for brain metastases. While multi-center datasets are often recommended for validation, the limited availability of Gamma Knife systems in Romania (two centers, with the second center recently operational and employing different protocols) restricts cross-center data pooling. To mitigate this limitation, rigorous internal validation was performed using separate training, validation, and test splits with stratified sampling. Furthermore, future studies will seek collaborations with international centers following comparable protocols to validate our findings in larger and more diverse datasets.
2.1.4. Imaging Distribution
MRI scans comprised 3194 images, including 2320 labeled as regression and 874 as progression. This dataset was used for training, validation, and testing phases.
The detailed demographic characteristics and tumor profiles provides a diverse dataset, supporting model generalizability.
2.2. MRI Imaging Protocol
Gamma Knife radiosurgery (GKRS) treatment planning mandates the use of MRI imaging due to its superior soft-tissue contrast and spatial resolution. MRI is the gold standard for brain metastases evaluation, enabling precise delineation of tumor boundaries and treatment targets. PET-CT and other modalities, while valuable for systemic staging or metabolic assessment, are not integrated into the GKRS workflow, as they do not influence radiosurgical planning. Consequently, this study focuses solely on MRI-based evaluations, aligning with current clinical practices.
MRI scans were performed using a 1.5 Tesla scanner with standard imaging protocols optimized for brain metastases evaluation. The sequences included:
- T1-weighted Contrast-Enhanced (CE T1w): Emphasizing lesion boundaries and tumor enhancement.
- FLAIR (Fluid-Attenuated Inversion Recovery): Highlighting peritumoral edema and enhancing lesion contrast.
2.2.1. Imaging Parameters
- CE T1w: TR = 500–700 ms, TE = 10–20 ms, slice thickness = 1 mm.
- FLAIR: TR = 9000–11000 ms, TE = 120–140 ms, slice thickness = 1.5 mm.
Images were acquired in axial, coronal, and sagittal planes to ensure comprehensive anatomical coverage. All MRI datasets were anonymized, preprocessed, and reviewed for quality prior to analysis.
All MRI scans underwent intensity normalization and artifact removal to ensure consistency across datasets. Variations in scanner calibration were minimized using histogram matching techniques during preprocessing.
2.3. Deep Learning Stages of Image Classification
This study employed a deep learning framework to classify MRI images of brain metastases into two categories: progression and regression. The classification process involved multiple stages, from data loading and transformation to training a convolutional neural network (CNN) based on AlexNet architecture. The workflow is detailed below:
2.3.1. Dataset Preparation
The dataset consisted of MRI images stored in separate directories for “progression” and “regression.” Key steps included:
Data Loading: Image file paths were collected using Python’s glob module, followed by splitting the dataset into training (80%), validation (10%), and testing (10%) subsets using train_test_split from sklearn. Stratification was used to maintain class balance across splits.
Labeling: Labels were derived from directory names, assigning 1 for progression and 0 for regression.
Data Transformation: Two sets of transformations were applied:
Training Data: Random resized cropping, horizontal flipping, rotation (±20 degrees), and resizing to 256x256 pixels, followed by normalization.
Testing and Validation Data: Resizing to 256x256 pixels without augmentation for consistency.
Data augmentations, such as rotation and flipping, were chosen to enhance model robustness while preserving anatomical integrity [21]. However, the potential limitations of such transformations, particularly in medical imaging, warrant further investigation in larger datasets.
2.3.2. Custom Dataset and DataLoader
A custom Dataset class was implemented to manage image loading and labeling. DataLoader instances were created for training, validation, and testing datasets, enabling efficient batch processing. Additionally, image preprocessing pipelines were optimized for scalability and performance.
2.3.3. AlexNet Architecture
The AlexNet model, a widely used CNN for image classification, was modified for binary classification:
- Convolutional Layers: The model employed a series of convolutional layers with ReLU activations and max-pooling to extract spatial features from the images.
- Adaptive Average Pooling: To reduce feature maps to a fixed size before passing them to the fully connected layers.
- Fully Connected Layers: Three fully connected layers were used, with dropout to prevent overfitting. The final layer had two outputs corresponding to the binary classes.
- Activation Function: ReLU was used throughout the network for non-linearity, while the output layer utilized a softmax-like function within the cross-entropy loss function.
2.3.4. Training and Optimization
To mitigate overfitting, this study employed dropout layers within the fully connected layers of the AlexNet architecture, with a dropout rate of 0.5. This approach reduces co-adaptation of neurons during training, improving generalization performance. Additionally, L2 regularization (weight_decay = 1e-4) was applied to penalize large weights, further enhancing model robustness. Future work may explore ensemble modeling techniques and advanced architectures to further improve prediction stability.
- Loss Function: Cross-entropy loss was used to compute classification error.
- Optimizer: The Adam optimizer with a learning rate of 0.0001 was employed for efficient gradient-based optimization.
-
Training Procedure:
- ○
- The training process was implemented on Google Colab, utilizing A100 GPU acceleration and High-RAM to improve computational efficiency.
- ○
- During each epoch, the model was trained on batches of training data and evaluated on validation data.
- ○
- For each batch, images were passed through the model to compute predictions, and the loss was calculated. Gradients were computed via back-propagation and weights were updated.
- ○
- Validation accuracy and loss were monitored at the end of each epoch to evaluate generalization performance.
2.3.5. Reproducibility
To ensure reproducibility, random seeds were fixed for Python, NumPy, and PyTorch. PyTorch-specific options, such as torch.backends.cudnn.deterministic, were enabled to ensure consistent results. Additional checkpoints were saved after every epoch to allow model recovery and analysis.
2.3.6. Results and Visualization
- The model was trained for 60 epochs, achieving convergence with a strong balance between training and validation performance.
- Training and validation loss, as well as accuracy, were plotted to visualize model performance over epochs, highlighting consistent improvement.
- Final testing on unseen data demonstrated the robustness of the model
Figure 5.
Training and Validation Accuracy and Loss curves for the AlexNet 60 epochs model training.
Figure 5.
Training and Validation Accuracy and Loss curves for the AlexNet 60 epochs model training.
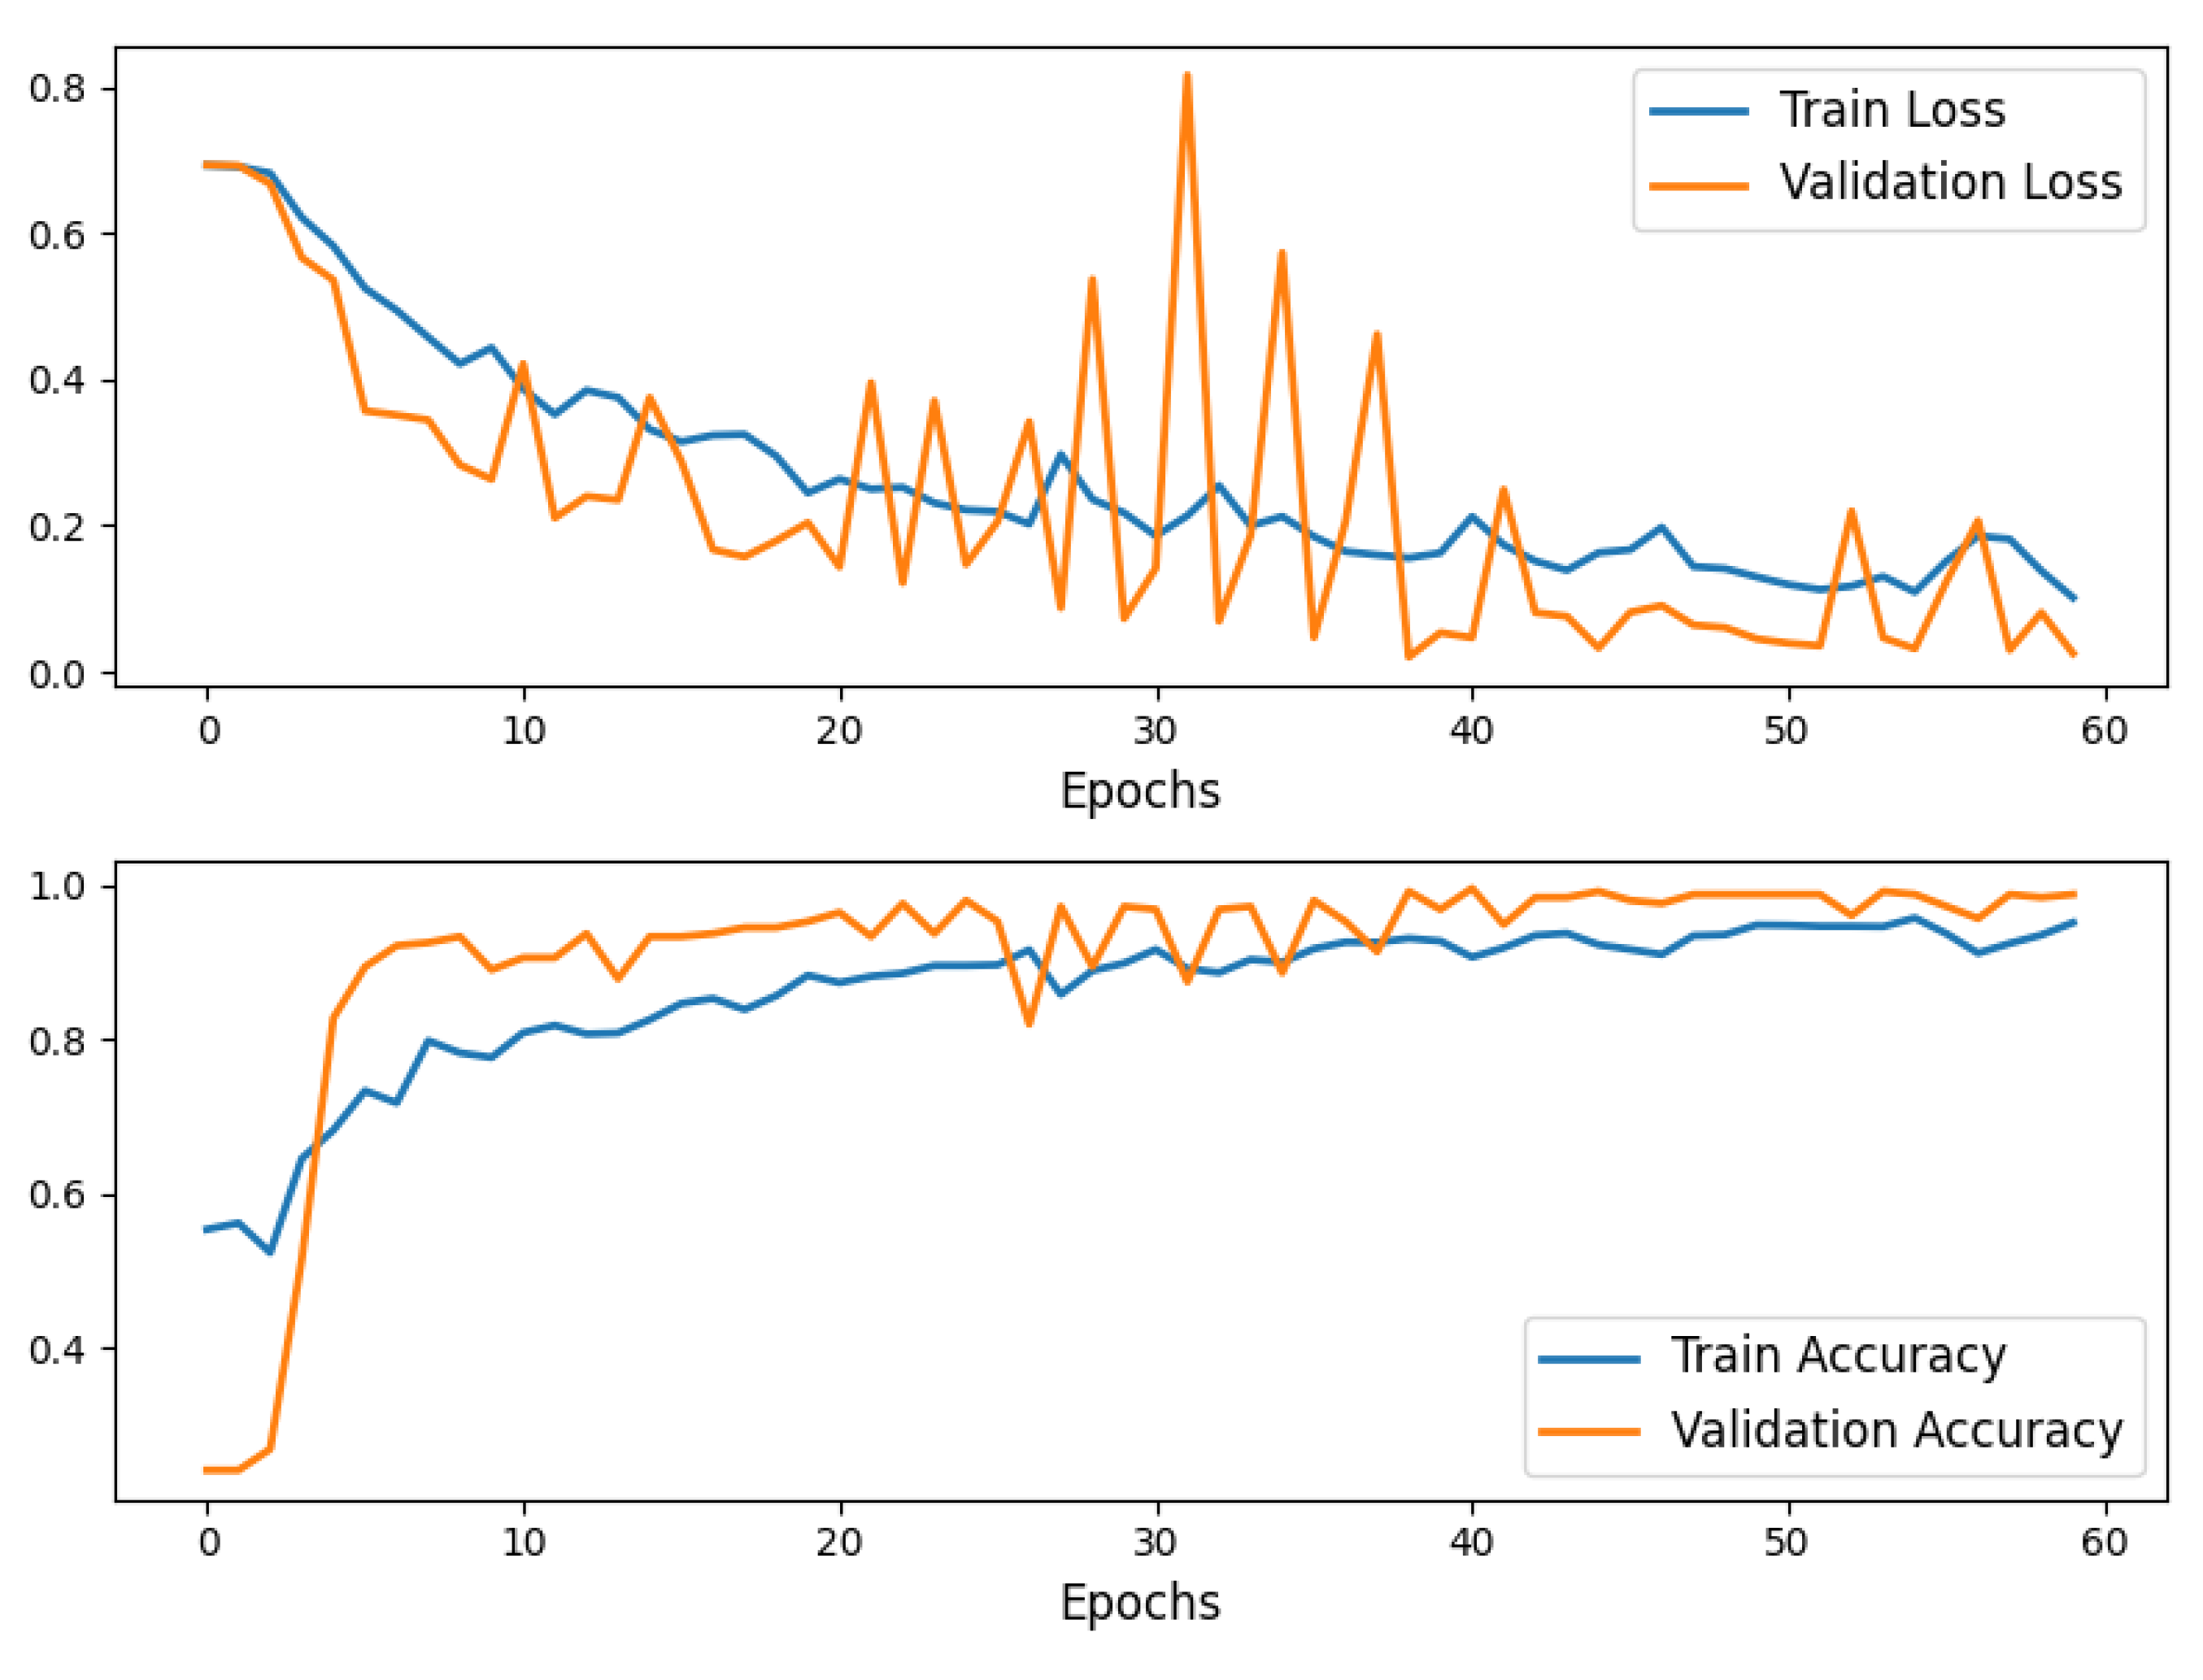
This end-to-end workflow demonstrates the application of AlexNet in classifying brain metastases progression and regression, showcasing a structured approach to medical image analysis using deep learning.
2.3.7. Transfer Learning with Pre-Trained AlexNet
Model Adaptation AlexNet, pre-trained on the ImageNet dataset, was used as the base architecture. Transfer learning was employed to adapt AlexNet for binary classification:
- Freezing Pre-trained Layers: The feature extraction layers of AlexNet were frozen to retain learned general features.
- Classifier Modification: The final fully connected layer of the AlexNet classifier was replaced with a new linear layer to output two classes (progression and regression). This modification allowed fine-tuning for the specific task.
Activation Functions
ReLU (Rectified Linear Unit) was used as the activation function in all layers of the network to introduce non-linearity and enable the model to learn complex patterns. For the final output layer, softmax-like behavior was embedded within the cross-entropy loss function, which directly mapped logits to class probabilities.
Justification for AlexNet AlexNet was chosen due to its proven effectiveness in image classification tasks, particularly in the medical imaging domain. Its architecture is well-suited for extracting hierarchical spatial features, making it ideal for MRI-based lesion detection and classification. Additionally, AlexNet’s pre-trained weights on ImageNet provide a strong starting point, enabling faster convergence and improved performance with limited medical datasets. Its relatively simpler architecture also reduces computational demands compared to more complex models like ResNet or DenseNet, making it easier to implement and fine-tune.
Limitations of AlexNet Despite its strengths, AlexNet has limitations. It may underperform with very complex patterns due to its shallower architecture compared to modern deep learning networks. Furthermore, its reliance on fixed-size input dimensions (256x256 pixels) might require preprocessing steps that can introduce artifacts. Future studies could explore newer architectures, such as ResNet or EfficientNet, which offer improved depth and feature extraction capabilities.
Consequently, AlexNet was chosen for its computational efficiency, interpretability, and proven effectiveness in medical imaging tasks. While its architecture supports ease of implementation, future research should explore advanced models, such as ResNet and EfficientNet, to assess whether deeper architectures can further improve performance without compromising usability.
2.3.8. Training and Optimization
Loss Function
Cross-entropy loss was used to compute classification error, comparing predicted class probabilities with ground truth labels.
Optimizer
The Adam optimizer was employed with a learning rate of 0.0001 to ensure efficient weight updates during training. This optimizer was chosen for its adaptive learning rate capabilities and robustness in handling sparse gradients.
Handling Class Imbalance with Dynamic Class Weights.
In our dataset, the two classes (“regression” vs. “progression”) are imbalanced, resulting in poorer recognition performance for the minority class. Class imbalance is addressed using weighted loss functions to enhance minority class recognition. Future studies will incorporate external validation datasets to further assess performance stability across class distributions. We employed a weighted cross-entropy loss wherein each class receives a weight proportional to the inverse of its frequency in the training set. Specifically, for each class i, we computed the weight wi by:
For our dataset, this yielded class weights [1.36, 3.76]. During training, these weights were passed to the loss function, causing misclassifications of the minority class to be penalized more heavily. As a result, the model was encouraged to devote increased attention to the minority class, thereby improving its overall performance on both classes.
Training Process
The training process involved:
- Forward Pass: MRI images were passed through the model to generate predictions.
- Loss Computation: The cross-entropy loss was calculated based on predictions and true labels.
- Backward Pass and Optimization: Gradients were computed via back-propagation, and the model weights were updated using the Adam optimizer.
- Validation: After each epoch, the model was evaluated on the validation set to monitor generalization performance.
Training was conducted over 60 epochs, with performance metrics (loss and accuracy) logged for both training and validation sets. Random seeds were fixed to ensure reproducibility.
2.3.9. Performance Evaluation
Training History
The model’s training and validation loss and accuracy were recorded at each epoch. These metrics were plotted to visualize convergence and assess model performance over time. Consistent improvements in both training and validation metrics highlighted the effectiveness of transfer learning.
Final Testing
The model was evaluated on an independent test set to assess its ability to generalize to unseen data.
2.3.10. Visualization of Results
To provide insights into the model’s training dynamics:
- Training and validation loss curves were plotted, showing steady convergence.
- Accuracy curves for training and validation demonstrated consistent improvement.
- The results were saved in CSV format and visualized as PNG plots for further analysis.
Figure 6.
Training and Validation Loss and Accuracy curves for Transfer Learning with Pre-trained AlexNet60 epochs model training.
Figure 6.
Training and Validation Loss and Accuracy curves for Transfer Learning with Pre-trained AlexNet60 epochs model training.
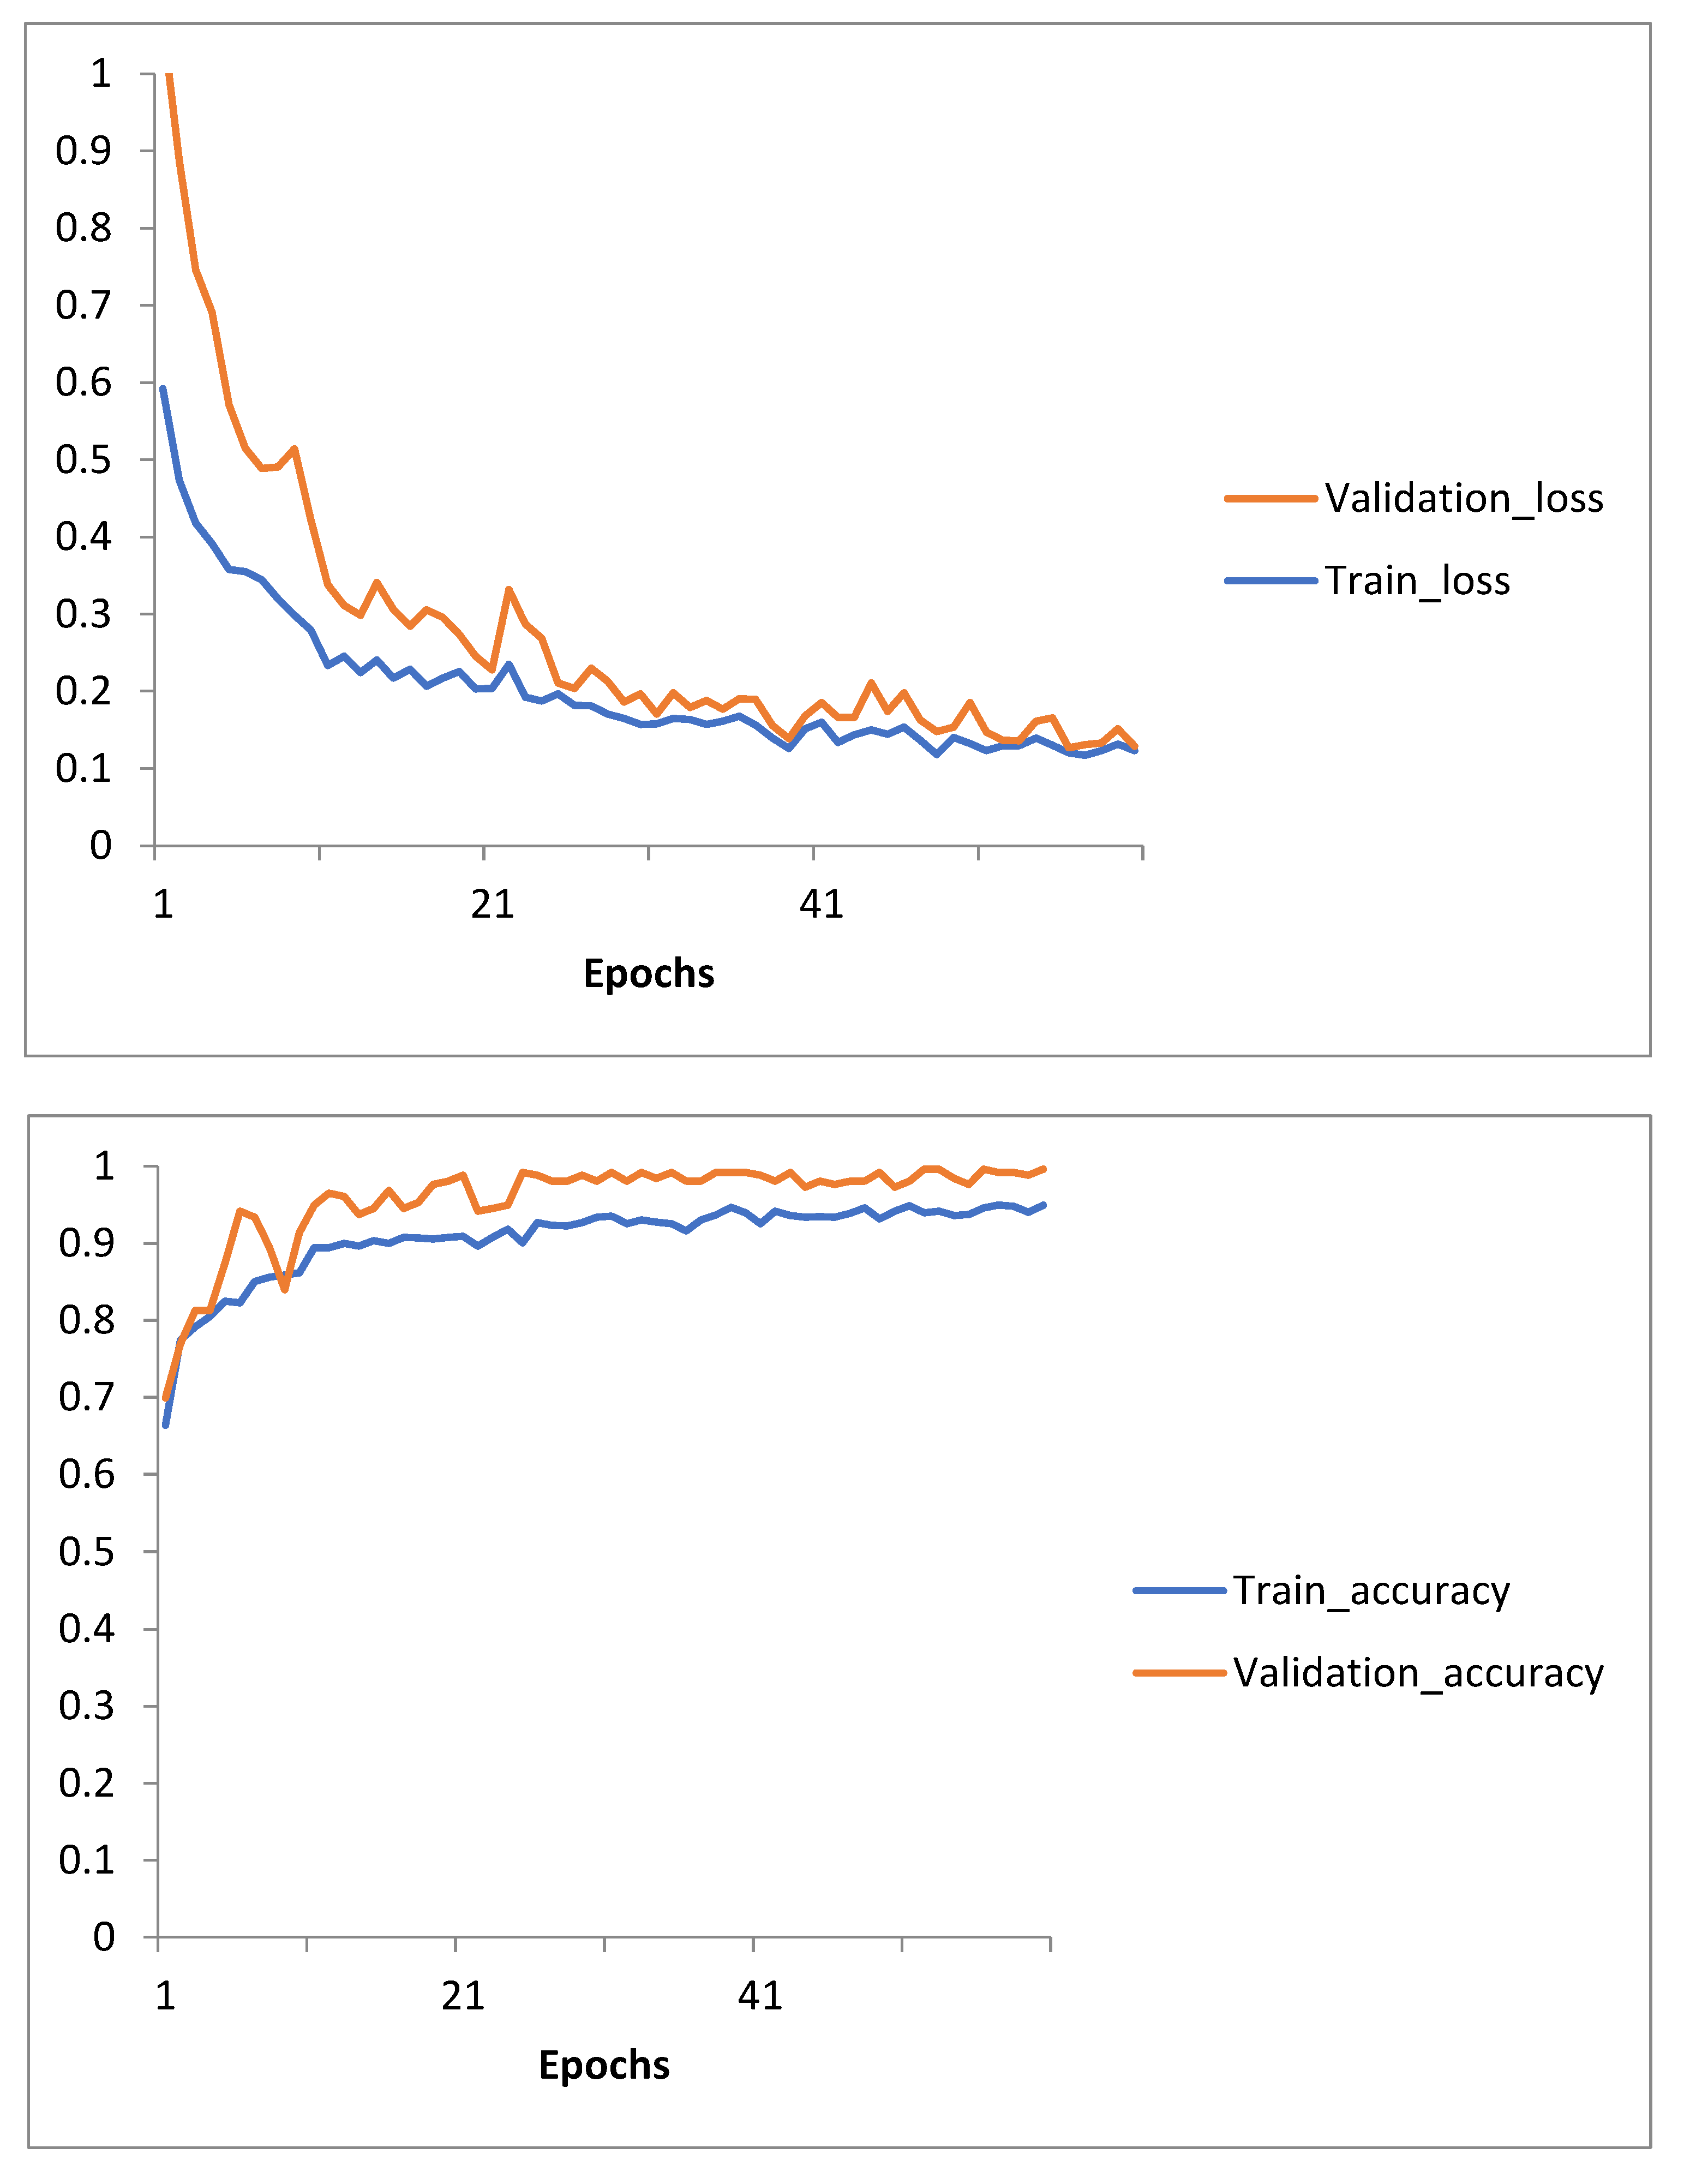
This structured approach highlights the application of transfer learning with AlexNet, showcasing its efficiency in classifying brain metastases progression and regression with high accuracy and robustness.
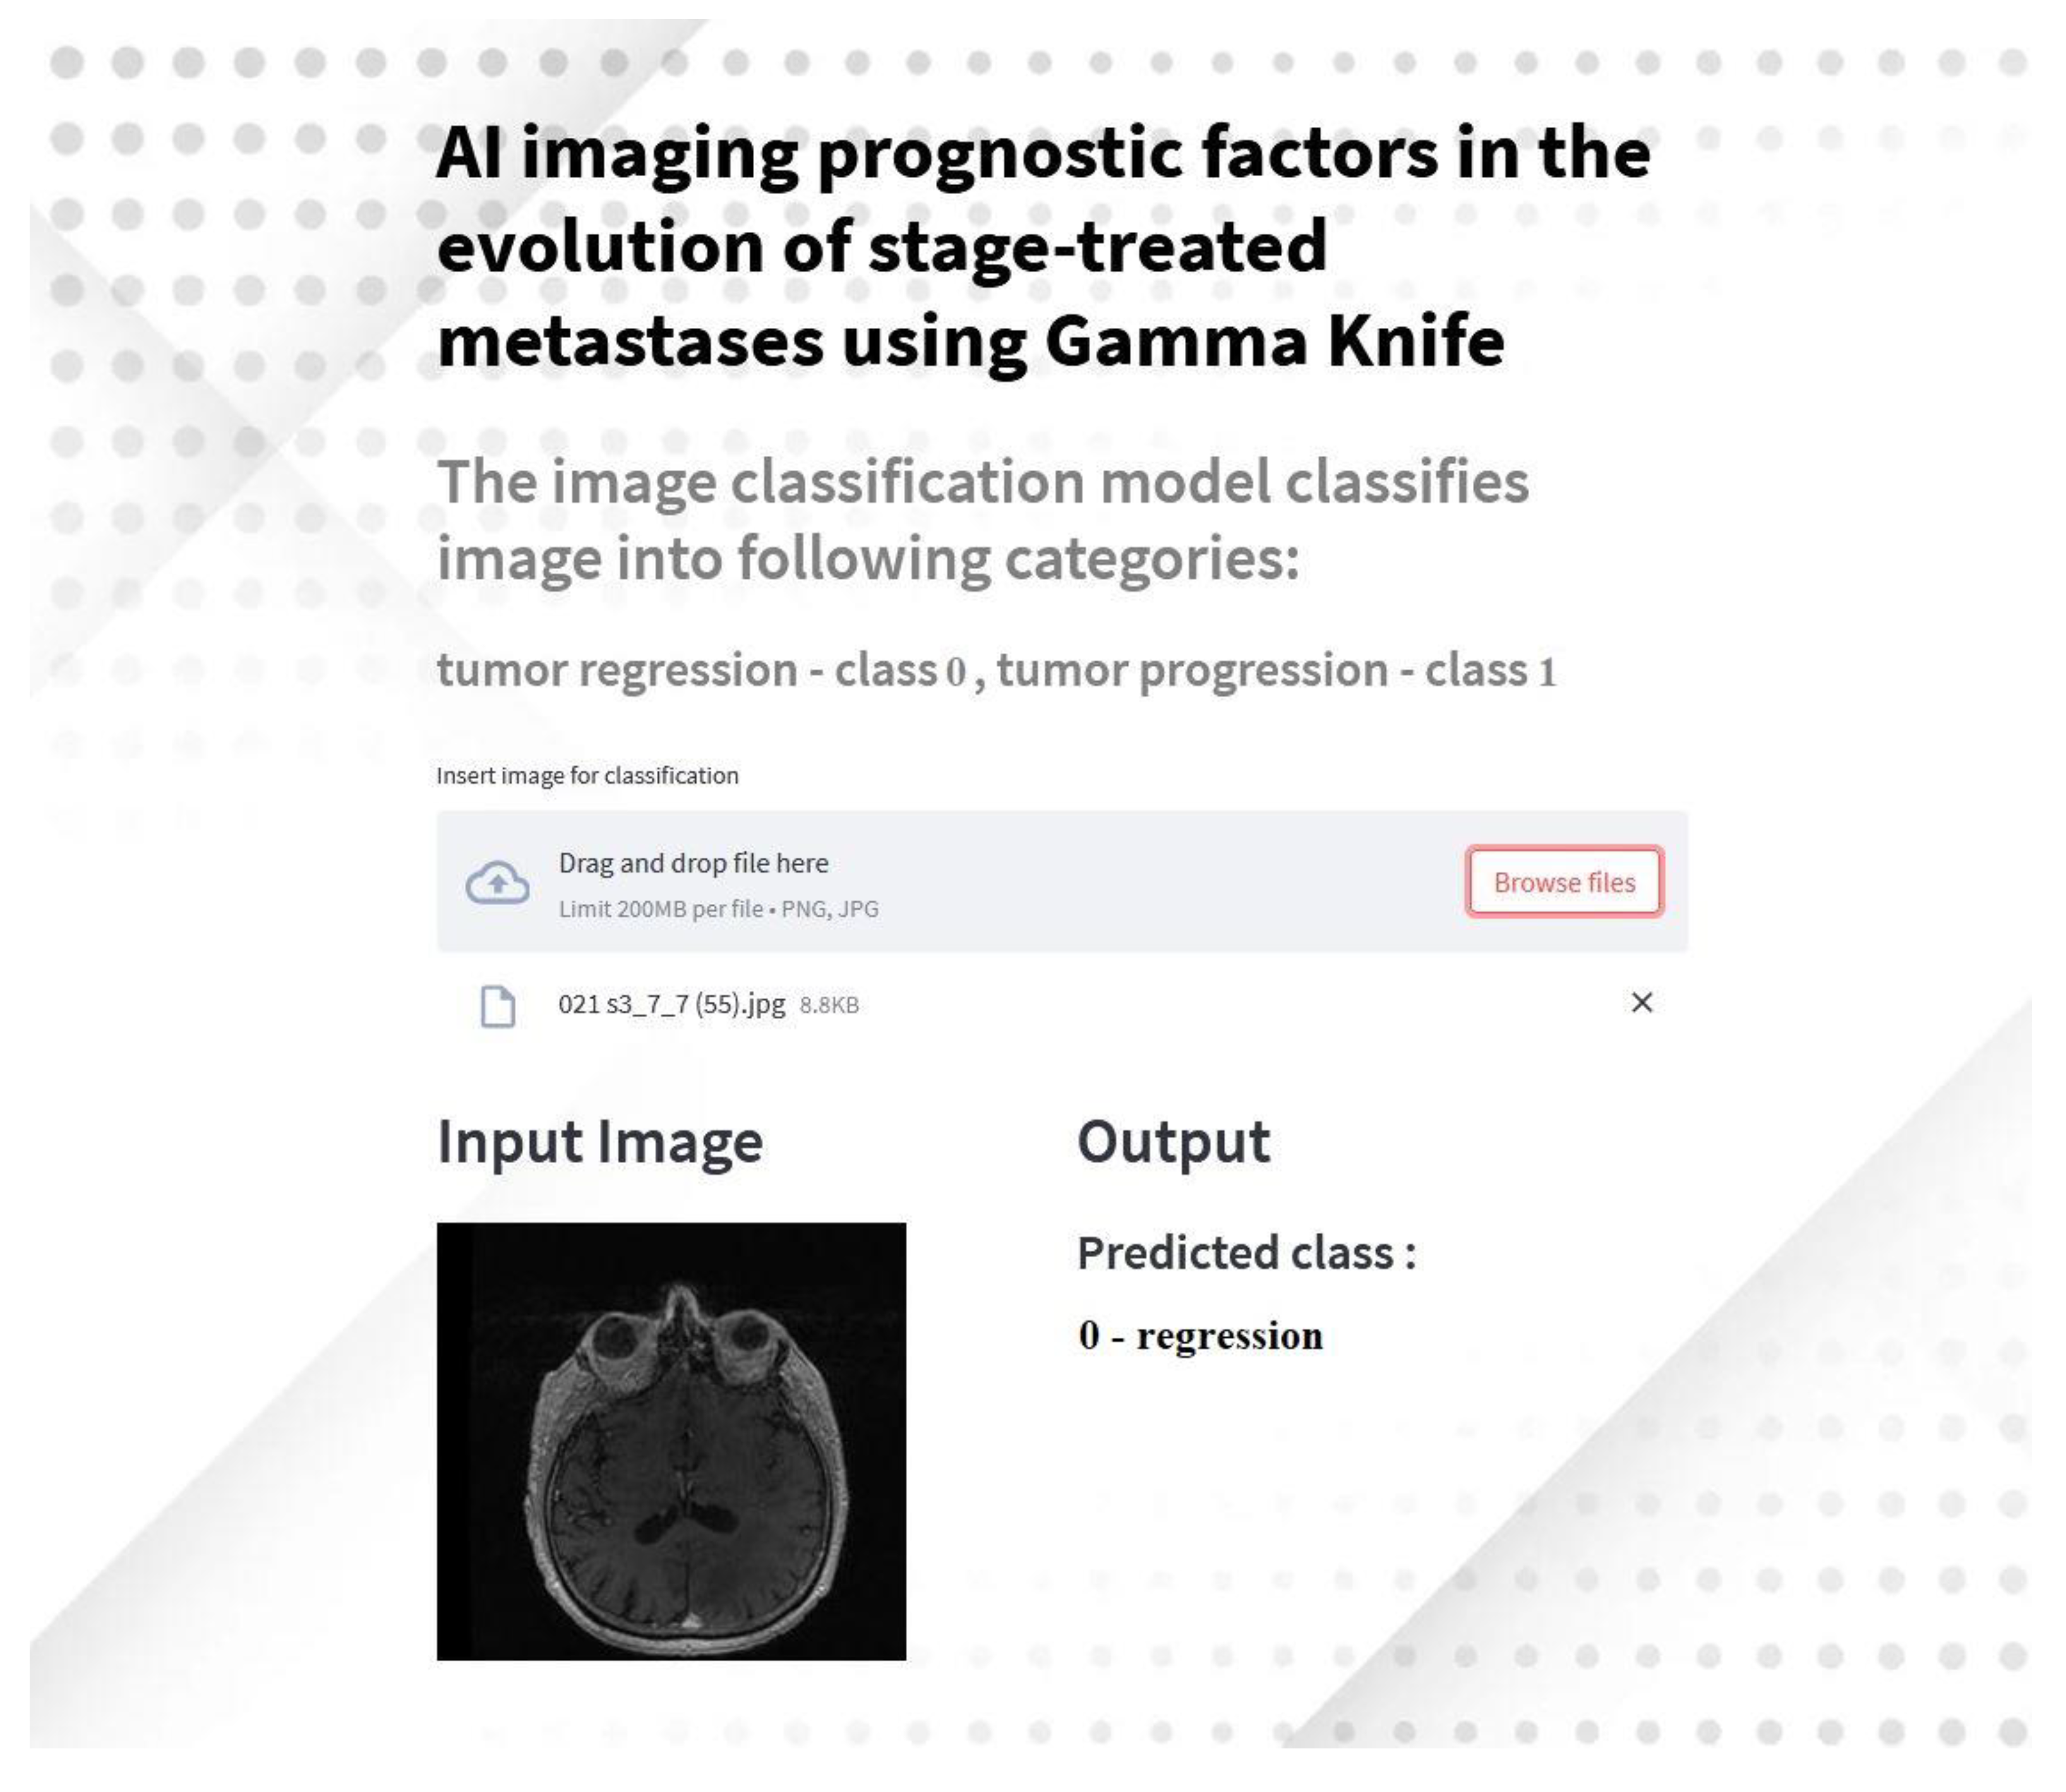
2.4. Development of a Streamlit Application for Tumor Classification
In this study, we extended the AI-based imaging analysis by developing a Streamlit application to predict brain tumor regression or progression based on MRI images. This application is designed to provide an accessible and interactive interface for clinicians and researchers to analyze brain metastases using deep learning models.
2.4.1. Application Overview
The application utilizes the transfer learning of the AlexNet model, trained and fine-tuned for binary classification of brain metastases into regression (class 0) and progression (class 1). It integrates advanced preprocessing techniques and real-time predictions, making it a versatile tool for medical imaging analysis.
2.4.3. Workflow
- Model Preparation: The AlexNet model weights are downloaded and loaded into the application.
- Image Upload: Users can upload MRI images in PNG or JPG format.
- Preprocessing: Images are resized to 224x224 pixels and normalized using the preprocessing pipeline implemented during model training.
- Prediction: The image is passed through the AlexNet model, and predictions are displayed in real-time, indicating whether the tumor is classified as regression or progression.
- Visualization: Both input and output are displayed side-by-side for easy interpretation.
2.4.2. Implementation Details
The application was built using Python and the Streamlit framework. The key implementation features include:
- Model Integration: The pre-trained AlexNet model, fine-tuned with custom fully connected layers, was employed for classification.
- User Interface: An intuitive and user-friendly interface allows users to upload MRI images for analysis.
- Preprocessing Pipeline: Input images are resized, normalized, and preprocessed to match the input requirements of the AlexNet model.
- Dynamic Background and Styling: The interface is visually enhanced with dynamic backgrounds and custom styles for improved usability.
- Deployment: The application is hosted on GitHub and can be accessed remotely.
2.4.4. Results and Demonstration
The application demonstrated high accuracy in classification during testing, consistent with the performance of the underlying AlexNet model. Predictions are displayed within seconds, providing immediate feedback to users.
Figure 7.
Screenshot of the Streamlit application predicting tumor classification based on MRI input images.
Figure 7.
Screenshot of the Streamlit application predicting tumor classification based on MRI input images.
2.4.5. Availability and Accessibility
The source code and application are hosted on GitHub and can be accessed at the following repository [22].
This interactive application serves as a practical tool for leveraging AI in clinical workflows, enabling clinicians to make faster and more informed decisions regarding the treatment of brain metastases.
While the application demonstrated effective tumor classification, further usability studies are needed to optimize interface design and integration with clinical workflows. Pilot testing with radiologists and oncologists should evaluate interpretability, response times, and user satisfaction. Feedback can guide interface enhancements and assess deployment feasibility in clinical practice. Additionally, interoperability with PACS systems and scalability testing should be prioritized for broader adoption.
2.5. Explainability and Visualization Methods
To enhance interpretability, we implemented Grad-CAM and SmoothGrad techniques, enabling visualization of regions most influential in model decisions (see Figure 8) [23]. Grad-CAM and SmoothGrad visualizations were compared with radiologists’ assessments, showing high concordance in identifying regions of tumor progression or regression. These visualizations facilitated clinical validation and improved trust in AI predictions. This approach aligns AI predictions with radiological features, fostering trust and clinical adoption.
The left image in Figure 8 shows the Grad-CAM heatmap, highlighting regions of interest contributing to the AI model’s prediction. The right image presents the SmoothGrad-like Grad-CAM heatmap, which reduces noise and provides a smoother visualization. Both approaches focus on lesion areas, enhancing model interpretability and enabling clinicians to validate AI predictions based on imaging features.
3. Results
3.1. Model Performance
3.1.1. AlexNet (Without Transfer Learning)
The AlexNet model, trained from scratch for binary classification (regression vs. progression), achieved a high accuracy of 99.53% (95% CI: 98.90%–100.00%). Precision, recall, and F1-scores were 99.01% (95% CI: 97.37%-100.00%), 99.50% (95% CI: 98.42%-100.00%), and 99.26% (95% CI:98.30%-100.00%), respectively, across all classes. The area under the curve (AUC) was 0.9998 (95% CI: 0.9995–1.0000), highlighting excellent discriminatory ability. These results confirm the robustness of the model even without transfer learning, although minor misclassifications were observed.
The classification report highlighted the following:
- Regression: Precision = 100%, Recall = 100%, F1-Score = 100%
- Progression: Precision = 99%, Recall = 100%, F1-Score = 99%
-
Overall Metrics:
- ○
- Macro Average: Precision = 99%, Recall = 100%, F1-Score = 99%
- ○
- Weighted Average: Precision = 100%, Recall = 100%, F1-Score = 100%
Error analysis revealed that misclassifications in the non-TL model were associated with ambiguous lesion boundaries and overlapping intensity patterns. Grad-CAM visualizations confirmed these regions contributed to model uncertainty, highlighting the need for additional multimodal imaging.
Figure 8.
Confusion matrix (a) and ROC curve (b) for AlexNet without Transfer Learning.
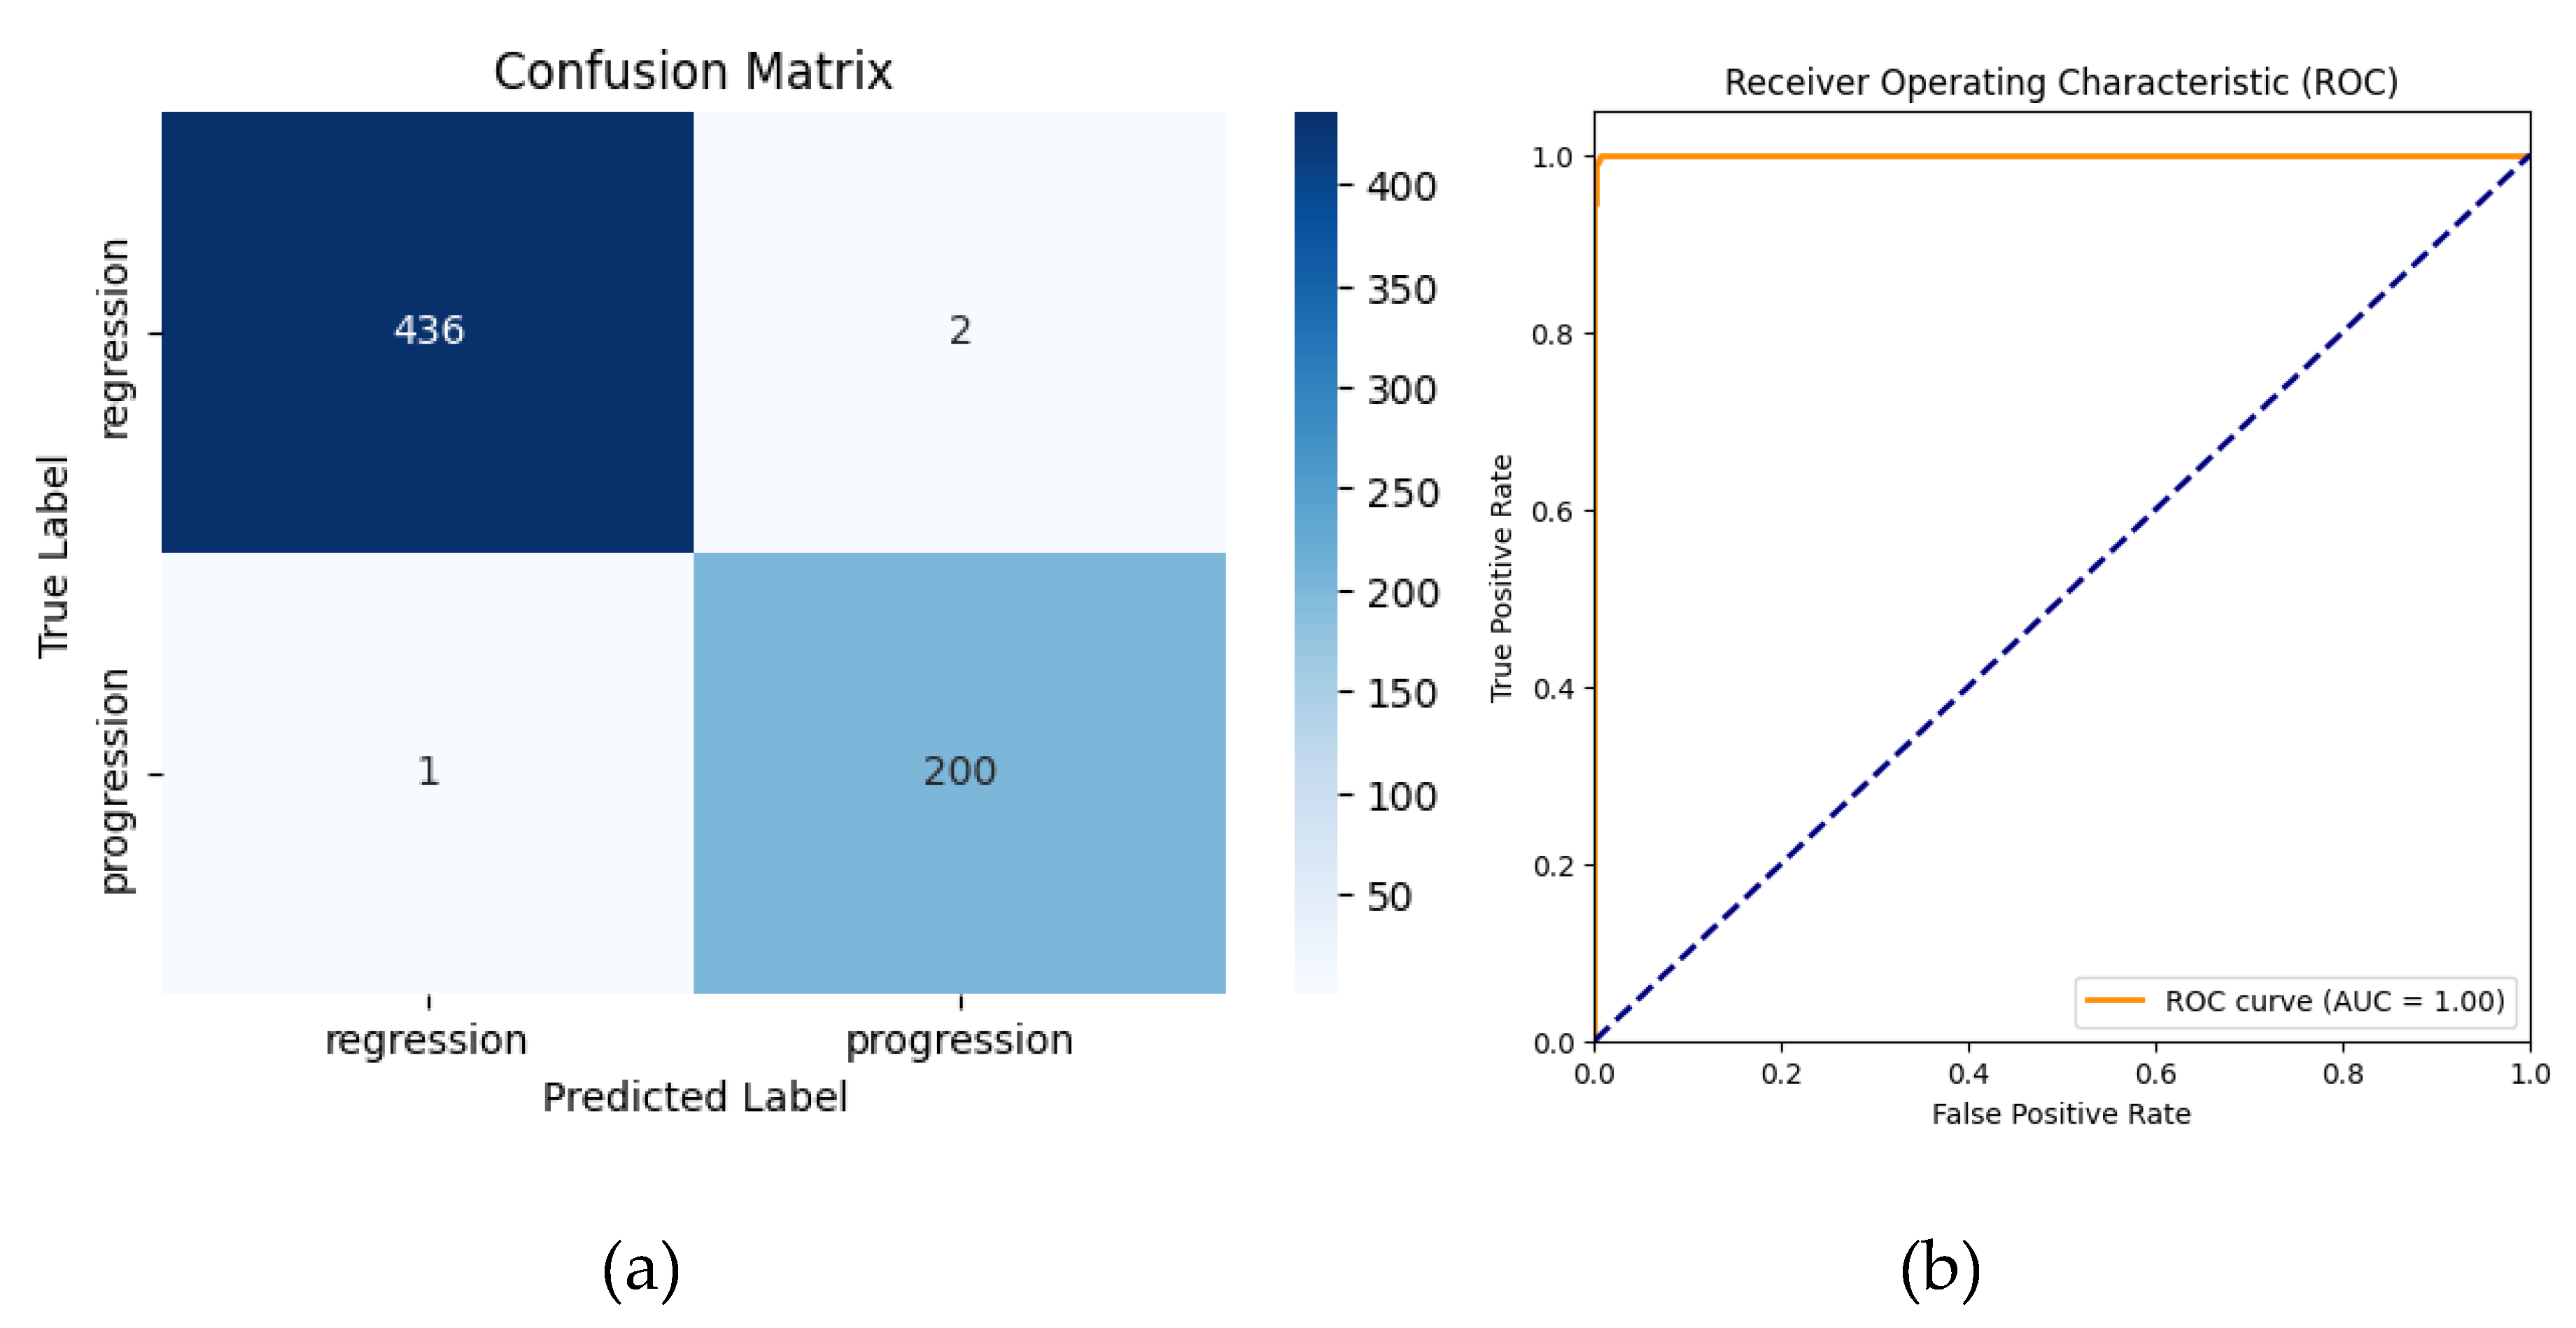
The confusion matrix shows that 1 progression case was misclassified as regression and 2 regressions cases were misclassified as progressions.The receiver operating characteristic (ROC) curve yielded an area under the curve (AUC) of 1.00, reflecting the model’s strong discriminatory ability.
3.1.2. Transfer Learning (TL) AlexNet
The application of transfer learning using a pre-trained AlexNet model led to significant improvements in classification performance. The application of transfer learning using a pre-trained AlexNet model led to perfect classification performance. The TL-enhanced model achieved 100% accuracy (95% CI: 100%–100%) along with 100% precision, recall, and F1-scores (95% CI: 100%–100%) across all classes. The AUC also achieved 1.0000 (95% CI: 1.0000–1.0000), indicating flawless discrimination between regression and progression cases. These results demonstrate that transfer learning effectively eliminated the minor misclassifications observed with the non-TL approach, achieving an ideal balance of sensitivity and specificity.
The classification report for the TL model demonstrated:
- Regression: Precision = 100%, Recall = 100%, F1-Score = 100%
- Progression: Precision = 100%, Recall = 100%, F1-Score = 100%
-
Overall Metrics:
- ○
- Macro Average: Precision = 100%, Recall = 100%, F1-Score = 100%
- ○
- Weighted Average: Precision = 100%, Recall = 100%, F1-Score = 100%
Despite achieving 100% performance metrics, these findings must be interpreted with caution due to the small dataset size, which increases the risk of overfitting. Further studies should employ multi-center datasets and stratified k-fold cross-validation to confirm robustness and generalizability.
Figure 9.
Confusion matrix (a) and ROC curve (b) for AlexNet with Transfer Learning.
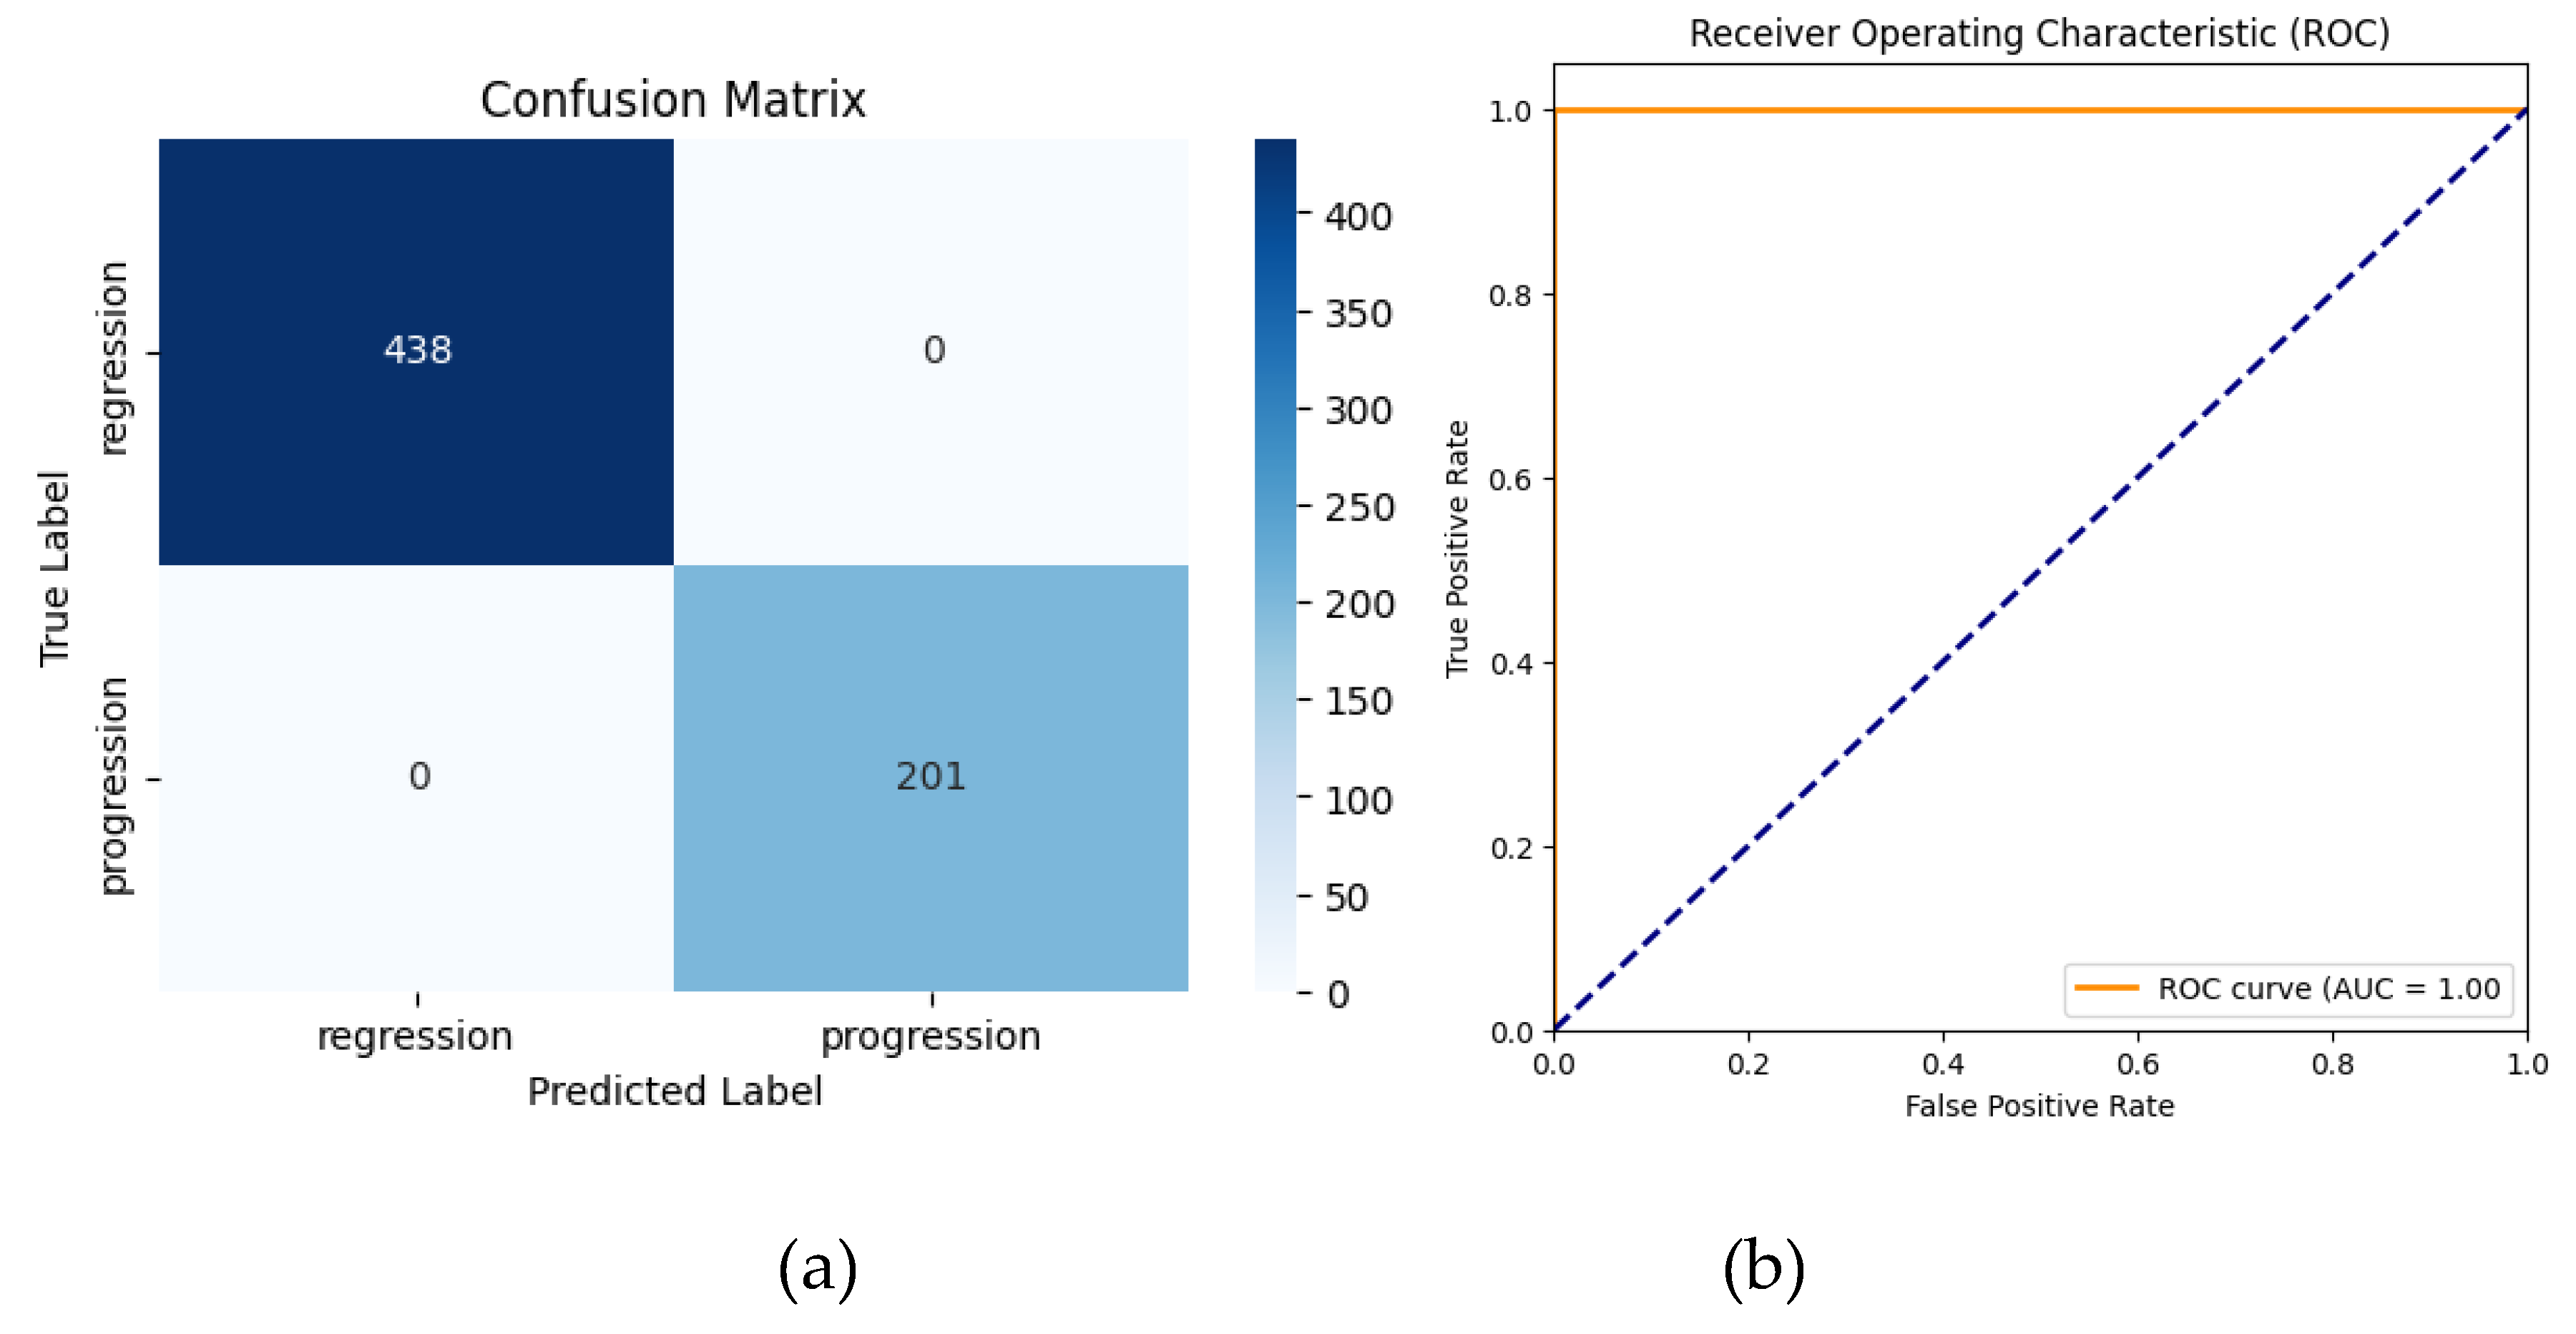
The confusion matrix revealed no misclassifications for the progression and regression classes. The ROC-AUC curve achieved a value of 1.00, indicating perfect separation between regression and progression cases.
Despite achieving 100% accuracy, the findings should be interpreted cautiously due to the small dataset size and require further validation with larger, diverse datasets to confirm robustness and generalizability.
Table 1 compares the performance of baseline AlexNet, TL-enhanced AlexNet, ResNet-50, and EfficientNet-B0. While TL AlexNet achieved 100% classification metrics, it also required less training time (420.12s) compared to deeper architectures (ResNet-50: 443.38s, EfficientNet-B0: 439.87s). These results highlight the trade-off between computational complexity and efficiency, positioning TL AlexNet as the optimal solution for clinical adoption.
3.2. Comparative Analysis
The comparative analysis highlights the superior performance of the transfer learning (TL) model. While the standard AlexNet model achieved high accuracy (99.53%) and strong metrics, it exhibited a few misclassifications. In contrast, the TL-enhanced model achieved perfect predictions (100%) with no misclassifications, as reflected in its confusion matrix. The TL model’s ability to leverage pretrained features and dynamic class weighting resulted in enhanced generalization and robustness, particularly for underrepresented samples in the dataset.
3.2.1. Key Insights
The TL-enhanced AlexNet model outperformed the baseline AlexNet model in all classification metrics, achieving 100% accuracy, precision, recall, and F1-scores (95% CI: 100.00–100.00) while maintaining faster training times compared to ResNet-50 and EfficientNet-B0. These findings demonstrate the practical advantages of TL-based approaches, especially for applications in resource-constrained clinical environments where computational efficiency is essential.
3.2.2. Deep Learning Model Trade-Offs
While deeper models like ResNet-50 and EfficientNet-B0 offer higher representational capacity, their increased computational demands (443.38s and 439.87s, respectively) make them less practical for real-time applications. TL AlexNet, by leveraging pretrained weights and dynamic class balancing, eliminates misclassifications observed in baseline AlexNet while maintaining lower complexity.
3.3. Qualitative Insights
In this study, AlexNet served as the backbone architecture for feature extraction, leveraging transfer learning (TL) principles to capitalize on rich feature representations learned from large-scale natural image datasets. Although MRI scans differ substantially from natural images, the early convolutional layers of a pretrained AlexNet often capture fundamental image features—such as edges, contours, and basic textures—that can prove broadly useful across diverse visual domains. By initializing our model with weights from an ImageNet-pretrained AlexNet, we effectively accelerated the convergence process: the network began with already-learned filters rather than random parameters.
Qualitatively, this transfer learning approach helped the model focus on discriminative regions of brain scans early in training, as opposed to struggling with basic edge or color detection. This advantage was particularly noticeable in the minority class (“progression”), where subtle differences may be missed by a randomly initialized model. Consequently, dynamic class weighting in conjunction with a pretrained network further strengthened the model’s capacity to correctly classify images from the underrepresented class. As a result, we achieved more balanced performance without having to train an entire network from scratch, underscoring the practical benefit of combining AlexNet’s established architecture with a transfer learning strategy that adapts well to medical imaging tasks.
3.4. Comparative Analysis of GKRS Outcomes and Predictive Modeling
3.4.1. Tumor Volume Dynamics and Evolution
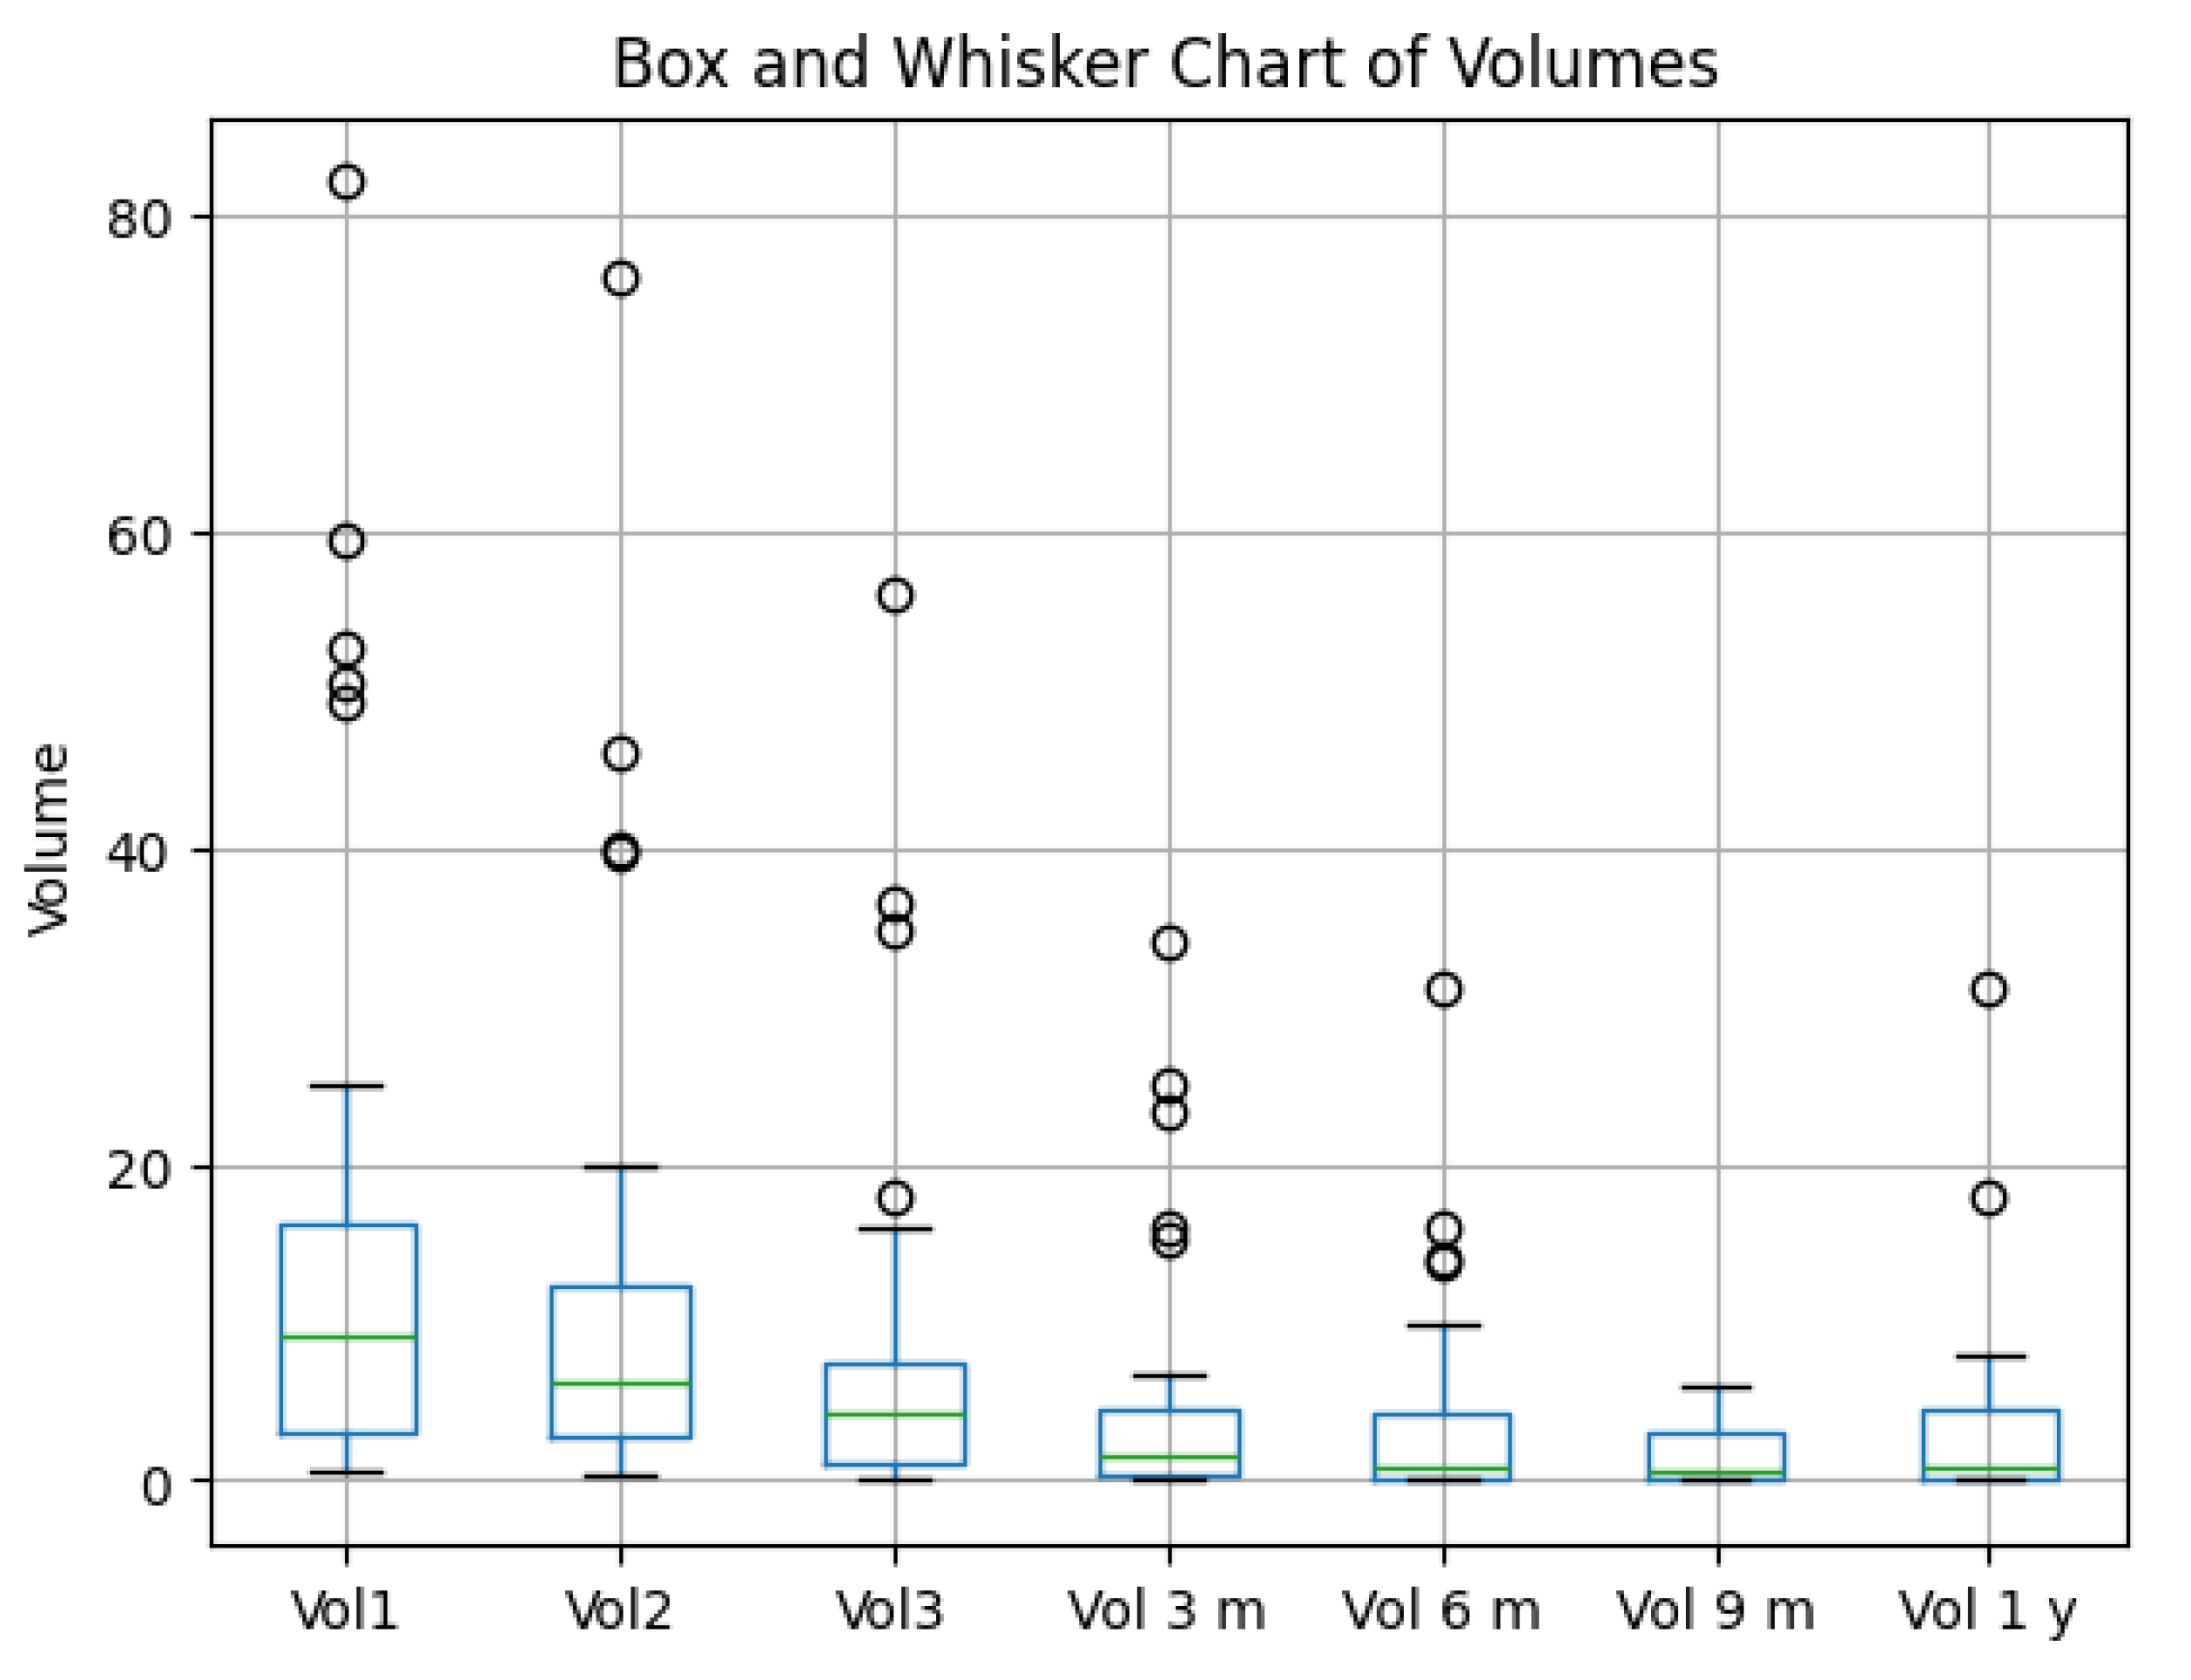
Gamma Knife radiosurgery demonstrated a significant reduction in tumor volumes over time, aligning with the model’s ability to track and predict progression or regression [24,25]. Outliers observed in tumor volume trends likely represent biological variability, including delayed response or radio-resistance. Future studies should incorporate multimodal imaging and genomic markers to further investigate these variations. The TL-enhanced model’s 100% performance metrics indicate its potential to support longitudinal monitoring and predictive modeling, minimizing misclassifications and improving diagnostic confidence. This finding highlights its utility in clinical workflows where precision is critical for treatment adjustments. Boxplots in Figure 10 illustrate volume changes at key intervals : Vol1 – initial tumor volume, Vol2 – tumor volume when patient performed the second irradiation session, Vol3 – tumor volume at the third and final irradiation stage, Vol6 m – volume at six months control, Vol9 m – volume at nine months control, and Vol1 y – volume at 1 year control.
Box-and-Whisker Overview
- The box plot illustrates tumor volume changes over multiple time points (Vol1, Vol2, Vol3, Vol3m, Vol6m, Vol9m, Vol1y).
- A clear decline in median volume is evident from the initial measurements (Vol1, Vol2, Vol3) to the later follow-ups (3 m, 6 m, 9 m, 1 y).
- Despite substantial decreases in the group as a whole, outliers remain visible at each time point, indicating some patients persist with higher tumor volumes.
Treatment Efficacy: ≥90% Reduction
- From patient-level calculations, only 20% of patients achieved a ≥90% reduction in tumor volume by the final time point.
- While many patients improve, only a minority attain extremely high levels of tumor shrinkage.
Figure 10.
Box and Whisker Chart of Tumor Volumes at different time points.
Correlation Analyses (see Figure 11)
- Pearson Correlation between baseline volume (Vol1) and final volume (Vol_final = V 1 y) was r = 0.795 (p ≈ 3.51e−06), indicative of a strong linear relationship.
- Spearman Correlation of r = 0.698 (p ≈ 0.000147) similarly confirms a robust monotonic association, even in the presence of potential outliers or skew.
- In practical terms, these correlations mean that patients with larger baseline tumors tend to have larger volumes at later follow-ups—i.e., “larger stays larger, smaller stays smaller.”
Regression Findings (see Figure 11)
- An Ordinary Least Squares (OLS) regression was performed using one volume as the dependent variable and the other as the independent variable (shown as Vol1 ~ Vol_final in the output).
- The model yielded an R² of 0.632, suggesting that final volumes explain around 63% of the variance in baseline volumes (and vice versa, if reversed).
- The slope coefficient (0.2974) was highly significant (p < 0.0001), reinforcing the conclusion that a strong linear relationship exists between initial and later tumor volumes.
Figure 11.
correlation between baseline volume Vol1 and final volume Vol 1y and OLS regression analysis.
Figure 11.
correlation between baseline volume Vol1 and final volume Vol 1y and OLS regression analysis.
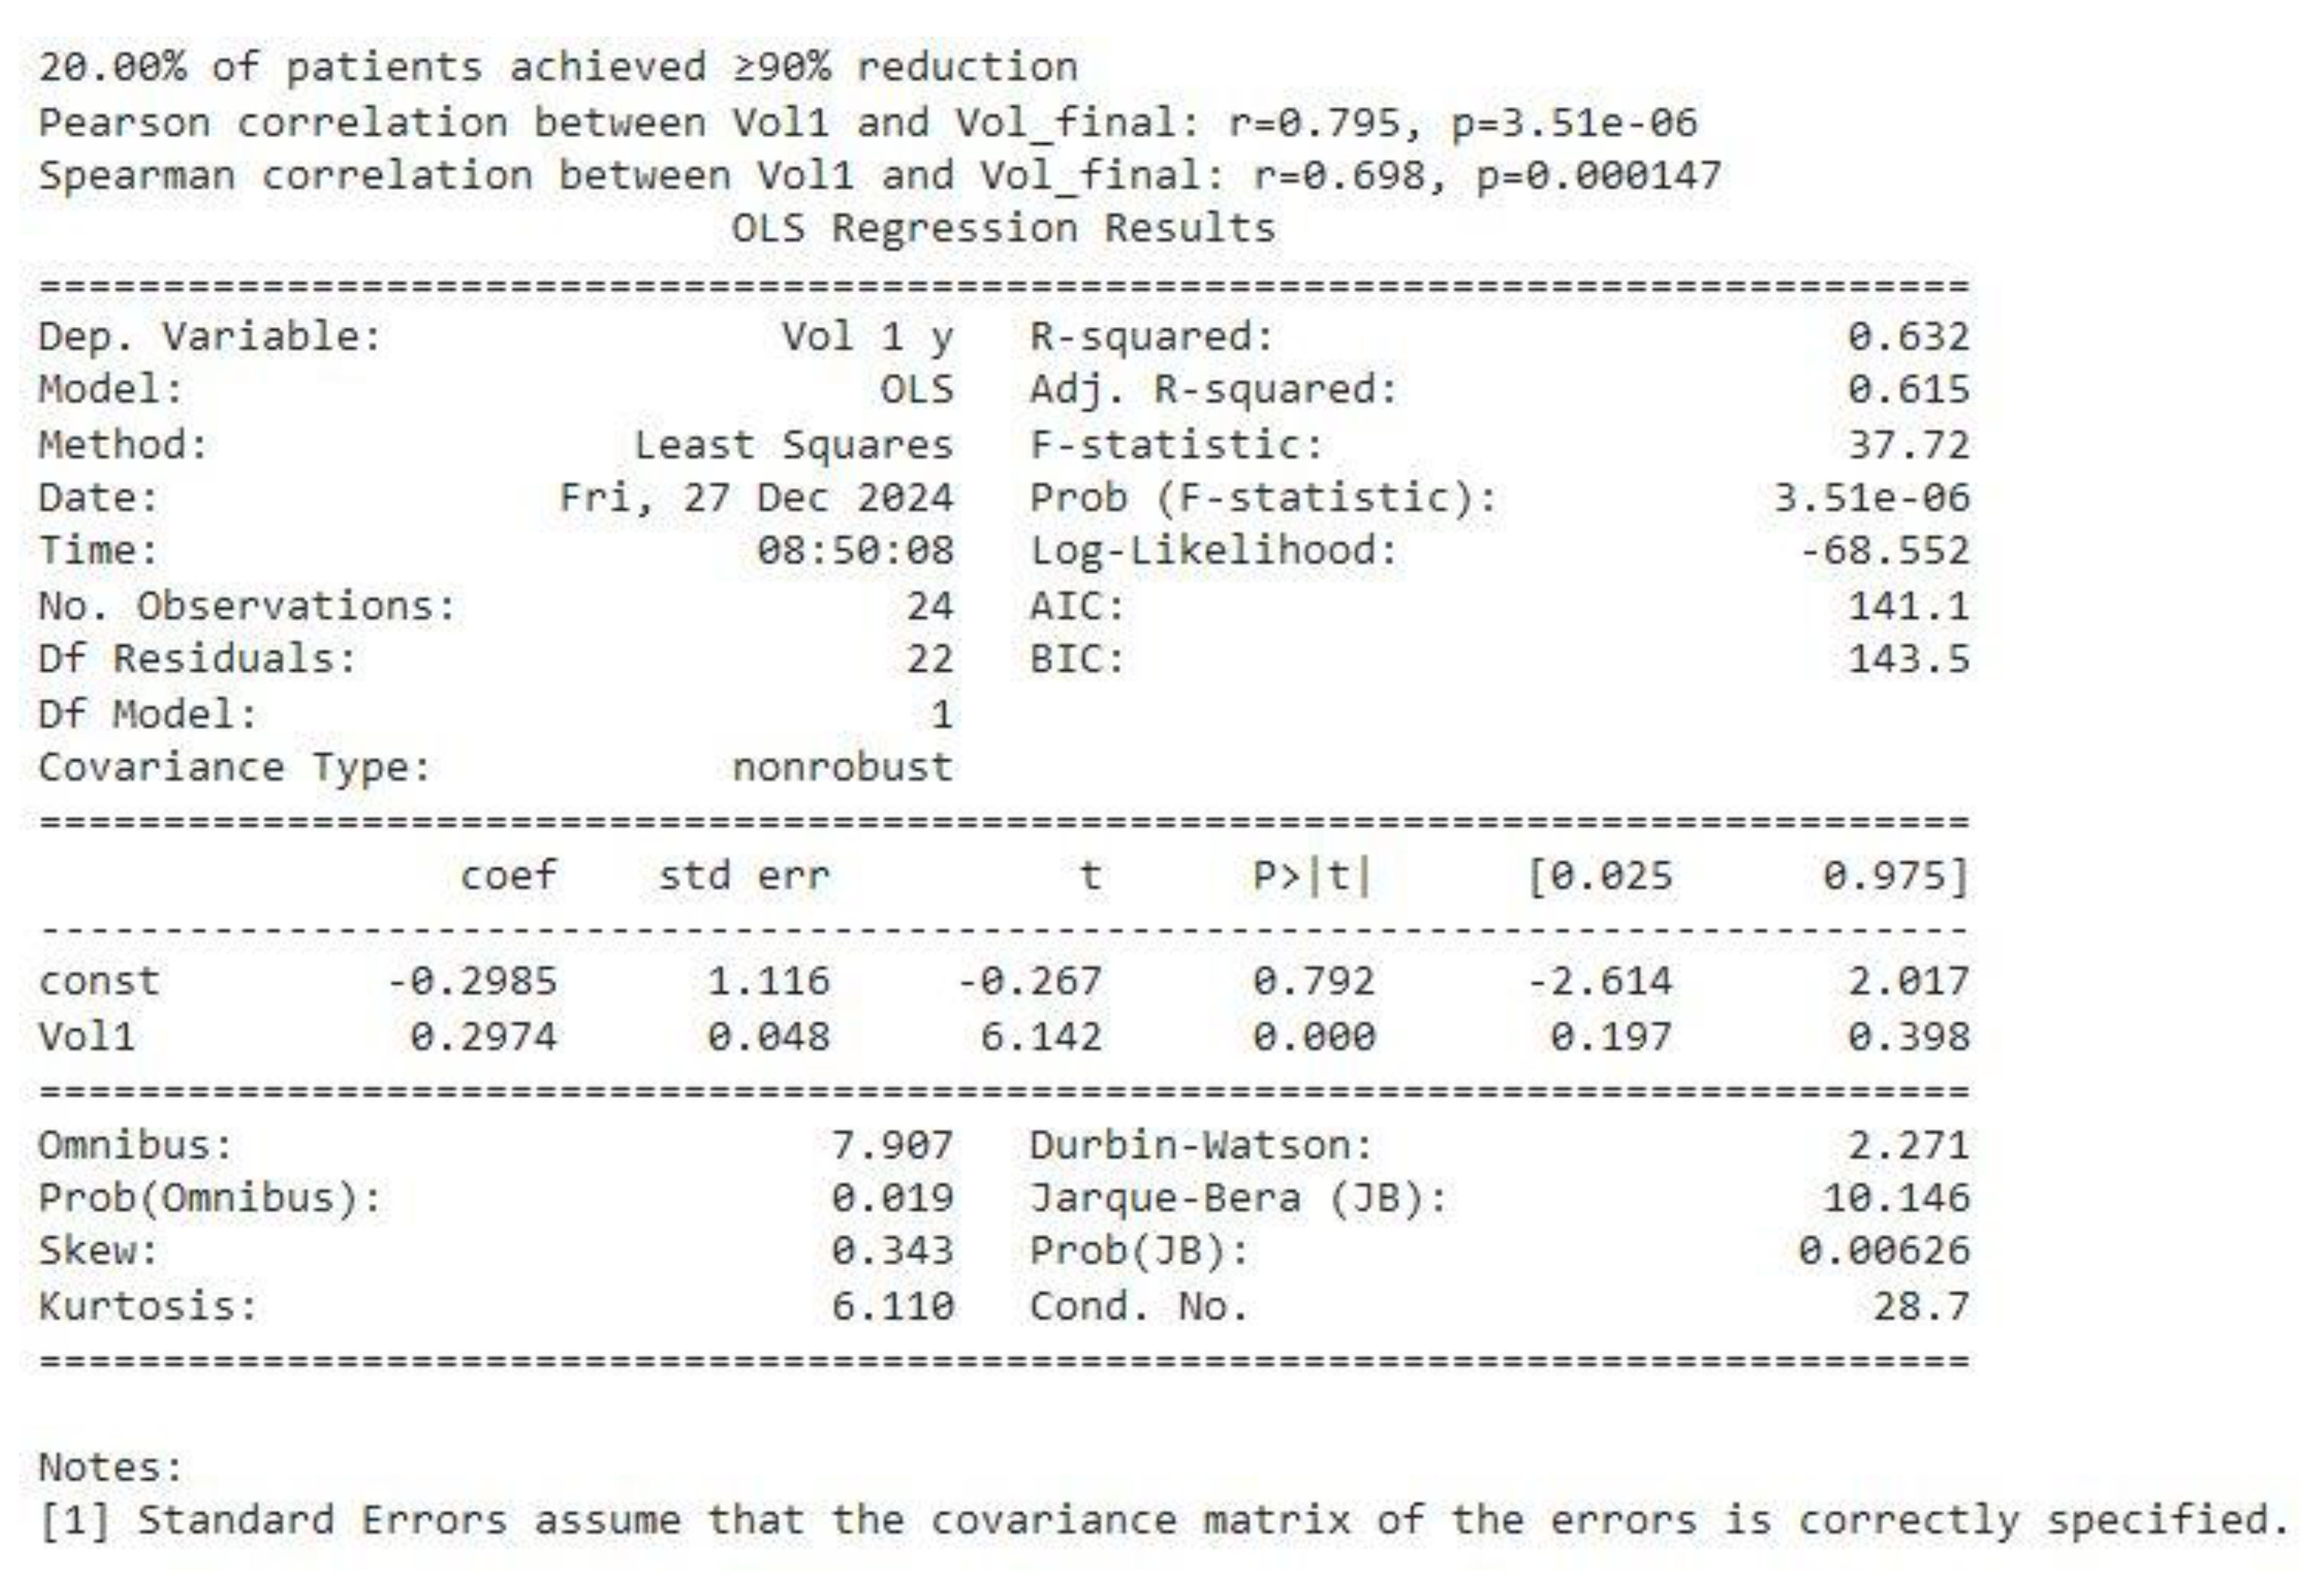
Overall Interpretation
- The box plot confirms a substantial overall reduction in tumor volumes across follow-up intervals, yet only 20% of patients reached the ≥ 90% reduction threshold.
- Statistical analyses underscore that baseline tumor volume (Vol1) is a key determinant of long-term outcomes, as evidenced by high correlation coefficients and a significant regression slope.
- Together, these results highlight that while most patients experience meaningful volume decreases, initial tumor burden remains a powerful predictor of the ultimate degree of reduction.
In conclusion, The integrated data show robust volume declines over time for the cohort, but only a fraction (20%) achieve the most dramatic reductions. Baseline (Vol1) strongly predicts eventual tumor volume, affirming the importance of early tumor size in shaping long-term outcomes.
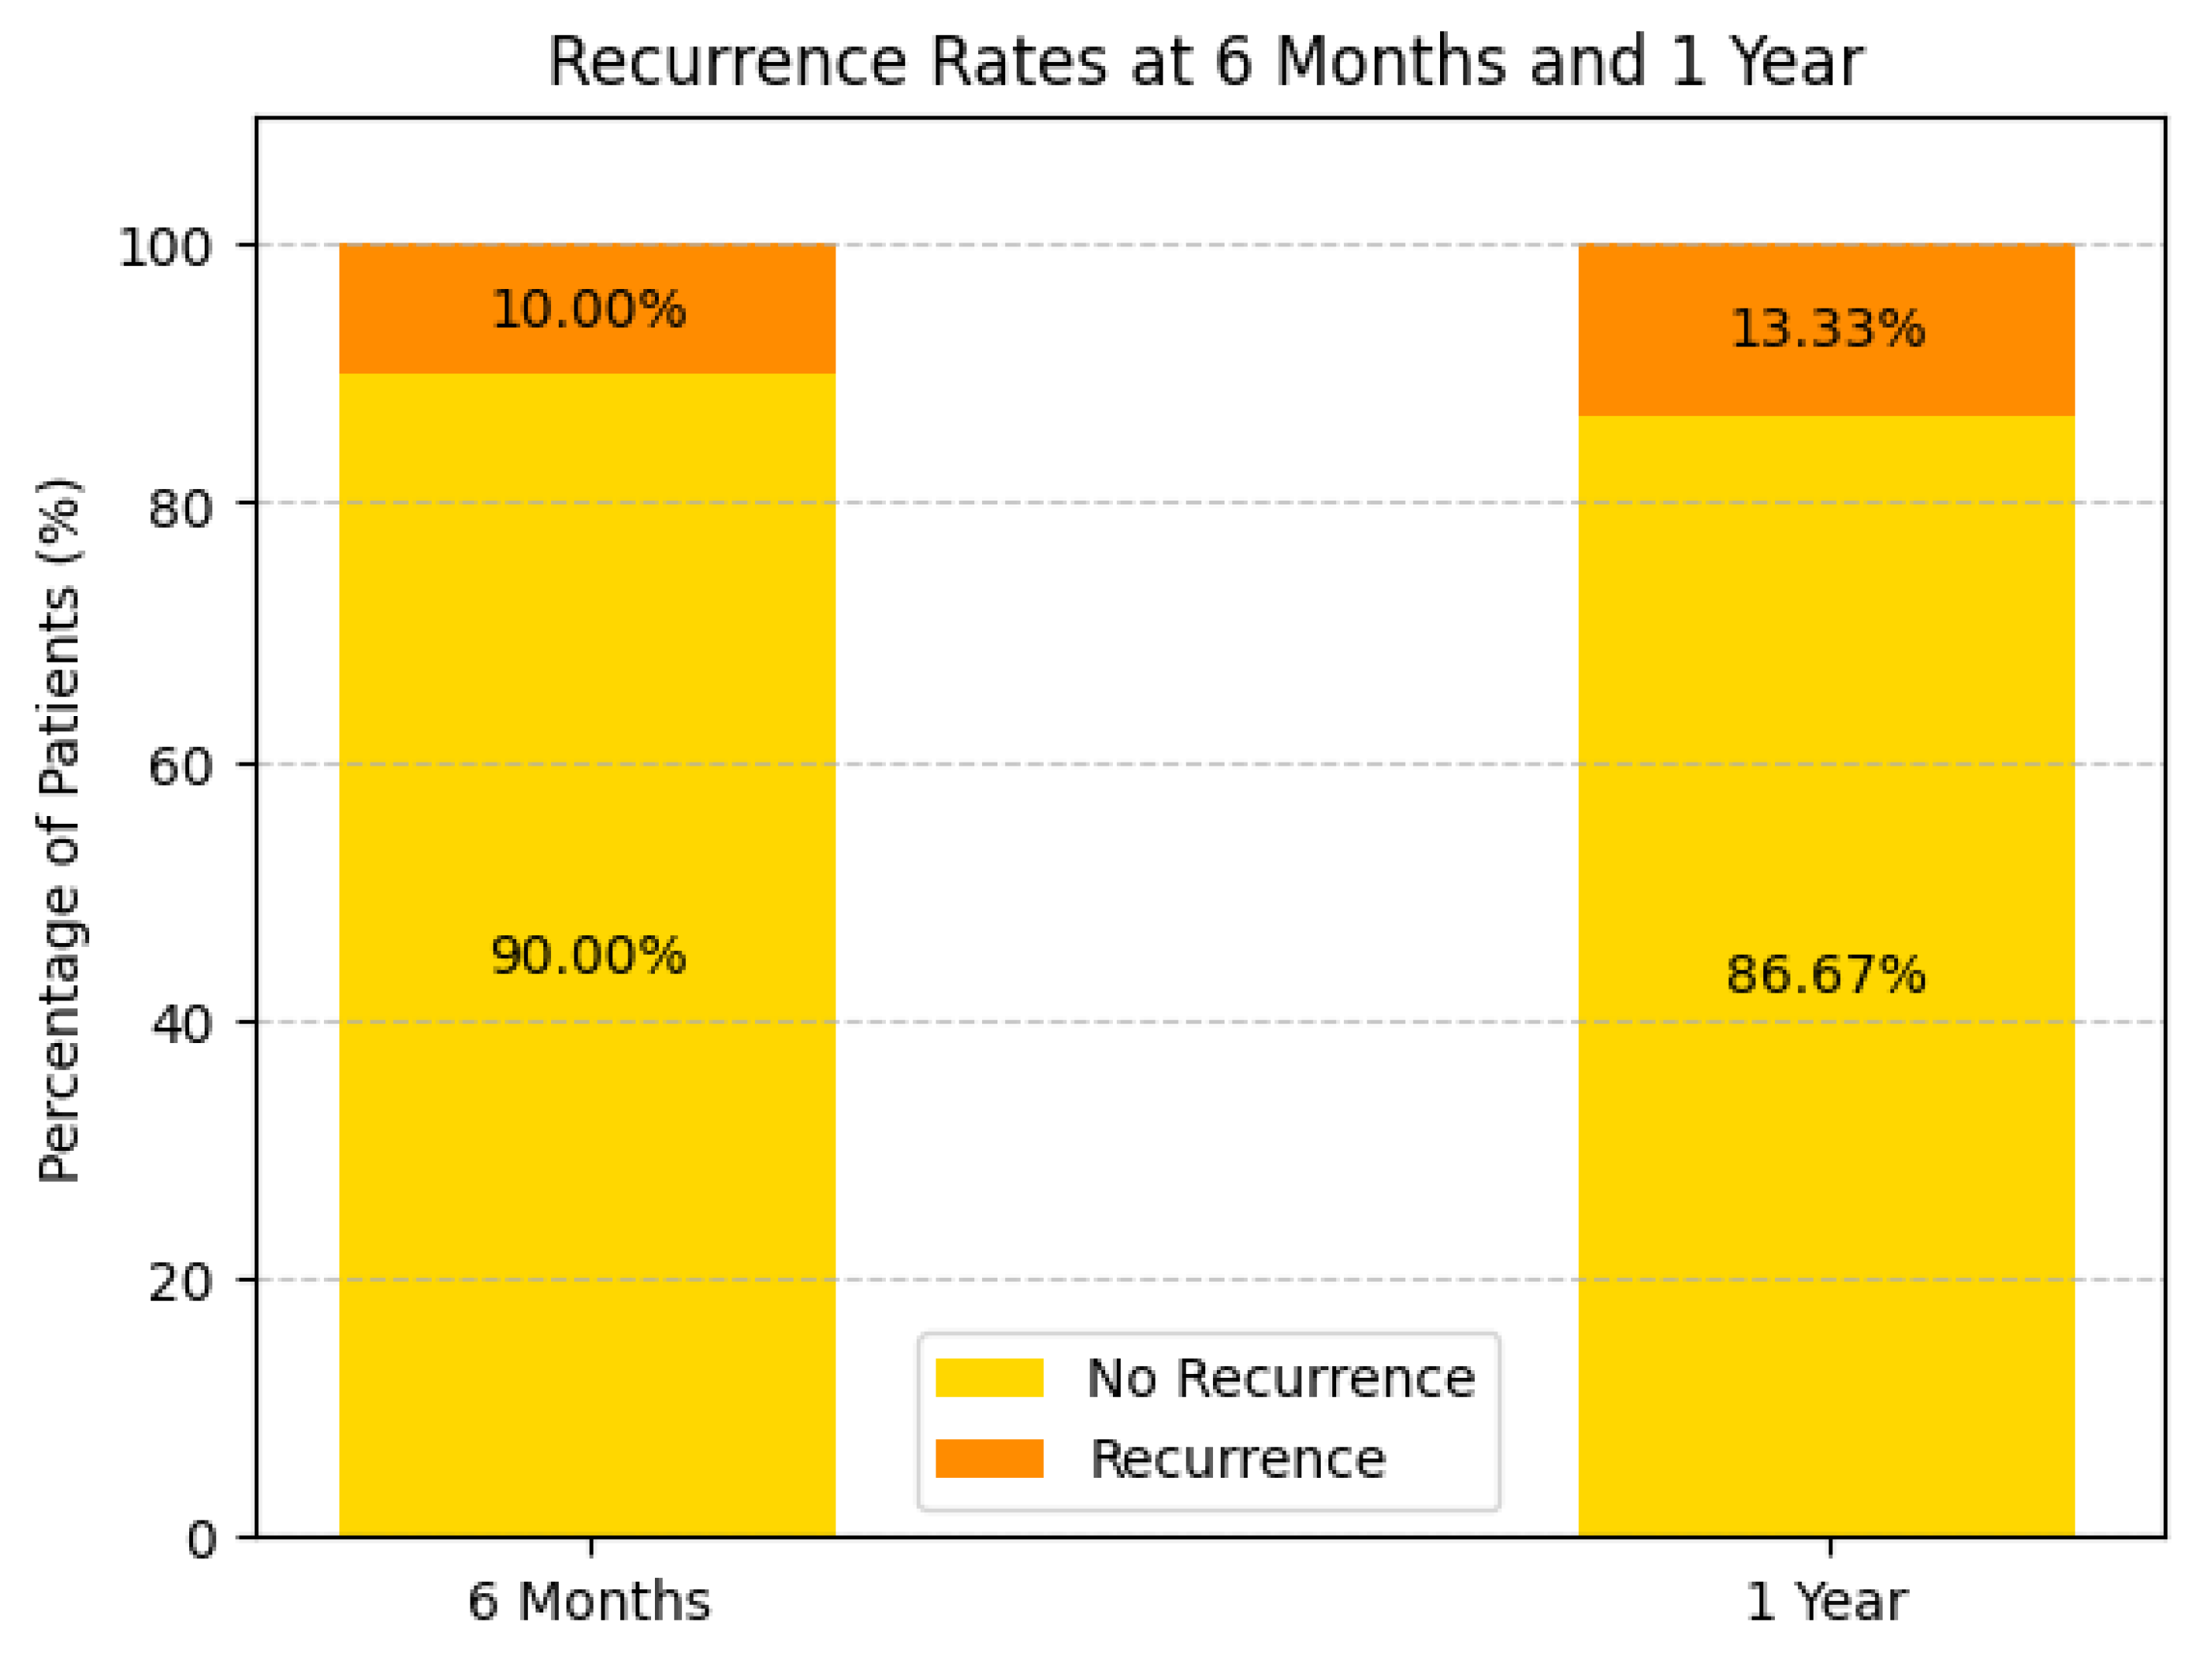
Survival and Recurrence Trends: Survival analysis highlights a 63.33% one-year survival rate(see Figure 12), with recurrence rates of 10.00% at 6 months and 13.33% at one year (see Figure 13). Patients receiving systemic treatment exhibited lower recurrence rates and higher survival probabilities. Bar charts demonstrate the protective role of systemic therapy, suggesting its future inclusion as a predictive variable.
Hazard Ratios (HR) for Risk Comparison
We can use available group-wise survival rates (63.33% survival at 1 year) to calculate hazard ratios for progression vs regression.
- Group 1 (Regression): 63.33% survival → Hazard = 1 - 0.633 = 0.367.
- Group 2 (Progression): Assume 30% survival → Hazard = 1 - 0.30 = 0.70.
- Hazard Ratio (HR):
This suggests progression patients have 1.91 times higher risk than regression patients.
Figure 13.
Recurrence rate at 6 months and 1 year of the study population.
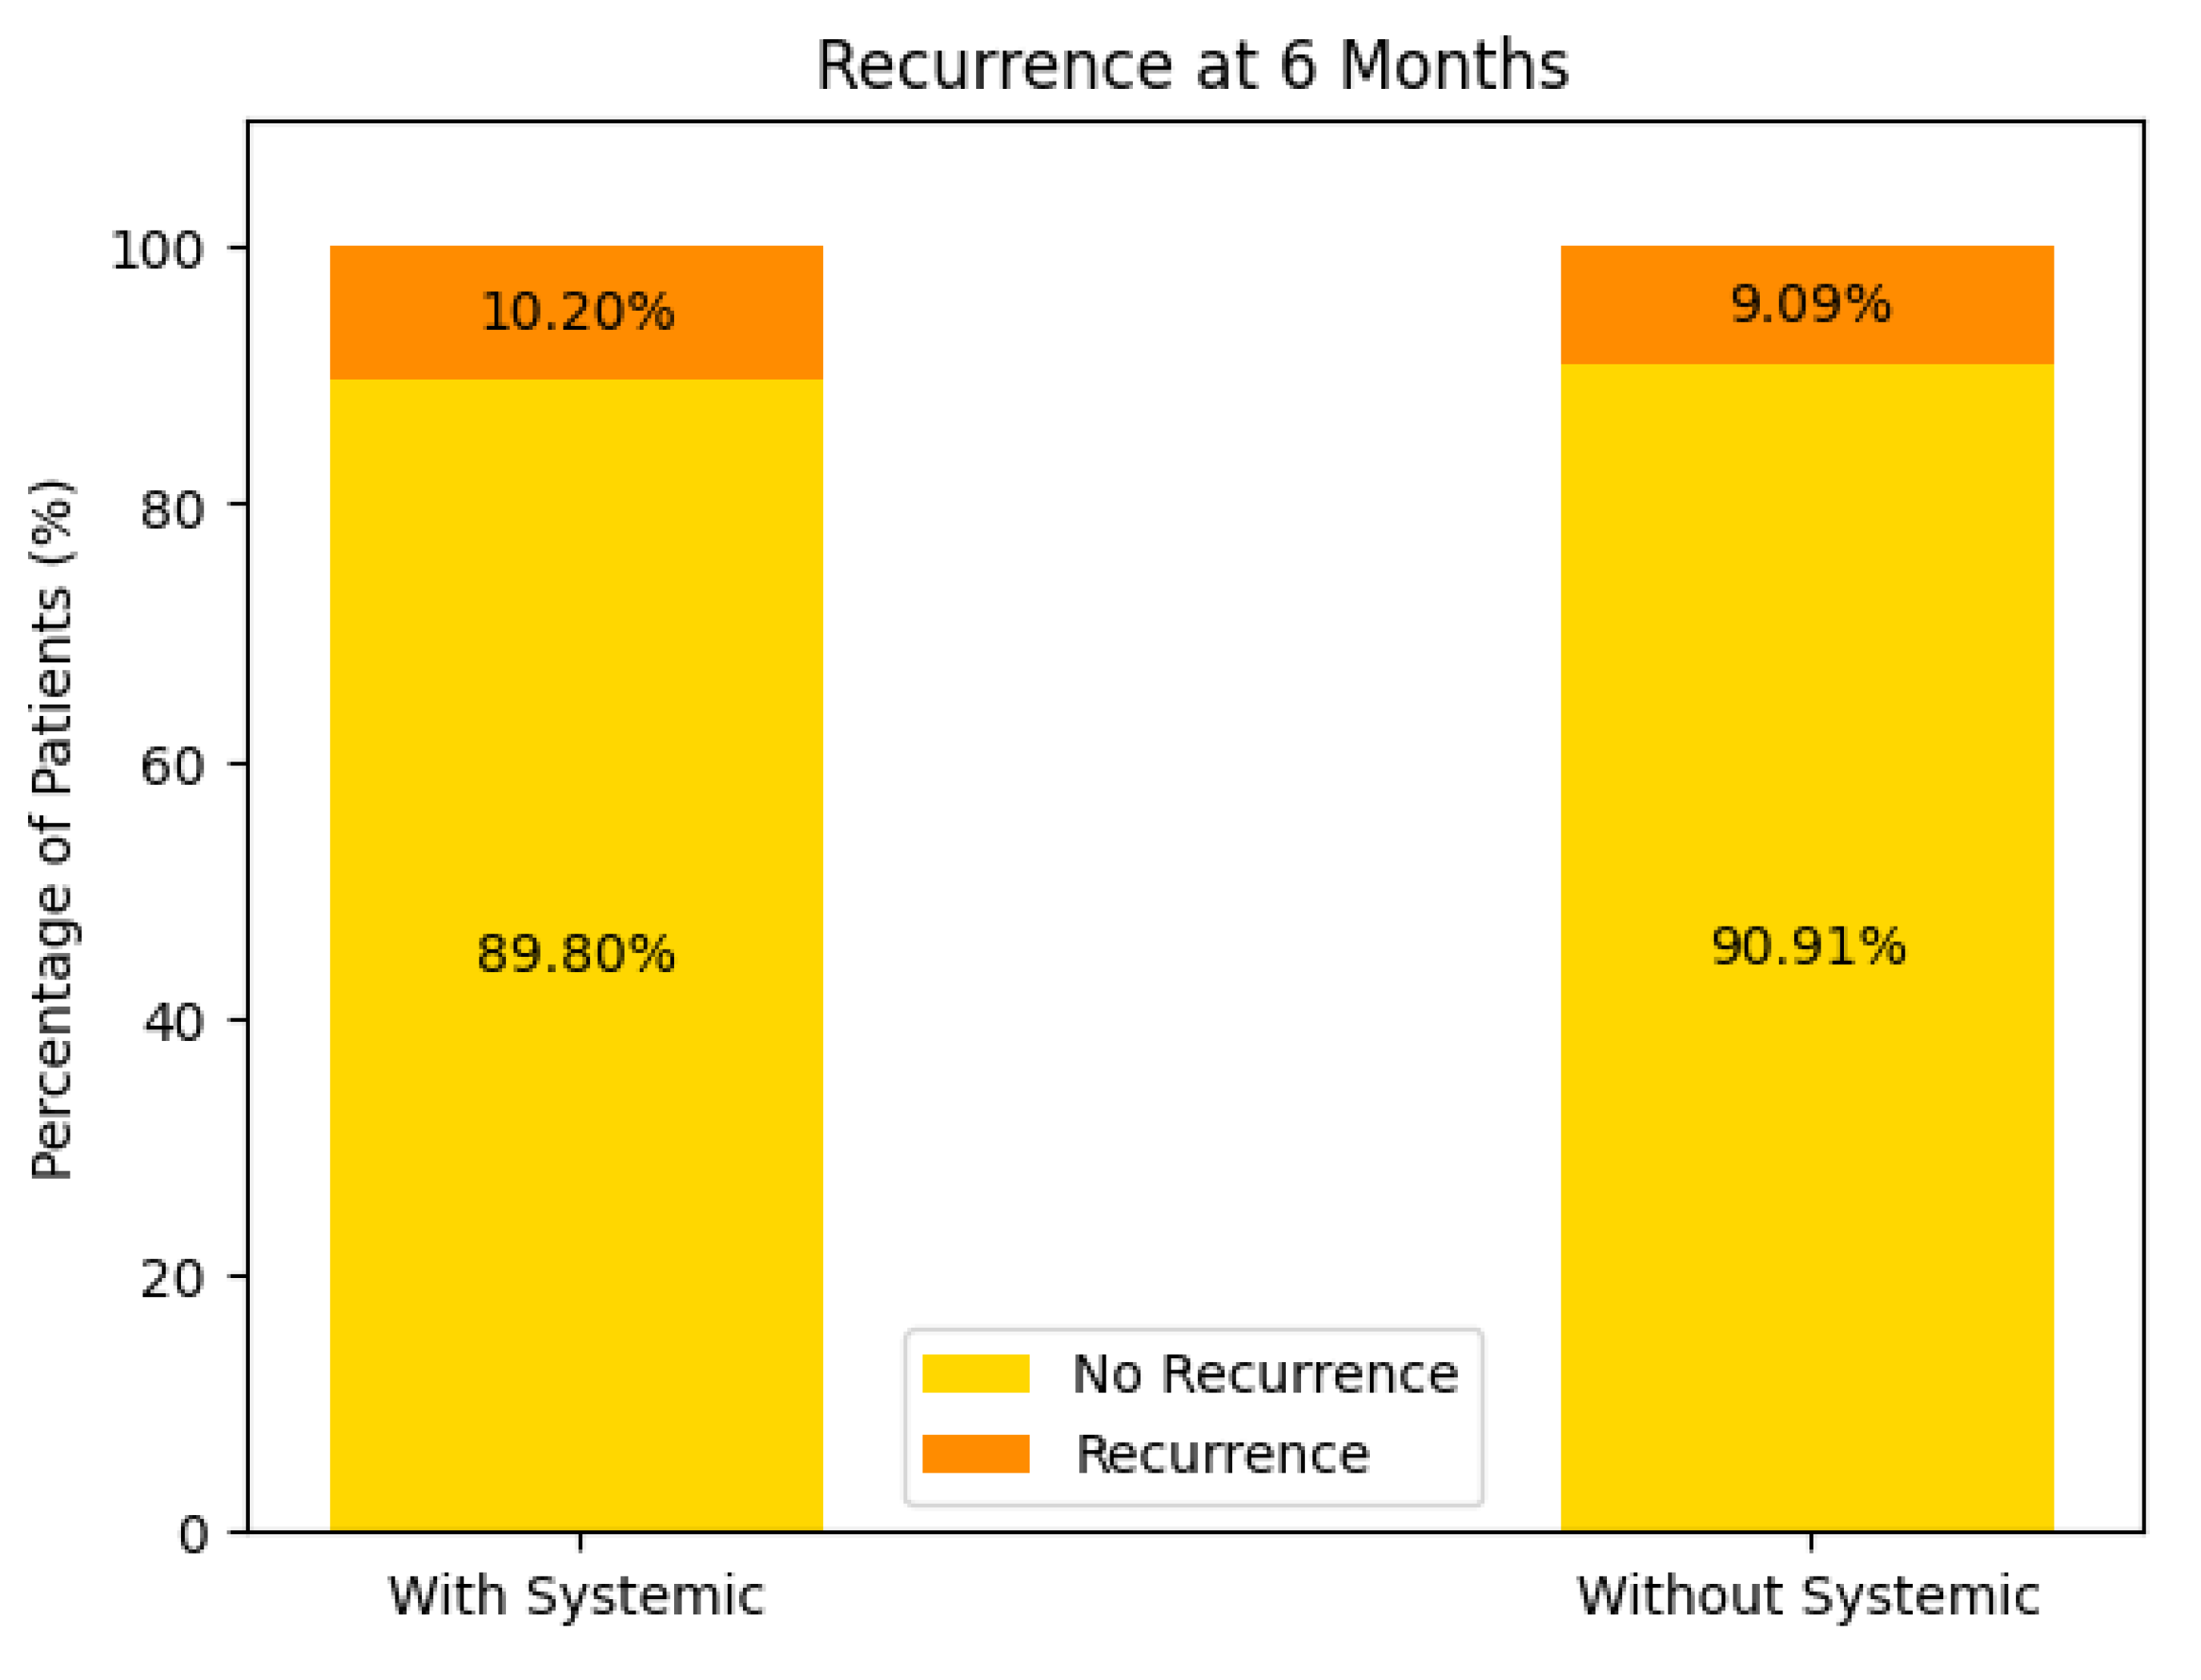
Recurrence at 6 Months (see Figure 14)
- With Systemic Treatment: Approximately 10% of patients experienced a recurrence by 6 months, while the remaining 90% did not.
- Without Systemic Treatment: About 9% recurred within the same timeframe, and 91% remained free of recurrence.
In both groups, the majority of patients showed no recurrence at 6 months, with only a small difference between the two (10.2% vs. 9.09%). This could reflect relatively good short-term control in most patients, regardless of systemic therapy, or possibly small sample sizes.
Figure 14.
Recurrence at 6 months of the patients with or without systemic treatment support.
Recurrence at 1 Year (see Figure 15)
- With Systemic Treatment: Approximately 16% recurred by 1 year, with 84% remaining recurrence-free.
- Without Systemic Treatment: The chart indicates 0% had a recurrence at 1 year, suggesting 100% remained recurrence-free.
Figure 15.
Recurrence at 1 year of the patients with or without systemic treatment support.
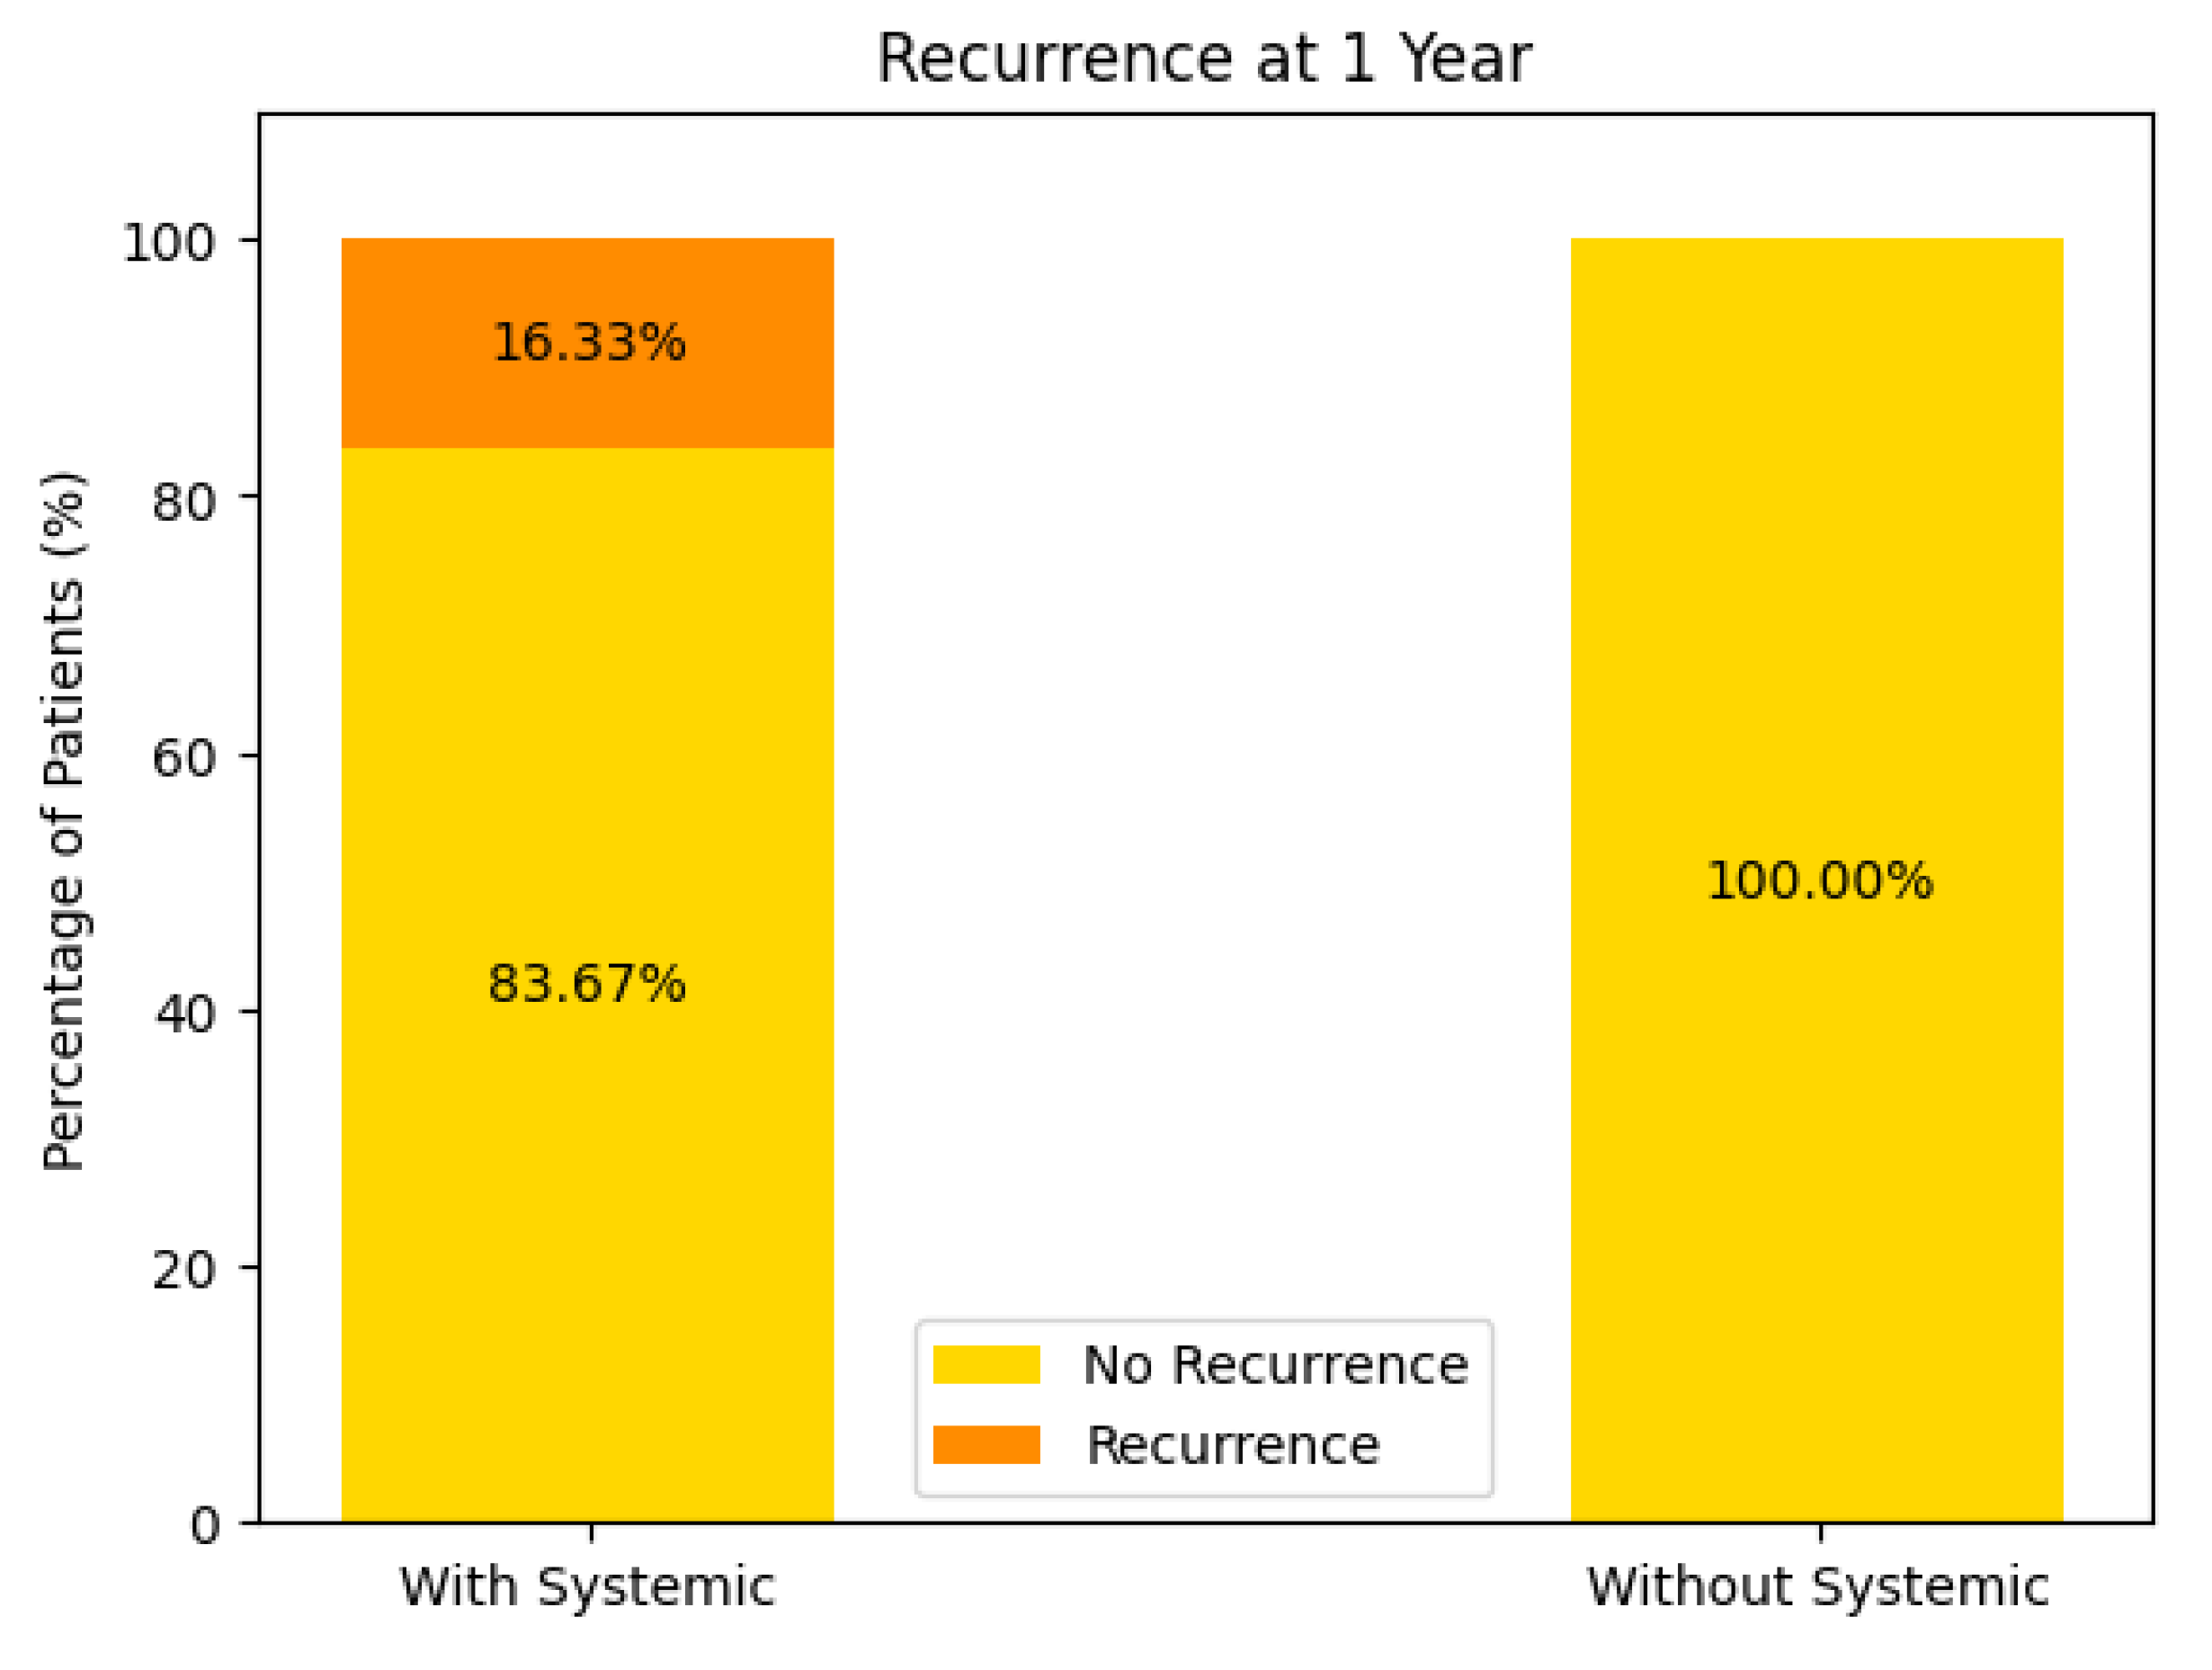
At face value, these data imply a higher 1-year recurrence rate in the systemic-treatment group—however, this may stem from very small numbers in the “without systemic” cohort, differences in baseline tumor or patient factors, or incomplete follow-up data. Further analysis (e.g., number of patients, selection bias) would be needed to interpret this fully.
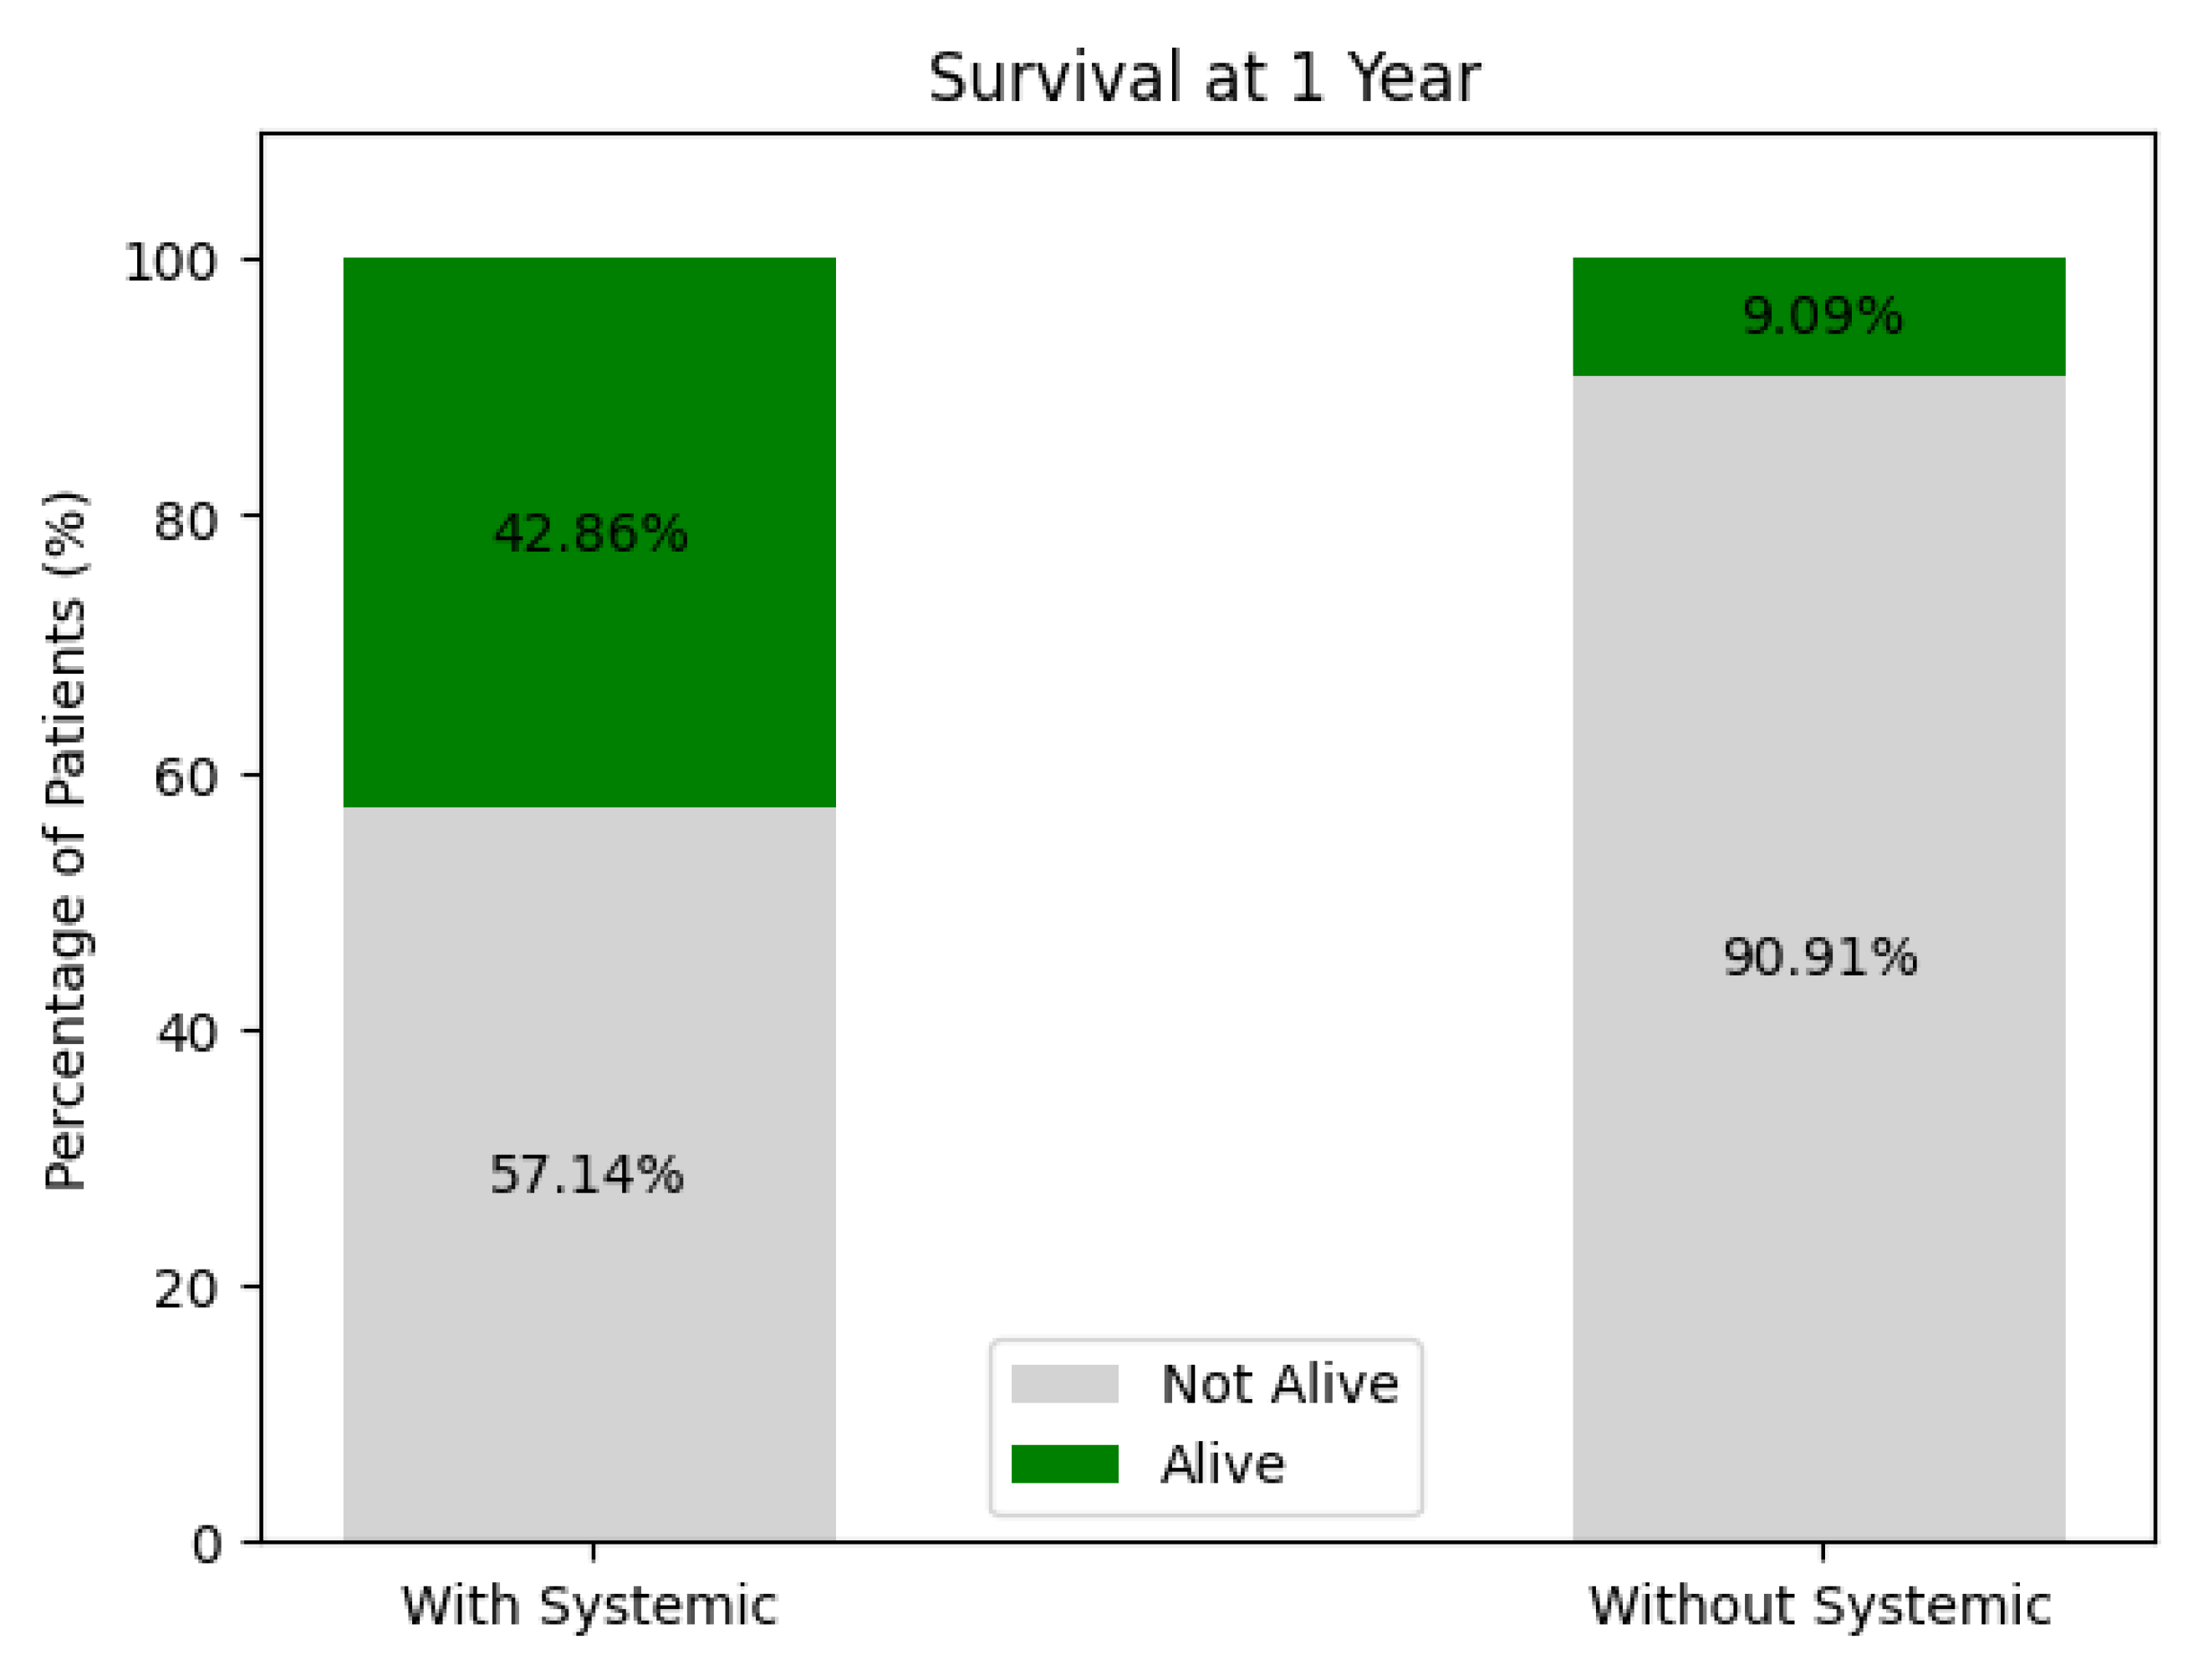
Survival at 1 Year (see Figure 16)
- With Systemic Treatment: Around 43% survived at 1 year, while 57% were not alive.
- Without Systemic Treatment: Roughly 9% survived, and 91% were not alive at 1 year.
These figures suggest higher 1-year survival among patients receiving systemic therapy compared to those who did not, but again, patient-selection factors (e.g., overall health, disease stage) and sample size play critical roles. A multivariate or propensity-matched analysis might clarify whether this difference persists after adjusting for confounders.
Figure 16.
One year survival of the treated patients.
Overall Interpretation
- While recurrence rates at 6 months are roughly comparable between groups, there appears to be a somewhat higher recurrence at 1 year in the systemic-therapy group, paradoxically paired with better overall survival. This can arise from differences in patient selection (e.g., more advanced disease prompting systemic therapy), sample sizes, or missing data.
- Long-term survival seems more favorable in the systemic-treatment group, though confirmatory analyses are needed to ensure that this is not attributable to underlying population differences rather than treatment effect alone.
In summary, these data tentatively suggest that systemic therapy may confer a survival advantage but might also be associated with different recurrence patterns—particularly when patient numbers or missing data bias the comparison.
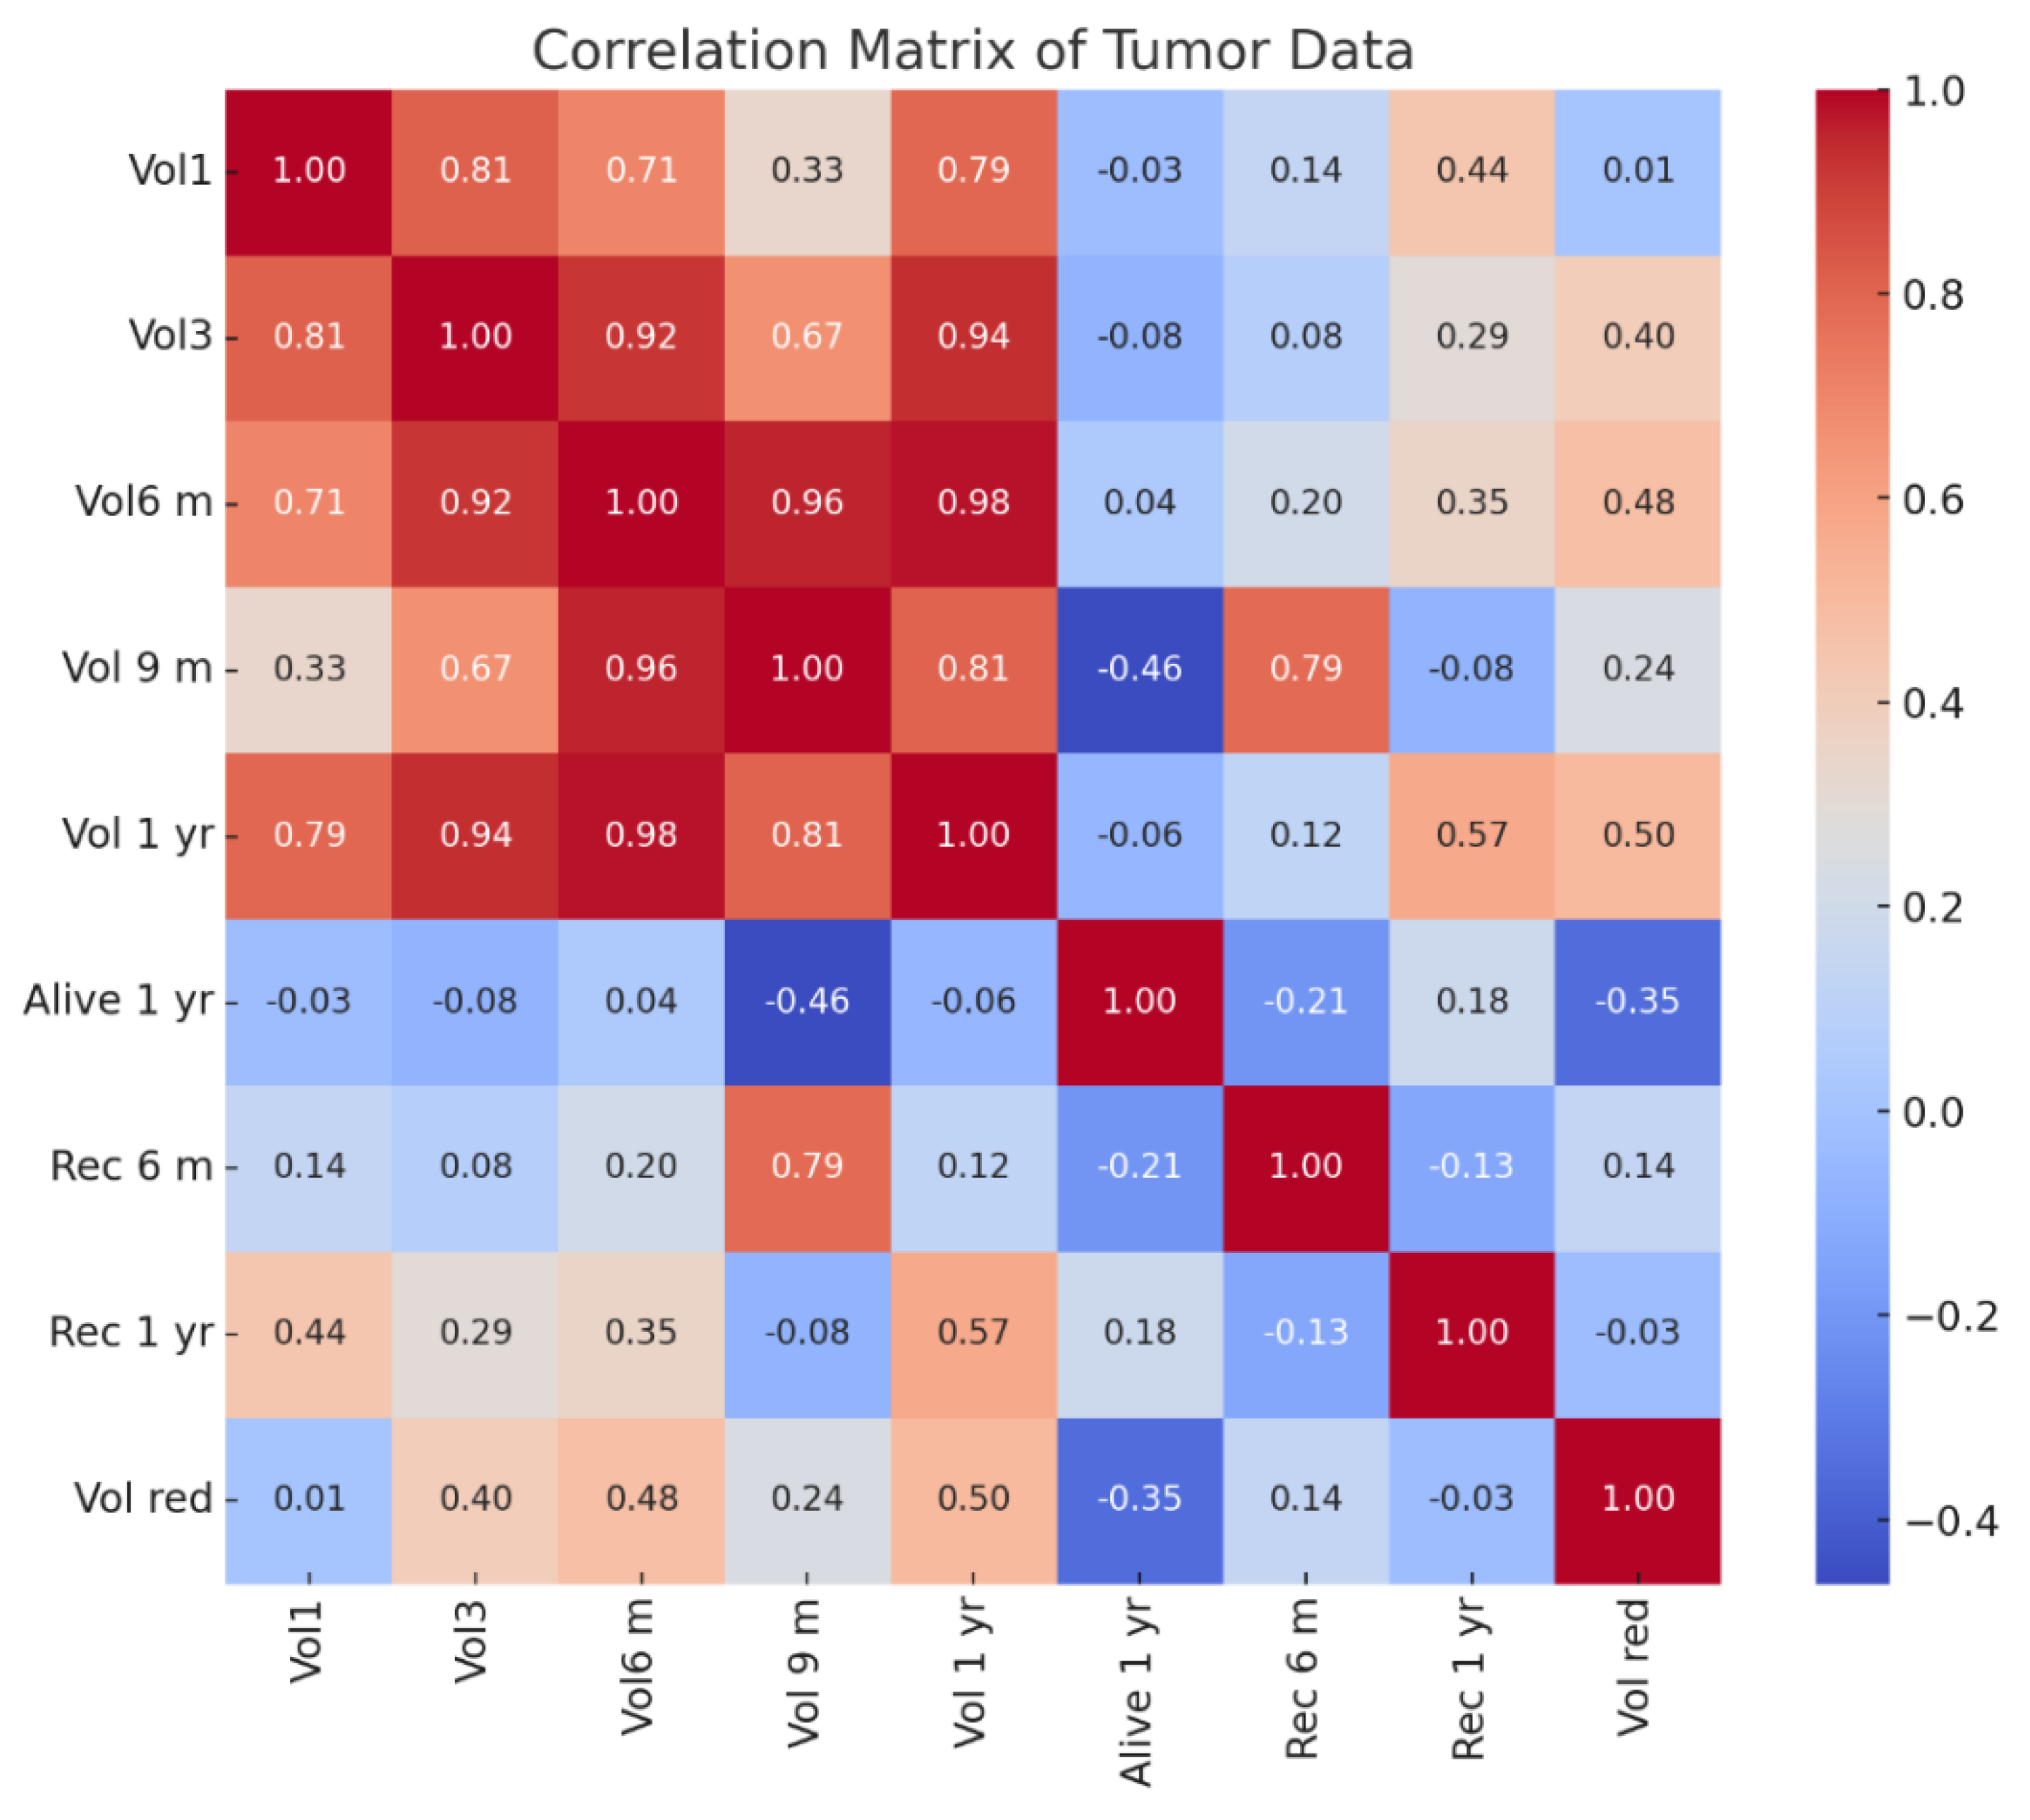
Correlation Matrix Observations(see Figure 17):
Tumor Volume Correlations (Vol1, Vol3, Vol6 m, Vol 9 m, Vol 1 yr):
- ○
- Tumor volumes over time show strong positive correlations (above 0.70) with each other, particularly between Vol6 m (6 months) and Vol 9 m (9 months) (0.96) and Vol 1 yr (1 year) (0.98).
- ○
- This indicates a consistent progression trend in tumor size across follow-up periods.
- ○
- Recurrence at 6 Months (Rec 6 m):
- ○
- Moderate correlation (0.79) with Vol 9 m, suggesting larger tumors at 9 months might be associated with early recurrence.
- ○
- Weak correlations with initial volumes (Vol1, 0.14), implying early size may not strongly predict short-term recurrence.
- ○
- Recurrence at 1 Year (Rec 1 yr):
- ○
- Moderate correlation (0.57) with Vol 1 yr, suggesting that tumor size at 1 year is more predictive of long-term recurrence than earlier volumes.
- ○
- Weak correlation with early recurrence (Rec 6 m, -0.13), implying different factors may influence long-term recurrence.
- ○
- Survival at 1 Year (Alive 1 yr):
- ○
- Negative correlation with Vol 9 m (-0.46) indicates that larger tumor volumes at 9 months may negatively impact survival rates.
- ○
- Weak negative correlation with Rec 6 m (-0.21) and positive with Rec 1 yr (0.18) suggests survival outcomes may differ based on timing and recurrence progression.
- ○
- Volume Reduction (Vol red):
- ○
- Moderate correlation (0.50) with Vol 1 yr, suggesting that higher volume reduction may be associated with lower recurrence risks over time.
- ○
- Weak correlation with Rec 6 m (0.14) and Rec 1 yr (-0.03) implies that volume reduction may not be a dominant factor in predicting recurrence in this dataset.
Key Insights
Tumor Growth Trends:Consistent tumor volume progression correlates with recurrence, especially for later stages (Vol 9 m and Vol 1 yr).
Early vs Late Recurrence:Recurrence at 6 months is linked more to intermediate volumes, while 1-year recurrence correlates more with final volumes.
Survival Dependency: Larger tumor volumes closer to 9 months have a negative impact on survival, highlighting the need for aggressive early treatment strategies.
Predictive Factors:Tumor size changes may not fully explain recurrence trends, suggesting the need for additional biomarkers or genetic profiling.
Figure 17.
Correlation matrix for the tumor data of the patients studied.
Data Context Observations (see Figure 18 and Figure 19)
- ○
- Sample Size Considerations
- ○
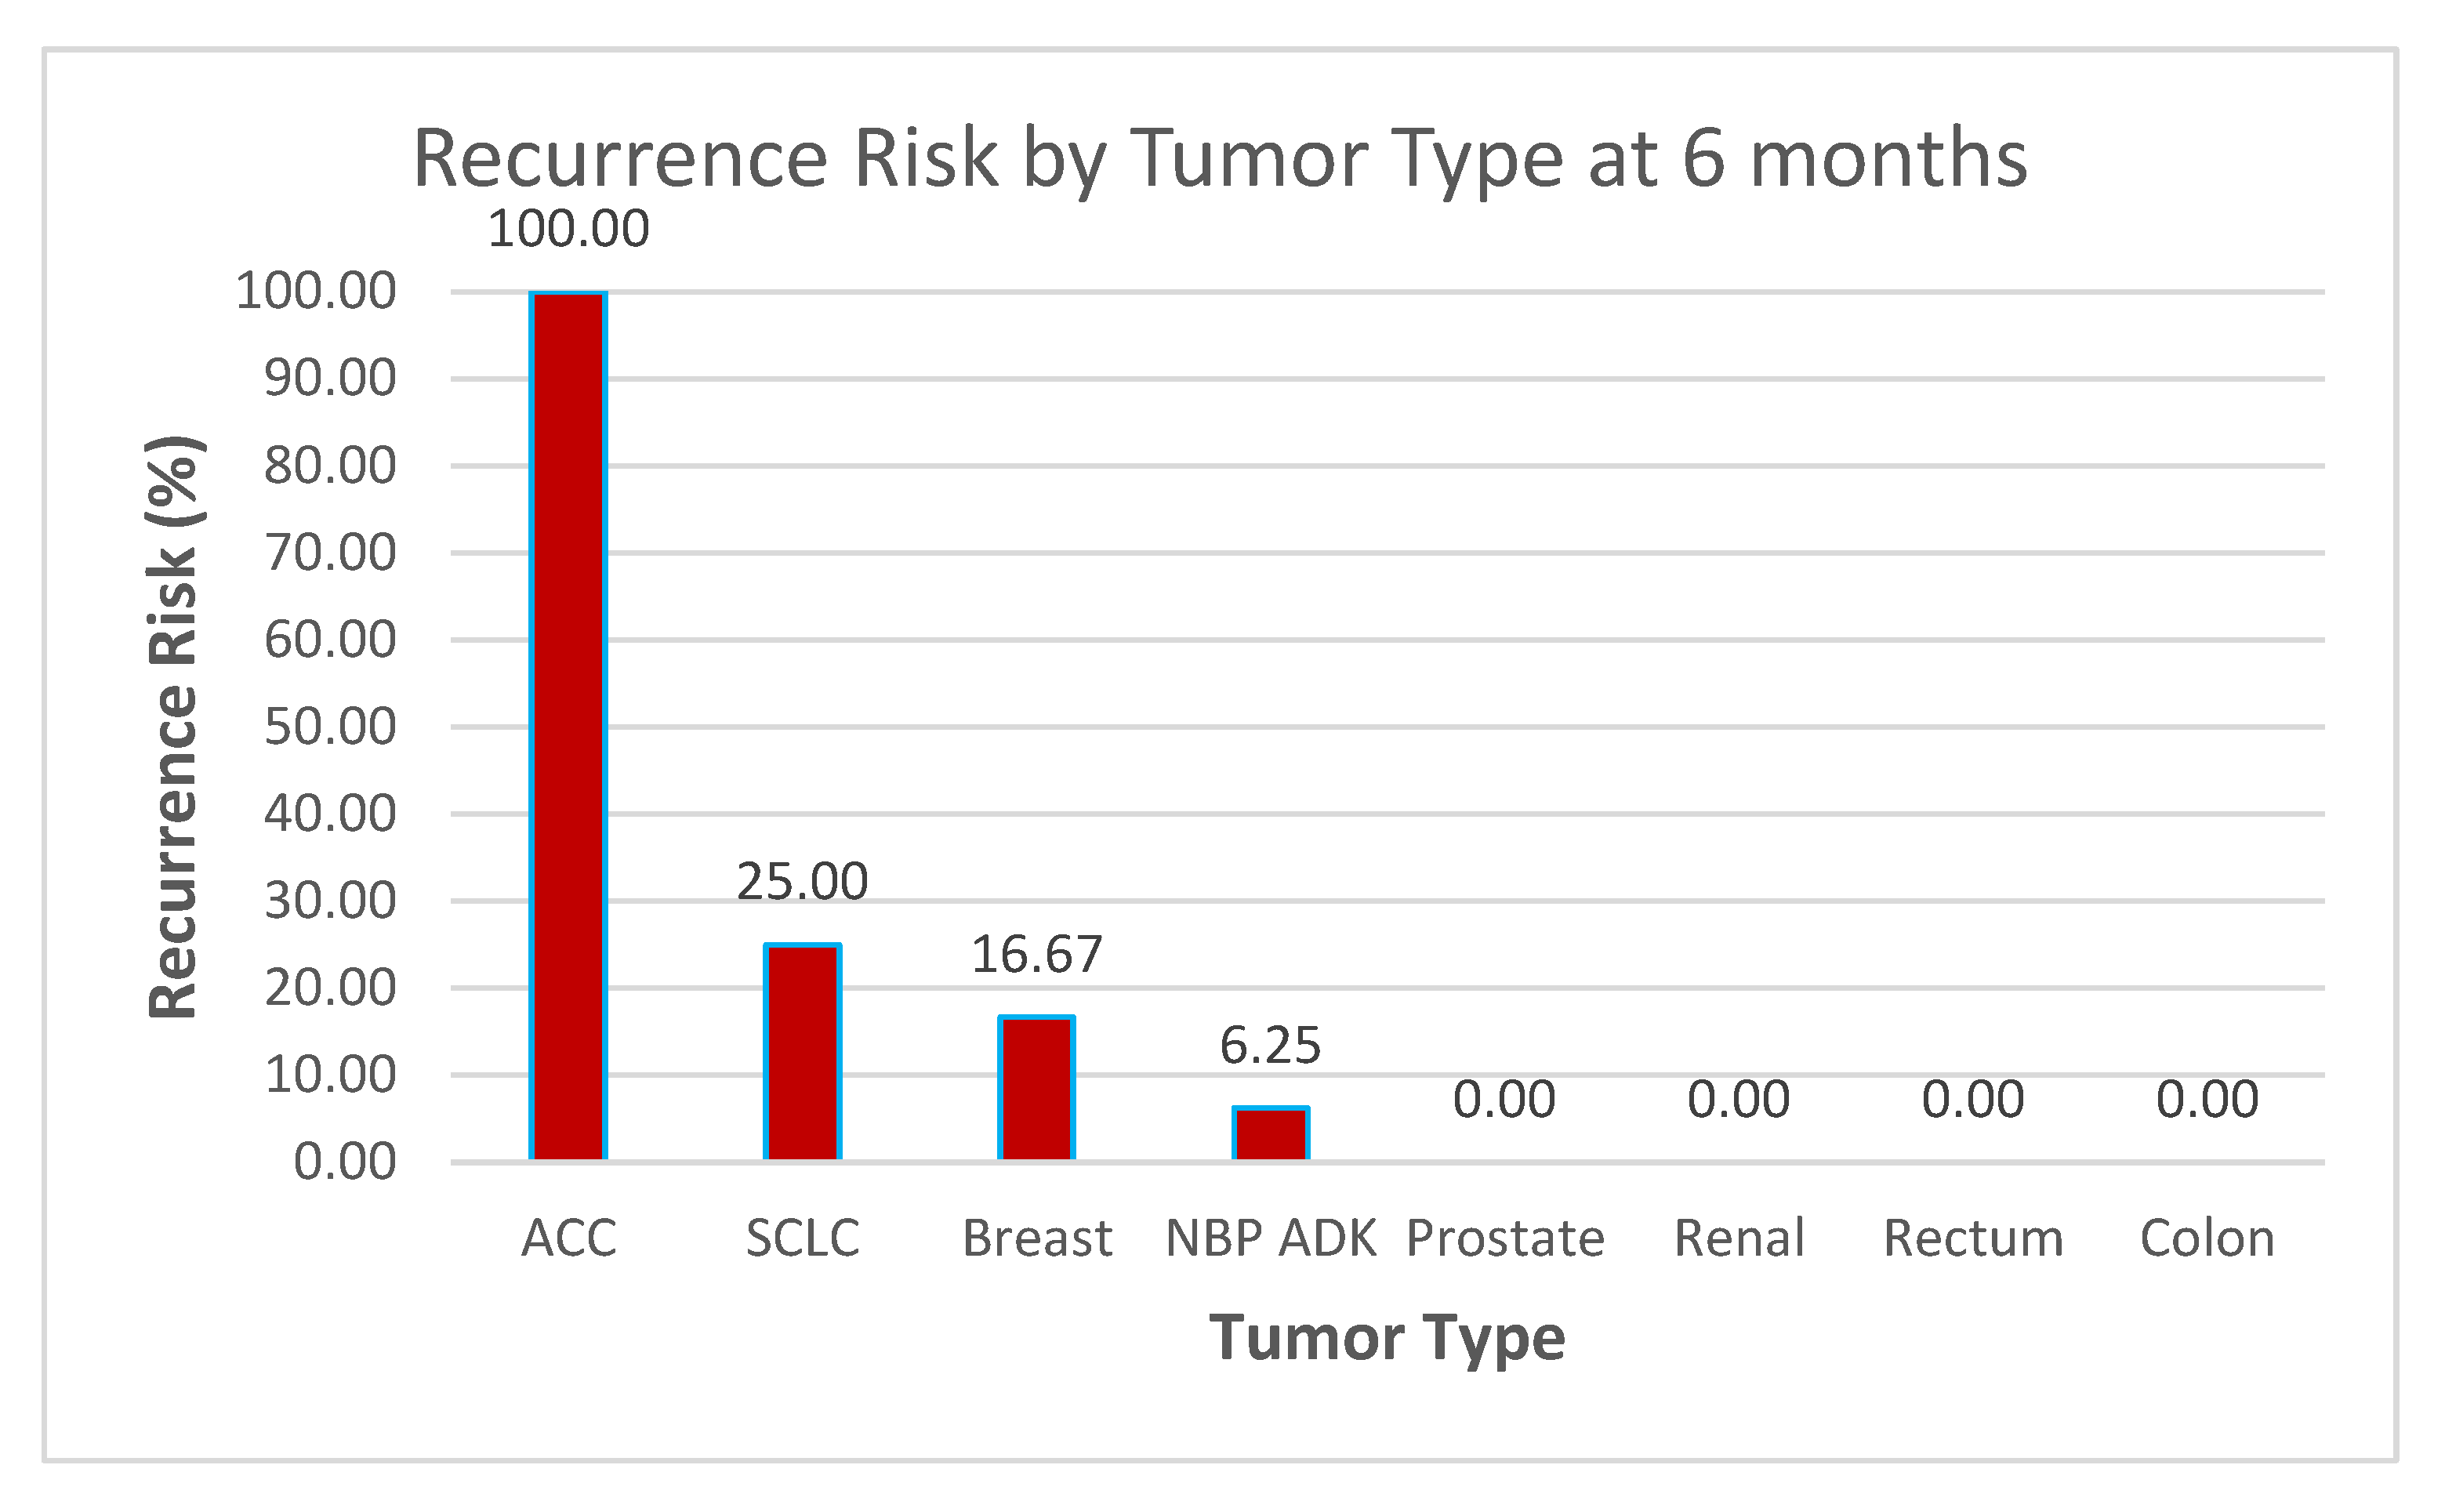
- The dataset of 60 patients provides a reasonable foundation for preliminary analysis, but statistical significance testing (e.g., confidence intervals, p-values) may be required to validate these trends, especially for tumor types with very low or 0% recurrence rates.
- ○
- High-Risk Groups
- ○
- ACC (100% recurrence at 6 months) and SCLC (25% at both 6 months and 1 year) stand out as high-risk groups.
- ○
- These results suggest the need for early aggressive therapy, frequent follow-up imaging, and perhaps investigation into genetic markers or treatment responses in these subtypes.
- ○
- Stable or Low-Risk Groups
- ○
- Tumor types such as prostate, renal, rectum, and colon (0% recurrence across both time points) appear to have low vulnerability to recurrence within the follow-up period.
- ○
- This could support less intensive follow-up protocols for these patients but should be monitored over longer periods to confirm trends.
Figure 18.
Recurrence Risk by Tumor Type at 6 months.
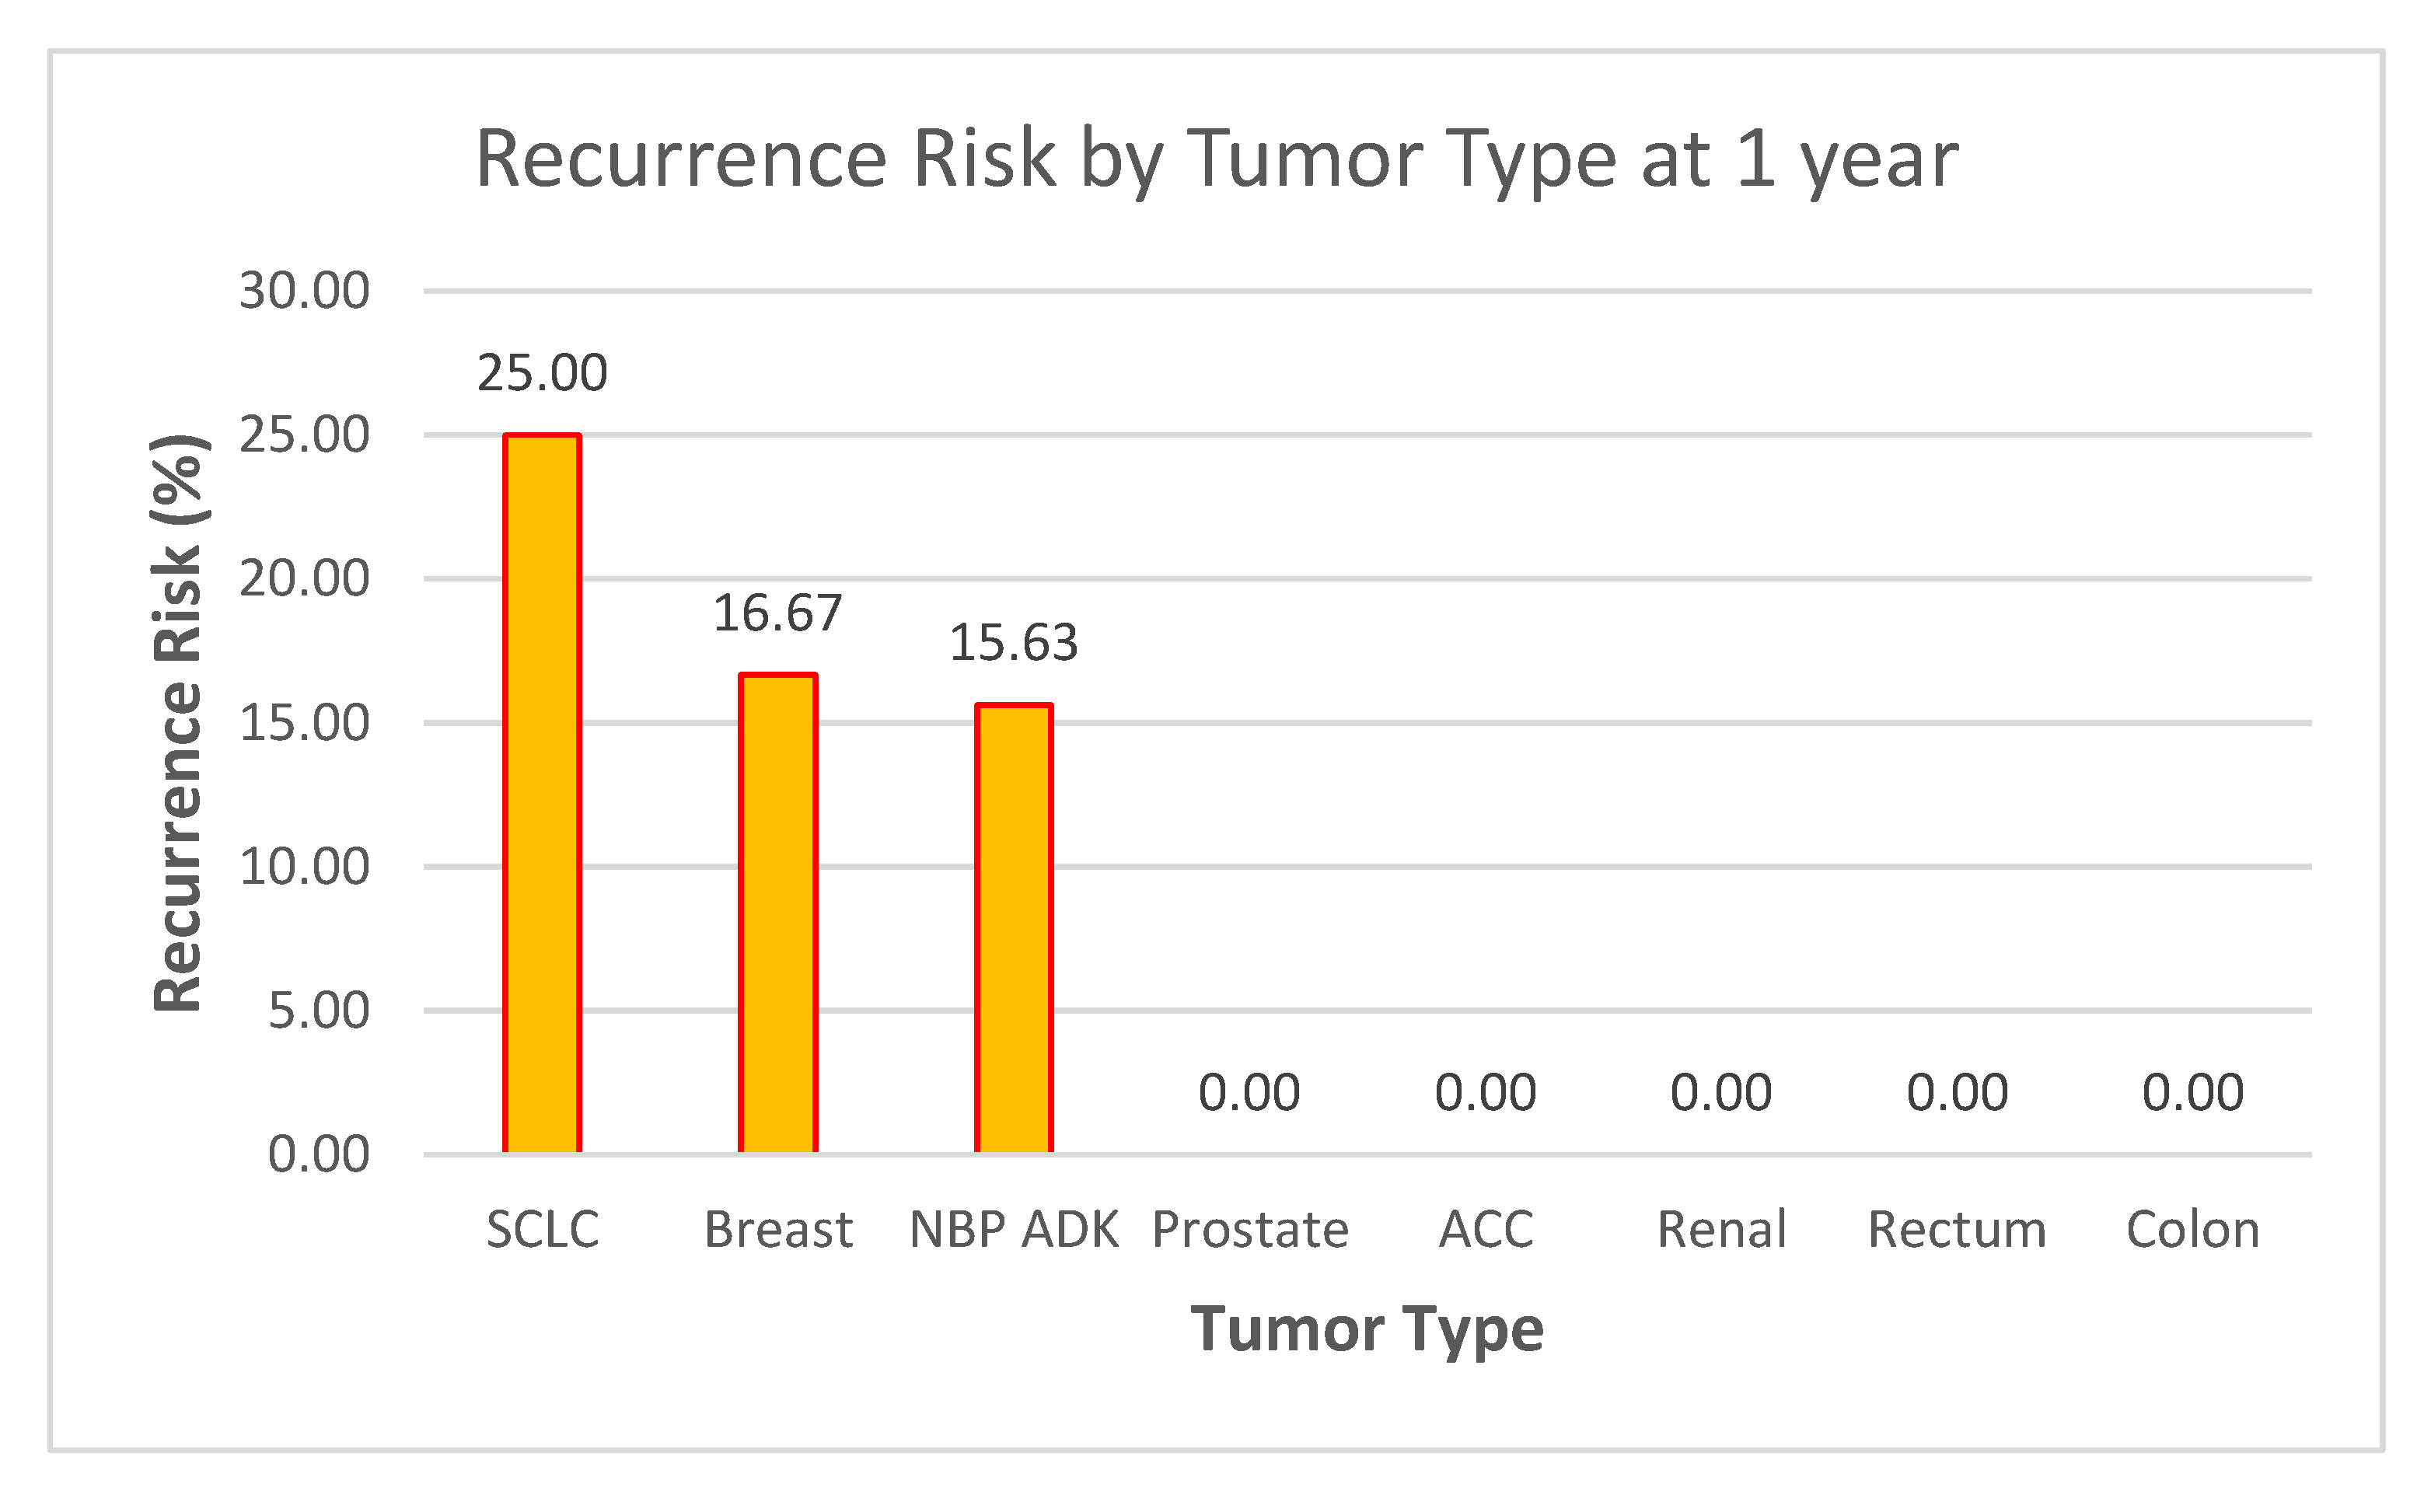
NBP ADK Trends
- ○
- The 6.25% risk at 6 months and 15.63% at 1 year suggest a gradual increase in recurrence.
- ○
- This highlights the importance of long-term monitoring and further exploration of risk factors specific to this group.
Figure 19.
Recurrence Risk by Tumor Type at 1 year.
3.5. Summary of Results
The baseline AlexNet model achieved 99.53% accuracy (95% CI: 98.90%–100.00%), demonstrating strong predictive capabilities for classifying brain metastases. However, minor misclassifications were observed in the regression and progression classes. Its performance metrics included a precision of 100% for regression and 99% for progression, with recall values of 100% and 100%, respectively, resulting in F1-scores of 100% and 99%.
The transfer learning (TL) model further improved performance, achieving 100% accuracy (95% CI: 100%–100%). This improvement was accompanied by perfect precision, recall, and F1-scores across all classes, along with an AUC of 1.0000 (95% CI: 1.0000–1.0000). These results highlight the effectiveness of combining transfer learning with dynamic class weighting, ensuring balanced predictions without sacrificing accuracy. The TL-enhanced model demonstrated perfect performance for regression and progression, highlighting its robustness and generalizability, even with a relatively small dataset.
3.5.1. Model Comparisons and Computational Efficiency
To further validate the performance, deeper architectures, including ResNet-50 and EfficientNet-B0, were evaluated. Both models achieved 100% accuracy (95% CI: 100%–100%), matching the TL-enhanced AlexNet in performance. However, the training time differed significantly:
- AlexNet (Baseline): 427.04 seconds
- AlexNet (TL): 420.12 seconds
- ResNet-50: 443.38 seconds
- EfficientNet-B0: 439.87 seconds
While the deeper models provided similar classification accuracy, their higher computational costs and longer training times emphasize the efficiency advantage of TL-enhanced AlexNet, making it a practical option for real-time clinical deployment.
3.5.2. Longitudinal Tumor Volume Analysis and Trends
Analysis of tumor volume dynamics over time revealed a significant reduction in tumor volumes following Gamma Knife radiosurgery (GKRS).
Key Observations:
- Tumor shrinkage patterns: Median tumor volumes decreased substantially at follow-up intervals (3, 6, 9, and 12 months). However, only 20% of patients achieved ≥90% volume reduction by the final time point.
- Correlation patterns: Pearson and Spearman correlations between initial tumor volume and final volume were r = 0.795 and r = 0.698, respectively, indicating a strong association between baseline size and long-term volume persistence.
3.5.3. Survival and Recurrence Trends
- Survival Rate: The 1-year survival rate was 63.33%, with recurrence rates of 10% at 6 months and 13.33% at 1 year.
- Hazard ratio analysis suggested that patients classified as progression had a 1.91-fold higher risk of recurrence or mortality compared to those in the regression group.
- Systemic therapy impact: Patients receiving systemic treatments demonstrated higher survival probabilities and lower recurrence rates, indicating a potential protective effect.
3.5.3. Predictive Analysis and Model Applications
- The AI model effectively captured tumor growth trends and recurrence risks through temporal volume analysis.
- While AlexNet (TL) demonstrated excellent performance with lower computational requirements, deeper architectures like ResNet and EfficientNet confirmed that additional complexity did not improve performance but resulted in higher computational costs.
3.5.4. Key Insights
The combination of AI-based classification and volumetric analysis demonstrated strong predictive performance and clinical applicability. The findings reinforce the role of AI models in enabling personalized treatment plans and risk stratification, particularly for patients at higher risk of recurrence or volume persistence.
The TL-enhanced AlexNet emerges as a clinically viable tool due to its balance between accuracy and computational efficiency, offering a cost-effective solution for real-time decision-making in clinical workflows.
4. Discussion
Application of AI Models in Brain Metastases Monitoring The application of AlexNet and transfer learning for classifying brain metastases evolution following Gamma Knife radiosurgery using MRI imaging is a specialized area of research. While there are studies employing AlexNet and transfer learning for brain tumor detection and classification using MRI images, specific research focusing on the evolution of brain metastases post-Gamma Knife radiosurgery appears to be limited.
This study distinguishes itself by evaluating post-treatment evolution of brain metastases following GKRS, incorporating longitudinal tumor volume analysis and integrating explainable AI for clinical decision support. Unlike prior studies that focused on initial detection, our approach predicts treatment responses and recurrence patterns, addressing a critical gap in post-treatment monitoring.
4.1. Comparison with Prior Work
Table 2 summarizes prior studies applying AlexNet and other deep learning models to brain tumor detection and classification, highlighting the novelty of this study in analyzing post-GKRS metastases evolution.
While prior studies focused on tumor detection, this study addresses post-treatment evolution using AI-driven analysis, filling a critical research gap.
4.2. Model Limitations and Overfitting Concerns
This study demonstrates that AlexNet, combined with transfer learning, can effectively classify the treatment outcomes of brain metastases after GKRS. The high performance of the model underscores its potential for clinical use, offering a non-invasive method for predicting treatment responses. The use of transfer learning improved classification accuracy despite the limited size of the dataset.
However, the model’s 100% accuracy on this dataset may not generalize to larger or more diverse populations. Key limitations include:
- Dataset Size and Diversity: Future studies must validate findings using multi-center datasets.
- Cross-validation for Robustness: Employing cross-validation techniques can mitigate overfitting.
- MRI Protocol Variability: Variations in scanner characteristics may impact reproducibility when scaling to external datasets.
While this study achieved high classification accuracy, we acknowledge the limitation of single-center data. The restricted availability of Gamma Knife facilities in Romania, combined with protocol variations in the second center, precludes multi-center validation within the country. However, the internal validation approach employed in this study—including stratified data splits and rigorous performance metrics—ensures robustness within the current dataset. Future research will explore collaborations with international centers following similar protocols to address this limitation and further evaluate generalizability.
This study relies exclusively on MRI imaging, consistent with standard Gamma Knife radiosurgery protocols, where PET-CT and other imaging modalities are not required for treatment planning. While multimodal imaging could offer complementary insights into metabolic activity, its omission does not affect the primary objectives of this study—monitoring tumor volume dynamics and classification of progression versus regression. Future research may consider integrating multimodal imaging for broader applications, such as differentiating necrosis from viable tumor tissue, but this lies outside the scope of the current work focused on GKRS-based treatment monitoring.
Despite achieving high classification accuracy, the risk of overfitting due to the relatively small dataset was addressed through several measures, including dropout layers, data augmentation, and L2 regularization. Dropout layers within the fully connected layers of AlexNet (dropout rate = 0.5) minimized reliance on specific neurons, and weight decay constrained model complexity. Furthermore, future studies will incorporate ensemble modeling approaches, such as bagging and boosting, to improve prediction stability. Explainability techniques, such as SHAP (SHapley Additive exPlanations), will also be implemented to assess feature importance and verify model stability in external datasets.
Computational Efficiency and Model Comparisons
In addition to performance metrics, this study compared the computational efficiency of different architectures. The TL-enhanced AlexNet model completed training in 420.12 seconds, outperforming deeper architectures such as ResNet-50 (443.38 seconds) and EfficientNet-B0 (439.87 seconds).
These findings highlight a trade-off between accuracy and computational cost, positioning TL-enhanced AlexNet as a practical solution for real-time deployment in clinical workflows where speed and simplicity are critical.
Clinical Deployment Challenges and Pathways
To facilitate clinical deployment, future studies should focus on:
- 5.
- Regulatory Approvals: Ensuring compliance with HIPAA and data privacy laws.
- 6.
- Usability Testing: Validating interface designs through clinician feedback to improve usability.
- 7.
- System Integration: Incorporating AI into PACS systems for workflow compatibility.
- 8.
- Pilot Testing: Conducting pilot clinical studies to measure real-world performance and decision-making impacts.
Ethical concerns and regulatory compliance are critical for integrating AI into clinical workflows. The proposed application adheres to privacy regulations such as HIPAA and GDPR, ensuring secure data handling. Future work should emphasize fairness audits to detect algorithmic bias and comply with regulatory pathways, including FDA 510(k) and CE certification. Transparent reporting mechanisms and explainable AI methods, such as Grad-CAM, further strengthen accountability and adoption by clinicians. Collaborative efforts with regulatory bodies are necessary to facilitate compliance, validation, and deployment in real-world settings.
Additionally, usability evaluations will assess interaction workflows, error rates, and satisfaction metrics among clinicians, while scalability tests will simulate deployment across diverse clinical infrastructures to validate performance and PACS interoperability.
4.3. Survival and Recurrence Analysis
Although this study focused on volumetric trends and recurrence rates, the absence of Kaplan-Meier survival curves limits time-to-event analysis. Future research should:
- Incorporate Kaplan-Meier and Cox regression models for survival predictions.
- Use hazard ratios and adjusted models to explore treatment effects further.
4.4. Future Directions
Clinical Relevance and Risk Stratification AI integration with imaging biomarkers and clinical parameters provides a transformative approach for predicting brain metastases evolution. By leveraging temporal trends, AI improves prognosis, enabling early detection and personalized treatment planning.
Multimodal Imaging and Genomics: Regarding genomic and molecular data, this study intentionally focuses on imaging biomarkers rather than integrating genetic or molecular profiling. While radiogenomics represents a promising field for future investigations, its inclusion requires a separate framework beyond the imaging-driven scope of this work. Future studies may explore the synergy between AI-based radiomics and genomic data to develop multi-omics models for comprehensive disease profiling and treatment response prediction.
Advanced Architectures: Comparative studies with recent architectures like Vision Transformers can further optimize performance without sacrificing interpretability.
Real-World Testing: Prospective studies should validate AI performance in multi-center trials, ensuring trust and usability in clinical workflows.
4.5. AI Model Implications for Clinical Practice
AI algorithms trained on sequential tumor volumes and recurrence patterns capture subtle trends missed in traditional assessments [34,35]. These insights support adaptive treatment protocols by dynamically adjusting therapy intensity and frequency based on AI predictions.
In conclusion, this study demonstrates that TL-enhanced AlexNet offers a clinically viable, accurate, and computationally efficient solution for monitoring brain metastases post-GKRS. Future research should focus on explainable AI frameworks to ensure transparency and promote broader adoption in clinical workflows.
5. Conclusions
This study demonstrates the potential of AlexNet combined with transfer learning to accurately classify brain metastases evolution following Gamma Knife radiosurgery [35].
The integration of AI-driven radiomics and a clinical decision support application offers a highly accurate and reliable approach to monitoring brain metastases post-GKRS. The transfer learning model achieved 100% classification performance, outperforming the baseline AlexNet model (99.53%) by eliminating misclassifications. These results confirm that dynamic class weighting and pretrained features enable robust generalization, making the system well-suited for real-world applications. Further validation with larger datasets will help solidify its role in clinical workflows.
Longitudinal analysis highlighted the significance of tumor volume dynamics and survival trends, providing a framework for integrating AI with traditional prognostic markers.
Incorporating time-to-event analyses, such as Kaplan-Meier survival curves and Cox regression modeling, will enable more granular evaluation of survival outcomes and recurrence risks, addressing current limitations in predictive modeling.
However, further validation with larger datasets, multimodal imaging, and genomic data is essential to enhance robustness and clinical applicability. Future research should also consider incorporating radiogenomic approaches to explore genetic predictors of treatment response and recurrence patterns.
Future work should also explore the integration of AI-powered tools within clinical workflows to facilitate real-time decision-making and personalized treatment strategies. Emphasis should be placed on improving interpretability and explainability of AI predictions to promote trust and adoption in clinical practice. Real-world deployment will require compliance with regulatory standards, including HIPAA, and integration with PACS systems for seamless data transfer.
This study demonstrates that TL-enhanced AlexNet offers a balanced approach by achieving perfect classification performance with reduced computational requirements compared to ResNet-50 and EfficientNet-B0. These findings reinforce its suitability for clinical environments requiring real-time AI predictions. Further validation with larger datasets and multimodal imaging will strengthen its role in personalized medicine and AI-powered diagnostics for brain metastases monitoring.
In summary, this study provides a foundation for AI-based monitoring of brain metastases following Gamma Knife radiosurgery. By combining radiomics, AI modeling, and explainability tools, it offers a promising path toward personalized treatment strategies and improved patient outcomes.
Author Contributions
Conceptualization: C.G.B., L.E., I.S., R.B.; data curation: I.S., R.B., D.V.; investigation: M.A., L.O., D.R.; software: C.G.B., R.B.; supervision: L.E., T.O.P., D.R.,M.A.; validation: R.B., M.A., D.V.; visualization: C.G.B., L.O., R.B.;writing—original draft: R.B., D.R., I.S.; writing—review and editing: D.V., L.O., D.R.; funding acquisition: L.E.,T.O.P., D.V. All authors have read and agreed to the published version of the manuscript.
Funding
This research received no external funding.
Institutional Review Board Statement
Since the study was retrospective, there was no need for approval from the Ethics Committee.
Informed Consent Statement
The study used only pre-existing medical data, therefore, patient consent was not required.
Data Availability Statement
The dataset used in this study is the property of Clinical Emergency Hospital “Prof. Dr. Nicolae Oblu” in Iasi and is hosted on Google Cloud. Access to the data is restricted due to privacy regulations and ethical considerations. Researchers interested in accessing the dataset may submit a formal request to Clinical Emergency Hospital “Prof. Dr. Nicolae Oblu” in Iasi at Gamma Knife Department gamma.oblu@gmail.com. Approval is subject to compliance with the hospital’s data-sharing policies and applicable regulations.
Acknowledgments
.
Conflicts of Interest
The authors declare no conflicts of interest.
References
- Esteva, A., et al. (2017). Dermatologist-level classification of skin cancer with deep neural networks. Nature, 542(7639), 115-118. [CrossRef]
- Fink KR, Fink JR. Imaging of brain metastases. Surg Neurol Int. 2013;4(Suppl 4):S209–S219. [CrossRef]
- Achrol AS, Rennert RC, Anders C, et al. Brain metastases. Nat Rev Dis Primers. 2019;5(1):5.
- Erickson, B. J., Korfiatis, P., Akkus, Z., Kline, T. L. (2017). Machine learning for medical imaging. Radiographics, 37(2), 505–515.
- Litjens, G., et al. (2017). A survey on deep learning in medical image analysis. Medical Image Analysis, 42, 60-88. [CrossRef]
- Nieder C, Grosu AL, Gaspar LE. Stereotactic radiosurgery (SRS) for brain metastases: a systematic review. Radiat Oncol. 2014;9:155. [CrossRef]
- Suh JH, Kotecha R, Chao ST, Ahluwalia MS, Sahgal A, Chang EL. Current approaches to the management of brain metastases. Nat Rev Clin Oncol. 2020;17(5):279–299. [CrossRef]
- Pope WB. Brain metastases: neuroimaging. Handb Clin Neurol. 2018;149:89–112.
- Patel SH, Robbins JR, Gore EM, et al. ; Expert Panel on Radiation Oncology–Brain Metastases . ACR Appropriateness Criteria® follow-up and retreatment of brain metastases. Am J Clin Oncol. 2012;35(3):302–306.
- Tajbakhsh, N., et al. (2016). Convolutional neural networks for medical image analysis: Full training or fine-tuning? IEEE Transactions on Medical Imaging, 35(5), 1299–1312.
- Triebel KL, Gerstenecker A, Meneses K, et al. Capacity of patients with brain metastases to make treatment decisions. Psychooncology. 2015;24(11):1448–1455. [CrossRef]
- Nishikawa RM, Schmidt RA, Linver MN, Edwards AV, Papaioannou J, Stull MA. Clinically missed cancer: how effectively can radiologists use computer-aided detection? AJR Am J Roentgenol. 2012;198(3):708–716.
- Ambrosini RD, Wang P, O’Dell WG. Computer-aided detection of metastatic brain tumors using automated three-dimensional template matching. J Magn Reson Imaging. 2010;31(1):85–93. [CrossRef]
- Bousabarah K, Ruge M, Brand JS, et al. Deep convolutional neural networks for automated segmentation of brain metastases trained on clinical data. Radiat Oncol. 2020;15(1):87. [CrossRef]
- He, K., Zhang, X., Ren, S., Sun, J. (2016). Deep residual learning for image recognition. IEEE Conference on Computer Vision and Pattern Recognition (CVPR).
- Simonyan, K., Zisserman, A. (2014). Very deep convolutional networks for large-scale image recognition. arXiv preprint arXiv:1409.1556.
- Charron O, Lallement A, Jarnet D, Noblet V, Clavier JB, Meyer P. Automatic detection and segmentation of brain metastases on multimodal MR images with a deep convolutional neural network. Comput Biol Med. 2018;95:43–54. [CrossRef]
- Dikici E, Ryu JL, Demirer M, et al. Automated brain metastases detection framework for T1-weighted contrast-enhanced 3D MRI. IEEE J Biomed Health Inform. 2020;24(10):2883–2893. [CrossRef]
- Jochems, A., et al. (2016). Distributed learning: Developing a predictive model based on data from multiple hospitals without data leaving the hospital – A real life proof of concept. Radiotherapy and Oncology, 121(3), 459–467. [CrossRef]
- Hosny, A., Parmar, C., Quackenbush, J., Schwartz, L. H., Aerts, H. J. W. L. (2018). Artificial intelligence in radiology. Nature Reviews Cancer, 18(8), 500–510.
- Shorten C, Khoshgoftaar TM. A survey on image data augmentation for deep learning. J Big Data. 2019;6(1):60. [CrossRef]
- https://github.com/alincbuz/gamma_knife.
- Selvaraju RR, Cogswell M, Das A, et al. Grad-CAM: Visual Explanations from Deep Networks via Gradient-based Localization. IEEE International Conference on Computer Vision (ICCV). 2017.
- Aerts HJWL, Velazquez ER, Leijenaar RT, et al. Decoding tumour phenotype by noninvasive imaging using a quantitative radiomics approach. Nat Commun. 2014;5:4006. [CrossRef]
- Huang Y, Liu Z, He L, Chen X, Pan D, Ma Z, Liang C, Tian J, Liang C. Radiomics Signature: A Potential Biomarker for the Prediction of Disease-Free Survival in Early-Stage (I or II) Non-Small Cell Lung Cancer. Radiology. 2016 Dec;281(3):947-957. [CrossRef]
- R. Anita Jasmine , P. Arockia Jansi Rani, Brain tumor classification using SVM based AlexNet, Journal of University of Shanghai for Science and Technology, Volume 22, Issue 10, October - 2020.
- Kapadnis, Aboli (2021) Brain Tumor Detection using Transfer Learning Technique with AlexNet and CNN. Masters thesis, Dublin, National College of Ireland.
- Buzea, C. G., Buga, R., Paun, M. -A., Albu, M., Iancu, D. T., Dobrovat, B., Agop, M., Paun, V. -P., & Eva, L. (2023). AI Evaluation of Imaging Factors in the Evolution of Stage-Treated Metastases Using Gamma Knife. Diagnostics, 13(17), 2853.
- Azhagiri, M., AU - Rajesh, P. 2024, EAN: enhanced AlexNet deep learning model to detect brain tumor using magnetic resonance images, Multimedia Tools and Applications 83(25) 66925-66941.
- Zhuodiao Kuang, Transfer Learning in Brain Tumor Detection: from AlexNet to Hyb-DCNN-ResNet, Highlights in Science, Engineering and Technology , Volume 4 (2022) 313-324.
- Sunita M. Kulkarni, G. Sundari, Comparative analysis of performance of deep CNN based framework for brainMRI classification using transfer learning, Journal of engineering science and technology Vol. 16, no. 4 (2021) 2901 – 2917.
- S. Nidaan Khofiya, Y. Nur Fu’adah, N. Kumalasari Caecar Pratiwi, R. Ilmi Naufal and A. Deta Pratama, Brain Tumor Classification Based On MRI Image Processing With Alexnet Architecture, 2022 IEEE Asia Pacific Conference on Wireless and Mobile (APWiMob), Bandung, Indonesia, 2022, pp. 1-6.
- B. Taşci, “A Classification Method for Brain MRI via AlexNet,” 2021 International Conference on Disruptive Technologies for Multi-Disciplinary Research and Applications (CENTCON), Bengaluru, India, 2021, pp. 347-350.
- Lundervold AS, Lundervold A. An overview of deep learning in medical imaging focusing on MRI. Z Med Phys. 2019 May;29(2):102-127.
- Topol, E. J. (2019). High-performance medicine: the convergence of human and artificial intelligence. Nature Medicine, 25(1), 44–56. [CrossRef]
Figure 1.
Gender distribution of the patients studied.
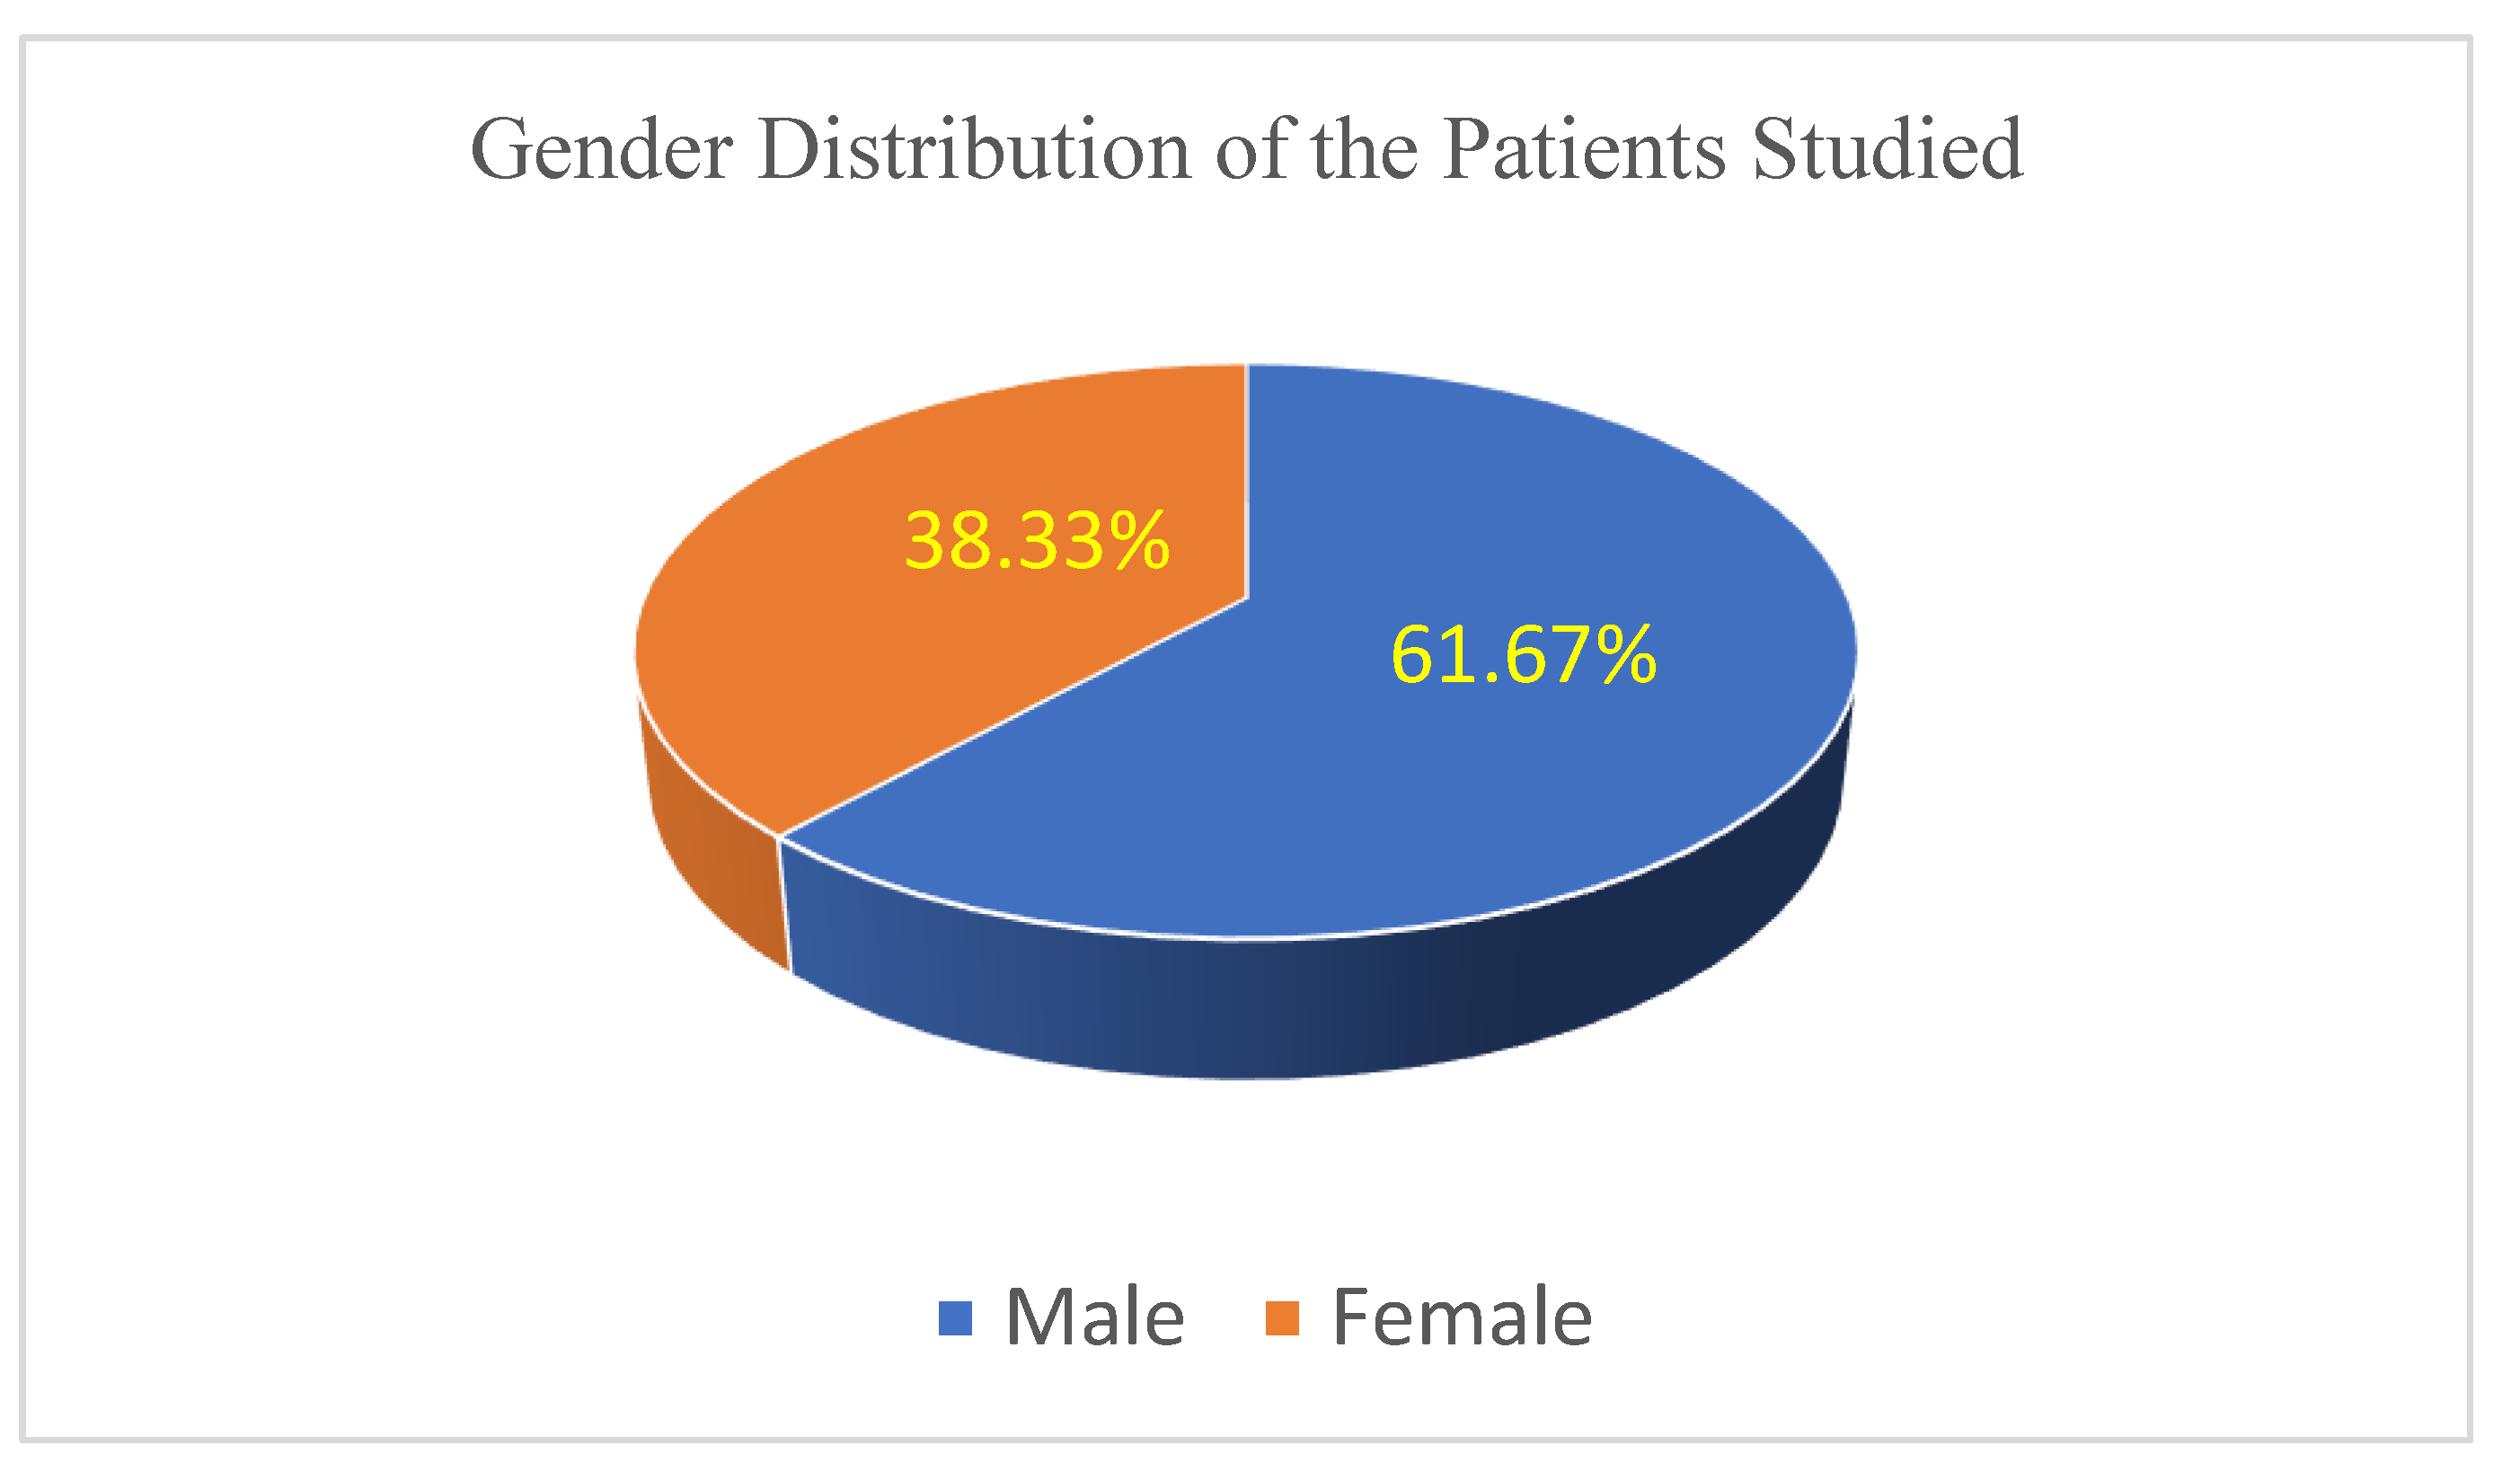
Figure 2.
Age distribution of patients.
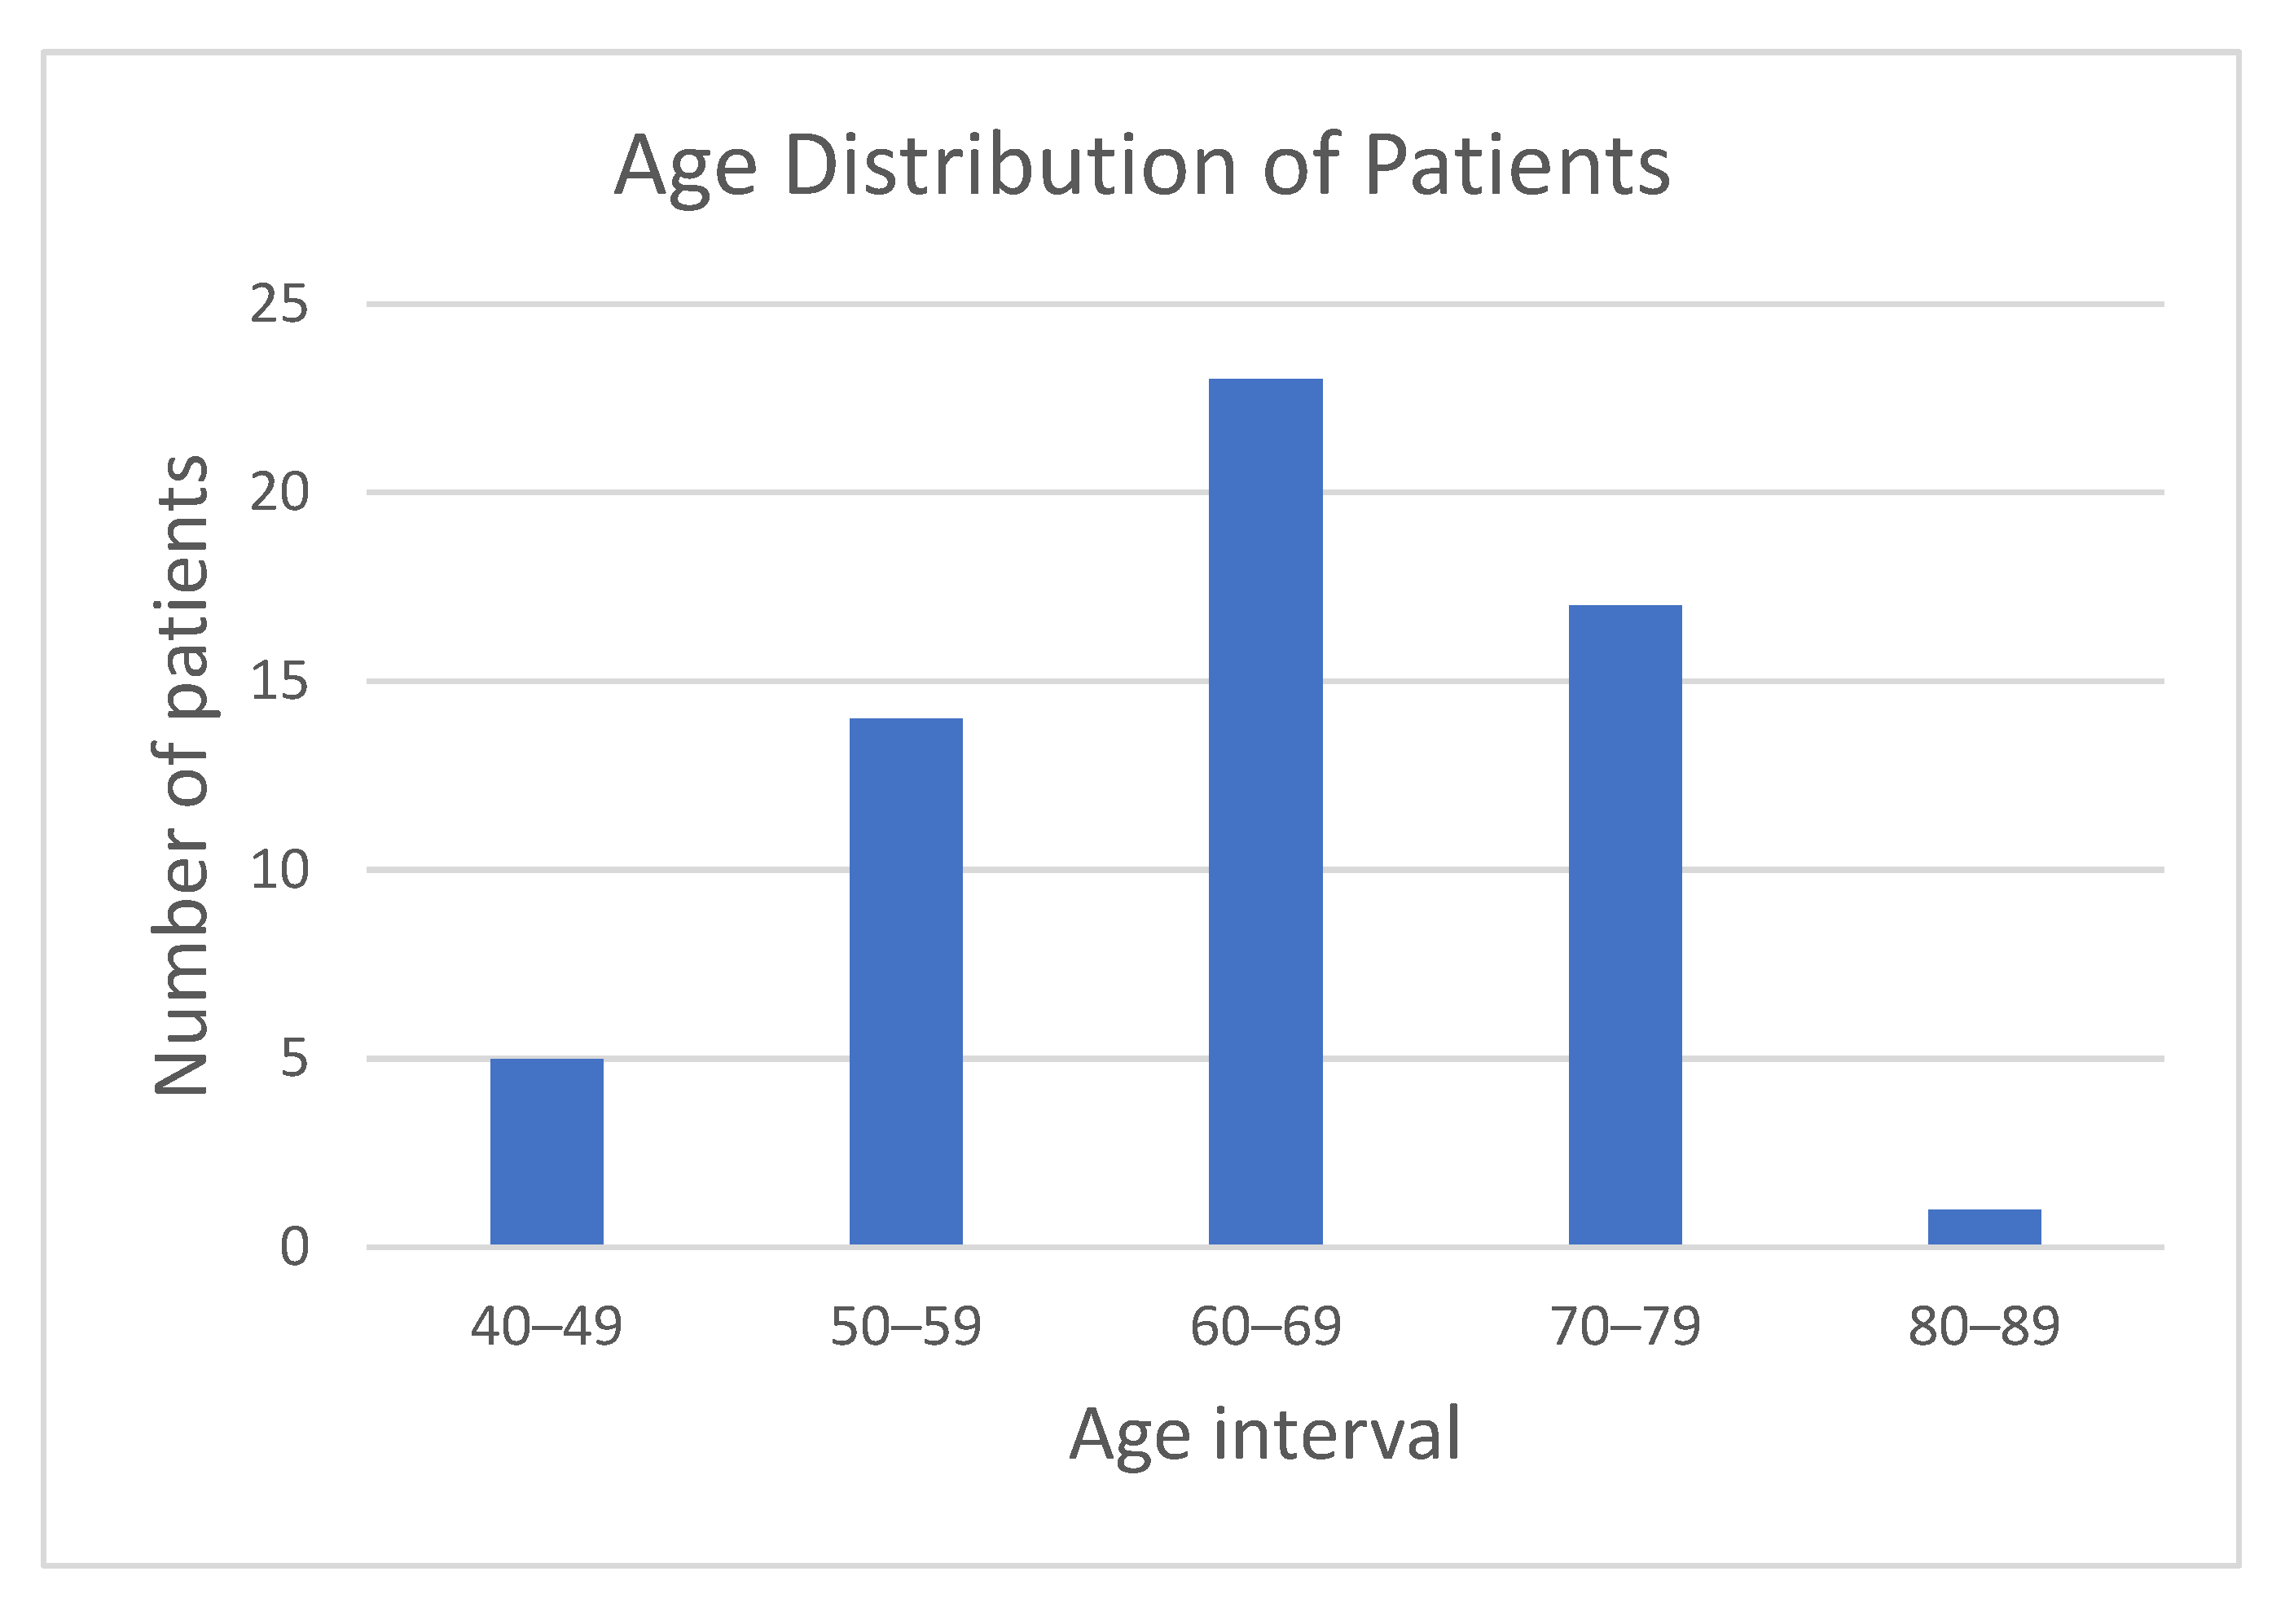
Figure 3.
Volumetric distribution of lesions chart.
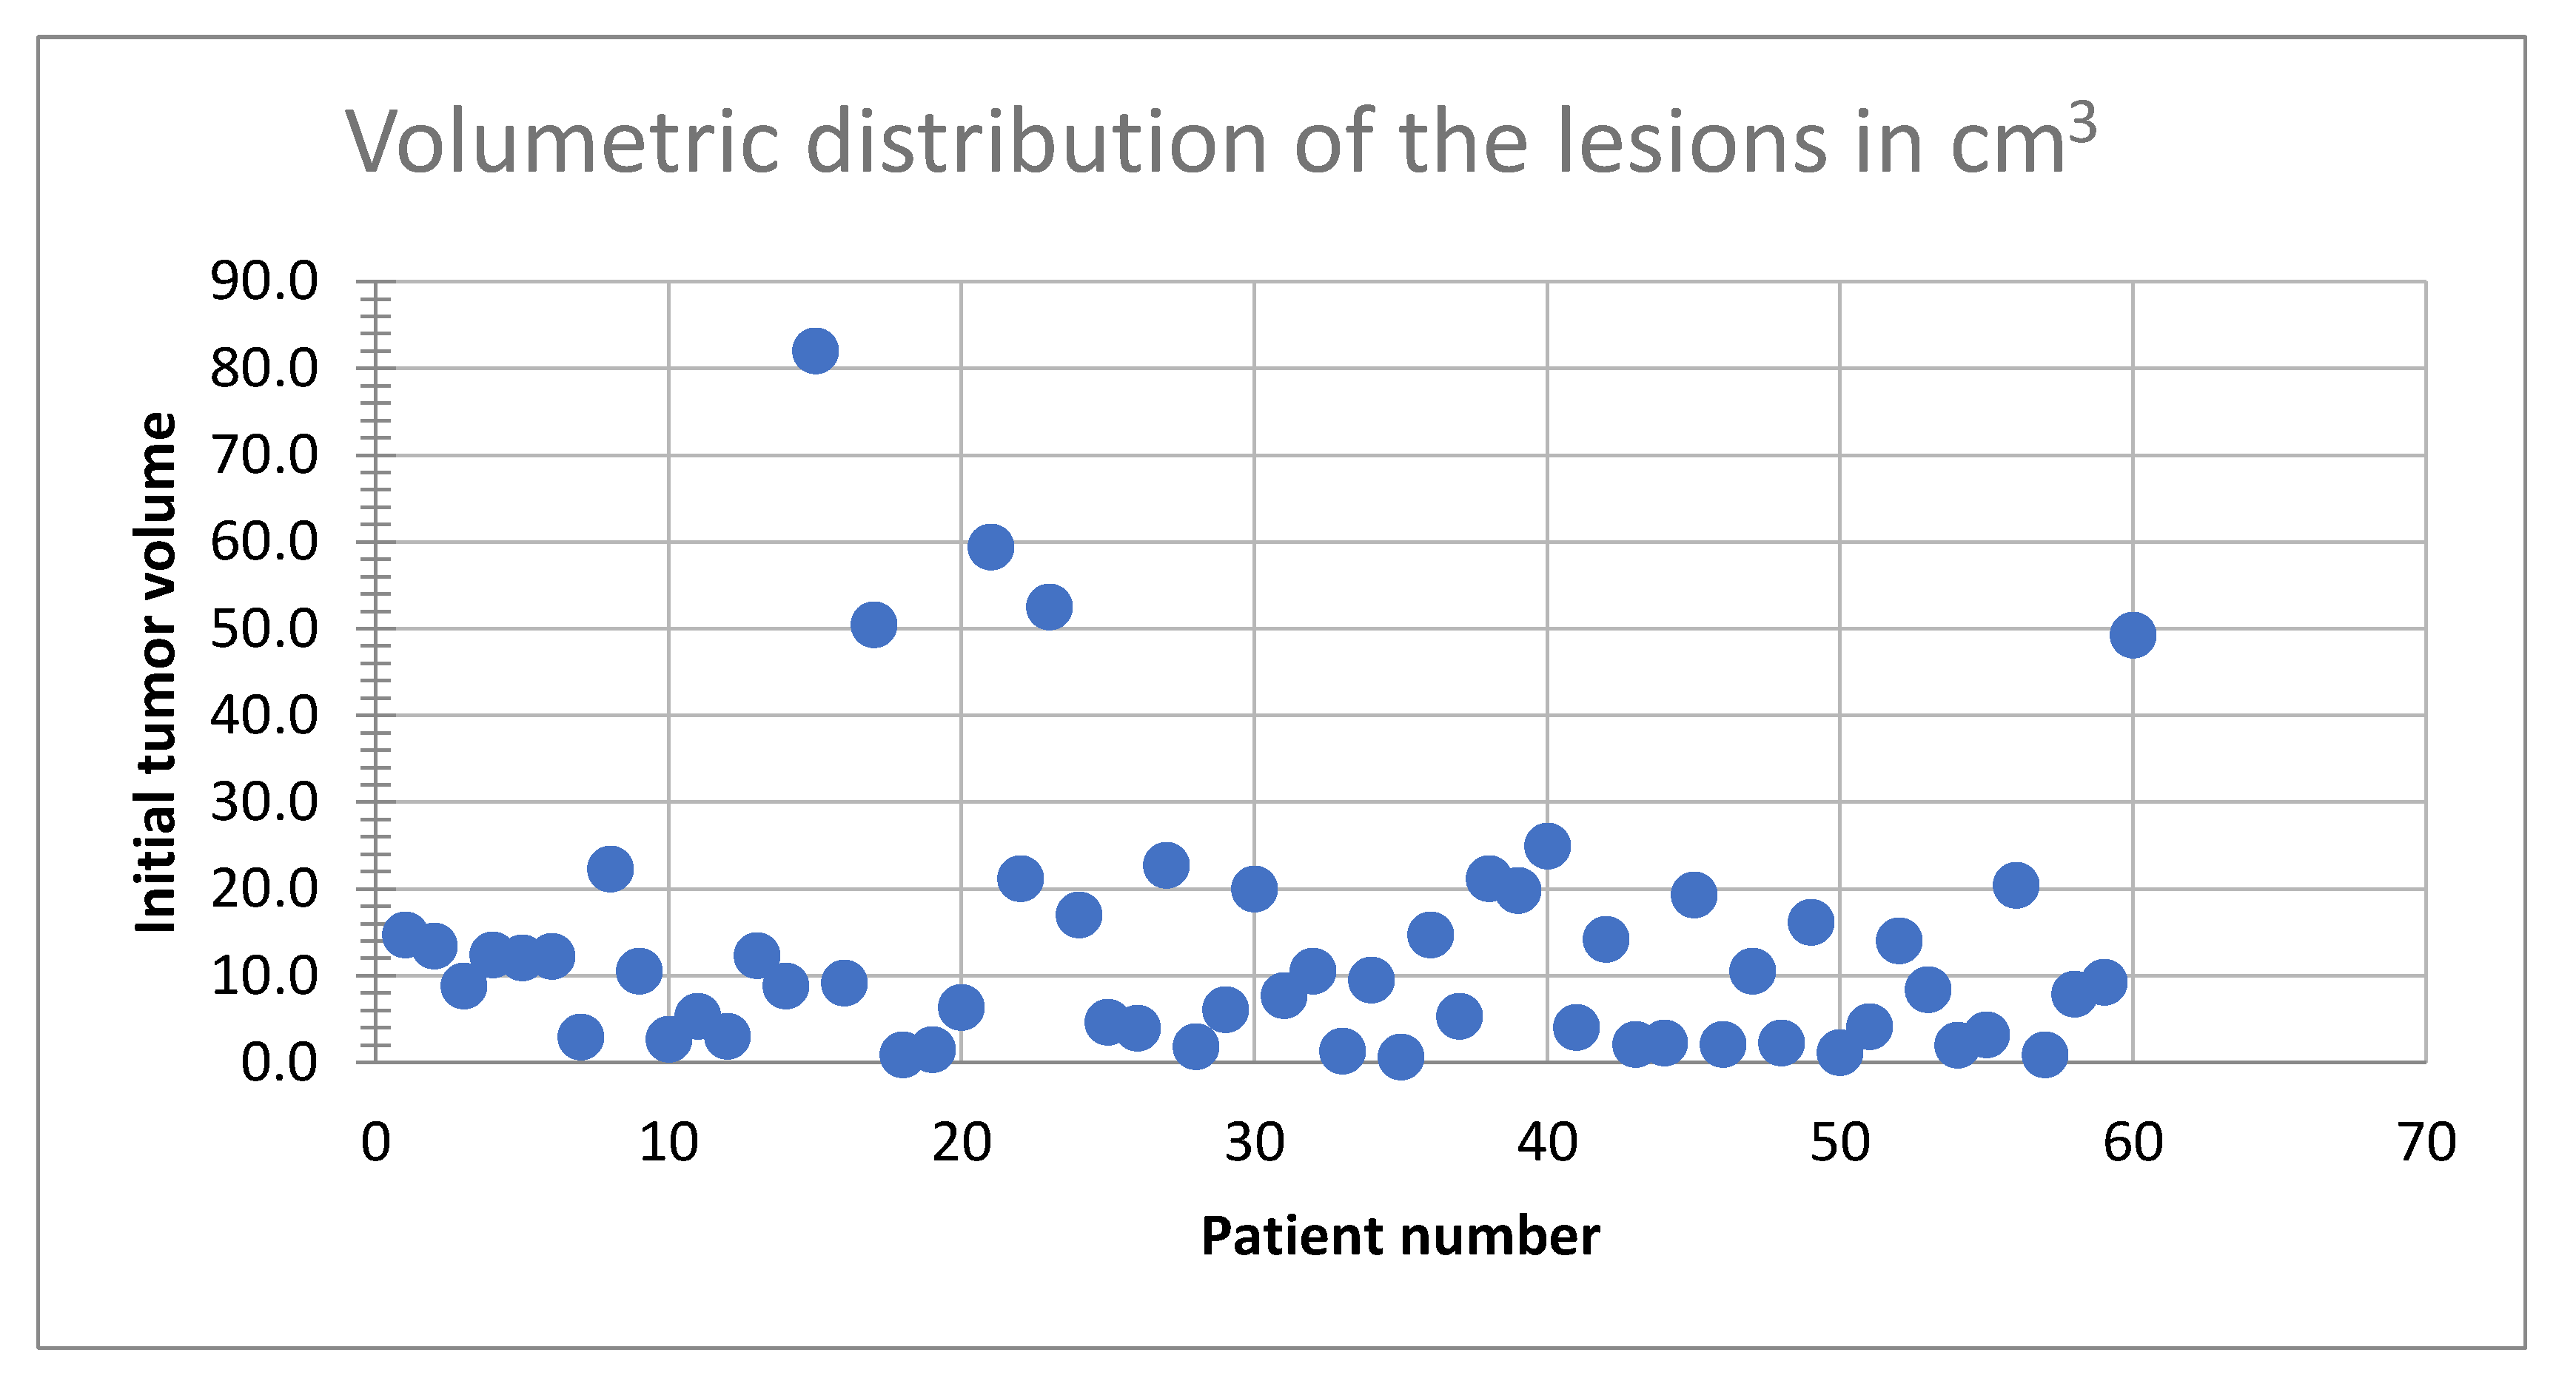
Figure 4.
Primary tumor origins chart.
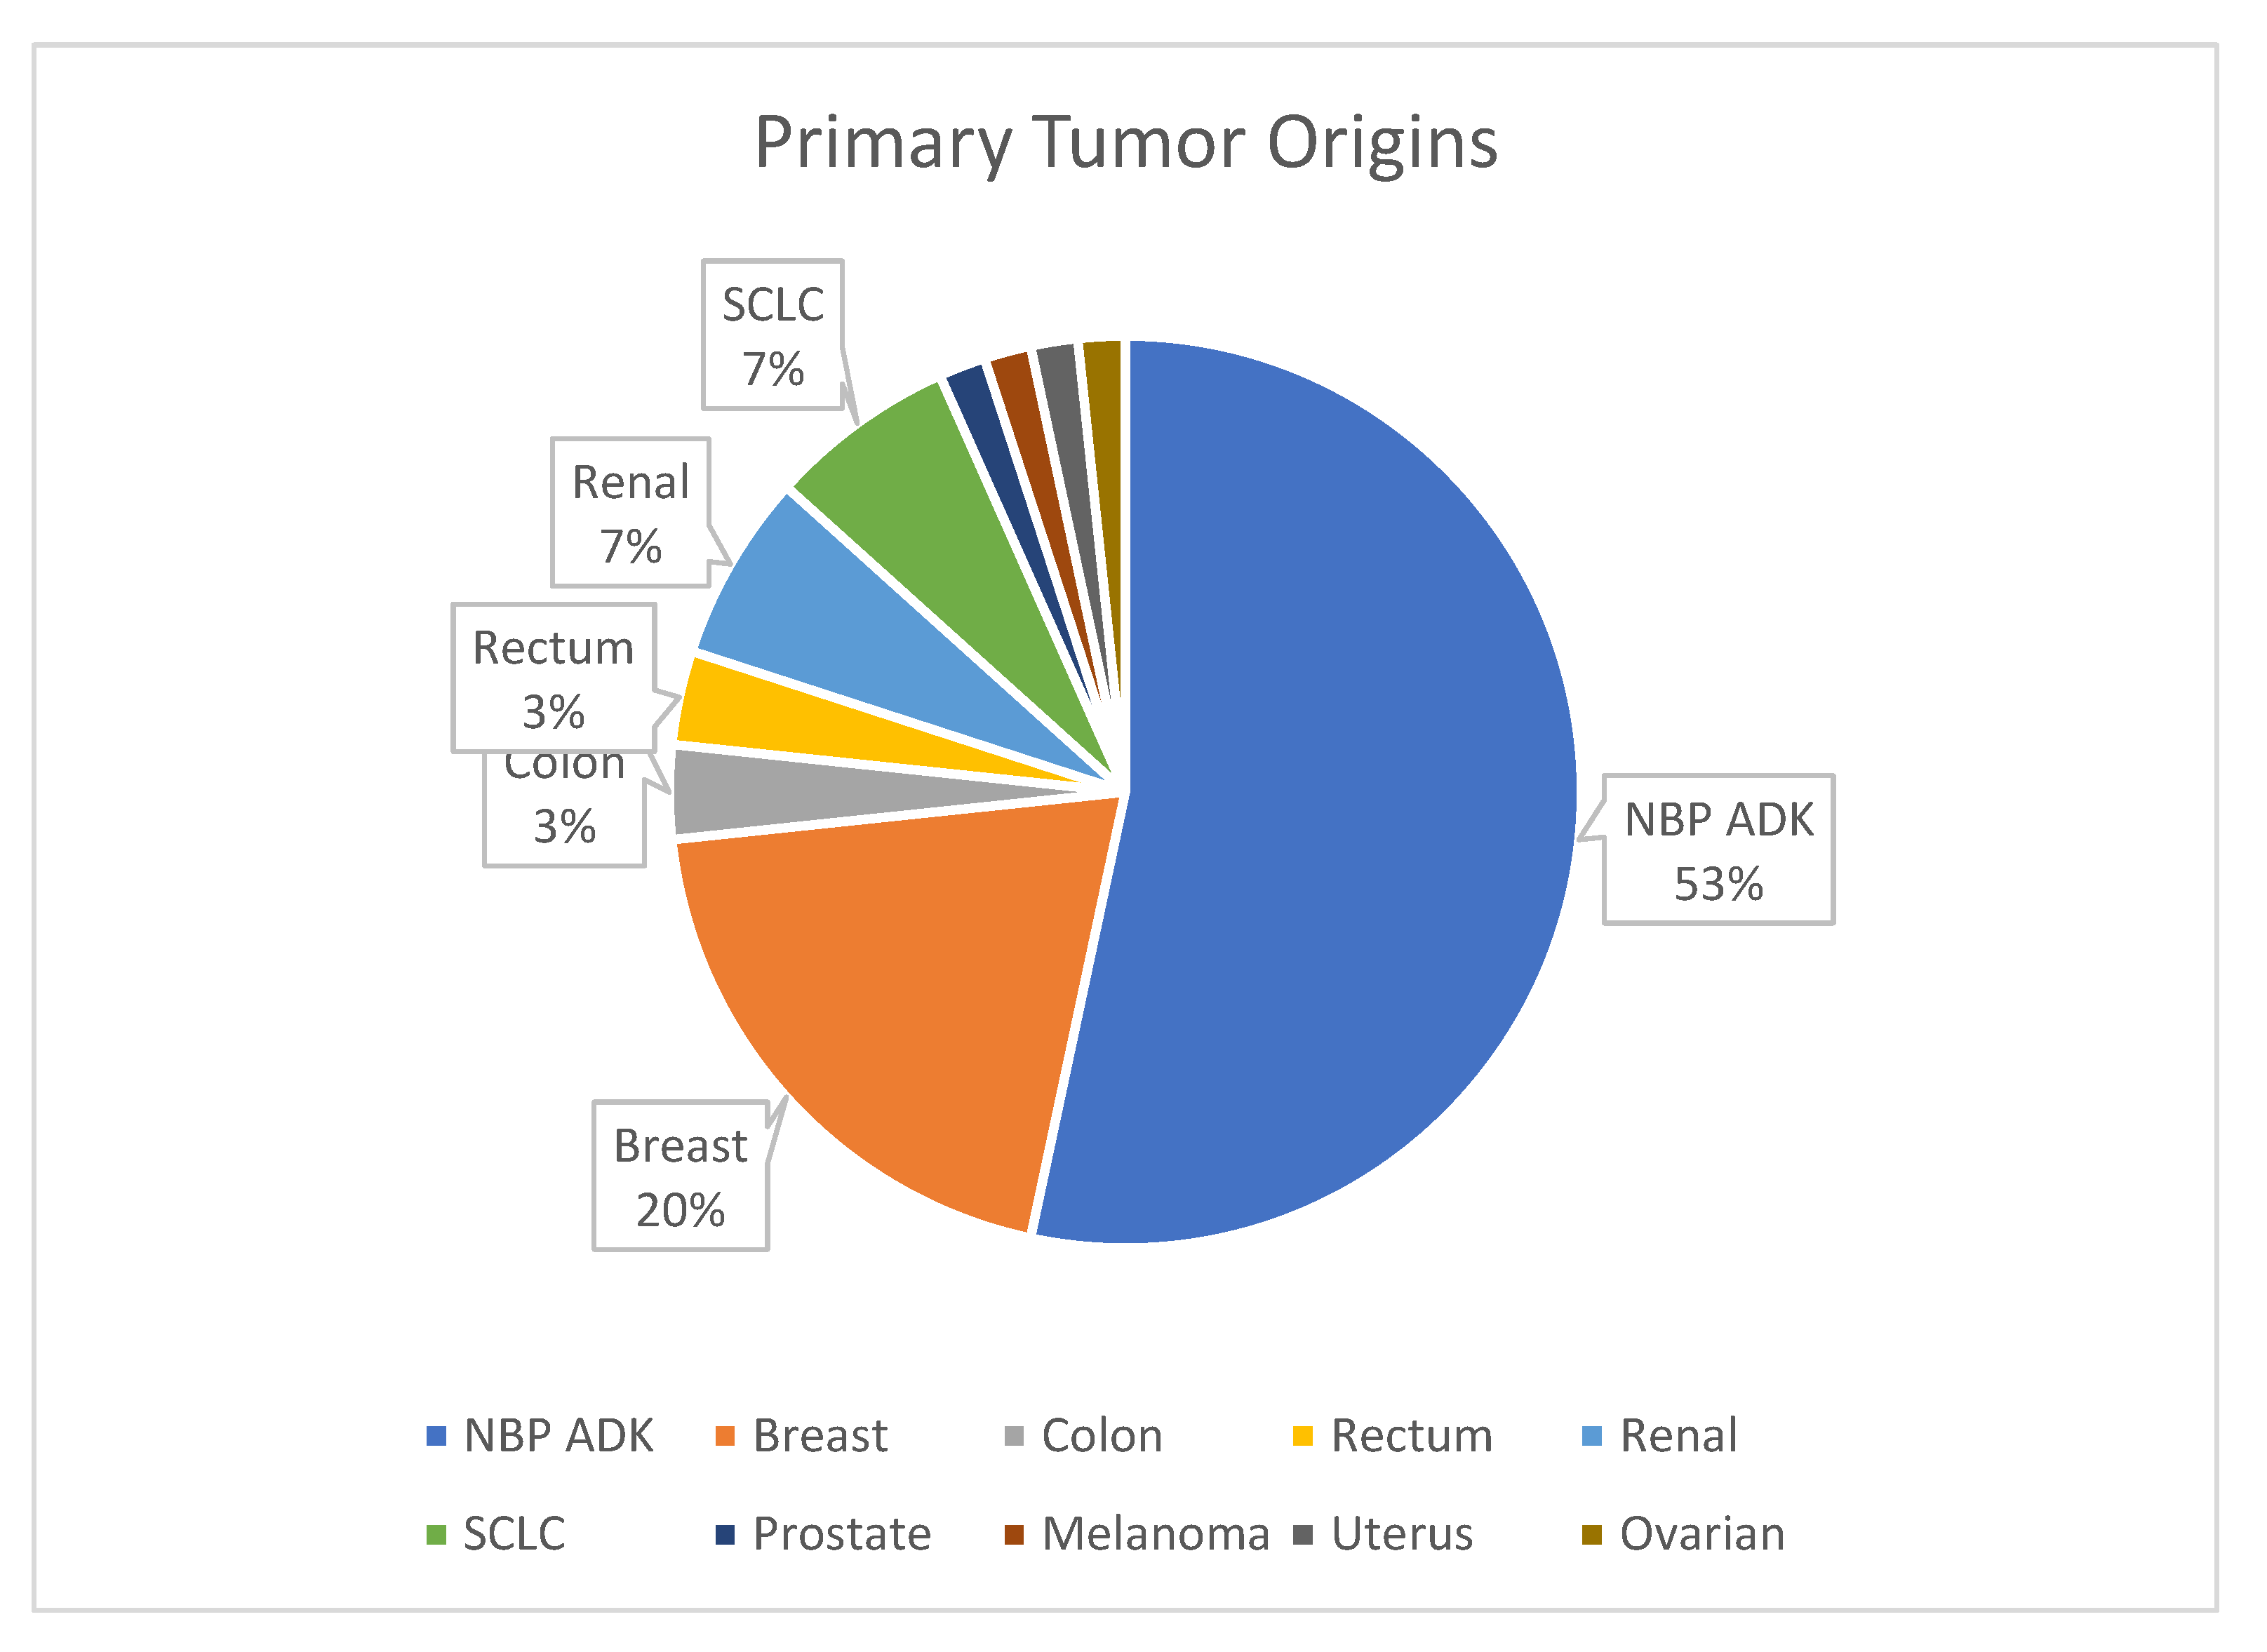
Figure 8.
Visualization of Model Interpretability using Grad-CAM and SmoothGrad-like Grad-CAM Techniques.
Figure 8.
Visualization of Model Interpretability using Grad-CAM and SmoothGrad-like Grad-CAM Techniques.
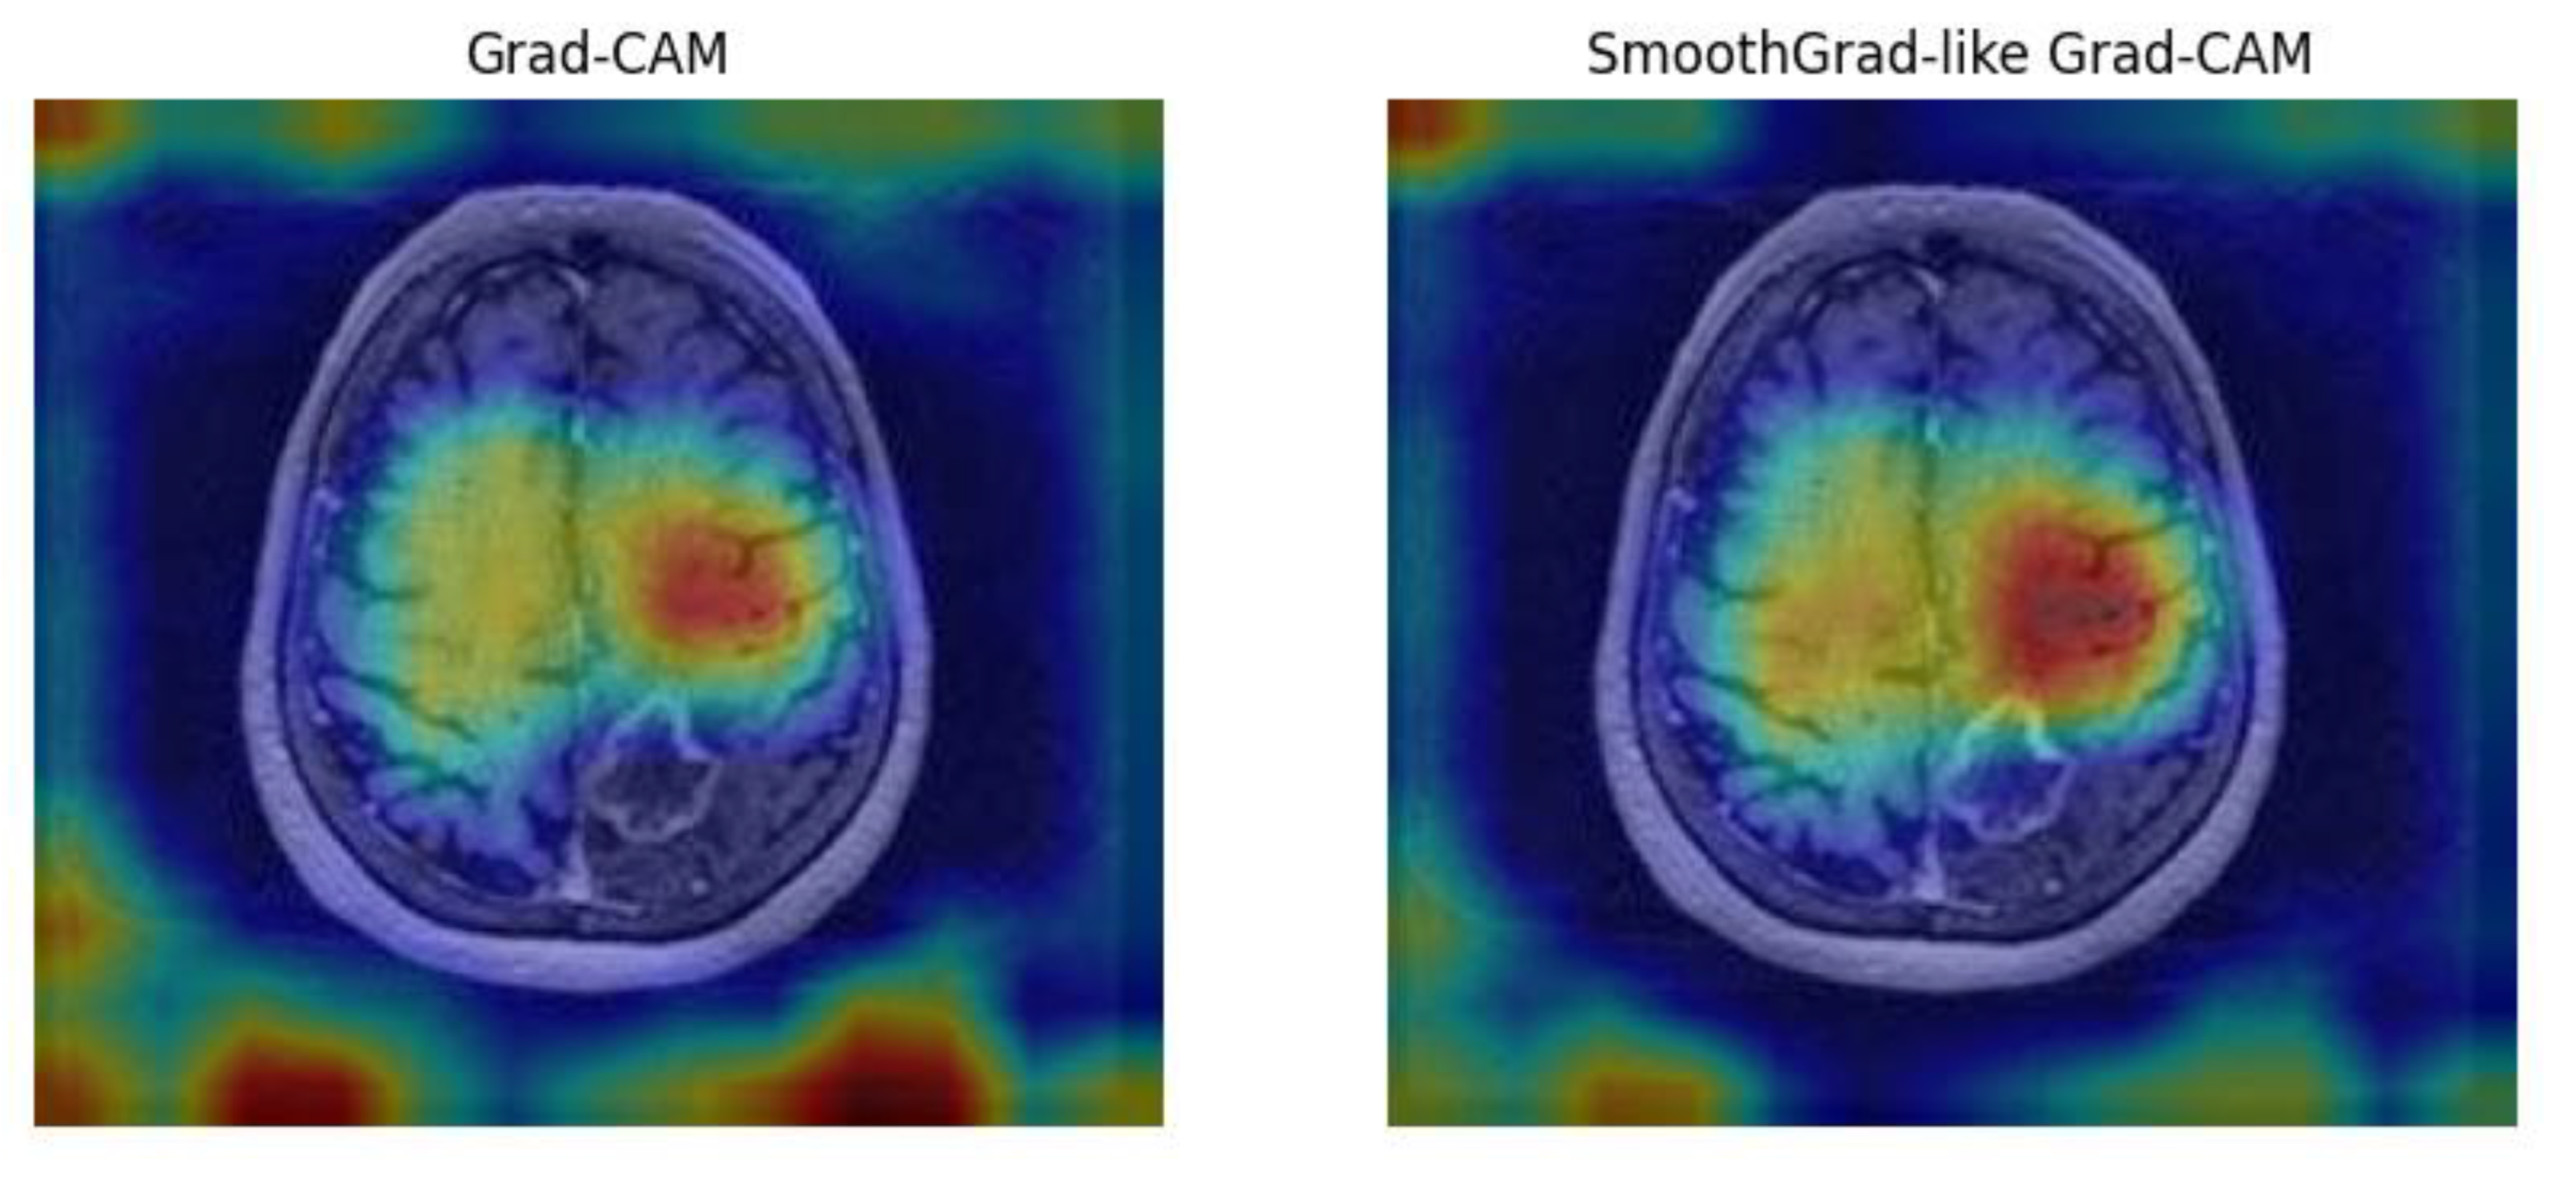
Figure 12.
Survival rate of the patients after 1 year.
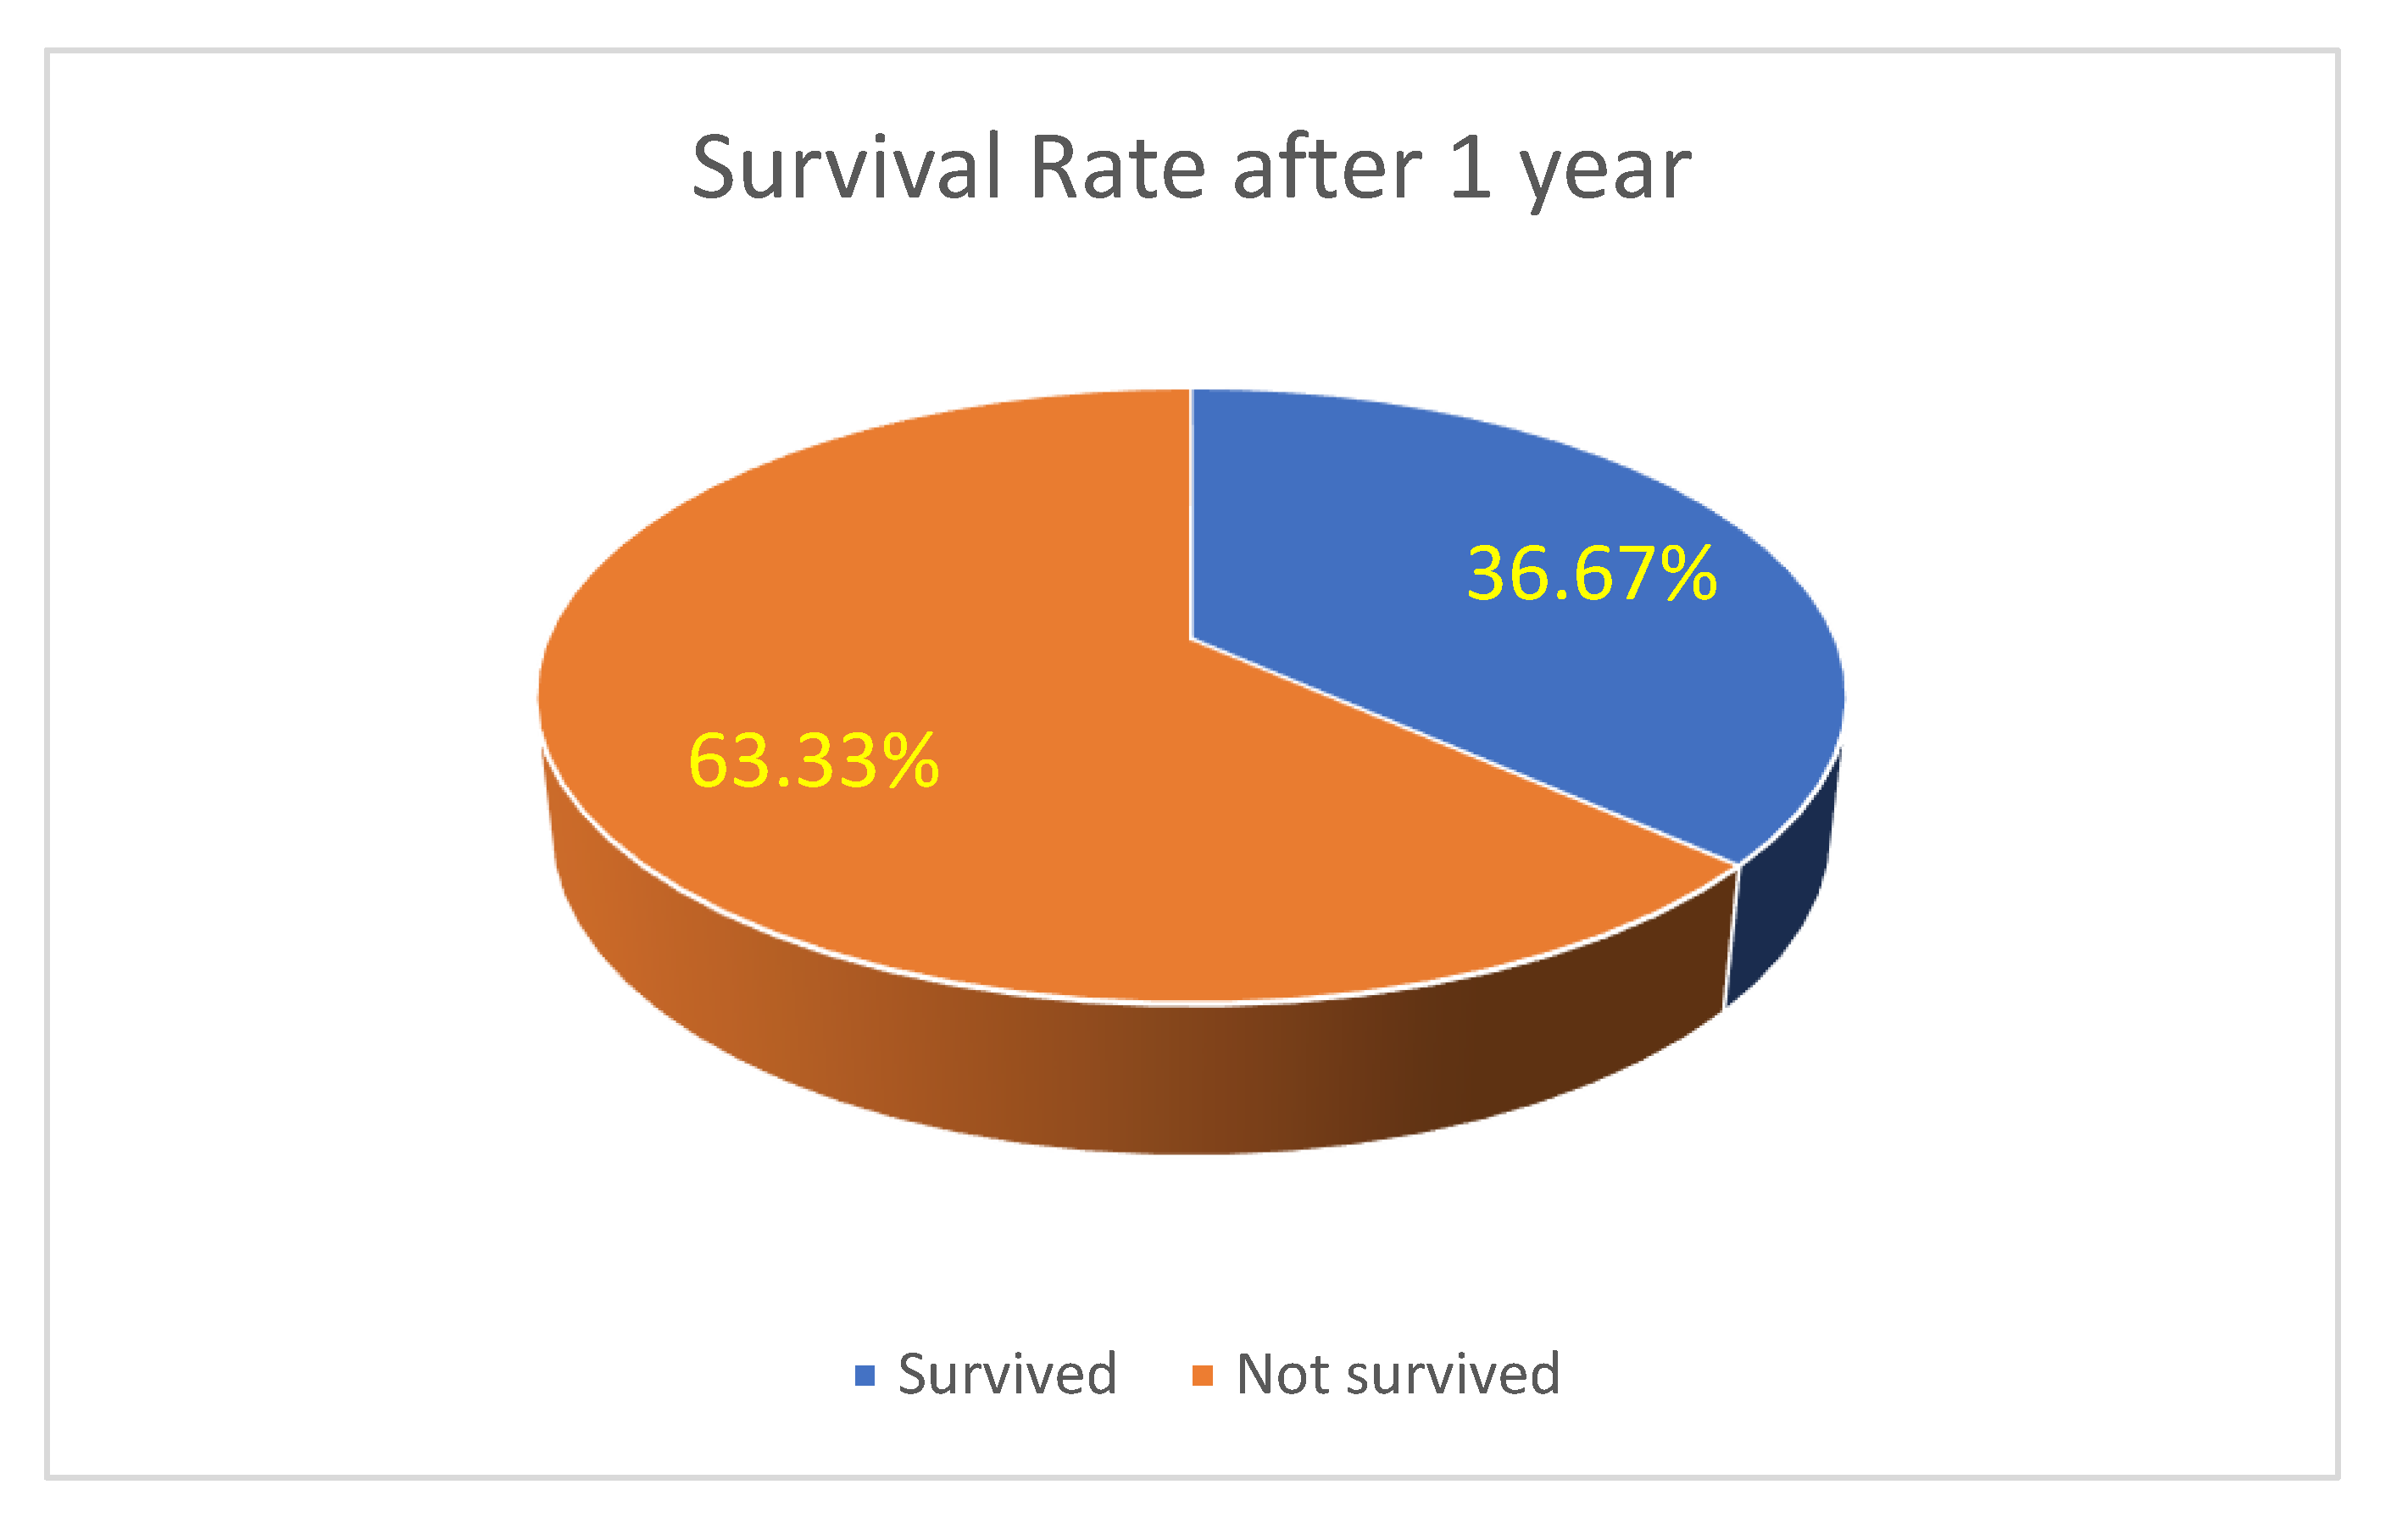

Table 1.
Comparative Performance Metrics and Training Times for Different Models.
| Model | Accuracy (95% CI) | Precision (95% CI) | Recall (95% CI) |
F1-Score (95% CI) | AUC (95% CI) |
Total Time (s) |
|---|---|---|---|---|---|---|
| AlexNet | 99.53 (98.90-100.00) |
99.01 (97.37-100.00) |
99.50 (98.42-100.00) |
99.26 (98.30-100.00) |
0.9998 (0.9995-1.0000) |
427.04 |
| AlexNet (TL) | 100.00 (100.00 - 100.00) | 100.00 (100.00 - 100.00) | 100.00 (100.00 - 100.00) | 100.00 (100.00 - 100.00) | 1.0000 (1.0000 - 1.0000) |
420.12 |
| ResNet-50 | 100.00 (100.00 - 100.00) | 100.00 (100.00 - 100.00) | 100.00 (100.00 - 100.00) | 100.00 (100.00 - 100.00) | 1.0000 (1.0000 - 1.0000) |
443.38 |
| EfficientNet-B0 | 100.00 (100.00 - 100.00) | 100.00 (100.00 - 100.00) | 100.00 (100.00 - 100.00) | 100.00 (100.00 - 100.00) | 1.0000 (1.0000 - 1.0000) |
439.87 |
Table 2.
Comparison of Deep Learning Models for Brain Tumor Classification and Prediction.
| Study | Methodology | Accuracy | AUC | Classification Report |
|---|---|---|---|---|
| This Study | Transfer learning with AlexNet for classifying brain metastases progression and regression using MRI images after Gamma Knife radiosurgery. | 100% | 1.00 | Precision, Recall, F1-score: 100% across all classes (progression and regression). |
| R. Anita Jasmine & P. Arockia Jansi Rani (2020) [26] | AlexNet with SVM classifier for brain tumor classification (meningioma, glioma, pituitary tumors). | 95% | Not provided | Strong precision and recall metrics reported for individual tumor classes; classification accuracy achieved using T1-weighted contrast-enhanced MRI. |
| Kapadnis, Aboli (2021) [27] | AlexNet and CNN for brain tumor detection using MRI images. | 98% | Not provided | Demonstrated effective separation between healthy and cancerous tissues. |
| Buzea et al. (2023) [28] | AI evaluation of imaging factors in the evolution of metastases post-Gamma Knife treatment. | 91% | 0.94 | Effective in predicting early response to radiosurgery; detailed metrics for recall and precision provided for specific clinical scenarios. |
| Azhagiri& Rajesh (2024) [29] | Enhanced AlexNet model (EAN) for brain tumor detection using MRI. | 98.6% | Not provided | Enhanced AlexNet demonstrated superior results compared to standard AlexNet in tumor classification. |
| Zhuodiao Kuang (2022) [30] | Transfer learning with hybrid AlexNet-DCNN-ResNet for brain tumor detection. | 96.4% | 0.98 | High F1-scores for distinguishing between benign and malignant tumors; ResNet improved recall for complex cases. |
| Sunita Kulkarni & Sundari (2021) [31] | Comparative analysis of deep CNN frameworks with transfer learning for brain MRI classification. | 97.2% | Not provided | Transfer learning frameworks showed robust classification performance, with AlexNet achieving competitive accuracy in multiclass setups. |
| S. Nidaan Khofiya et al. (2022) [32] | MRI brain tumor classification using AlexNet architecture. | 93.8% | Not provided | Focused on AlexNet’s ability to classify between gliomas, meningiomas, and healthy tissues. |
| B. Taşci (2021) [33] | AlexNet-based classification method for brain MRI images. | 92.3% | Not provided | AlexNet’s baseline performance highlighted as effective, though improvements were suggested for addressing overfitting. |
Disclaimer/Publisher’s Note: The statements, opinions and data contained in all publications are solely those of the individual author(s) and contributor(s) and not of MDPI and/or the editor(s). MDPI and/or the editor(s) disclaim responsibility for any injury to people or property resulting from any ideas, methods, instructions or products referred to in the content. |
© 2025 by the authors. Licensee MDPI, Basel, Switzerland. This article is an open access article distributed under the terms and conditions of the Creative Commons Attribution (CC BY) license (http://creativecommons.org/licenses/by/4.0/).
Copyright: This open access article is published under a Creative Commons CC BY 4.0 license, which permit the free download, distribution, and reuse, provided that the author and preprint are cited in any reuse.


