Submitted:
05 February 2025
Posted:
06 February 2025
You are already at the latest version
Abstract
To effectively mine and utilize the valuable genes of wild emmer wheat (Triticum dicoccoides, 2n=4x=28, AABB), this study conducted an investigation of agronomic traits using two sets of chromosome arm substitution lines (CASLs) of wild emmer wheat in the backgrounds of the common wheat varieties Bethlehem (BLH) and Chinese Spring (CS). The results indicated notable differences in growth characteristics, including seedling agronomic traits, heading date (HD), and yield traits among the various CASLs in both the BLH and CS backgrounds. In both genetic backgrounds, the number of tillers in CASL6AL and CASL7BS was significantly less than that of the parents. Additionally, the average leaf width of six CASLs (2BS, 1AL, 7AL, 5BS, 4AS, and 2BL) was significantly smaller compared to the parents. Among CASLs in the CS background, CASL2BS exhibited a significantly narrower average leaf width and shorter average plant height compared to the parents and early-maturing CASLs. Conversely, CASL4AL had significantly more tillers and a shorter average plant height than other CASLs. In the BLH background, the spike phenotypes of all CASLs showed no significant differences from BLH. However, in the CS background, CASL6AS and CASL5AL demonstrated significantly longer spike lengths than CS. Moreover, CASL6BL had a more spikelets per spike than CS. CASLs 4AS, 4AL, 6BS, and 6BL exhibited short awns at the base and long awns at the top, while the remaining CASLs displayed no awns, consistent with CS. It is speculated that genes controlling physiological traits such as seedling tiller number, leaf width, plant height, and spike traits may be located on the corresponding chromosome arms.
Keywords:
Triticum aestivum
; Triticum dicoccoides
; CASL-chromosome arm substitution lines
; Agronomic traits
; identification
1. Introduction
Wheat (Triticum aestivum L.) is a major global staple crop, and enhancing its yield and quality, as well as improving its resistance to biotic and abiotic stresses, are key objectives in wheat breeding [1]. The wide adaptability and good storability of wheat are crucial for food security and social stability [2,3]. Over the past half-century, rapid population growth and improving quality of life have increased the demand for wheat, along with higher quality requirements for wheat grains. However, the large-scale promotion of single wheat variety has led to a scarcity of wheat germplasm resources for breeding new varieties, slowing progress in improving both wheat yield and quality. Fortunately, wheat has many closely related wild species that can be utilized. For a long time, scientists have conducted extensive research on developing and utilizing the excellent genes of wheat's wild relatives to improve the yield and quality of existing wheat varieties, achieving promising results and making significant contributions to the breeding of new wheat varieties.
Wild emmer wheat (Triticum dicoccoides, 2n=4x=28, AABB) is the direct ancestor of cultivated hexaploid and tetraploid wheat [4]and possesses excellent agronomic traits such as early maturity, good disease resistance (against Fusarium head blight, rust, etc.), good resistance to abiotic stresses (salt tolerance, drought tolerance, heat tolerance, herbicide tolerance), high grain protein content, good quality (new alcohol-soluble proteins and gluten), high amino acid content, and rich trace elements [5,6,7,8,9,10]. Thus, wild emmer wheat can serve as a convenient source of exogenous genes for genetic improvement in common wheat [10,11,12]. Unfortunately, only a few excellent genes have been identified and mapped, primarily focusing on disease resistance and quality traits [13]. Few superior genes from wild emmer wheat have been introduced into cultivated wheat, leading to the development of new varieties [14].
Joppa & Cantrell developed a set of substitution lines in a tetraploid wheat genetic background, carrying a wild emmer wheat chromosome, for the identification of superior genes from wild emmer wheat and for the breeding of new tetraploid wheat varieties [15]. Through this set of substitution lines, many excellent genes from wild emmer wheat have been discovered and initially mapped. For example, Joppa & Cantrell found that the protein content in substitution lines for wild emmer wheat 2A, 3A, 6A, 5B, and 6B chromosomes was higher than the parental lines, ranging from 17.2% to 17.9% [15]. In the same experiment, they also found that 2A, 3A, and 5B substitution lines could increase grain weight, and most of these results were confirmed by other researchers. In disease resistance identification, a major QTL for Fusarium head blight resistance was identified on the 3AS and 7AL chromosome arms of wild emmer wheat [16].
In common hexaploid wheat, two sets of CASLs in the background of the common wheat varieties Bethlehem (BLH) and Chinese Spring (CS) were developed by the Weizmann Institute of Science in Israel through conventional hybridization and cytogenetic identification [17]. Since only one wild chromosome arm is introduced into the CASLs, it is easier to directly detect atypical changes caused by the key arm, allowing the evaluation of the contribution of its chromosome arm from the wild donor without interference from other chromosomes of the donor [7,9]. Due to their homozygous and stable genotypes, they can be repeatedly planted over many years and in different locations, making them ideal materials for discovering important agronomic genes [4]. The above advantages of these two sets of CASLs in agronomic trait QTL mapping and gene cloning have gradually shown their potential in the practice of wheat distant hybrid breeding, opening a new pathway for enriching wheat germplasm resources [7,18].
Thus, identifying chromosome regions that govern wheat agronomic traits during growth and development stages, and discovering relevant SNP markers, will contribute to the creation of new germplasm with desirable traits and accelerate the breeding of superior wheat varieties. In this study, we observed and measured early-stage agronomic traits in two sets of CASLs to explore superior genes from wild emmer wheat and conduct preliminary chromosome mapping. The primary objective of this study is to identify candidate chromosomal regions associated with robust seedling growth, as well as spike and grain traits at maturity, ultimately to lay the theoretical and material foundation for breeding high-yielding, high-quality wheat varieties suited for cultivation in China.
2. Materials and Methods
2.1. Plant Material
Two sets of CASLs derived from wild emmer wheat ( Triticum turgidum ssp. dicoccoides ) were utilized in this study, with 'Bethlehem' (BLH) and 'Chinese Spring' (CS) as the recurrent parents. CASLs were generated by hybridizing a disomic addition line of common wheat with the wild emmer accession TDIC140, followed by 4-7 generations of backcrossing to the respective disomic addition line and a single generation of selfing. Cytological verification was performed at each generation [7,9,19]. Wild emmer wheat possesses two genomes (A and B), comprising 14 chromosomes and 28 chromosome arms. While theoretically, 28 CASLs are possible for each recurrent parent, CASLs for chromosome arms 2AL, 4AS, 5AL, and 6BS in the BLH background were not recovered, presumably due to sterility associated with these introgressions [7,9].
2.2. Field Experimental Design
CASLs and their parents were evaluated over two consecutive growing seasons under field conditions in Lin'an, Zhejiang Province, China (30.25°N, 119.72°E, 44.2 m above sea level). Field trials employed a randomized complete block design with three replications. Each plot consisted of six double rows (1.2 m long, 0.4 m inter-row spacing) with plants spaced 0.2 m apart within rows (seven plants per row). Standard agronomic practices for large-scale wheat production, including fertilization, irrigation, pest, and weed control, were implemented. Two sets of CASLs were also evaluated in a greenhouse experiment at Zhejiang A&F University. Three replicates per CASL were used, with each replicate consisting of three plants grown in a single pot. BLH and CS were included as controls in the greenhouse experiment.
2.3. Investigation of Agronomic Traits at the Seedling Stage
Seedling growth habit for both CASL populations was classified as prostrate, semi-prostrate, or erect at peak tillering. Plant height (cm, from ground level to the base of the spike, excluding awns) and leaf width (cm, The widest point in the middle of the leaf perpendicular to the vein) were measured at tillering stage. The number of effective tillers (i.e., tillers producing fertile spikes) was recorded.
2.4. Agronomic Trait Survey at Heading Stage
To reduce experimental error caused by environmental factors, the first two plants at the beginning and the last two plants at the end of each row are excluded from the statistical analysis due to the significant environmental impact on the phenotypes of individual plants located at the edges of each row. HD was recorded when 50% of the spike had emerged from the flag leaf sheath. Days to HD was calculated as the number of days between sowing and heading. The mean HD was calculated, and standard deviation was determined. Use tags to identify individual plants that have already had their HD recorded.These plants were excluded from subsequent observations.
2.5. CASLs Propagation
Wheat was harvested individually, and yield-related traits were evaluated under controlled environment conditions. Propagation procedures followed the "National Wheat Variety Regional Trial Recording Standard" (GB/T 1301-2007).
2.5. Yield Trait Survey
Four yield-related traits were investigated: grain length (GL, mm), grain width (GW, mm), grain thick (GT, mm), and thousand-kernel weight (TKW, g). For GL and GW, 20 fully intact grains per sample were randomly selected and imaged using an HP5590 scanner. Images were processed in Photoshop to remove the background, and then analyzed using Seed_Identification V1.0 software to determine average RGB values, grayscale, length, width, and projected area. GT was measured using an electronic digital caliper on 20 randomly selected grains per sample.All measurements were repeated three times, and the average value was used for analysis. For TKW, two replicates of 500 grains per sample were weighed after 72 hours of drying at 37°C using an electronic balance (accurate to 0.01 g). TKW was calculated as: TKW (g) = (W/n)×1000, where “W” is the total weight and “n” is the number of grains. This process was repeated three times, with the average value used for analysis, ensuring a measurement error within 0.5g. Data were processed in Microsoft Excel 2010. Significance and correlation analyses were performed using SPSS 19.0 software with a 5% confidence interval.
2.6. Spike Trait Survey
The primary characteristics of the spike encompass several key indicators, including spike length, the number of spikelets, the number of grains per spike, panicle types and awn length. The classification standard for awn types can be found in Table 1. In this study, The spike length is measured as the distance from the peduncle to the base of the awn, excluding the awn length.Spikelet number, including both fertile and sterile spikelets per spike, was determined. The number of fertile (grain-bearing) spikelets per spike was also recorded. Kernel number per spike was determined by harvesting and threshing 30 randomly selected spikes per plant, with three replications performed to calculate the average kernel number per spike.The classification standard for spike types is referenced in Table 2.

Table 1.
Awn types grading standard of wheat.
| Level | Awn Length and Position |
|---|---|
| No Awn | Completely without awns or awns are extremely short. |
| Top Awn | Awns present at the top of the spike, with a length of <5mm, no awns at the lower part of the spike. |
| Curved Awn | The base of the awn is swollen and curved. |
| Short Awn | Awns present both at the top and bottom of the spike, with a length <40mm. |
| Long Awn | Awn length >40mm. |
Table 2.
Spike types grading standard of wheat.
| Trait | Phenotype Description |
|---|---|
| Spindle-shaped | The ear is pointed at both ends, with the middle slightly larger. |
| Oval-shaped | The middle is wide, with both ends slightly smaller, resembling an ellipse. |
| Rectangular-shaped | The ear is relatively short, and the shape is consistent in the upper, middle, and lower parts, appearing column-like. |
| Club-shaped | The ear is smaller at the bottom and larger at the top, with tightly clustered spikelets at the upper part, resembling a big head. |
| Conical-shaped (Pagoda-shaped) | The ear is larger at the bottom and smaller at the top, resembling a cone. |
3. Results
3.1. Statistical Analysis of Agronomic Traits During the Seedling Stage
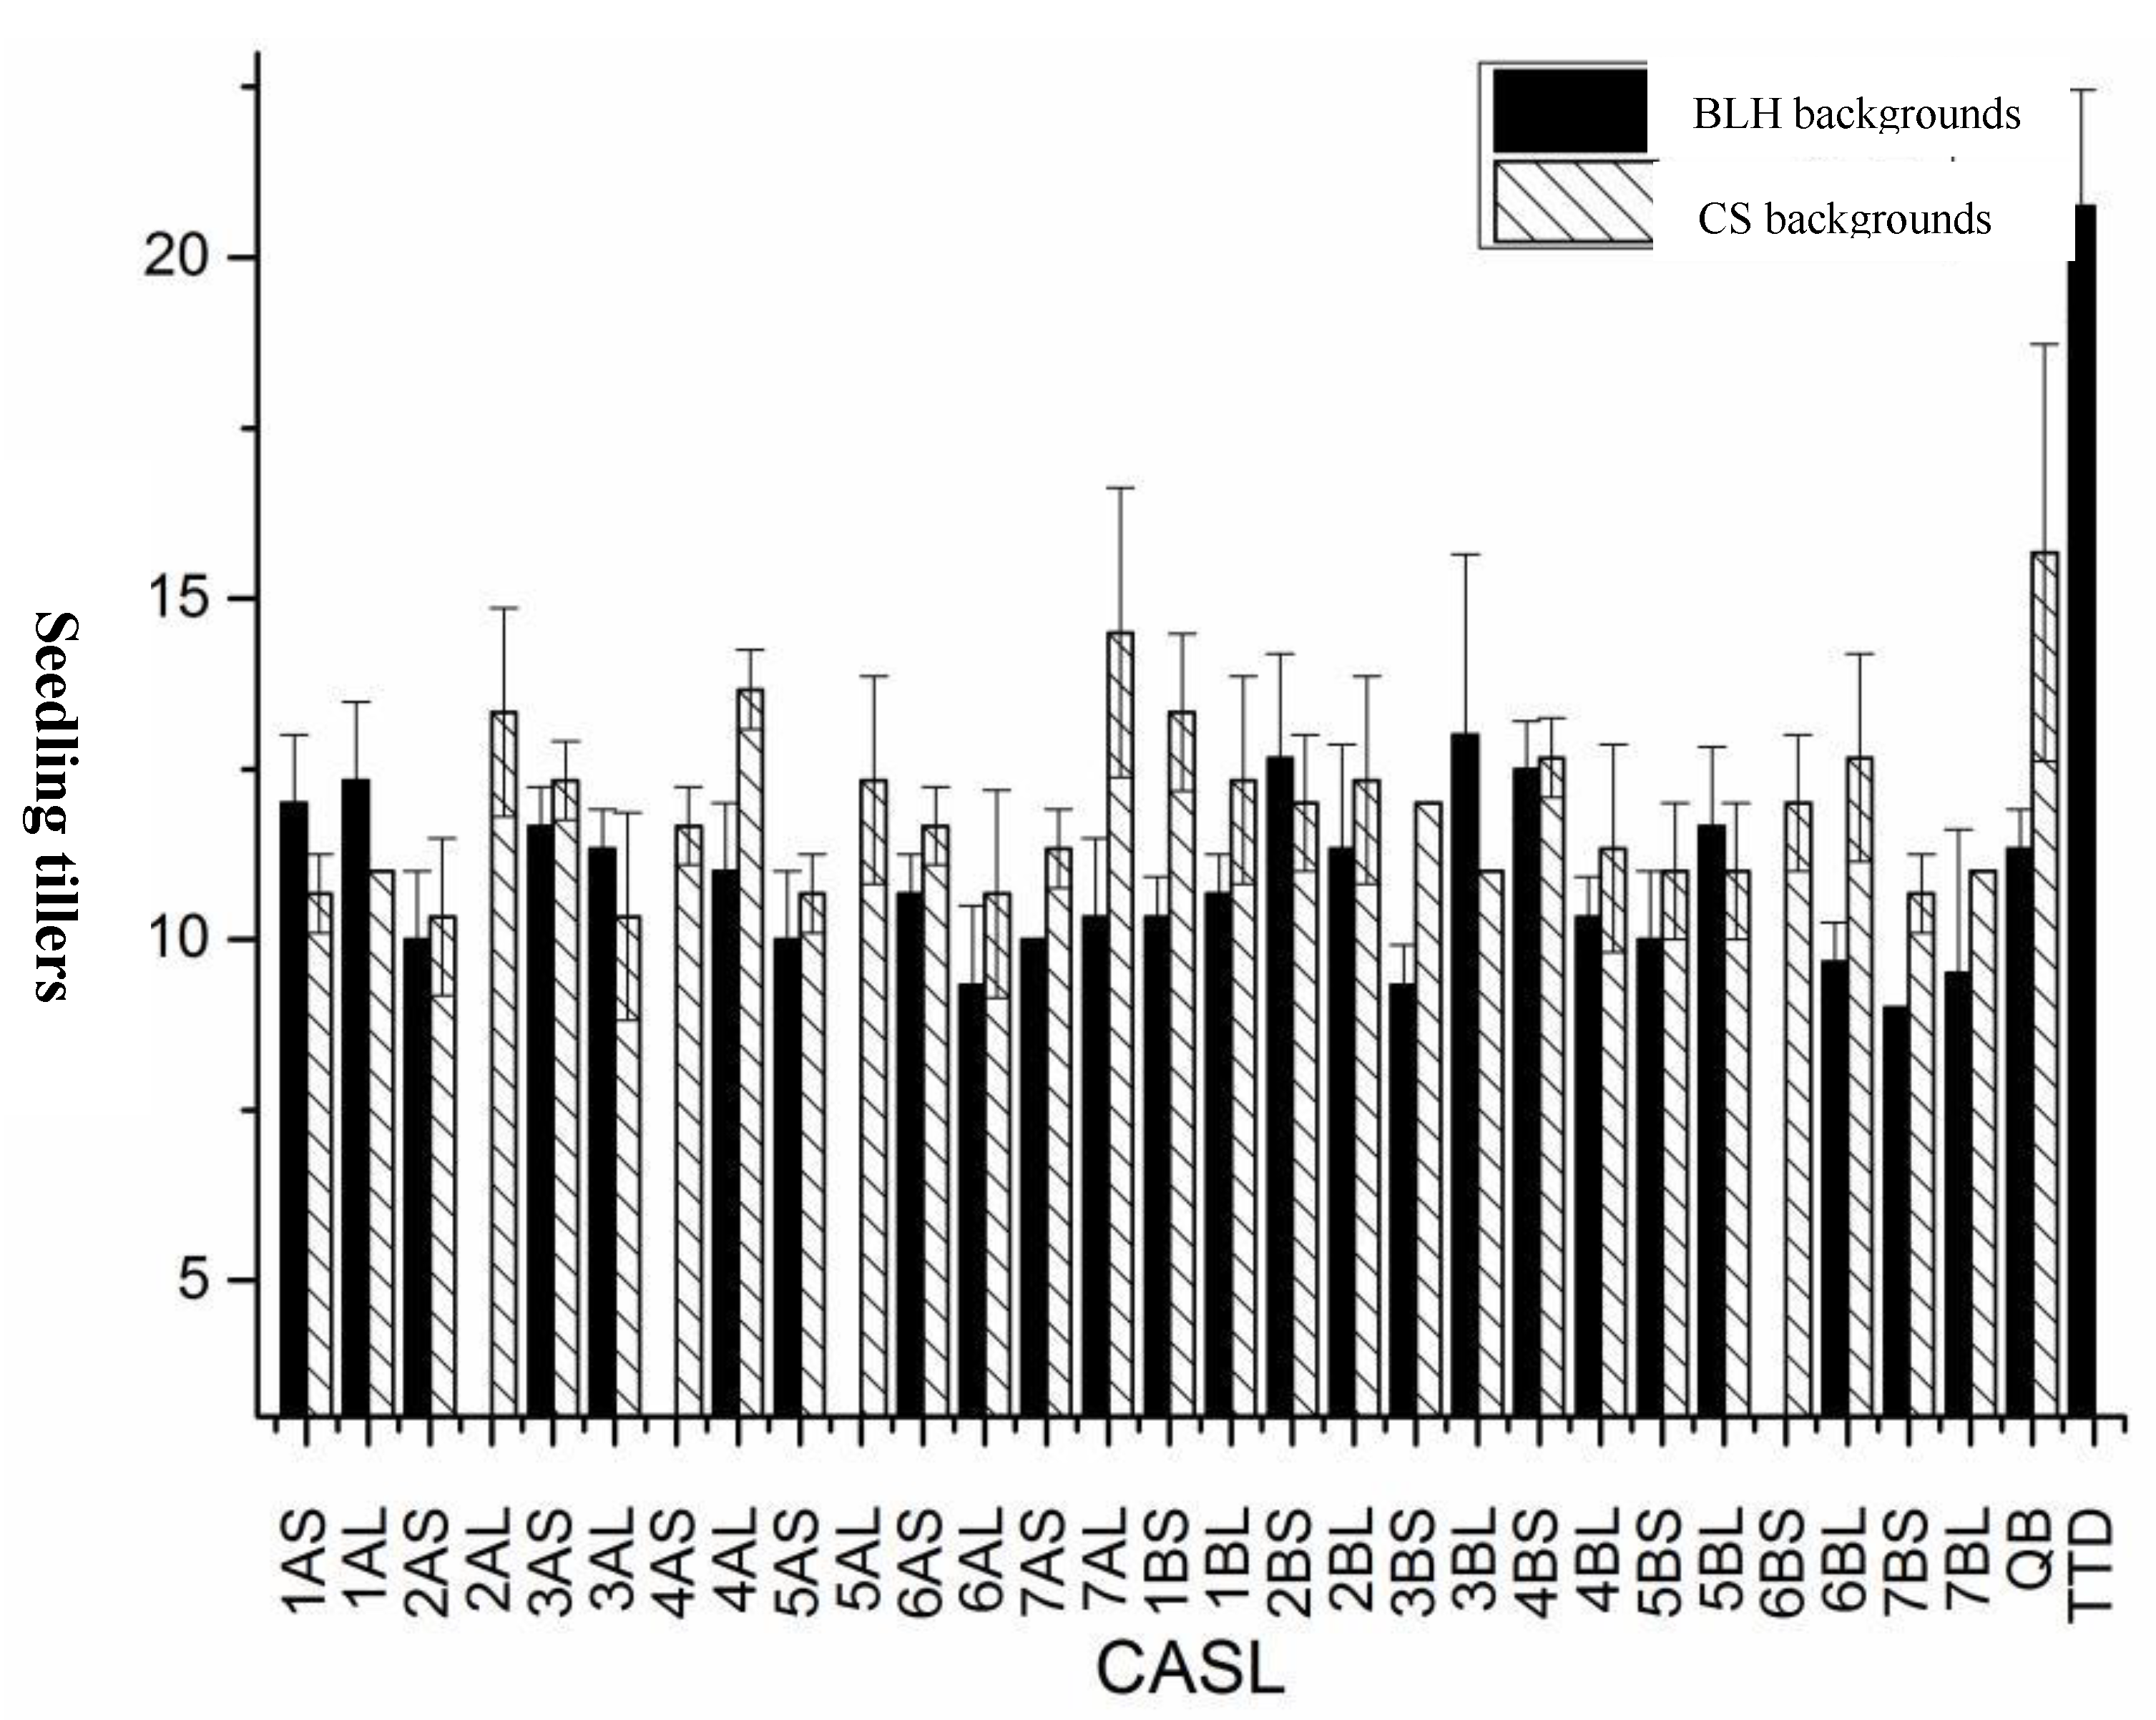
Seedling Tiller Number:Tiller number at the seedling stage was statistically analyzed for two sets of CASLs, their respective parents (BLH and CS), and the wild wheat accession TDIC140 (Figure 1). TDIC140 had the highest average tiller number (20.7), significantly greater than both sets of CASLs and their parents. Generally, CASLs exhibited significantly lower tiller numbers than their respective parents. This reduction was particularly pronounced in the CS background, where all CASLs had fewer tillers than CS. Fifteen CASLs had an average tiller number below 11.67. In both backgrounds, CASL6AL and CASL7BS exhibited significantly reduced tiller numbers compared to their respective parents.
Figure 1.
Statistical analysis for seedling tillers of CASLs.
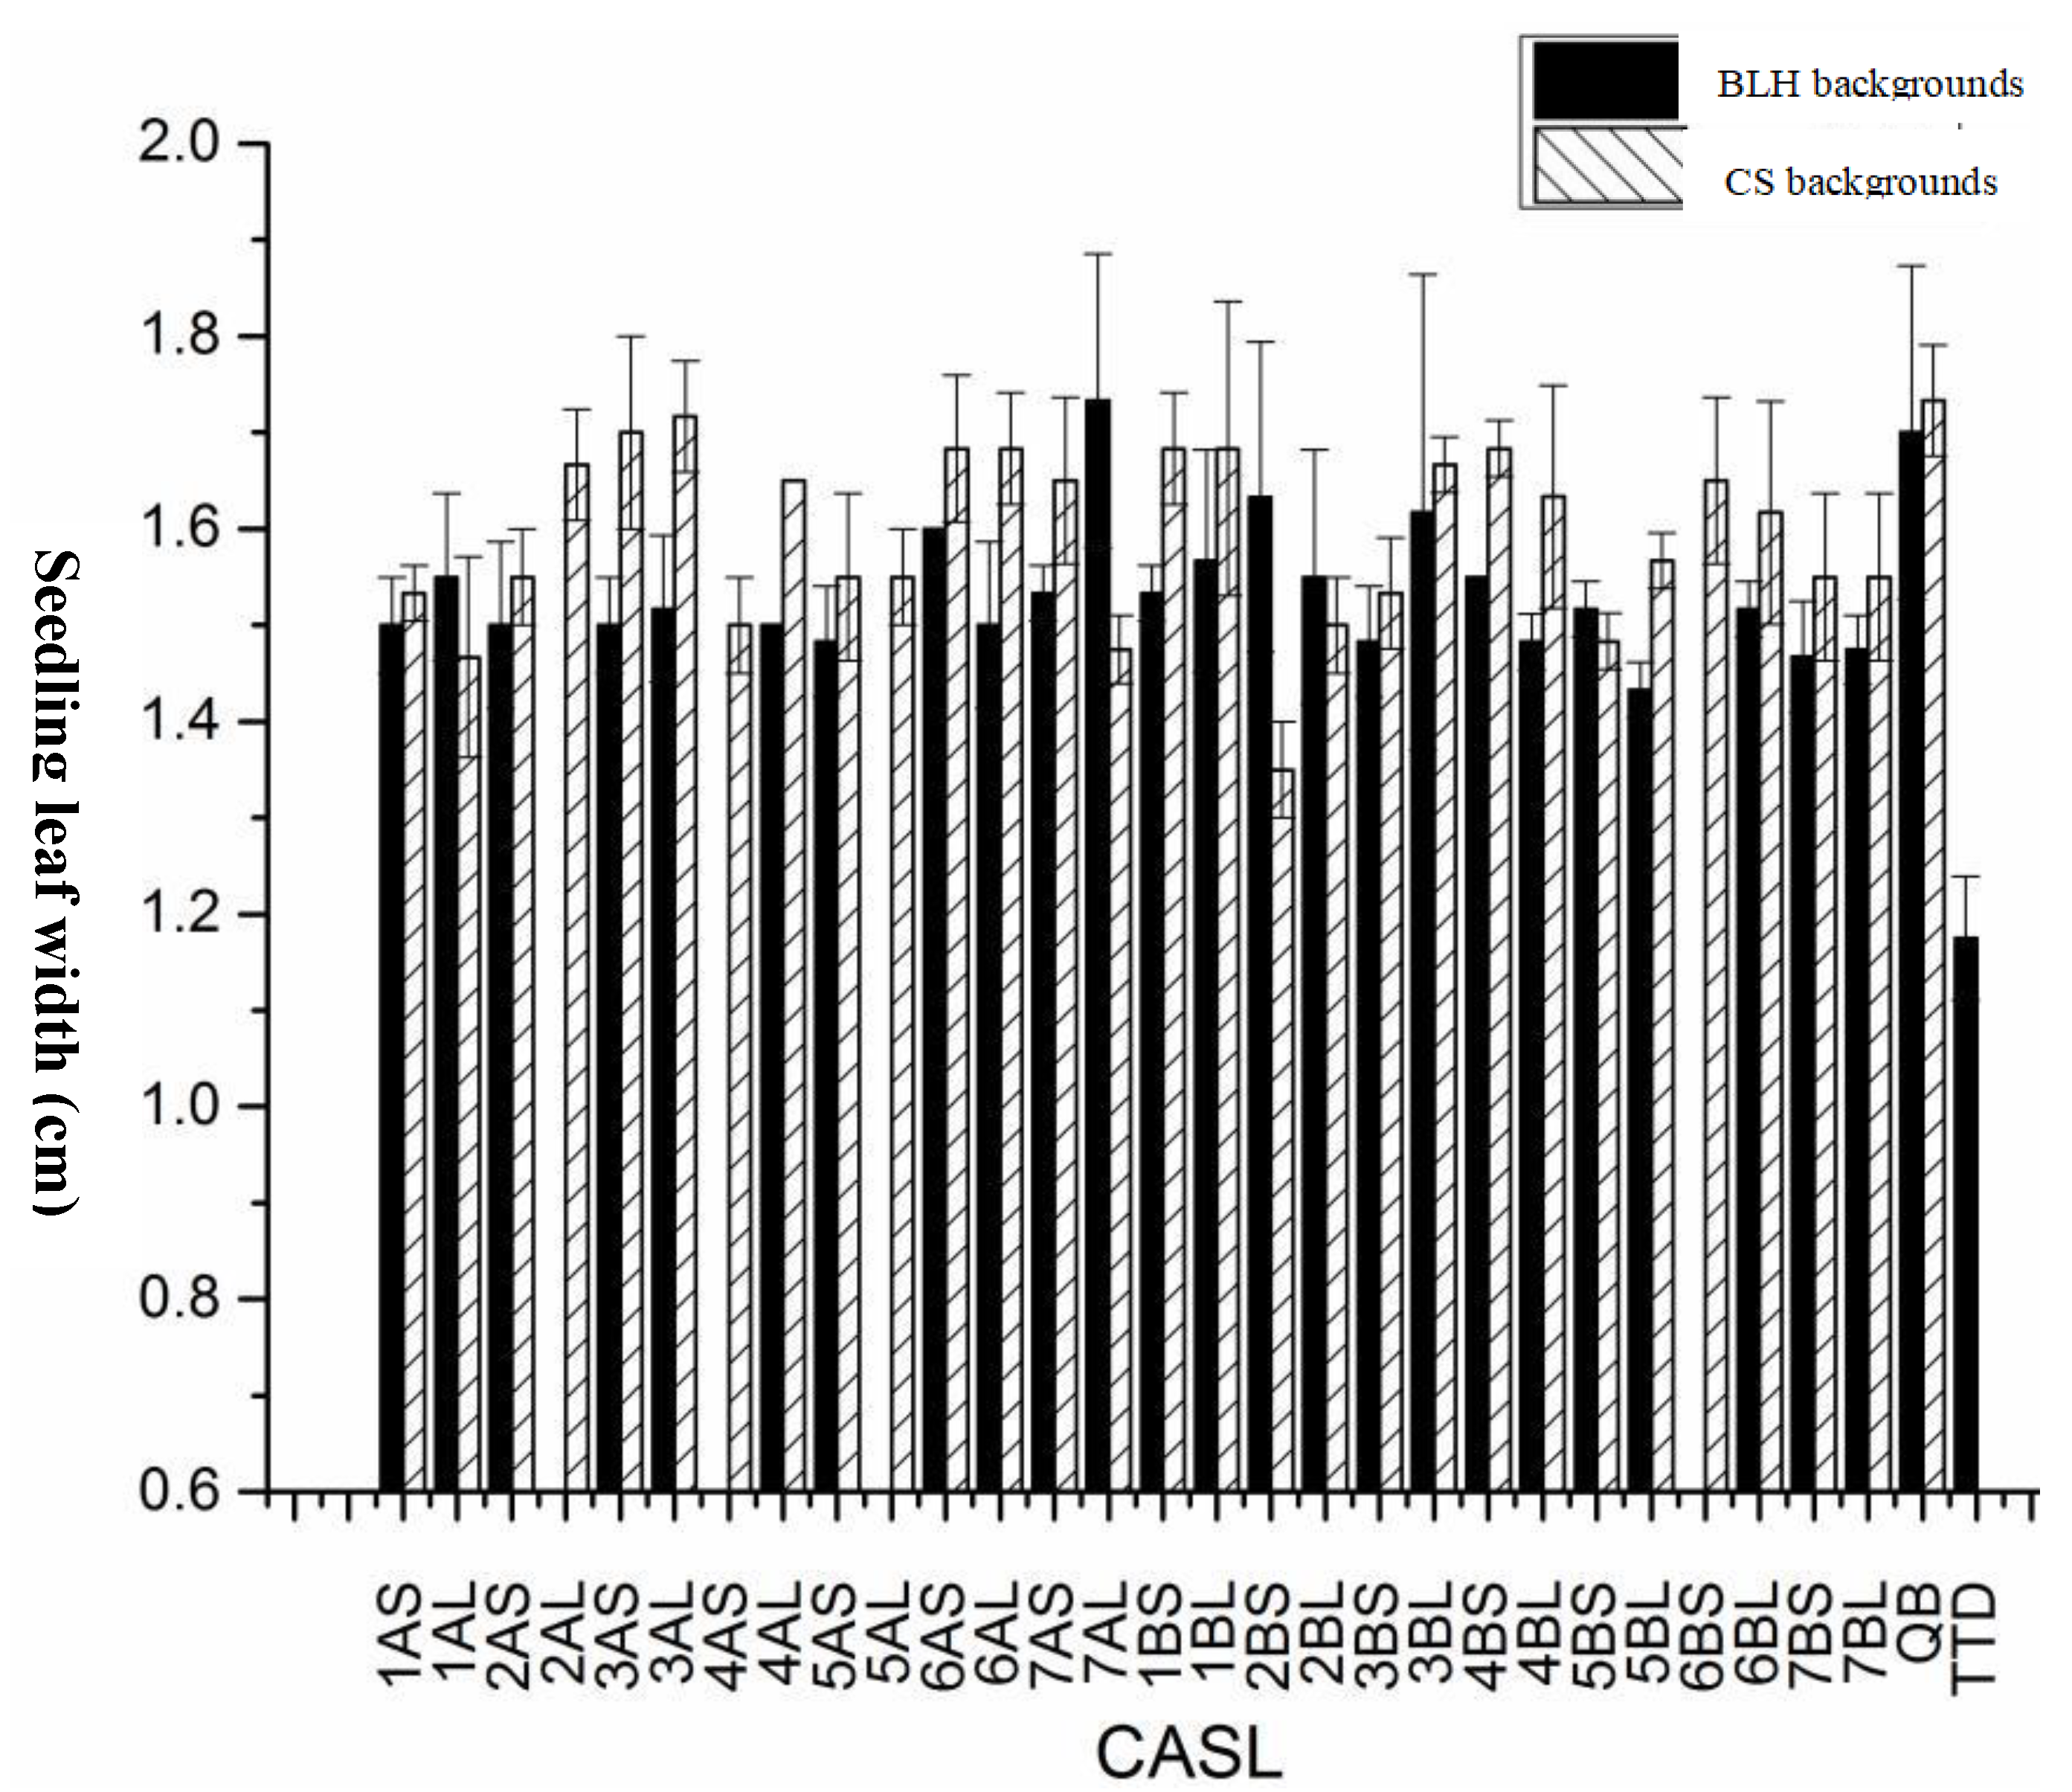
Seedling Leaf Width:Seedling leaf width was analyzed for significance (Figure 2). TDIC140 had the narrowest average leaf width (< 1.17 cm), significantly narrower than both parental varieties, BLH (1.73 cm) and CS (1.73 cm), as well as their respective CASLs. In the BLH background, all CASLs except CASL7AL (which had the same leaf width as BLH) exhibited significantly narrower leaves than BLH. Twenty of these CASLs had an average leaf width of less than 1.57 cm. In the CS background, all CASLs had significantly narrower leaves than the CS parent. Six CASLs (CASL2BS, CASL1AL, CASL7AL, CASL5BS, CASL4AS, and CASL2BL) had an average leaf width below 1.50 cm.
Figure 2.
Statistical analysis for seedling leaf width of CASLs.
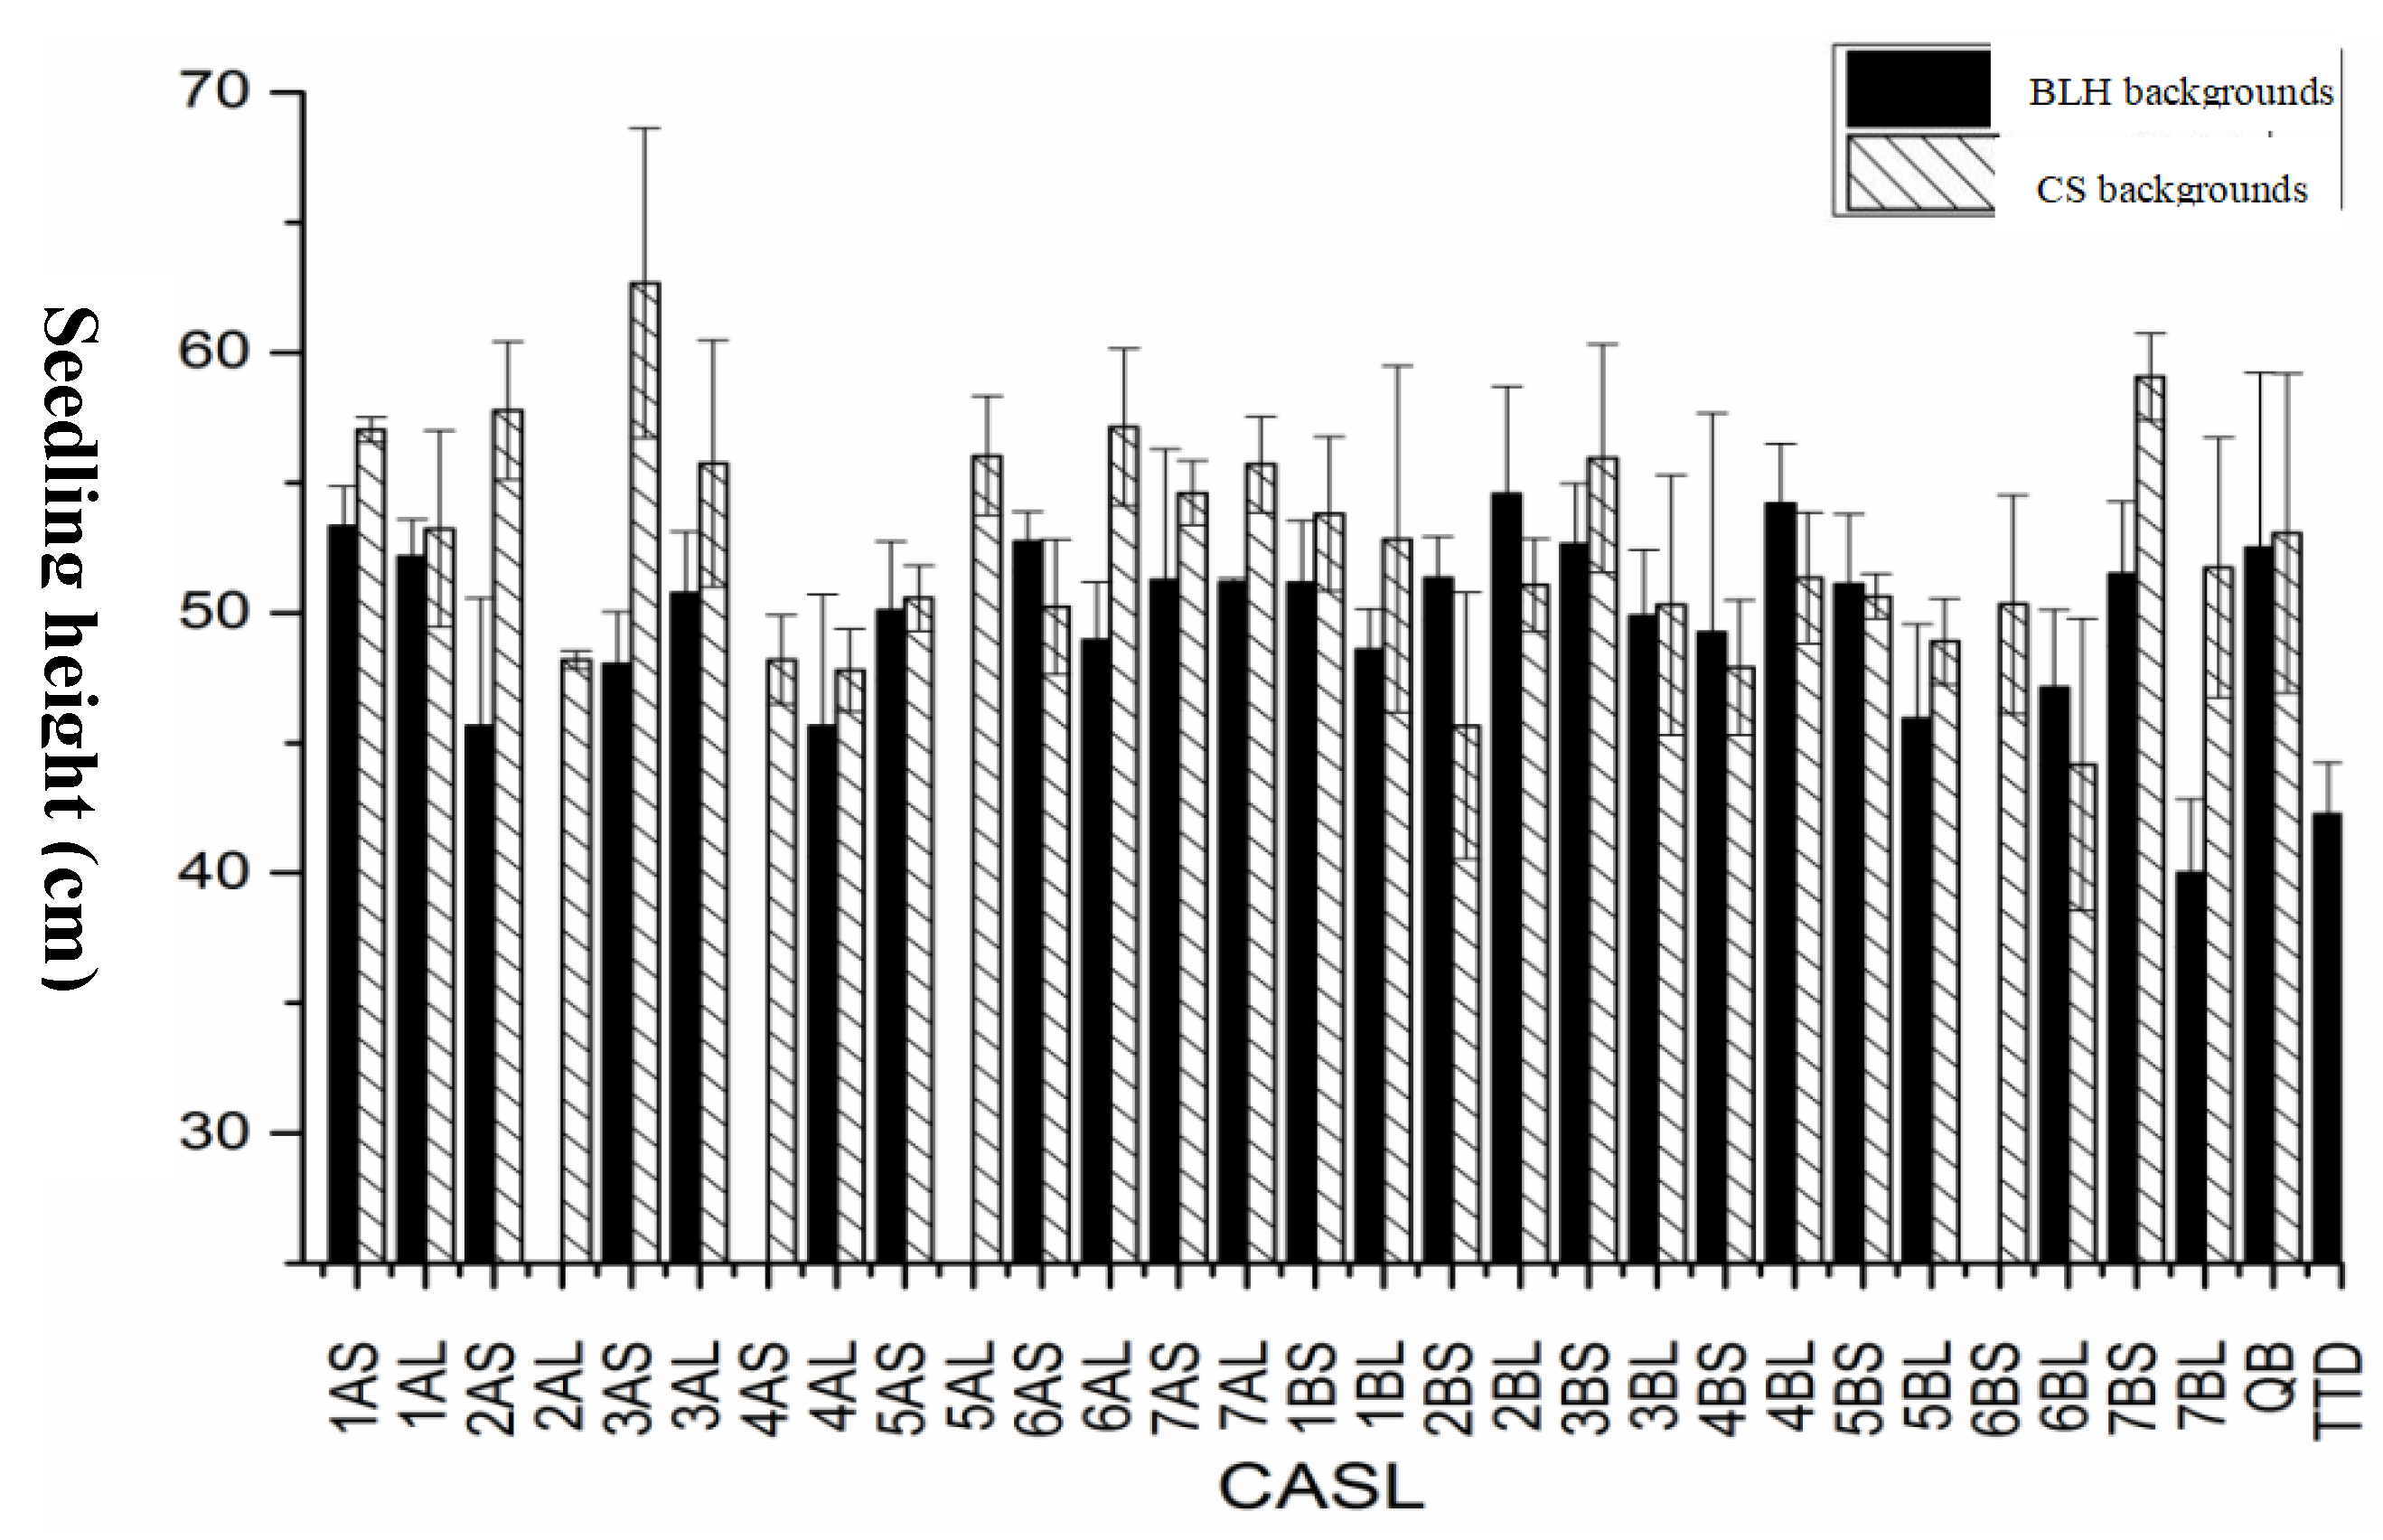
Plant Height:Seedling height was analyzed for significance (Figure 3). The average seedling height of TDIC140 was 42.0 cm, while that of the BLH parent was 52.5 cm. In the BLH background, four CASLs (CASL5BL, CASL2AS, CASL4AL, and CASL7BL) had average seedling heights below 46.0 cm, significantly shorter than the parent. CASL7BL reached an average height of only 40.0 cm, representing 76% of the parent's height. In the CS background, CASL3AS (62.7 cm) had significantly greater seedling height than the CS parent (53.1 cm). Conversely, CASL2BS and CASL6BL had average seedling heights below 45.7 cm, significantly shorter than the parent.
Figure 3.
Statistical analysis for seedling height of CASLs.
3.2. Agronomic Trait Statistical Analysis at Heading Stage
HD was statistically analyzed for 28 CASLs and the CS parent (Table 3). Significant differences in HD were observed among the CASLs. Lines with substitutions on chromosomes 4AL and 2BS exhibited significantly delayed heading (more than 15 days later than CS; P < 0.01), while lines with substitutions on chromosomes 3AL, 7BS, and 3AS headed significantly earlier (4 to 9 days earlier than CS; P < 0.01). These results suggest that genes controlling HD and contributing to late maturity are located on chromosome arms 4AL and 2BS, whereas genes promoting early maturity reside on chromosome arms 3AL, 7BS, and 3AS.
Table 3.
Statistical analysis of CASL heading date variation in CS background to CS.
| CASL | Mean/day | significant | SD |
|---|---|---|---|
| 2BS | 137.4 | A | 1.4 |
| 4AL | 134.8 | B | 2.3 |
| 6BL | 123.4 | C | 0.5 |
| 6BS | 122.6 | CD | 0.5 |
| 5BS | 121.8 | CDE | 1.7 |
| 7BL | 121.5 | CDE | 1.5 |
| 5BL | 121.4 | CDEF | 1.1 |
| 3BL | 121.3 | CDEF | 1.8 |
| 4AS | 121.3 | CDEF | 1.8 |
| 6AS | 121 | CDEF | 0.8 |
| CS | 120.6 | CDEF | 1.4 |
| 1AL | 120.8 | CDEF | 1.0 |
| 1AS | 120.6 | CDEF | 0.9 |
| 5AL | 120.6 | CDEF | 0.9 |
| 2AL | 120.6 | CDEF | 1.9 |
| 7AL | 120.4 | CDEF | 0.6 |
| 4BS | 119.8 | CDEFG | 1.4 |
| 1BS | 119.7 | CDEFG | 2.7 |
| 7AS | 119.4 | CDEFG | 1.5 |
| 1BL | 119 | CDEFG | 1.6 |
| 2BL | 118.8 | CDEFG | 1.0 |
| 5AS | 118.6 | CDEFG | 0.9 |
| 2AS | 118.4 | DEFG | 2.7 |
| 6AL | 118.2 | EFG | 1.2 |
| 4BL | 117.8 | EFG | 1.8 |
| 3BS | 117.6 | FG | 1.1 |
| 3AS | 116.4 | G | 1.0 |
| 7BS | 114.7 | G | 1.3 |
| 3AL | 111.3 | G | 1.4 |
Different letters means the significance at 0.01 leves. CASL: chromosome arm substitution line; Mean±SD: The average value±standard deviation.
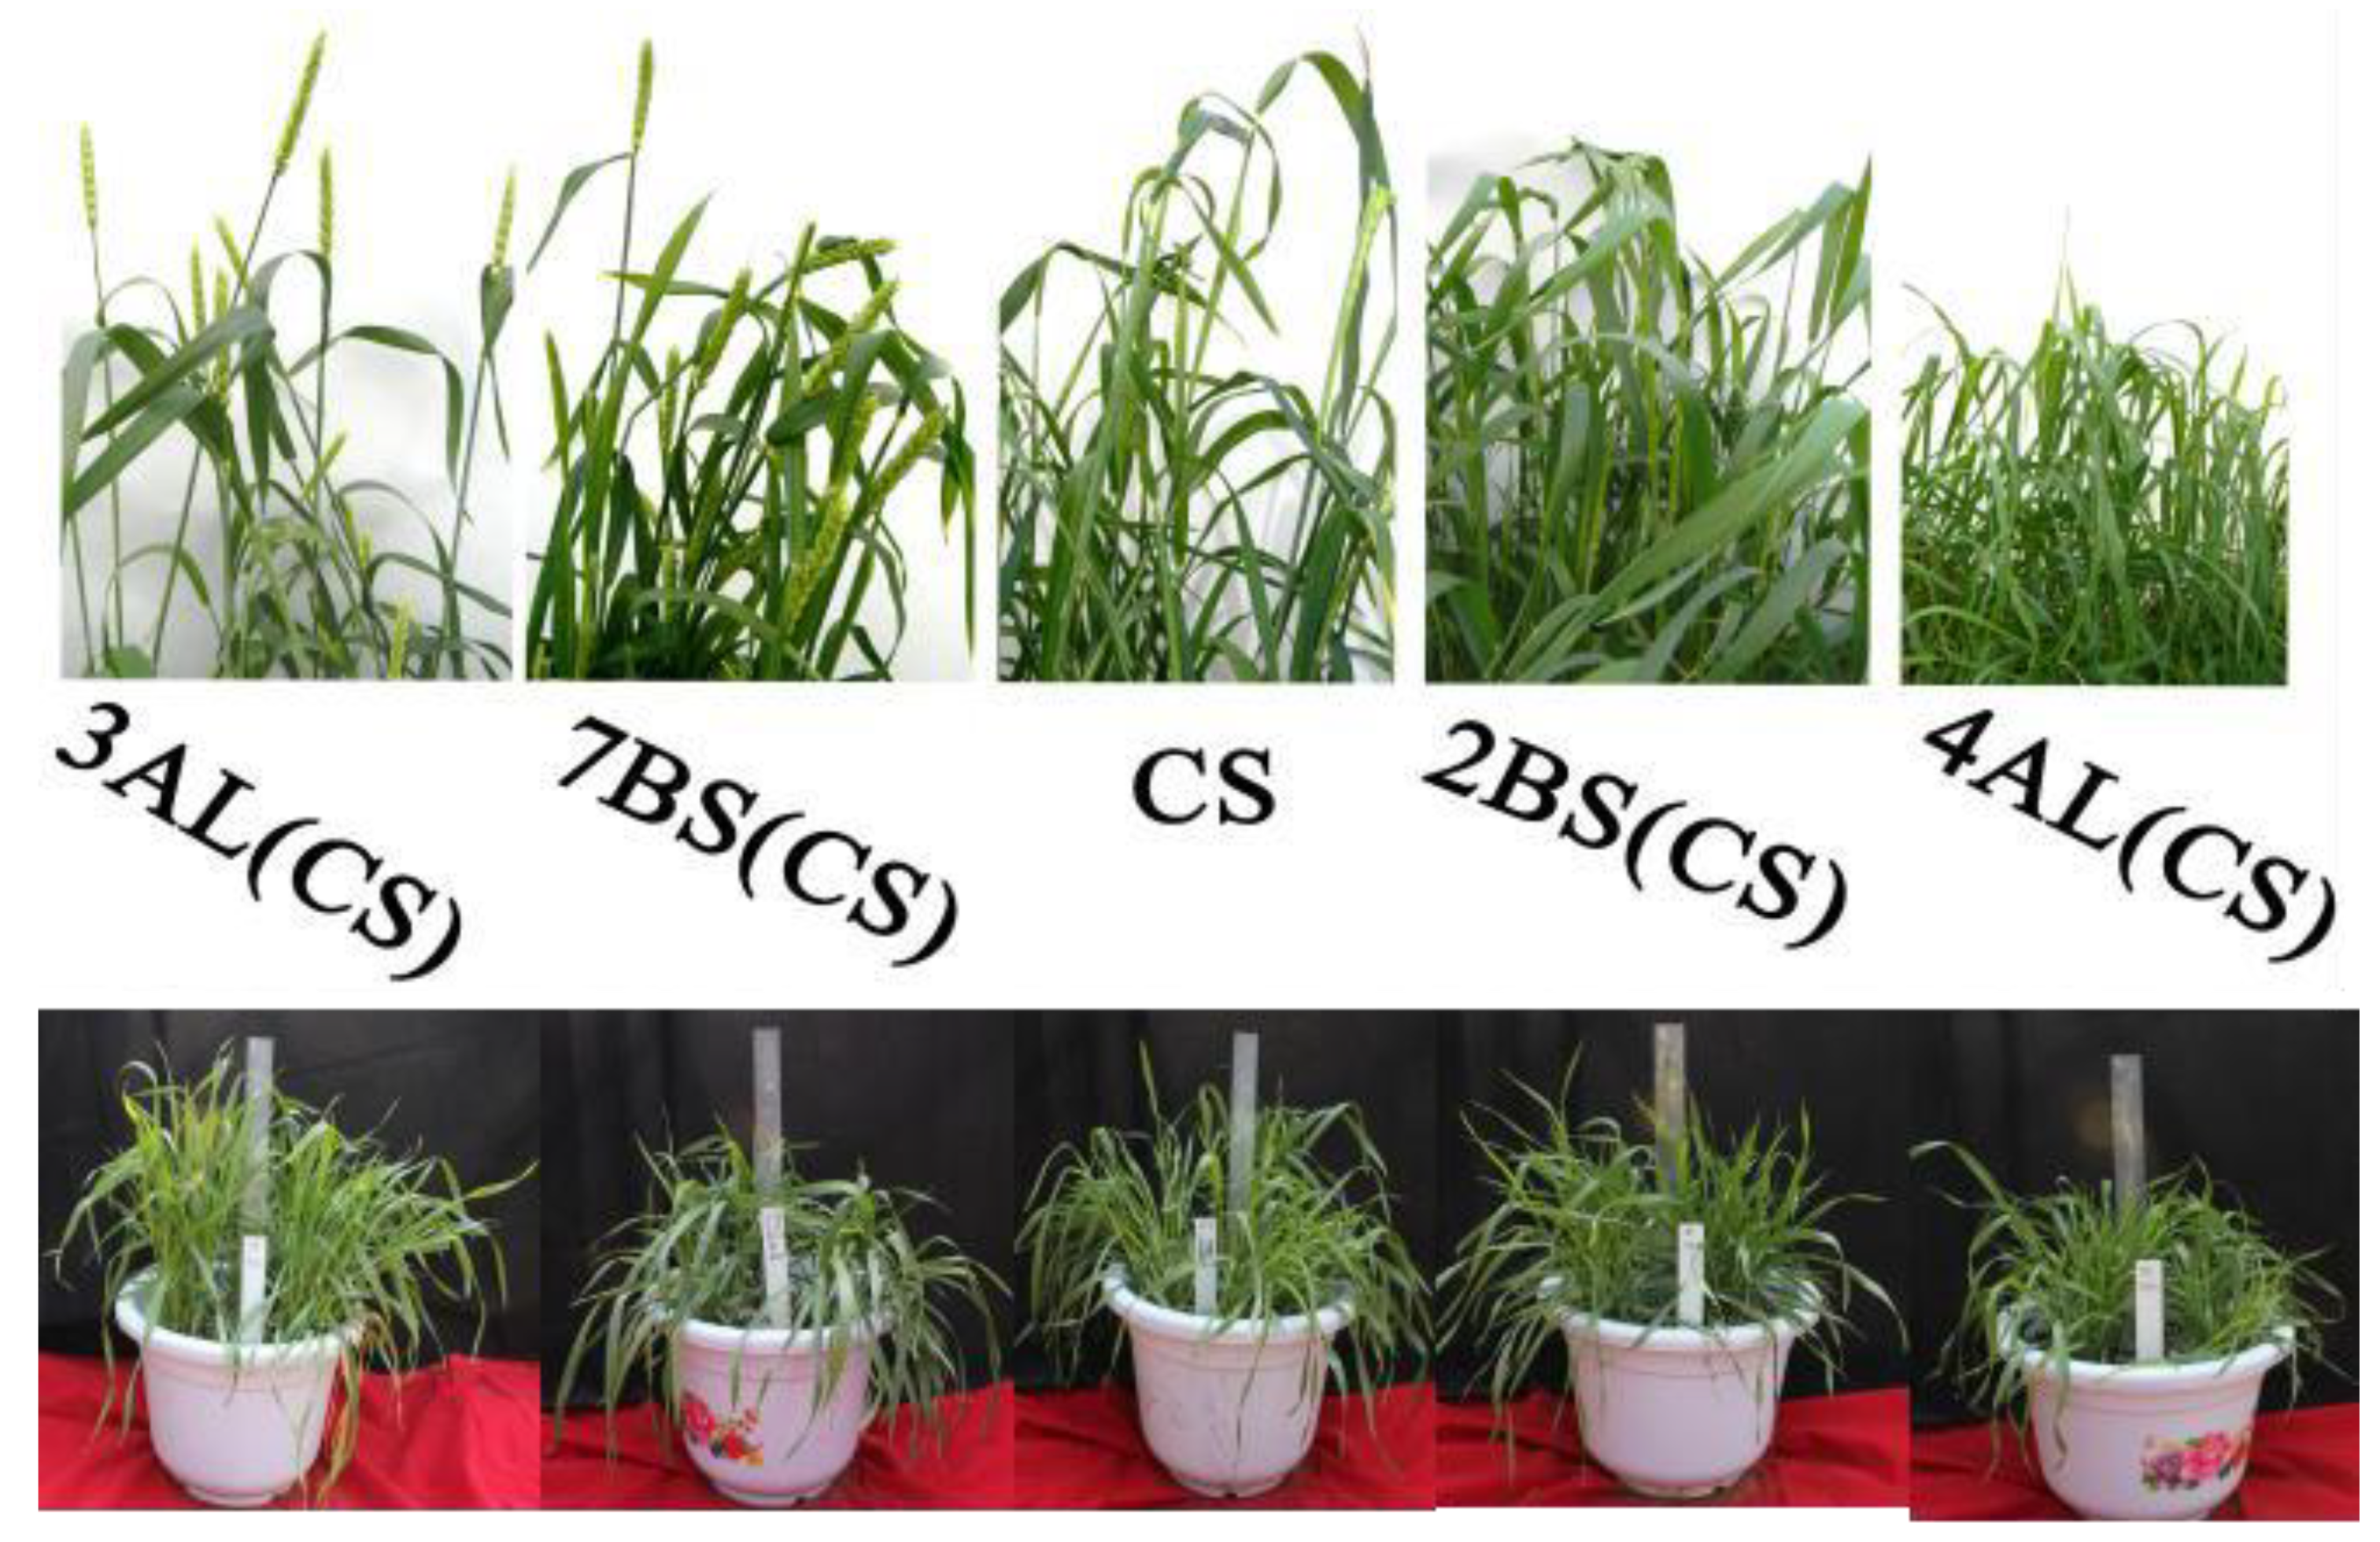
Seedling stage traits, including leaf width, plant height, and tiller number, were statistically analyzed for late-maturing (CASL4AL, CASL2BS) and early-maturing (CASL3AL, CASL7BS, CASL3AS) CASLs, as well as the CS parent and TDIC140. These lines were selected from a set of 28 CASLs (CS background) based on HD. Significant differences were observed for all traits (Figure 4 and Figure 5). Late-maturing lines generally exhibited narrower leaves, shorter plant height, and greater tiller number compared to early-maturing lines. TDIC140 had significantly lower values for plant height, leaf width, and tiller number than both the CS parent and the CASLs.
Figure 4.
Statistical analysis of CASLs Leaf width, plant height, tiller number in CS.
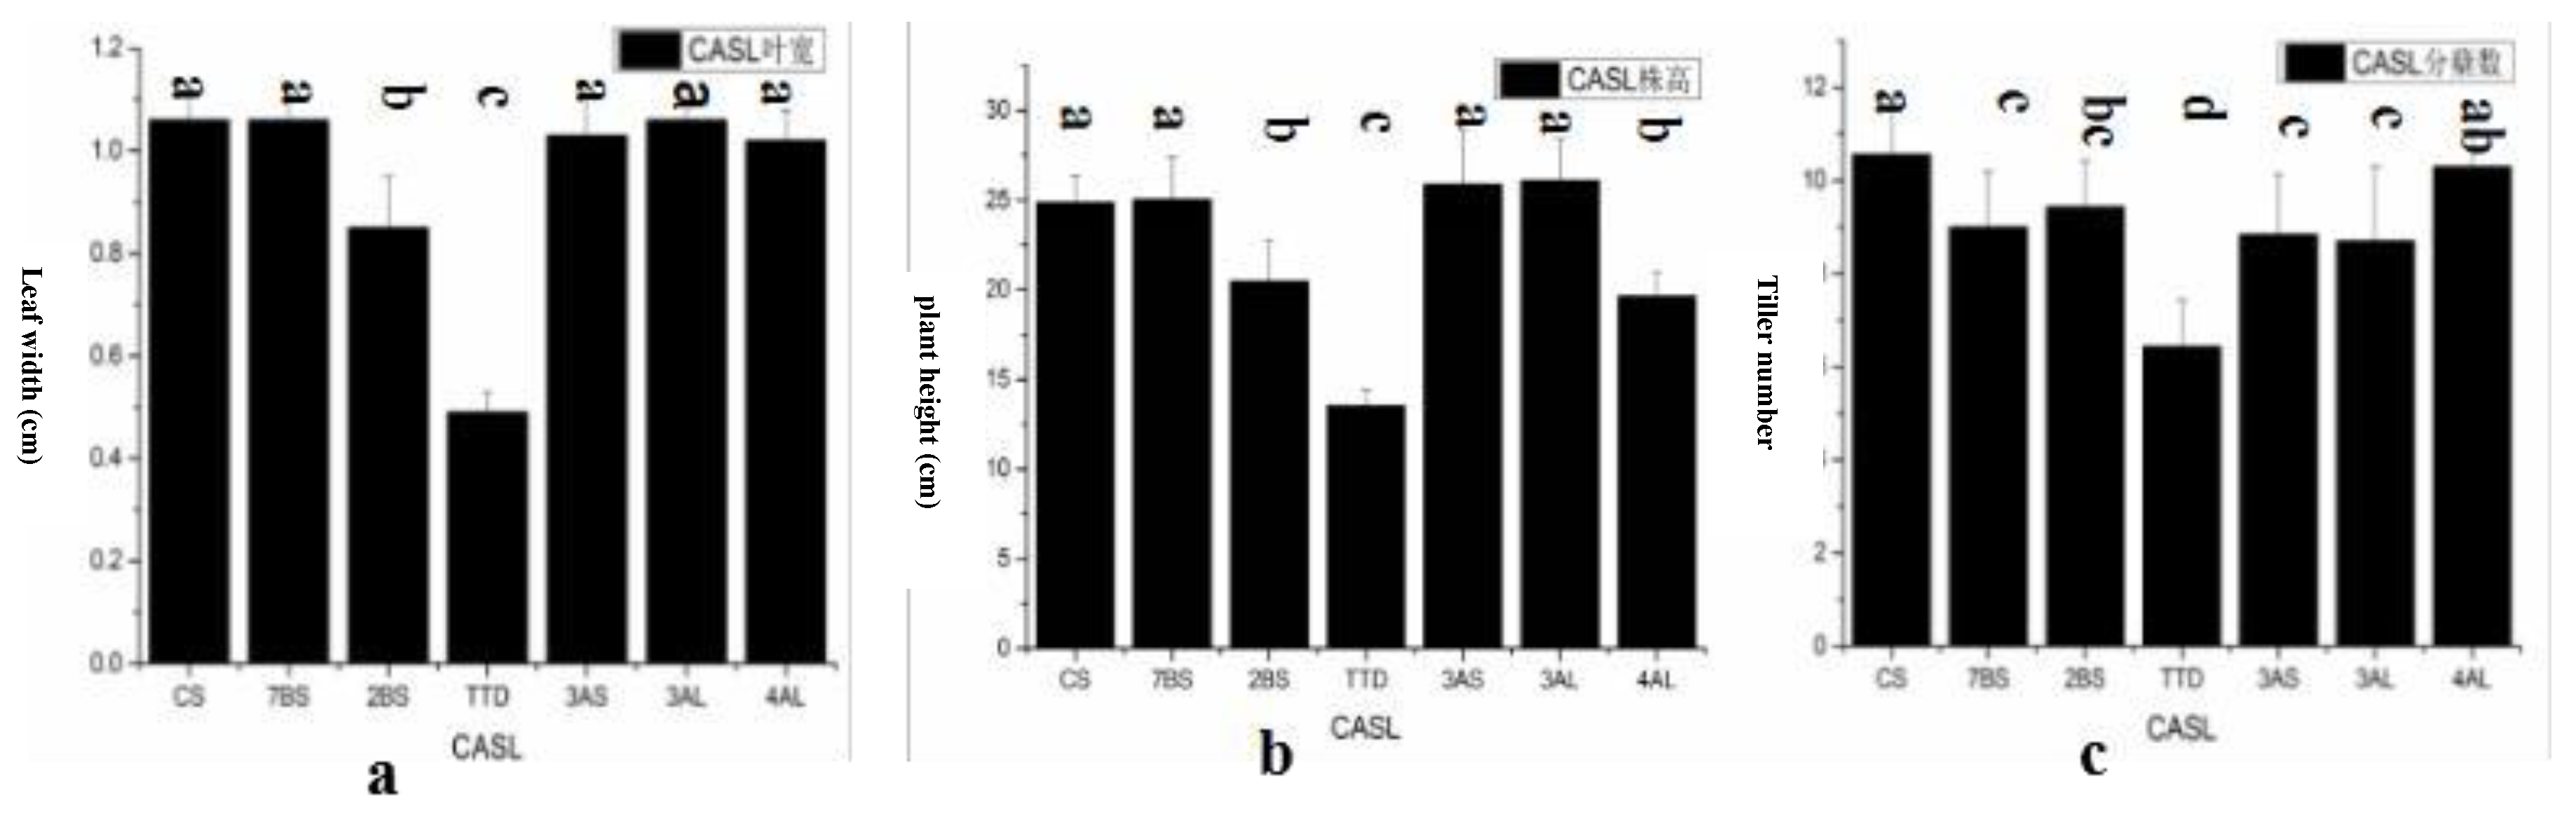
Figure 5.
Phenotypic differences in seedling and heading stage of CASL in CS background.
3.3. Investigation and Data Analysis of Grain Traits
Grayscale and RGB Values: Grayscale, red, green, and blue values were statistically analyzed for the 28 CASLs and their CS parent (Table 4). Significant differences in these traits were observed among the CASLs. CASL4AL and CASL2BS exhibited significantly higher grayscale values than the parent, while CASL7AL had a significantly lower grayscale value. Four substitution lines (CASL2BS, CASL4AS, CASL2BL, and CASL1AL) had significantly higher R values than the parent. CASL4AL and CASL2BS exhibited significantly higher G values than the parent, whereas CASL7AL and CASL4BL had significantly lower G values. CASL7BS had a significantly lower B value than the parent.
Table 4.
Statistical analysis of the Gray value, RGB value of CASL in CS background to CS.
| CASL | Grayscale Value | CASL | R Value | CASL | G Value | CASL | B Value |
|---|---|---|---|---|---|---|---|
| 4AL | 142.28±2.73 a | 2BS | 180.8±4.24 A | 4AL | 138.78±3.96 A | 2BL | 82.9±6.93 A |
| 2BS | 141.08±1.61 ab | 4AS | 179.37±8.16 AB | 2BS | 137.98±0.35 A | 2AL | 79.62±2.11 AB |
| 2BL | 140.75±2.07 abc | 2BL | 177.75±3.44 ABC | 2BL | 135.07±3.94 AB | 5BL | 78.37±1.1 ABC |
| 2AL | 139.72±0.68 abcd | 1AL | 176.92±0.79 ABCD | 2AL | 133.8±0.48 ABC | 1BS | 78.12±4.77 ABC |
| 1AL | 138.73±2.87 abcde | 2AL | 175.9±3.38 ABCDE | 1AL | 132.38±3.61 ABCD | 4AL | 77.88±4.54 ABCD |
| 5BL | 136.97±1.46 abcdef | 1BS | 172.58±0.8 ABCDEF | 3AS | 131.63±3.46 BCDE | CS | 77.87±2.92 ABCD |
| 3AS | 136.83±3.6 abcdef | 3AS | 172.35±5.03 ABCDEF | 5BL | 131.48±1.23 BCDEF | 6BS | 77.13±4.92 ABCDE |
| 6BS | 136.07±1.84 bcdefg | 5BL | 171.77±2.2 BCDEF | CS | 131.33±2.16 BCDEF | 2BS | 76.22±4.53 ABCDE |
| 1AS | 135.8±2.16 bcdefgh | 2AS | 171.75±2.39 BCDEF | 6BS | 130.75±4.29 BCDEFG | 5AL | 75.53±6.76 ABCDE |
| CS | 135.4±2.43 cdefgh | 1BL | 171.7±0.88 BCDEF | 1AS | 130.72±2.96 BCDEFG | 4AS | 75.5±2.05 ABCDE |
| 1BS | 135.38±2.27 cdefghi | 1AS | 171.47±0.78 BCDEF | 3AL | 130.12±0.42 BCDEFGH | 1AL | 75.47±5.39 ABCDE |
| 4AS | 135.28±0.9 cdefghi | 4BS | 171.42±3.05 BCDEF | 4AS | 130.08±1.63 BCDEFGH | 7BL | 75.05±1.48 ABCDE |
| 7AS | 135.17±0.28 cdefghi | 6BS | 170.7±2.59 BCDEF | 7AS | 130.02±0.46 BCDEFGH | 3AS | 74.9±1.73 ABCDE |
| 3AL | 134.65±0.73 defghi | 3BS | 170.58±6.72 BCDEF | 1BS | 128.4±2.42 CDEFGH | 3AL | 73.93±2.28 ABCDE |
| 4BS | 133.32±1.58 efghi | 7BS | 170.5±1.98 BCDEF | 3BL | 127.17±3.05 CDEFGH | 7AS | 73.38±4.87 ABCDE |
| 3BL | 133.22±2.24 efghi | 7AS | 170.32±1.43 BCDEF | 5AL | 126.93±0.96 CDEFGH | 1AS | 73±3.55 ABCDE |
| 5AL | 132.95±0.51 fghi | 3BL | 169.65±0.59 CDEF | 4BS | 126.92±1.34 CDEFGH | 3BL | 72.88±3.01 ABCDE |
| 3BS | 132.38±1.31 fghi | 6AS | 169.28±0.46 CDEF | 6BL | 125.62±4.2 DEFGH | 4BL | 72.82±3.27 ABCDE |
| 2AS | 132.25±2.69 fghi | 6BL | 168.72±6.18 CDEF | 3BS | 125.6±4.73 DEFGH | 6AL | 72.72±1.99 ABCDE |
| 1BL | 131.72±1.01 fghi | 3AL | 168.37±2.49 DEF | 2AS | 125.48±3.08 DEFGH | 3BS | 70.8±5.55 BCDE |
| 6BL | 131.7±2.79 fghi | 5AL | 168.22±2.05 DEF | 6AS | 125.35±2.43 DEFGH | 6BL | 70.55±4.67 BCDE |
| 6AS | 131.45±2.3 fghi | 4AL | 167.78±3.19 DEF | 6AL | 125.1±3.89 EFGH | 4BS | 70.33±1.38 BCDE |
| 6AL | 131.33±3.58 fghi | 5AS | 167.78±3.19 DEF | 7BL | 124.69±2.67 EFGH | 5BS | 69.97±2.55 BCDE |
| 7BS | 131.08±0.44 fghi | 6AL | 167.47±3.74 EF | 5AS | 124.5±3.56 EFGH | 1BL | 69.38±2.42 BCDE |
| 7BL | 130.83±2.77 ghi | CS | 167.12±4.74 EF | 5BS | 124.33±4 FGH | 7AL | 69.17±5.59 BCDE |
| 5AS | 130.37±2.51 ghi | 5BS | 166.68±1.97 EF | 1BL | 124.3±0.94 FGH | 6AS | 67.97±6.75 CDE |
| 5BS | 130.33±2.13 ghi | 4BL | 166.63±3.04 EF | 7BS | 124.3±0.79 FGH | 2AS | 67.62±2.34 CDE |
| 4BL | 130.07±2.57 hi | 7BL | 165.77±3.71 F | 7AL | 123.77±1.03 GH | 5AS | 67±6.22 DE |
| 7AL | 129.53±0.34 i | 7AL | 165.68±4.31 F | 4BL | 123.35±2.19 H | 7BS | 66.83±3.73 E |
Different letters after a same column mean significant differences among the materials at 0.01 level. Grayscale Value: The grayscale value of each pixel in an image ranges from 0 to 255, representing the brightness level. It can also be expressed as the percentage of coverage by black ink (from 0% to 100%).RGB Value: Refers to the three primary colors: Red, Green, and Blue. Each color channel has a value from 0 (black) to 255 (white), representing the brightness level of that color.
Grain Length, Grain Width, Grain Thick, and Thousand-Grain Weight:Analysis of variance revealed significant differences in grain length (GL), grain width (GW), grain thick (GT), and thousand-grain weight (TKW) between the CS parent and the 28 CASLs (Table 5). Seed length ranged from 6.57 to 8.34 mm. Twenty-two CASLs had longer grains than the parent, with CASL6AS, CASL2AS, CASL4BL, and CASL1BL exhibiting significantly longer grains. Six CASLs had shorter grains than the parent; in three of these (CASL3BL, CASL6BS, and CASL2BL), GL was less than 92% of the parent. Seed width ranged from 2.98 to 3.73 mm. CASL2AS and CASL1BL had significantly wider grains than the parent. Seed thickness ranged from 2.12 to 2.82 mm. Six CASLs (CASL4BL, CASL3BL, CASL2BL, CASL7AS, CASL4AS, and CASL7BS) had significantly thicker grains than the parent. Projected area ranged from 17.20 to 23.41 mm². Eight CASLs had significantly larger projected areas than the parent. TKW ranged from 26.63 to 35.48 g. Fifteen CASLs had greater TKW than the parent. These results suggest the presence of QTLs on specific chromosome arms controlling these traits.
Table 5.
Statistical analysis of the grain length, width, size and weight of CASL.
| CASL | Length/mm | CASL | Width/mm | CASL | Thickness/mm | CASL | Projected Area /mm2 | CASL | TGW |
|---|---|---|---|---|---|---|---|---|---|
| 6AS | 8.34±0.16 a | 2AS | 3.73±0.01 a | 4BL | 2.82±0.08 a | 2AS | 23.41±0.1 a | 7AL | 35.48±1.16 a |
| 2AS | 8.34±0.21 a | 1BL | 3.7±0.1 ab | 3BL | 2.78±0.19 ab | 1BL | 22.65±0.65 ab | 7AS | 34.89±1.01 a |
| 4BL | 8.28±0.07 ab | 3BS | 3.67±0 abc | 2BL | 2.75±0.07 abc | 6AS | 22.27±0.38 bc | 4BS | 32.99±1.36 ab |
| 1BL | 8.14±0.13 abc | 7AL | 3.66±0.07 abc | 7AS | 2.74±0.09 abc | 7AL | 22.04±0.81 bcd | 6AL | 32.65±0.79 abc |
| 7AL | 8.03±0.1 abcd | 3AS | 3.66±0.04 abc | 4AS | 2.7±0.13 bc | 4BL | 21.96±0.99 bcd | 6AS | 32.56±1.47 abc |
| 5AS | 7.91±0.16 abcde | 5AS | 3.65±0 abcd | 7BS | 2.7±0.05 bc | 5AS | 21.74±0.59 bcde | 1BL | 32.54±0.98 abc |
| 3AS | 7.82±0.14 bcde | 2AL | 3.64±0.01 abcd | 2AS | 2.65±0.05 cd | 3AS | 21.56±0.56 cdef | 7BL | 32.3±1.15 abcd |
| 5AL | 7.82±0.25 bcdef | 5BS | 3.63±0.01 abcd | 3AS | 2.65±0.12 cd | 7BL | 21.56±0.26 cdef | 2AS | 32.29±1.49 abcd |
| 2BS | 7.81±0.06 bcdef | 4BS | 3.63±0.07 abcd | 7AL | 2.65±0.02 cd | 2AL | 21.51±0.42 cdefg | 1AL | 32.28±1.36 abcd |
| 7AS | 7.8±0.22 bcdef | 4BL | 3.62±0.11 abcde | 3AL | 2.64±0 cde | 3BS | 21.32±0.16 cdefg | 3AL | 32.25±1.51 abcd |
| 6AL | 7.7±0.15 cdef | 1AL | 3.61±0.01 abcde | 5AS | 2.64±0.03 cde | 5BS | 21.27±0.17 cdefg | 3AS | 31.97±1.91 abcde |
| 3AL | 7.68±0.15 cdef | 7BS | 3.59±0.02 abcde | 3BS | 2.57±0 def | 3AL | 21.1±0.54 defg | 5BS | 31.78±1.38 abcde |
| 7BL | 7.68±0.42 cdef | 3AL | 3.57±0.09 abcde | 2BS | 2.56±0.04 defg | 7AS | 21.09±0.34 defg | 4BL | 31.61±1.57 abcde |
| 3BS | 7.66±0.16 cdef | 6AS | 3.57±0.02 abcde | CS | 2.55±0.04 defg | 5AL | 21.07±0.72 defg | 5AS | 31.56±1.67 abcde |
| 4BS | 7.64±0.22 cdef | 7BL | 3.57±0.05 abcde | 1BL | 2.55±0.02 defg | 4BS | 21.06±0.38 defg | 3BL | 31.44±1.19 abcde |
| 2AL | 7.62±0.26 cdef | 2BL | 3.56±0.09 abcde | 5AL | 2.55±0.03 defg | 2BS | 20.74±0.17 efg | CS | 31.28±1.13 bcde |
| 5BL | 7.62±0.26 cdef | 5BL | 3.54±0.03 abcdef | 7BL | 2.54±0.02 defgh | 7BS | 20.65±0.42 efg | 4AS | 30.95±1.6 bcde |
| 1BS | 7.61±0.21 cdef | 5AL | 3.53±0.04 abcdef | 6BL | 2.53±0.07 defgh | 5BL | 20.63±0.3 fg | 1AS | 30.78±1.13 cde |
| 1AL | 7.61±0 cdef | 7AS | 3.53±0.02 abcdef | 6AL | 2.53±0.01 defgh | 6AL | 20.46±0.61 gh | 1BS | 30.76±2.02 cde |
| 1AS | 7.59±0.06 def | 6AS | 3.52±0.04 bcdef | 5BL | 2.52±0.01 efgh | 1AL | 20.42±0.36 gh | 5AL | 30.45±1.15 cdef |
| 5BS | 7.59±0.27 def | CS | 3.47±0.02 cdefg | 6BS | 2.51±0.01 fgh | CS | 20.42±0.27 gh | 7BS | 30.29±1.37 cdef |
| 6BL | 7.58±0.26 def | 1BS | 3.47±0.07 cdefg | 2AL | 2.48±0.02 fghi | 1BS | 19.54±1.11 hi | 3BS | 30.23±1.37 cdef |
| CS | 7.52±0.11 defg | 4AS | 3.46±0.04 cdefg | 5BS | 2.47±0.03 fghi | 4AS | 19.47±1.17 hi | 2BS | 29.22±0.95 cdef |
| 4AS | 7.42±0.22 efgh | 2BS | 3.45±0.13 defg | 1AL | 2.46±0.05 fghi | 4AL | 18.96±0.8 ij | 2BL | 29.22±0.79 cdef |
| 4AL | 7.28±0.34 fgh | 3BL | 3.42±0.09 efg | 4BS | 2.45±0.05 fghi | 2BL | 18.95±0.73 ij | 5BL | 29.18±1 cdef |
| 7BS | 7.08±0.76 ghi | 4AL | 3.34±0 fgh | 1BS | 2.45±0.07 ghi | 3BL | 18.87±0.34 ij | 6BL | 28.83±1.81 def |
| 3BL | 6.96±0.59 hij | 1AS | 3.28±0 gh | 1AS | 2.43±0.04 hi | 1AS | 18.19±0.31 jk | 2AL | 28.65±0.96 ef |
| 6BS | 6.74±0.67 ij | 6BS | 3.17±0.06 h | 6AS | 2.39±0.04 i | 6BS | 17.73±0.1 kl | 6BS | 27.05±1.15 f |
| 2BL | 6.57±0.67 j | 6BL | 2.98±0.03 i | 4AL | 2.12±0.02 j | 6BL | 17.2±0.14 l | 4AL | 26.63±1.66 f |
Different letters after a same column mean significance differences among the materials at 0.05 level; TGW:Thousand-Grain Weight.
Correlation Analysis: Correlation analysis revealed significant relationships between grain traits and HD (Table 6). The HD is significantly positively correlated with the seed red value, gray value, and grain thick (GT), and significantly negatively correlated with thousand-grain weight (P<0.01). Additionally, the HD is significantly positively correlated with the GV at the 5% level. TKW is highly negatively correlated with grayscale and RGB Values, and significantly positively correlated with grain length, width, and projected area at the 1% level (P<0.01), as well as significantly positively correlated with grain thickness at the 5% level.
Table 6.
Simple correlation coefficients (r) between the investigated traits.
| CASLs | Heading Period | R Value | G Value | B Value | Grayscale Value | Width/mm | Length/mm | Average Grain Thickness | Projected Area/mm2 | TGW |
|---|---|---|---|---|---|---|---|---|---|---|
| Heading Period | 1 | |||||||||
| R Value | 0.555** | 1 | ||||||||
| G Value | 0.467* | 0.779** | 1 | |||||||
| B Value | 0.288 | 0.493** | 0.791** | 1 | ||||||
| Grayscale Value | 0.509** | 0.878** | 0.980** | 0.784** | 1 | |||||
| Width/mm | -0.353 | 0.023 | -0.276 | -0.344 | -0.207 | 1 | ||||
| Length/mm | -0.142 | -0.279 | -0.492** | -0.578** | -0.472** | 0.539** | 1 | |||
| Average Grain Thickness | -0.505** | -0.335 | -0.324 | -0.14 | -0.329 | 0.235 | 0.07 | 1 | ||
| Projected Area/mm2 | -0.291 | -0.116 | -0.404* | -0.505** | -0.353 | 0.895** | 0.839** | 0.192 | 1 | |
| TGW | -0.479** | -0.535** | -0.541** | -0.509** | -0.578** | 0.476** | 0.549** | 0.383* | 0.572** | 1 |
**. Correlation is significant at the 0.01 level (2-tailed); *. Correlation is significant at the 0.05 level (2-tailed).
3.4. Statistical Analysis of Spike Traits
Spike length, spikelet number, and TKW are important yield-related traits in wheat. These traits exhibit complex interrelationships, necessitating a comprehensive approach to selection that considers their interactions. Selection based on a single trait is unlikely to maximize yield. Correlation analysis can facilitate the identification of desirable plant ideotypes. Similar to leaves, awns contribute to photosynthesis in wheat, directly supplying photosynthates to developing spikelets and playing a crucial role in grain filling. Awn presence/absence and length are key traits for wheat classification (Table 1). Based on these categories, awn phenotypes were recorded and classified. Wheat spike morphology can be categorized into five types based on size and shape (Table 2). Tillers are branches that develop from the base of the wheat plant. Effective tillers produce fertile spikes and contribute to grain yield, whereas ineffective tillers either fail to produce spikes or produce infertile spikes.
Spike Length:Spike length was measured and analyzed for the 28 CASLs and their CS parent (Table 7). Spike length ranged from 6.04 to 8.68 cm, compared to 7.03 cm for the CS parent. Eighteen CASLs had longer spikes than the parent. CASL6AS (8.04 cm) and CASL5AL (8.68 cm) had significantly longer spikes than the parent (P<0.05). Ten CASLs had shorter spikes than the parent, with CASL2AL exhibiting the shortest spike length (6.04 cm)(Figure 6). These results suggest that genes influencing spike length may be located on chromosome arms 6AS and 5AL.
Number of Spikelets:Analysis of variance revealed that the average number of spikelets per spike ranged from 15.71 to 22.16 among the 28 CASLs and their CS parent (mean=19.49). Six CASLs exhibited a greater number of spikelets per spike than the CS parent, with CASL6BL having the highest number (22.16) and differing significantly from the parent (P<0.05). Twenty-two CASLs had fewer spikelets than the parent. Three of these (CASL2BS, CASL1AS, and CASL2AL) had significantly fewer spikelets than the parent (Table 7). These results suggest that a positive-effect QTL controlling spikelet number may be located on chromosome arm 6BL, while negative-effect QTLs may reside on 2BS, 1AS, and 2AL.
Number of Grains per Spike:Among the 28 CS-background CASLs, grains per spike ranged from 30.13 to 51.18, compared to 39.42 for the CS parent. Sixteen CASLs exhibited higher grain numbers than the parent. CASL7AL and CASL3AS had the highest grain numbers (51.18 and 49.77, respectively), representing increases of >26% compared to the CS parent. Conversely, CASL1AS and CASL3BS had the lowest grain numbers (30.57 and 30.13, respectively), representing decreases of >22% compared to the parent (Table 7). These differences were statistically significant. These results suggest that genes promoting increased grain number per spike may reside on chromosome arms 7AL and 3AS, while genes suppressing grain number may reside on 1AS and 3BS.
Correlation Analysis of Spike-related Target Traits:Correlation analysis of spike-related traits in the substitution lines (Table 8) revealed a significant positive correlation between spike length and the number of fertile grains (P<0.01). A weak positive correlation was observed between the number of fertile tillers and both spike length and the number of fertile grains (P< 0.05).
3.5. Statistical Analysis of Other Field Agronomic Traits
Plant Height: Plant height were measured for 52 CASLs, along with the parental lines (BLH, CS) and wild-type wheat accessions (TDIC140 ) (Table 9). Significant variation in plant height was observed among the BLH-background CASLs, ranging from 76.87 cm to 91.92 cm. Eight CASLs exhibited plant heights exceeding 89.73 cm, significantly taller than the BLH parent (86.26 cm). Seven CASLs were significantly shorter than the BLH parent, with plant heights below 82.12 cm. The wild-type accessions (TDIC140, TDIC140) had the shortest stature (73.46 cm), significantly shorter than both sets of CASLs and their respective parents. Within the CS background, eight CASLs were significantly taller than the CS parent, exceeding 121.37 cm (P<0.01). Twelve CS-background CASLs were shorter than the CS parent, although these differences were not statistically significant (P < 0.01). All CS-background CASLs exceeded 101 cm in height, while all BLH-background CASLs were shorter than 92 cm, indicating a generally shorter stature in the BLH background. All height comparisons were assessed using a significance threshold of P < 0.01.
Table 7.
Statistical analysis of Panicle length, spikelet number, tiller number, grain number per spike of CASL under CS background.
Table 7.
Statistical analysis of Panicle length, spikelet number, tiller number, grain number per spike of CASL under CS background.
| CASL | Spike Length(cm) | CASL | Spikelet Number | CASL | Number of Effective Tillers | CASL | Grain Number Per Panicle |
|---|---|---|---|---|---|---|---|
| 6AS | 8.04±0.41 a | 6BL | 22.16±0.89 a | 5AL | 17.00±1.73 a | 7AL | 51.18±5.18 a |
| 5AL | 8.68±1.56 ab | 4BS | 21.83±1.6 ab | 2BL | 16.33±1.53 a | 3AS | 49.77±4.05 ab |
| 4AL | 8.04±0.38 abc | 4AS | 20.86±0.93 abc | 3BS | 15.33±0.58 ab | 2AS | 47.12±3.64 abc |
| 4BS | 7.77±0.79 abcd | 5BL | 20.52±1.29 abc | 7AS | 15.00±2.58 abc | 5BL | 46.07±4.67 abcd |
| 2AS | 8.03±0.31 bcd | 7BS | 20.48±2.01 abc | 5BL | 14.33±2.21 bcd | 1BS | 45.8±5.53 abcd |
| 3AS | 7.77±0.34 bcd | 1BL | 19.72±2.21 abcd | 1BS | 14.00±1.36 bcd | 3BL | 45.73±2.69 abcd |
| 3BL | 8.02±0.61 bcd | CS | 19.49±1.07 bcde | 2AS | 13.67±2.08 bcd | 1BL | 45.13±5.74 abcd |
| 7AL | 7.91±0.48 bcd | 3BS | 19.43±1.3 bcde | 7AL | 13.67±2.69 bcd | 6BL | 44.54±1.47 abcd |
| 4AS | 7.49±0.02 bcde | 5AL | 19.39±1.97 bcde | 3AS | 13.33±2.52 bcd | 3AL | 43.11±3.29 abcde |
| 3AL | 7.43±0.05 bcde | 7AL | 19.38±1.37 bcde | 3AL | 13.33±2.52 bcd | 7BS | 42.98±1.75 abcde |
| 6AL | 7.62±0.29 bcde | 7BL | 19.09±0.66 cdef | 4AL | 13.33±2.52 bcd | 4BS | 42.81±1.11 abcde |
| 1BL | 7.62±0.37 bcde | 5AS | 18.95±2.05 cdef | 4BS | 13.33±1.08 bcd | 6AL | 42.03±3.21 bcdef |
| 5AS | 7.45±0.1 bcde | 6BS | 18.84±0.99 cdefg | 6BS | 13.33±0.58 bcd | 7BL | 41.47±1.93 bcdef |
| 5BL | 7.7±0.28 cdef | 1BS | 18.83±1 cdefg | 5AS | 12.33±1.53 bcde | 5AL | 41.43±5.63 bcdef |
| 4BL | 7.22±0.19 cdef | 4AL | 18.82±0.49 cdefg | 1BL | 12.00±1.61 bcde | 5BS | 40.74±3.88 cdefg |
| 1AL | 6.71±0.26 cdef | 6AS | 18.61±2.76 cdefg | 3BL | 12.00±1 bcde | 4AL | 40.49±5.93 cdefg |
| 1BS | 7.42±0.55 cdef | 7AS | 18.51±1.86 cdefg | 4BL | 12.00±1.61 bcde | CS | 39.42±2.86 cdefg |
| 7BL | 6.91±0.7 cdef | 2BL | 17.75±1.41 defgh | 6AS | 11.67±2.06 bcde | 2AL | 38.58±2.73 cdefgh |
| CS | 7.03±0.6 cdef | 5BS | 17.62±2.04 defgh | 7BS | 11.67±1.53 bcde | 2BL | 38.48±3.84 cdefgh |
| 7AS | 7.06±0.38 cdef | 2AS | 17.36±1.01 defgh | 6AL | 11.33±0.58 bcde | 4BL | 38.46±2.63 cdefgh |
| 3BS | 6.62±0.43 cdef | 6AL | 17.26±1.13 defgh | CS | 11.00±1.00 bcde | 6BS | 37.55±3.65 cdefgh |
| 7BS | 6.7±0.55 cdef | 3BL | 17.19±0.44 defgh | 2AL | 10.67±1.79 bcdef | 6AS | 36.36±3.6 defgh |
| 6BL | 7.02±0.16 cdef | 4BL | 17.11±1.08 defgh | 2BS | 10.00±1.00 cdef | 7AS | 36.3±4.86 defgh |
| 1AS | 6.57±0.14 cdef | 1AL | 17.08±0.63 defgh | 7BL | 10.00±1.04 cdef | 2BS | 34.29±3.28 efgh |
| 2BL | 6.62±0.76 def | 3AL | 16.78±0.54 efgh | 4AS | 9.67±1.43 cdef | 4AS | 33.97±2.19 efgh |
| 5BS | 6.87±0.32 def | 3AS | 16.7±1.74 efgh | 5BS | 9.00±0.73 def | 1AL | 32.81±2.76 fgh |
| 2BS | 6.74±0.35 def | 2BS | 16.37±1.03 fgh | 6BL | 9.00±1.65 efg | 5AS | 31.28±3.04 gh |
| 6BS | 6.38±0.03 ef | 1AS | 16.2±0.9 gh | 1AL | 6.33±1.53 fg | 1AS | 30.57±2.41 h |
| 2AL | 6.04±0.38 f | 2AL | 15.71±1.52 h | 1AS | 6.00±1.00 g | 3BS | 30.13±2.75 h |
Different letters after a same column mean significance differences among the materials at 0.05 level.
Table 8.
Simple correlation coefficients (r) between the investigated traits.
| CASL | Spike Length | Effective Grains | Effective Tiller | Spikelet Number | TGW |
|---|---|---|---|---|---|
| SpikeLength | 1 | ||||
| EffectiveGrains | 0.54** | 1 | |||
| EffectiveTiller | 0.41* | 0.33* | 1 | ||
| Spikelet Number | 0.23 | 0.17 | 0.19 | 1 | |
| TGW | 0.23 | 0.21 | 0.00 | -0.03 | 1 |
**. Correlation is significant at the 0.01 level (2-tailed); *. Correlation is significant at the 0.05 level (2-tailed).
Table 9.
Statistical analysis of Plant height, panicle type, type of mountain of CASL.
| BLH background | CS background | ||||||
|---|---|---|---|---|---|---|---|
| CASL | Plant Height(cm) | Panicle Type | Type of Spike Awn | CASL | Plant Height(cm) | Panicle Type | Type of Spike Awn |
| 5BS | 91.92±2.44A | Elliptic-type | Long awn | 2BS | 136.19±3.81A | Elliptic-type | No awn |
| 7AL | 91.74±2.83A | Elliptic-type | Long awn | 4AL | 126.52±3.48B | Elliptic-type | Base short awn Top long awn |
| 1AL | 91.10±2.03AB | Elliptic-type | Long awn | 7AL | 124.47±3.53BC | Elliptic-type | No awn |
| 5BL | 90.89±2.50AB | Elliptic-type | Long awn | 1BL | 122.67±4.33BCD | Elliptic-type | No awn |
| 1BS | 90.87±2.55AB | Elliptic-type | Long awn | 4BL | 122.98±4.02BCD | Elliptic-type | No awn |
| 6AS | 90.70±2.93AB | Elliptic-type | Long awn | 1AS | 122.08±4.92BCD | Rectangle | No awn |
| 1AS | 89.73±2.86AB | Elliptic-type | Long awn | 1AL | 121.53±3.47BCD | Clavate-type | No awn |
| 7AS | 89.73±2.86AB | Elliptic-type | Long awn | 1BS | 121.37±3.63BCD | Elliptic-type | No awn |
| 2AS | 87.93±2.4BC | Elliptic-type | Long awn | 4AS | 120.13±3.87BCDE | Elliptic-type | Base short awn Top long awn |
| 2BS | 87.87±2.55BC | Elliptic-type | Long awn | 3AS | 117.62±5.38BCDEF | Rectangle | No awn |
| BLH | 86.26±1.67CD | Elliptic-type | Long awn | 7BS | 117.02±2.98CDEFG | Elliptic-type | No awn |
| 3AL | 86.07±2.1CD | Elliptic-type | Long awn | 6AS | 116.01±3.99CDEFG | Elliptic-type | No awn |
| 2BL | 85.74±2.84CD | Elliptic-type | Long awn | 5AS | 115.24±4.76CDEFG | Elliptic-type | No awn |
| 3BL | 84.52±3.33CDE | Elliptic-type | Long awn | 7BL | 114.04±3.96DEFG | Elliptic-type | No awn |
| 3AS | 84.13±1.95DE | Elliptic-type | Long awn | 5AL | 113.82±4.18DEFG | cone model | No awn |
| 5AS | 84.02±2.2DE | Elliptic-type | Long awn | 6BS | 113.13±3.87DEFGH | Elliptic-type | Base short awn Top long awn |
| 3BS | 83.96±2.33DE | Elliptic-type | Long awn | CS | 112.61±2.39EFGHI | Elliptic-type | No awn |
| 4BL | 83.87±2.54DE | Elliptic-type | Long awn | 2AS | 111.97±3.03EFGHI | Elliptic-type | No awn |
| 4BS | 82.12±1.98EF | Elliptic-type | Long awn | 4BS | 111.82±3.18EFGHI | Elliptic-type | No awn |
| 4AL | 81.92±2.42EF | Elliptic-type | Long awn | 5BL | 110.59±4.41EFGHI | Elliptic-type | No awn |
| 7BS | 81.71±2.9EF | Elliptic-type | Long awn | 6AL | 109.83±5.17EFGHI | Elliptic-type | No awn |
| 6BL | 80.26±1.67FG | Elliptic-type | Long awn | 3AL | 109.16±5.84EFGHI | Elliptic-type | No awn |
| 6AL | 80.02±2.2FG | Elliptic-type | Long awn | 6BL | 109.25±3.75FGHI | Elliptic-type | Base short awn Top long awn |
| 1BL | 78.03±2.18G | Elliptic-type | Long awn | 3BS | 108.46±4.54FGHI | Rectangle | No awn |
| 7BL | 76.87±2.55G | Elliptic-type | Long awn | 5BS | 108.74±3.26GHI | Elliptic-type | No awn |
| TTD | 73.46±1.54H | Spindle-type | Long awn | 3BL | 105.08±2.92HI | Elliptic-type | No awn |
| 7AS | 103.69±3.31I | Elliptic-type | No awn | ||||
| 2AL | 102.99±4.01I | Clavate-type | No awn | ||||
| 2BL | 101.37±3.63I | Elliptic-type | No awn | ||||
| TTD | 73.46±1.54J | Spindle-type | Long awn | ||||
Different letters after a same column mean significance differences among the materials at 0.01 level.
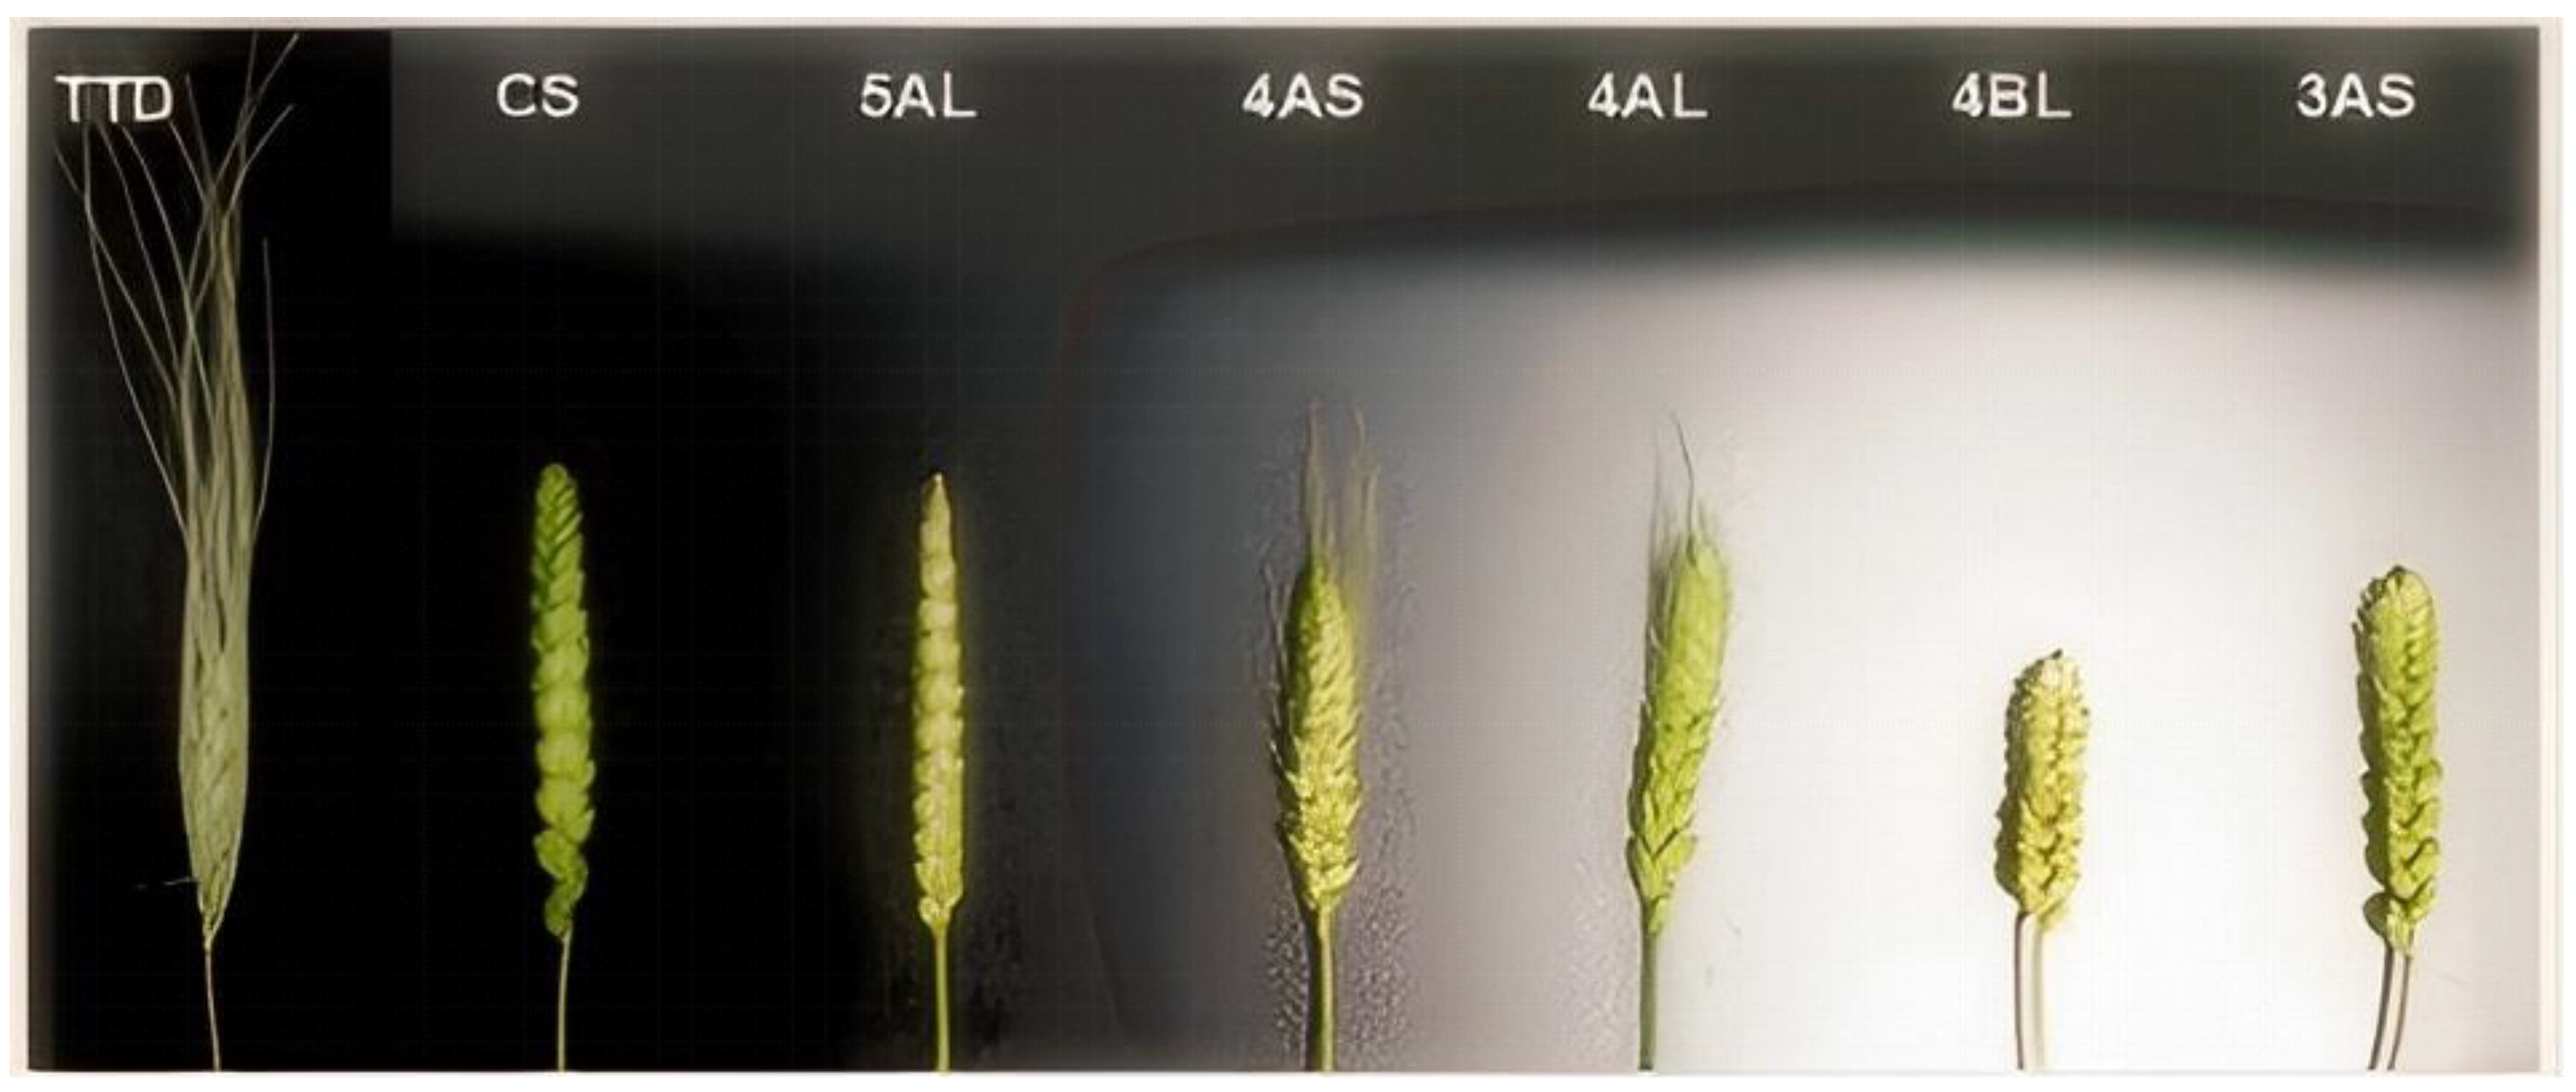
Spike Morphology:Spike morphology was assessed for both sets of materials according to national wheat classification standards (Table 9). The wild-type wheat accessions (TDIC140,TDIC140) exhibited fusiform spikes. In the BL background, all CASLs displayed elliptical spikes, mirroring the BL parent. Similarly, most CS-background CASLs also had elliptical spikes, consistent with the CS parent. Exceptions included CASL1AS, 3AS, and 3BS, which exhibited spikes closer to a rectangular shape. CASL1AL and 2AL displayed clavate (club-shaped) spikes, while CASL5AL exhibited pyramid-shaped spikes (Figure 7). These findings suggest that genes influencing spike morphology reside on chromosomes 1AS, 3AS, 3BS, 1AL, 2AL, and 5AL. Specifically, a gene on chromosome 5AL of Chinese Spring may suppress the pyramid-shaped spike phenotype.
Figure 6.
CASL spike length under CS background.
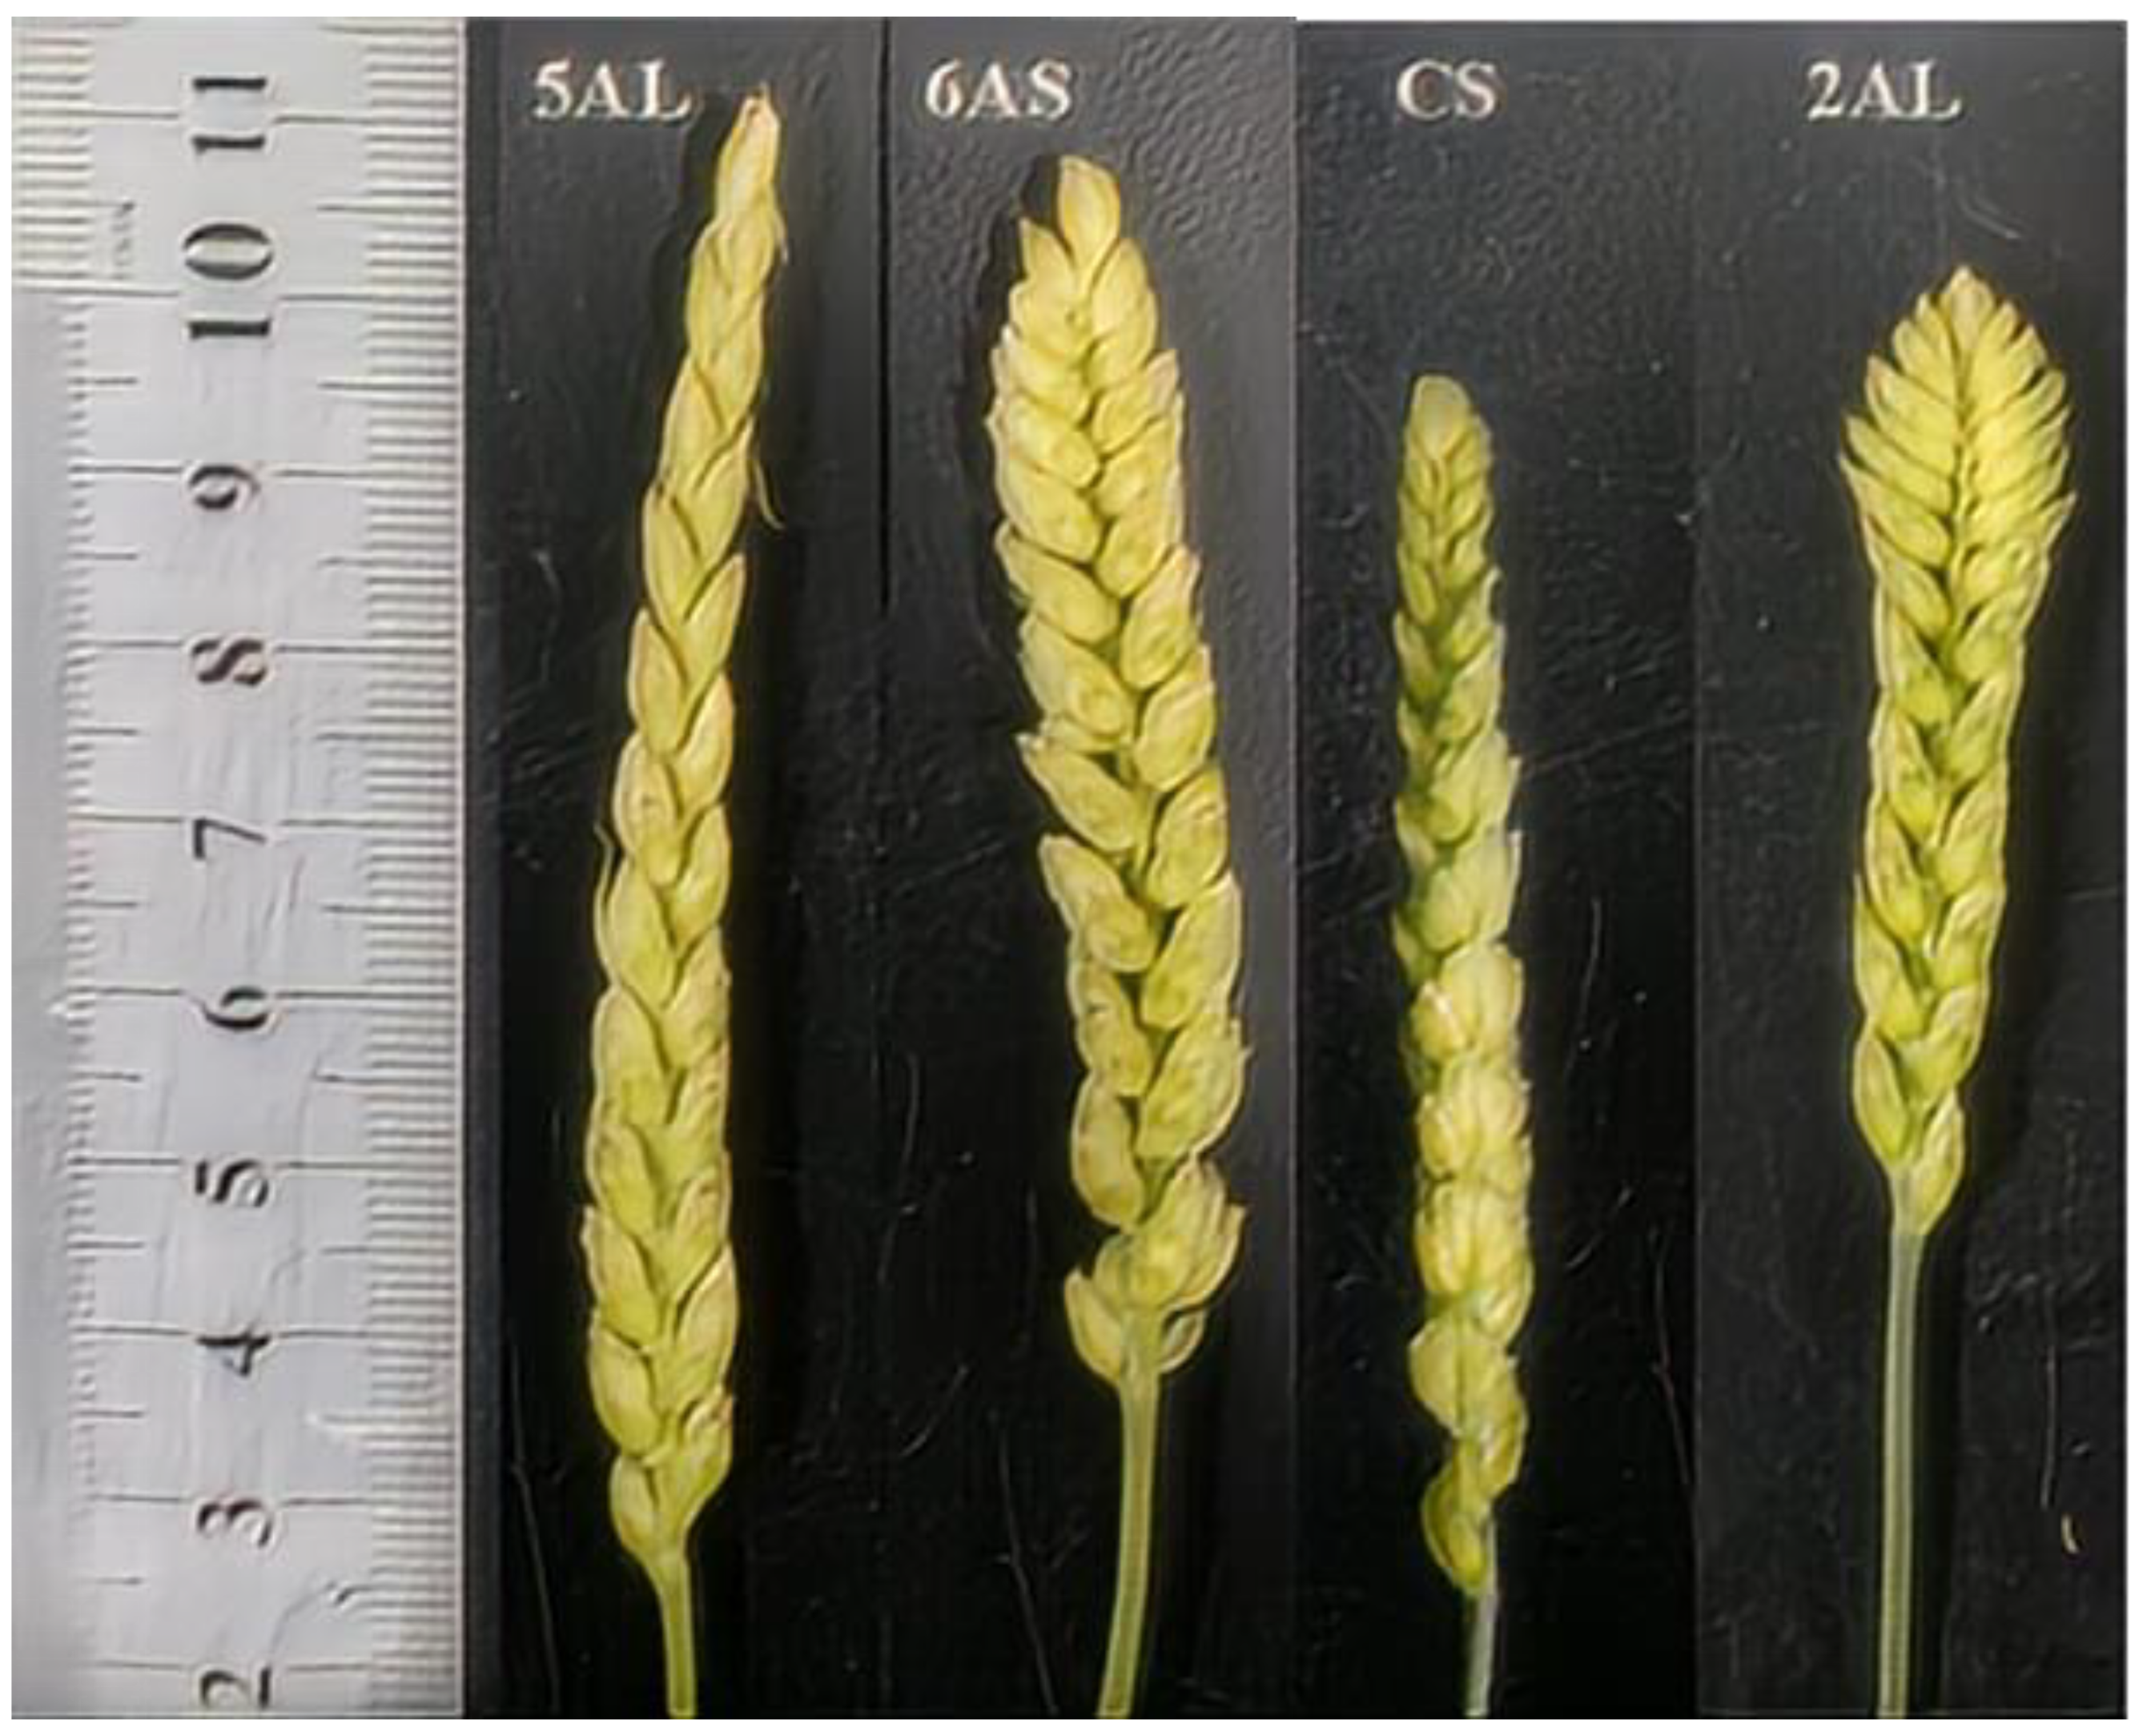
Figure 7.
CASLs Panicle type and awn length under CS.
Effective Tillering Number per Plant:Fertile tillers, defined as those producing spikes and seed, were counted for each plant. Fertile tiller number ranged from 6 to 17 among the CASLs, compared to an average of 11 for the CS parent. Twenty CASLs exhibited greater fertile tiller numbers than the CS parent. CASL5AL (17 tillers) and CASL2BL (16.33 tillers) had significantly higher numbers of fertile tillers than the parent (Table 7). Eight CASLs had fewer fertile tillers than the parent, with CASL1AL and CASL1AS exhibiting significantly lower numbers (<58% of the CS parent). These results suggest that genes promoting fertile tiller development may be located on chromosome arms 5AL and 2BL, while genes inhibiting tillering may reside on 1A.
Awn Types: Awn phenotypes of the two CASL sets were assessed according to national wheat classification standards (Table 9). The BLH parent exhibited long awns, a phenotype retained in all 24 BLH-background CASLs. In contrast, the CS parent was awnless. Among the 28 CS-background CASLs, four lines (4AS, 4AL, 6BS, and 6BL) exhibited short basal awns and long apical awns, while the remaining lines were awnless, similar to the CS parent (Figure 3.7). This suggests that genes located on chromosomes 4AS, 4AL, 6BS, and 6BL in Chinese Spring may suppress awn development.
4. Discussion
Wild emmer wheat (Triticum dicoccoides) is a valuable genetic resource for wheat improvement due to its robust resistance to diseases and rich genetic diversity. This study investigates the agronomic traits of CASLs derived from wild emmer wheat in the backgrounds of common wheat varieties Bethlehem (BLH) and Chinese Spring (CS). The results provide insights into the genetic control of key traits and highlight the potential for utilizing wild emmer wheat in breeding programs.
4.1. The Utilization of Wild Emmer Wheat in Breeding
Wild emmer wheat is the progenitor of tetraploid and hexaploid wheat and is known for its resistance to various diseases and abiotic stresses [12]. The genetic diversity within wild emmer wheat offers a rich pool of alleles that can enhance traits such as grain yield and protein content in cultivated wheat [13,20]. The study found that specific chromosomal arms from wild emmer wheat can significantly influence traits like tiller number, leaf width, plant height, and spike morphology. For instance, CASL6AL and CASL7BS exhibited reduced tiller numbers, while CASL2BS showed narrower leaves and shorter plant height in the CS background. These findings suggest that genes controlling these traits are located on the respective substituted chromosomal arms.
The genetic resources from wild emmer wheat have been extensively utilized to broaden the germplasm pool of common wheat. For example, the high-protein, disease-resistant wheat variety Lainong 998013 was developed using wild emmer wheat, demonstrating significant improvements in yield and quality [21,22]. The successful introgression of wild emmer wheat into cultivated varieties has led to the creation of synthetic hexaploid varieties such as Syn022 and Syn086 [21,22]. These examples highlight the potential of wild emmer wheat as a source of beneficial genes for wheat breeding.
Gene identification and mapping are essential for effectively harnessing the beneficial traits of wild emmer. Numerous agronomically important genes have been identified, primarily associated with disease resistance and grain quality. For instance, powdery mildew resistance genes like Pm36, Pm41, Ml3D232, MlWE27, MlIW172, and MlIW30 have been identified [23]. Additionally, genes such as Yr36 and Yr15, which confer broad-spectrum resistance to stripe rust pathogens, have been mapped [24,25,26,27]. Regarding quality-related genes, a gene named TaNAM that increases protein, zinc, and iron content has been located [28]. The identification of these genes is crucial for targeted breeding efforts to improve wheat resistance and quality.
4.2. The important Agronomic Traits and Their Controlling Candidate Chromosomal Regions Analyses in CASLs
Seedling-stage traits such as tiller number, leaf biomass, and plant height are heritable indicators of wheat growth status and correlate with other plant traits [29,30]. These traits are valuable for understanding growth dynamics and predicting yield potential. The study found significant correlations between seedling traits and mature-stage yield components, such as spike grain number, spike length, and TKW [42]. For example, late-maturing CASLs exhibited narrower leaves and shorter plant height compared to early-maturing lines, indicating the presence of genes controlling these traits on specific chromosomal arms. These findings suggest that seedling traits can be used as selection criteria for breeding high-yielding wheat varieties.
The study also revealed complex interactions between traits, such as the positive correlation bwtween grain size and grain weight and seedling vigor [18,32,33,34,35,36,37,38], and negative correlation between grain number and grain weight [38,39]. This complexity underscores the challenges in improving yield through manipulation of individual traits challenging [18,32,40,41]. Seedling-stage traits have been linked to mature-plant traits such as spike grain number, spike length, and 1,000-grain weight [42]. Coleoptile and first leaf length at the seedling stage are positively correlated with mature plant height and flag leaf length, but negatively correlated with flag leaf width [43]. Principal component analysis has highlighted the direct contribution of grains per plant and 1,000-grain weight to yield, suggesting their utility as selection criteria. In our study, we discovered that the heading date (HD) is significantly positively correlated with grain thick and significantly negatively correlated with thousand-grain weight (TKW) (P<0.01). Furthermore, TKW is highly negatively correlated with grayscale and RGB values (P<0.01) and significantly positively correlated with grain length, width, and projected area. Therefore, predicting mature-stage traits based on seedling-stage characteristics appears feasible. Future research should focus on understanding the genetic mechanisms underlying these interactions and identifying additional genes that contribute to yield and quality. The use of advanced genomic tools, such as high-density SNP linkage maps, can facilitate the identification and mapping of these genes.
4.3. CASLs Offer a Powerful Tool for Dissecting the Genetic Control of These Complex Traits and Understanding Their Interactions
Seedling traits, including tiller number, leaf width, plant height, and HD, along with yield components (GL, GW, and TKW) and spike characteristics (length, spikelet number, grains per spike, awn type, and spike type), are key morphological indicators with significant impacts on wheat growth and yield. However, relatively few genes controlling these traits have been successfully transferred from wild emmer to cultivated wheat. CASLs offer a powerful tool for dissecting the genetic control of these complex traits and understanding the interactions between chromosomal arms and the distribution and effects of genes within them. In this study, we characterized agronomic traits in a set of CASLs, analyzing correlations between early and late-maturing lines based on seedling traits (tiller number, leaf width, and plant height) and examining spike and grain traits at maturity. These results suggest the presence of genes controlling seedling-stage physiological traits and spike morphology on the respective substituted chromosomal arms. These CASLs are valuable not only for mapping quality traits but also for identifying genes underlying complex quantitative traits like tiller number, leaf width, plant height, grain morphology, spike shape, and awn type. Our findings highlight the close relationship between seedling traits and HD and mature-stage yield components, warranting further investigation into the underlying mechanisms. In conclusion, this study highlights the potential of wild emmer wheat as a valuable genetic resource for wheat improvement. In addition to the ultimate goal of identifying agronomically important functional genes for wheat breeding, CASLs are also ideal and valuable materials for fundamental research, such as studies on heterosis. Recently, Zhao and Reif utilized 1,604 populations generated from crosses among 135 elite parental breeding lines to propose a quantitative genetic framework for investigating the genetic basis of heterosis across 11 different environments[44]. On average, these hybrids outperformed the midparents by 10%, with epistatic effects contributing more significantly to wheat yield heterosis than dominance effects. In our laboratory, preliminary studies on CASLs within the genetic backgrounds of CS and BL have shown that several F1 hybrids, derived from crosses between specific CASLs and either CS or BL, surpassed both parent lines in performance. Currently, there are no reports on heterosis in wheat lines carrying single alien chromosome arms, and such studies could offer valuable insights into the potential application of heterosis in wheat breeding. The identification of specific chromosomal arms controlling key agronomic traits provides a foundation for targeted breeding efforts. Further research into the genetic mechanisms underlying these traits and their interactions will be crucial for developing high-yielding, high-quality wheat varieties suited for cultivation in diverse environments.
Funding
This research was funded by Zhejiang Science and Technology Major Program on Agricultural New Variety Breeding (2021C02064-3–4), the Zhejiang Provincial Natural Science Foundation of China (LY19C060003) and the National Natural Science Foundation of China (31671684).
Data Availability Statement
The original contributions presented in this study are included in the article. Further inquiries can be directed to the corresponding author.
Acknowledgments
The 52 CASLs and their parents (CS and BLH) were kindly provided by Prof. M. Feldman, Weizmann Institute of Science, Israel.
Conflicts of Interest
The authors declare no conflicts of interest.
References
- Kumar, A.; Mantovani, E.; Simsek, S.; Jain, S.; Elias, E.; Mergoum, M. Genome wide genetic dissection of wheat quality and yield related traits and their relationship with grain shape and size traits in an elite × non-adapted bread wheat cross. PloS one 2019, 14, e0221826. [Google Scholar] [CrossRef] [PubMed]
- Yuli, J.; Tiantian, G.; Hong, L.; Diaoguo, A. Research progress on the wheat powdery mildew resistance gene Pm2. Chinese Journal of Eco-Agriculture 2022, 30, 779–786. [Google Scholar]
- Ye, X.; Lin, Z.; Wang, K.; Tang, H.; Han, Z. Annual progress on new gene characterization and novel technology development for wheat genetic improvement in 2023. Science & Technology Review 2024, 42, 174–187. [Google Scholar]
- Millet, E.; Rong, J.; Qualset, C.; McGuire, P.; Bernard, M.; Sourdille, P.; Feldman, M. Production of wild emmer recombinant substitution lines in a modern common wheat cultivar and their exploitation for wheat improvement. Euphytica 2013, 190, 1–17. [Google Scholar] [CrossRef]
- Feldman, M. Historical aspects and significance of the discovery of wild wheats. Stadler Symposium 1977, 9, 121–146. [Google Scholar]
- Feldman, M.; Sears, E. The wild gene resources of wheat. Sci Am 1981, 244, 102–112. [Google Scholar] [CrossRef]
- Feldman, M.; Millet, E. (1995).Methodologies for identification, allocation and transfer of quantitative genes from wild emmer into cultivated wheat. In: Proceedings of the 8th International Wheat Genetics Symposium, Beijing, China, pp. 19–27.
- Millet, E.; Rong, J.; Qualset, C.; McGuire, P.; Bernard, M.; Sourdille, P.; Feldman, M. Production of chromosome-arm substitution lines of wild emmer in common wheat. Euphytica 2012, 190, 1–17. [Google Scholar] [CrossRef]
- Millet, E. , Rong, J. , Qualset, C., Mcguire, P., Bernard, M., Sourdille, P.; Feldman, M. Grain yield and grain protein percentage of common wheat lines with wild emmer chromo some-arm substitutions. Euphytica 2014, 195, 69–81. [Google Scholar]
- Orlovskaya, O.; Leonova, I.; Solovey, L.; Dubovets, N. Molecular cytological analysis of alien introgressions in common wheat lines created by crossing of Triticum aestivum with T. dicoccoides and T. dicoccum..Vavilovskii zhurnal genetiki i selektsii 2023, 553–564. [Google Scholar]
- Almadi, H.; Nazarian, F. The inheritance and chromosomal location of morphological traits in wildwheat, Triticum turgidum L. ssp.dicoccoides, Euphytica 2007, 158, 103–108. [Google Scholar]
- Zheng, Q.; Zhao, L.; Li, B.; Li, H.; Wan, J.; Zhang, X. Wheat wide hybridization and chromosome engineering breeding in China. Hereditas(Beijing) 2025, 1–13. [Google Scholar]
- Xie, W.; Nevo, E. Wild emmer: Genetic resources, gene mapping and potential for wheat improvement. Euphytica 2008, 164, 603–614. [Google Scholar] [CrossRef]
- Simmonds, J.; Fish, L.; Leverington-Waite, M.; Wang, Y.; Howell, P.; Snape, J. Mapping of a gene (Vir) for a non-glaucous, viridescent phenotype in bread wheat derived from Triticum dicoccoides, and its association with yield variation. Euphytica 2008, 159, 333–341. [Google Scholar] [CrossRef]
- Joppa, L.; Cantrell, R. Chromosome location of genes for grain protein content of wildtetraploid wheat. Crop Sci 1990, 30, 1059–1064. [Google Scholar] [CrossRef]
- Kumar, N.; Kulwal, P.; Balyan, H.; Gupta, P. QTL mapping for yield and yield contributing traits in two mapping populations of bread wheat. Mol. Breed 2007, 19, 163–177. [Google Scholar] [CrossRef]
- Feldman, M.; Millet, E.; Abbo, S. (1994).Exploitation of wild emmer wheat to increase yield and protein content in durum and common wheat. In: Proceedings of the EUCARPIA meeting of the Genetic Resources Section, March 15–18, 1994 Clermont-Ferrand, France.
- Zhou, W.; Jiang, Y.; Zhang, W.; Xu, G.; Rong, J. Characterization of Large Chromosome Segment Introgressions from Triticum turgidum subsp. dicoccoides into Bread Wheat with Simple Sequence Repeat Markers.Crop Science 2013, 53, 1555–1565. [Google Scholar]
- Zhao, Y.; Miao, Y.; Cao, Y.; Rong, J. Investigation on the Seed Germination and Seedling Growth of Chromosome Arm Substitution Lines of Triticum dicoccoidesin the Background of T. aestivum. Journal of Triticeae Crops 2017, 37, 287–294. [Google Scholar]
- Merchuk-Ovnat, L.; Fahima, T.; Ephrath, J.; Krugman, T.; Saranga, Y. Ancestral QTL alleles from wild emmer wheat enhance root development under drought in modern wheat. Frontiers in Plant Science 2017, 8. [Google Scholar] [CrossRef]
- Kunert, A.; Naz, A.; Dedeck, O.; Pillen, K.; Leon, J. AB-QTL, analysis imn winter wheat: I. Synthetichexaploid wheat (7. tugidum ssp, dicoccoides X T. tauschii ) as a source of favourable alleles for millingand baking quality traits. Theoretical and Applied Genetics 2007, 115, 683–695. [Google Scholar]
- Naz, A.; Kunert, A.; Lind, V.; Pillen, K.; Leon, J. AB-QTL, analysis in winter wheat: Il. Genetic analysisof seedling and field resistance against leafrust in a wheat advanced backcross, population. Theoretical andApplied Genetics 2008, 116, 1095–1104. [Google Scholar]
- Blanco, A.; Gadaleta, A.; Cenci, A.; Carluccio, A.; Abdelbacki, A.; Simeone, R. Molecular mapping of the novel powdery mildew resistance gene Pm36 introgressed from Triticum turgidumvar. dicoccoides in durum wheat. Theoretical and Applied Genetics 2008, 117, 135–142. [Google Scholar] [CrossRef] [PubMed]
- Fu, D.; Uauy, C.; Distelfeld, A.; Blechl, A.; Epstein, L.; Chen, X.; Dubcovsky, J. A kinase-start gene confers temperaturedependent resistance to wheat stripe rust. Science 2009, 323, 1357–1360. [Google Scholar] [CrossRef] [PubMed]
- Klymiuk, V.; Yaniv, E.; Huang, L.; Raats, D.; Fatiukha, A.; Chen, S.; Fahima, T. Cloning of the wheat Yr15 resistance gene sheds light on the plant tandem kinase-pseudokinase family. Nature Communications 2018, 9. [Google Scholar] [CrossRef] [PubMed]
- Qie, Y.; Liu, Y.; Wang, M.; Li, X.; See, D.; An, D.; Chen, X. Development, validation, and re-selection of wheat Lines with pyramided genes Yr64 and Yr15 linked on the short arm of chromosome 1B for resistance to stripe rust. Plant Disease 2019, 103, 51–58. [Google Scholar] [CrossRef] [PubMed]
- Yaniv, E.; Raats, D.; Ronin, Y.; Korol, A.; Grama, A.; Bariana, H.; Fahima, T. Evaluation of marker-assisted selection for the stripe rust resistance gene Yr15, introgressed from wild emmer wheat. Molecular Breeding 2015, 35. [Google Scholar] [CrossRef] [PubMed]
- Uauy, C.; Distelfeld, A.; Fahima, T.; Blechl, A.; Dubcovsky, J. A NAC gene regulating senescence improves grain protein, zinc, and iron content in wheat. Science 2006, 314, 1298–1301. [Google Scholar] [CrossRef] [PubMed]
- Khan, M.; Anwar, S.; Khan, M. Genetic variability for seedling traits in wheat (Triticum aestivum L. ) under moisture stress conditions. Asian J Plant Sci. 2002, 1, 588–590. [Google Scholar] [CrossRef]
- Salih, A. .SNP markers for seedling traits revealed by association analysis andgenetic variation in durum wheat accessions (Triticum turgidum L. ssp. durum Desf)].Huazhong Agricultural University 2016 Doctoral Dissertation.
- Meles, B.; Genetic, V. Correlation and path analysis of yield and grain quality traits in bread wheat (Tritium aestivum L. ) genotypes at Axum, Northern Ethiopia.Journal of Plant Breeding and Crop Science 2017, 9, 175–185. [Google Scholar]
- Bavec, M.; Bavec, F.; Varga, B.; Kovacˇevic´, V. Relationships among yield, it’s quality and yield components in winter wheat (Triticum aestivum L. ) cultivars affected by seeding rates. Die Bodenkultur 2002, 53, 143–151. [Google Scholar]
- Botwright, T.; Condon, A.; Rebetzke, G.; Richards, R. Field evaluation of early vigour for genetic improvement of grain yield in wheat. Aust J Agric Res. 2022, 53, 1137–1145. [Google Scholar] [CrossRef]
- Gegas, V.; Nazari, A.; Griffiths, S.; Simmonds, J.; Fish, L.; Orford, S.; Sayers, L.; Doonan, J.; Snape, J. A genetic framework for grain size and shape variation in wheat. Plant Cell 2010, 22, 1046–1056. [Google Scholar] [CrossRef] [PubMed]
- Farahani, H.; Moaveni, P.; Maroufi, K. Effect of seed size on seedling production in wheat (Triticum aestivum L. ). Adv. Environ. Biol. 2011, 5, 1711–1715. [Google Scholar]
- Russo, M.; Ficco, D.; Laido, G.; Marone, D.; Papa, R.; Blanco, A.; Gadaleta, A.; Vita, P.; Mastrangelo, A. A dense durum wheat ×T. dicoccum linkage map based on SNP markers for the study of seed morphology. Mol Breed 2014, 34, 1579–1597. [Google Scholar]
- Kumar, A.; Mantovani, E.; Seetan, R.; Soltani, A.; Echeverry-Solarte, M.; Jain, S.; Simsek, S.; Doehlert, D.; Alamri, M.; Elias, E. Dissection of Genetic Factors underlying Wheat Kernel Shape and Size in an Elite × Nonadapted Cross using a High Density SNP Linkage Map. The Plant Genome 2016, 9. [Google Scholar] [CrossRef] [PubMed]
- Feng, F.; Han, Y.; Wang, S.; Yin, S.; Peng, Z.; Min, Z.; Gao, W.; Wen, X.; Qin, X.; Siddique, K. The Effect of Grain Position on Genetic Improvement of Grain Number and Thousand Grain Weight in Winter Wheat in North China. Frontiers in Plant Science 2018, 9, 129. [Google Scholar] [CrossRef] [PubMed]
- Guy, G.; Idan, A.; Aviad, P.; Zimran, G.; Peleg, Z. GNI-A1 mediates trade-off between grain number and grain weight in tetraploid wheat. TAG. Theoretical and applied genetics. Theoretische und angewandte Genetik 2019, 132, 2353–2365. [Google Scholar]
- Slafer, G.; Calderini, D.; Miralles, G. (1996). Yield components and compensation in wheat: opportunities for future increasing yield potential. In: Reynolds MP, Rajaram S(eds) Increasing yield potential in wheat: breaking the barriers. Proc. Workshop held in CIMMYT, Ciudad Obrego´n, Sonora, Mexico, CIMMYT, p101-133.
- Wu, Q.; Chen, Y.; Zhou, S.; Fu, L.; Chen, J.; Xiao, Y.; Zhang, D.; Ouyang, S.; Zhao, X.; Cui, Y. High-Density Genetic Linkage Map Construction and QTL Mapping of Grain Shape and Size in the Wheat Population Yanda1817×Beinong6. PLoS One 2015, 10, e0118144. [Google Scholar] [CrossRef]
- Xu, Y. (2020).Response of seedling biomass and agronomictraitsin maturity stage of wheat tonitrogen, phosphorus and potassium deficiency and it’s genetican alysis[D].Tai’an Shandong:Shandong Agriculture University.
- Sun, N.; Zhou, Q.; Zhi, L.; Qiao, P.; Mou, L.; Ni, S. &Chen, L. Identification of Drought Resistance at Seedling Stage and Correlation Analysisbetween Drought Resistance Indexes and lmportant Agronomic Characters of 240 Wheat Materials.Acta Agriculturae Boreali- occidentalis Sinica 2022, 147-156.
- Jiang, Y.; Schmidt, R.; Zhao, Y. , & Reif, J. A quantitative genetic framework highlights the role of epistatic effects for grain-yield heterosis in bread wheat. Nature Genetics 2017, 49, 1741–1746. [Google Scholar] [CrossRef]
Disclaimer/Publisher’s Note: The statements, opinions and data contained in all publications are solely those of the individual author(s) and contributor(s) and not of MDPI and/or the editor(s). MDPI and/or the editor(s) disclaim responsibility for any injury to people or property resulting from any ideas, methods, instructions or products referred to in the content. |
© 2025 by the authors. Licensee MDPI, Basel, Switzerland. This article is an open access article distributed under the terms and conditions of the Creative Commons Attribution (CC BY) license (https://creativecommons.org/licenses/by/4.0/).
Copyright: This open access article is published under a Creative Commons CC BY 4.0 license, which permit the free download, distribution, and reuse, provided that the author and preprint are cited in any reuse.


