Submitted:
06 February 2025
Posted:
06 February 2025
You are already at the latest version
Abstract
Some high-viscosity crude oils have the characteristics of high oil production, low gas production and slow pressure reduction speed during the pressure depletion production process, and the "foamy oil" phenomenon occurs. The coexistence time of the two phases of foamy oil is much longer than that of crude oil with ordinary dissolved gas. Its complex phase change process is an important reason for the high degree of primary oil recovery. In the past, most of the studies focused on the production performance of foamy oil, while there were relatively few studies on the regularity of the molecular phase behavior of microscopic foamy oil and its influencing factors. Taking the foamy oil in Venezuela as the research object, this paper uses an etched glass model with heterogeneous pore characteristics to simulate the pressure reduction process. It discovers an important phenomenon that the growth of bubbles mostly occurs during the migration process. It is speculated that the high content of heavy components in foamy oil leads to the stability of the interface between the oil phase and the gas phase, which is the main reason why foamy oil is not easy to degas and undergoes phase change slowly. And there is always a diffusion phenomenon between bubbles and the oil phase during the movement process. Combined with the experimental phenomena, molecular simulation was employed to calculate the diffusion process of components in the gas phase and oil phase. After taking the diffusion coefficient into account, the VOF (Volume of Fluid) method was adopted to simulate the growth process of bubbles in foamy oil by solving the individual momentum equations and handling the volume ratio of each fluid passing through the region. The influences of conditions such as the content of light components, oil phase viscosity and interfacial tension on the bubble growth process were analyzed. The simulation results show that the bubble growth process is affected by multiple conditions such as oil phase components, oil phase viscosity and interfacial tension. However, the degrees of influence of the above factors vary in different stages. In the initial stage of bubble formation, it is mainly influenced by the change in the content of light components. During the stage when the bubbles have relatively high stability, the oil phase viscosity is the main reason for slowing down the increase in the bubble growth rate. The slight influence of interfacial tension on the bubble growth rate is not a major influencing factor for foamy oil. Based on the above analysis, an empirical formula for bubble growth was obtained through data fitting means, and a reasonable explanation for the development characteristics of foamy oil was provided.
Keywords:
Foamy oil
; Microscopic glass model
; Bubble growth rate
; Molecular simulation
; VOF
1. Introduction
Heavy oil accounts for a huge proportion in the world's petroleum resources, approximately 50% of the total hydrocarbon reserves [1]. The main characteristic of conventional heavy oil is its high viscosity. However, some oil reservoirs exhibit abnormal production performance during the development process [2,3]. The oil samples collected at the wellhead are in a viscous, oil-phase continuous foamy state. This is a two-phase coexistence form presented by heavy oil and dissolved gas in the pore media of heavy oil reservoirs. The term "foamy oil" can be used to distinguish it from two-phase fluids in the usual sense [4,5].
Foamy oil is essentially different from the mixture of oil and gas two-phase fluids in conventional oil reservoirs, and the corresponding theories and development technologies are also quite abundant. Due to the high reserves of heavy oil in Canada and Venezuela and the obvious characteristics of foamy oil, relevant research was carried out relatively early, covering the physical property characteristics of foamy oil, generation and storage conditions, influencing factors for stability, development mechanism and methods for enhancing oil recovery, etc. [6,7,8,9]. In recent years, with the development of domestic complex oil reservoirs and the gradual expansion of overseas oilfield development business, certain achievements have also been made in the theoretical understanding and mechanism research of foamy oil [10,11,12]. The formation of bubbles in foamy oil is a continuous process. The supersaturation of gas components is the fundamental cause of bubble generation, and the degree of supersaturation determines the sensitivity to factors such as temperature and pressure conditions. The main factors for the formation (bubble formation) of foamy oil include asphaltene content [13,14,15,16,17], supersaturated state [18,19] and pressure reduction rate [20,21,22].
The phase change process of high-viscosity crude oil is also the process of the initial generation of bubbles within high-viscosity crude oil (the formation of foamy oil) and the development of bubbles. Generally speaking, the generation of foamy oil mainly consists of the following stages: the initial supersaturated state, bubble nucleation, bubble growth, bubble migration, coalescence and rupture. According to Alshmakhy's [23] research, the formation of microbubbles starts at the critical supersaturated pressure (this pressure point is lower than the bubble point pressure of heavy oil), and there is a supersaturation threshold. Only when the gas saturation is greater than this value will bubbles nucleate. Due to the randomness of bubble nucleation, the critical supersaturation is not a definite value but depends on the time of nucleation. The supersaturation process is affected by the pressure depletion rate [24]. Under a high pressure depletion rate, the increase in supersaturation can shorten the time required for bubble nucleation. As the pressure depletes, bubble nuclei embryos on the molecular scale will be generated inside the liquid and gradually transform into bubble nuclei and microbubbles. Bubble nucleation can be classified into instantaneous nucleation and progressive nucleation according to the nucleation speed [25], and can also be divided into primary nucleation and secondary nucleation according to the nucleation process. Among them, primary nucleation includes homogeneous nucleation and heterogeneous nucleation [26]. Bubble growth is the main process that changes the seepage characteristics of foamy oil and is controlled by two factors: the diffusive effect in the early stage and the pressure-driven effect in the later stage. In the early stage, bubble formation and the migration of bubbles account for the major part, and the capillary force acts as a driving force in the movement process of bubbles. In the later stage, due to the far-reaching influence of pressure depletion, the bubble growth process is related to the pressure depletion rate and the volume expansion of the fluid. In addition, viscous force and capillary force, bubble mass and momentum, heat and mass transfer, interfacial tension, diffusivity and initial bubble radius, crude oil viscosity, components and quantity of dissolved gas in crude oil, temperature and pressure depletion rate also have certain influences on the bubble growth process [27,28]. Under normal circumstances, the migration and growth of bubbles occur simultaneously. Adjacent bubbles are affected by rock particles or other bubbles during their movement. After adjacent bubbles approach each other, the liquid film between them begins to thin slowly and eventually ruptures, and the adjacent bubbles merge into one [29]. Its influencing factors include dissolved gas, pressure depletion rate and flow rate, pore structure and sand production, crude oil components and viscosity, small bubbles and interfacial tension, etc. [30,31,32].
Regarding the microscopic phase behavior of foamy oil, in addition to the research on experimental mechanisms [33,34,35,36,37], the research on mathematical models has also attracted increasingly extensive attention. It has been found through experiments that the formation and coalescence processes of bubbles in foamy oil have a power exponential function relationship with pressure and time. The model of the bubble growth index was adopted to characterize and describe the bubble growth process [26]. Ben Hamida et al. [38] proposed equations for controlling the state of bubbles. Sheng et al. [39] and Joseph et al. [40] both established kinetic mechanism models describing the physical changes of gas dispersed in oil. Shen [41,42] put forward a general dynamic model based on the understanding of the escape process of dissolved gas and a gas lubrication model based on viscosity. Smith [43] established a dispersed microbubble model and used the mixture characteristic equation to describe the flow of oil-gas mixtures. Gennady et al. [44] put forward the concept of pseudo-bubble point pressure and described the depletion production of heavy oil reservoirs. The established pseudo-bubble point model can calculate the properties of conventional experimental fluids, but it is difficult to simulate the time-related changes in the flow characteristics of foamy oil.
The growth status of bubbles is the key in the "foamy oil flow" stage. Based on the current research status of the above experiments and numerical simulations, there is currently a lack of analytical models for studying the influencing factors of bubble growth from the perspective of physical chemistry. In this paper, according to the differences in physical property parameters between foamy oil and ordinary heavy oil, the influence degrees of crude oil components, viscosity, and interfacial tension on bubble growth are analyzed. By combining the microscopic experiment on the pressure drop of foamy oil with molecular simulation and the numerical simulation technology of the VOF (Volume of Fluid) method [45], a quantitative analysis is carried out on the main influencing stages and the contribution degrees of the effects of these three factors, and an empirical formula for bubble growth is obtained. Through the empirical formula, a deeper understanding of the phase change process of foamy oil and the seepage characteristics of bubbles in porous media is achieved, which provides theoretical guidance for the depletion production time of foamy oil and the application of subsequent production technologies.
2. Methods
2.1. Experimental Samples
Foamy oil mainly includes the following stages: the initial supersaturated state, bubble nucleation, bubble growth, bubble migration, coalescence and rupture. This paper only focuses on the growth process of bubbles and its influencing factors. The microscopic etched glass model experiment is an effective means to observe the microscopic phase change characteristics of foamy oil in porous media. Therefore, it is used to conduct the foamy oil pressure drop experiment. With the aim of observing the bubble growth process, a microscopic etched model with the characteristics of the pores of real oil reservoir rocks is selected to conduct an in-depth study on the growth characteristics and influencing factors of bubbles in foamy oil.
Figure 1 illustrates the appearance and dimensions of the microscopic glass etched model. Figure 1(a) shows the blank model, with an effective area of 15 mm × 15 mm and an etched depth of 20 μm. The injection and production ends are located in the diagonal direction. Figure 1(b) presents the pore image after being saturated with oil, and as shown in the magnified view in Figure 1(c), the minimum pore diameter is 75 μm.
In the experiment, the foamy oil from the Orinoco in Venezuela was selected as the research object. Among them, the viscosity of the formation oil was 5,873 mPa·s, and the viscosity of the degassed crude oil was 50 mPa·s. To avoid the pores from being blocked by heavy components during the experiment, the easily flowing simulated oil was prepared according to the component proportion for the experiment. The simulated oil and natural gas were mixed under a fixed pressure to prepare the simulated oil samples. The saturated foamy oil with a viscosity of 12 mPa·s (@ 50 °C, 3.0 MPa) was prepared according to the oil-gas ratio of 7.1 m³/m³. The components of the degassed crude oil and natural gas are shown in Table 1 and Table 2 respectively.
2.2. Experimental Setups
The apparatus for the foamy oil pressure drop experiment uses a microscopic glass etched model, and the flow chart is shown in Figure 2. The experimental apparatus mainly includes: a micro-pump (Quzix-5210; with a minimum controllable speed of 0.00001 ml/min and a maximum speed of 10.0 ml/min), a visual high-pressure model (with a maximum pressure resistance of 20 MPa and a temperature of 90 °C), a glass model (with pores ranging from 100 to 1000 μm), a microscope (Carl Zeiss Discovery V8 stereomicroscope; with objective lenses of ×0.5 and ×1.0; adjustable magnification of ×1.0 - 12.0), a high-speed camera (Photron Fastcam-Mini ×100, with a shooting speed ranging from 250 fps to 1000 fps), a back pressure valve (Coretest DBPR-5; with a maximum back pressure of 70 MPa and an accuracy of ±0.01 MPa), and an image acquisition system (NI system).
2.3. Experimental Process
Connect the experimental equipment according to the process shown in Figure 2 to simulate the seepage process of foamy oil in porous media. Through pressure reduction, the light components in the foamy oil are precipitated in the form of bubbles, and the growth process of the bubbles is observed.
①Experimental preparation. The temperature of the thermostatic chamber is stabilized at 50 °C; the back pressure valve is set at 3.0 MPa; the foamy oil prepared in the intermediate container is at 3.0 MPa. Adjust the microscope, light source and image acquisition device to achieve a state where clear images can be collected.
②Evacuate the glass model. Adjust the confining pressure of the visual high-pressure model to 1.0 MPa; turn on the vacuum pump to evacuate, and keep the vacuum gauge at -0.1 MPa for a stable period of no less than 1 hour, and then turn off the vacuum pump.
③Saturate the degassed crude oil. In order to prevent gas precipitation due to a large pressure difference when saturating the foamy oil, the degassed crude oil is saturated first before saturating the foamy oil. Due to the effect of vacuum, the degassed crude oil flows into the glass model. When the pressure is balanced, the degassed crude oil is then saturated at a rate of 0.01 ml/min. Monitor the inlet pressure of the glass model. When the pressure approaches the confining pressure, increase the confining pressure and maintain a pressure difference of 1.0 ± 0.2 MPa. When the inlet pressure of the glass model reaches 2.0 MPa and the confining pressure is 3.0 ± 0.2 MPa, stop the saturation process.
④Saturate the foamy oil. Slowly open the valve. As the pressure of the foamy oil is high, the foamy oil flows into the glass model. Although there is a tendency for bubbles to precipitate, the pressure process is very short and the gas will not precipitate. After the pressure is balanced, continue to saturate the foamy oil at a rate of 0.01 ml/min, maintain the confining pressure at 4.0 ± 0.2 MPa. When foamy oil is produced at the outlet and the form and flow rate of the produced foamy oil become stable, stop the saturation process.
⑤The process of the foamy oil phase change experiment. Adjust the microscope and the clarity of the imaging again. For example, use the objective lens ×1.0 and observe at a magnification of 2 times. The image acquisition speed of the high-speed camera is set at 500 fps. Slowly adjust the back pressure valve and reduce the pressure from 3.0 MPa to 2.9 MPa within a period of no less than 10 minutes. During the adjustment process, carefully observe the image monitoring system, purposefully select phenomena such as bubble formation and growth, and record and store them using the high-speed camera. Similarly, the pressure reduction speed can be adjusted to achieve step-by-step pressure reduction and observation.
2.4. Numerical simulation method
2.4.1. Molecular Dynamics Simulation Method
The modeling process is divided into two parts: the establishment of the geometric model and the setting of molecular distribution within the model. As shown in Figure 3, the overall model is 29.4×5.4×19.2 nm³. The wall of the geometric model is composed of SiO₂ unit cells cut along the (1 0 0) orientation, and hydrogen atoms are added to hydroxylate the exposed oxygen atoms on the silica surface. A fixed rigid wall is constructed in the z-direction, with the upper wall being a plane and the lower wall having a blind-ended groove where heptane molecules are placed to make the diffusion phenomenon more distinct. According to the flow laws of macroscopic fluids, periodic boundaries are set in the x and y directions, and a non-periodic boundary is set in the z-direction. The temperature and pressure are set at 50°C and 30 MPa, the number of heptane molecules is 326, the number of water molecules is 26,902, the density of methane is 0.19 g/cm³, and the number of methane molecules is 2300. Water molecules are used to replace other components in the oil phase, which enables a clear display of the molecular interaction process between methane and heptane. The LAMMPS software is used to simulate this model.
2.4.2. Macro - fluid Simulation Method
The volume change and migration process of bubbles are the main dynamic behaviors of bubbles when gas and liquid systems coexist in two phases. Generally, numerical and theoretical analyses of their morphological changes and migration behaviors are carried out through the continuity equation, momentum equation and interface advancement equation.
For the calculation of multiphase flow, the continuity equation is usually used to track the gas-liquid interface and determine the position of the interface by calculating the volume proportion of each phase. If q is used to represent the gas phase or the liquid phase, the continuity equation for this phase is shown as follows:
The right side of Equation (1) is the source term of the equation. Under normal circumstances, its magnitude is zero. In addition, in the initial state, the volume proportions of the gas and liquid phases do not need to be obtained through Equation (1), but through the following constraint relationships:
It can be concluded from the constraint relationship (2) that for the mixed phase in each infinitesimal unit, the value of its overall physical property parameters is obtained by weighted averaging of each component dissolved in the liquid phase according to their respective volume proportions. It can thus be concluded that for a system with n-phase components, the weighted average density (weighted according to volume proportions) of any infinitesimal unit can be written as:
Since the bubble motion studied in this paper belongs to gas-liquid two-phase flow, the relevant physical property parameters of the gas phase and the liquid phase are now distinguished by subscript 1 and subscript 2 respectively. According to the constraint relationship of Equation (3), the weighted average density of any infinitesimal unit at this time is written as:
Similarly, expressions for other parameters in the system can be obtained, and they will not be listed one by one here.
In the VOF (Volume of Fluid) algorithm, the momentum equations of the gas phase and the liquid phase are solved within the same calculation region. That is to say, in the process of solving the velocity field for the gas phase and the liquid phase, the same momentum equation is used for the solution. However, the physical property parameters in the equation, such as ρ (density) and µ (viscosity), are reflected by the volume-proportion-weighted average physical property parameters, and their magnitudes vary at different spatial positions. The momentum equation is as follows:
In Equation (5): S—Viscous shear tensor, S = µ(∇u + ∇Tu); Fs—Surface tension; S—Gravity term, S = ρg.
For the motion of bubbles, the gas-liquid interface is a free surface, and the physical property parameters of the fluids on both sides of it differ greatly, with differences spanning multiple orders of magnitude numerically. Therefore, it is very difficult to calculate the exchange of momentum and energy of the fluids on both sides, and it is also very hard to capture the precise position of the free surface. This poses high requirements for numerical calculations. Generally speaking, accurately simulating the two-phase flow field must meet the following several conditions: ① conservation of fluid mass; ② high-resolution interface; ③ accurate calculation of surface tension; ④ adaptability to a large ratio of physical property parameters of the two phases.
The VOF (Volume of Fluid) method is used to simulate two-phase flow through interface reconstruction, and the transport of physical quantities at the interface can adopt the Eulerian format or the Lagrangian convection format. Since this method is based on interface reconstruction, it can handle well the gas-liquid flow problems with large-deformation and complex interfaces, such as the problem of bubble coalescence. Moreover, by using the same set of equations to calculate the physical quantities related to the flow field, it can ensure mass conservation well, and the storage requirement during the calculation process is also relatively low. However, at the same time, when the VOF method uses the interface reconstruction method to calculate the gas-liquid two phases, there are problems such as discontinuity and intermittence in the reconstructed interface. Especially in three-dimensional cases, it is very difficult to obtain calculation results with high-order accuracy. We use the VOF method to capture the gas-liquid two-phase interface and use Youngs' PLIC 3D algorithm (Piecewise Linear Interface Calculation) to reconstruct and transport the interface. We set the volume fraction of the fluid inside the interface as α = 0, the volume fraction of the fluid outside the interface as α = 1, and at the interface, α ranges from 0 to 1. Therefore, the transport equation of the interface is:
And for each computational grid, the physical property parameters at the center point of the grid, such as density and dynamic viscosity coefficient, can be obtained by volume-weighted averaging of each phase, that is, calculated through Equation (4).
There is surface tension on the gas-liquid interface. In the actual processing of calculating the momentum equation, we use the Continuous Surface Force (CSF) model. The basic idea of this model is to equate the surface tension to a volume force source term and to equate the gas-liquid interface to a very thin transition zone in the flow field, where the huge differences in the physical property parameters of the gas and liquid phases are smoothed out in this region. Through such processing, when calculating the gas-liquid two-phase flow, the same set of equations is used to solve for the two fluids. The expression for its surface tension is as follows:
In order to simulate the influence of crude oil components, viscosity and interfacial tension on the growth rate of bubbles, a direct-current pipeline model shown in Figure 4 was designed. This model avoids the impact of the pressure difference caused by the pore structure on the morphological changes of bubbles. The geometric dimensions of the two-dimensional model are 0.6 × 2.5 mm, and the grid is a structured square grid. The outlet pressure is 3.0 MPa, which is consistent with the experimental conditions. The pressure difference between the inlet and the outlet is 0.1 MPa, and the remaining boundaries are walls.
Analyze the growth rate of bubbles through the change in the area of bubbles during the migration process. Calculate the area of bubbles according to the grid size and the number of grids. Use the ratio of the increased area to the migration time to represent the growth rate. The area of a single grid is 1.5 × 10⁻⁶ μm².
3. Results and Discussion
3.1. The variation Law of the Bubble Growth Rate in the Experiment
Unlike a series of phenomena in conventional crude oil, such as rapid gas precipitation, rapid bubble growth and coalescence, the growth rate of bubbles in the depressurization experiment is relatively slow, and they grow while migrating within the pores. The bubbles indicated in Figure 5 are analyzed. In Figure 5(a), the bubble diameter is 164 μm, which is much larger than the depth of the pores with a diameter of 20 μm, and the bubble is in a flattened state. The bubble shown in Figure 5(a) passes through a narrow throat and migrates to the position shown in Figure 5(b) in 84 ms, with the bubble diameter increasing to 178 μm. During the process from (a) to (b), the growth rate of the bubble is 0.17 μm/ms. At 408 ms, the bubble migrates to the position shown in Figure 5(c), with the bubble diameter increasing to 214 μm. During the process from (b) to (c), the growth rate of the bubble is 0.11 μm/ms. During this process, the fluid enters large pores from small pores. According to the relationship between the flow velocity and the diameter in pipe flow, under the condition of a certain flow rate, the square of the pipe diameter is inversely proportional to the flow velocity. That is, when the pore diameter suddenly increases, the fluid will suddenly slow down. The change in the flow velocity causes the bubble to undergo elastic deformation under the action of inertia. The bubble diameter in Figure 5(d) is 286 μm. During the process from (c) to (d), the growth rate of the bubble is 0.50 μm/ms. The position of the bubble in Figure 5(d) is the limit position of the observation area. Based on the growth rate of the bubble at this moment, it can be judged that the bubble is still growing for a period of time after this moment.
By tracking the bubbles in the observation area of Figure 5, it can be found that as the flow pressure difference decreases, the bubbles exhibit the phenomenon of simultaneous migration and growth. The growth rates of the bubbles in Figure 5 during various time periods are calculated, and the resulting regular curve is shown in Figure 6. According to the growth rate curve, the bubble growth can be divided into three stages: fast in the early stage, slowing down in the middle stage, and accelerating in the later stage. Based on the PV relationship, the bubble diameter is inversely proportional to the cube root of the pressure. As the migration distance increases, the growth rate of the bubbles gradually accelerates. However, according to the growth pattern in Figure 6, it indicates that the growth of bubbles in foamy oil is clearly not only affected by the pressure difference, and the main influencing factors and the degree of their influence are different in different growth stages.
The precipitation process of dissolved gas in conventional crude oil is continuous. Bubbles grow rapidly until they become stable, and the migration distance can be neglected. However, the bubble growth process in foamy oil presents three stages, and the bubble growth occurs simultaneously with the migration process. This phenomenon is significantly different from the conventional gas precipitation process. It is speculated that the high content of heavy components in foamy oil leads to the stability of the interface between the oil phase and the gas phase, resulting in the difficulty of degassing of foamy oil and a slow phase change process. The viscosity of foamy oil is higher than that of conventional crude oil, and the increase in viscosity will also slow down the growth and migration speed of bubbles. With different initial bubble diameters, under the action of the same pressure difference, the growth rates of bubbles will also be different.
There is a gas diffusion phenomenon in foamy oil. However, considering that the gas diffusion coefficient is related to the ambient temperature and pressure and is a common phenomenon in all gas-oil two-phase fluids, it has no particularity in the process of bubble growth. Therefore, the bubble growth process takes into account the combined effects of these three factors: crude oil viscosity, component content, and initial bubble diameter. However, through experimental research, multiple sets of controlled experiments need to be carried out, and it is difficult to control the pressure difference in the pores inside the microscopic model. So, it is impossible to study and verify the simulation results through experimental means. In order to accurately study the influence of single-factor parameters on bubble growth, numerical methods are adopted for simulation and analysis.
3.2. The Interaction Process Between Methane Molecules and Alkanes
In Figure 7, the pink ones are methane molecules, and the dark red ones are heptane molecules. For the convenience of analysis, when analyzing the diffusion process between methane molecules and heptane, other oil-phase molecules are hidden during the observation process so that the observation can be clearer.
Figure 7 shows the intrusion process of methane molecules and the separation process of heptane molecules at 50 °C and 30 MPa. Figure 7(a) presents the molecular diffusion state at 0.03 ns. Methane molecules, carrying some heptane molecules, start to diffuse in the z direction. Figure 7(b) shows the moment at 0.035 ns, when methane molecules and a small number of heptane molecules are attached to the top wall surface of SiO2. In Figure 7(c)–(d), methane molecules and heptane molecules continue to diffuse along the z direction and basically reach a dynamic equilibrium state of diffusion.
The diffusion process is plotted as the curve shown in Figure 8. At the beginning of the simulation, the first 0.03 ns is the stage for the system to conduct the initial structural optimization. After the optimization, the molecular diffusion speed increases. Around 1 ns, the diffusion phenomenon begins to enter a dynamic equilibrium state. Therefore, the diffusion speed is analyzed through the process from 0.03 ns to 1 ns. The slope of this curve can reflect the diffusion coefficient. According to Equation (9), the calculated diffusion coefficient is 2.8 × 10⁻⁵ cm²/s.
In the formula: D represents the diffusion coefficient, with the unit of cm²/s; k represents the slope, and its value is 1.6581.
During the movement process of bubbles in foamy oil fluids, the diffusion with the oil phase is also an influencing factor for the growth rate of bubbles. Through the above molecular diffusion simulation of methane and heptane, the diffusion coefficient of methane bubbles and alkanes can be obtained. In the process of macroscopic flow simulation, considering the influence of molecular diffusion, the diffusion coefficient of fluid parameters is adjusted to conduct the simulation of the influencing factors such as the content of light components, viscosity and interfacial tension.
3.3. Factor of the Content of Light Components
The light components in foamy oil affect the bubble growth process, while the heavy components have a greater impact on parameters such as viscosity. The lower the content of light components is, the higher the corresponding content of heavy components will be. During the simulation, CH4 gas is taken as the representative of light components, and the simulation results are analyzed based on the differences in CH4 content. The content of CH4 in the foamy oil prepared in the experiment is 12%. Therefore, numerical models with CH4 contents of 1%, 5%, 12%, 16% and 20% in the fluid domain are established. When analyzing the bubble growth rate, the prerequisite is that the bubbles have already been generated. So a criterion for bubble generation is set. That is, under the current grid drawing conditions, if the number of clear bubble boundary layers that can be seen when magnified is greater than or equal to 5, it is considered that the bubbles have been generated, as shown in Figure 9. This paper focuses on the growth process of bubbles and does not consider the generation process of bubbles. The grid size affects the calculation accuracy of the bubble generation process, but it does not affect the growth process of bubbles.
Figure 10 takes the simulation result with a CH4 content of 12% as an example to illustrate the growth rate of bubbles. In the figure, the red represents the oil phase, the blue represents the CH4 gas phase, and the color in the middle is the bubble boundary. The bubbles have already formed in Figure 10 (a). When magnified, it is shown in Figure 10 (b). After 0.0671 ms, the bubbles grow, as shown in Figure 10 (c). When magnified, it is shown in Figure 10 (d). During this process, the growth rate of the bubbles is 8.7 × 10⁻⁵ μm²/ms.
As the content of light components increases, the diameter of the generated bubbles becomes larger and the growth rate increases. Figure 11 shows the images of bubbles after growth when the CH4 content is 1%, 5%, 12%, 16%, and 20% respectively. The maximum diameters of the growing bubbles are 2 μm, 3 μm, 4 μm, 6 μm, and 13 μm respectively. The curve of the bubble growth rate is plotted as shown in Figure 12. When the CH4 content is less than 15%, the variation range of the growth rate is relatively small. After exceeding 15%, the growth rate increases exponentially.
It can be known from the above results that when exploited at the same depletion rate, the lower the content of light components (that is, the higher the content of heavy components), the slower the bubble growth rate will be. This indicates that heavy components can play a key role in inhibiting bubble growth, prolonging the time for the oil reservoir to reach the bubble point pressure and extending the development stage of foamy oil flow. For the development of a specific oil reservoir, the component content of this oil reservoir is fixed, and it is impossible to extend the foamy flow time by controlling the component content. However, the foamy flow time in a specific oil reservoir can be predicted according to this curve so that the development strategy of the oil reservoir can be changed in a timely manner.
3.4. Viscosity Factor
The growth and migration processes of bubbles are always affected by the viscous resistance of the oil phase. The greater the viscosity is, the greater the viscous force acting on the bubble boundary will be. Therefore, the degree of bubble deformation under different viscosities is different, and the growth rate is also slower. Taking the viscosity of the experimental foamy oil, which is 12 mPa·s, as the standard, a total of 5 groups of numerical models with viscosities of 2 mPa·s, 12 mPa·s, 20 mPa·s, 50 mPa·s and 100 mPa·s were established to obtain the law of the effect of viscosity. In Figure 13, the shapes of bubbles are different under different viscosities of the oil phase. As the viscosity increases, the shape of bubbles gradually changes from an oval shape to a spherical cap shape and then to a crescent shape.
The influence of viscosity on bubble growth is shown in the curve in Figure 14. As the viscosity increases, the growth rate of bubbles drops sharply, the migration speed becomes slower and the time is prolonged. It can be seen from the above analysis that the viscosity of foamy oil is a key factor in inhibiting bubble expansion and can control the release speed of light components. Reasonably controlling the viscosity of foamy oil is beneficial to extending the foamy flow stage.
3.5. Interfacial Tension Factor
Heavy components (such as asphaltenes and other high-molecular-weight organic substances) usually have relatively low interfacial activity, which may lead to the uneven formation of the interfacial film and instead increase the oil-water interfacial tension, especially at higher concentrations. These components may form a relatively thick film at the oil-water interface, increasing the interfacial tension and reducing the stability of the system.
The interfacial tension between CH4 and the oil phase is 15 mN/m. Based on 15 mN/m, a total of 5 groups of numerical models with interfacial tensions of 5 mN/m, 15 mN/m, 50 mN/m, 200 mN/m and 500 mN/m were established. Figure 15 shows the simulation results of the influence of the magnitude of interfacial tension on the migration morphology of bubbles and the growth rate of bubbles. The simulation results indicate that as the interfacial tension increases, it is easier for the bubbles to maintain a spherical or ellipsoidal shape during the migration process.
The influence of interfacial tension on bubble growth is shown in the curve in Figure 16. Generally speaking, when the interfacial tension is large, the growth rate of bubbles is also fast. In the range of 0.3 to 33.3 times the interfacial tension between CH4 and the oil phase, although the magnitude of the bubble growth rate does not change much, it shows a certain regularity. It generally increases in a logarithmic form. As the interfacial tension increases, the degree of influence of the interfacial tension gradually weakens.
It can be known from the above simulation data that the variation coefficient of the bubble growth rate with the interfacial tension is close to 0. Therefore, from the perspective of oil reservoir exploitation, the influence of interfacial tension on the bubble growth rate can be neglected.
Based on the above single-factor simulation results, the bubble growth rate curve can be fitted in sections:
Effect of component content:
Effect of viscosity:
Effect of interfacial tension:
In the formula: C represents the content of light components, in %; μ represents the viscosity of the oil phase, in mPa·s; and σ represents the interfacial tension, in mN/m.
The sensitivity of the bubble growth rate to the factors of component content and viscosity is higher than that to the factor of interfacial tension. Light components have a strong dissolving effect on crude oil. When the content of light components is high and the viscosity of crude oil decreases, the bubble growth rate will increase slowly, which leads to an increase in the bubble diameter and, consequently, the growth rate continues to increase. In order to better exploit foamy oil, it is necessary to control the depletion rate of pressure during cold production to control the growth of bubbles.
4. Conclusions
Based on the pressure drop experiments on foamy oil, the growth process of the bubbles precipitated in the foamy oil was analyzed. Combining molecular simulation and Fluent numerical simulation methods, a quantitative analysis was conducted on factors such as the initial bubble diameter size, the component content of foamy oil and the viscosity of foamy oil, and the following understandings were formed:
(1) The experiment found an important phenomenon that the growth of bubbles mostly occurs during the migration process. Under the condition of equal pressure difference reduction, the growth rate of bubbles presents a three-stage characteristic of being fast in the initial stage, slowing down in the middle stage and accelerating in the later stage. It is analyzed that this is related to the different intensities of the roles played by complex factors in each stage. The experiment shows that after the bubble diameter reaches 200 μm, the growth rate increases exponentially. Therefore, during the development process, the bubble diameter of the precipitated bubbles should be controlled. A smaller bubble diameter is beneficial to improving the fluidity of foamy oil, while an overly large bubble diameter is likely to lead to an excessively fast growth rate of gas and reduce the utilization efficiency of gas energy.
(2) The numerical model shows that as the content of light components in foamy oil increases, both the generation and growth rates of bubbles become larger. When the methane content is greater than 15%, the growth rate increases in an exponential trend. Combined with the slowly declining development characteristics of foamy oil, it is analyzed that the special fluid characteristics of foamy oil, which enable light components to be slowly precipitated, are the key to its long-term development. It has been verified that the high content of heavy components in foamy oil leads to the stability of the interface between the oil phase and the gas phase, which is the main reason why foamy oil is not easy to degas and undergoes phase change slowly.
(3) The simulation results of the influence of viscosity on the bubble growth rate show that there is a logarithmic relationship between viscosity and growth rate. The greater the viscosity is, the slower the growth rate will be. It can be known from these simulation results that the viscosity of foamy oil is a key factor in inhibiting bubble expansion. It can control the release rate of light components, enabling foamy oil to exhibit the characteristics of a long development time and a high recovery degree in depletion-type development.
(4) The interfacial tension has little impact on the bubble growth rate, and the influence of this factor can be neglected during the process of oil reservoir exploitation.
The experimental phenomena and the analysis of the numerical simulation results of the growth rate have explored the reasons for the slow growth of bubbles in foamy oil. The research results on the three influencing factors, namely the content of light components, viscosity and interfacial tension, have provided the exploitation ideas for controlling the pressure drop rate. Meanwhile, the research results on the content of light components and viscosity factors can predict the exploitation status of foamy oil reservoirs and provide theoretical guidance for the timely adjustment of development strategies.
Author Contributions
Conceptualization, W.L. and M.Z.; methodology, W.L. and M.Z.; validation, X.C. and M.Z.; investigation, X.C. and M.Z.; experiment, X.C.; simulation, X.C. and M.Z.; writing—original draft preparation, M.Z.; writing—review and editing, W.L. and X.C.; supervision, W.L. and X.C.; project administration, W.L.; funding acquisition, W.L. All authors have read and agreed to the published version of the manuscript.
Funding
This research was funded by the Major Special project of the CNPC ( 2021ZZ01-05).
Data Availability Statement
The raw/processed data required to reproduce these findings cannot be shared at this time, as these data also form part of an ongoing study.
Acknowledgments
The financial and research equipment support of the CNPC.
Conflicts of Interest
The authors declare no conflict of interest.
References
- GUAN Wenlong, JIANG Youwei, GUO Erpeng, et al. Countermeasures for heavy oil development under the background of "dual carbon" goal [J]. Acta Petrolei Sinica, 2023, 44(5): 826-840.
- LU Teng,LI Zhaomin,GU Zihan,et al. Microscopic mechanism of viscosity lowering foamy system with ultra-deep heavy oil and its application in mining field [J].Acta Petrolei Sinica,2023,44(08):1344-1355.
- YANG Chaopeng,LI Xingmin,CHEN Heping. Numerical simulation of SAGD development after cold production of foamy oil type ultra-heavy oil [J].Acta Petrolei Sinica,2018,39(04):445-455.
- Speight, James G. Rules of Thumb for Petroleum Engineers - Foamy Oil [M]. John Wiley & Sons, Ltd, 2017.
- Maini, Brij B. Foamy-Oil Flow [M]. Journal of Petroleum Technology. Society of Petroleum Engineers, 2001.
- Sheng J G, Maini B B, Tortike W S. A Non-Equilibrium Model to Calculate Foamy Oil Properties [J]. Journal of Canadian Petroleum Technology, 1995, 38(4):38-45. [CrossRef]
- Sheng J J, Maini B B, Hayes R E, et al. Critical Review of Foamy Oil Flow [J]. Transport in Porous Media, 1999, 35(2):157-187. [CrossRef]
- Wang J, Yuan Y, Zhang L, et al. The influence of viscosity on stability of foamy oil in the process of heavy oil solution gas drive [J]. Journal of Petroleum Science & Engineering, 2009, 66(1-2):69-74. [CrossRef]
- Li J, Qin J.H, Zhang X.H. A Study on Porous Flow Mechanism of Foamy Oil [C]. International Conference Forum on Porous Flow & Applications, 2009.
- Busahmin B S, Maini B B. Effect of Solution-Gas-Oil-Ratio on Performance of Solution Gas Drive in Foamy Heavy Oil Systems [C]. Canadian Unconventional Resources and International Petroleum Conference, Calgary, Alberta, Canada, Society of Petroleum Engineers. 2010: 10.
- Liu S, Sun X, Li S. Foamy oil recovery mechanism in cold production process of super heavy oil in Venezuela MPE-3 block [J]. Special Oil & Gas Reservoirs, 2011, 18(4):102-104.
- Lu Yingbo. Formation mechanism and percolation characteristics of secondary foamy oil by gas injection in super heavy oil [J]. Lithologic Reservoirs, 2022,34(6):152-159.
- Smith, Gerald E. Fluid Flow and Sand Production in Heavy-Oil Reservoirs Under Solution-Gas Drive [J]. SPE Production Engineering, 1988, 3(02):169-180. [CrossRef]
- Claridge E L. A Proposed Model And Mechanism For Anomalous Foamy Heavy Oil Behavior [M]. :SPE. 1994: 12.
- Maini B B, Sarma H K, George A E. Significance of Foamy-oil Behaviour in Primary Production of Heavy Oils [J]. Journal of Canadian Petroleum Technology, 1993, 32(9):50-54. [CrossRef]
- Bauget F, Lenormand R. Mechanisms of Bubble Formation by Pressure Decline in Porous Media: a Critical Review [C]. SPE Annual Technical Conference and Exhibition, San Antonio, Texas, Society of Petroleum Engineers. 2002: 10.
- Bora R, Maini B B, Chakma A. Flow Visualization Studies of Solution Gas Drive Process in Heavy Oil Reservoirs with a Glass Micromodel [J]. SPE Reservoir Evaluation & Engineering, 2000, 3(3): 224-229. [CrossRef]
- Lillico D A, Babchin A J, Jossy W E, et al. Gas bubble nucleation kinetics in a live heavy oil [J]. Colloids & Surfaces A Physicochemical & Engineering Aspects, 2001, 192(1-3):25-38. [CrossRef]
- Alshmakhy A, Maini B B. A Follow-Up Recovery Method After Cold Heavy Oil Production [C]. SPE Heavy Oil Conference Canada, Calgary, Alberta, Canada, Society of Petroleum Engineers. 2012: 19.
- Alshmakhy A, Maini B B. Foamy-Oil-Viscosity Measurement [J]. Journal of Canadian Petroleum Technology, 2012, 51(01): 60-65. [CrossRef]
- Alshmakhy A, Maini B B. Effects of Gravity, Foamyiness, and Pressure Drawdown on Primary-Depletion Recovery Factor in Heavy-Oil Systems [J]. Journal of Canadian Petroleum Technology, 2012, 51(06): 449-456. [CrossRef]
- Alcantara R, Paredes J E, Briones M. Pressure Transient Analysis for Heavy Oil and Low Transmissivity Formations [C]. SPE International Heavy Oil Conference and Exhibition, Kuwait City, Kuwait, Society of Petroleum Engineers. 2018: 29.
- Alshmakhy A, Maini B B. Effect of Foamyiness on the Performance of Solution Gas Drive in Heavy Oil Reservoirs [J]. Journal of Canadian Petroleum Technology, 2009, 48(03):27-35. [CrossRef]
- Wu X, Zhao R, Wang R. Visual Experimental Study of the Factors Affecting the Stability of Foamy Oil Flow [J]. Petroleum Science and Technology, 2011, 29(14):1449-1458. [CrossRef]
- George D S, Hayat O, Kovscek A R. A microvisual study of solution-gas-drive mechanisms in viscous oils [J]. Journal of Petroleum Science & Engineering, 2005, 46(1-2):101-119.
- CHEN Xinglong,QIN Jishun.Visualization of movement patterns of foamy oil [J].Journal of Southwest Petroleum University,2009(6):126-130.
- Stewart C R, Hunt E B, Schneider F N, et al. The Role of Bubble Formation in Oil Recovery by Solution Gas Drives in Limestones [J]. Journal of Petroleum Technology, 1954, 5(12):21-28.
- Pooladi-Darvish M, Firoozabadi A. Solution-gas Drive In Heavy Oil Reservoirs [J]. Journal of Canadian Petroleum Technology, 1999, 38(04): :32-39.
- Mahabadi N, Zheng X, Yun T S, et al. Gas Bubble Migration and Trapping in Porous Media: Pore-Scale Simulation [J]. Journal of Geophysical Research Solid Earth, 2018:1-20.
- Kam S I, Rossen W R. A Model for Foamy Generation in Homogeneous Media [J]. SPE Journal, 2003, 8(4):417-425.
- Li S, Li Z, Lu T, et al. Experimental Study on Foamy Oil Flow in Porous Media with Orinoco Belt Heavy Oil [J]. Energy & Fuels, 2012, 26:6332-6342. [CrossRef]
- Li J H, Tang R, Xu J, et al. Foamy-Oil Flow Characteristic Considering Relaxation Effects in Porous Media [J]. Applied Mechanics and Materials, 2013, 318:486-490.
- Sheng J J, Maini B B, Hayes R E, et al. Critical Review of Foamy Oil Flow [J]. Transport in Porous Media, 1999, 35(2):157-187. [CrossRef]
- Wang J, Yuan Y, Zhang L, et al. The influence of viscosity on stability of foamy oil in the process of heavy oil solution gas drive [J]. Journal of Petroleum Science & Engineering, 2009, 66(1-2):69-74.
- Busahmin B S, Maini B B. Effect of Solution-Gas-Oil-Ratio on Performance of Solution Gas Drive in Foamy Heavy Oil Systems [C]. Canadian Unconventional Resources and International Petroleum Conference, Calgary, Alberta, Canada, Society of Petroleum Engineers. 2010: 10.
- Li S, Li Z, Wang Z. Experimental study on the performance of foamy oil flow under different solution gas–oil ratios [J]. RSC Adv, 2015, 5(82):66797-66806.
- Li S, Li Z. Effect of Temperature on the Gas/Oil Relative Permeability of Orinoco Belt Foamy Oil [J]. SPE Journal, 2016, 21(01):170-179. [CrossRef]
- Ben Hamida, Mohamed Bechir & Belghaieb, Jalel & Hajji, Nejib. (2017). Numerical study of heat and mass transfer enhancement for bubble absorption process. Thermal Science. 22. 229-229. 10.2298/TSCI170313229B.
- Sheng J J, Hayes R E, Maini B B, et al. A Proposed Dynamic Model for Foamy Oil Properties [C]. SPE International Heavy Oil Symposium, Calgary, Alberta, Canada, Society of Petroleum Engineers. 1995: 14.
- Joseph D D, Kamp A M, Bai R. Modeling foamy oil flow in porous media [J]. International Journal of Multiphase Flow, 2002, 28(10):1659-1686. [CrossRef]
- Shen C. A Practical Approach for the Modeling of Foamy Oil Drive Process [C]. SPE Canada Heavy Oil Technical Conference, Calgary, Alberta, Canada, Society of Petroleum Engineers. 2015: 17.
- Zhang Y-Y, Sun X-F, Duan X-W, et al. Diffusion coefficients of natural gas in foamy oil systems under high pressures [J]. Petroleum Science, 2015, 12(2): 293-303. [CrossRef]
- Smith, Gerald E. Fluid Flow and Sand Production in Heavy-Oil Reservoirs Under Solution-Gas Drive [J]. SPE Production Engineering, 1988, 3(02):169-180. [CrossRef]
- Gor G Y, Kuchma A E, Kuni F M. Gas Bubble Growth Dynamics in a Supersaturated Solution: Henry's and Sievert's Solubility Laws [J]. Physics, 2012:213-233.
- WANG Yuhang, ROHLFS W, MING Pingjian. Numerical simulation study of droplet aggregation and self-springing: Based on improved VOF method [J]. Journal of Engineering Thermophysics, 2022, 43(6): 1541-1546.
Figure 1.
Microscopic glass etched model

Figure 2.
Flow chart of the microscopic experiment on foamy oil pressure drop. 1.Micro pump ; 2.Constant temperature box ; 3.Intermediate container ; 4.vacuum pump ; 5.Valves ; 6.Light source ; 7.Visible high pressure model ; 8.Glass model ; 9.high-speed camera ; 10.Microscope ; 11. Back pressure valve ; 12. Export ; 13. Image acquisition and display system
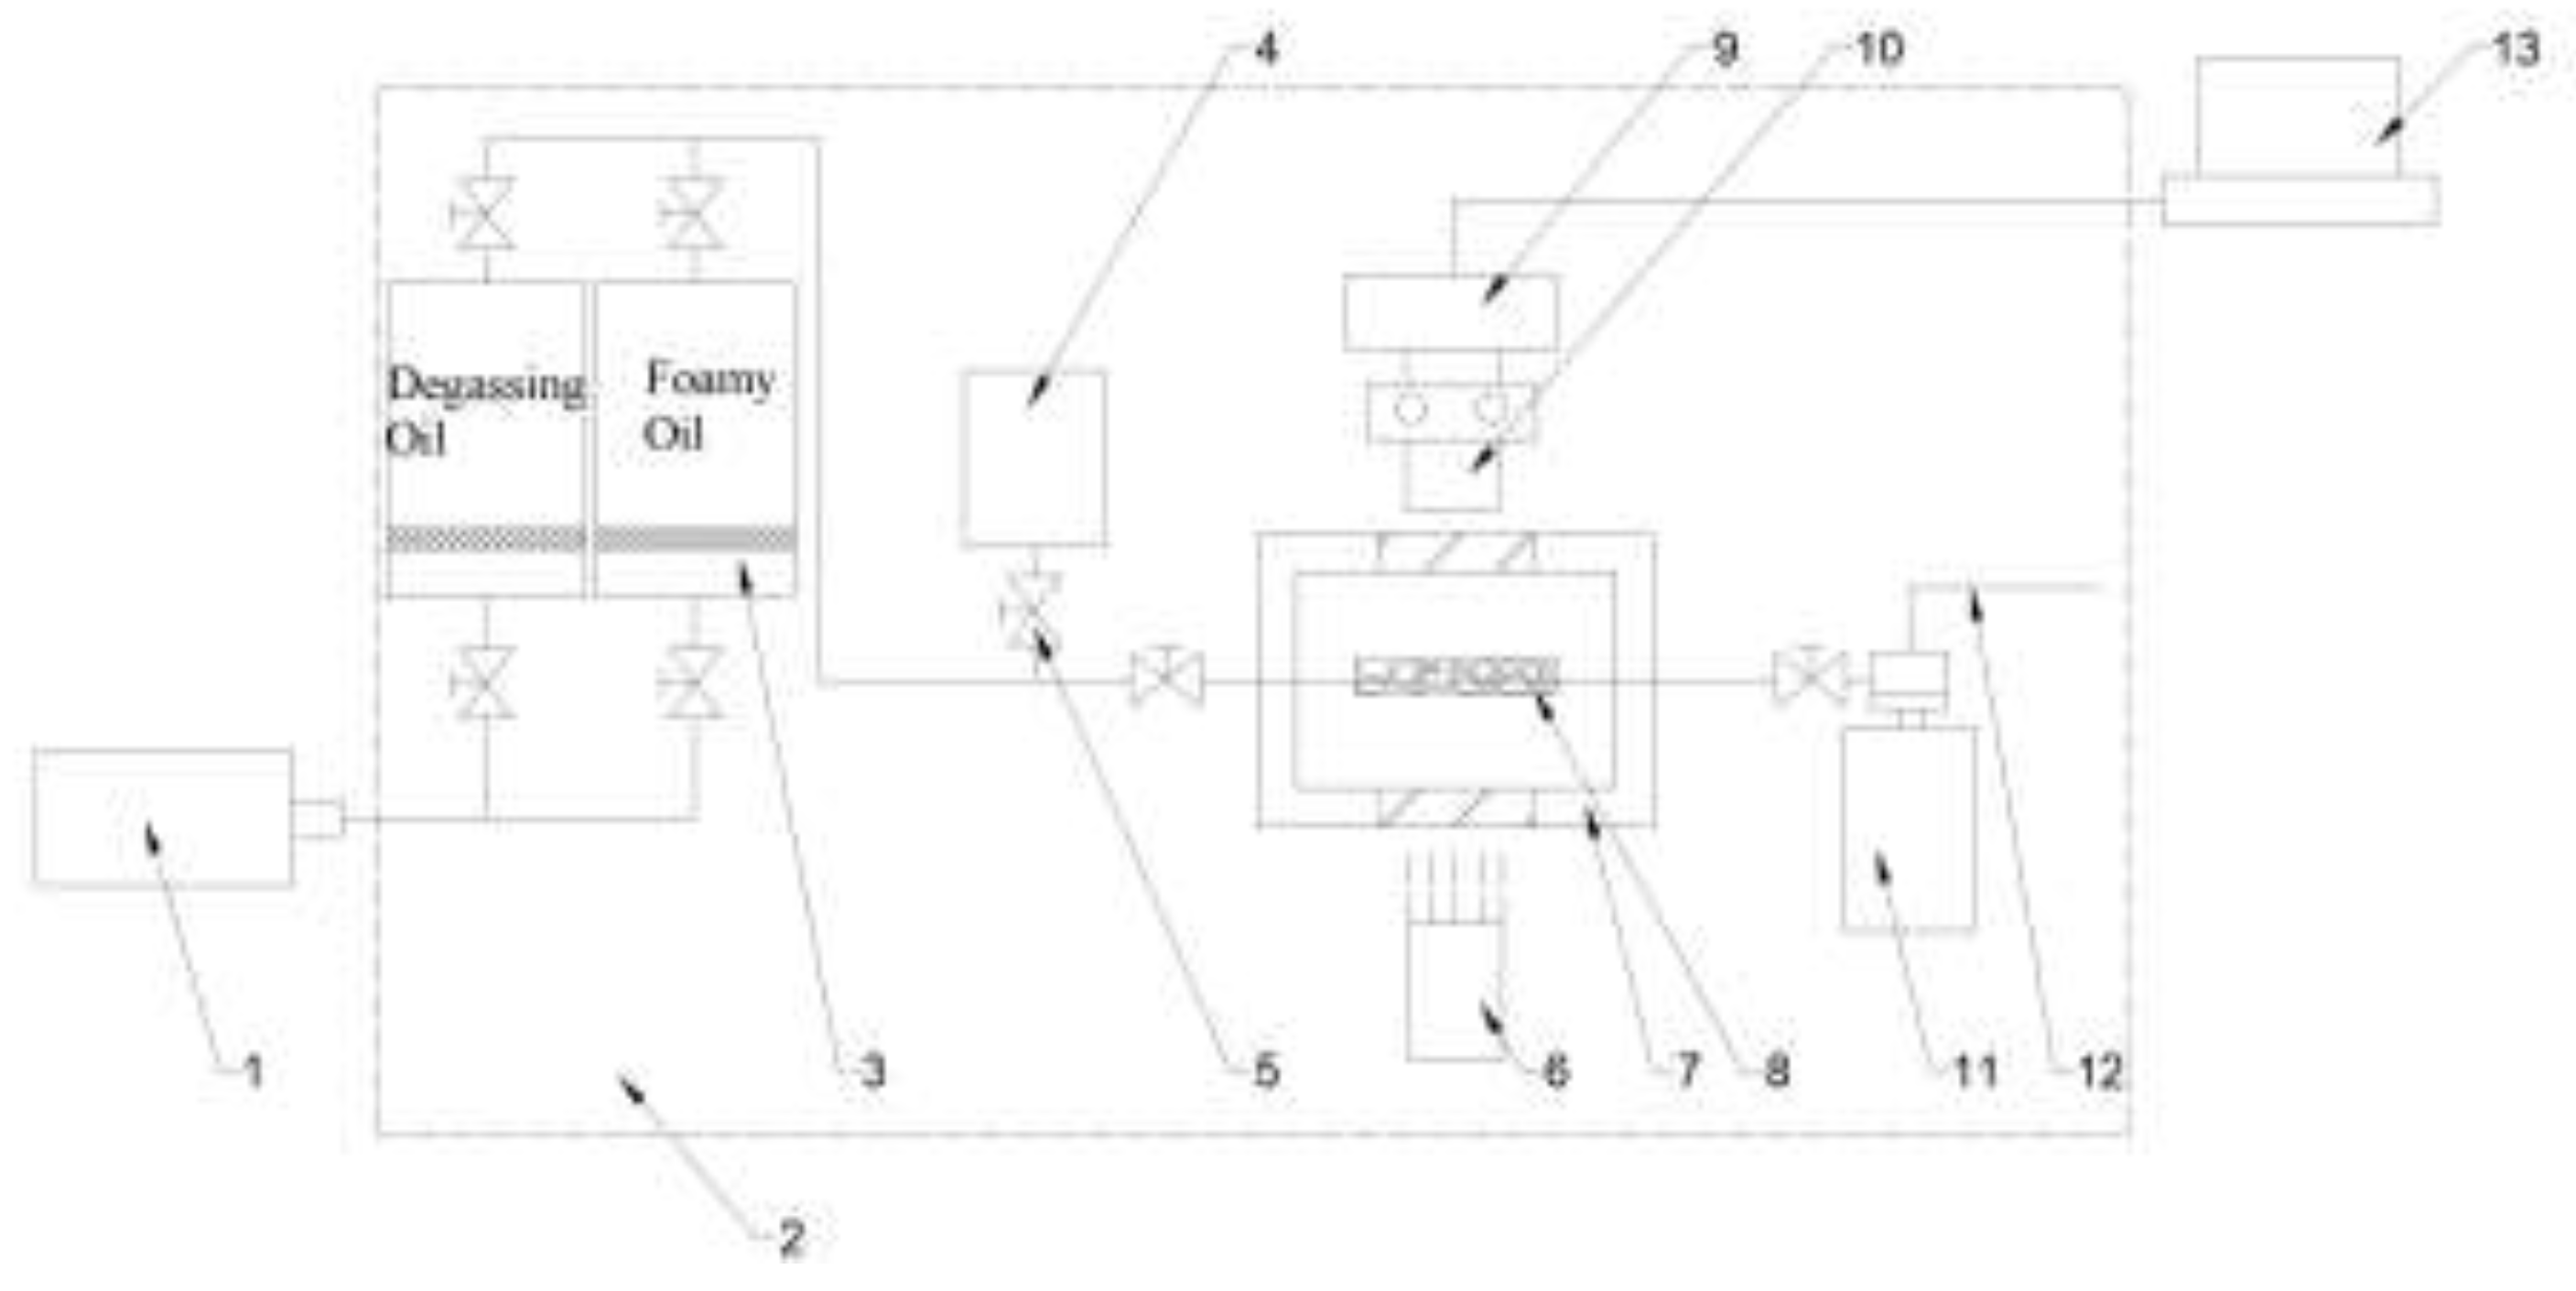
Figure 3.
Figure 3. Fluid atom model of the SiO₂ channel
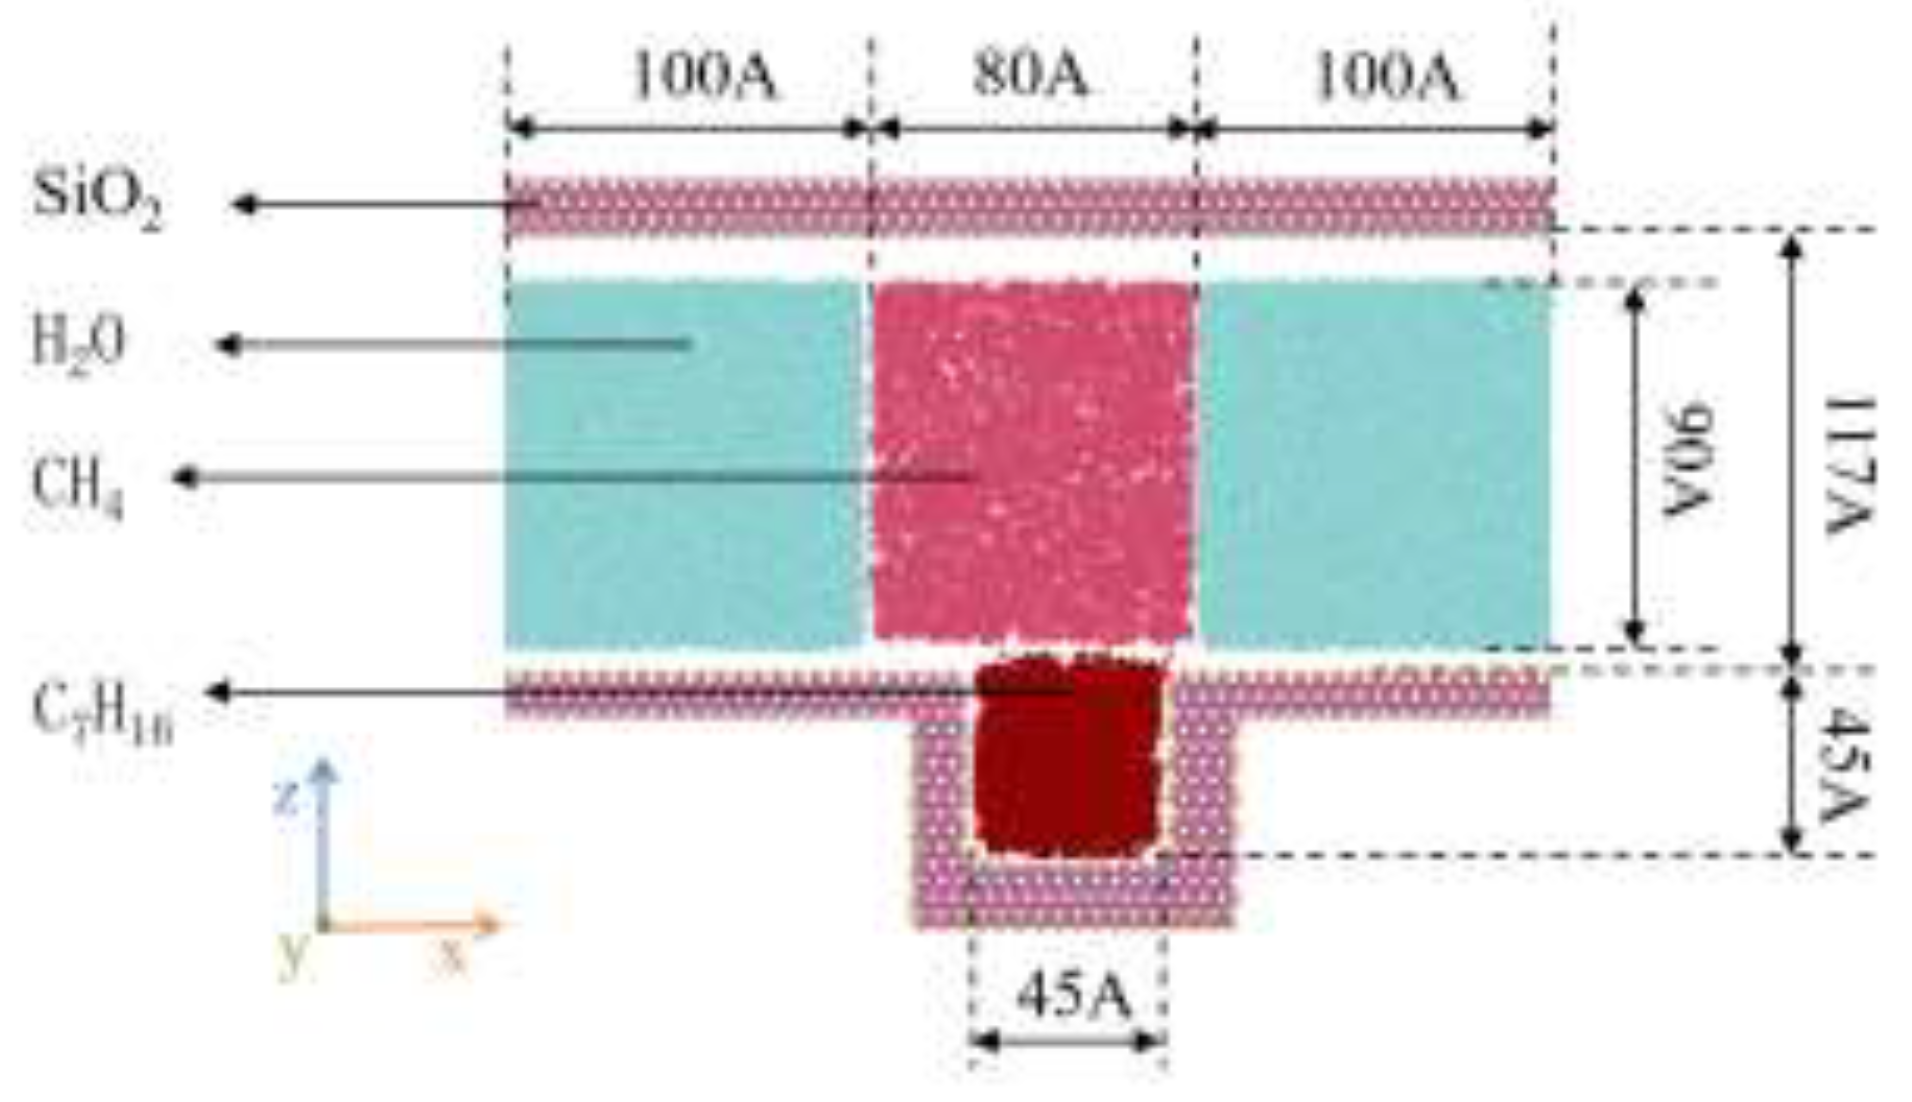
Figure 4.
Schematic diagram of the geometric model
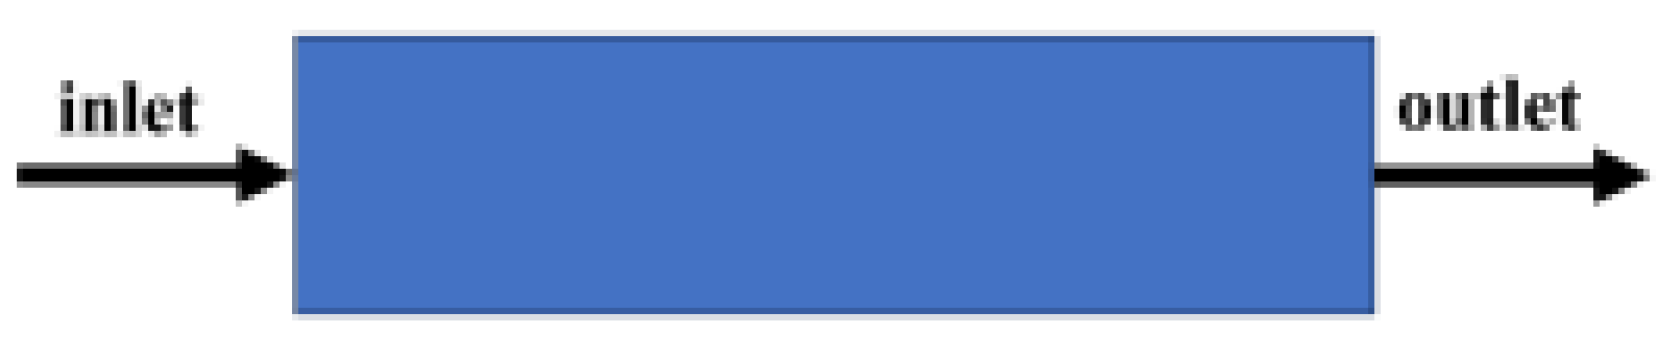
Figure 5.
The growth process of bubbles during the migration process
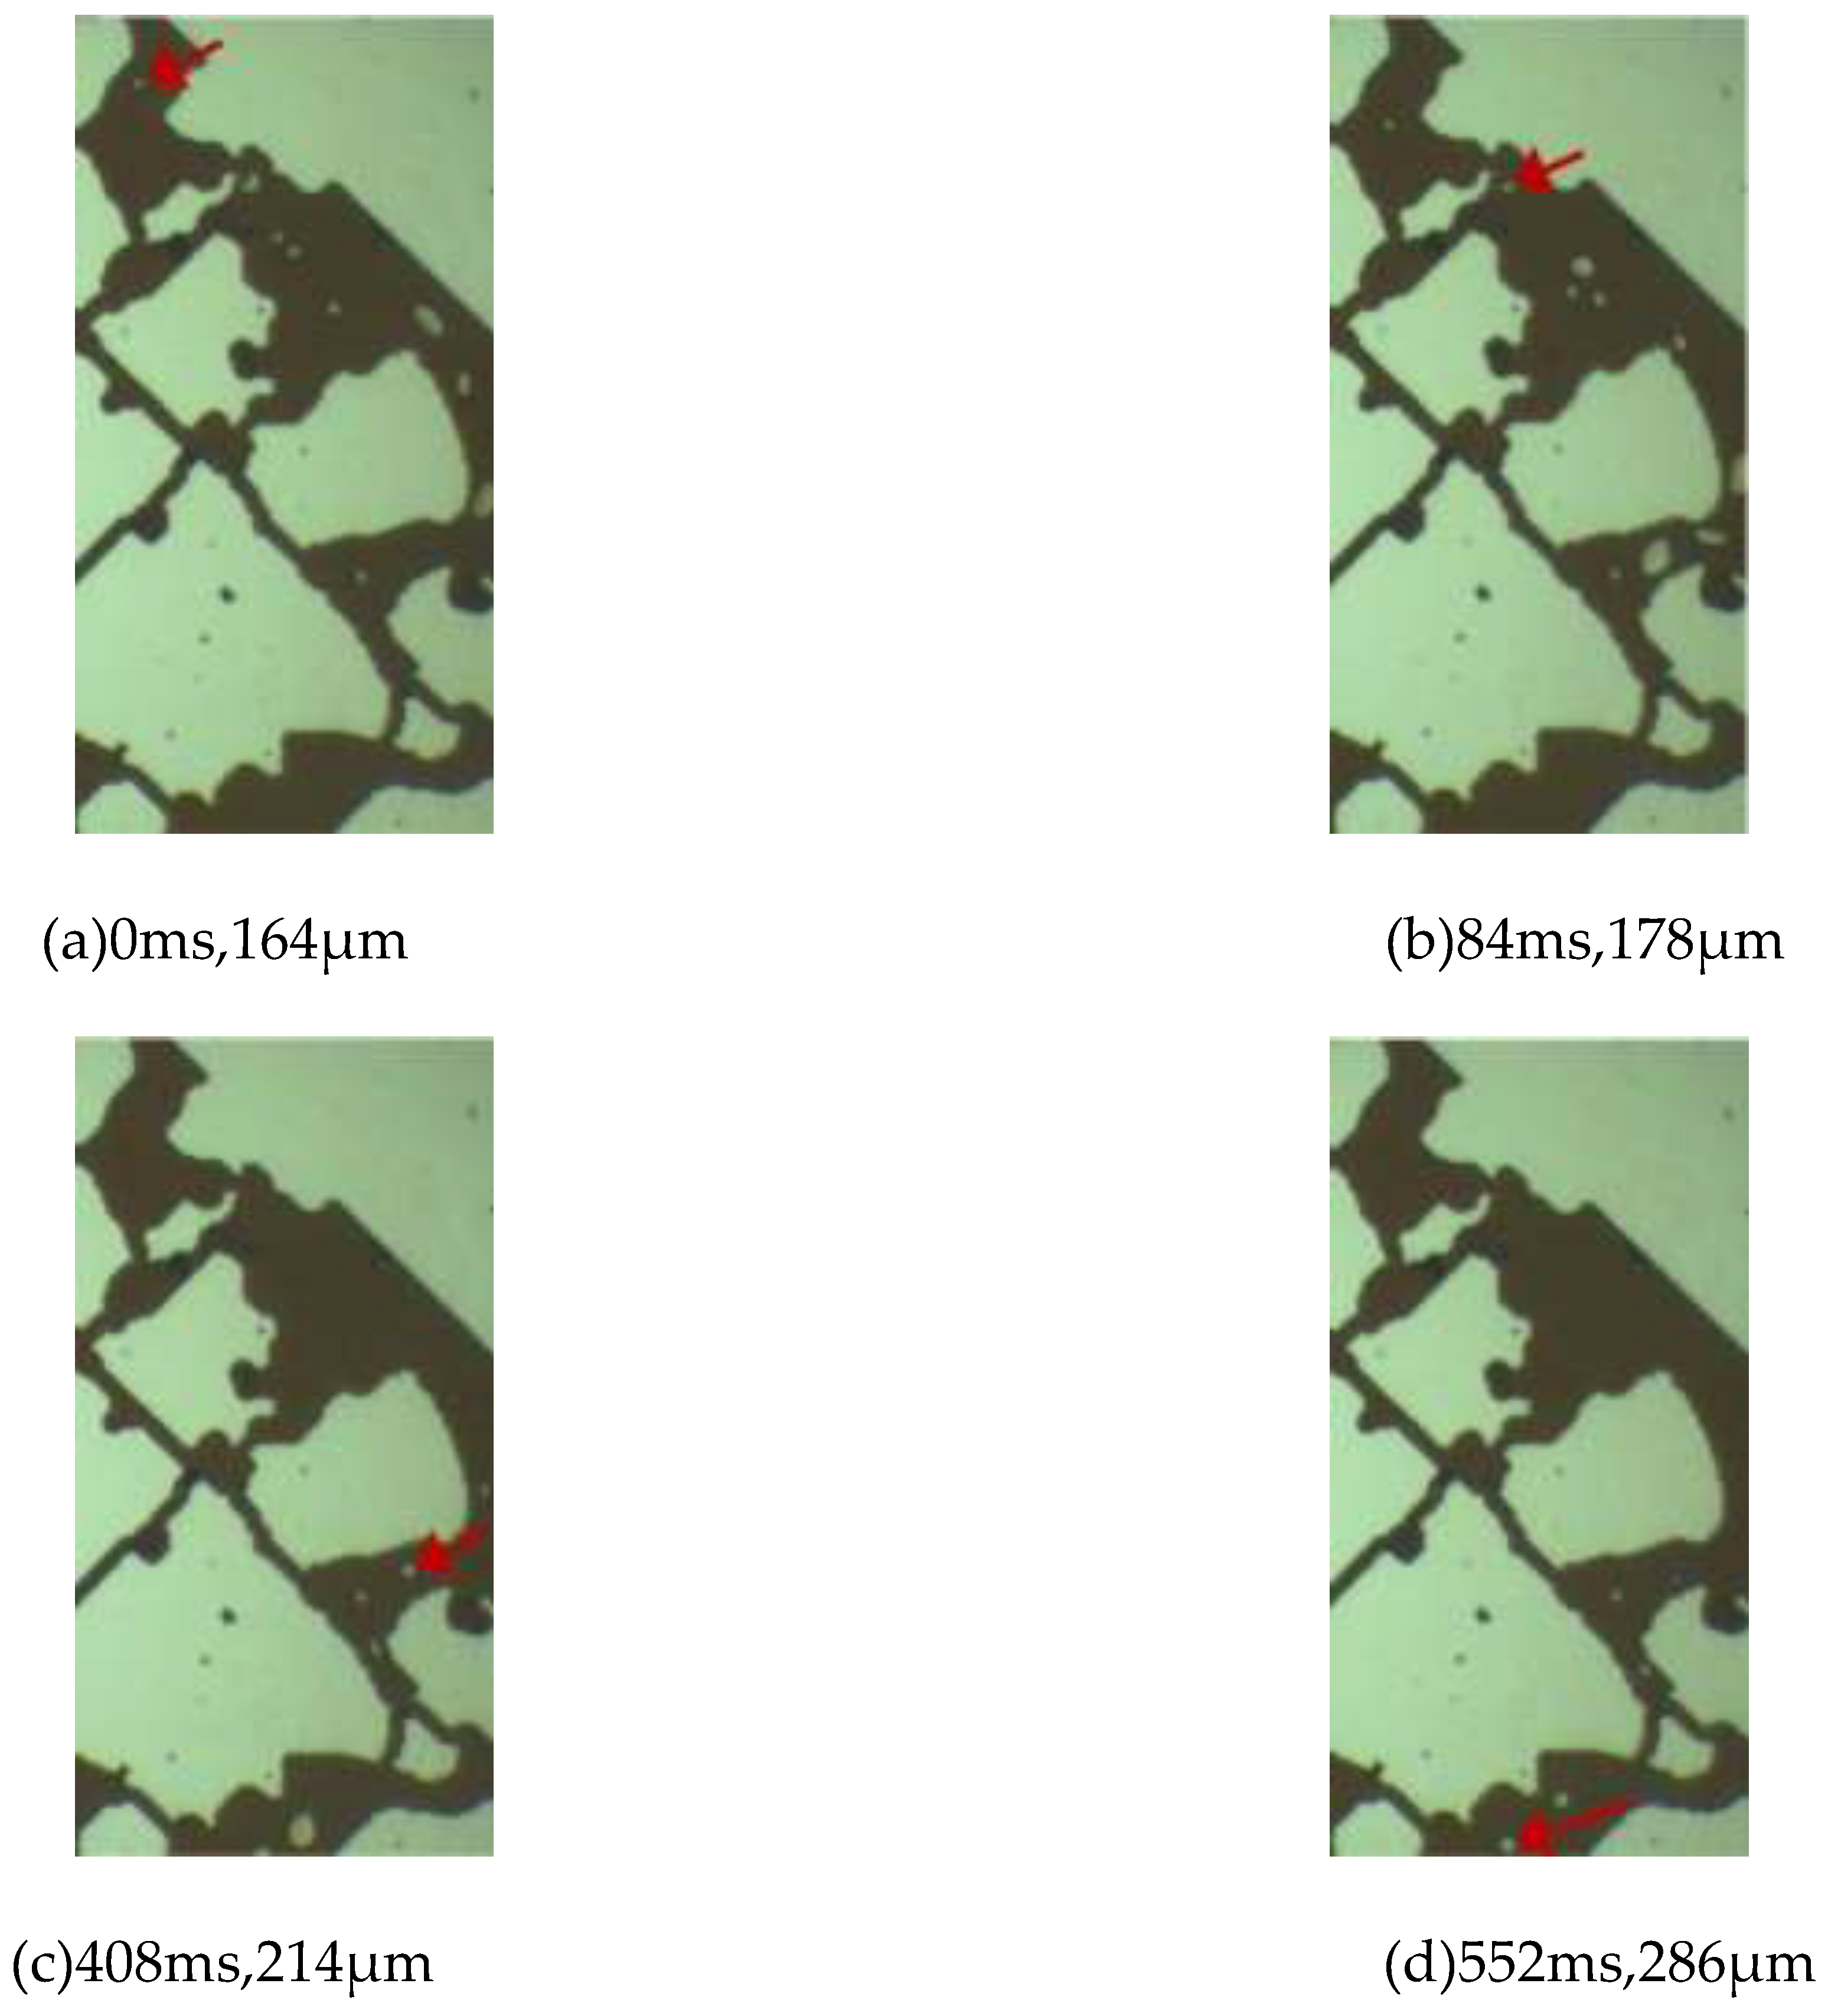
Figure 6.
Bubble growth rate curve
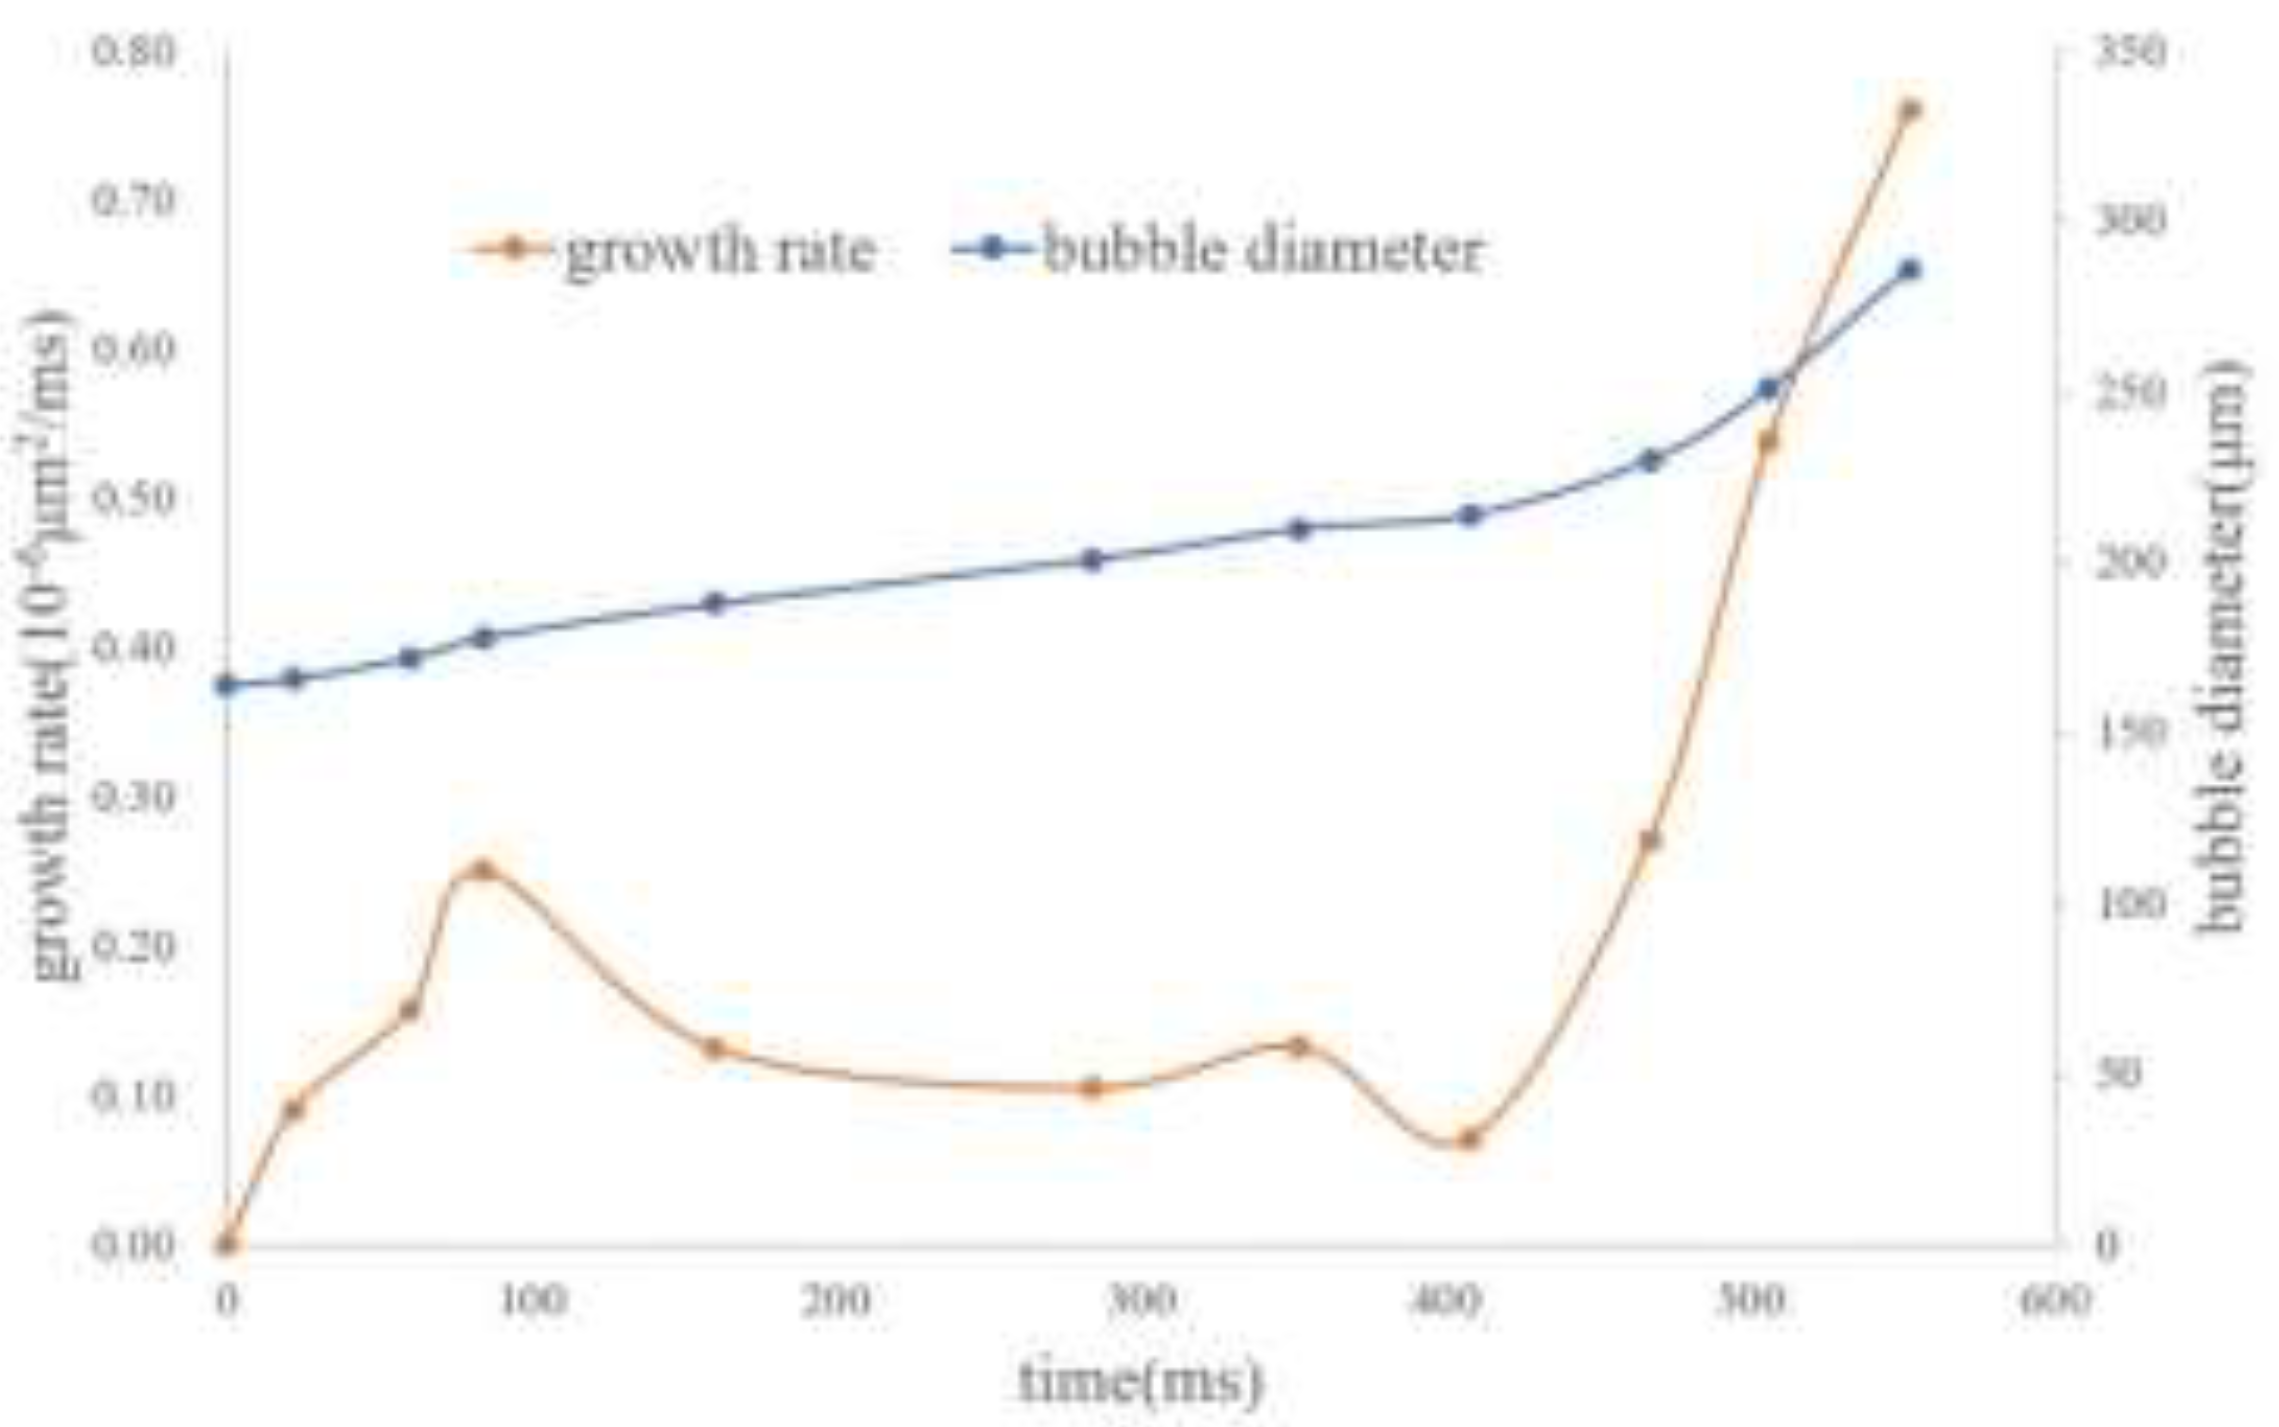
Figure 7.
The interaction process of methane molecules and heptane molecules
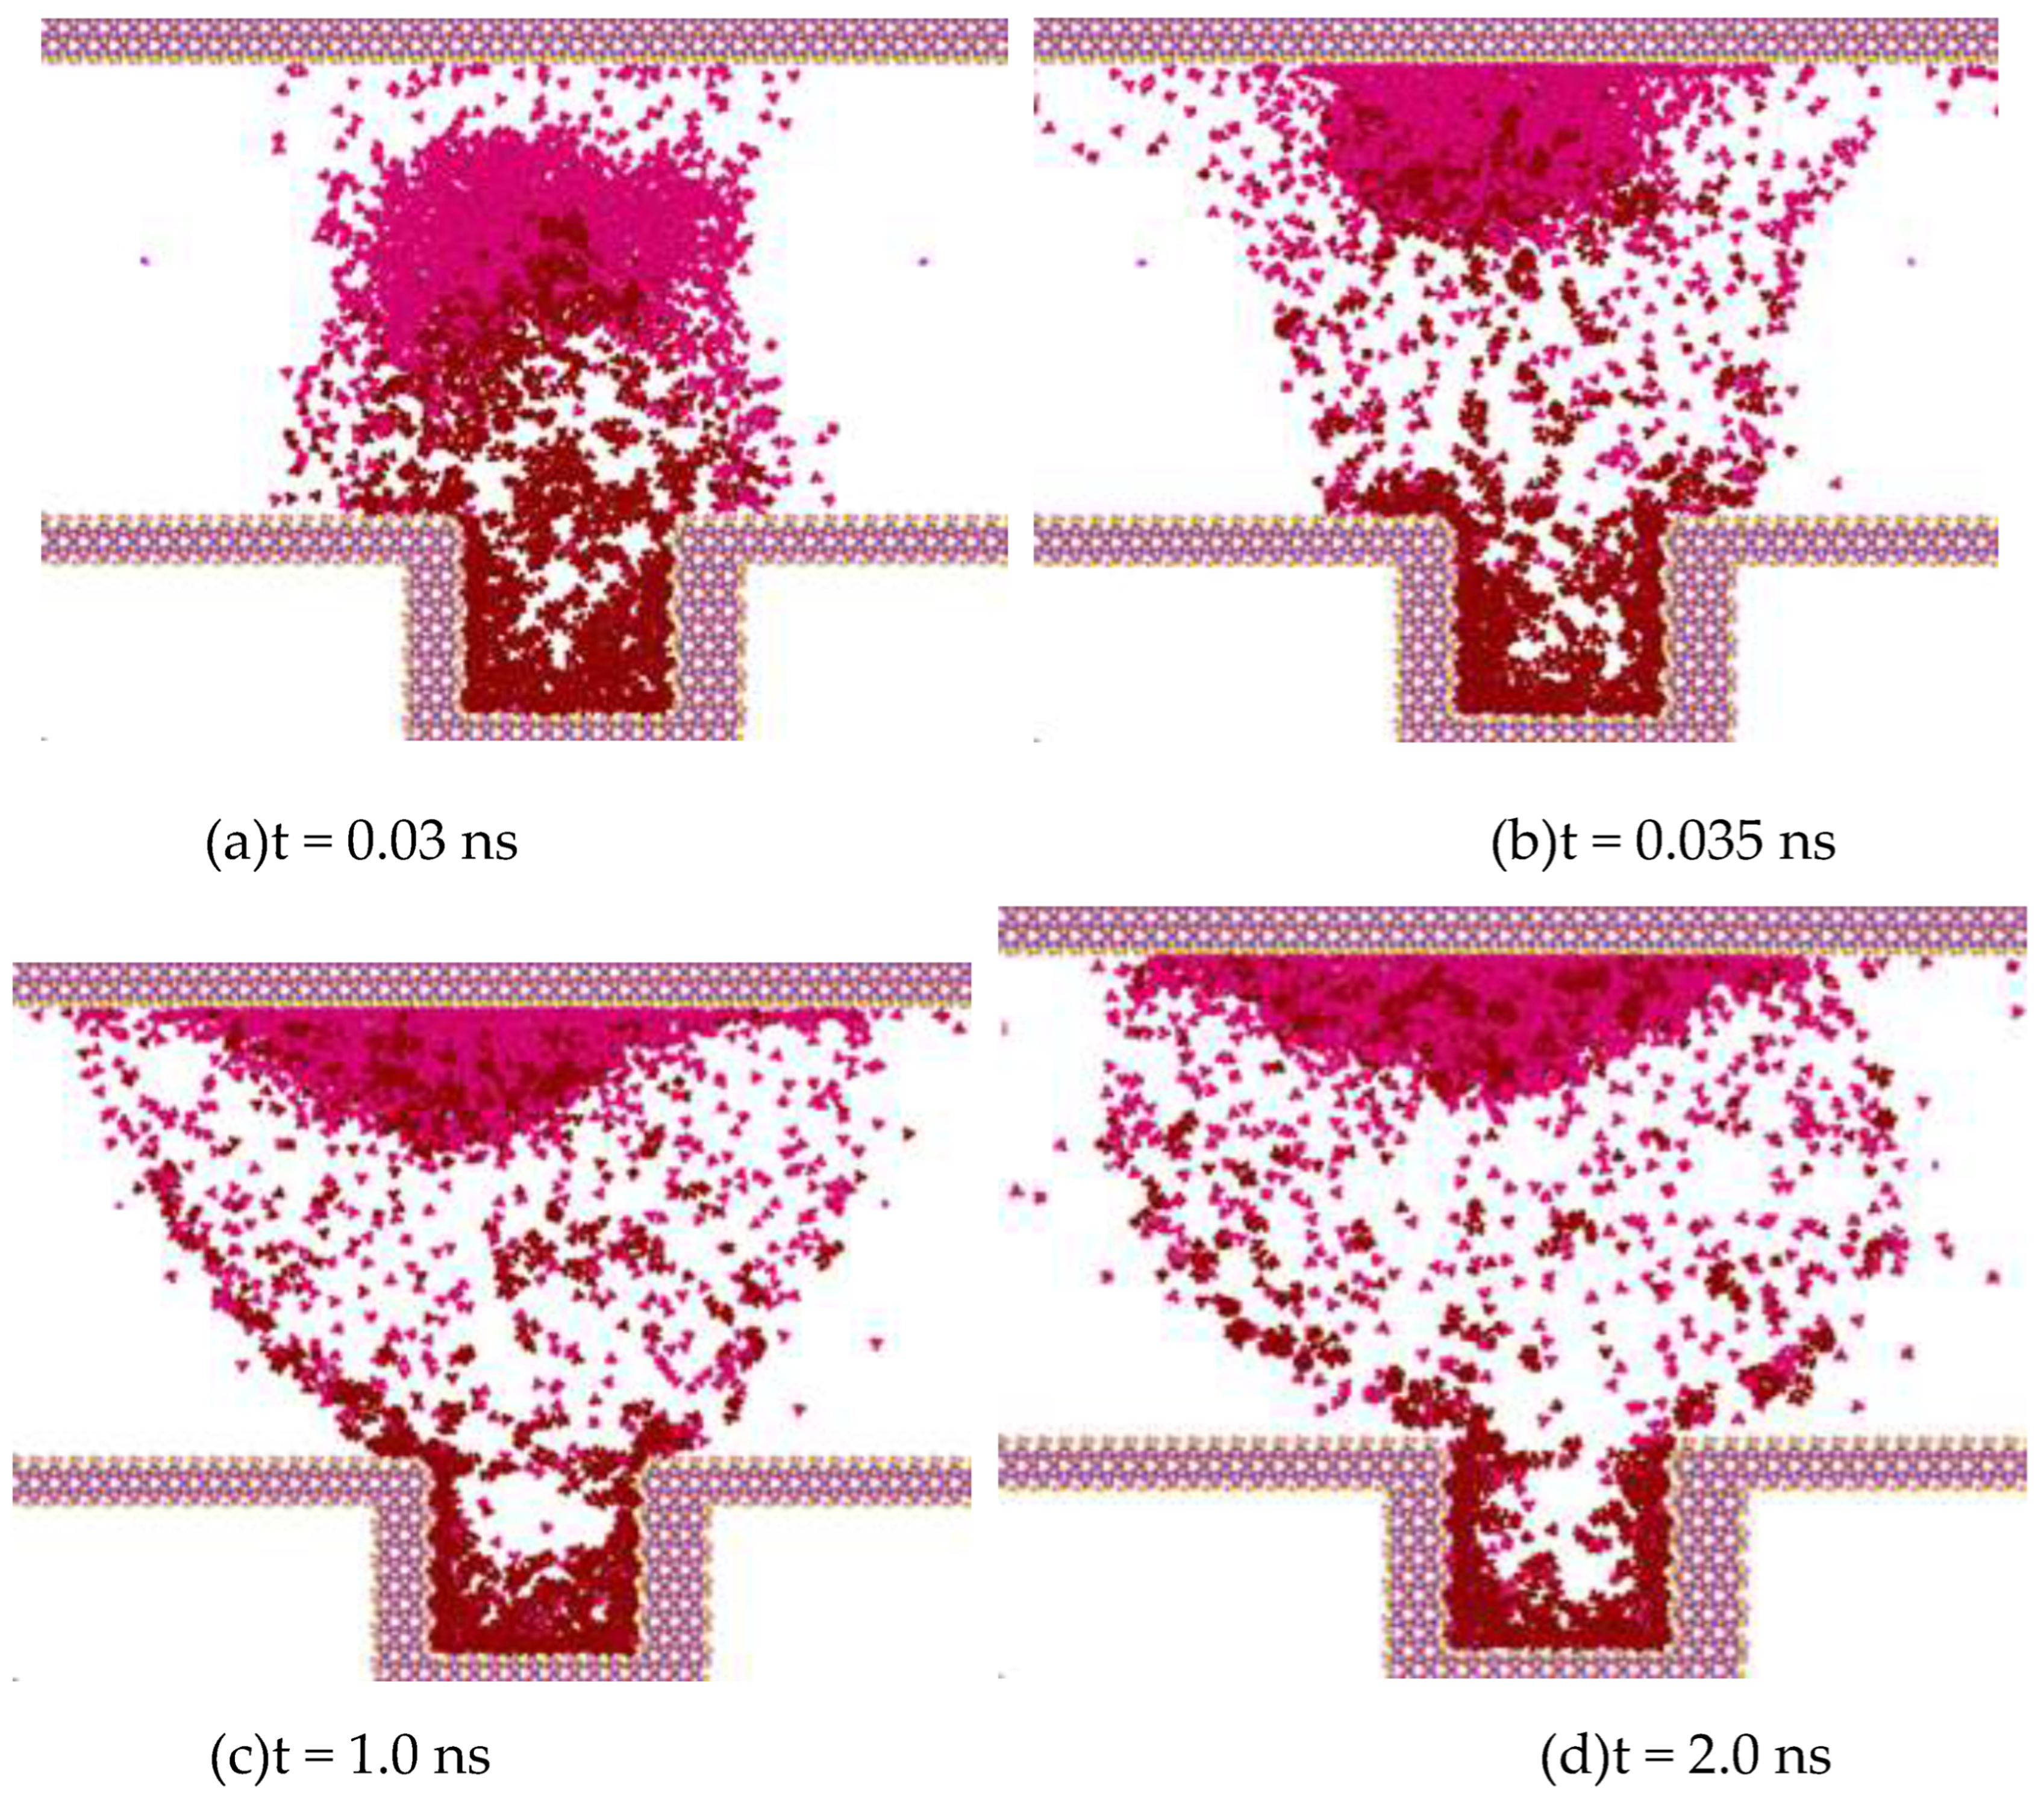
Figure 8.
The diffusion degree of methane molecules in heptane molecules
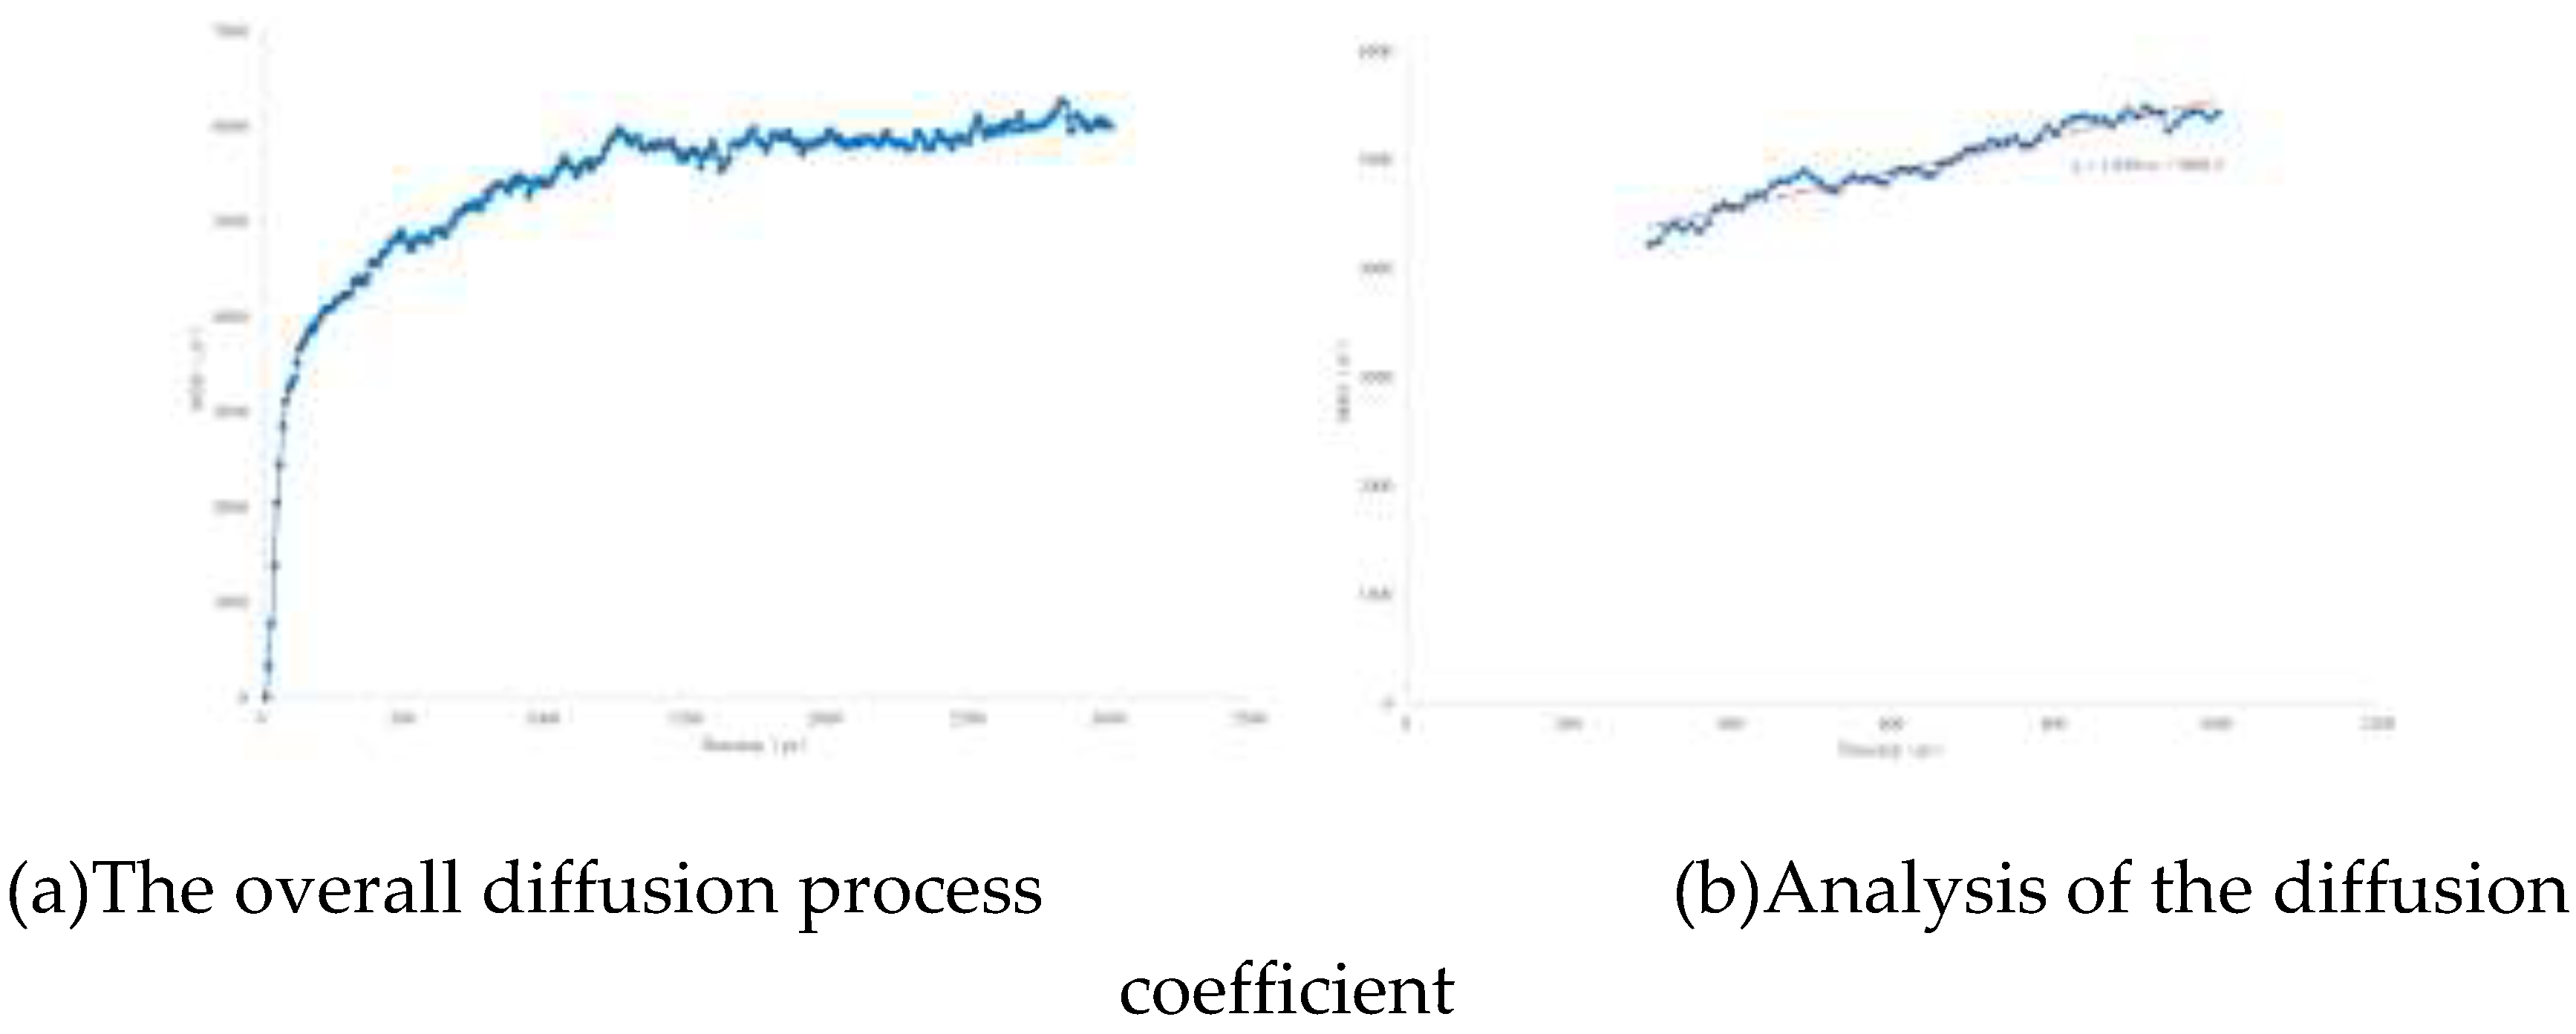
Figure 9.
Illustration diagram of bubble generation size
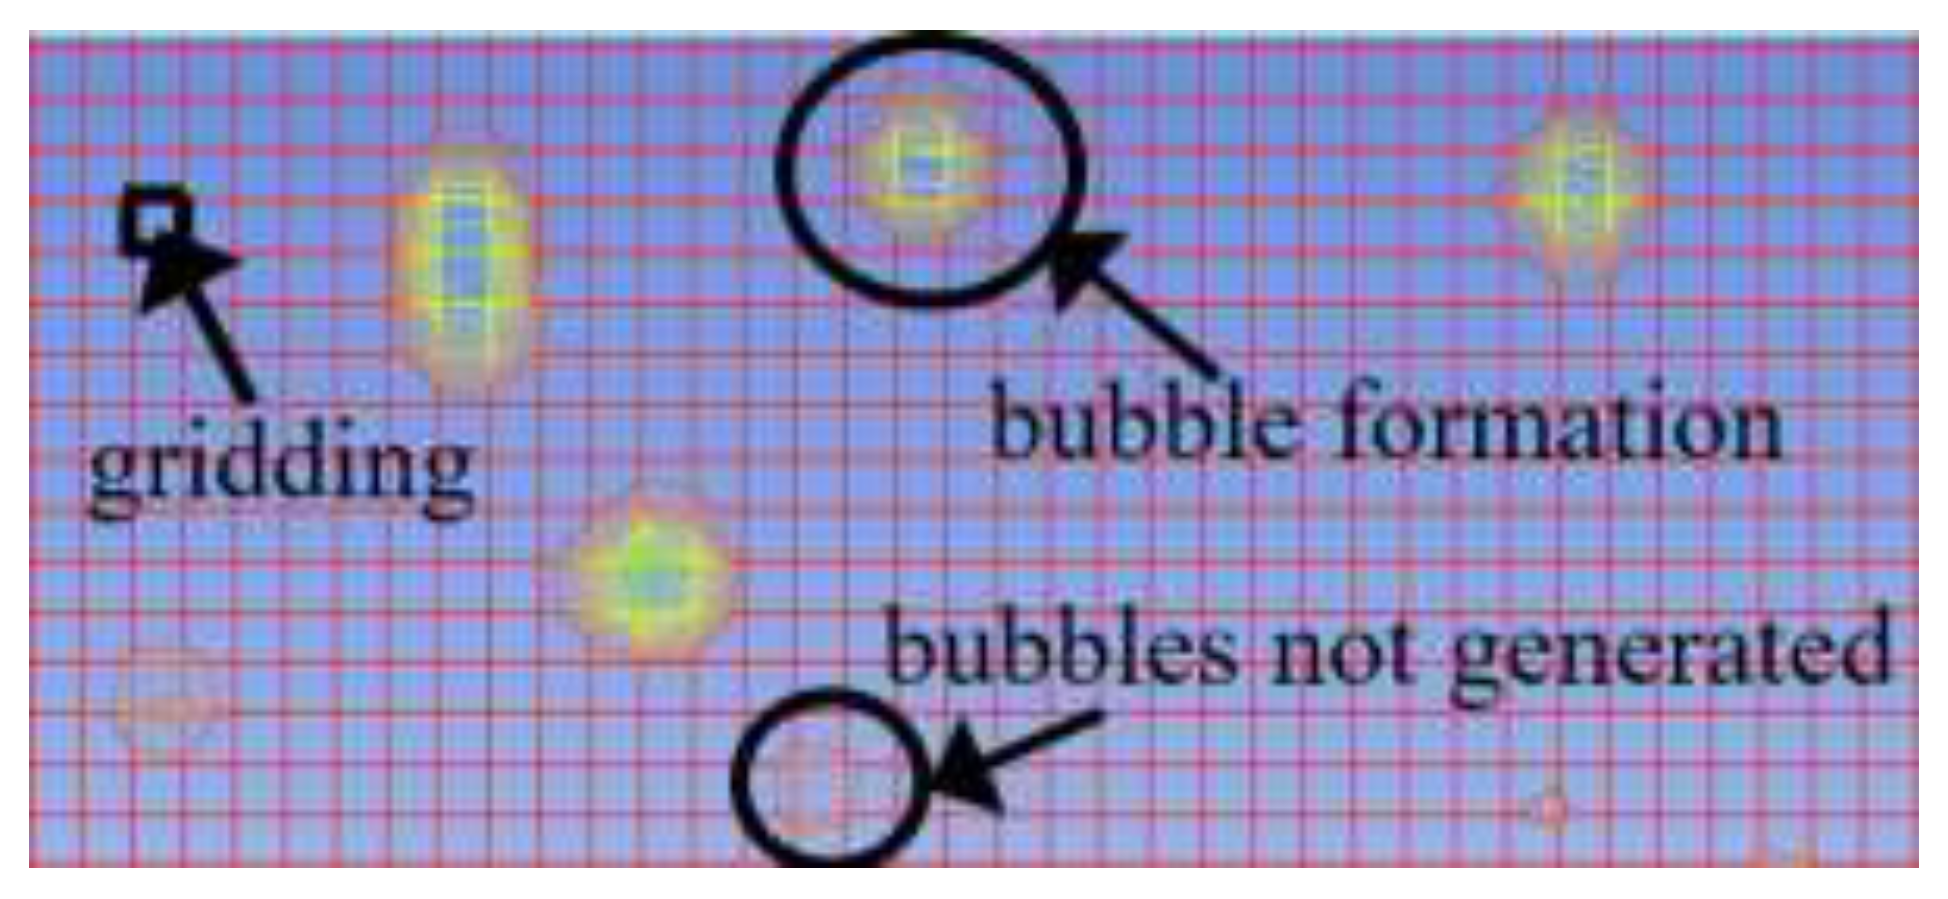
Figure 10.
The bubble growth process when the CH4 content is 12%(@12 mPa·s)

Figure 11.
Comparative analysis of the bubble generation effects with different CH4 contents at the same time(@12 mPa·s)
Figure 11.
Comparative analysis of the bubble generation effects with different CH4 contents at the same time(@12 mPa·s)
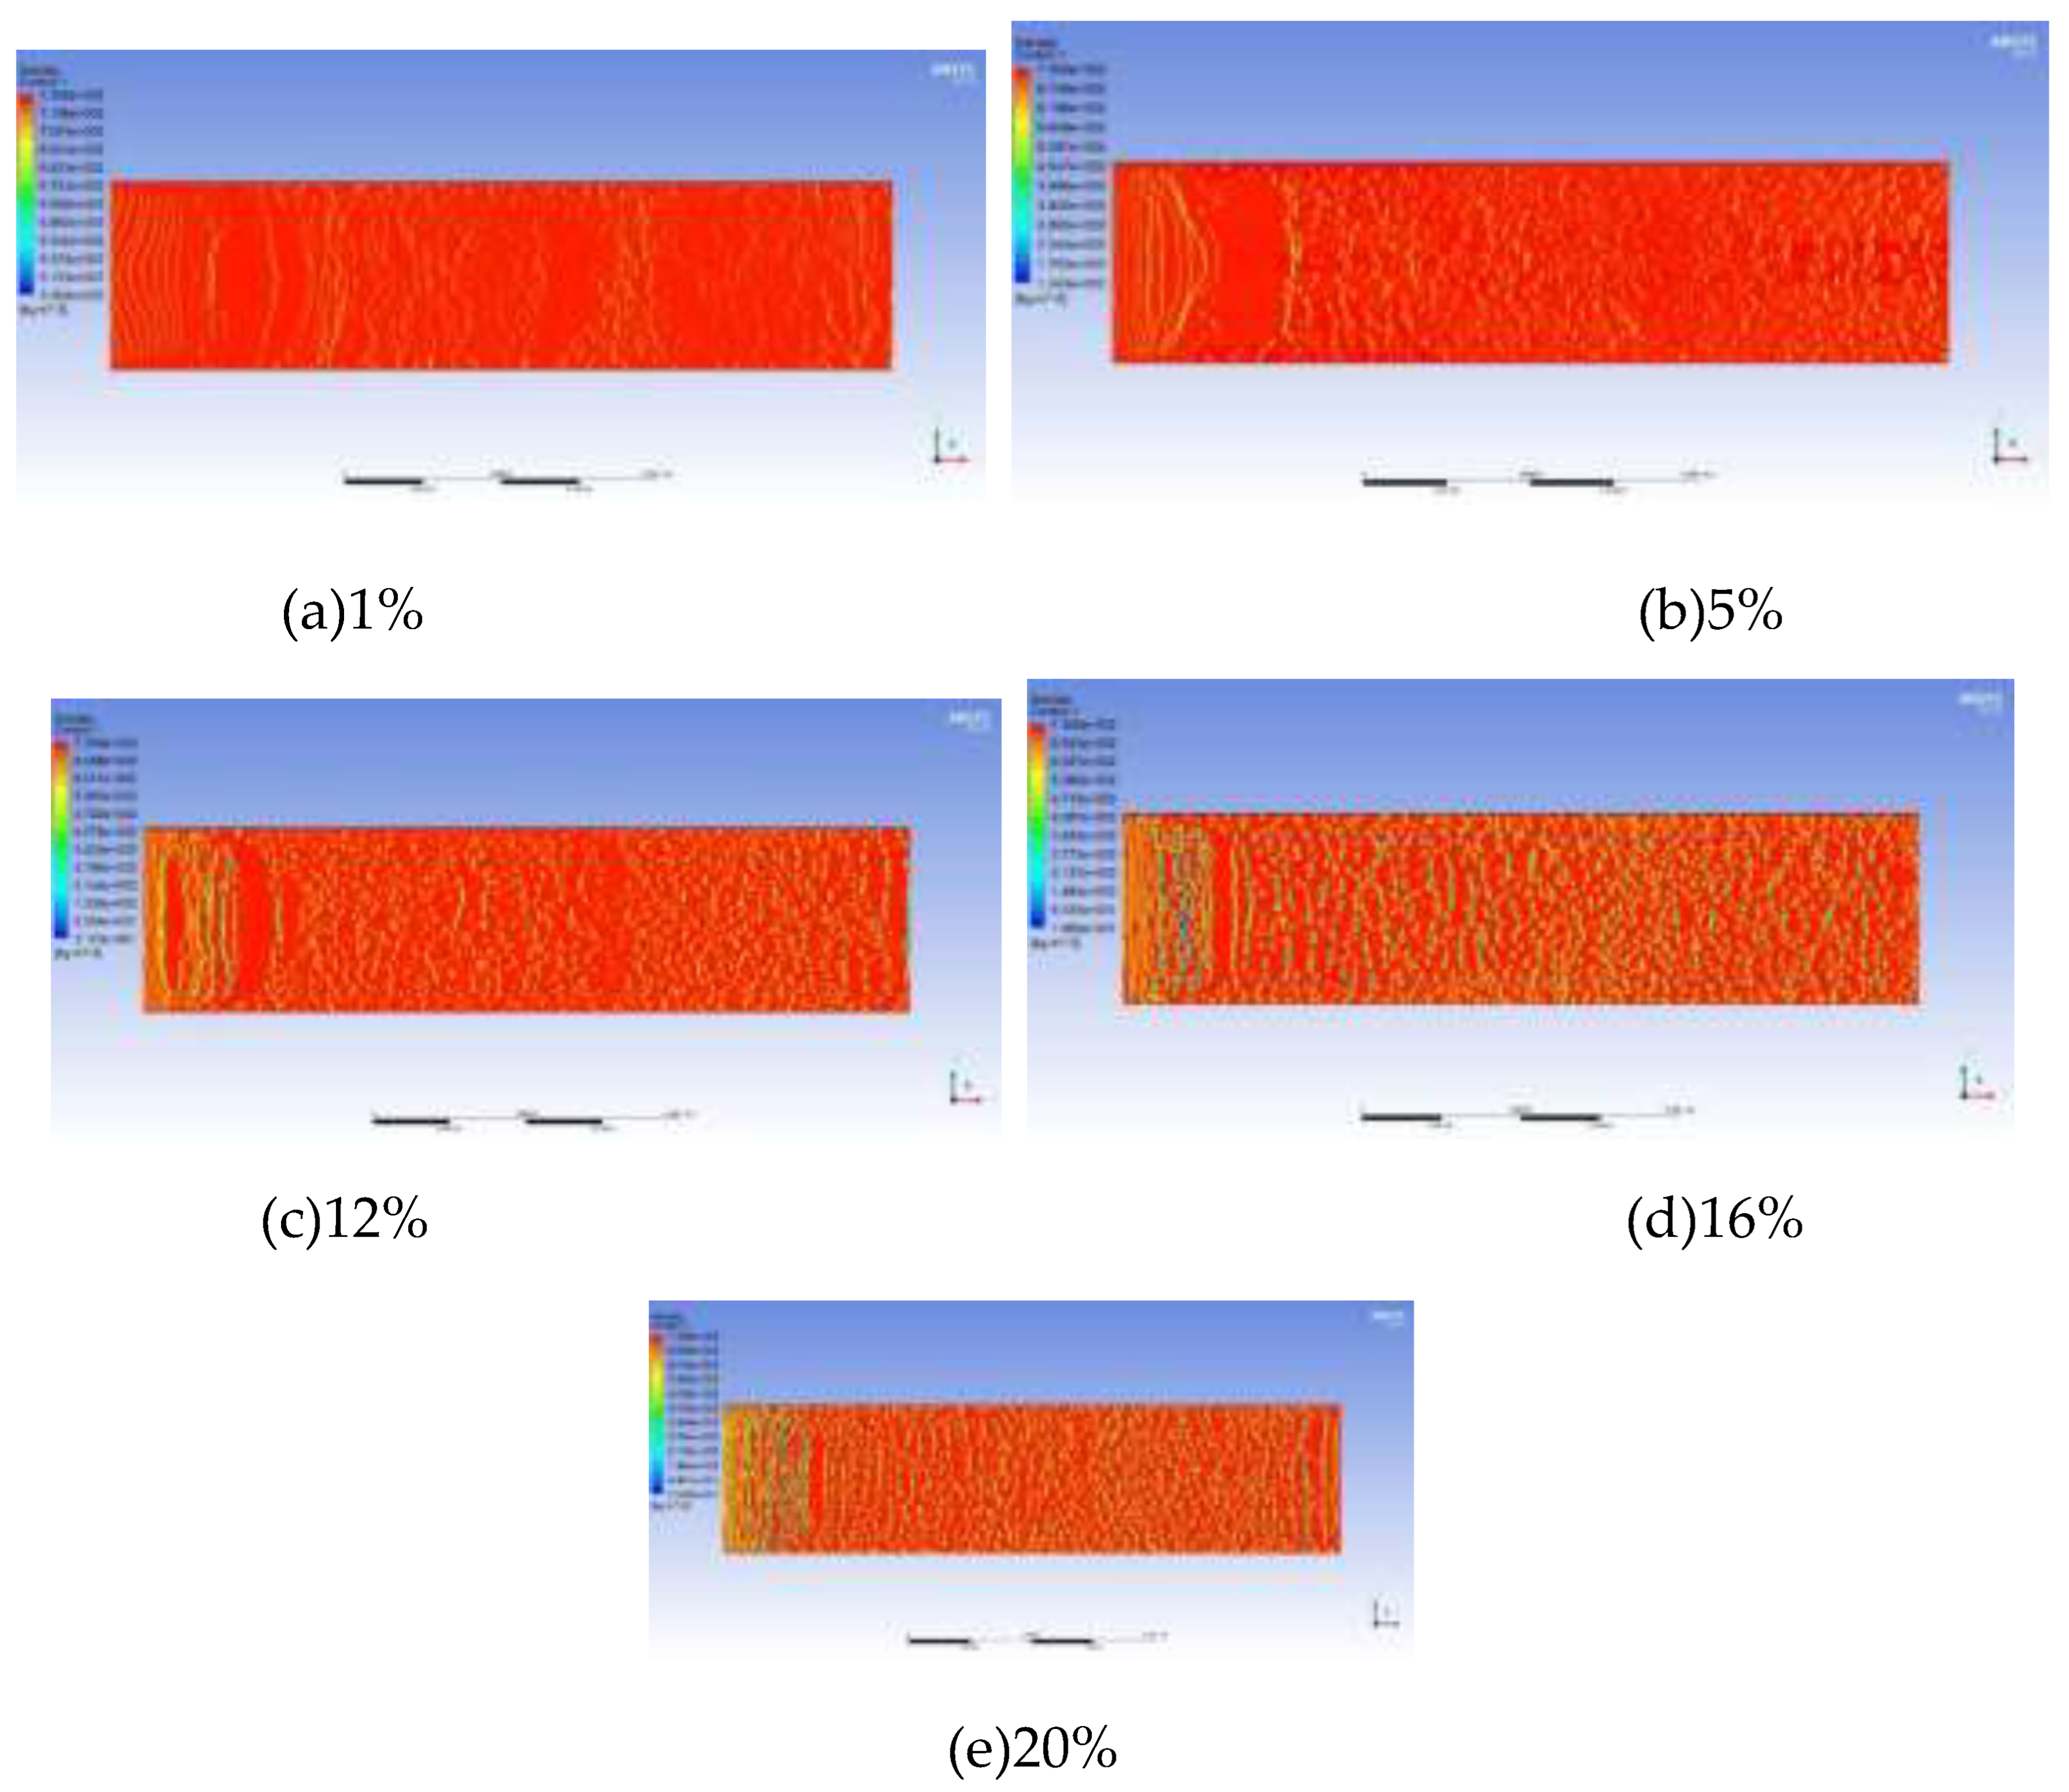
Figure 12.
The curve of bubble growth rate at different CH4 contents
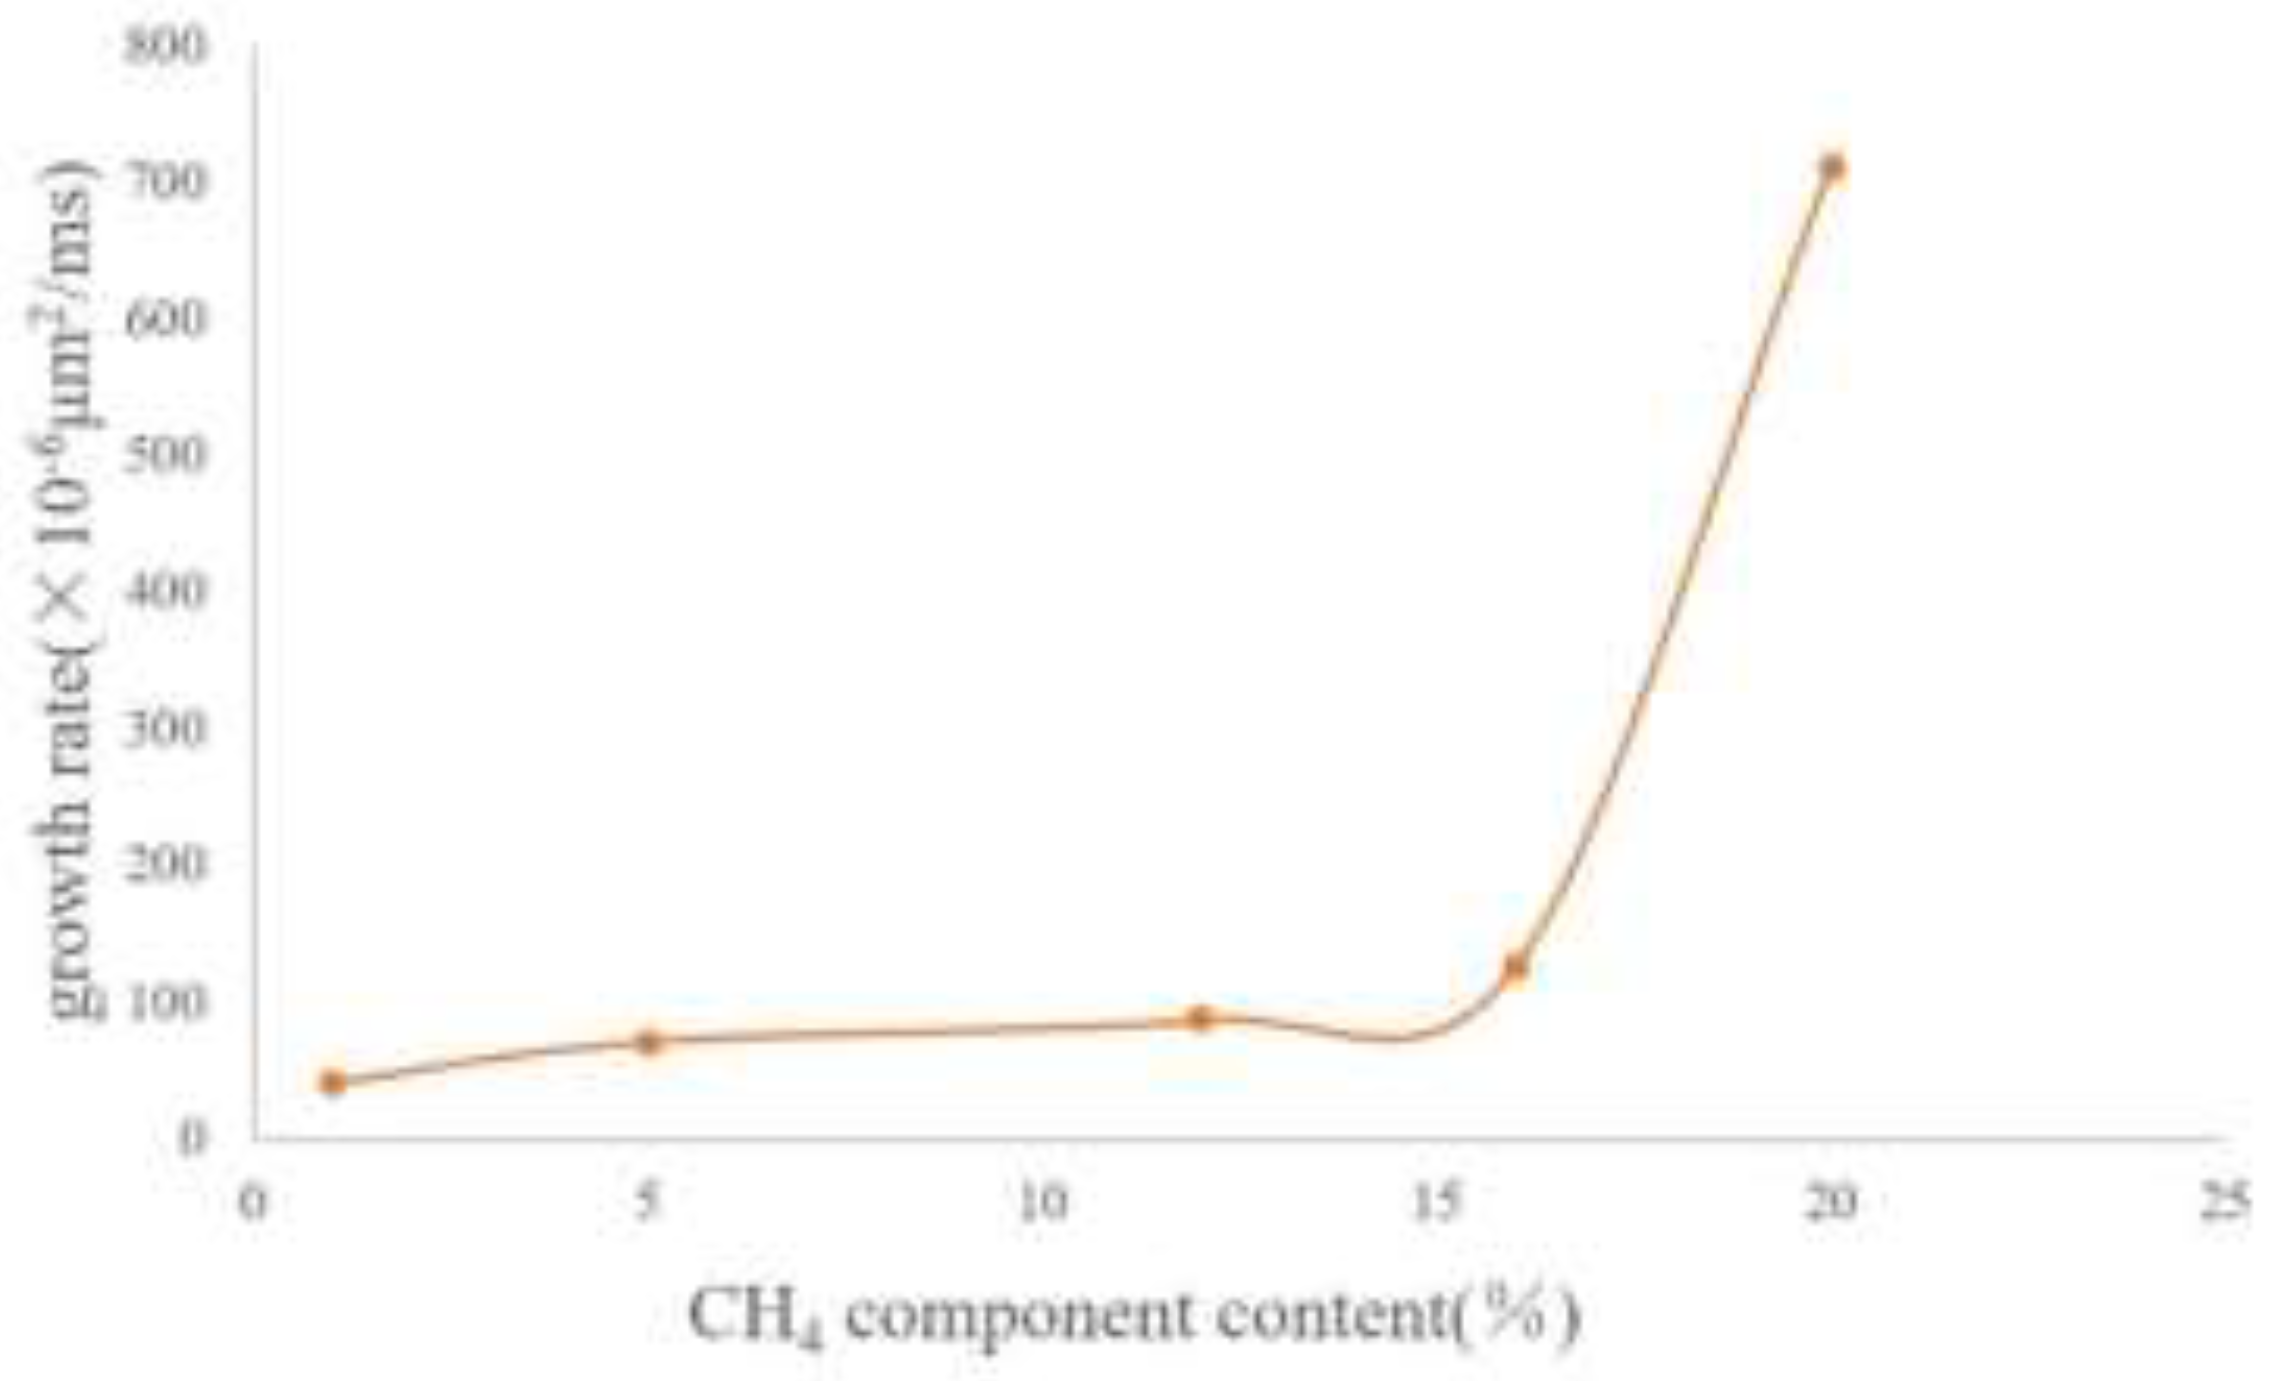
Figure 13.
Comparison diagram of bubble shapes under different viscosities
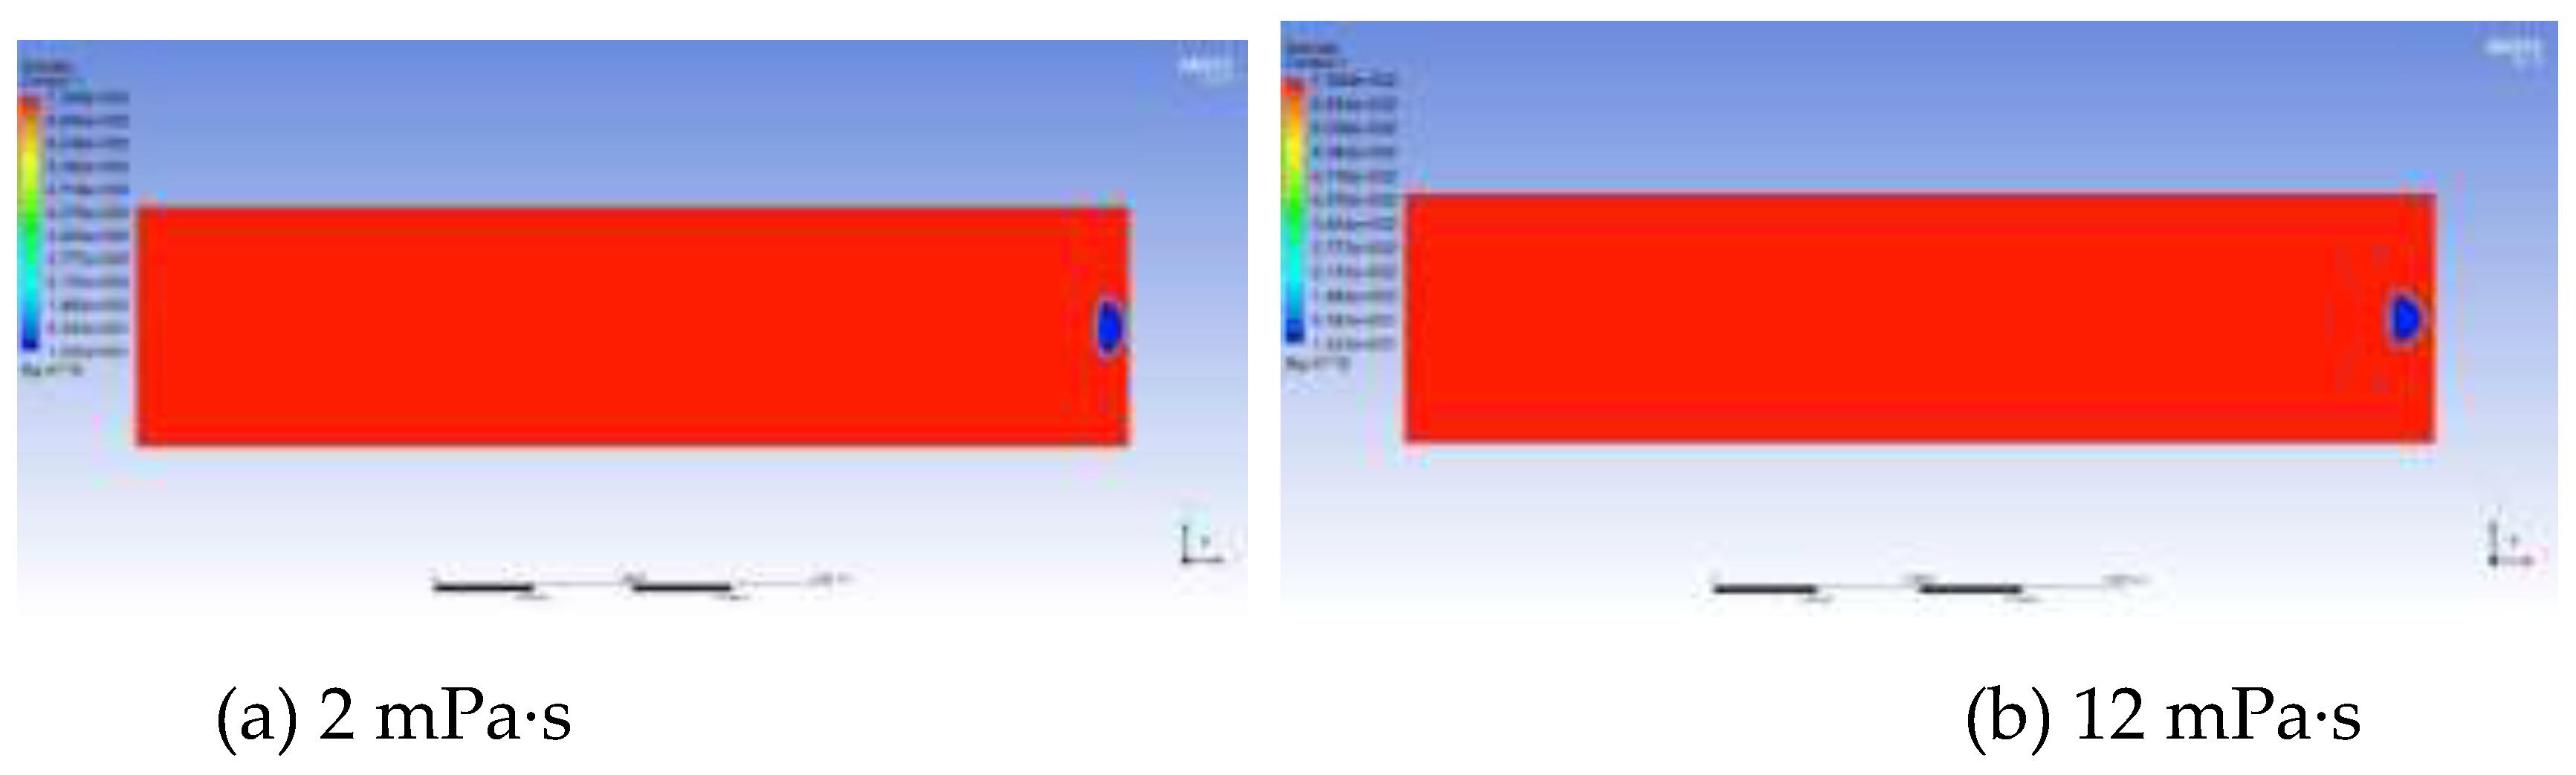
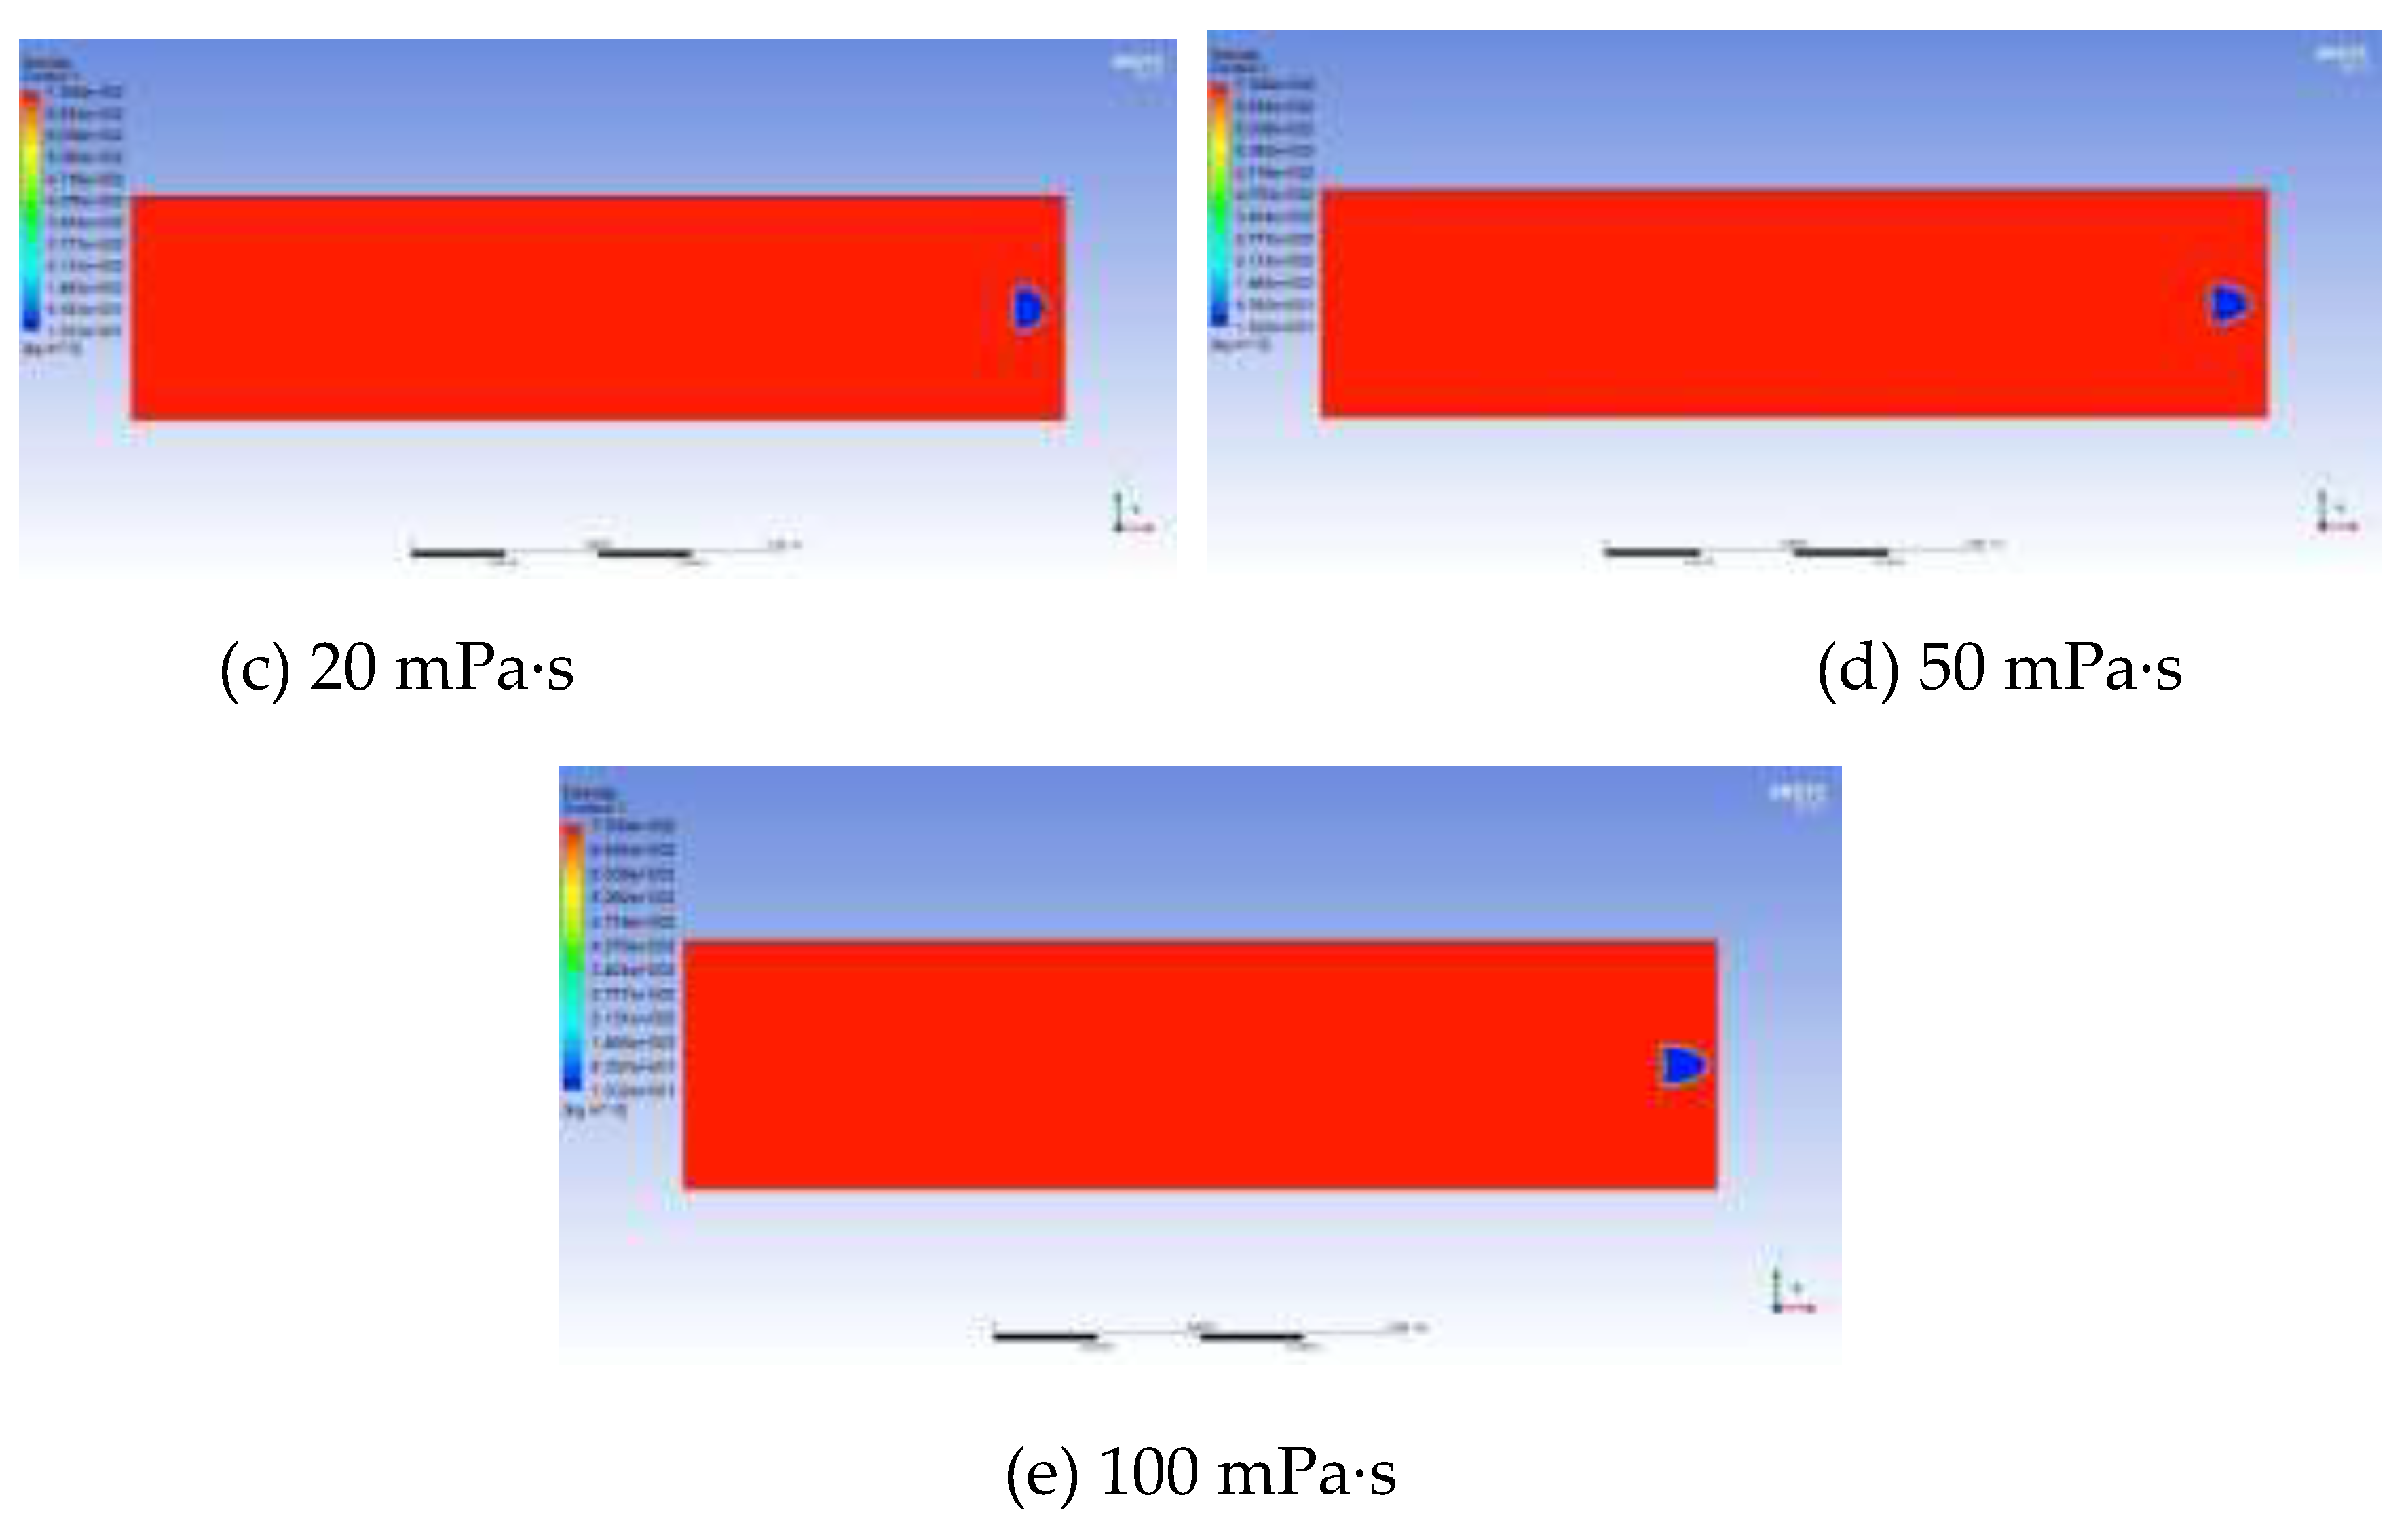
Figure 14.
The curve of bubble growth rate under different viscosities
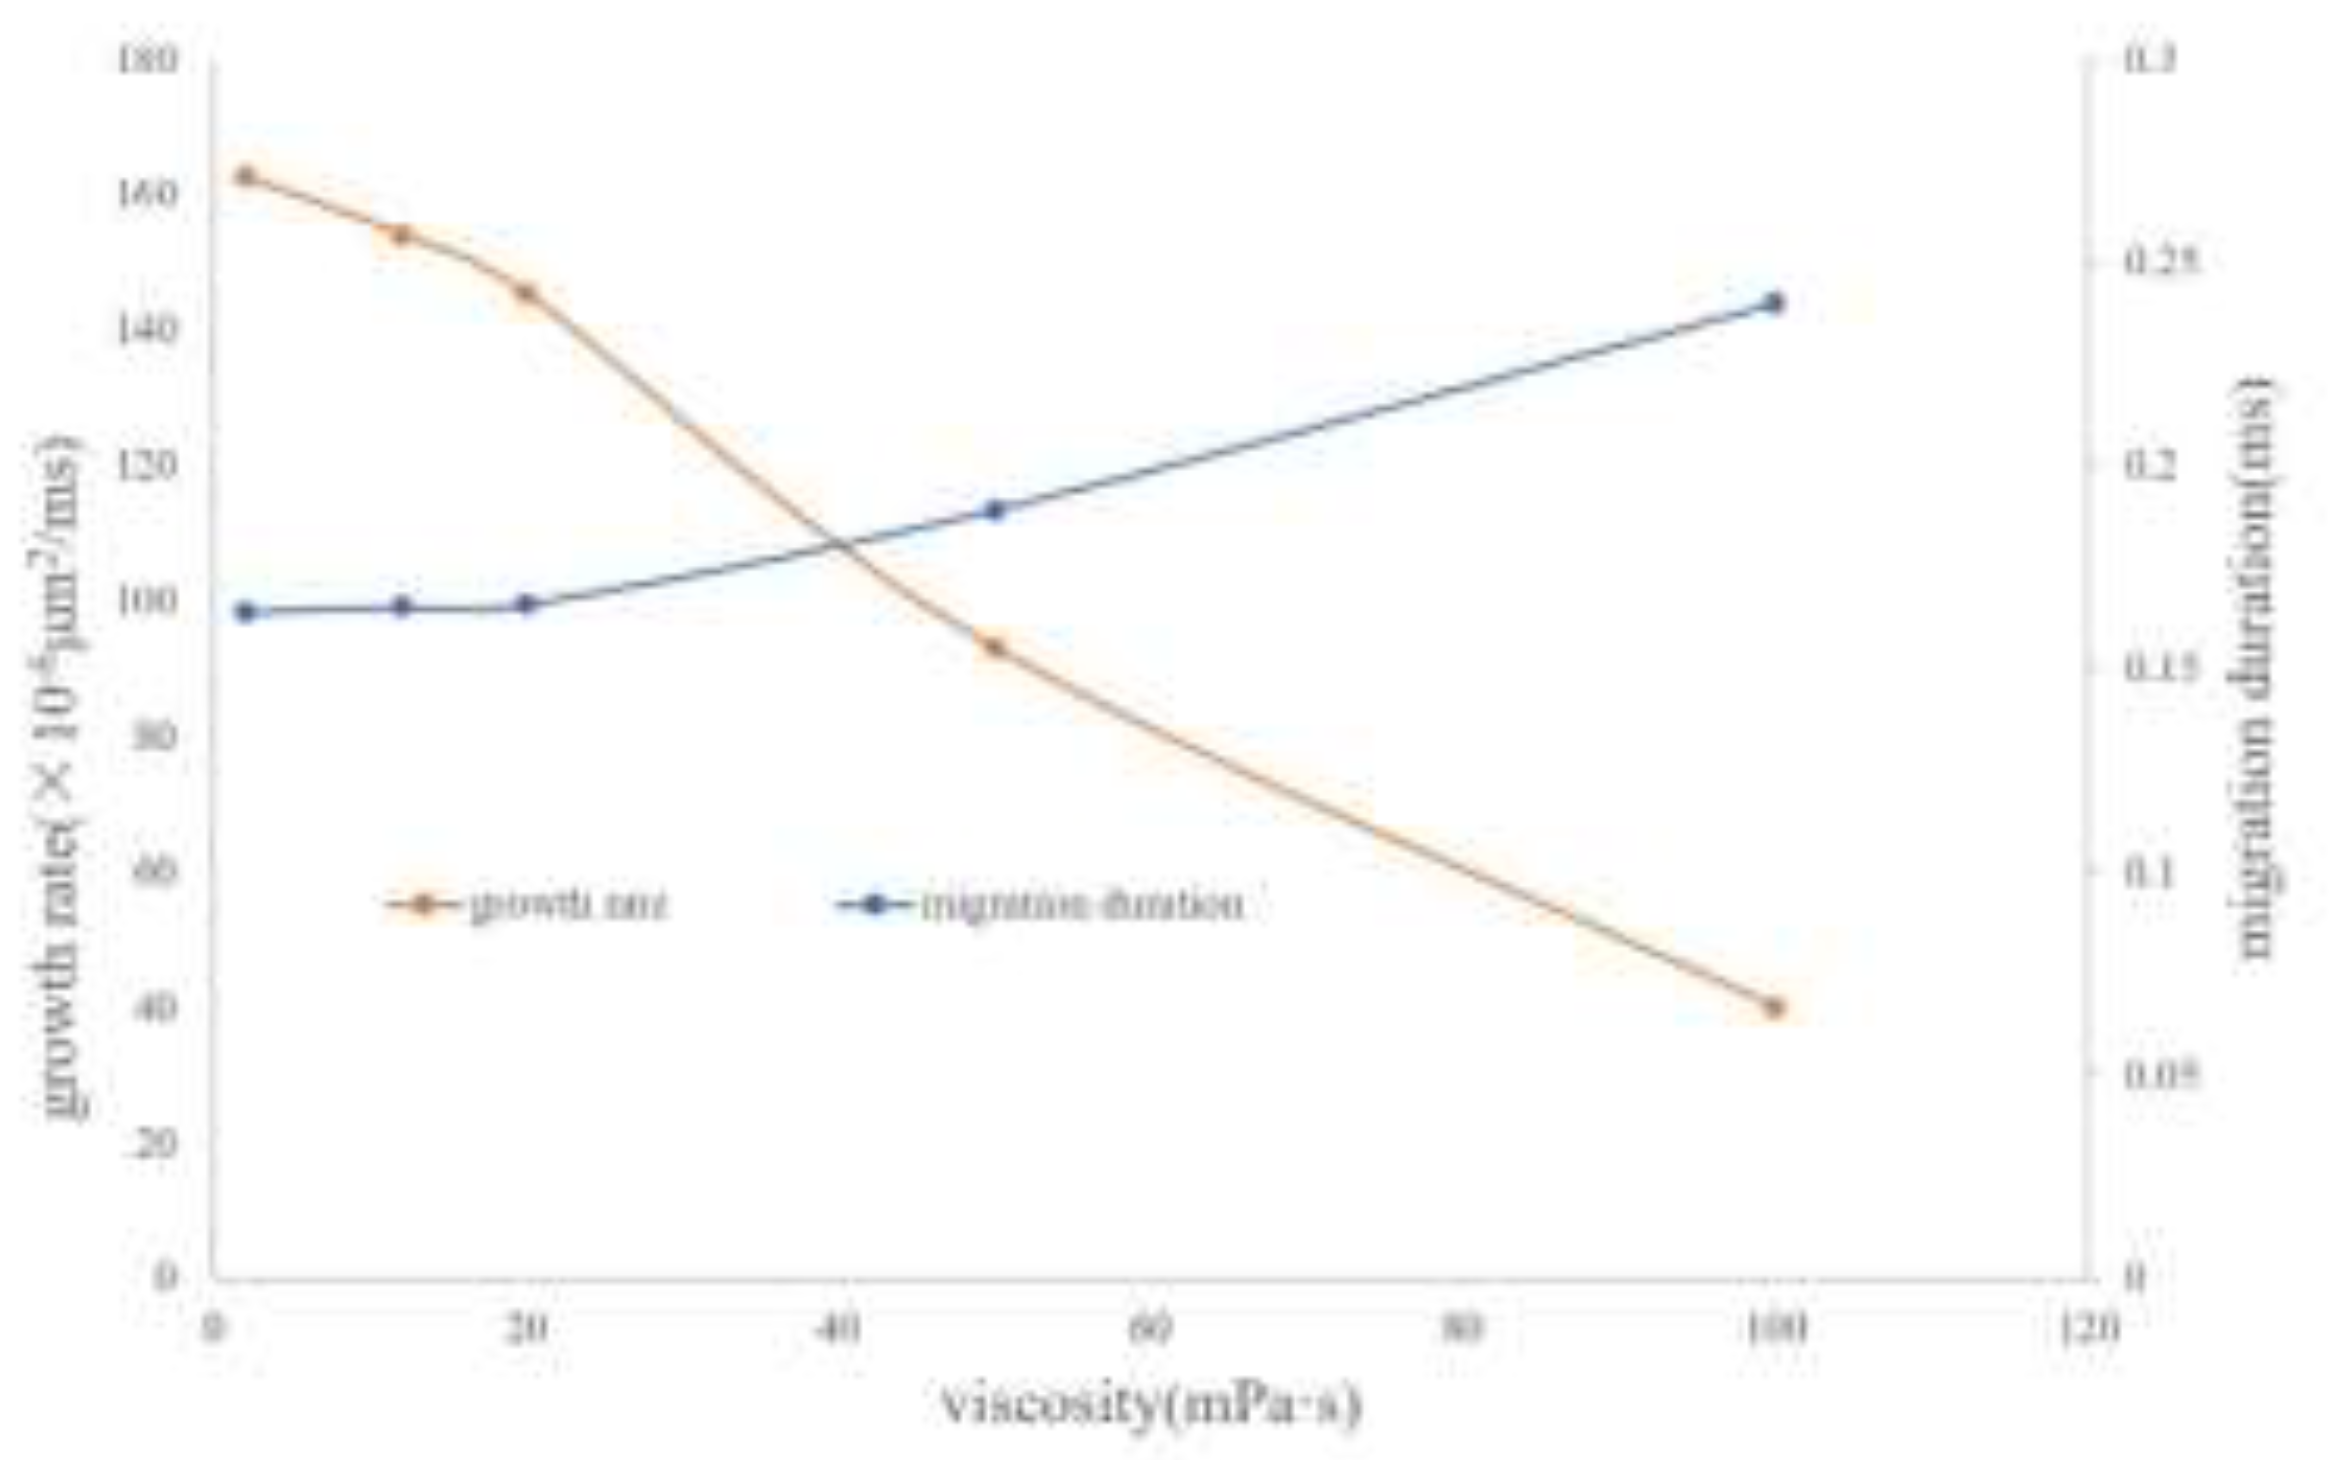
Figure 15.
Comparison diagram of bubble shapes under different interfacial tensions
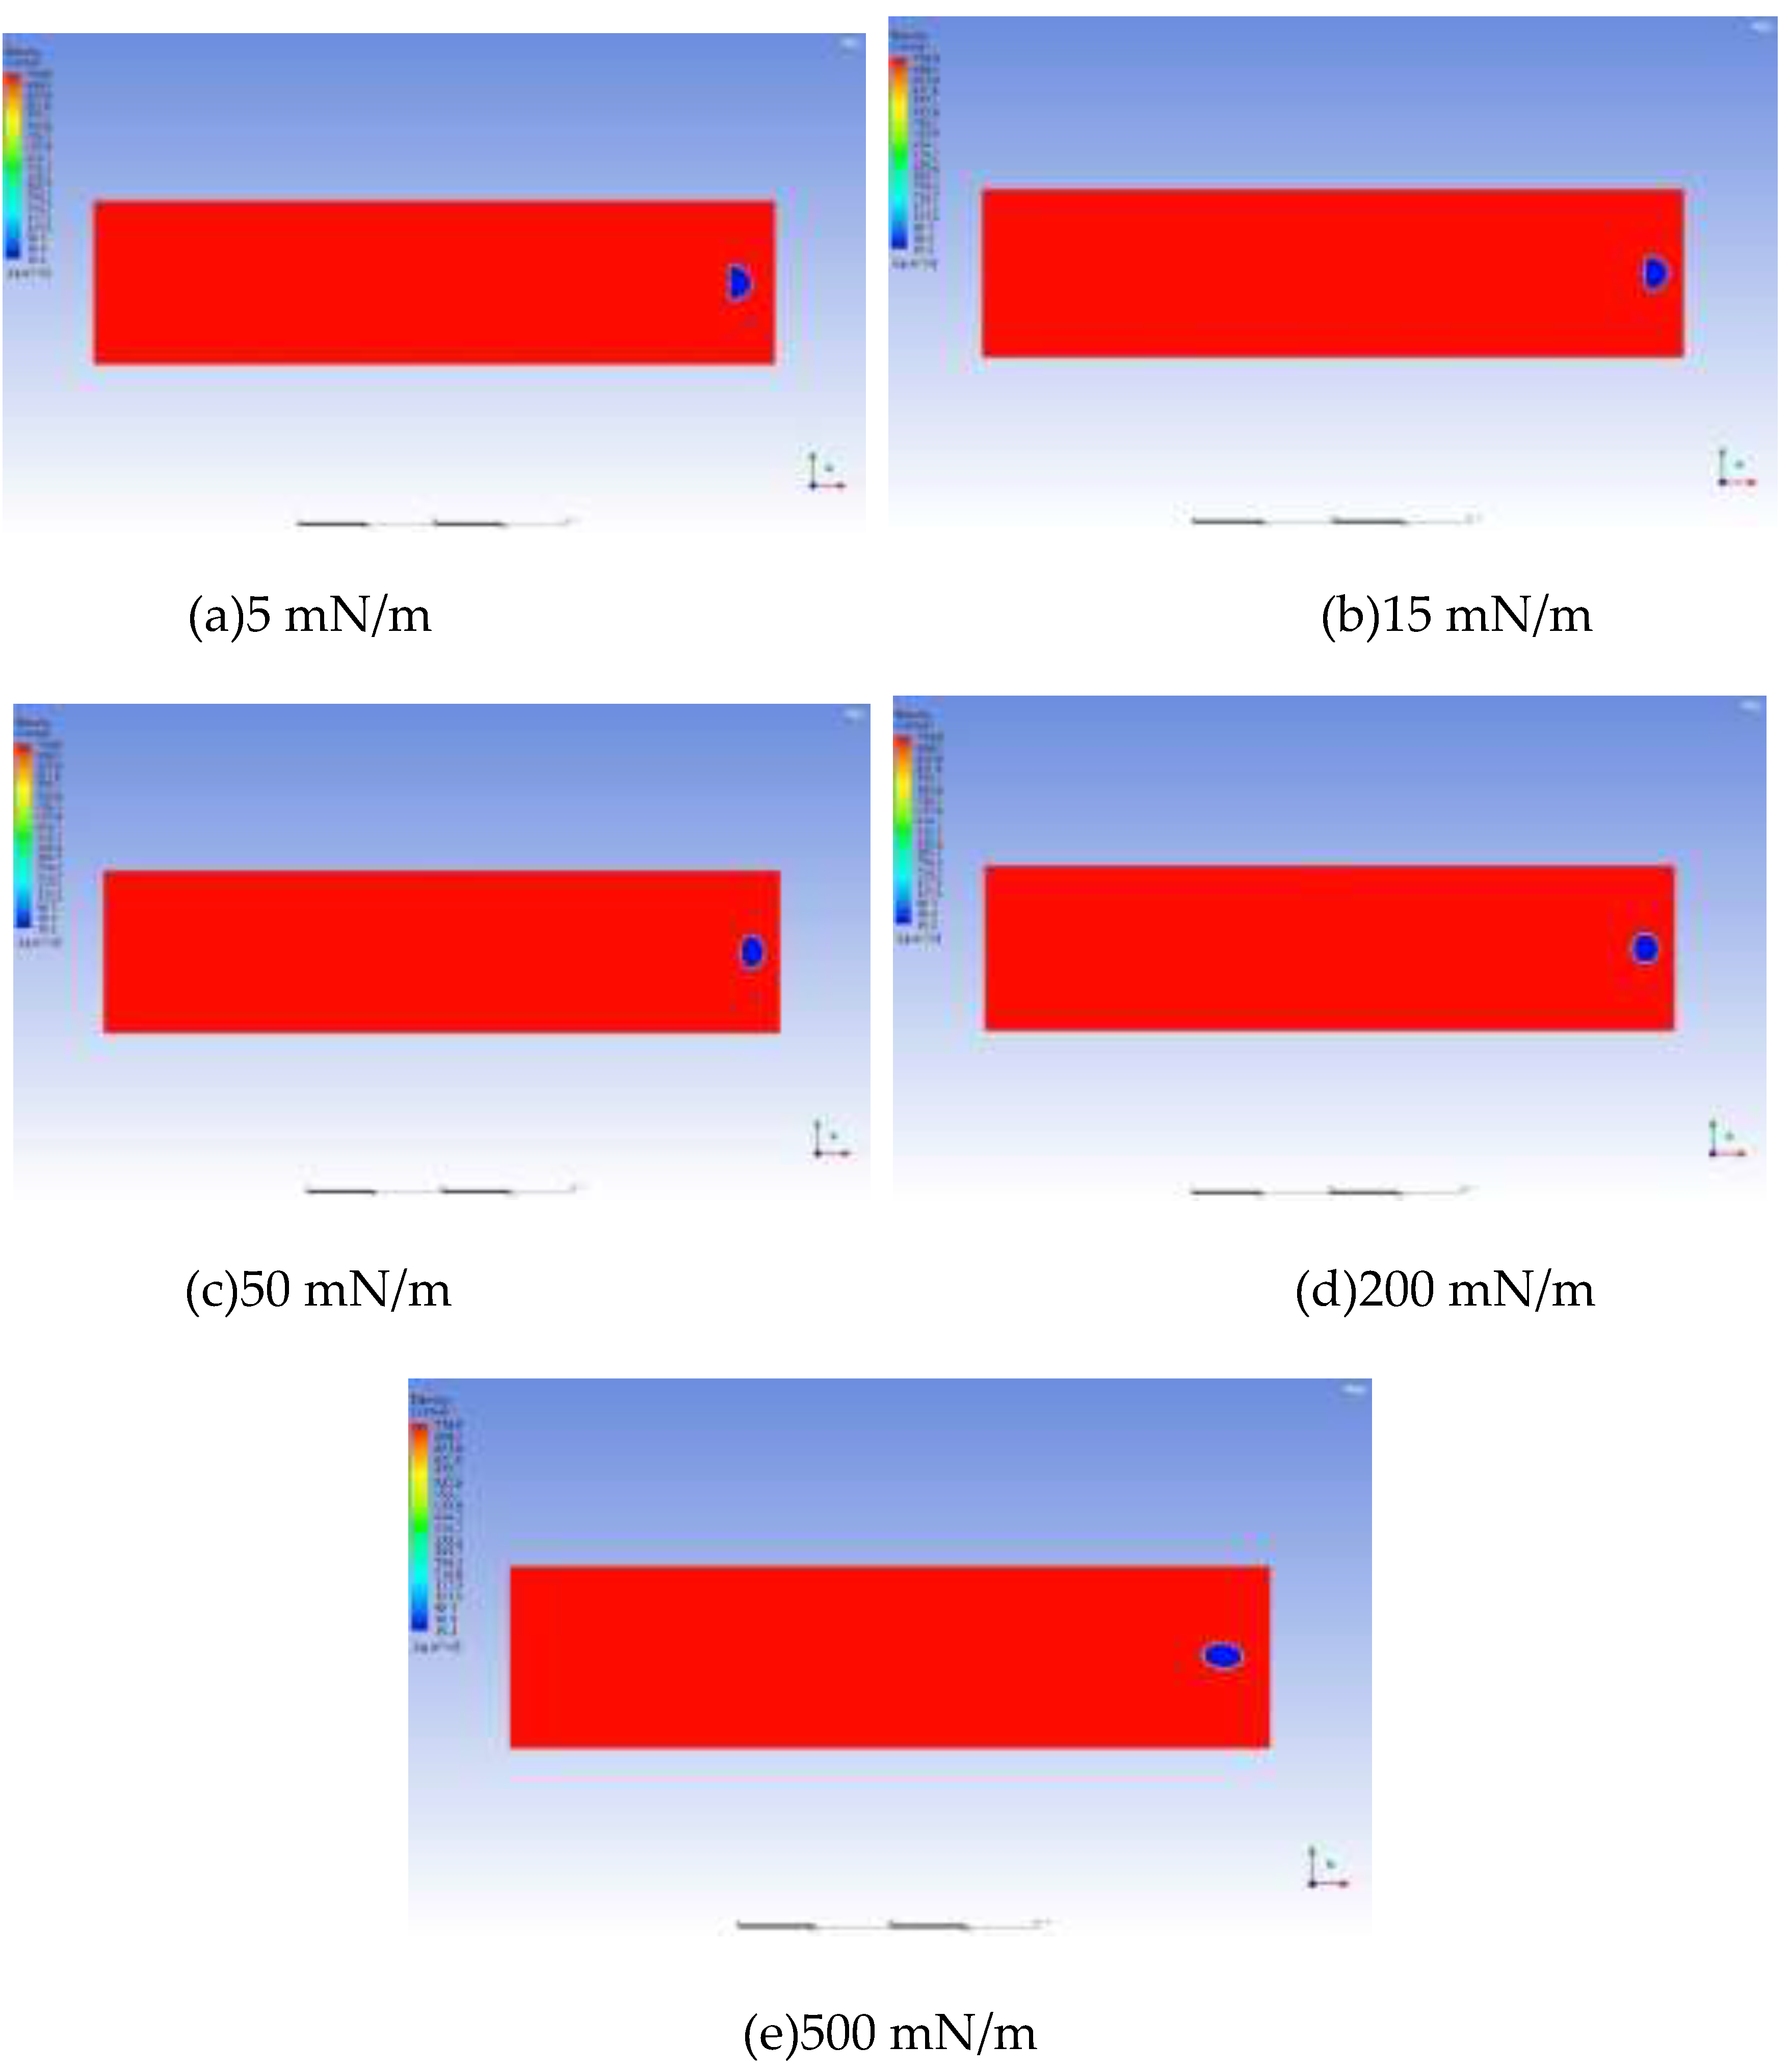
Figure 16.
The curve of bubble growth rate under different interfacial tensions
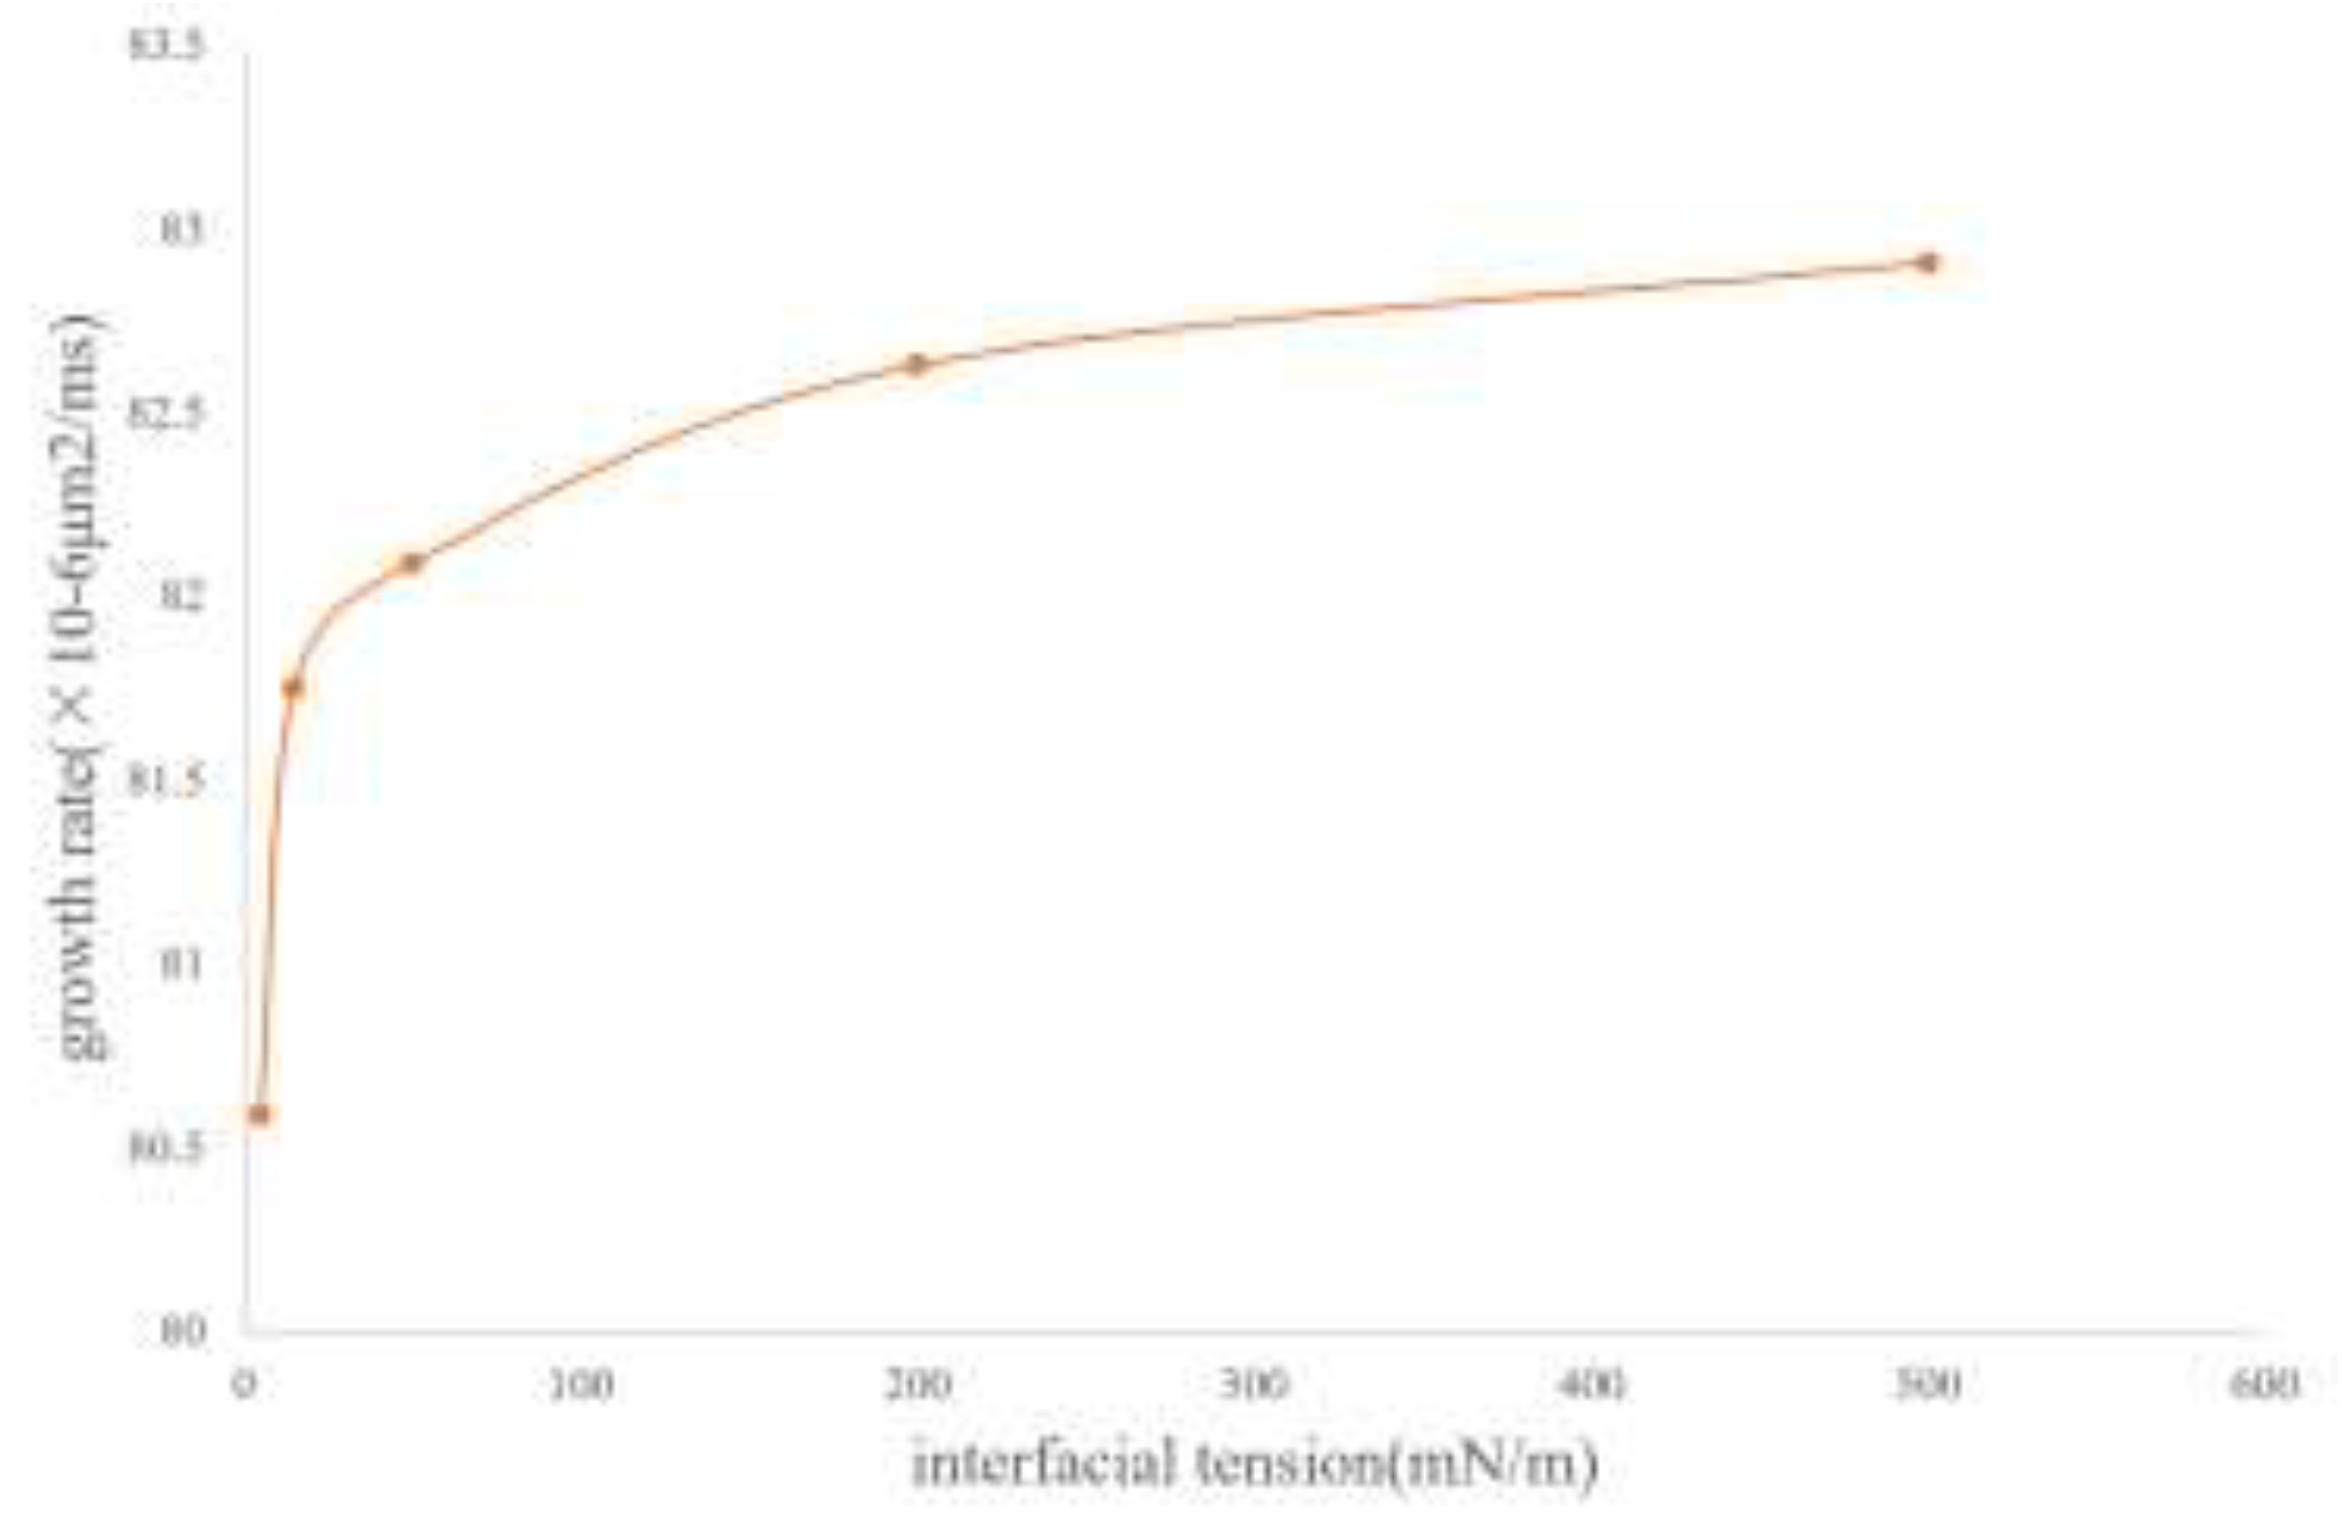

Table 1.
Analysis of degassed crude oil components
| component | Components for the preparation of simulated oil | weight ratio % |
|---|---|---|
| H2S、CO2、N2 | / | 0.00 |
| C1~ C9 | / | 0.00 |
| C10~ C19 | C10 | 17.05 |
| C20~ C29 | C20 | 23.95 |
| C30+ | C30 | 59.00 |
| 合计 | C10、C20、C30 | 100.00 |
Table 2.
Natural gas composition table
| component | weight ratio % |
| CH4 | 85 |
| C2~C3 | 10 |
| C4 | 5 |
Disclaimer/Publisher’s Note: The statements, opinions and data contained in all publications are solely those of the individual author(s) and contributor(s) and not of MDPI and/or the editor(s). MDPI and/or the editor(s) disclaim responsibility for any injury to people or property resulting from any ideas, methods, instructions or products referred to in the content. |
© 2025 by the authors. Licensee MDPI, Basel, Switzerland. This article is an open access article distributed under the terms and conditions of the Creative Commons Attribution (CC BY) license (http://creativecommons.org/licenses/by/4.0/).
Copyright: This open access article is published under a Creative Commons CC BY 4.0 license, which permit the free download, distribution, and reuse, provided that the author and preprint are cited in any reuse.


