Submitted:
18 September 2025
Posted:
18 September 2025
You are already at the latest version
Abstract
State of the art historical global burned area (BA) products largely rely on MODIS data, offering long temporal coverage but limited spatial resolution. As a result, small fires and complex landscapes remain underrepresented in global fire history reconstructions. By contrast, Landsat provides the only continuous satellite record extending back to the 1980s with substantially finer resolution, yet its use at global scale has long been hindered by infrequent revisits, cloud contamination, massive data volumes, and processing challenges. We compared MODIS FireCCI51 with the only existing Landsat-based product, GABAM, in a mountainous region, showing that the latter detects a higher number of burn scars, including small events, with higher Producer’s Accuracy (0.68 vs. 0.08) and similar User’s Accuracy (0.85 vs 0.83). These results emphasize the value of Landsat for reconstructing past fire regimes. Crucially, recent advances in cloud computing, data cubes, and processing pipelines now remove many of the former barriers to exploiting the Landsat archive globally. We argue that it is time to reconsider Landsat’s role and integrate it with MODIS-based routines to build comprehensive, accurate databases of historical fire activity, ultimately enabling improved understanding of long-term global fire dynamics.
Keywords:
burned area
; validation
; FireCCI
; GABAM
; time-series
; mountains
1. Introduction
The rapid development of Earth Observation technology has enabled an era of continuous, global-scale monitoring of both sea and land surface dynamics, as well as atmospheric processes [1]. However, reconstructing long-term trends and predicting future changes requires consistent and comparable time series data. While some long-term satellite datasets exist, their applicability can be limited by the sensors’ original design. A prime example is burned area mapping [2], where several global inventories leveraging various satellite data sources have been released, such as the ESA’s Climate Change Initiative Fire Disturbance (FireCCI) suite (thirteen datasets available on https://climate.esa.int/en/projects/fire/, last accessed 02-09-2025) and the MODIS Standard Fire series (Active Fire and Burned Area products retrievable on https://modis-fire.umd.edu, last accessed 02-09-2025), among the most widely used. These products serve as base inputs for integrated, higher-level models like the Global Fire Emissions Database (currently at version 5, see https://www.globalfiredata.org, last accessed 02-09-2025).
Despite continuous improvements of burned area inventories, two key requirements for meeting the fire monitoring objectives defined by GCOS (Global Climate Observing System) Essential Climate Variables (https://gcos.wmo.int/en/essential-climate-variables/fire, last accessed 02-09-2025) persist: achieving higher spatial resolution and extending time series data [3,4,5]. Several researchers emphasize the importance of including small fires due to their environmental impacts far exceeding their local context, especially in mountainous regions and in dense agricultural areas, as well as their role in defining recent fire regimes and their recent shifts, and quantifying regional and global atmospheric emissions and forest loss [6,7,8,9,10,11]. While specific user communities may prioritize one improvement over the other, achieving both with the data accumulated in the past satellite history remains challenging. For example, addressing the issue of dataset length, FireCCILT11 by Oton et al. [12] combines data from different sensors spanning in total 36 years, but at the relatively coarse spatial resolution (0.05 degrees). Efforts to include smaller fires often integrate information from thermal sensors (e.g., MODIS, VIIRS, ATSR) allowing detection of fires below the nominal resolution of final products [8,13]. Additionally, images from the Landsat program, offering the longest-running consistent multispectral data at 30 m resolution since the mid-1980s, have been employed to build historical burned area datasets. However, despite the potential applicability to the global scale, Landsat-based initiatives focused on restricted regions. Prominent examples among numerous ones are the MapBiomas Fire product from Brazil [14], the Burned Area Essential Climate Variable (BAECV) developed by Hawbaker et al. [15] and the Monitoring Trends in Burn Severity (MTBS) program for the conterminous United States [16] (see https://www.mtbs.gov, last accessed 02-09-2025). To date, the only freely-available, consistent global burned area product developed using the historical Landsat archive is the Global Annual Burned Area Maps (GABAM) by Long et al. [17]. The main limitation of the Landsat archive for reconstructing historical fire inventories is its relatively low temporal resolution, with a nominal revisit cycle of 16 days. Because fire effects on the land surface are often short-lived, the delay between the fire event and the first cloud-free acquisition may prevent timely detection of burn scars [18,19]. Moreover, the change detection process is further complicated by the potential confusion of burned areas with other surface disturbances, including clear-cutting, flooding, agricultural cycles, shadows, and vegetation senescence [5,20,21,22].
Validating burned area inventories derived from satellite data is crucial for assessing their reliability, usability, and guiding future enhancements. While robust validation protocols for global products that specifically consider the localized and temporary spatiotemporal nature of burned areas have been established and continually evolve [23,24,25], sampling design often focus on major flammable biomes while neglecting other important burning environments such as agricultural areas [26,27,28], circumpolar boreal forests and tundra [29,30] or fragile mountainous regions [31,32]. For example, if we look at BARD—an updatable standard database of burned areas distributed globally to be used as reference sites [33]—a random sampling approach stratified across terrestrial ecoregions as defined by Olson’s classification [34] was employed. However, in some cases, systematic or convenience sampling was used to account for rarer land cover classes and particular fire season conditions which have little probability to be selected using the primary sampling approach. We argue that this type of adaptations to improve inclusivity of all burning conditions on Earth should be encouraged. By considering assessments that focus on specific regions with challenging mapping conditions, we can provide valuable insights into global burned area products strengths and limitations.
This study aims to evaluate two recently released global burned area products: GABAM [17] and FireCCI51 [13] in a biodiversity hotspot and fire-prone mountainous area characterized by frequent, small fires. These products were selected based on three key attributes: they offer global coverage, span at least two decades prior to the Sentinel-2 era, and are delivered at a relatively high spatial resolution. A central motivation of this work is that, to date, the Landsat archive has remained largely underutilized in the development of global burned area products for the pre-Sentinel period. Here, we investigate its performance and assess its potential for the improvement of global applications. Given the difficulties associated with burned area detection in this region [19] and more generally, remote sensing application in heterogeneous landscapes [35,36], this study contributes to a more comprehensive understanding of these new inventories’ capabilities and limitations, providing valuable insights for future advancements in global burned area extraction approaches using satellite imagery.
2. Materials and Methods
2.1. Study Region
Northwest Yunnan is a mountainous region in southwest China located between approximately 24.5°N–29.5°N latitude and 98°E–101.5°E longitude (Figure 1a), covering an area of over 67,000 square km, almost as big as a country such as Sierra Leone. The region is renowned for its rich biological and cultural diversity dwelling within a highly heterogeneous landscape. The dominant vegetation types include needleleaved forests (Pinus, Picea, Abies), subtropical evergreen broadleaved forests (Lithocarpus, Castanopsis, Quercus), as well as shrubs, grasslands, arid savannas, and alpine meadows [37,38]. The climate is under the influence of the East Asian monsoon providing distinct wet and dry seasons. The dry season, from November to May, coupled with strong wind, elevates the region’s susceptibility to fire [39]. The prevalence of fire-adapted Pinus yunnanensis [40] further exacerbates this proneness. Annually, unauthorized human-caused fires (negligence, accidents) burn relatively small patches of wildland, making northwest Yunnan a hotspot for fire activity in Yunnan province and China as a whole [41].
2.2. Dataset Selection and Processing
FireCCI51 was developed by Lizundia-Loiola and colleagues [13] as part of the ESA Fire Disturbance Climate Change Initiative framework. The algorithm combines information from both MODIS thermal channels and near-infrared reflectances, as well as land cover maps from the Land Cover CCI project, generates spatio-temporal clusters of potential fires that will be then filtered according to adaptive thresholds, and finally applies a contextual region growing algorithm to detect the perimeter on the burned patches. We obtained the monthly pixel products, which have a spatial resolution of 250 meters and cover the period 2001-2020. Those products provide information on detection time, confidence level, and the land cover for burned pixels.
GABAM [17] is a Landsat-based product generated using Google Earth Engine. Its burned area map generation routine includes the computation of spectral indices from the images’ reflectance bands, a Random Forest model [42] calculating per-pixel burn probabilities, a conditional filtering step based on bi-yearly comparisons of specific derived metrics, and a Region Growing process to obtain final burned areas. The delivered product consists of annual binary grids (burned/unburned) with a 30-meter spatial resolution, spanning 1985 to 2021.
Following Fornacca et al. [32], we spatially and temporally aggregated neighboring burned pixels from the original raster products to form vector polygons representing single fire events. Although FireCCI51 provides detection date and time for each burned pixel, to allow for comparability with GABAM the temporal window for the aggregation was set to one calendar year. Moreover, we established a minimum burned area of 1 pixel (62,500 square meters) from the lower resolution dataset (i.e., FireCCI51), after verifying the existence of such small detections. Consequently, smaller polygons in the GABAM dataset were excluded from the analyses. Finally, due to uncertainties in burned area detection within agricultural areas and for consistency with previous evaluations in this region [32], we excluded polygons detected over agricultural fields using the decadal GlobeLand30 [43] and the annual LC_cci v2.0.7 [44] land cover datasets.
2.2. Evaluation Method
To evaluate the products’ ability to detect burned areas, we conducted a year-by-year assessment from 2001 to 2019 using a 10-km grid overlaying the study area as in Fornacca et al. 2020 [19]. Based on GlobeLand30, sample squares with more than 50% non-vegetated land cover (bare, snow, urban, water) as well as agricultural land were excluded, resulting in 430 valid sample squares (Figure 1b). We categorized sample squares by high and low fire frequency with adapted thresholds for each year based on MODIS MCD14ML thermal anomalies detections [45] within vegetated areas. Because of the extremely skewed distributions resulting from the localized nature of fire occurrences, the majority of sample squares didn’t include any thermal anomalies. Therefore, for each year, we excluded these squares from the threshold calculation and set the minimum number of detections necessary to qualify as “high fire frequency” to that of the 0.75 percentile. Afterwards, ten sample squares were randomly selected each year, evenly divided between high and low fire frequency squares.
For each selected sample square, three analysts visually interpreted all available Landsat and Sentinel-2 (post-2015) images within the corresponding year and manually digitized all detected burned areas to be used as reference. MCD14ML thermal anomalies and NWY_Fire_LS v2 [19], a fire inventory previously generated for northwest Yunnan using a specific fire extraction routine, aided with the mapping task. The latter model has an omission error of 20% and commission error of 22% in its v1, while v2 underwent an extensive visual revision of the dataset aiming at removing erroneous detections, significantly decreasing errors of commission (no specific metric provided). Due to the data gap between the decommissioning of Landsat 5 and the launch of Landsat 8, the years 2012 and 2013 were excluded from this evaluation.
Giving the particular obstacles for burned area detection in this kind of landscape, in particular rapidly fading burn scars that significantly limit the delimitation of full perimeters (reference), we opted for a simplified approach to assess performances. We focused our assessment on fire counts without evaluating the precision of the perimeters mapped by the two models. Successful detection (True Positives or TP) occurred when modeled and reference polygons intersected, regardless of the overlapping extent. Non detected fire events were tagged as False Negatives (FN) while erroneously mapped fires were counted as False Positives (FP). Based on these metrics, we calculated User’s Accuracy (), indicating the percentage of predicted positive cases that were correct, and Producer’s Accuracy (), reflecting how well the actual positive cases were identified by the model. To evaluate the impact of burned area size, we classified reference fire events into three categories, < 25 ha (approximately four FireCCI51 pixels), 25-100 ha, and > 100 ha and calculated PA for each. Finally, we assessed the spatial distribution of fires predicted by the two models as compared with MCD14ML and NWY_Fire_LS v2 by the means of correlation of fire counts within each 10-km sample grid. This analysis was done for the period 2001-2018, not including 2011, 2012 and 2013, to match the temporal coverage of the benchmark dataset NWY_Fire_LS v2.
All operations were performed using Google Earth Engine (https://earthengine.google.com/), the Python programming language, and QGIS software (https://www.qgis.org/).
3. Results
Of the 170 samples distributed across 17 years, 101 squares included at least one fire event. This demonstrates the effectiveness of stratified sampling using third-party fire frequencies data in maximizing the statistical representativeness of burned patches [25]. In total, 198 fire events were recorded in these squares and used as reference. FireCCI51 detected only 15 (PA = 0.08), while GABAM identified 135 (PA = 0.68). Both products achieved a User’s Accuracy of over 0.83 (Table 1), proving good skills in distinguishing from other types of landcover change. When looking at different fire sizes, FireCCI51 exhibited a noticeable decline in detection probability (PA) as burned area decreased, while GABAM performed consistently with fires smaller than 100 ha and significantly improved detection of larger fires (Table 2).
The correlation of fire frequency distribution within the 10-km with the two reference datasets was highly significant (p-value < 0.001) for both models. However, the coefficients were much higher for GABAM. The maps drawn in Figure 2 clearly show that fires occur in most part of the study region (reference datasets MDC14ML and NWY_Fire_LS v2) but FireCCI51 omits large areas of lower to moderate fire frequency.
4. Discussion
Northwest Yunnan, like many other alpine regions ranks among the most biodiversity-rich spots on Earth. Understanding the role and impacts of disturbances such as wildland fires is therefore of critical importance. In these fragile mountain ecosystems, even small-scale environmental changes can disrupt local ecological balance, alter species distributions, and reduce habitat resilience. Moreover, disturbances in alpine regions often have cascading effects beyond their boundaries: changes in vegetation cover can modify hydrological regimes, increase erosion risk, and trigger landslides, with consequences for the densely populated lowlands downstream. Given the ecological and socio-economic significance of these areas, assessing disturbance dynamics is essential both for biodiversity conservation and for maintaining ecosystem services such as water regulation and slope stability. A defining characteristic of mountainous regions is their high degree of landscape heterogeneity. This complexity poses significant challenges for remote sensing analyses, especially when detecting short-term land surface changes such as burn scars, where topography, variable illumination, frequent cloud cover, and fine-scale mosaics of vegetation can obscure or distort signals [19,36,46]. These challenges, combined with the predominance of small fires in the study region [19,47] have led to the relatively poor performance of global burned area products in a previous assessment [32] and in other regions with comparable landscape/fire characteristics [48,49]. Given these constraints, our evaluation focused on the detection of individual fire events rather than on the accuracy of burned area perimeters. This approach allows us to assess the capacity of each product to capture fire frequency, while not directly evaluating the precision of mapped burned extents.
The results highlighted contrasting capabilities between two leading global burned area products. FireCCI51 makes use of MODIS data at its highest resolution (250 meters), providing increased precision than other established burned area products such as MCD64A1 [50]. Being an improved version of its predecessor FireCCI41, it is acknowledged for better including smaller fires and increasing burned area estimation globally [13]. However, comparisons against modern higher resolution satellite products such as Sentinel-2 found very divergent accuracies among different biomes, with the lowest omission found in temperate savanna (33.8%), lowest commission in tropical savanna (29.5%), while the most problematic ecosystems were deserts & xeric shrublands with omission and commission errors reaching 98% and 40.8%, respectively [51]. The errors of omissions found in our study were higher than the predecessor FireCCI41 in rugged landscapes [32]. Limited performance of the current FireCCI51 was also reported in other heterogeneous or particularly challenging landscapes of the Mediterranean [52], the Amazon [53], areas dominated by croplands [54], tropical peatlands [55], high northern latitudes [56], and alpine regions [31], especially with decreasing burned area size. Because the size of fires is the main factor determining the accuracy of burned area products [57], spatial resolution and the trade-off between omission and commission errors significantly impact product performance in specific environments. Automated algorithms designed for global burned area extraction must concurrently accommodate diverse vegetation and landscape conditions, making it difficult to achieve optimal and consistent results across all scenarios. This is certainly one of the main contributing factors to differences in mapped burned areas from different models [20,53].
GABAM, using the Landsat archive, offers significantly higher spatial resolution than FireCCI51. However, this comes at the cost of temporal revisiting hindering certain applications such as the early detection and monitoring of ongoing fires [2,4]. Cloud cover further limits analyzable scenes, especially in regions with persistent cloudiness, seriously limiting the detection of rapidly recovering burn scars [58,59] and the analysis of seasonality trends, because day-of-burns cannot be accurately and systematically determined. Despite these challenges, GABAM demonstrated relatively strong performance, comparable to the local benchmark dataset from Fornacca and colleagues [19]. The few validations performed up to day have reported higher burned area mapped by GABAM with low commission error as compared to other global products, including FireCCI51 [53,60]. However, an analysis by Zubkova et al. [61] in three protected areas of South Africa, highlighted missing data issues in GABAM due to persistent cloud cover and inabilities in detecting scars in areas that burn frequently. During our evaluation, we observed heavy and frequent artifacts in GABAM likely due to issues with Landsat scene alignment, WRS-2 edges overlaps, and the use of Landsat-7 images post-SLC instrument failure, leaving the notorious no-data stripes clearly visible in the final product. Moreover, the documentation of GABAM, beyond the prototype year 2015 [17] and a few selected years [39], lacks comprehensive information on time-series generation, uncertainties assessment, and extensive independent validation. Considering the latter point, we recognize that our assessment process, primarily reliant on Landsat imagery—the same data source used by GABAM—introduces a potential bias favoring GABAM over FireCCI51. This constraint limits our ability to independently assess model accuracy, as the reference fire scars, derived from Landsat visual interpretation, may inherently reflect the same feature detection patterns as GABAM’s algorithm.
Despite significant advancements in contemporary Earth Observation, Landsat remains an invaluable resource for reconstructing past land surface dynamics. Newer sensors offer higher spatial resolution and, in some cases, cloud-penetrating capabilities, yet only Landsat provides a nearly four-decade-long, consistent record of moderate-resolution observations. This long archive makes it indispensable for historical analyses. By contrast, MODIS has been instrumental in numerous burned area applications, particularly thanks to its near-daily temporal coverage. However, its availability only since 2000 limits its usefulness for reconstructing longer fire histories. This limitation is particularly relevant because the importance of small fires, crucial for refining atmospheric emission estimates and assessing ecological impacts in heterogeneous landscapes, has been repeatedly emphasized by researchers and requested by the broader user community [5]. Several regionally focused, long-term burned area products based on Landsat have been developed [14,15,16], but GABAM remains the only effort to date that has attempted a global-scale solution. Substantial progress has also been made in developing change detection tools to reconstruct past disturbance and recovery patterns using Landsat time series, many of which are now implemented in Google Earth Engine [62,63,64,65,66,67,68]. However, unlike other applications such as grassland [69] or wetland [70] mapping, these tools have not yet delivered a finalized global and annual burned area product, other than GABAM.
Hybrid approaches that combine Landsat with other satellite data sources have also shown promise in historical burned area mapping [21,28,71,72]. MODIS is still the most suitable platform for producing consistent global burned area inventories, but fusing it with Landsat and complementary sensors offers a path to extending records back in time while improving the detection of smaller fires. For the pre-MODIS era, Landsat may again be combined with alternative missions, although the varying active periods of different satellites inevitably introduce inconsistencies in the final historical inventory. Nonetheless, the unifying thread across all approaches remains the Landsat archive, which provides an irreplaceable backbone for long-term reconstructions.
Addressing these challenges is essential for future burned area products that aspire to reach the quality and reliability standards required to serve as inputs for higher-level applications, including fire emission inventories and fire-enabled dynamic global vegetation models.
5. Conclusions
The datacube structure and computing power of Google Earth Engine have transformed large-scale data processing, making advanced analyses accessible to a broader research community. Machine learning algorithms and time-series tools that were once constrained by prohibitive computational demands are now widely applicable within this platform. Given this technological landscape, it is, to say the least, surprising that the full potential of the Landsat archive for reconstructing global-scale historical fire records remains largely unrealized. Our analysis highlights a critical conclusion: At the same time, Landsat’s limited temporal revisit strongly indicates that it should not be used in isolation. Instead, combining Landsat with other satellite data sources, tailored to their respective periods of availability, offers the most promising pathway to reconstruct fire history consistently back to the mid-1980s. We therefore urge the research community to make fuller use of the Landsat archive, not only in fire science but across Earth system disciplines, by integrating it with complementary datasets to advance our understanding of past global land surface dynamics and their implications for ecological and climate processes.
Author Contributions
Conceptualization, D.F and W.X.; methodology, D.F.; validation, W.X.; formal analysis, D.F., Y.Y. and X.L.; investigation, D.F.; resources, W.X.; data curation, D.F., Y.Y. and X.L.; writing—original draft preparation, D.F.; writing—review and editing, D.F., Y.Y., X.L. and W.X.; visualization, D.F., Y.Y.; supervision, W.X.; project administration, W.X.; funding acquisition, D.F and W.X.
Funding
This work was supported by the Swiss National Science Foundation (P500PB_214369), the National Natural Science Foundation of China (3241101652), and the Project for Talent and Platform of Science and Technology in Yunnan Province Science and Technology Department (202105AM070008; 202205AM070007).
Data Availability Statement
All datasets are freely available on the Internet. References and links are mentioned in the manuscript.
Acknowledgments
The authors would like to express their gratitude and admiration to all individuals contributing to the advancement of Earth Observation science and deepening our understanding of nature. During the preparation of this manuscript/study, the author(s) used the free service Gemini (https://gemini.google.com/) to improve the language in some parts of the manuscript. The authors have reviewed and edited the output and take full responsibility for the content of this publication.
Conflicts of Interest
The authors declare no conflicts of interest. The funders had no role in the design of the study; in the collection, analyses, or interpretation of data; in the writing of the manuscript; or in the decision to publish the results.
References
- Zhao, Q.; Yu, L.; Du, Z.; Peng, D.; Hao, P.; Zhang, Y.; Gong, P. An Overview of the Applications of Earth Observation Satellite Data: Impacts and Future Trends. Remote Sens 2022, 14. [Google Scholar] [CrossRef]
- Chuvieco, E.; Aguado, I.; Salas, J.; García, M.; Yebra, M.; Oliva, P. Satellite Remote Sensing Contributions to Wildland Fire Science and Management. Curr. For. Rep. 2020, 6, 81–96. [Google Scholar] [CrossRef]
- Pettinari, M.L.; Lizundia-Loiola, J.; Khairoun, A.; Roteta, E.; Storm, T.; Boettcher, M.; Danne, O.; Brockmann, C.; Chuvieco, E. Global and Continental Burned Area Detection from Remote Sensing: The FireCCI Products. In Proceedings of the EGU General Assembly 2023, Vienna, Austria; 2023. [Google Scholar]
- Mouillot, F.; Schultz, M.G.; Yue, C.; Cadule, P.; Tansey, K.; Ciais, P.; Chuvieco, E. Ten Years of Global Burned Area Products from Spaceborne Remote Sensing-A Review: Analysis of User Needs and Recommendations for Future Developments. Int. J. Appl. Earth Obs. Geoinf. 2014, 26, 64–79. [Google Scholar] [CrossRef]
- Chuvieco, E.; Mouillot, F.; van der Werf, G.R.; San Miguel, J.; Tanasse, M.; Koutsias, N.; García, M.; Yebra, M.; Padilla, M.; Gitas, I.; et al. Historical Background and Current Developments for Mapping Burned Area from Satellite Earth Observation. Remote Sens Env. 2019, 225, 45–64. [Google Scholar] [CrossRef]
- van der Velde, I.R.; van der Werf, G.R.; van Wees, D.; Schutgens, N.A.J.; Vernooij, R.; Houweling, S.; Tonucci, E.; Chuvieco, E.; Randerson, J.T.; Frey, M.M.; et al. Small Fires, Big Impact: Evaluating Fire Emission Estimates in Southern Africa Using New Satellite Imagery of Burned Area and Carbon Monoxide. Geophys Res Lett 2024, 51. [Google Scholar] [CrossRef]
- van Wees, D.; van der Werf, G.R.; Randerson, J.T.; Andela, N.; Chen, Y.; Morton, D.C. The Role of Fire in Global Forest Loss Dynamics. Glob Chang Biol 2021, 27, 2377–2391. [Google Scholar] [CrossRef] [PubMed]
- Randerson, J.T.; Chen, Y.; Van der Werf, G.R.; Rogers, B.M.; Morton, D.C. Global Burned Area and Biomass Burning Emissions from Small Fires. J Geophys Res Biogeosci 2012, 117, 1–23. [Google Scholar] [CrossRef]
- Ramo, R.; Roteta, E.; Bistinas, I.; van Wees, D.; Bastarrika, A.; Chuvieco, E.; van der Werf, G.R. African Burned Area and Fire Carbon Emissions Are Strongly Impacted by Small Fires Undetected by Coarse Resolution Satellite Data. Proc Natl Acad Sci U S A 2021, 118. [Google Scholar] [CrossRef]
- Liu, T.; Mickley, L.J.; Marlier, M.E.; DeFries, R.S.; Khan, M.F.; Latif, M.T.; Karambelas, A. Diagnosing Spatial Biases and Uncertainties in Global Fire Emissions Inventories: Indonesia as Regional Case Study. Remote Sens Env. 2020, 237, 111557. [Google Scholar] [CrossRef]
- Khairoun, A.; Mouillot, F.; Chen, W.; Ciais, P.; Chuvieco, E. Coarse-Resolution Burned Area Datasets Severely Underestimate Fire-Related Forest Loss. Sci. Total Environ. 2024, 920, 170599. [Google Scholar] [CrossRef]
- Otón, G.; Lizundia-Loiola, J.; Pettinari, M.L.; Chuvieco, E. Development of a Consistent Global Long-Term Burned Area Product (1982–2018) Based on AVHRR-LTDR Data. Int. J. Appl. Earth Obs. Geoinf. 2021, 103. [Google Scholar] [CrossRef]
- Lizundia-Loiola, J.; Otón, G.; Ramo, R.; Chuvieco, E. A Spatio-Temporal Active-Fire Clustering Approach for Global Burned Area Mapping at 250 m from MODIS Data. Remote Sens Env. 2020, 236, 111493. [Google Scholar] [CrossRef]
- Souza, C.M.; Shimbo, J.Z.; Rosa, M.R.; Parente, L.L.; A. Alencar, A.; Rudorff, B.F.T.; Hasenack, H.; Matsumoto, M.; G. Ferreira, L.; Souza-Filho, P.W.M.; et al. Reconstructing Three Decades of Land Use and Land Cover Changes in Brazilian Biomes with Landsat Archive and Earth Engine. Remote Sens (Basel) 2020, 12, 2735. [Google Scholar] [CrossRef]
- Hawbaker, T.J.; Vanderhoof, M.K.; Schmidt, G.L.; Beal, Y.J.; Picotte, J.J.; Takacs, J.D.; Falgout, J.T.; Dwyer, J.L. The Landsat Burned Area Algorithm and Products for the Conterminous United States. Remote Sens Env. 2020, 244, 111801. [Google Scholar] [CrossRef]
- Eidenshink, J.; Schwind, B.; Brewer, K.; Zhu, Z.; Quayle, B.; Howard, S. A Project for Monitoring Trends in Burn Severity. Fire Ecol. Spec. Issue 2007, 3. [Google Scholar] [CrossRef]
- Long, T.; Zhang, Z.; He, G.; Jiao, W.; Tang, C. 30 m Resolution Global Annual Burned Area Mapping Based on Landsat Images and Google Earth Engine. Remote Sens (Basel) 2019, 11, 489. [Google Scholar] [CrossRef]
- Verbyla, D.L.; Kasischke, E.S.; Hoy, E.E. Seasonal and Topographic Effects on Estimating Fire Severity from Landsat TM/ETM+ Data. Int J Wildland Fire 2008, 17, 527. [Google Scholar] [CrossRef]
- Fornacca, D.; Ren, G.; Xiao, W. Small Fires, Frequent Clouds, Rugged Terrain and No Training Data: A Methodology to Reconstruct Fire History in Complex Landscapes. Int J Wildland Fire 2020. [Google Scholar] [CrossRef]
- Humber, M.L.; Boschetti, L.; Giglio, L.; Justice, C.O. Spatial and Temporal Intercomparison of Four Global Burned Area Products. Int J Digit Earth 2019, 12, 460–484. [Google Scholar] [CrossRef]
- Boschetti, L.; Roy, D.P.; Justice, C.O.; Humber, M.L. MODIS-Landsat Fusion for Large Area 30m Burned Area Mapping. Remote Sens Env. 2015, 161, 27–42. [Google Scholar] [CrossRef]
- Key, C.H.; Benson, N.C. Landscape Assessment: Ground Measure of Severity, the Composite Burn Index; and Remote Sensing of Severity, the Normalized Burn Ratio, Ogden, UT, 2006.
- Boschetti, L.; Roy, D.P.; Hoffmann, A.A.; Humber, M.L. Collection 6 MODIS Burned Area Product User’s Guide–Version 1.0. User Guide 2016, Version 1., 1–12. [Google Scholar]
- Padilla, M.; Stehman, S. V.; Chuvieco, E. Validation of the 2008 MODIS-MCD45 Global Burned Area Product Using Stratified Random Sampling. Remote Sens Env. 2014, 144, 187–196. [Google Scholar] [CrossRef]
- Padilla, M.; Olofsson, P.; Stehman, S. V.; Tansey, K.; Chuvieco, E. Stratification and Sample Allocation for Reference Burned Area Data. Remote Sens Env. 2017, 203, 240–255. [Google Scholar] [CrossRef]
- Hall, J. V.; Loboda, T. V.; Giglio, L.; McCarty, G.W. A MODIS-Based Burned Area Assessment for Russian Croplands: Mapping Requirements and Challenges. Remote Sens Env. 2016, 184, 506–521. [Google Scholar] [CrossRef]
- Lasko, K.; Vadrevu, K.P.; Tran, V.T.; Ellicott, E.; Nguyen, T.T.N.; Bui, H.Q.; Justice, C. Satellites May Underestimate Rice Residue and Associated Burning Emissions in Vietnam. Environ. Res. Lett. 2017, 12. [Google Scholar] [CrossRef]
- Liu, T.; Marlier, M.E.; Karambelas, A.; Jain, M.; Singh, S.; Singh, M.K.; Gautam, R.; Defries, R.S. Missing Emissions from Post-Monsoon Agricultural Fires in Northwestern India: Regional Limitations of Modis Burned Area and Active Fire Products. Env. Res Commun 2019, 1. [Google Scholar] [CrossRef]
- Chen, D.; Shevade, V.; Baer, A.E.; Loboda, T. V. Missing Burns in the High Northern Latitudes: The Case for Regionally Focused Burned Area Products. Remote Sens (Basel) 2021, 13. [Google Scholar] [CrossRef]
- Zhu, C.; Kobayashi, H.; Kan, Y.; Saito, M. Size-Dependent Validation of MODIS MCD64A1 Burned Area over Six Vegetation Types in Boreal Eurasia : Large Underestimation in Croplands. Sci Rep 2017, 7, 4181. [Google Scholar] [CrossRef] [PubMed]
- Huang, Y.; Pan, Y.; Xia, X.; Zhou, Q.; Chen, Q.; Zhang, S. Validating MCD64A1 and FireCCI51 Burned Area Mapping in the Qinghai-Tibetan Plateau. Geocarto Int 2023, 38. [Google Scholar] [CrossRef]
- Fornacca, D.; Ren, G.; Xiao, W. Performance of Three MODIS Fire Products (MCD45A1, MCD64A1, MCD14ML), and ESA Fire_CCI in a Mountainous Area of Northwest Yunnan, China, Characterized by Frequent Small Fires. Remote Sens (Basel) 2017, 9, 1131. [Google Scholar] [CrossRef]
- Franquesa, M.; Vanderhoof, M.K.; Stavrakoudis, D.G.; Gitas, I.Z.; Roteta, E.; Padilla, M.; Chuvieco, E. Development of a Standard Database of Reference Sites for Validating Global Burned Area Products. Earth Syst Sci Data 2020, 12, 3229–3246. [Google Scholar] [CrossRef]
- Olson, D.M.; Dinerstein, E.; Wikramanayake, E.D.; Burgess, N.D.; Powell, G.V.N.; Underwood, E.C.; D’Amico, J.A.; Itoua, I.; Strand, H.E.; Morrison, J.C.; et al. Terrestrial Ecoregions of the World: A New Map of Life on Earth. Bioscience 2001, 51, 933–938. [Google Scholar] [CrossRef]
- Ward, E.; Buytaert, W.; Peaver, L.; Wheater, H. Evaluation of Precipitation Products over Complex Mountainous Terrain: A Water Resources Perspective. Adv Water Resour 2011, 34, 1222–1231. [Google Scholar] [CrossRef]
- Weiss, D.J.; Walsh, S.J. Remote Sensing of Mountain Environments. Geogr Compass 2009, 3, 1–21. [Google Scholar] [CrossRef]
- Tang, C.Q.; Ohsawa, M. Ecology of Subtropical Evergreen Broad-Leaved Forests of Yunnan, Southwestern China as Compared to Those of Southwestern Japan. J Plant Res 2009, 122, 335–350. [Google Scholar] [CrossRef]
- Tang, C.Q. The Subtropical Vegetation of Southwestern China: Plant Distribution, Diversity and Ecology; Plant and Vegetation; Springer Netherlands: Dordrecht, Netherlands, 2015; ISBN 978-94-017-9740-5. [Google Scholar]
- Zhang, Z.; Long, T.; He, G.; Wei, M.; Tang, C.; Wang, W.; Wang, G.; She, W.; Zhang, X. Study on Global Burned Forest Areas Based on Landsat Data. Photogramm Eng Remote Sens. 2020, 86, 503–508. [Google Scholar] [CrossRef]
- Pausas, J.G.; Su, W.; Luo, C.; Shen, Z. A Shrubby Resprouting Pine with Serotinous Cones Endemic to Southwest China. Ecology 2021, 102, 1–4. [Google Scholar] [CrossRef]
- Xiong, Q.; Luo, X.; Liang, P.; Xiao, Y.; Xiao, Q.; Sun, H.; Pan, K.; Wang, L.; Li, L.; Pang, X. Fire from Policy, Human Interventions, or Biophysical Factors? Temporal–Spatial Patterns of Forest Fire in Southwestern China. Ecol Manag. 2020, 474. [Google Scholar] [CrossRef]
- Breiman, L. Random Forests. Mach Learn 2001, 45, 5–32. [Google Scholar] [CrossRef]
- Chen, J.; Chen, J.; Liao, A.; Cao, X.; Chen, L.; Chen, X.; He, C.; Han, G.; Peng, S.; Lu, M.; et al. Global Land Cover Mapping at 30 m Resolution: A POK-Based Operational Approach. ISPRS J. Photogramm. Remote Sens. 2015, 103, 7–27. [Google Scholar] [CrossRef]
- ESA Land Cover CCI Product User Guide Version 2. Tech. Rep. 2017.
- Giglio, L.; Schroeder, W.; Justice, C.O. The Collection 6 MODIS Active Fire Detection Algorithm and Fire Products. Remote Sens Env. 2016, 178, 31–41. [Google Scholar] [CrossRef]
- Tan, B.; Masek, J.G.; Wolfe, R.; Gao, F.; Huang, C.; Vermote, E.F.; Sexton, J.O.; Ederer, G. Improved Forest Change Detection with Terrain Illumination Corrected Landsat Images. Remote Sens Env. 2013, 136, 469–483. [Google Scholar] [CrossRef]
- Tian, X.; Zhao, F.; Shu, L.; Wang, M. Distribution Characteristics and the Influence Factors of Forest Fires in China. Ecol Manag. 2013, 310, 460–467. [Google Scholar] [CrossRef]
- Vanderhoof, M.K.; Brunner, N.; Beal, Y.J.G.; Hawbaker, T.J. Evaluation of the U.S. Geological Survey Landsat Burned Area Essential Climate Variable across the Conterminous U.S. Using Commercial High-Resolution Imagery. Remote Sens (Basel) 2017, 9. [Google Scholar] [CrossRef]
- Smith, H.; de Beurs, K.M.; Neeson, T.M. Evaluation of Low-Resolution Remotely Sensed Datasets for Burned Area Assessment within the Wildland-Urban Interface. Remote Sens Appl 2022, 26. [Google Scholar] [CrossRef]
- Giglio, L.; Boschetti, L.; Roy, D.P.; Humber, M.L.; Justice, C.O. The Collection 6 MODIS Burned Area Mapping Algorithm and Product. Remote Sens Env. 2018, 217, 72–85. [Google Scholar] [CrossRef]
- Gonzalez-Ibarzabal, J.; Franquesa, M.; Rodriguez-Montellano, A.; Bastarrika, A. Sentinel-2 Reference Fire Perimeters for the Assessment of Burned Area Products over Latin America and the Caribbean for the Year 2019. Remote Sens (Basel) 2024, 16. [Google Scholar] [CrossRef]
- Katagis, T.; Gitas, I.Z. Assessing the Accuracy of MODIS MCD64A1 C6 and FireCCI51 Burned Area Products in Mediterranean Ecosystems. Remote Sens (Basel) 2022, 14. [Google Scholar] [CrossRef]
- Pessôa, A.C.M.; Anderson, L.O.; Carvalho, N.S.; Campanharo, W.A.; Silva Junior, C.H.L.; Rosan, T.M.; Reis, J.B.C.; Pereira, F.R.S.; Assis, M.; Jacon, A.D.; et al. Intercomparison of Burned Area Products and Its Implication for Carbon Emission Stimations in the Amazon. Remote Sens (Basel) 2020, 12, 3864. [Google Scholar] [CrossRef]
- Hall, J. V.; Argueta, F.; Giglio, L. Validation of MCD64A1 and FireCCI51 Cropland Burned Area Mapping in Ukraine. Int. J. Appl. Earth Obs. Geoinf. 2021, 102, 102443. [Google Scholar] [CrossRef]
- Vetrita, Y.; Cochrane, M.A.; Suwarsono; Priyatna, M.; Sukowati, K.A.D.; Khomarudin, M.R. Evaluating Accuracy of Four MODIS-Derived Burned Area Products for Tropical Peatland and Non-Peatland Fires. Environ. Res. Lett. 2021, 16. [Google Scholar] [CrossRef]
- Chen, D.; Shevade, V.; Baer, A.E.; Loboda, T. V. Missing Burns in the High Northern Latitudes: The Case for Regionally Focused Burned Area Products. Remote Sens (Basel) 2021, 13. [Google Scholar] [CrossRef]
- Franquesa, M.; Stehman, S. V.; Chuvieco, E. Assessment and Characterization of Sources of Error Impacting the Accuracy of Global Burned Area Products. Remote Sens Env. 2022, 280, 113214. [Google Scholar] [CrossRef]
- Fornacca, D.; Ren, G.; Xiao, W. Evaluating the Best Spectral Indices for the Detection of Burn Scars at Several Post-Fire Dates in a Mountainous Region of Northwest Yunnan, China. Remote Sens (Basel) 2018, 10, 1196. [Google Scholar] [CrossRef]
- Lu, B.; He, Y.; Tong, A. Evaluation of Spectral Indices for Estimating Burn Severity in Semiarid Grasslands. Int J Wildland Fire 2016, 25, 147–157. [Google Scholar] [CrossRef]
- Qi, B.; Zhang, Z.; Long, T.; He, G.; Wang, G.; Peng, Y.; Xu, Z. High Resolution (30 m) Burned Area Product Improves the Ability for Carbon Emission Estimation in Africa. Earths Future 2024, 12. [Google Scholar] [CrossRef]
- Zubkova, M.; Lötter, M.; Bronkhorst, F.; Giglio, L. Assessment of the Effectiveness of Coarse Resolution Fire Products in Monitoring Long-Term Changes in Fire Regime within Protected Areas in South Africa. Int. J. Appl. Earth Obs. Geoinf. 2024, 132. [Google Scholar] [CrossRef]
- Zhu, Z.; Zhang, J.; Yang, Z.; Aljaddani, A.H.; Cohen, W.B.; Qiu, S.; Zhou, C. Continuous Monitoring of Land Disturbance Based on Landsat Time Series. Remote Sens Env. 2019, 1–16. [Google Scholar] [CrossRef]
- Kennedy, R.E.; Yang, Z.; Cohen, W.B. Detecting Trends in Forest Disturbance and Recovery Using Yearly Landsat Time Series: 1. LandTrendr–Temporal Segmentation Algorithms. Remote Sens Env. 2010, 114, 2897–2910. [Google Scholar] [CrossRef]
- Huang, C.; Goward, S.N.; Masek, J.G.; Thomas, N.; Zhu, Z.; Vogelmann, J.E. An Automated Approach for Reconstructing Recent Forest Disturbance History Using Dense Landsat Time Series Stacks. Remote Sens Env. 2010, 114, 183–198. [Google Scholar] [CrossRef]
- Arévalo, P.; Bullock, E.L.; Woodcock, C.E.; Olofsson, P. A Suite of Tools for Continuous Land Change Monitoring in Google Earth Engine. Front. Clim. 2020, 2, 1–19. [Google Scholar] [CrossRef]
- Verbesselt, J.; Hyndman, R.; Newnham, G.; Culvenor, D. Detecting Trend and Seasonal Changes in Satellite Image Time Series. Remote Sens Env. 2010, 114, 106–115. [Google Scholar] [CrossRef]
- Brown, J.F.; Tollerud, H.J.; Barber, C.P.; Zhou, Q.; Dwyer, J.L.; Vogelmann, J.E.; Loveland, T.R.; Woodcock, C.E.; Stehman, S. V.; Zhu, Z.; et al. Lessons Learned Implementing an Operational Continuous United States National Land Change Monitoring Capability: The Land Change Monitoring, Assessment, and Projection (LCMAP) Approach. Remote Sens Env. 2020, 238, 111356. [Google Scholar] [CrossRef]
- Hermosilla, T.; Wulder, M.A.; White, J.C.; Coops, N.C.; Hobart, G.W. An Integrated Landsat Time Series Protocol for Change Detection and Generation of Annual Gap-Free Surface Reflectance Composites. Remote Sens Env. 2015, 158, 220–234. [Google Scholar] [CrossRef]
- Parente, L.; Sloat, L.; Mesquita, V.; Consoli, D.; Stanimirova, R.; Hengl, T.; Bonannella, C.; Teles, N.; Wheeler, I.; Hunter, M.; et al. Annual 30-m Maps of Global Grassland Class and Extent (2000–2022) Based on Spatiotemporal Machine Learning. Sci. Data 2024, 11, 1–22. [Google Scholar] [CrossRef]
- Zhang, X.; Liu, L.; Zhao, T.; Wang, J.; Liu, W.; Chen, X. Global Annual Wetland Dataset at 30 m with a Fine Classification System from 2000 to 2022. Sci Data 2024, 11, 1–12. [Google Scholar] [CrossRef]
- Chen, Y.; Hall, J.; Van Wees, D.; Andela, N.; Hantson, S.; Giglio, L.; Van Der Werf, G.R.; Morton, D.C.; Randerson, J.T. Multi-Decadal Trends and Variability in Burned Area from the Fifth Version of the Global Fire Emissions Database (GFED5). Earth Syst Sci Data 2023, 15, 5227–5259. [Google Scholar] [CrossRef]
- Zhang, W.; Li, A.; Jin, H.; Bian, J.; Zhang, Z.; Lei, G.; Qin, Z.; Huang, C. An Enhanced Spatial and Temporal Data Fusion Model for Fusing Landsat and Modis Surface Reflectance to Generate High Temporal Landsat-like Data. Remote Sens 2013, 5, 5346–5368. [Google Scholar] [CrossRef]
Figure 1.
Map of northwest Yunnan (left); and sampling grid used for the validation (right).
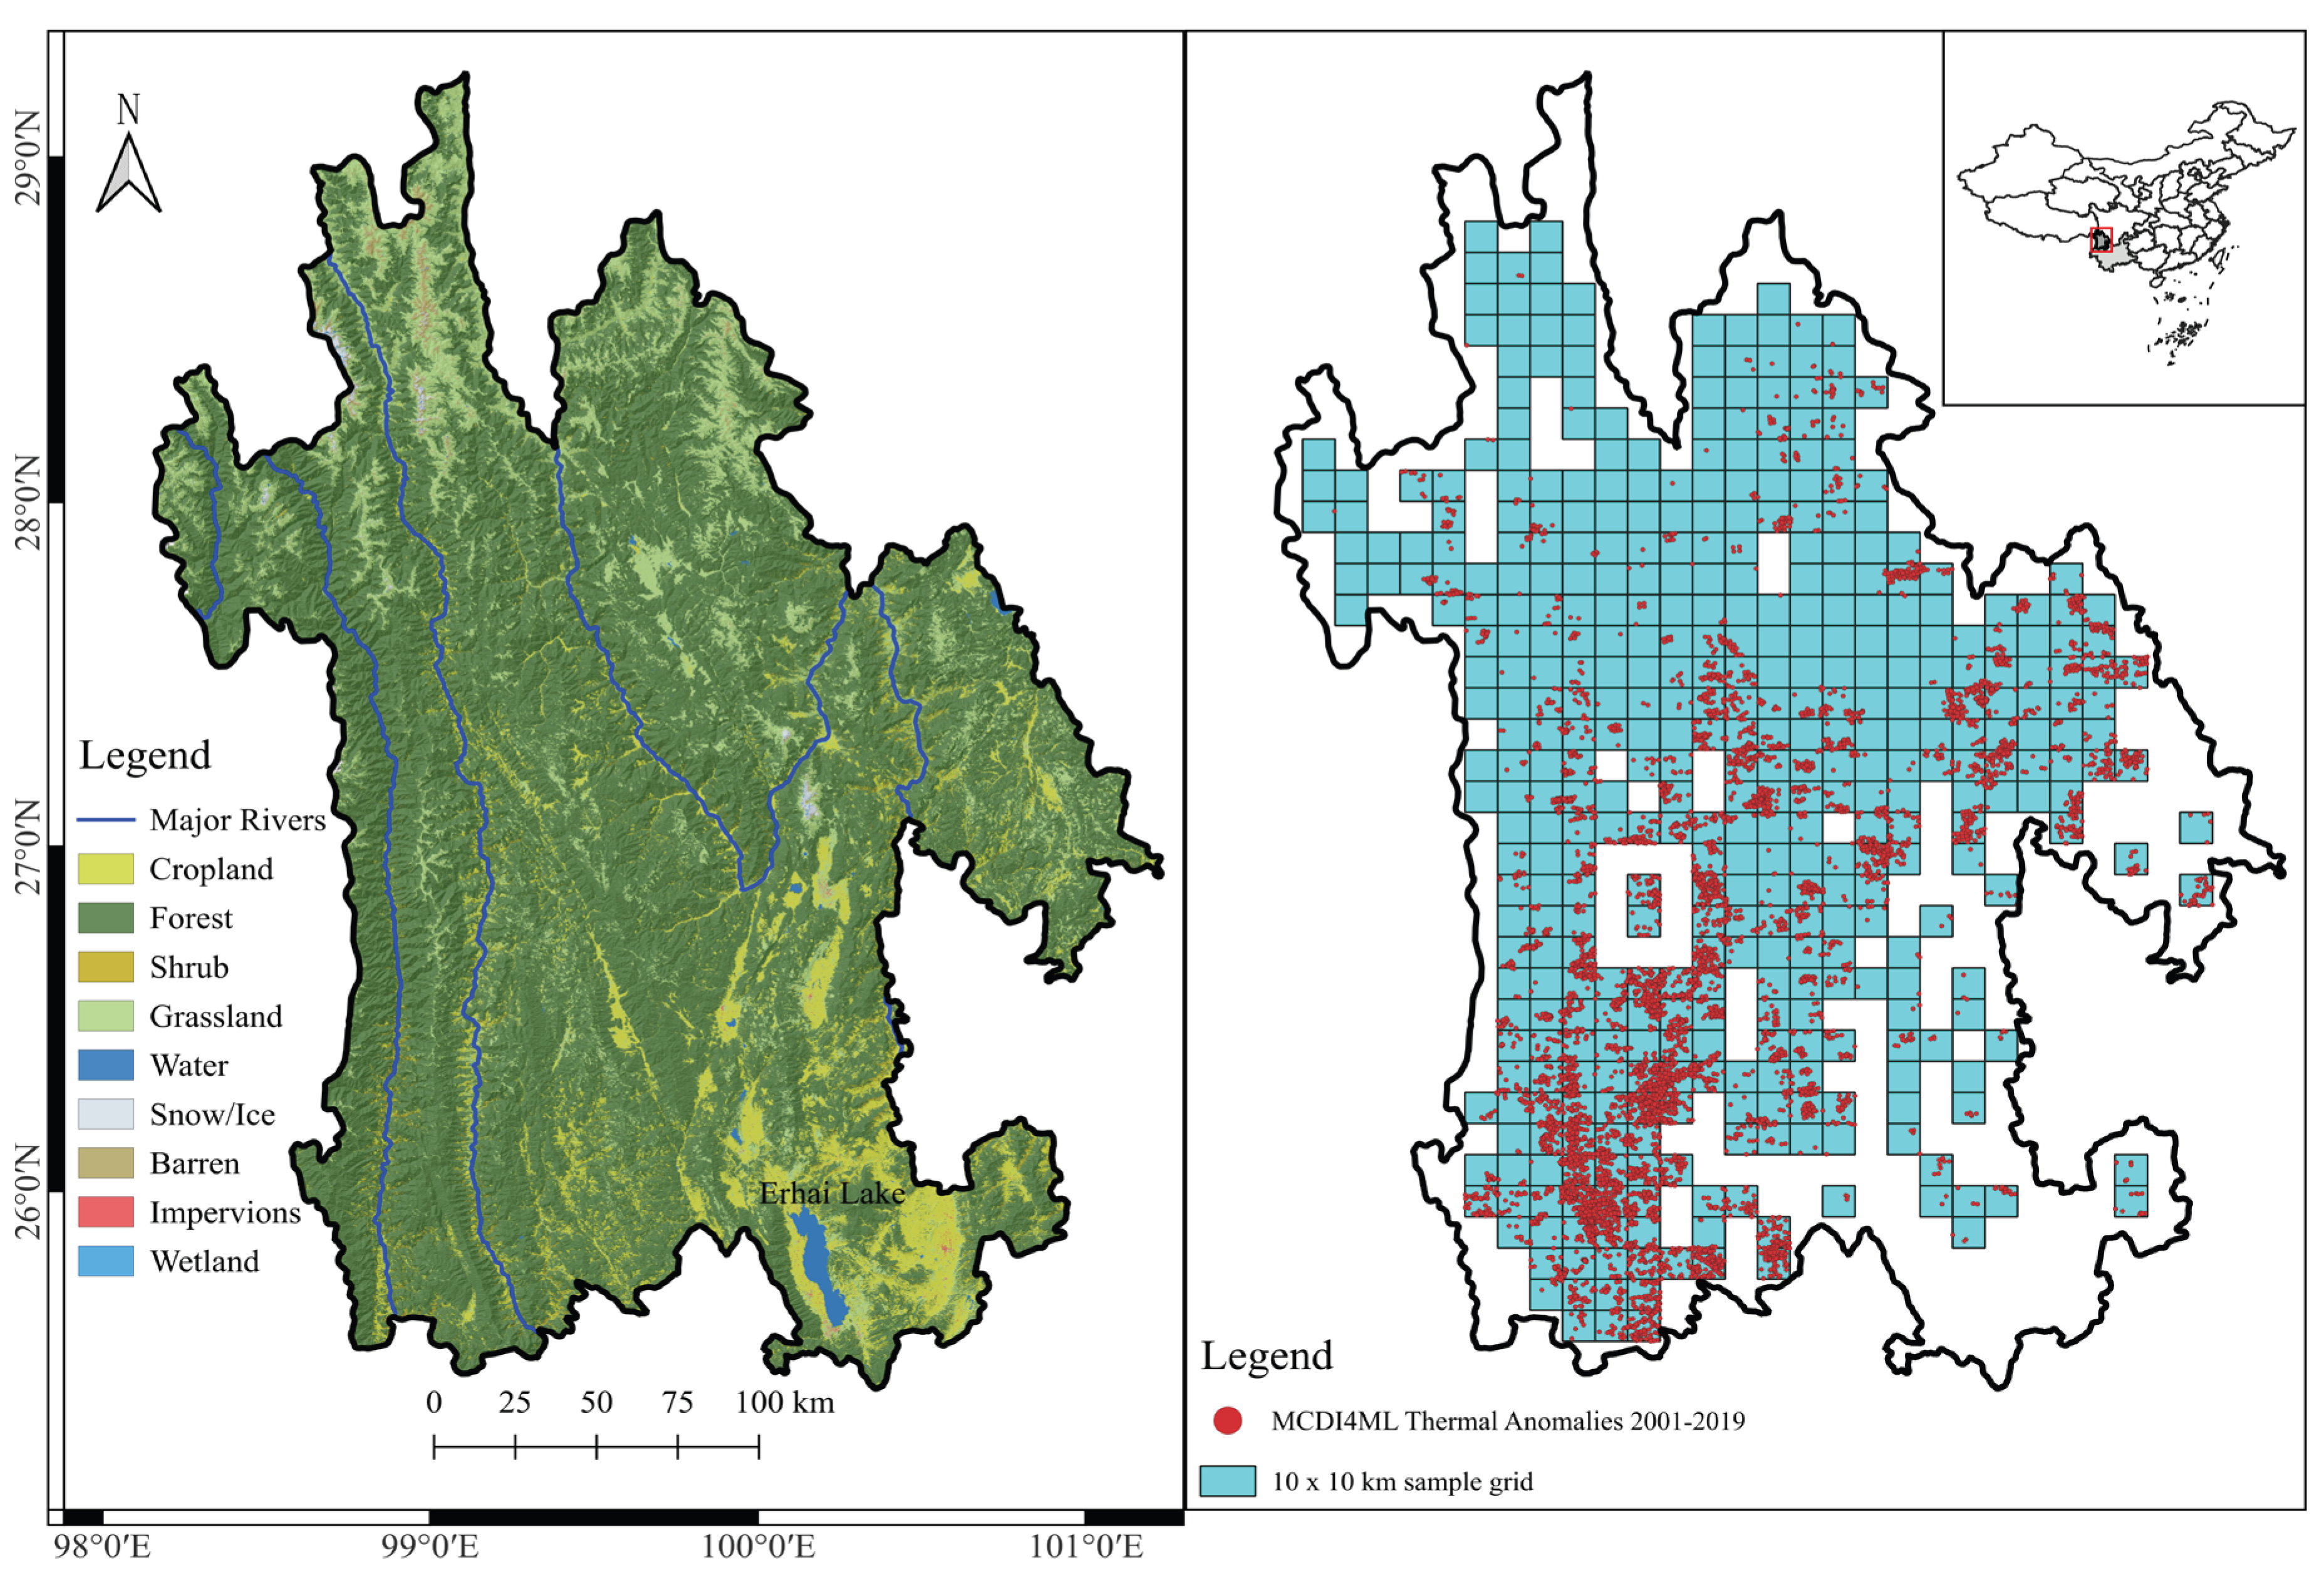
Figure 2.
Fire counts distribution within 10-km square units and Spearman Rho correlation coefficients between assessed model and reference benchmarks. Fire counts were Min-Max re-scaled to allow comparison, while correlations were all significant at the 0.001 threshold.
Figure 2.
Fire counts distribution within 10-km square units and Spearman Rho correlation coefficients between assessed model and reference benchmarks. Fire counts were Min-Max re-scaled to allow comparison, while correlations were all significant at the 0.001 threshold.
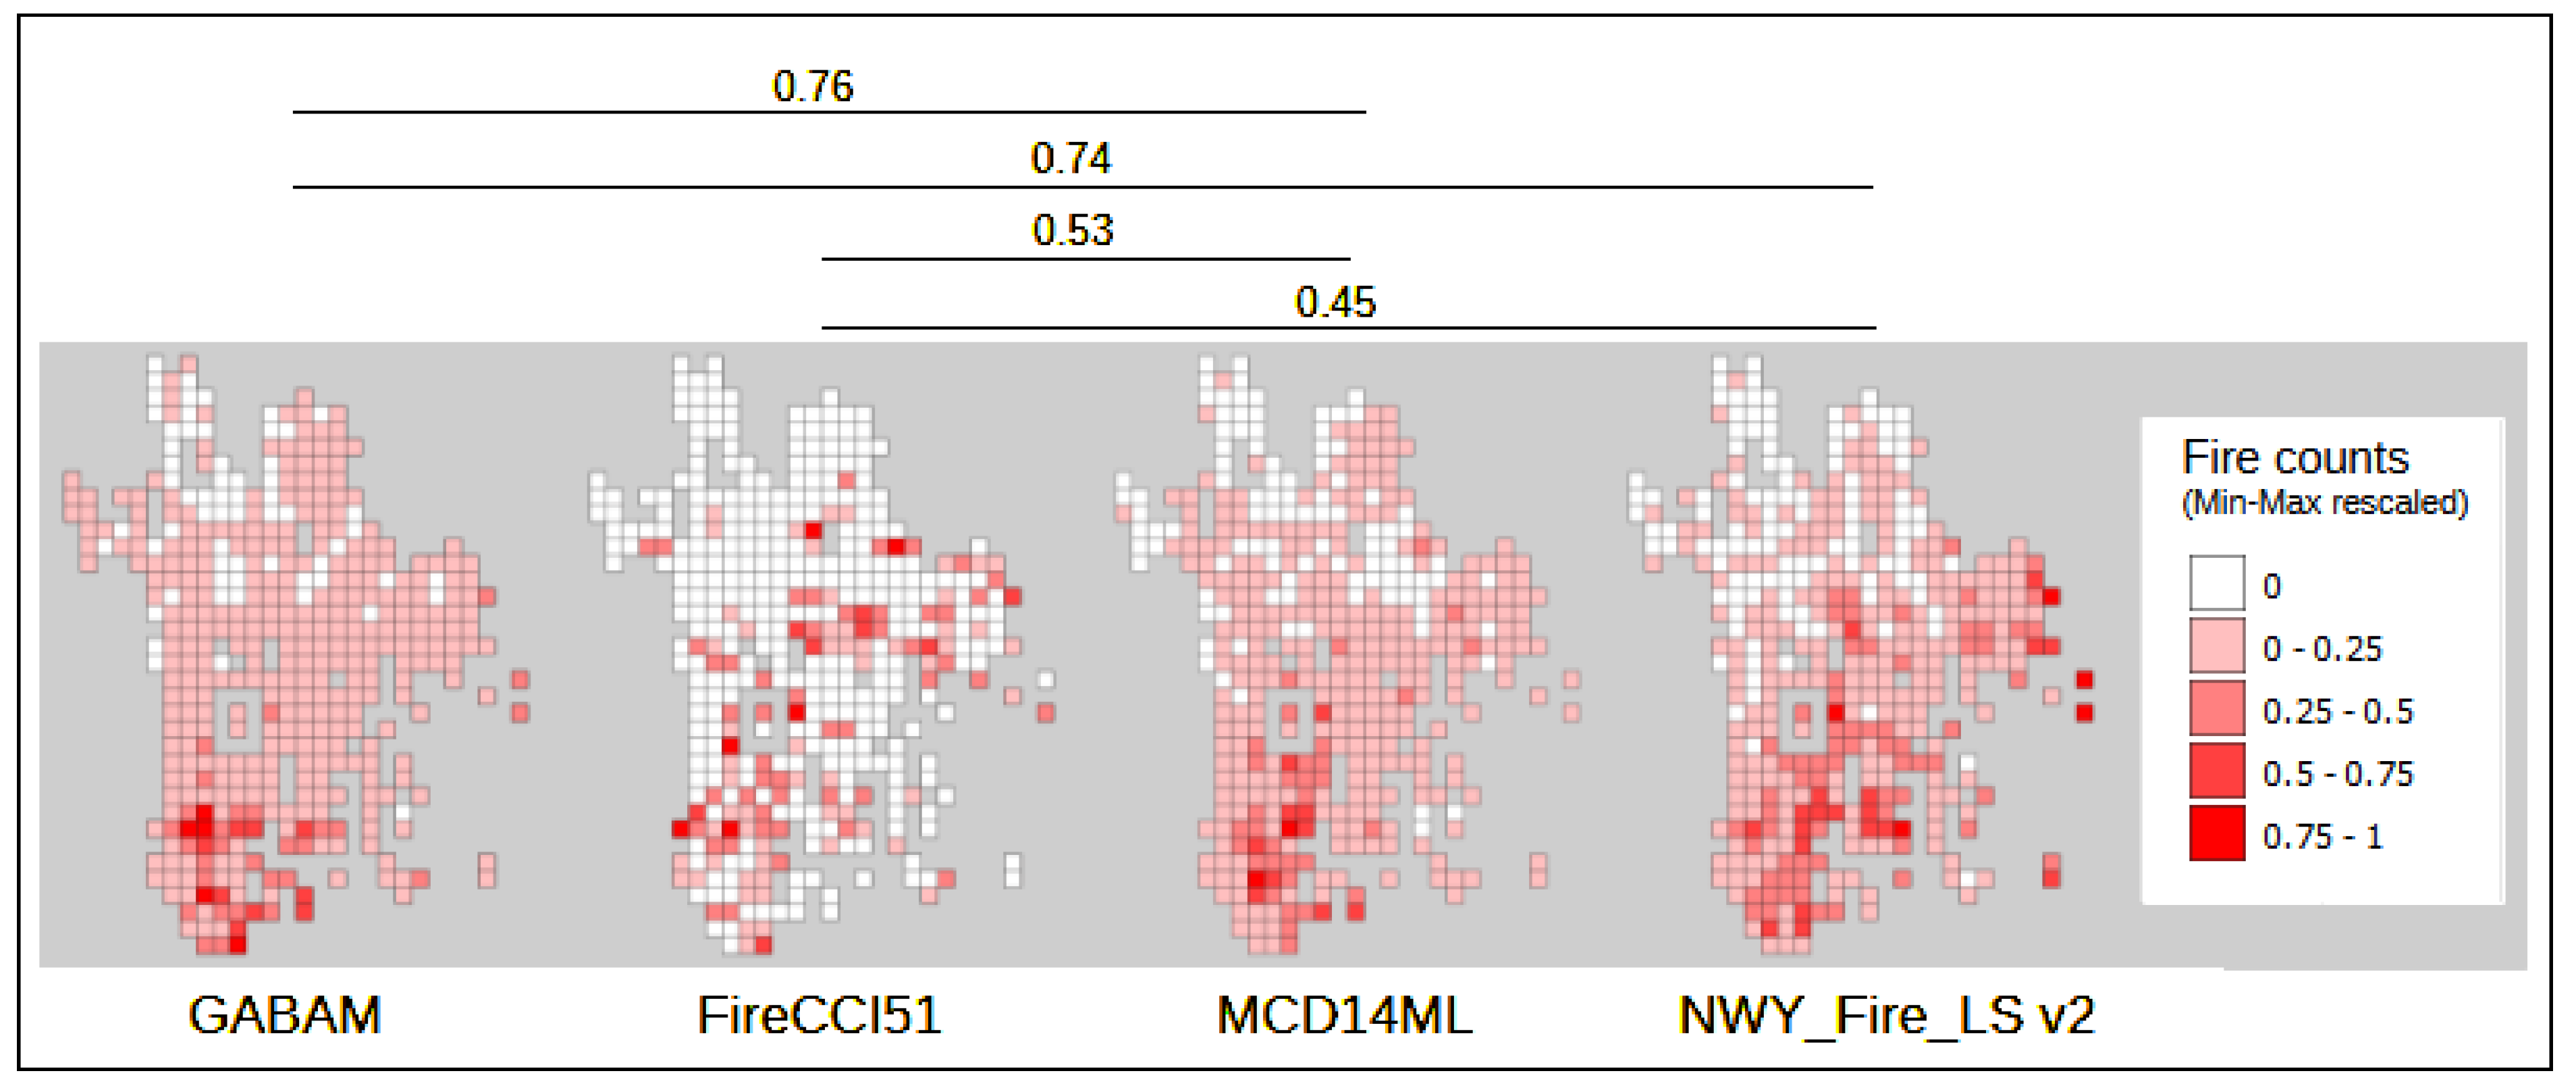

Table 1.
Burned area detection metrics for two global burned area products. TP: True Positives, FN: False Negatives, FP: False Positives, PA: Producer’s Accuracy, UA: User’s Accuracy, NaN: Not a Number (caused by “divide-by-zero” error).
Table 1.
Burned area detection metrics for two global burned area products. TP: True Positives, FN: False Negatives, FP: False Positives, PA: Producer’s Accuracy, UA: User’s Accuracy, NaN: Not a Number (caused by “divide-by-zero” error).
| FireCCI51 | GABAM | ||||||||||||
|---|---|---|---|---|---|---|---|---|---|---|---|---|---|
| Year | Low–high threshold |
High frequency sample squares |
Reference fires |
TP | FN | FP | PA | UA | TP | FN | FP | PA | UA |
| 2001 | 2 | 23 | 8 | 0 | 8 | 0 | 0 | NaN | 6 | 2 | 5 | 0.75 | 0.55 |
| 2002 | 2 | 7 | 7 | 0 | 7 | 0 | 0 | NaN | 6 | 1 | 1 | 0.86 | 0.86 |
| 2003 | 3 | 20 | 13 | 1 | 12 | 0 | 0.08 | 1 | 7 | 6 | 4 | 0.54 | 0.64 |
| 2004 | 4 | 26 | 10 | 0 | 10 | 0 | 0 | NaN | 8 | 2 | 3 | 0.8 | 0.73 |
| 2005 | 4 | 17 | 18 | 0 | 18 | 0 | 0 | NaN | 2 | 16 | 0 | 0.11 | 1 |
| 2006 | 7 | 39 | 18 | 3 | 15 | 1 | 0.17 | 0.75 | 14 | 4 | 1 | 0.78 | 0.93 |
| 2007 | 6 | 34 | 15 | 0 | 15 | 0 | 0 | NaN | 14 | 1 | 1 | 0.93 | 0.93 |
| 2008 | 3 | 16 | 11 | 0 | 11 | 0 | 0 | NaN | 9 | 2 | 4 | 0.82 | 0.69 |
| 2009 | 6 | 41 | 8 | 2 | 6 | 0 | 0.25 | 1 | 7 | 1 | 0 | 0.88 | 1 |
| 2010 | 10 | 43 | 18 | 1 | 17 | 0 | 0.06 | 1 | 14 | 4 | 0 | 0.78 | 1 |
| 2011 | 4 | 11 | 10 | 0 | 10 | 0 | 0 | NaN | 9 | 1 | 0 | 0.9 | 1 |
| 2014 | 30 | 86 | 14 | 6 | 8 | 1 | 0.43 | 0.86 | 11 | 3 | 1 | 0.79 | 0.92 |
| 2015 | 4 | 24 | 8 | 2 | 6 | 1 | 0.25 | 0.67 | 7 | 1 | 1 | 0.88 | 0.88 |
| 2016 | 3 | 7 | 7 | 0 | 7 | 0 | 0 | NaN | 5 | 2 | 0 | 0.71 | 1 |
| 2017 | 5 | 12 | 12 | 0 | 12 | 0 | 0 | NaN | 6 | 6 | 2 | 0.5 | 0.75 |
| 2018 | 2 | 8 | 9 | 0 | 9 | 0 | 0 | NaN | 2 | 7 | 0 | 0.22 | 1 |
| 2019 | 3 | 14 | 12 | 0 | 12 | 0 | 0 | NaN | 8 | 4 | 0 | 0.67 | 1 |
| Overall study period | 198 | 15 | 183 | 3 | 0.08 | 0.83 | 135 | 63 | 23 | 0.68 | 0.85 | ||
Table 2.
Burned area detection capabilities for different fire sizes. BA: Burned Area, TP: True Positives, PA: Producer’s Accuracy.
Table 2.
Burned area detection capabilities for different fire sizes. BA: Burned Area, TP: True Positives, PA: Producer’s Accuracy.
| BA < 25 ha (n = 41) |
BA 25-100 ha (n = 71) |
BA > 100 ha (n = 86) |
||||
|---|---|---|---|---|---|---|
| TP | PA | TP | PA | TP | PA | |
| GABAM | 26 | 0.63 | 42 | 0.59 | 67 | 0.78 |
| FireCCI51 | 0 | 0 | 4 | 0.06 | 11 | 0.13 |
Disclaimer/Publisher’s Note: The statements, opinions and data contained in all publications are solely those of the individual author(s) and contributor(s) and not of MDPI and/or the editor(s). MDPI and/or the editor(s) disclaim responsibility for any injury to people or property resulting from any ideas, methods, instructions or products referred to in the content. |
© 2025 by the authors. Licensee MDPI, Basel, Switzerland. This article is an open access article distributed under the terms and conditions of the Creative Commons Attribution (CC BY) license (http://creativecommons.org/licenses/by/4.0/).
Copyright: This open access article is published under a Creative Commons CC BY 4.0 license, which permit the free download, distribution, and reuse, provided that the author and preprint are cited in any reuse.


