
Submitted:
05 February 2025
Posted:
06 February 2025
You are already at the latest version
Abstract
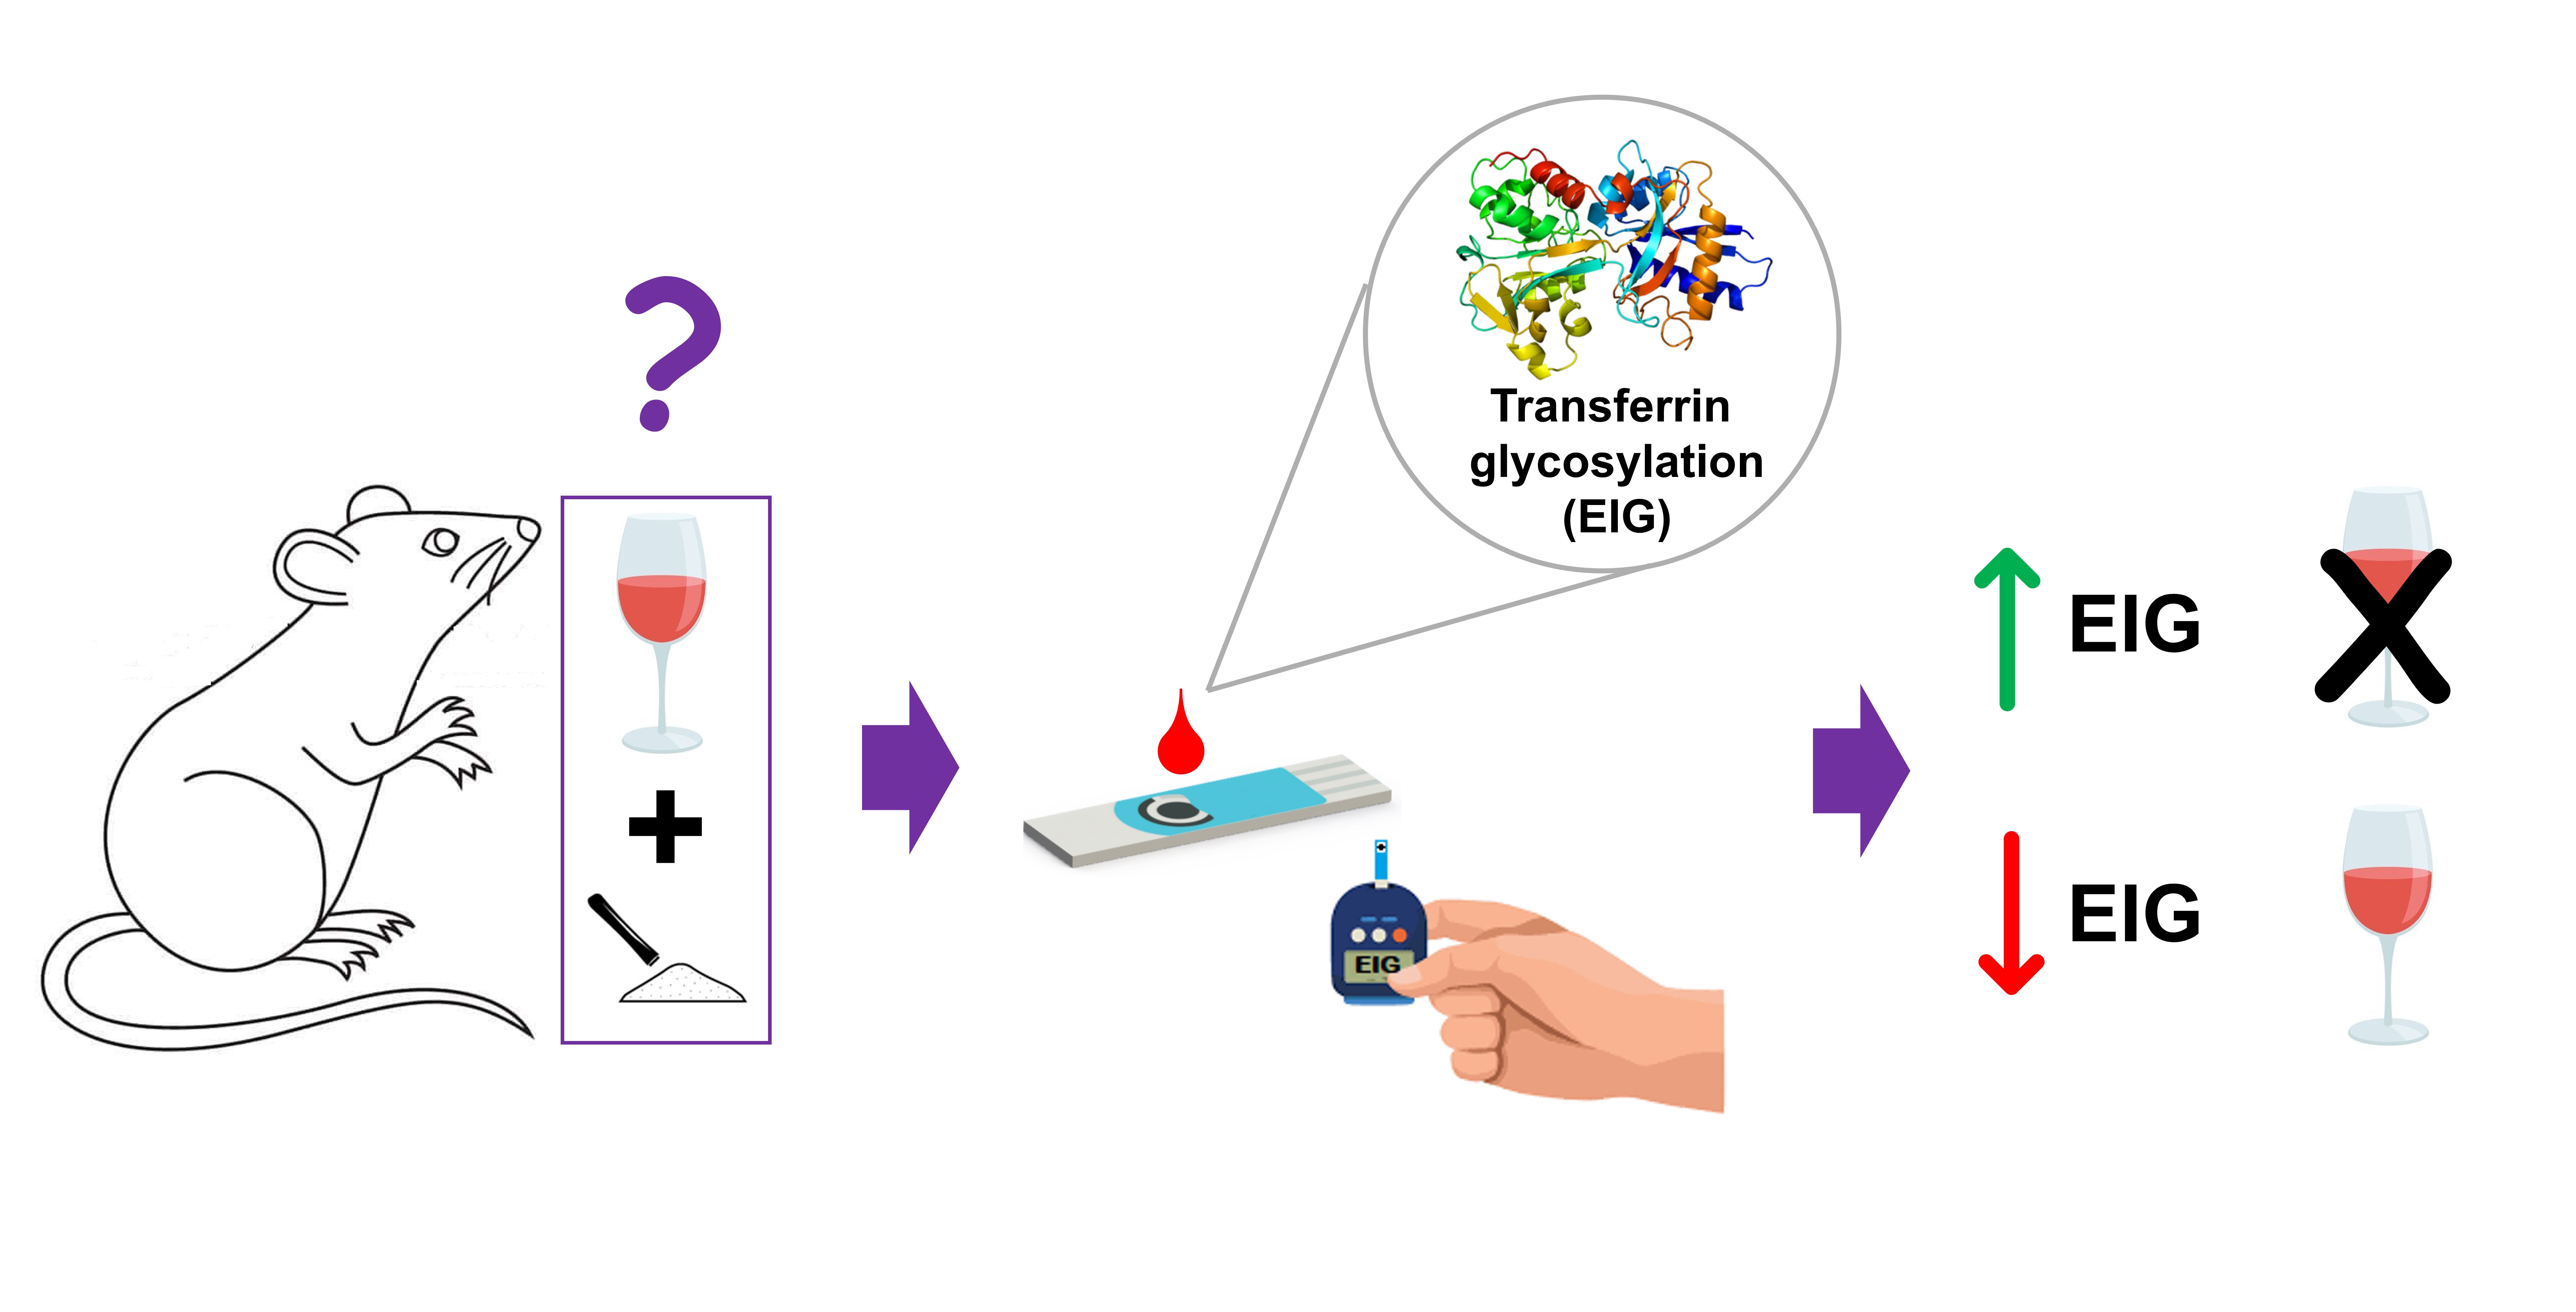
An electrochemical sensor for identification and monitoring of chronic alcohol abuse and alcoholism was preclinically validated by the analysis of plasma from polydrug-consuming rats (alcohol and cocaine). The sensor measures the glycosylation level of transferrin as an electrochemical index of glycosylation (EIG). Three rat groups were designed: saline group, cocaine group and cocaine-alcohol group. Moreover, two periods of withdrawal were studied, after 2 days and 30 days. The alcohol-cocaine group after 2 days of withdrawal showed significantly lower EIG values (p<0.1) than the rest of groups (saline groups, cocaine groups and alcohol-cocaine group after 30 days of withdrawal), so the sensor was able to identify the alcohol abuse in rats and the recovery of glycosylation level after 30 days of withdrawal, even combined with cocaine. Furthermore, the effect of sex was also considered. Receiver operating characteristic (ROC) curves were developed for each sex and the corresponding cut-off values were determined. The sensor showed a clinical sensitivity of 70% for male and 75% for female, and a specificity of 67% for both sexes. This preclinical validation demonstrated the possibilities of this sensor for point of care testing of chronic alcohol abuse, even in cocaine addicts, making it a potential tool for diagnosis and monitoring of alcohol consumption in detox treatments for humans.
Keywords:
Alcoholism
; point-of-care testing
; carbohydrate deficient transferrin
; sensor
; polydrug
; diagnosis
; rat plasma
1. Introduction
The most common type of drug consumption is polyconsumption, with alcohol and cocaine being the substances most frequently consumed together. Some studies suggest that up to 74% of individuals with cocaine use disorder (CUD) in the United States frequently or heavily consume alcohol [1]. One of the biggest challenges in diagnosing drug addiction is the development of objective diagnostic techniques to identify individuals with problematic drug use.
In the case of alcohol, there are several blood biomarkers for the diagnosis and follow-up of chronic alcohol abuse. Among them, the most important are γ-glutamyltransferase, mean corpuscular volume and carbohydrate deficient transferrin (CDT), providing the latter the highest sensitivity and specificity [2,3]. These biomarkers could show different performances in function of sex, the consumption pattern or the possible co-occurrence with other substances, such as cocaine. In our previous work, a simple disposable screen-printed carbon electrode (SPCE) was successfully used for the diagnosis of alcohol abuse in an animal model under intravenous passive administration, based on CDT assessment [4]. In that study, we found that the electrochemical sensor allowed us to reliably differentiate between rats exposed to alcohol and saline control rats. In the present study, we intend to check if this sensor can identify alcohol abuse even in rats that consume alcohol combined with cocaine (active polydrug consumption).
CDT is considered to be the group of transferrins (Tf) having no carbohydrate side-chains (asialo-Tf), one (monosialo-Tf) and two (disialo-Tf), which increase their concentration in blood due to chronic alcohol abuse. The ratio between these low glycosylated glycoforms and the sum of the signals for all glycoforms (from asialo- to hexasialo-Tf) is termed %CDT. Typically, %CDT is measured by HPLC and CZE using UV detection, providing excellent diagnostic performance [5,6] However, these techniques require benchtop equipment and skilled personnel, so the analysis is done in clinical laboratories. There is also a fast and simple commercial immunoassay kit for chronic alcohol abuse (N Siemens Latex CDT assay), which uses two selective monoclonal antibodies: one recognizes the structure of asialo- disialo-Tf and the other all Tf glycoforms [7] The assay relies on an immunonephelometry, so a nephelometer instrument is needed.
In this context, the development of point-of-care testing (POCT) for CDT evaluation would help therapists, clinicians and/or caregivers in the follow-up of rehab process, because POCTs provide immediate and simple information about the patient’s health, without the need for decentralized laboratories. Furthermore, the analysis can be performed near the point of care (physician’s or therapist’s office, or even at home), improving patient convenience and comfort [8,9]
Electrochemical sensors are promising POCT due to the easy miniaturization, low cost fabrication, multiplexing detection capacity and its portability (handheld potentiostat even for connecting on smartphones) [10,11] Among electrochemical sensors, screen-printed electrodes (SPEs) have emerged as one of most relevant because they offer rapid, portable, sensitive, low-cost, and precise analyses, besides SPEs are disposable and needs a low amount of sample (μL range) [12]
In this sense, we previously reported an electrochemical approach for the evaluation of CDT by defining a new parameter called “electrochemical index of glycosylation” (EIG) [13] This parameter is the ratio between the signal produced by carbohydrates from Tf (which were selectively tagged by an Os(VI) complex) and the signal generated by the electroactive amino acids from Tf. EIG showed an excellent linear correlation with the parameter %CDT. This POCT was used for the diagnosis of congenital disorders of glycosylation (CDG), a rare disease, analyzing serum samples. The approach combines selective immunomagnetic beads and disposable screen-printed carbon electrodes (SPCE). Then we adapted this approach for the screening of chronic alcohol abuse in an animal model (Wistar rat) under intravenous passive administration (2 g/kg b.w.) [4] Two groups of rats were analyzed: one received alcohol (alcohol group, 16 rats) and another received saline solution (saline group, 15 rats). EIG values from both groups were significantly different. A cut-off value was defined (EIG=0.61) to discriminate between alcohol and non-alcohol rat groups by doing a receiver operating characteristic (ROC) analysis, yielding a sensitivity of 81% and a specificity of 87%.
In this work, more complex and realistic rat groups were devised to perform a deeper preclinical validation of the proposed electrochemical sensor for chronic alcohol abuse identification. The animal experimental design consists of rats fed saline solution (saline group), rats that self-administered alcohol and cocaine (ALC+COC group), and rats that self-administered cocaine (COC group). This design imitates one of the most common patterns of drug abuse, polydrug use. In addition, each group was subjected to two different periods of withdrawal: rats sacrificed after 2 days (2D) withdrawal and after 30 days (30D). Therefore, six groups were evaluated. The sex was also considered, with a total of 121 young adult rats in this study (65 female and 56 male).
2. Material and methods
2.1. Reagents
Anti-transferrin polyclonal antibody was purchased from Abcam (ab82411, United Kingdom, reacts with: Mouse, Rat, Guinea pig, Dog, Human). Low protein binding microtubes and protein-G magnetic beads (Invitrogen, 30 mg.L-1, 2.8 µm diameter) were acquired from Thermo Fisher Scientific (USA). Potassium osmate (VI) dihydrate, N, N, N’, N’-tetramethylethylenediamine (TEMED), boric acid, phosphoric acid, sodium hydroxide, sodium chloride, acetic acid, disodium hydrogen phosphate dodecahydrate and sodium dihydrogen phosphate monohydrate were purchased from Merck (Germany). Hydrochloric acid was acquired in Panreac (Spain). Ultra-pure water was used for the preparation of solutions (Milli-Q, Merck Millipore, Germany).
2.2. Instruments
Electrochemical measurements were carried out in a hand-held potentiostat (µ-Stat-I 400s, DropSens, Spain), controlled by DropView 8400 software. Single-use screen-printed carbon electrodes (SPCE) (DRP-110, Metrohm Dropsens, Spain) were used for sensing. They contain a 4 mm diameter working electrode, a counter electrode (both made of carbon), and a reference electrode made of silver. SPCEs need only 50 µL of sample.
2.3. Procedures
2.3.1. Labeling of transferrin with Os(VI)-based electrochemical tag
The labeling solution contains 30 mM Os(VI)O2(OH)2TEMED complex and 0.2 M phosphate buffer pH 7.0 and it was prepared according to previous work [13]. This electrochemical tag (Os(VI)O2(OH)2TEMED) reacts selectively with carbohydrates and glycans and not with amino acids [14,15]
The transferrin (Tf) contained in the rat plasma was labeled with the Os(VI)-based electrochemical tag as follows: 150 µL of rat plasma were mixed with 100 µL of 30 mM Os(VI)O2(OH)2TEMED solution and then it was incubated overnight at 37°C and 950 rpm using a Thermo Shaker (PHMT, Grant-Bio, United Kingdom). This reaction yields a Tf-Os(VI)O2TEMED complex (Tf-Os(VI)) [13]
2.3.2. Immunoextraction using anti-Tf magnetic beads
Anti-Tf magnetic beads (anti-Tf MB) were synthesized as in our previous work [4] These anti-Tf MBs were then employed to isolate Tf-Os(VI) from the rest of components present in rat plasma. The immunoextraction protocol was as follows: 1 µL of anti-Tf MBs was dispersed in 50 µL of plasma sample, which contained Tf-Os(VI), using low protein binding microtubes. Next it was incubated for 45 min at 25°C and 950 rpm (Thermo Shaker). Next anti-Tf MBs were collected and retained on the bottom of the microtube for 1 min using a magnet. The supernatant was removed and anti-Tf MBs were washed with 50 µL of 0.1 M PBS pH 7.4 solution (in triplicate). Finally, anti-Tf MBs containing Tf-Os(VI) were resuspended in 10 µL of 0.2 M Britton Robinson (BR) buffer pH 3.0 and then dropped on the working electrode of SPCE.
2.3.3. Electrochemical sensing
Electrochemical sensing was carried out by adsorptive transfer square wave voltammetry (AdTSWV) using single-use SPCE. This approach was previously reported by us [4] It consists of three steps: (i) 10 µL of anti-Tf MBs containing Tf-Os(VI) were dropped on the working electrode and Tf-Os(VI) complex was allowed to adsorb on the surface for 5 min at open circuit potential, (ii) the solution was removed and 50 µL of 0.2 M BR buffer pH 3.0 was added to SPCE, and (iii) adsorptive transfer square wave voltammetry (AdTSWV) was performed from -1.3 V to +1.2 V (step potential 5 mV, amplitude 50 mV and frequency 100 Hz).
The voltammograms show two peaks: one at -0.9 V, which comes from the Os(VI)-based electrochemical tag attached to Tf carbohydrates, and another at +0.8 V, which comes from electroactive amino acids (cysteine, tryptophan, and tyrosine) of Tf. The ratio between the peak height of both signals is called electrochemical index of glycosylation (EIG) and it is calculated as follows:
(1)
where IOs(VI) is the height of the peak at -0.9 V and ITf is the height of the peak at +0.8 V.
It is worth mentioning that EIG is inversely proportional to %CDT,[13] so the higher the glycosylation degree of Tf the higher the EIG value.
2.3.4. Animals, experimental design, and plasma preparation
Animals
All procedures were conducted in accordance with Spanish Legislation on protection of experimental animals and the European Union Laboratory Animal Care Guidelines (EU Directive 2010/63/EU) and have been previously approved by the Bioethics Committee of the National University of Distance Education (UNED, Madrid, Spain) and the Autonomous Community of Madrid (PROEX 2021.3-21). Male and female Wistar rats (Charles River Laboratories, Lyon, France) were weaned at 28 days old and housed in single-sex groups before undergoing surgery. Post-surgery, rats were individually housed in controlled conditions (22 °C, 50–60% humidity, 12-hour light/dark cycle) with ad libitum access to food and water.
Surgical Procedures
For the drug self-administration procedure, rats were implanted with indwelling jugular vein catheters. Briefly: Under isoflurane anaesthesia, a silicone catheter (polyvinyl chloride; 1 mm O.D. and 0.5 I.D.) was inserted into the atrium and guided to the scapular region. Marbofloxacin (0.25 mg/kg, IV) and buprenorphine (0.05 mg/kg, SC) were administered perioperatively and continued for three days post-surgery. Catheters were maintained by daily flushing with saline containing heparin and gentamicin. Functionality was verified using sodium thiopental (0.10 mg/kg), with loss of consciousness confirming proper catheter function.
Self-Administration Protocol
The procedure is extensively described in reference [16] After autoshaping with food pellets under a fixed ratio 1 (FR-1) schedule, self-administration sessions began. Rats were assigned to three groups: saline (SALINE), cocaine (COC; 1 mg/kg b.w. inj.), and cocaine + alcohol (ALC+COC; 0.133 g/kg ethanol b.w. inj. + 1 mg/kg cocaine b.w. inj.). Sessions were conducted in operant conditioning chambers equipped with active and inactive levers, with lever presses on the active lever delivering the reinforcer. Ethanol was gradually introduced over the first three sessions to the ALC+COC group.
The self-administration began 54 ± 2 days of age and consisted of 10 daily extended-access 6-hour sessions. Subsequently, rats underwent withdrawal for either 2 days (2D) or 30 days (30D).
Sample Collection and Analysis
After the withdrawal periods, rats were euthanized by decapitation, and blood samples were collected into heparinized tubes. Plasma was isolated by centrifugation (1500 × g, 10°C, 12 min) and stored at -80°C. Plasma proteins were removed using filtration (30 kDa), followed by centrifugation (3000 × g, 4°C, 45 min).
2.3.5. Statistical studies
The statistical analysis employed non-parametric tests due to the differing sample sizes across groups. The Kruskal-Wallis test was used to evaluate differences among the three treatment groups, and the Mann-Whitney U test was applied to determine which specific groups displayed significant differences.
All statistical analyses were conducted using IBM SPSS Statistical version 27 (IBM, Armonk, NY, USA). Test statistics, degrees of freedom and p-values were reported in the Results and Discussion section. A p-value less than 0.1 was considered statistically significant.
2.3.6. Clinical sensitivity and specificity
The clinical sensitivity and specificity of the sensor were calculated using the next equations:
where TP are the number of true positives, FN the number of false negatives, TN the number of true negatives and FP the number of false positives.
The dichotomous diagnostic performance of the sensor was evaluated by the Youden’s index:
3. Results and discussion
3.1. EIG level in rat plasma from polydrug-consuming rats.
Although clinical studies with volunteers have not found a relationship between cocaine consumption and CDT values [17], there are, to our best knowledge, no preclinical studies with animal models of simultaneous self-administration of alcohol and cocaine. In the present study, we want to contribute to fill this gap. Our experimental design is shown in Figure 1. Six groups were designed in this study according to the different treatments (i) and withdrawal period (ii): (i) rats fed saline solution (SALINE, control), rats that self-administered alcohol and cocaine (ALC+COC), and rats that self-administered cocaine (COC); and (ii) rats sacrificed after 2 days (2D) of withdrawal and after 30 days (30D) of withdrawal. The groups were labelled SALINE 2D, SALINE 30D, ALC+COC 2D, ALC+COC 30D, COC 2D and COC 30D. It is worth mentioning that rats do not self-administer alcohol intravenously in relevant doses. However, the combination with cocaine compensates for the potential aversive nature of intravenous ethanol alone self-administration, reaching doses of 133 mg of alcohol per infusion [16,18]. Moreover, the two withdrawal periods allowed us to evaluate the expected recovery of protein glycosylation after a long time of alcohol withdrawal (30D). The sex dimension was also considered by selecting female (F) and male (M) rats for every group. There were 121 rats (65 female and 56 male) in total for this study.
The EIG values for each rat and the corresponding standard deviation are collected in Table S1. Every plasma sample was analyzed in triplicate. For illustrative purposes, Figure S1 shows a voltammogram of SALINE 2D sample and another from ALC+COC 2D sample. Figure 2A shows the box and whiskers plot of EIG for each subgroup without considering sex. The lowest EIG median corresponds to the ALC+COC 2D subgroup and the highest to COC 2D subgroup.
To evaluate if there are significant differences among the subgroups, a statistical study was carried out. The confidence level was set at 90%, because of the low number of individuals in some subgroups (for instance, n=5 for SALINE 2D male). In addition, due to the lack of normality of some subgroups, and the heterogeneous number of individuals per subgroup (from 17 for SALINE 2D to 28 for ALC+COC 30D), non-parametric tests were used [18] According to Kruskal-Wallis H test, there were significant differences (p=0.004) by effect of treatment (SALINE, ALC+COC and COC) among the 2D groups, but not among 30D groups (p=0.239). Focusing on 2D groups, further statistical analysis performed between the different groups (Mann–Whitney U) revelated a reduction of EIG values by effect of alcohol, with significant differences between the SALINE vs. ALC+COC (p=0.015) and COC vs. ALC+COC (p=0.003) groups, but not between SALINE vs COC groups (p=0.248). As expected, alcohol consumption caused a decrease in the glycosylation of transferrin (lower EIG) for rats, but not cocaine consumption. It is well known that chronic alcohol abuse affects glycosylation of proteins;[19] for this reason, CDT is used as biomarkers of this disorder [3] However, the effect of cocaine abuse on transferrin has been only described for the saturation of transferrin [20] (amount of iron bound to this protein) and not for its glycosylation. So, the comparison of EIG results obtained between SALINE and COC groups seems to indicate the negligible effect of cocaine in proteins glycosylation. Moreover, EIG value for ALC+COC 2D subgroup was significantly lower than ALC+COC 30D subgroup (p=0.022), indicating that the loss of transferrin glycosylation from alcohol consumption was recovered after 30 days of withdrawal. In sum, the sensor was able to monitor the decrease of EIG (transferrin glycosylation) owing to alcohol consumption, and also the recovery of EIG to basal levels after a long withdrawal period (30 days).
Then, sex dimension was also studied (see Figure 2B). In all subgroups, except COC 2D, the EIG median was slightly lower for female than for male rats. In fact, we found significant differences between sexes (all male cases vs all female cases, Mann-Whitney U test, p=0.002). In this sense, Trbojević-Akmačić et al. reported that men produce Tf with higher carbohydrate branching and chain length than woman [21], so our results in rats are coherent with those provided for humans. Kruskal-Wallis H test showed significant differences among the 2D groups (SALINE, ALC+COC and COC) for female rats (p=0.002) but not for male rats (p=0.380). In addition, there were no significant differences among 30D groups for either female (p=0.442) or male (p=0.589) rats. Regarding alcohol effect (2D group), there were significant differences between ALC+COC 2D and SALINE 2D for female rats (Mann-Whitney U test, p=0.015), but not for male rats (p=0.157). Moreover, ALC+COC 2D female rats showed significantly lower EIG values than ALC+COC 2D males (p = 0.025). However, there are not significant differences between male and female rats in SALINE 2D group (p=0.279). This may indicate a higher toxic effect of alcohol on female than male rats, as reported for humans [22] Moreover, regarding the withdrawal period of 30D, we found significant differences between ALC+COC 2D and ALC+COC 30D for female (p=0.082) and male rats (p=0.043), but not among 30D groups (SALINE, ALC+COC, COC) (Kruskal-Wallis H test, p=0.589 for male and p=0.442 for female). So, this withdrawal period is enough for the recovery of protein glycosylation in both sexes.
3.2. Preclinical validation of the sensor
In our previous article,[4] we reported an EIG cut-off value of 0.61 to identify alcohol abuse in rats. In that case, the corresponding ROC curve was plotted by using two well-controlled groups: SALINE and ALCOHOL. Rats from alcohol group received 2g alcohol per kg body weight by using an intravenous catheter for 21 days. Furthermore, the sex dimension was not addressed in these experiments. In this case, the first approach was to use this cut-off value on the new set of data (Table S1), considering SALINE 2D and 30D, ALC+COC 30D, and COC 2D and COC 30D as negative samples (non-alcohol consumers); and only ALC+COC 2D as positive sample (alcohol consumers), considering the statistical analysis performed previously. Results are shown in the Table 1, and it can be observed that only 30% of alcoholic male rats were correctly classified and 67% of alcoholic female rats were correctly classified. In general, 40 of 56 male rats’ samples were correctly classified, and 44 of 65 samples were correctly classified, giving rise to 71% and 68% of correct classification, respectively.
Using equation 2, this cut-off value yields a sensitivity of 50% and a specificity of 74%. Clearly, the sensitivity is not satisfactory for screening purposes, because it means 50% of false negatives. It is better to obtain a false positive (specificity) than a false negative (sensitivity), because a false positive can be confirmed later by a more robust bench-top instrument.
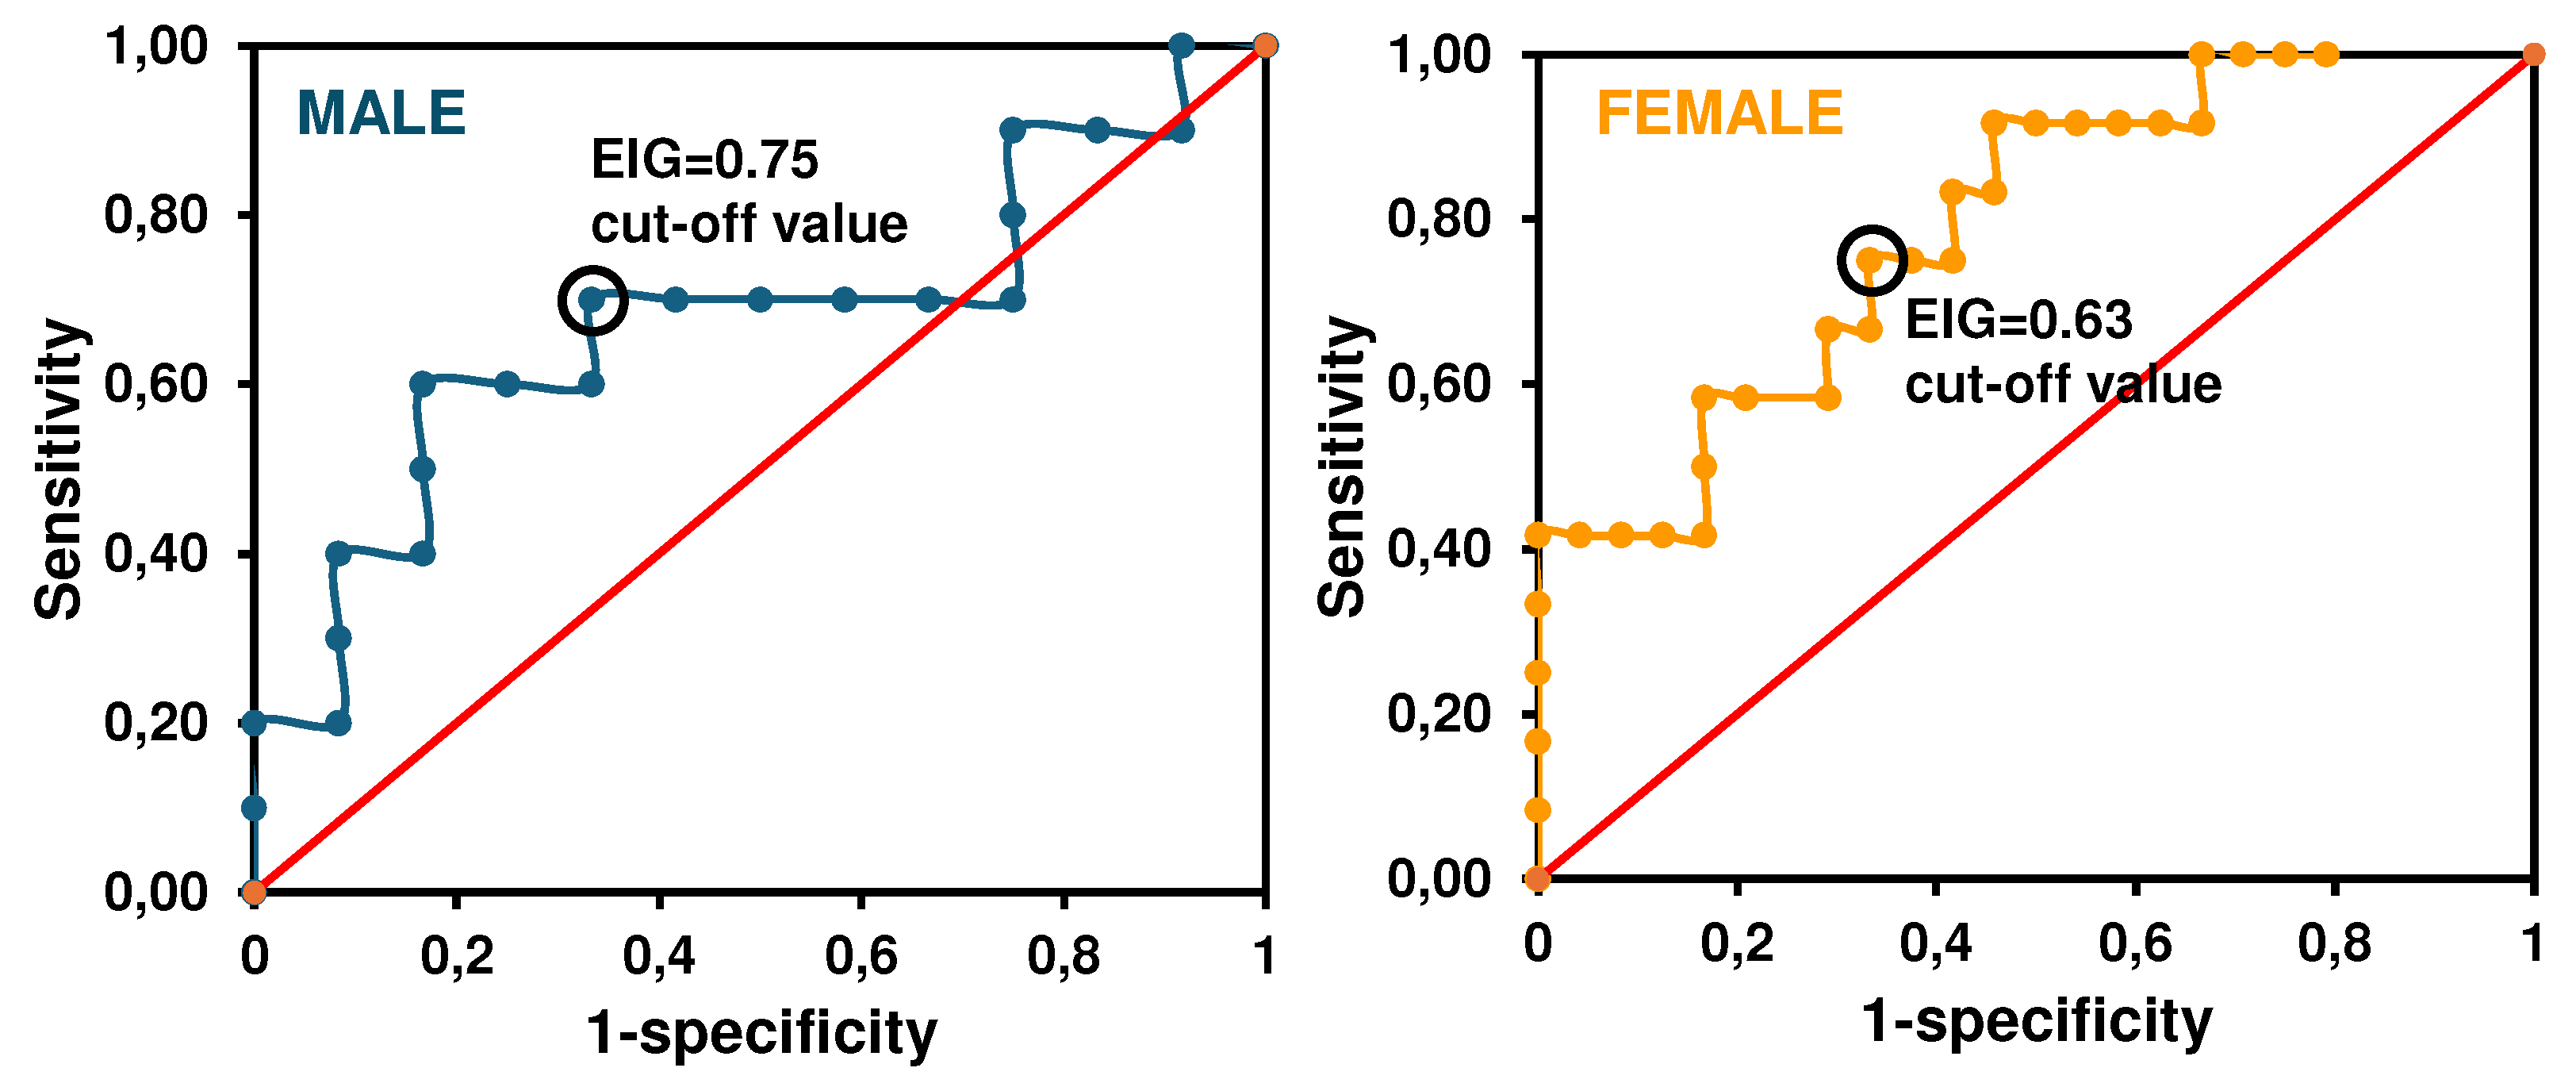
Considering the latter and the EIG differences between female and male rats showed in this work, it was considered necessary to establish a new cut-off value for alcohol chronic abuse considering the sex dimension. To this end, the data from SALINE group (2D and 30D) were chosen as negative cases (control group); and data from ALC+COC 2D was chosen as positive cases. With these data, the corresponding ROC curves were plotted for male and female rats (see Figure 3). The best diagnostic performance of the sensor was provided by the EIG values of 0.75 for male (Youden’ index=0.37), and 0.63 for female (Youden’ index=0.42). These new cut-off values were higher than in our previous work (EIG=0.61),[4] surely, due to the lower amount of alcohol ingested by rats in the self-administered mode (current work) with respect to direct vein infusion (previous work).
These new cut-off values yielded a sensitivity of 70% for male and 83% for female, and a specificity of 57% for male and 58% for female rats, reducing the number of false negatives (higher sensitivity) with respect to the previous cut-off value (EIG=0.61).
These new cut-off values were used to classify all samples from the different subgroups (SALINE 2D and 30D, ALC+COC 2D and 30D, and COC 2D and 30D), considering the sex (see Table 2). Samples from groups SALINE 2D, SALINE 30D, COC2D, COC30D and ALC+COC 30D were considered as non-alcohol samples and the group ALC+COC 2D was considered as alcohol samples.
As can be seen in Table 2, 70% of alcoholic male rats were correctly classified, and 83% of alcoholic female rats were correctly classified. In general, 33 of 56 male rats’ samples were correctly classified, and 41 of 65 female rats’ samples were correctly classified, giving rise to 59 and 63% of correct classification, respectively.
Although these values of general correct classification are lower that the previously reported with the 0.61 EIG cut-off value, it must be considered the improvement of correct classification for alcoholic rats from 30% to 70% in male rats with the new EIG cut-off value and from 67 to 83% in female rats. In contrast, this improvement in alcoholic rats’ classification is counter in the total rats’ classification by the misclassification of the larger population of non-alcoholic rats, whose correct classification decreased from 80% to 57% in male rats and from 68 to 58% in female rats with the new EIG cut-off values. All in all, new EIG cut-off values produced a significant improvement of chronic alcohol consumers classification sample, minimizing false negatives which is the main handicap of a sensor for its clinical application. In addition, the sensitivity provided by the sensor is in the range of other CDT-based assays for humans (39-94%) [3].
Currently, there is a commercial immunoassay kit “N Siemens Latex CDT assay” for the evaluation for carbohydrate deficient transferrin (CDT). Our approach employes a hand-held instrument and it can be used near the point of care, unlike N Siemens Latex CDT assay which a bench-top equipment (nephelometer) is needed. Moreover, our sensor is disposable (preventing cross-contamination), cheap and easy-to-use, so it is a perfect candidate for a POCT used by non-specialized personnel in detox treatments.
4. Conclusions
In this work, an electrochemical sensor for alcohol abuse identification was validated by the analysis of plasma from rats that self-administered alcohol and cocaine, trying to imitate this frequent human consumption pattern. The proposed sensor was able to discriminate between alcohol consuming rats (ALC+COC 2D group) and non-alcohol consuming rats (SALINE and COC), with the former showing significantly lower EIG values. Moreover, there were significant differences between ALC+COC 2D group and ALC+COC 30D group, so after 30 days of withdrawal the EIG values of rats returned to normal values.
Regarding the sex, female rats that self-administered cocaine and alcohol showed significantly lower EIG values than males after two withdrawal days, demonstrating higher influence of alcohol on females than males. This fact led us to establish different cut-off values according to sex (0.63 for female and 0.75 for male). According to these new cut-off values, the sensor showed a sensitivity of 70% for male and 75% for female rats, and a specificity of 67% for both sexes.
Our sensor shows specific characteristics to be used as POCT for alcohol abuse identification and monitoring such as portability, disposability, low-cost and user-friendly. Although this sensor didn’t provide extraordinary sensitivity and specificity, it was able to monitor the decrease of EIG due to alcohol consumption, and the recovery of EIG after a long withdrawal period (30 days). Therefore, this sensor may be a useful tool for physicians, therapists and caregivers in detox processes, after carrying out the corresponding clinical validation in humans.
Supplementary Materials
The following supporting information can be downloaded at the website of this paper posted on Preprints.org.
References
- Liu, Y.; Williamson, V.G.; Setlow, B.; Cottler, L.B.; Knackstedt, L.A. The importance of considering polysubstance use: lessons from cocaine research. Drug Alcohol Depend. 2018, 192, 16–28. [Google Scholar] [CrossRef]
- Niemelä, O. Biomarkers in alcoholism. Clin. Chim. Acta 2007, 377, 39–49. [Google Scholar] [CrossRef]
- Hannuksela, M.L.; Liisanantti, M.K.; Nissinen, A.E.; Savolainen, M.J. Biochemical markers of alcoholism. cclm 2007, 45, 953–61. [Google Scholar] [CrossRef] [PubMed]
- Rodriguez-Hidalgo, G.; Sierra, T.; Dortez, S.; Marcos, A.; Ambrosio, E.; Crevillen, A.G.; Escarpa, A. Transferrin analysis in wistar rats plasma: Towards an electrochemical point-of-care approach for the screening of alcohol abuse. Microchem. J. 2022, 181. [Google Scholar] [CrossRef]
- Bortolotti, F.; Sorio, D.; Bertaso, A.; Tagliaro, F. Analytical and diagnostic aspects of carbohydrate deficient transferrin (CDT): A critical review over years 2007–2017. J. Pharm. Biomed. Anal. 2018, 147, 2–12. [Google Scholar] [CrossRef]
- Caslavska, J.; Thormann, W. Monitoring of alcohol markers by capillary electrophoresis. J. Sep. Sci. 2012, 36, 75–95. [Google Scholar] [CrossRef]
- Delanghe, J.R.; Helander, A.; Wielders, J.P.; Pekelharing, J.M.; Roth, H.J.; Schellenberg, F.; Born, C.; Yagmur, E.; Gentzer, W.; Althaus, H. Development and Multicenter Evaluation of the N Latex CDT Direct Immunonephelometric Assay for Serum Carbohydrate-Deficient Transferrin. Clin. Chem. 2007, 53, 1115–1121. [Google Scholar] [CrossRef] [PubMed]
- Kim, C.; Kang, M.S.; Raja, I.S.; Joung, Y.K.; Han, D.-W. Advancements in nanobiosensor technologies for in-vitro diagnostics to point of care testing. Heliyon 2024, 10, e40306. [Google Scholar] [CrossRef] [PubMed]
- Vashist, S.K.; Luppa, P.B.; Yeo, L.Y.; Ozcan, A.; Luong, J.H.T. Emerging Technologies for Next-Generation Point-of-Care Testing. Trends Biotechnol. 2015, 33, 692–705. [Google Scholar] [CrossRef] [PubMed]
- Hernández-Rodríguez, J.F.; Rojas, D.; Escarpa, A. Electrochemical Sensing Directions for Next-Generation Healthcare: Trends, Challenges, and Frontiers. Anal. Chem. 2020, 93, 167–183. [Google Scholar] [CrossRef] [PubMed]
- Dai, Y.; Liu, C.C. Recent Advances on Electrochemical Biosensing Strategies toward Universal Point-of-Care Systems. Angew. Chem. 2019, 131, 12355–12368. [Google Scholar] [CrossRef] [PubMed]
- Paimard, G.; Ghasali, E.; Baeza, M. Screen-Printed Electrodes: Fabrication, Modification, and Biosensing Applications. Chemosensors 2023, 11, 113. [Google Scholar] [CrossRef]
- Sierra, T.; Crevillen, A.G.; Escarpa, A. Electrochemical sensor for the assessment of carbohydrate deficient transferrin: Application to diagnosis of congenital disorders of glycosilation. Biosens. Bioelectron. 2021, 179, 113098. [Google Scholar] [CrossRef] [PubMed]
- Trefulka, M.; Paleček, E. Direct chemical modification and voltammetric detection of glycans in glycoproteins. Electrochem. Commun. 2014, 48, 52–55. [Google Scholar] [CrossRef]
- Trefulka, M.; Černocká, H.; Staroňová, T.; Ostatná, V. Voltammetric analysis of glycoproteins containing sialylated and neutral glycans at pyrolytic graphite electrode. Bioelectrochemistry 2024, 163, 108851. [Google Scholar] [CrossRef]
- Marcos, A.; Moreno, M.; Orihuel, J.; Ucha, M.; de Paz, A.M.; Higuera-Matas, A.; Capellán, R.; Crego, A.L.; Martínez-Larrañaga, M.-R.; Ambrosio, E.; et al. The effects of combined intravenous cocaine and ethanol self-administration on the behavioral and amino acid profile of young adult rats. PLOS ONE 2020, 15, e0227044. [Google Scholar] [CrossRef]
- Conigrave, K.M.; Degenhardt, L.J.; Whitfield, J.B.; Saunders, J.B.; Helander, A.; Tabakoff, B. ; on behalf of the WHO/ISBRA Study Group CDT, GGT, and AST As Markers of Alcohol Use: The WHO/ISBRA Collaborative Project. Alcohol. Clin. Exp. Res. 2002, 26, 332–339. [Google Scholar] [CrossRef] [PubMed]
- Nahm, F.S. Nonparametric statistical tests for the continuous data: the basic concept and the practical use. Korean J. Anesthesiol. 2016, 69, 8–14. [Google Scholar] [CrossRef] [PubMed]
- Waszkiewicz, N.; Szajda, S.D.; Zalewska, A.; Szulc, A.; Kępka, A.; Minarowska, A.; Wojewódzka-Żelezniakowicz, M.; Konarzewska, B.; Chojnowska, S.; Ładny, J.R.; et al. Alcohol abuse and glycoconjugate metabolism. Folia Histochem. et Cytobiol. 2012, 50, 1–11. [Google Scholar] [CrossRef]
- Ersche, K.D.; Acosta-Cabronero, J.; Jones, P.S.; Ziauddeen, H.; van Swelm, R.P.L.; Laarakkers, C.M.M.; Raha-Chowdhury, R.; Williams, G.B. Disrupted iron regulation in the brain and periphery in cocaine addiction. Transl. Psychiatry 2017, 7, e1040–e1040. [Google Scholar] [CrossRef] [PubMed]
- Trbojević-Akmačić, I.; Vučković, F.; Pribić, T.; Vilaj, M.; Černigoj, U.; Vidič, J.; Šimunović, J.; Kępka, A.; Kolčić, I.; Klarić, L.; et al. Comparative analysis of transferrin and IgG N-glycosylation in two human populations. Commun. Biol. 2023, 6, 1–13. [Google Scholar] [CrossRef]
- Cargiulo, T. Understanding the health impact of alcohol dependence. Am. J. Heal. Pharm. 2007, 64 (Suppl. S3), S5–S11. [Google Scholar] [CrossRef] [PubMed]
Figure 1.
Experimental design to evaluate the level of EIG in polydrug-consuming rats.
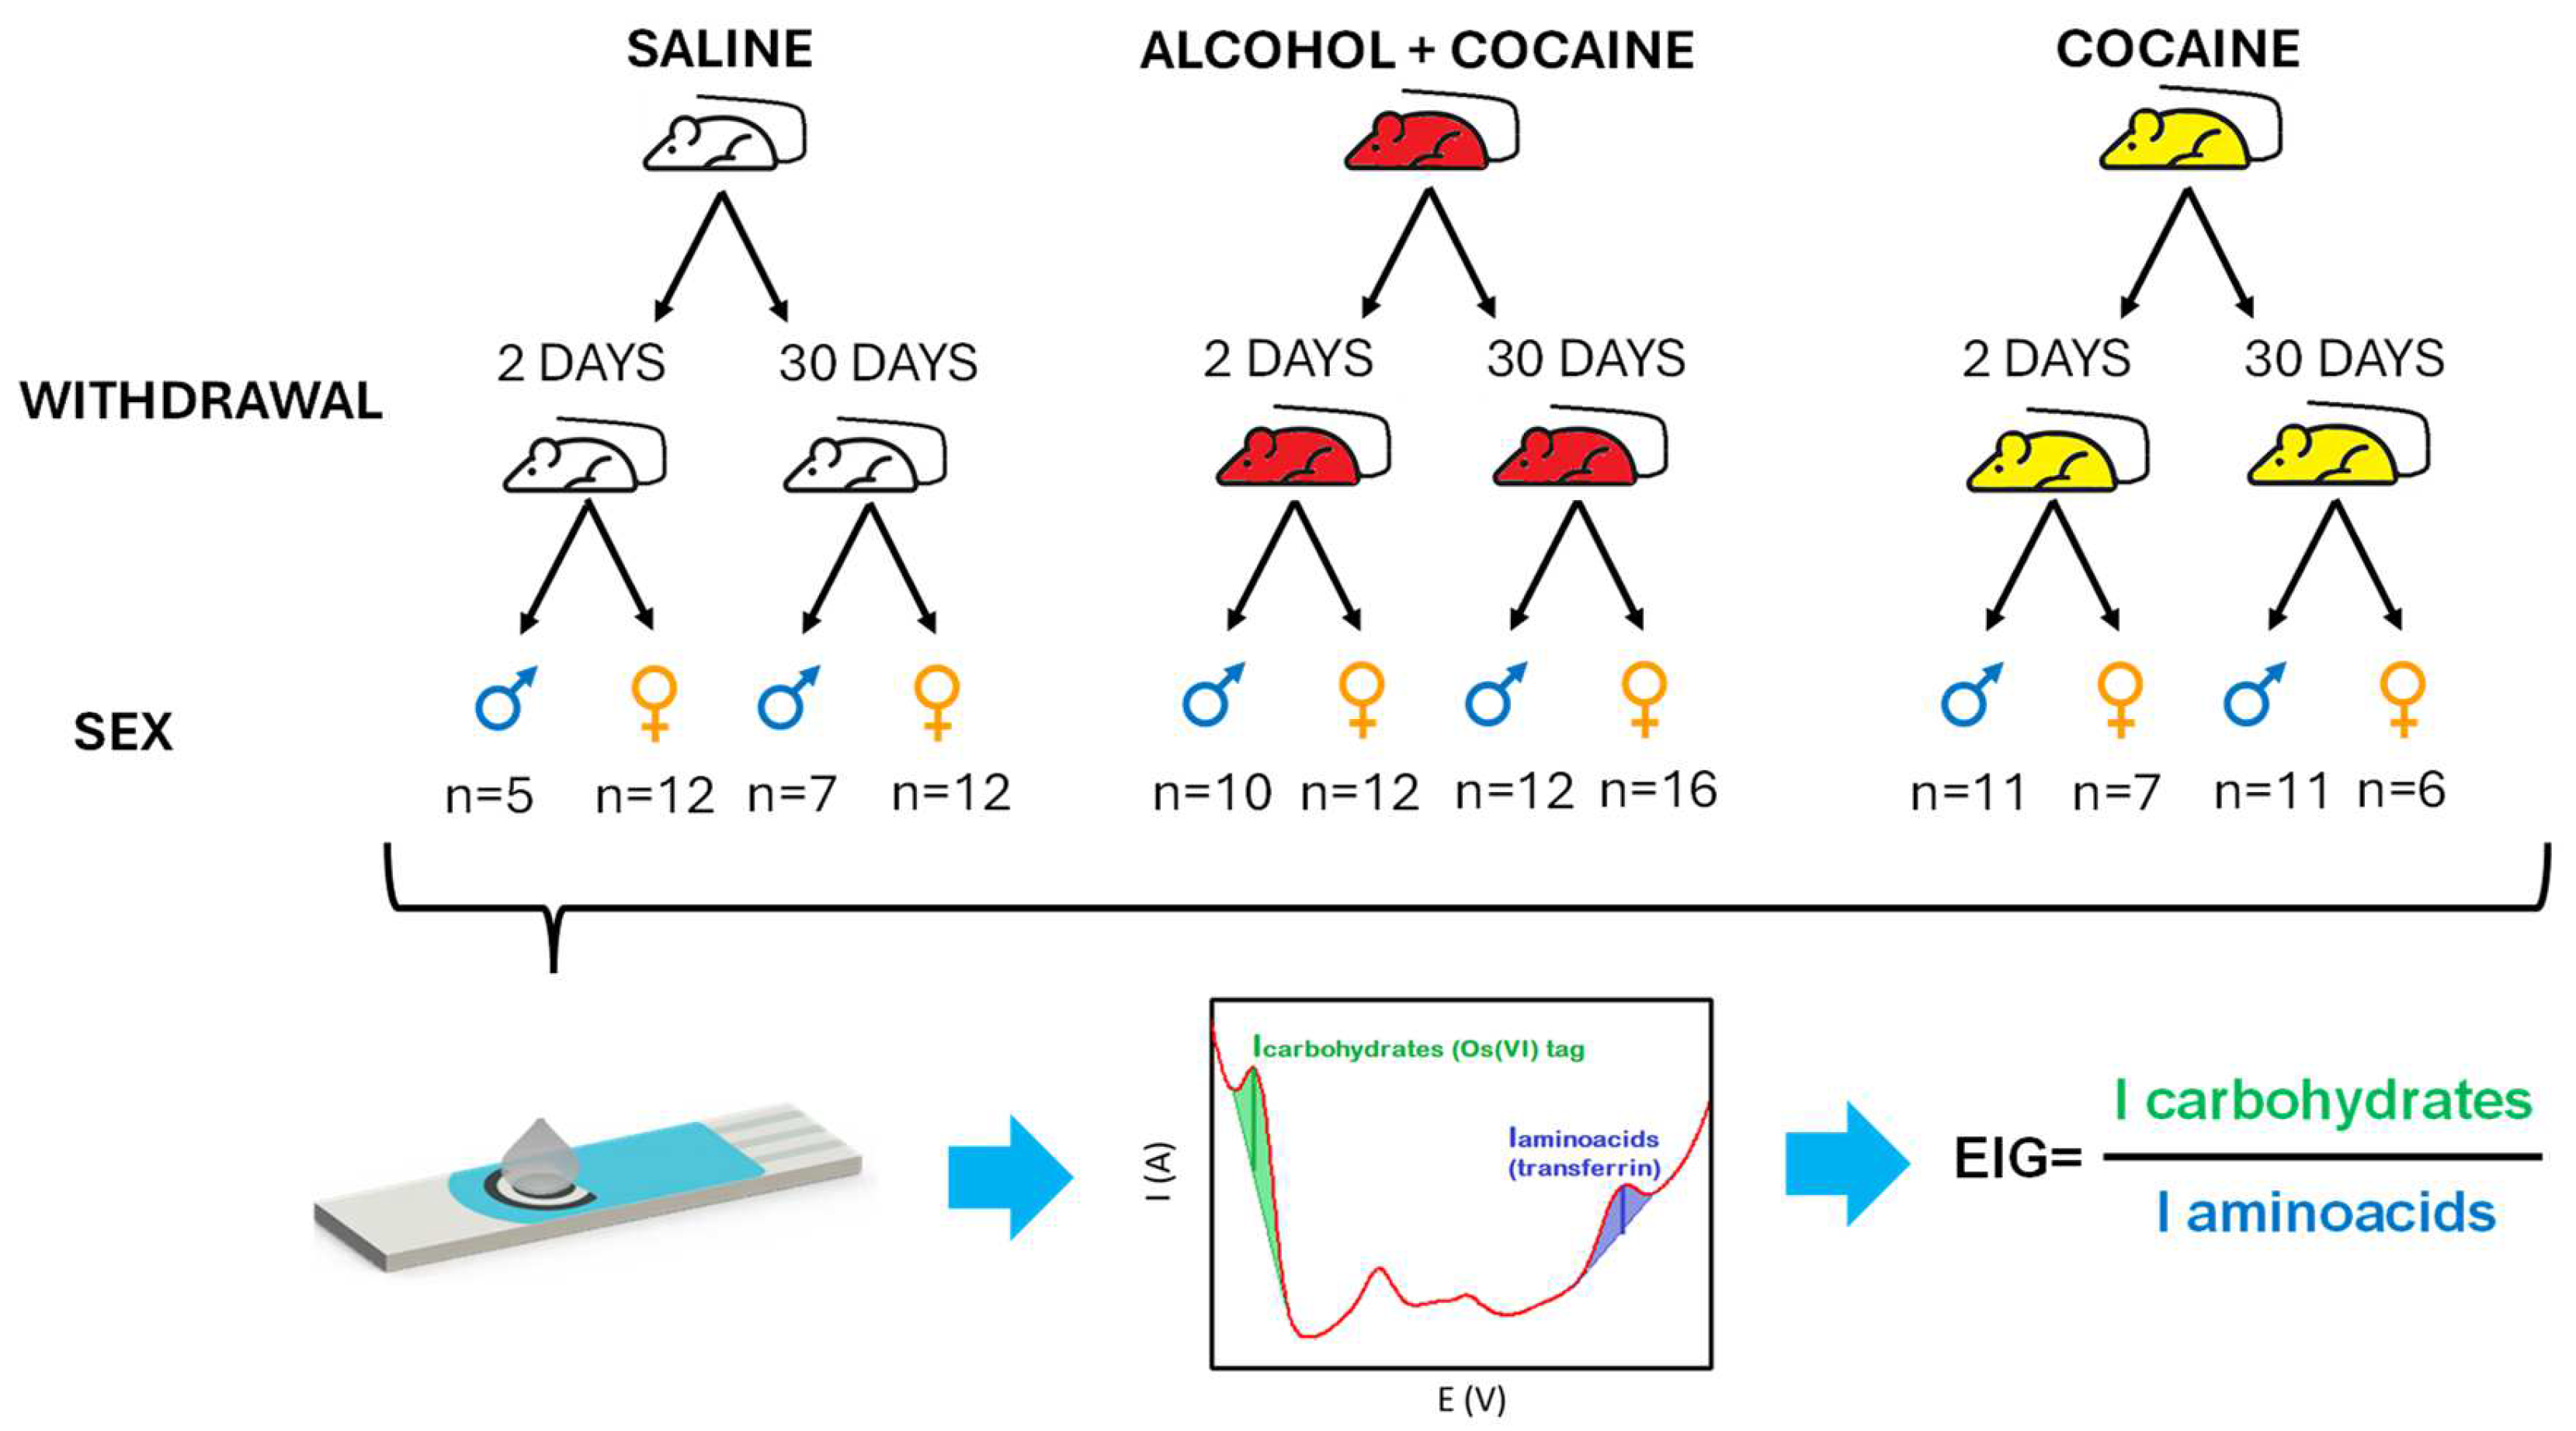
Figure 2.
Box and whiskers plot for each subgroup without considering sex (A) and considering sex (blue for male, and orange for female) (B). Red arrows and asterisks indicate the subgroups that show significant differences from other subgroups (p<0.1).
Figure 2.
Box and whiskers plot for each subgroup without considering sex (A) and considering sex (blue for male, and orange for female) (B). Red arrows and asterisks indicate the subgroups that show significant differences from other subgroups (p<0.1).
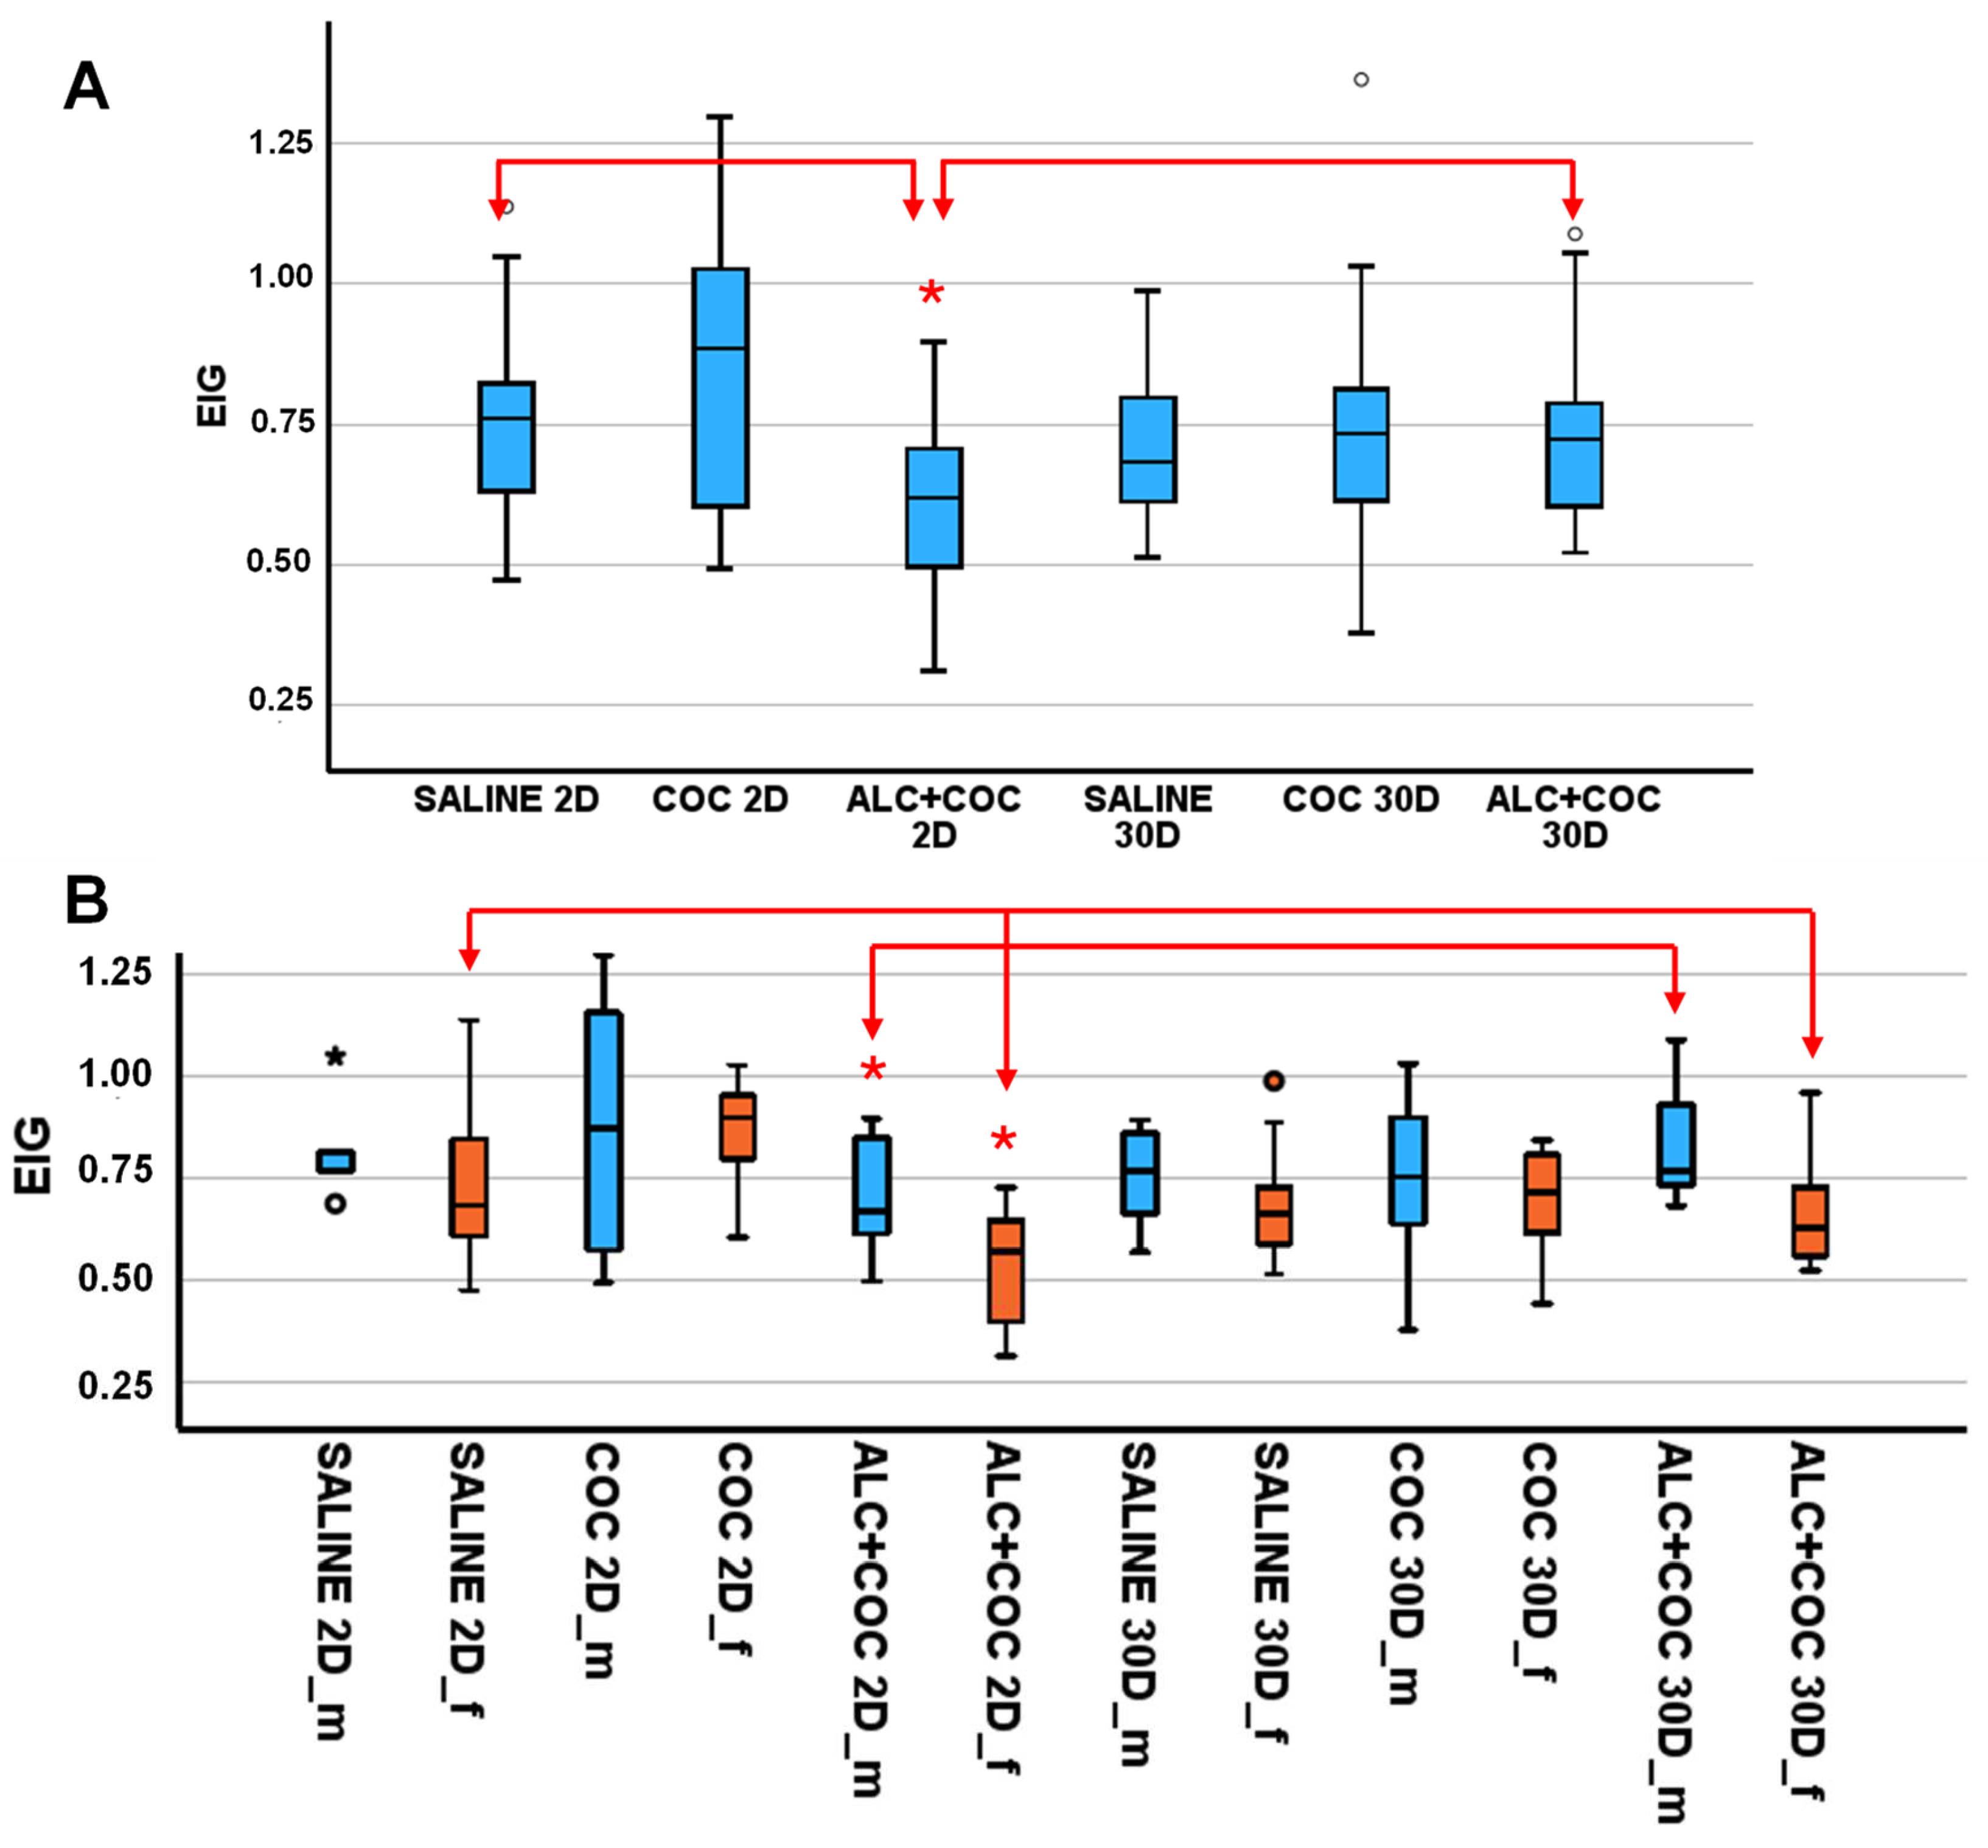
Figure 3.
ROC curves for alcohol abuse identification in male (blue line) and female rats (orange line). The red line corresponds to no discrimination line.
Figure 3.
ROC curves for alcohol abuse identification in male (blue line) and female rats (orange line). The red line corresponds to no discrimination line.
Disclaimer/Publisher’s Note: The statements, opinions and data contained in all publications are solely those of the individual author(s) and contributor(s) and not of MDPI and/or the editor(s). MDPI and/or the editor(s) disclaim responsibility for any injury to people or property resulting from any ideas, methods, instructions or products referred to in the content. |
© 2025 by the authors. Licensee MDPI, Basel, Switzerland. This article is an open access article distributed under the terms and conditions of the Creative Commons Attribution (CC BY) license (http://creativecommons.org/licenses/by/4.0/).
Copyright: This open access article is published under a Creative Commons CC BY 4.0 license, which permit the free download, distribution, and reuse, provided that the author and preprint are cited in any reuse.


