
Submitted:
05 February 2025
Posted:
05 February 2025
You are already at the latest version
Abstract
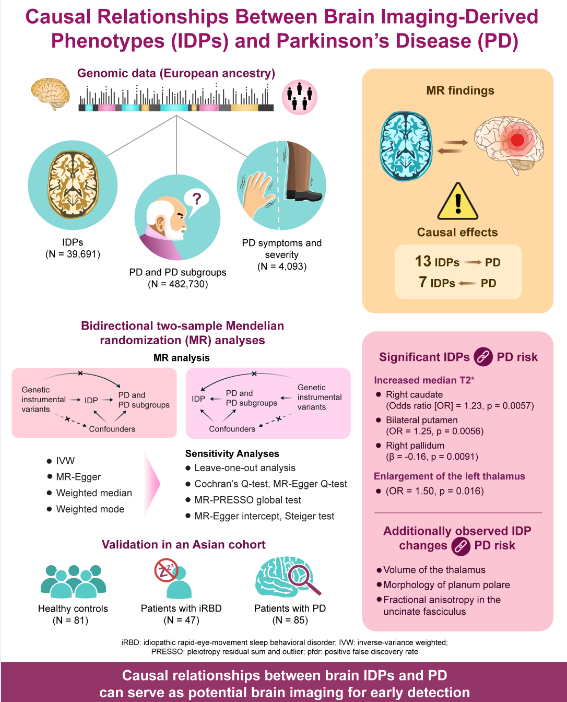
Background/Objectives: Observational studies have suggested a correlation between brain imaging alterations and Parkinson’s disease (PD). However, data on causal relationships are still lacking. This study aimed to examine the causal relationship between brain imaging-derived phenotypes (IDPs) and PD. Methods: A bidirectional two-sample Mendelian randomization analysis was conducted to explore the causal association between IDPs and PD. Summary-level data for IDPs (n=39,691), PD (n=482,730), and PD symptoms (n=4,093) were obtained from genome-wide association studies of European ancestry. Clinical validation was performed in an Asian cohort, which involved healthy controls (n=81), patients with idiopathic rapid-eye-movement sleep behavior disorder (iRBD) (n=47), and patients with PD (n=85). Results: We found 13 IDPs with significant causal effects on PD and 7 reciprocal effects of PD on IDPs. For instance, increased median T2star in the right caudate (odds ratio=1.23, 95% confidence interval 1.08–1.40, p=0.0057) and bilateral putamen (left: odds ratio=1.25, 95% confidence interval 1.09–1.43, p=0.0056; right: odds ratio=1.25, 95% confidence interval 1.10–1.43, p=0.0056) were associated with PD. Enlargement of the left thalamus (odds ratio=1.50, 95% confidence interval 1.14–1.96, p=0.016) demonstrated causal links with PD. No reverse causal effects were detected. Observational analyses results in the Asian cohort (healthy controls, iRBD, PD) aligned with the Mendelian randomization results. Conclusions: Our results suggest bidirectional causal links between IDPs and PD, offering insights into disease mechanisms and potential imaging biomarkers for PD.
Keywords:
Parkinson disease
; neuroimaging
; Mendelian randomization analysis
; causality
1. Introduction
Parkinson’s disease (PD) is the second most prevalent neurodegenerative disorder globally, imposing a significant health and economic burden on the society. Despite extensive research, the pathogenesis of PD remains unclear, and no effective causative treatments exist. Owing to its insidious onset and prolonged clinical latency, opportunities for early neuroprotection are often missed by the time motor symptoms emerge. Therefore, identifying early diagnostic biomarkers and exploring the underlying mechanisms of PD are crucial.
Brain imaging, a non-invasive method, is essential for detecting PD at various stages by revealing changes in brain structure, connectivity, and function. Observational studies have linked brain imaging-derived phenotypes (IDPs) to PD. For example, susceptibility-weighted imaging shows reduced high signals in the dorsal lateral substantia nigra (nigrosome 1) in patients with PD [1], aiding in the conversion from idiopathic rapid-eye-movement sleep behaviour disorder (iRBD) to PD [2]. Diffusion-weighted imaging also reveals altered connections among the substantia nigra, thalamus, and striatum in PD [3]. Additionally, changes in brain region volumes and functional connectivity distinguish healthy individuals from patients with PD and different PD symptoms. Although these findings suggest a strong link between brain imaging findings and PD, observational studies may involve confounding factors and cannot clarify whether imaging features precede or follow PD onset. Therefore, investigating the causal role of IDPs in PD, and vice versa, is essential.
Mendelian randomization (MR) analysis, comparable to a naturally occurring randomized controlled trial, randomly allocates alleles during gametogenesis, making it useful for assessing causal relationships between exposure and outcome. By using single nucleotide polymorphisms as instrumental variables, MR controls confounding factors and avoids reverse causality. In 2023, Zhu et al. used MR to study the link among three white matter lesions (i.e., white matter hyperintensities, fractional anisotropy, and mean diffusivity) and PD risk [4]. Yu et al. also recently used MR to explore the association between brain structure and PD risk [5]. However, these studies focused on structural changes and lacked data on connectivity and function. Furthermore, they did not examine causal links between IDPs and PD symptoms or severity. Therefore, a comprehensive analysis of multimodal brain imaging and its relationship with PD, motor/non-motor symptoms, and severity is needed. Understanding these causal relationships may uncover PD pathogenesis, early biomarkers, and targets for prevention.
Thus, this study aimed to examine the causal relationship between brain IDPs and PD. Towards this goal, we performed bidirectional two-sample MR to explore causal associations between 3,370 IDPs (n=39,691) and PD (n=482,730), along with PD symptoms and severity (n=4,093) [6,7,8]. The findings were then validated in an Asian PD cohort to determine if results from European patients applied to Asians. Additionally, patients with iRBD confirmed by video-polysomnography were included to support our MR findings, helping in our investigation of the causal role of IDPs in PD and the identification of neuroimaging changes that preceded PD onset.
2. Materials and Methods
2.1. Study Design
Genome-wide association studies (GWAS) summary data on IDPs and PD, including motor/non-motor symptoms and disease severity, were focused on individuals of European descent to minimize population bias. Care was taken to avoid including individuals in both exposure and outcome groups, reducing false positives. A two-sample MR analysis was then performed between exposure-outcome pairs with genetic correlation, along with a reverse MR to test for reverse causality. The primary method used was the inverse variance-weighted method, supplemented by MR-Egger, weighted median, and weighted mode methods. Sensitivity analyses was used to assess the robustness of the MR results. Finally, the MR findings were validated in our Asian cohort (healthy controls [HCs], iRBD, PD) to examine the relationship between brain IDPs and PD. In summary, GWAS data, MR analysis, and independent cohort validation were used to explore the relationship between brain IDPs and PD. The study flowchart is shown in Figure 1.
2.2. GWAS Datasets of Brain IDPs
Summary data were obtained from Smith et al., who conducted a GWAS using 39,691 brain-imaged samples in the UK Biobank in 2021 [6]. To ensure reliability and reproducibility of our results, we filtered the IDPs using the following process. First, some regions might be measured more than one time with different tools, resulting in redundant IDPs. Thus, we only kept the IDPs measured by the most commonly used tools. Second, we selected DWI-derived IDPs analyzed by both TBSS and probabilistic tractography to cover all connectivity information. We included the following IDPs: (1) T1 imaging metrics: grey matter, white matter, cerebrospinal fluid, and whole brain volumes; volumes of specific brain regions, cortical area and thickness; (2) susceptibility-weighted imaging metrics: thalamus, caudate, putamen, pallidum, hippocampus, amygdala, and accumbens; (3) diffusion-weighted imaging metrics (fractional anisotropy [FA], mean diffusivity, intracellular volume fraction) analyzed via TBSS and probabilistic tractography; and (4) rest-state MRI with ICA analyses. A total of 3,370 IDP traits were selected for the study, as outlined in Table S1 [6]. Table S2 provides detailed information on IDP GWAS.
2.3. GWAS Datasets of PD and Its Manifestations and Severity
The PD GWAS data from the International Parkinson Disease Genomics Consortium 2019 release included 33,674 disease cases and 449,056 controls [7]. PD severity and symptom data were obtained from 12 longitudinal cohorts (n=4,093) in a GWAS conducted by Iwaki et al. in 2019 [8]. These data covered continuous measures (Hoehn and Yahr [H-Y] staging, Unified Parkinson Disease Rating Scale [UPDRS] scores, Mini-Mental State Examination score, Montreal Cognitive Assessment score, and Schwab and England Activities of Daily Living Scale score) and binomial measures (constipation, cognitive impairment, depression). Importantly, we carefully selected non-overlapping datasets from populations of same ancestors. There was no overlap between IDP and PD GWAS data because of their diverse origins. Details are provided in Table S2.
2.4. Selection of Instrument Variants and Harmonization of Single Nucleotide Polymorphisms
In this two-sample MR study, instrumental variables (IVs) were selected based on three core criteria: (1) strong association with exposure (p<5×10⁻⁸); (2) independence from confounders, verified using Phenoscanner V2; and (3) pathway-specific influence on outcome (p>5×10⁻⁵). Detailed criteria are listed in the supplemental methods. SNP independence was determined using PLINK clumping with the 1000 Genomes Project as a reference for linkage disequilibrium trimming (R2 <0.001 and LD >10000 kb). Further quality control included calculating the F-statistic for each IV, excluding those with F<10. After harmonization and removal of palindromic and ambiguous SNPs, the final IVs were used in MR analyses. These IVs are listed in Tables S3 and S4.
2.5. Bidirectional Two-Sample MR Analyses
The MR analysis consisted of two parts: forward MR assessed whether IDPs causally influenced PD, severity, and symptoms, whereas reverse MR examined whether reverse causal relationships existed in the positive forward MR results. Using the study by Burgess et al. as guide, inverse variance-weighted MR was applied as the primary method. We began with a fixed-effects model and calculated Cochrane's Q statistic using a chi-square test. If p<0.05 (indicating heterogeneity), a multiplicative random-effects model was used. To ensure reliability, additional analyses were conducted using MR-Egger, weighted median, and weighted mode methods. The Wald Ratio was applied when only one genetic instrument was available.
2.6. Sensitivity Analysis
Sensitivity analyses were performed to verify the results of MR study with four methods: Cochran’s Q test, leave-one-out analysis, MR-Egger intercept, and MR-PRESSO. Cochrane's Q test was employed for the heterogeneity investigation, and the MR-Egger intercept and MR-PRESSO global test were used for the pleiotropy assessment. A genetic variant was referred to as pleiotropic if it had associations with more than one risk factor on different causal pathways. The Steiger test was subsequently conducted to prevent potential reverse causation. The leave-one-out test was performed to determine if a single SNP could determine the MR result. After these analyses, sub-optimal single nucleotide polymorphisms were excluded, and another MR analysis was performed to obtain the final results.
2.7. Observational Study Participants
A total of 213 participants, including 81 HCs, 47 patients with iRBD and 85 patients with PD, were recruited from the Department of Neurology, Ruijin Hospital, Shanghai, China. Participants met the following criteria: (1) age 45-80 years, (2) absence of dementia or psychiatric disorders, (3) no history of intracranial surgery or traumatic brain injury, (4) no familial history of PD or other neurological disorders, and (5) no systemic inflammatory or severe primary diseases. PD diagnoses were made by at least two neurologists based on current Movement Disorders Society criteria. IRBD diagnoses were confirmed by video-polysomnography following the International Classification of Sleep Disorders-II criteria. All patients with iRBD were examined to exclude motor signs of parkinsonism or secondary causes.
2.8. Brain Magnetic Resonance Imaging Acquisition and Processing
Structural and functional images were acquired using 3T Siemens scanners with a 12-channel head coil at the Department of Radiology, Ruijin Hospital. T1-weighted images were obtained using a 3D magnetization-prepared rapid acquisition gradient-echo sequence, and structural connectivity was assessed via diffusion-weighted imaging scanning. Detailed settings are provided in the supplementary methods. Imaging was processed using the UKB pipeline (https://git.fmrib.ox.ac.uk/falmagro/UK_biobank_pipeline_v_1). Positive IDPs in the MR study were analyzed in the observational cohort.
2.9. Statistical Analysis
All MR analyses were performed using TwoSampleMR (version 0.5.7) and MRPRESSO in R Software 4.3.1. (https://www.R-project.org). All statistical analyses were performed with car (version 3), readxl (version 1.4.3), nlme, multcomp, pROC, tidyverse, dunn.test, PMCMR, FSA, DescTools, and dplyr packages in R. An exposure-outcome association was considered positive if (1) p<0.05 in the inverse variance-weighted method and (2) the direction of results from MR-Egger, weighted median, and weighted mode were consistent with inverse variance-weighted. The Bonferroni method was used for multiple comparison corrections of instrumental variations, and Benjamini-Hochberg false discovery rate (FDR) method was used for multiple comparison corrections of different IDPs. In the observational study, clinicodemographic characteristics were analyzed using chi-square tests or analysis of variances (ANOVAs). Brain imaging values were analyzed using a fixed-effect model, adjusting for linear or nonlinear age and sex effects. Two-sample t-tests were used for two-group comparisons and ANOVAs or Kruskal–Wallis tests used for three-group comparisons, depending on data distribution and homoscedasticity. Multiple comparisons were followed by Dunnett contrasts after ANOVAs and FDR corrections after Kruskal-Wallis tests. Receiver operating characteristic curve (ROC) analysis was used to evaluate discriminative power.
3. Results
3.1. Forward MR: The Putative Causal Effects of IDPs on PD
As shown in Figure 1, IDP GWAS data were extracted from the UK Biobank imaging cohort (n=39,691), PD GWAS from the International Parkinson’s Disease Genomics Consortium (n=482,730), and PD manifestation GWAS from a 25-study meta-analysis (n=4,093). We identified 13 IDPs with significant causal effects on PD (Figure 2, Table S5). The scatter plots are shown in Figure S1. In susceptibility-weighted imaging analysis, increased median T2star in the right caudate was associated with higher PD risk (odds ratio [OR]=1.23, p=0.0057) (Figure 2a). An elevated T2star was also observed bilaterally in the putamen (left: OR=1.25, p=0.0056; right: OR=1.25, p=0.0056). In T1-weighted imaging, increased left thalamus volume (OR=1.50, p=0.016) contributed to PD incidence (Figure 2a). Given the independent function of the thalamic subregions, we further analyzed the volumetric segmentation of thalamic nuclei involved in PD. Enlarged paratenial nucleus (Pt; OR=2.25, p=0.015) and ventral posterolateral nucleus (VPL; OR=1.78, p=0.0041) showed direct causal links with PD (Figure 2a). In diffusion-weighted imaging analysis, increased mode of anisotropy in the retrolenticular part of the left internal capsule reduced PD risk (OR=0.68, p=0.024). Higher median mode of anisotropy in the left acoustic radiation (OR=0.33, p=0.012) and the right uncinate fasciculus (UF) (OR=0.44, p=0.017) were also causally associated with reduced PD risk.
3.2. Forward MR: The Putative Causal Effects of IDPs on PD Severity and Symptoms
For PD severity, increased median T2star in the right pallidum appeared to reduce disease severity, as indicated by its association with a lower H-Y Scale score (β=-0.16, p=0.0091, Figure 2b). The causal links between IDPs and PD symptoms, including motor symptoms (dyskinesias, motor flux, UPDRS scores) and non-motor symptoms (constipation, dementia, depression, hyposmia, sleep disorders), were also analyzed. In diffusion-weighted imaging analysis, higher intracellular volume fraction in the splenium of the corpus callosum was linked to an increased risk of depression in patients with PD (OR=6.67, p=0.041, Figure 2c). No significant results were found for other PD symptoms. Details are provided in Table S5.
3.3. Forward MR: The Putative Causal Effects of PD and Its Severity and Symptoms on IDPs
We identified significant causal relationships between seven other IDPs and PD (Figure 2d, Table S6). The scatter plots are shown in Figure S1. The mean FA in the left UF (β=-0.04, p=0.017) was mildly reduced in PD. The area of the planum polare (β=-0.05, p=0.040, Figure 2d) located anterior to the transverse temporal gyrus was also slightly decreased in PD.
3.4. Reverse MR
As shown in Tables S5 and S6, IDPs showed no significant reverse causal relationships with PD and its severity or symptoms detected in the forward MR study.
3.5. Sensitivity Analysis
Sensitivity analyses confirmed the robustness of the MR results. The leave-one-out test indicated that no single SNP significantly influenced the causal estimates (Tables S7 and S8, Figure S2). The Steiger test found no evidence of reverse causation (Tables S9 and S10). Heterogeneity was assessed using the Cochrane's Q tests, while pleiotropy was evaluated with the MR-Egger intercept and MR-PRESSO global tests. All tests showed no significant heterogeneity or pleiotropy (Tables S11-S14).
3.6. Concordance Between Observational Study Results and MR Analysis Results
Table 1 presents the clinicodemographic characteristics of the PD (n=85), iRBD (n=47), and HC (n=81) participants. iRBD is recognized as a prodromal phase of synucleinopathies, with a high conversion rate to PD. The MR study revealed that increased striatum T2star values and enlarged thalamus, particularly subregions Pt and VPL, were causally linked with PD. We compared T2star values and thalamus volume in HCs, patients with iRBD, and patients with PD. As shown in Figure 3a and 3e, participants with iRBD had higher median T2star values, while those with PD showed a decrease in values of both caudate sides (HC vs iRBD: left caudate: p=0.00119, right caudate: p=0.0222; HC vs PD: left caudate: p=0.17, right caudate: p=0.03). Similar results were observed in both sides of the pallidum and putamen (HC vs iRBD: left pallidum: p=0.00319, right pallidum: p=6.79×10⁻⁷; HC vs PD: left pallidum: p=0.26, right pallidum: p=0.39; HC vs iRBD: left putamen: p=0.64806, right putamen: p=0.05410; HC vs PD: left putamen: p=0.0046, right putamen: p=0.00029). Thalamus volume was larger in both the iRBD and PD groups (HC vs iRBD: p=0.98; HC vs PD: p=0.042), with consistent results in the left Pt and right VPL (left Pt: HC vs iRBD: p=0.94, HC vs PD: p=0.027; right VPL: HC vs iRBD: p=0.21, HC vs PD: p=0.037) (Figure 3b and 3f). Additionally, the observational study showed decreased FA in the left UF (p<2×10-16, Figure 3c and 3g) and reduced thickness of the superior planum polare (p<2×10-16, Figure 3d and 3h) in patients with PD, consistent with the MR results.
ROC analysis was used to evaluate whether these imaging markers could serve as early PD diagnostic biomarkers (H-Y score ≤ 2). The results demonstrated moderate diagnostic accuracy for individual biomarkers (AUC=0.62–0.73, p<0.05) and improved accuracy when combining biomarkers (AUC=0.80, p<0.0001; Figure 3i). For distinguishing HCs from iRBD individuals, the combined biomarkers showed an improved AUC of 0.79 (p<0.0001; Figure 3j).
4. Discussion
The current study identified 13 IDPs with significant evidence of potential causal effects on PD, as well as potential causal effects of PD on 7 IDPs. Additionally, validation in an Asian cohort (HCs, iRBD, and PD) yielded consistent findings, offering valuable insights into PD pathogenesis and early diagnostic strategies and paving the way for advancements in disease management and prognosis. To our best knowledge, this is the first MR analysis investigating causal connections between multi-modal imaging (brain structure, connectivity, and function) and PD, including PD motor/non-motor symptoms and disease severity.
In the MR analysis, we identified susceptibility-weighted imaging features associated with increased PD risk. Susceptibility-weighted imaging measures brain tissue magnetic susceptibility, primarily influenced by iron. In the UK Biobank IDP GWAS, median T2star values were analyzed in 14 major subcortical grey matter structures, where elevated T2star levels indicated reduced iron deposition. The results demonstrated that higher T2star in the caudate and putamen were causally linked to increased PD risk, whereas lower T2star values correlated with higher H-Y scores. This suggests that reduced iron deposition in these regions may increase PD susceptibility, whereas higher iron accumulation could exacerbate PD severity. This supports the growing interest in iron deposition as a key factor in PD pathogenesis [9]. Extensive evidence indicates that during the progression of PD, iron is specifically alternated in various brain regions, notably the substantia nigra (SN). Furthermore, the dysregulation of iron causes ferritinophagy and lipid peroxidation to induce ferroptosis in PD, a form of cell death reliant on iron. According to the distinctive patterns of iron accumulation in specific brain regions, extensive studies have confirmed that imaging can potentially diagnose PD in its early stages. The current findings were consistent with those of another MR study that reported increased T2star as potentially causally associated with heightened PD risk [10]. However, that study incorrectly interpreted that increased iron levels were causally linked to PD. Furthermore, the study focused on changes in SWI and lacked data on connectivity and function. Although several observational studies have reported higher iron deposition in the SN, findings regarding iron accumulation in the striatum of patients with PD have been less consistent [11,12].
Furthermore, they did not examine causal links between IDPs and PD symptoms or severity. We propose that iron deposition in the striatum undergoes dynamic changes at different PD stages. Given that iRBD is considered a prodromal phase of PD, we examined striatum T2star values in HC, participants with iRBD, and participants with PD. The results showed increased T2star values in the caudate, putamen, and pallidum in participants with iRBD, whereas T2star values were decreased in participants with PD. This suggests a stage where iron deposition in the striatum initially decreases and then increases during PD progression. In the classic model of PD circuitry, dopaminergic projections originate from the SN and extend to the caudate, putamen, and pallidum [13]. We propose that an initial redistribution of iron occurs during the early degeneration of dopaminergic neurons, leading to increased iron in the perinuclear region of the SN (cell body) and decreased iron in the axons of the caudate and putamen (projections). As the disease progresses, iron overload spreads across all cellular compartments, leading to increased iron levels in both the SN and striatum. Interestingly, two studies support our hypothesis. Using subcellular quantification, Lashuel et al. found decreased iron levels in neurites and distal ends of neurons, whereas they were increased in cell bodies in PD models [14]. Similarly, Ortega et al. overexpressed α-synuclein in PC12 cells to model PD and observed iron redistribution with accumulation in the perinuclear region [15]. Future studies are needed to verify iron redistribution during different PD stages and explore the underlying mechanisms.
Regarding T1 imaging analyses in the MR study, the current study observed that an enlarged left thalamus volume was a potential causal risk factor for PD. The observational study showed progressive thalamic enlargement from HCs to patients with iRBD and PD. However, findings regarding whole thalamus morphology have varied. One study reported thalamic atrophy in PD [16], while others found no significant differences [17,18]. More recent studies have confirmed thalamic enlargement in PD [19,20,21], with evidence of progressive volume increase as the disease advances [21]. Additionally, increased thickness and more expansive surface areas have been observed in PD, consistent with increased volumes [19,20]. However, the causative mechanisms remain unclear. We propose that compensatory mechanisms might explain these results. As a key node in the cortico-striato-thalamo-cortical circuit, the thalamus plays a crucial role in transferring motor, associative, and limbic signals between the cortex and subcortical nuclei [13]. Thus, thalamic enlargement could reflect adaptive compensatory responses, possibly to maintain or enhance neural function in response to underlying pathology.
Furthermore, the thalamus participates in the cerebello-thalamo-cortical loop, which may compensate for degeneration in the nigrostriatal system [22]. Early thalamic hypertrophy may result from hyperactivity in the cerebellothalamic circuit, particularly linked to Parkinson’s tremor. Another interesting finding in our MR study is that elevated mean intracellular volume fraction in the splenium of corpus callosum (CC) might have a causal relationship with PD-related depression. CC is the most prominent white matter pathway providing information transfer between the two hemispheres. The splenium connects association areas of the parietal and temporal lobes (anterior splenium) and occipital lobes (posterior splenium). Observational studies have illustrated a greater FA in the splenium of CC in patients with major depression disorder than in that of healthy controls, and they further identified a positive correlation between FA values in splenium of CC and anxiety, one of the three core symptoms (anhedonia, anxiety, and psychomotor retardation) involved in depression [23].
In MR analysis to determine whether PD was a causal factor for IDPs, PD was found to be possibly contribute to lower mean FA in the left UF and decreased surface area of the left planum polare. The UF is a key tract connecting the inferior frontal gyrus and the anterior temporal lobe regions. Several researchers observed widespread demyelination and degeneration of the UF in patients with PD [24,25,26,27]. These structural changes in the UF could potentially account for the presence of depressive symptoms and anxiety commonly observed in individuals with PD. Our findings highlighted the significant influence of PD on sensory alterations, with a reduced surface area in the left planum polare of the superior temporal gyrus, associated with the primary auditory cortex [28,29]. These findings shed light on the potential underlying mechanisms linking PD pathology to both emotional disturbances and sensorimotor alterations.
Given the large heterogeneity in thalamic subnuclei function, we further assessed structural thalamic morphology by subnuclei. In the MR study, Pt and VPL emerged as two predominant subregions. This was corroborated by findings in the observational cohort analysis, showing progressive volume increases from HCs to iRBD and finally to PD. Our findings are consistent with previous observational findings of enlargement of these subregions [19,20]. The Pt is part of the medial nuclear group, with stronger projections to subcortical areas (hypothalamus, amygdala, brainstem, hippocampus) than to cortical areas (prefrontal, insular, and orbital cortex). It also plays a key role in regulating wakefulness. Enlargement of the Pt may contribute to sleep disorders such as insomnia and excessive daytime sleepiness in patients with PD. The VPL processes somatosensory, especially nociceptive information, and projects to the somatosensory and insular cortex. Enlargement of the VPL may explain sensory disturbances and pain in patients with PD.
This study presents compelling evidence that specific IDPs have causal relationships with PD and may serve as diagnostic or predictive biomarkers of its PD risk, severity, and symptoms. First, imaging biomarkers can be used in early risk identification for PD. The ROC analysis suggests that combined IDP markers improve diagnostic accuracy, with AUC up to 0.80 for early PD. Using a composite of biomarkers may be particularly useful in distinguishing HCs from PD or high-risk groups, such as iRBD patients. Second, imaging biomarkers can be used as prognostic indicators of PD progression and severity. The study found that increased median T2star values in the right pallidum was associated with lower disease severity, as indicated by a reduced H-Y score. Monitoring such IDPs over time in PD patients may offer a way to objectively track disease progression. Third, these imaging biomarkers help predicting and managing PD-related symptoms. Higher intracellular volume fraction in the splenium of CC was causally linked with an increased risk of depression in PD. This suggests that imaging biomarkers can guide interventions for mental health management in PD, particularly in those at higher risk for depression. Fourth, the findings can guide therapeutic approaches and treatment planning. For patients with specific biomarker profiles (e.g., those with larger thalamic volume), clinicians might tailor neuroprotective treatments. Meanwhile, those showing IDPs associated with severe PD or depression risk might receive closer monitoring or early psychiatric support. Fifth, IDP testing can serve as a tool in clinical research and trials. IDPs can be used as endpoints in clinical trials to evaluate the efficacy of neuroprotective drugs or other therapies. These biomarkers can serve as objective indicators of drug impact on PD risk or progression.
The strengths of the present study are substantial. First, the two-sample MR design minimized the potential for confounding factors and reverse causation, allowing us to explore underlying mechanisms and identify causal relationships between IDPs and PD. The large GWAS sample size reduced bias and increased statistical power. Second, the inclusion of comprehensive multi-modal neuroimaging data, along with detailed PD symptoms and severity, added depth to our findings. Third, validation in an Asian cohort broadened the generalizability of our results. We included patients with video-polysomnography-confirmed iRBD to better understand IDP changes in the prodromal stage of PD. Additionally, this study provided new insights into potential imaging biomarkers for predicting and diagnosing early PD. However, our study also had limitations. First, Winner’s curse bias can occur when the same GWAS data are used to select instrumental variables and estimate their association with the exposure. Avoiding Winner’s curse was balanced with minimizing precision loss due to smaller sample sizes [30]. Moreover, although we performed sensitivity analyses, pleiotropy and heterogeneity could not be avoided in MR study. Second, selection bias was inevitable in both the UK Biobank Imaging cohort and PD cohorts. Further, the relatively small sample size of the observational cohort might have decreased the statistical power. Longitudinal studies are needed to validate our observations and explore the mechanisms underlying these relationships.
5. Conclusions
Our findings support a causal relationship between brain imaging changes and PD, providing insights into PD pathogenesis and early recognition.
Supplementary Materials
The following supporting information can be downloaded at the website of this paper posted on Preprints.org., Figure S1: Scatter plots of the forward Mendelian randomization study on the causal associations between IDPs and PD.; Figure S2: Leave-one-out plots of the forward Mendelian randomization study on the causal associations between IDPs and PD.; Table S1: Names and descriptions of IDPs in this study.; Table S2: Information for the GWAS summary data used in this study.; Table S3: IVs included in MR analysis regarding the putative causal effects of IDP on PD and its symptoms.; Table S4: IVs included in MR analysis regarding the putative causal effects of PD and its symptoms on IDPs.; Table S5: MR analysis results regarding the putative causal effects of IDP on PD and its symptoms.; Table S6: MR analysis results regarding the putative causal effects of PD and its symptoms on IDPs.; Table S7: Leave-one-out test for significant results of the MR analysis regarding the putative causal effects of IDP on PD and its symptoms.; Table S8: Leave-one-out test for significant results of the MR analysis regarding the putative causal effects of PD and its symptoms on IDPs.; Table S9: Steiger test for significant results of the MR analysis regarding the putative causal effects of IDP on PD and its symptoms.; Table S10: Steiger test for significant results of the MR analysis regarding the putative causal effects of PD and its symptoms on IDPs.; Table S11: Heterogeneity test for significant results of the MR analysis regarding the putative causal effects of IDP on PD and its symptoms.; Table S12: Heterogeneity test for significant results of the MR analysis regarding the putative causal effects of PD and its symptoms on IDPs.; Table S13: Pleiotropy test for significant results of the MR analysis regarding the putative causal effects of IDP on PD and its symptoms.; Table S14: Pleiotropy test for significant results of the MR analysis regarding the putative causal effects of PD and its symptoms on IDPs.; Supplementary Methods.
Author Contributions
Conceptualization, Y.Z., M.N., Y.L., B.W. and J.L.; methodology, Y.Z.; software, M.Z.; validation, M.Z. and Z.D.; formal analysis, Y.Z. M.Z. and X.W.; investigation, Z.Y., L.Z., Q.Y., and M.Z. ; resources, Z.Y., L.Z., and M.N.; data curation, Z.Y. and M.Z.; writing—original draft preparation, Y.Z. and M.N.; writing—review and editing, X.W and M.N.; visualization, Y.Z.; supervision, Y.L.; project administration, Z.Y., L.Z., and M.N.; funding acquisition, M.N. and J.L. All authors have read and agreed to the published version of the manuscript. Y.Z., M.Z., and Z.Y. contributed equally.
Funding
This research was funded by the NATIONAL NATURAL SCIENCE FOUNDATION OF CHINA (82101335 and 82230040).
Institutional Review Board Statement
The study was conducted in accordance with the Declaration of Helsinki, and approved by the Institutional Review Board of RUIJIN HOSPITAL (protocol code 2018, No. 101, June 13th, 2018).
Informed Consent Statement
Informed consent was obtained from all subjects involved in the study.
Data Availability Statement
Genome-wide summary statistics for brain imaging phenotypes used in the current study are available at https://open.win.ox.ac.uk/ukbiobank/big40/ [6]. Genome-wide summary statistics for Parkinson’s disease used in the current study are available at IEU OpenGWAS project https://gwas.mrcieu.ac.uk/datasets/ieu-b-7/ [7]. Genome-wide summary statistics for Parkinson’s disease manifestations used in the current study are available at https://pdgenetics.shinyapps.io/pdprogmetagwasbrowser/ [8].
Acknowledgments
Our gratitude goes out to both the study's participants and their families for their invaluable support. This research was funded by the NATIONAL NATURAL SCIENCE FOUNDATION OF CHINA (82101335 and 82230040).
Conflicts of Interest
The authors declare no conflicts of interest.
Abbreviations
The following abbreviations are used in this manuscript:
| ANOVAs | Analysis of variances |
| CC | Corpus callosum |
| FA | Fractional anisotropy |
| FDR | False discovery rate |
| GWAS | Genome-wide association studies |
| HCs | Healthy controls |
| IDPs | Imaging-derived phenotypes |
| iRBD | Idiopathic rapid-eye-movement sleep behaviour disorder |
| IVs | Instrumental variables |
| MR | Mendelian randomization |
| OR | Odds ratio |
| PD | Parkinson’s disease |
| ROC | Receiver operating characteristic curve |
| UPDRS | Unified Parkinson Disease Rating Scale |
| SN | Substantia nigra |
| UF | Uncinate fasciculus |
| VPL | Ventral posterolateral nucleus |
References
- Haller, S.; Haacke, E.M.; Thurnher, M.M.; Barkhof, F. Susceptibility-weighted Imaging: Technical Essentials and Clinical Neurologic Applications. Radiology 2021, 299, 3–26. [Google Scholar] [CrossRef] [PubMed]
- Mitchell, T.; Lehéricy, S.; Chiu, S.Y.; Strafella, A.P.; Stoessl, A.J.; Vaillancourt, D.E. Emerging Neuroimaging Biomarkers Across Disease Stage in Parkinson Disease. JAMA Neurol 2021, 78, 1262–1127. [Google Scholar] [CrossRef] [PubMed]
- Theisen, F.; Leda, R.; Pozorski, V.; Oh, J.M.; Adluru, N.; Wong, R.; Okonkwo, O.; Dean, D.C.; Bendlin, B.B.; Johnson, S.C.; et al. Evaluation of Striatonigral Connectivity Using Probabilistic Tractography in Parkinson's Disease. Neuroimage Clin 2017, 16, 557–563. [Google Scholar] [CrossRef] [PubMed]
- Zhu, Y.; Du, R.; He, Z.; Pang, X.; Yu, W.; Huang, X. Assessing the Association between White Matter Lesions and Parkinson's Disease. Neurol Sci 2023, 44, 897–903. [Google Scholar] [CrossRef]
- Liu, W.S.; Zhang, Y.R.; Ge, Y.J.; Wang, H.F.; Cheng, W.; Yu, J.T. Inflammation and Brain Structure in Alzheimer's Disease and Other Neurodegenerative Disorders: a Mendelian Randomization Study. Mol Neurobiol 2024, 61, 1593–1604. [Google Scholar] [CrossRef]
- Smith, S.M.; Douaud, G.; Chen, W.; Hanayik, T.; Alfaro-Almagro, F.; Sharp, K.; Elliott, L.T. An Expanded Set of Genome-wide Association Studies of Brain Imaging Phenotypes in UK Biobank. Nat Neurosci 2021, 24, 737–745. [Google Scholar] [CrossRef]
- Nalls, M.A.; Blauwendraat, C.; Vallerga, C.L.; Heilbron, K.; Bandres-Ciga, S.; Chang, D.; Tan, M.; Kia, D.A.; Noyce, A.J.; Xue, A.; et al. Identification of Novel Risk Loci, Causal Insights, and Heritable Risk for Parkinson’s Disease: A Meta-analysis of Genome-wide Association Studies. Lancet Neurol 2019, 18, 1091–1102. [Google Scholar] [CrossRef]
- Iwaki, H.; Blauwendraat, C.; Leonard, H.L.; Kim, J.J.; Liu, G.; Maple-Grødem, J.; Corvol, J.C.; Pihlstrøm, L.; van Nimwegen, M.; Hutten, S.J.; et al. Genomewide Association Study of Parkinson's Disease Clinical Biomarkers in 12 Longitudinal Patients’ Cohorts. Mov Disord 2019, 34, 1839–1850. [Google Scholar] [CrossRef]
- Levi, S.; Volonté, M.A. Iron Chelation in Early Parkinson’s Disease. Lancet Neurol 2023, 22, 290–291. [Google Scholar] [CrossRef]
- Wang, X.; Zhu, Z.; Sun, J.; Jia, L.; Cai, L.; Chen, Q.; Yang, W.; Wang, Y.; Zhang, Y.; Guo, S.; et al. Changes in Iron Load in Specific Brain Areas Lead to Neurodegenerative Diseases of the Central Nervous System. Prog Neuropsychopharmacol Biol Psychiatry 2024, 129, 110903. [Google Scholar] [CrossRef]
- Alushaj, E.; Hemachandra, D.; Kuurstra, A.; Menon, R.S.; Ganjavi, H.; Sharma, M.; Kashgar, A.; Barr, J.; Reisman, W.; Khan, A.R.; et al. Subregional Analysis of Striatum Iron in Parkinson’s Disease and Rapid Eye Movement Sleep Behaviour Disorder. Neuroimage Clin 2023, 40, 103519. [Google Scholar] [CrossRef] [PubMed]
- Ravanfar, P.; Loi, S.M.; Syeda, W.T.; Van Rheenen, T.E.; Bush, A.I.; Desmond, P.; Cropley, V.L.; Lane, D.J.R.; Opazo, C.M.; Moffat, B.A.; et al. Systematic Review: Quantitative Susceptibility Mapping (QSM) of Brain Iron Profile in Neurodegenerative Diseases. Front Neurosci 2021, 15, 618435. [Google Scholar] [CrossRef] [PubMed]
- McGregor, M.M.; Nelson, A.B. Circuit Mechanisms of Parkinson’s Disease. Neuron 2019, 101, 1042–1056. [Google Scholar] [CrossRef] [PubMed]
- Lashuel, H.; Ortega, R.; Cloetens, P.; Devès, G.; Carmona, A.; Bohic, S. Iron Storage within Dopamine Neurovesicles Revealed by Chemical Nano-Imaging. PLoS ONE 2007, 2, e925. [Google Scholar] [CrossRef]
- Ortega, R.; Carmona, A.; Roudeau, S.; Perrin, L.; Dučić, T.; Carboni, E.; Bohic, S.; Cloetens, P.; Lingor, P. α-Synuclein Over-Expression Induces Increased Iron Accumulation and Redistribution in Iron-Exposed Neurons. Mol Neurobiol 2015, 53, 1925–1934. [Google Scholar] [CrossRef]
- Lisanby, S.H.; McDonald, W.M.; Massey, E.W.; Doraiswamy, P.M.; Rozear, M.; Boyko, O.B.; Krishnan, K.R.; Nemeroff, C. Diminished Subcortical Nuclei Volumes in Parkinson’s Disease by MR Imaging. J Neural Transm Suppl 1993, 40, 13–21. [Google Scholar]
- McKeown, M.J.; Uthama, A.; Abugharbieh, R.; Palmer, S.; Lewis, M.; Huang, X. Shape (But Not Volume) Changes in the Thalami in Parkinson Disease. BMC Neurol 2008, 8, 8. [Google Scholar] [CrossRef]
- Messina, D.; Cerasa, A.; Condino, F.; Arabia, G.; Novellino, F.; Nicoletti, G.; Salsone, M.; Morelli, M.; Lanza, P.L.; Quattrone, A. Patterns of Brain Atrophy in Parkinson’s Disease, Progressive Supranuclear Palsy and Multiple System Atrophy. Parkinsonism Relat Disord 2011, 17, 172–176. [Google Scholar] [CrossRef]
- Boelens Keun, J.T.; van Heese, E.M.; Laansma, M.A.; Weeland, C.J.; de Joode, N.T.; van den Heuvel, O.A.; Gool, J.K.; Kasprzak, S.; Bright, J.K.; Vriend, C.; et al. Structural Assessment of Thalamus Morphology in Brain Disorders: A Review and Recommendation of Thalamic Nucleus Segmentation and Shape Analysis. Neurosci Biobehav Rev 2021, 131, 466–478. [Google Scholar] [CrossRef]
- Chen, Y.; Zhu, G.; Liu, D.; Liu, Y.; Yuan, T.; Zhang, X.; Jiang, Y.; Du, T.; Zhang, J. The Morphology of Thalamic Subnuclei in Parkinson’s Disease and the Effects of Machine Learning on Disease Diagnosis and Clinical Evaluation. J Neurol Sci 2020, 411, 116721. [Google Scholar] [CrossRef]
- Jia, X.; Liang, P.; Li, Y.; Shi, L.; Wang, D.; Li, K. Longitudinal Study of Gray Matter Changes in Parkinson Disease. AJNR Am J Neuroradiol 2015, 36, 2219–2226. [Google Scholar] [CrossRef] [PubMed]
- Laansma, M.A.; Bright, J.K.; Al-Bachari, S.; Anderson, T.J.; Ard, T.; Assogna, F.; Baquero, K.A.; Berendse, H.W.; Blair, J.; Cendes, F.; et al. International Multicenter Analysis of Brain Structure Across Clinical Stages of Parkinson’s Disease. Mov Disord 2021, 36, 2583–2594. [Google Scholar] [CrossRef] [PubMed]
- Coloigner, J.; Batail, J.M.; Commowick, O.; Corouge, I.; Robert, G.; Barillot, C.; Drapier, D. White Matter Abnormalities in Depression: A Categorical and Phenotypic Diffusion MRI Study. Neuroimage Clin 2019, 22, 101710. [Google Scholar] [CrossRef] [PubMed]
- Bergamino, M.; Keeling, E.G.; Ray, N.J.; Macerollo, A.; Silverdale, M.; Stokes, A.M. Structural Connectivity and Brain Network Analyses in Parkinson’s Disease: A Cross-sectional and Longitudinal Study. Front Neurol 2023, 14, 1137780. [Google Scholar] [CrossRef]
- Koinuma, T.; Hatano, T.; Kamagata, K.; Andica, C.; Mori, A.; Ogawa, T.; Takeshige-Amano, H.; Uchida, W.; Saiki, S.; Okuzumi, A.; et al. Diffusion MRI Captures White Matter Microstructure Alterations in PRKN Disease. J Parkinsons Dis 2021, 11, 1221–1235. [Google Scholar] [CrossRef]
- Rashidi, F.; Khanmirzaei, M.H.; Hosseinzadeh, F.; Kolahchi, Z.; Jafarimehrabady, N.; Moghisseh, B.; Aarabi, M.H. Cingulum and Uncinate Fasciculus Microstructural Abnormalities in Parkinson’s Disease: A Systematic Review of Diffusion Tensor Imaging Studies. Biology (Basel) 2023, 12, 475. [Google Scholar] [CrossRef]
- Shen, Q.; Liu, Y.; Guo, J.; Zhang, H.; Xiang, Y.; Liao, H.; Cai, S.; Zhou, B.; Wang, M.; Liu, S.; et al. Impaired White Matter Microstructure Associated with Severe Depressive Symptoms in Patients with PD. Brain Imaging Behav 2022, 16, 169–175. [Google Scholar] [CrossRef]
- Kim, S.G.; Overath, T.; Sedley, W.; Kumar, S.; Teki, S.; Kikuchi, Y.; Patterson, R.; Griffiths, T.D. MEG Correlates of Temporal Regularity Relevant to Pitch Perception in Human Auditory Cortex. Neuroimage 2022, 249, 118879. [Google Scholar] [CrossRef]
- Rossler, J.; Rossler, W.; Seifritz, E.; Unterrassner, L.; Wyss, T.; Haker, H.; Wotruba, D. Dopamine-Induced Dysconnectivity Between Salience Network and Auditory Cortex in Subjects With Psychotic-like Experiences: A Randomized Double-Blind Placebo-Controlled Study. Schizophr Bull 2020, 46, 732–740. [Google Scholar] [CrossRef]
- Jiang, T.; Gill, D.; Butterworth, A.S.; Burgess, S. An Empirical Investigation Into the Impact of Winner’s Curse on Estimates From Mendelian Randomization. Int J Epidemiol 2023, 52, 1209–1219. [Google Scholar] [CrossRef]
Figure 1.
Workflow of the causal inference between IDPs and PD. The diagram shows the Mendelian randomization and observational study to explore the causal relationships between IDPs and PD. The procedure entails the selection of specific SNPs from GWAS datasets, performing MR analysis, sensitivity analyses, and observational cohort analyses. Abbreviations: T1_SIENAX: T1-weighted imaging analysis using Structural Image Evaluation, using Normalization, of Atrophy: Cross-sectional; T1_FIRST: T1-weighted imaging analysis using FMRIB’s Integrated Registration and Segmentation Tool; T1_FAST_ROI: T1-weighted imaging gray matter segmentation using FMRIB’s Automated Segmentation Tool within 139 regions of interest; SWI: susceptibility-weighted imaging; TBSS: Tract-Based Spatial Statistics style analysis; probtrack: probabilistic tractography (with crossing fiber modelling) using PROBTRACKx; ICA: independent component analysis; SNPs: single nucleotide polymorphisms; IVW: inverse-variance weighted; MR-PRESSO: Mendelian randomization Pleiotropy RESidual Sum and Outlier.
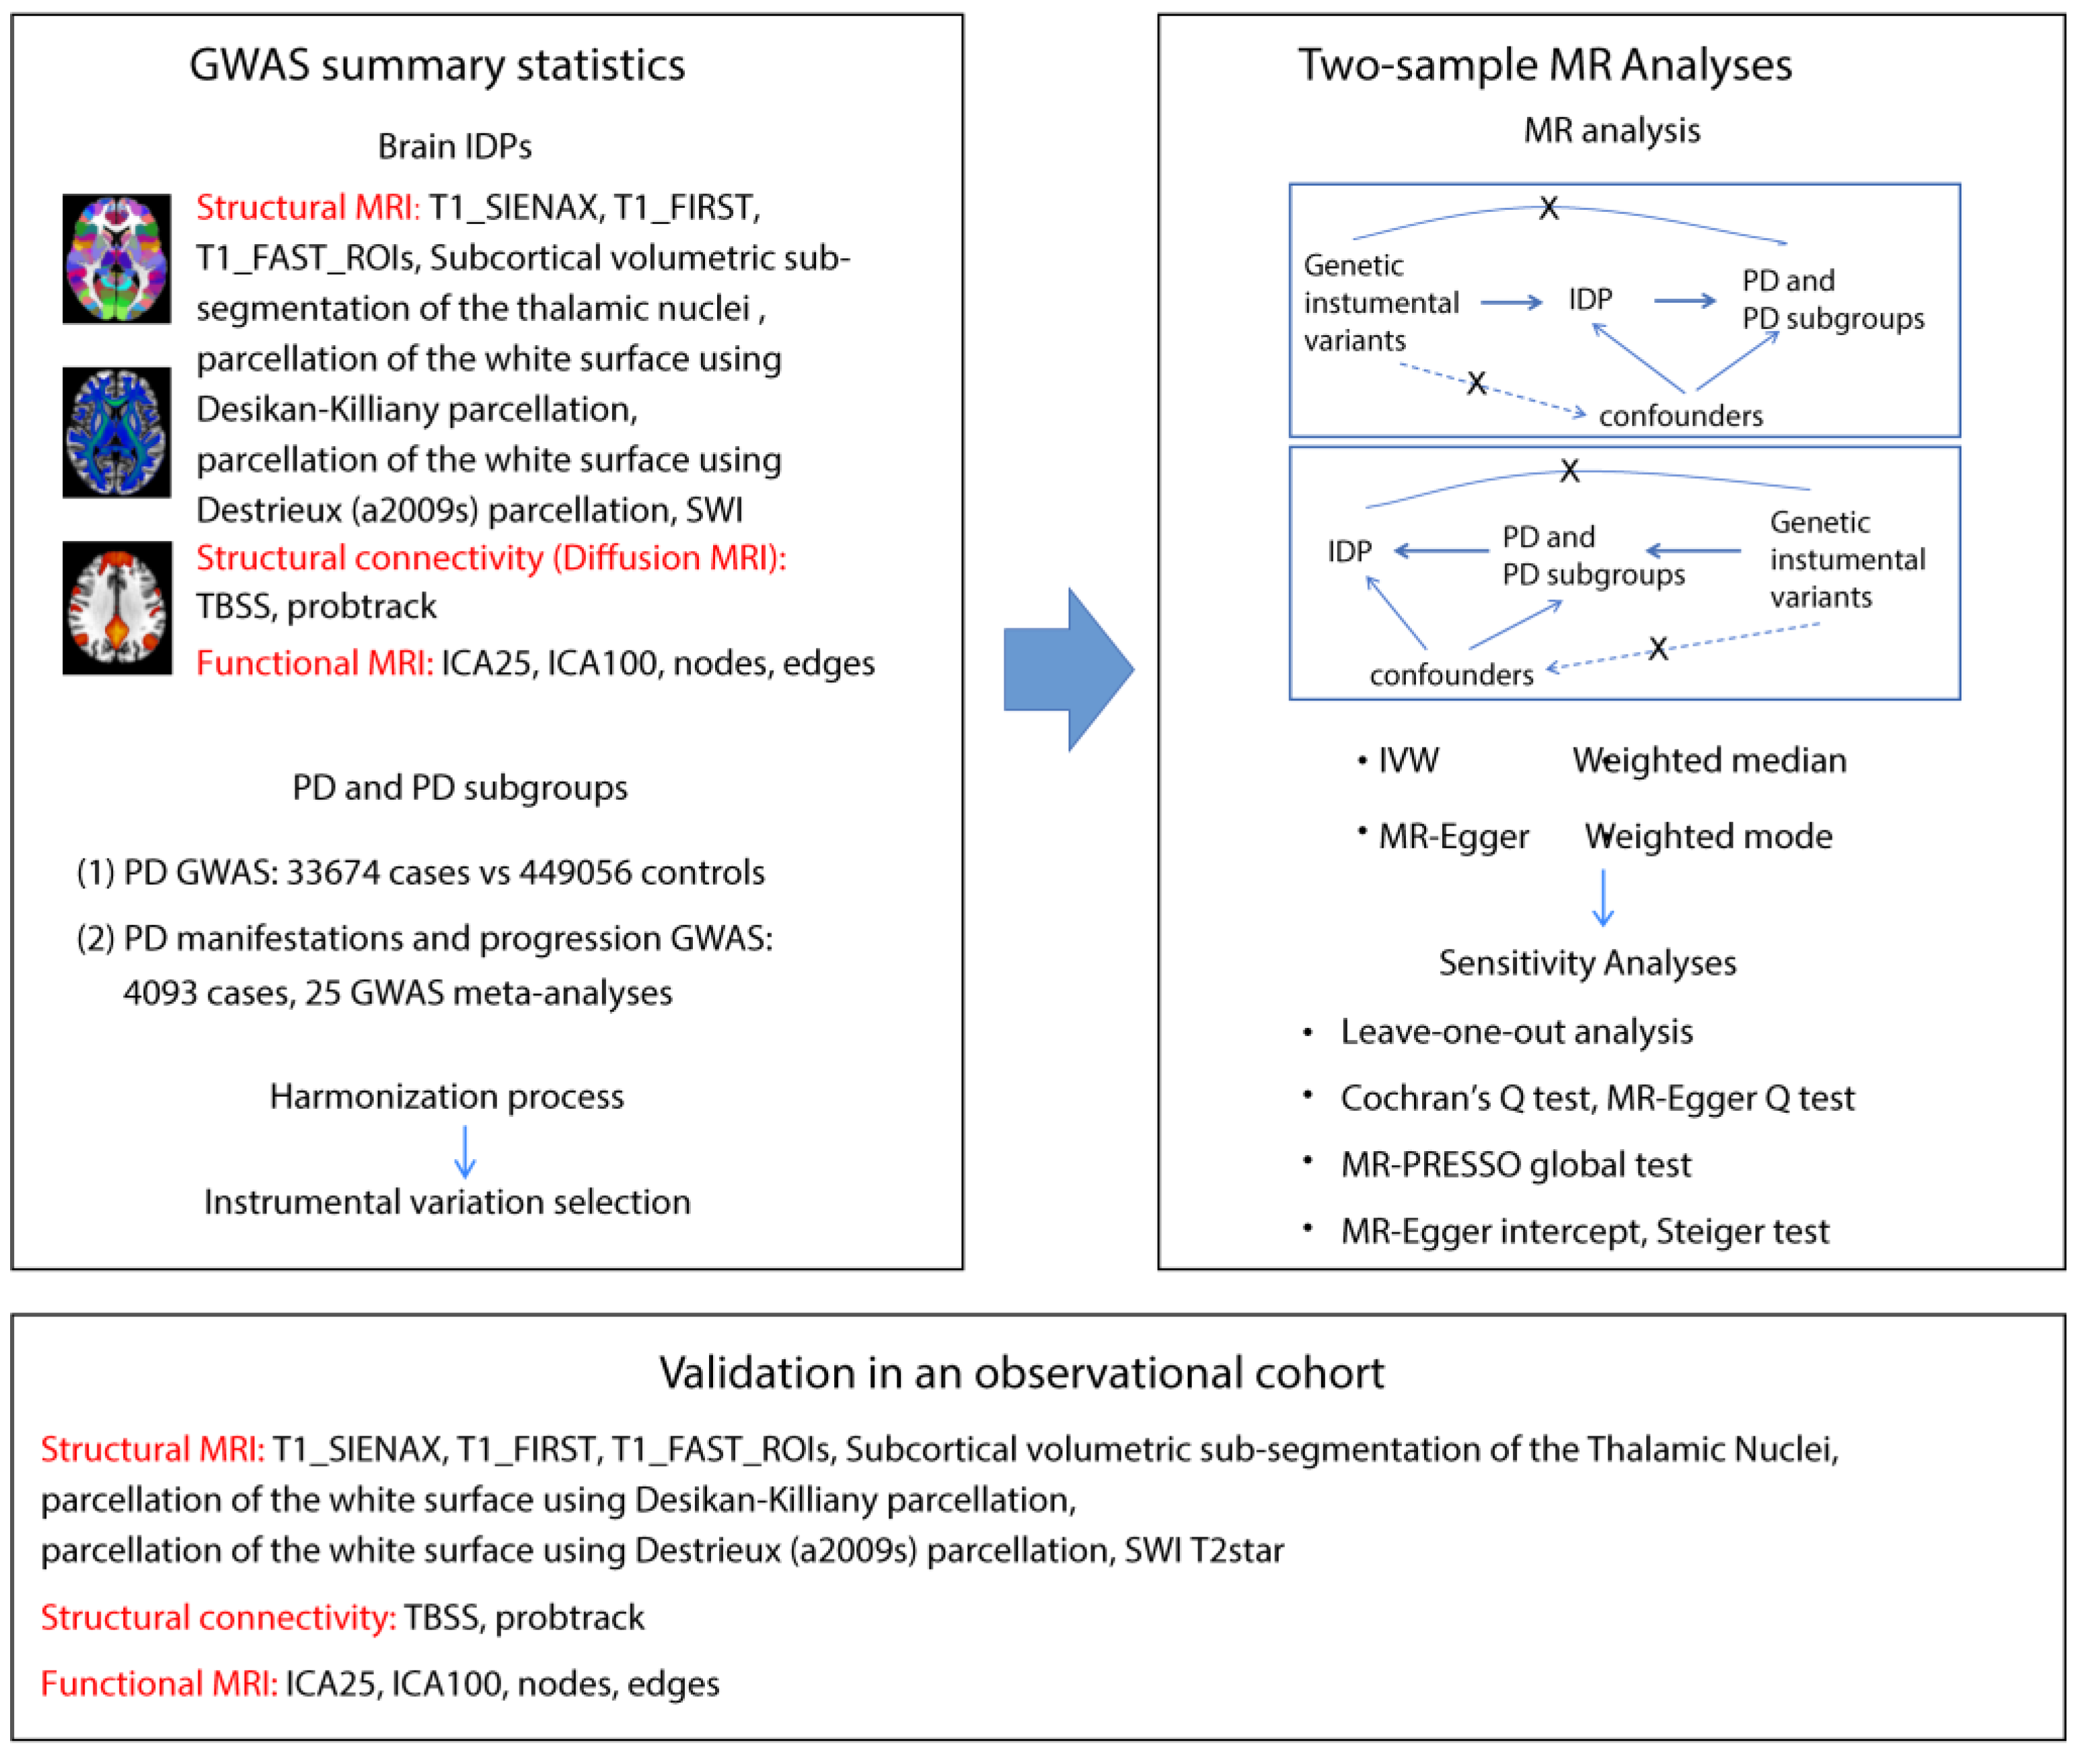
Figure 2.
Causal relationships between IDPs and PD. Forest plots show the significant causal effects of IDPs on PD (a), PD severity (b), and PD manifestations (c) with p<0.05. The forest plots demonstrate significant causal effects of alternations in median T2star in the striatum and volumes of the thalamus, as well as its subregions VPL and Pt on PD (a). Furthermore, the data suggest that altered median T2star in the pallidum might be causally associated with PD severity (b), while the mean ICVF in the splenium of the corpus callosum may be causally associated with PD depression (c). (d) Forest plots show significant causal effects of PD on IDPs. Data suggest PD might have causal effects on weighted-mean FA in the tract UF and area of the left planum polare. Each circle in the graph represents an inverse-variance weighted estimate. The horizontal line represents the 95% confidence intervals (CIs) for the estimates. For binomial outcomes, MR estimates are reported as odds ratios (ORs) along with their corresponding 95% Cls. For continuous outcomes, the MR estimates are reported as betas with their 95% CIs. Abbreviations: nsnp: number of SNPs; P: p value after Bonferroni and false discovery rate correction; H&Y: Hoehn-Yahr stage; VPL: ventral posterolateral nucleus; Pt: paratenial nucleus; MO: diffusion tensor mode; ICVF: intracellular volume fraction; FA: fractional anisotropy.
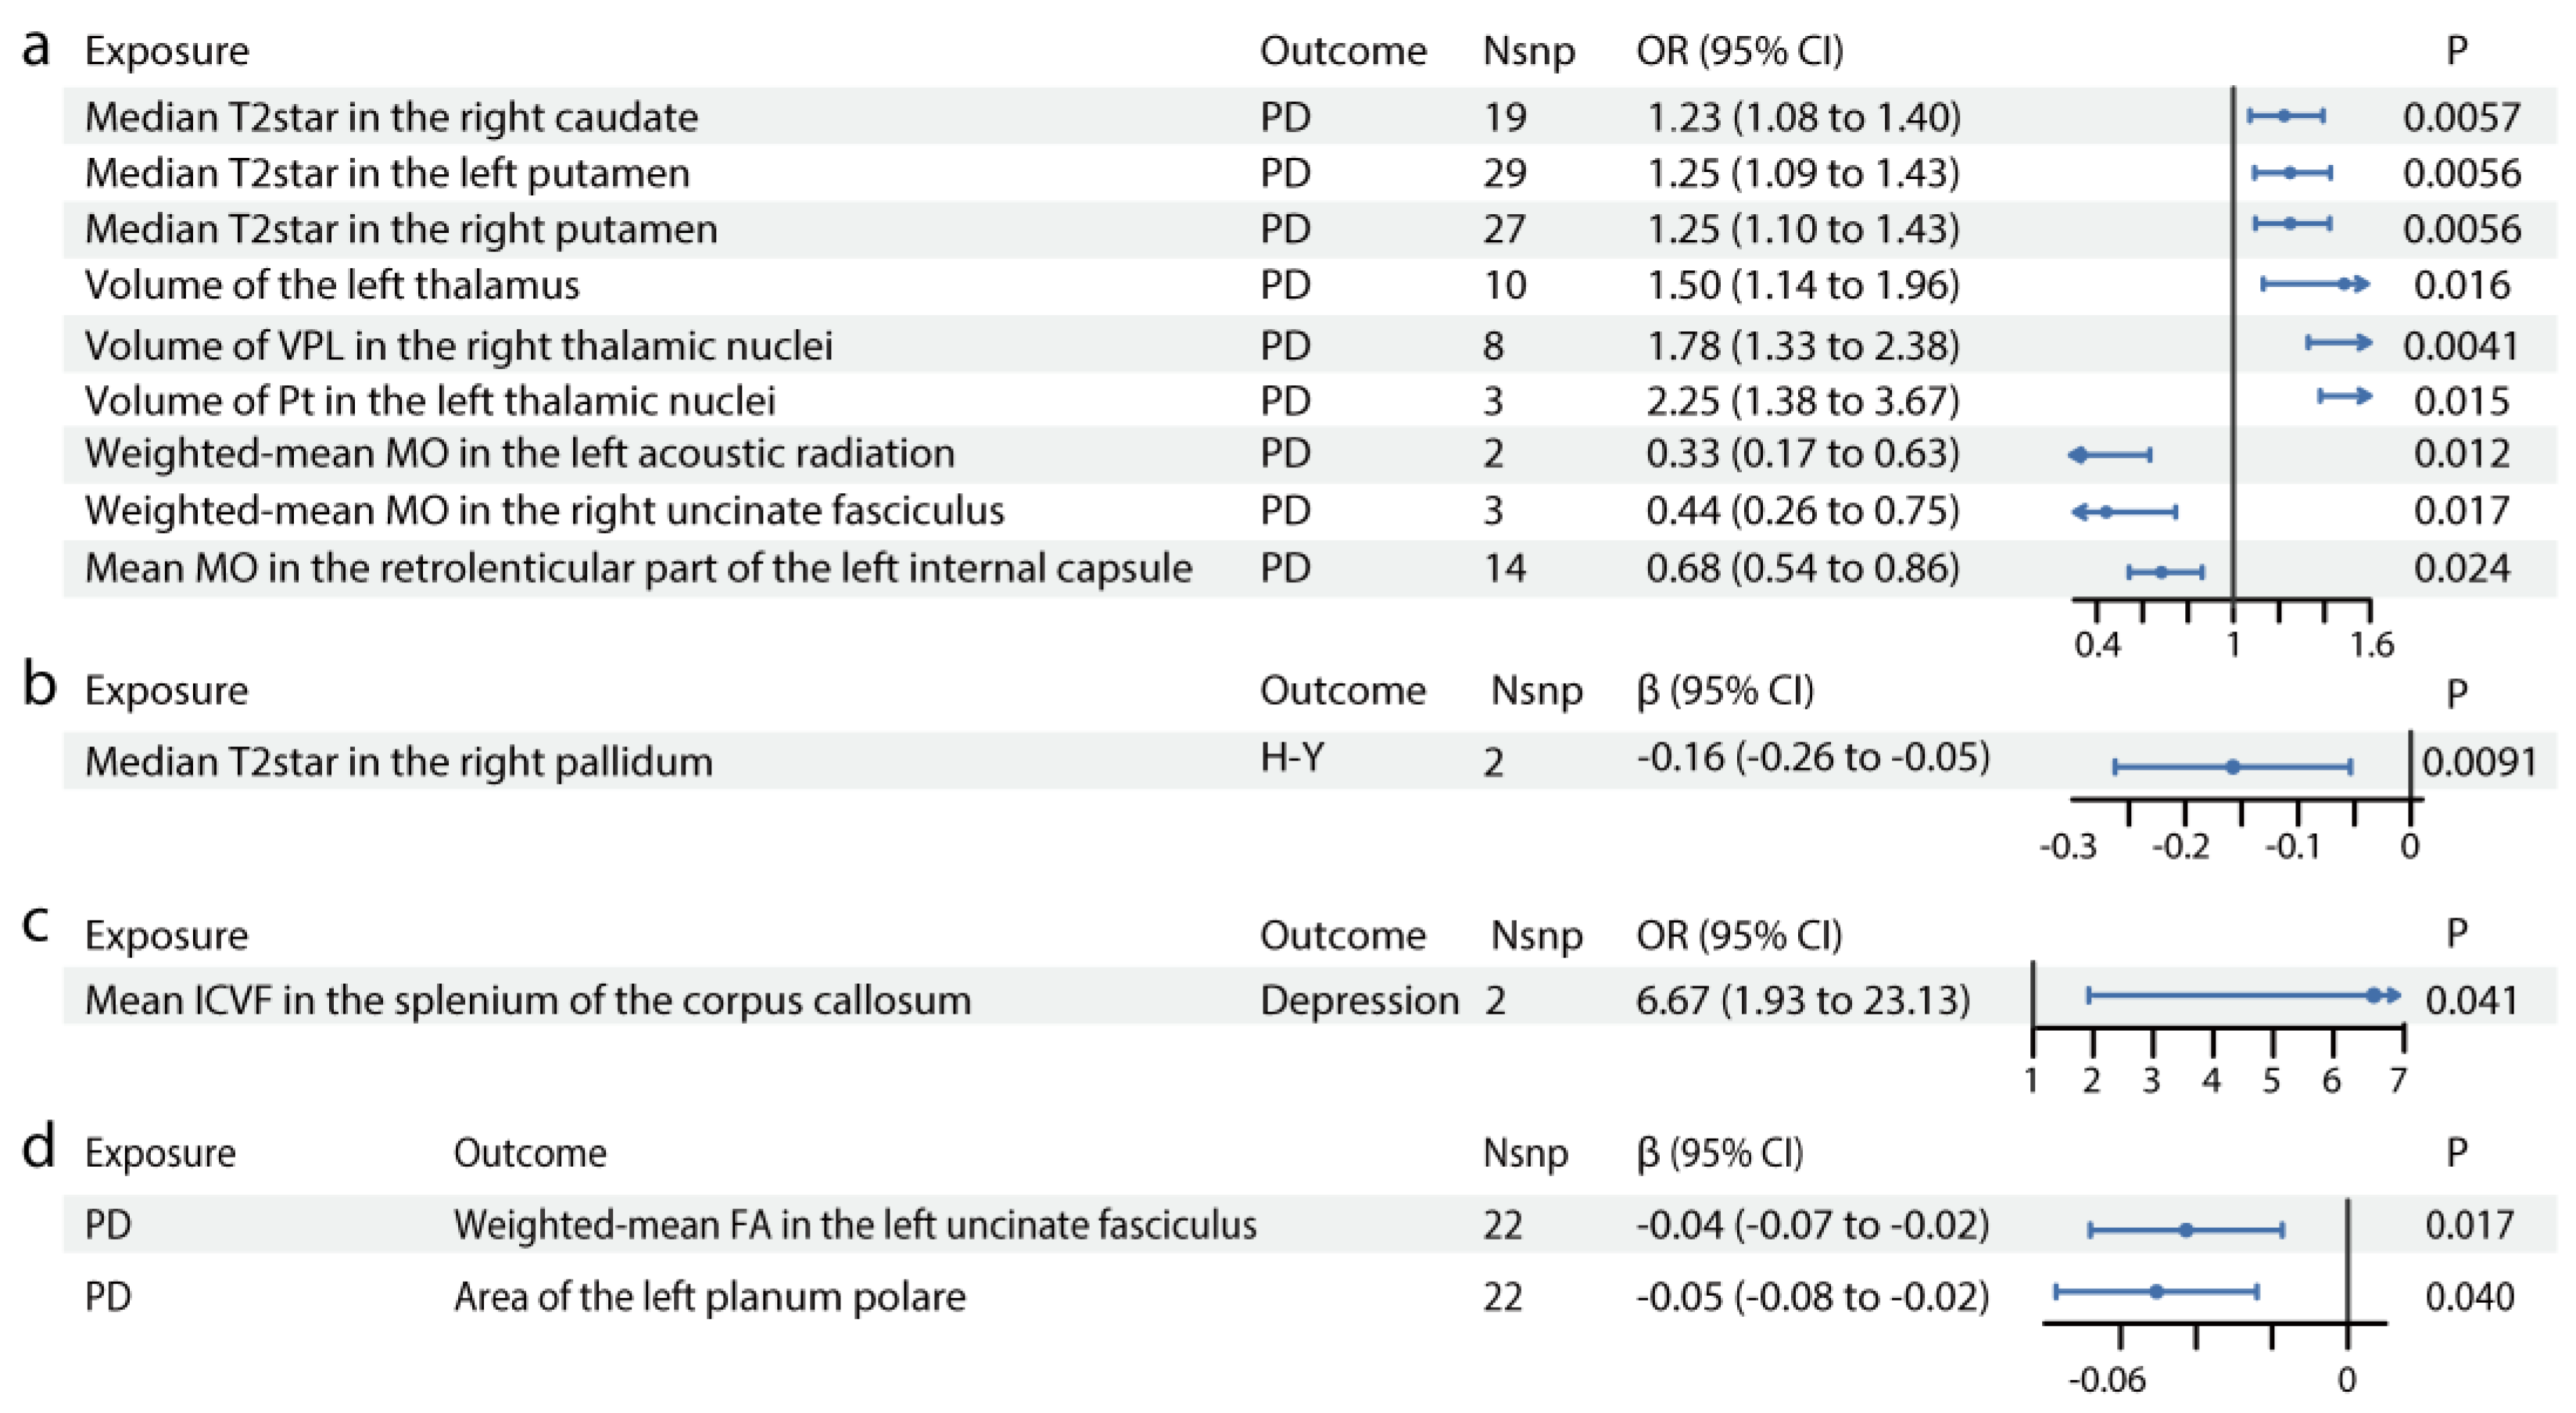
Figure 3.
Associations of brain IDPs and PD in the observational study. (a) Differences in median T2star in the caudate, putamen, and pallidum across HCs, patients with iRBD, and patients with PD. Patients with iRBD have higher median T2star values, while those with PD show lower values for both caudate sides. Similar results are observed in both sides of the pallidum and putamen. (b) Volumes of the thalamus, Pt, and VPL in HCs, participants with iRBD, and participants with PD. The thalamus volume is larger in both the iRBD and PD groups, with consistent results in the left Pt and right VPL. (c) FA in the left uncinate fasciculus in HCs, participants with iRBD, and participants with PD. FA is decreased in the left uncinate fasciculus in patients with PD. (d) Thickness of the left planum polare in HCs, participants with iRBD, and participants with PD. The thickness of the superior planum polare is reduced in patients with PD. (e-h) MRI pattern diagrams corresponding to a-d. Mean and SEM are used for precision and dispersion measures, setting SEM as error bars. We used a fixed effect model, with linear or nonlinear age and sex effect kept in the model. ANOVAs or Kruskal-Wallis tests are used depending on data distribution and homoscedasticity, with logarithmic transformation or reciprocal transformation performed if necessary. For multiple comparisons, Dunnett Contrast tests are performed after ANOVAs, and false discovery rate analyses are performed after Kruskal-Wallis tests. The discriminative power of the values is evaluated using ROC curve analysis. (i) ROC curve distinguishing HCs from early-stage PD participants. (j) ROC curve distinguishing HCs from iRBD participants. Significance codes: “ns” for no significance; *p<0.05; **p<0.01; ***p<0.001. Abbreviations: FA, fractional anisotropy; HCs, healthy controls; iRBD, idiopathic rapid-eye-movement sleep behavioral disorder; MRI, magnetic resonance imaging; PD, Parkinson’s disease; ROC, receiver operating characteristic; VPL, ventral posterolateral nucleus.
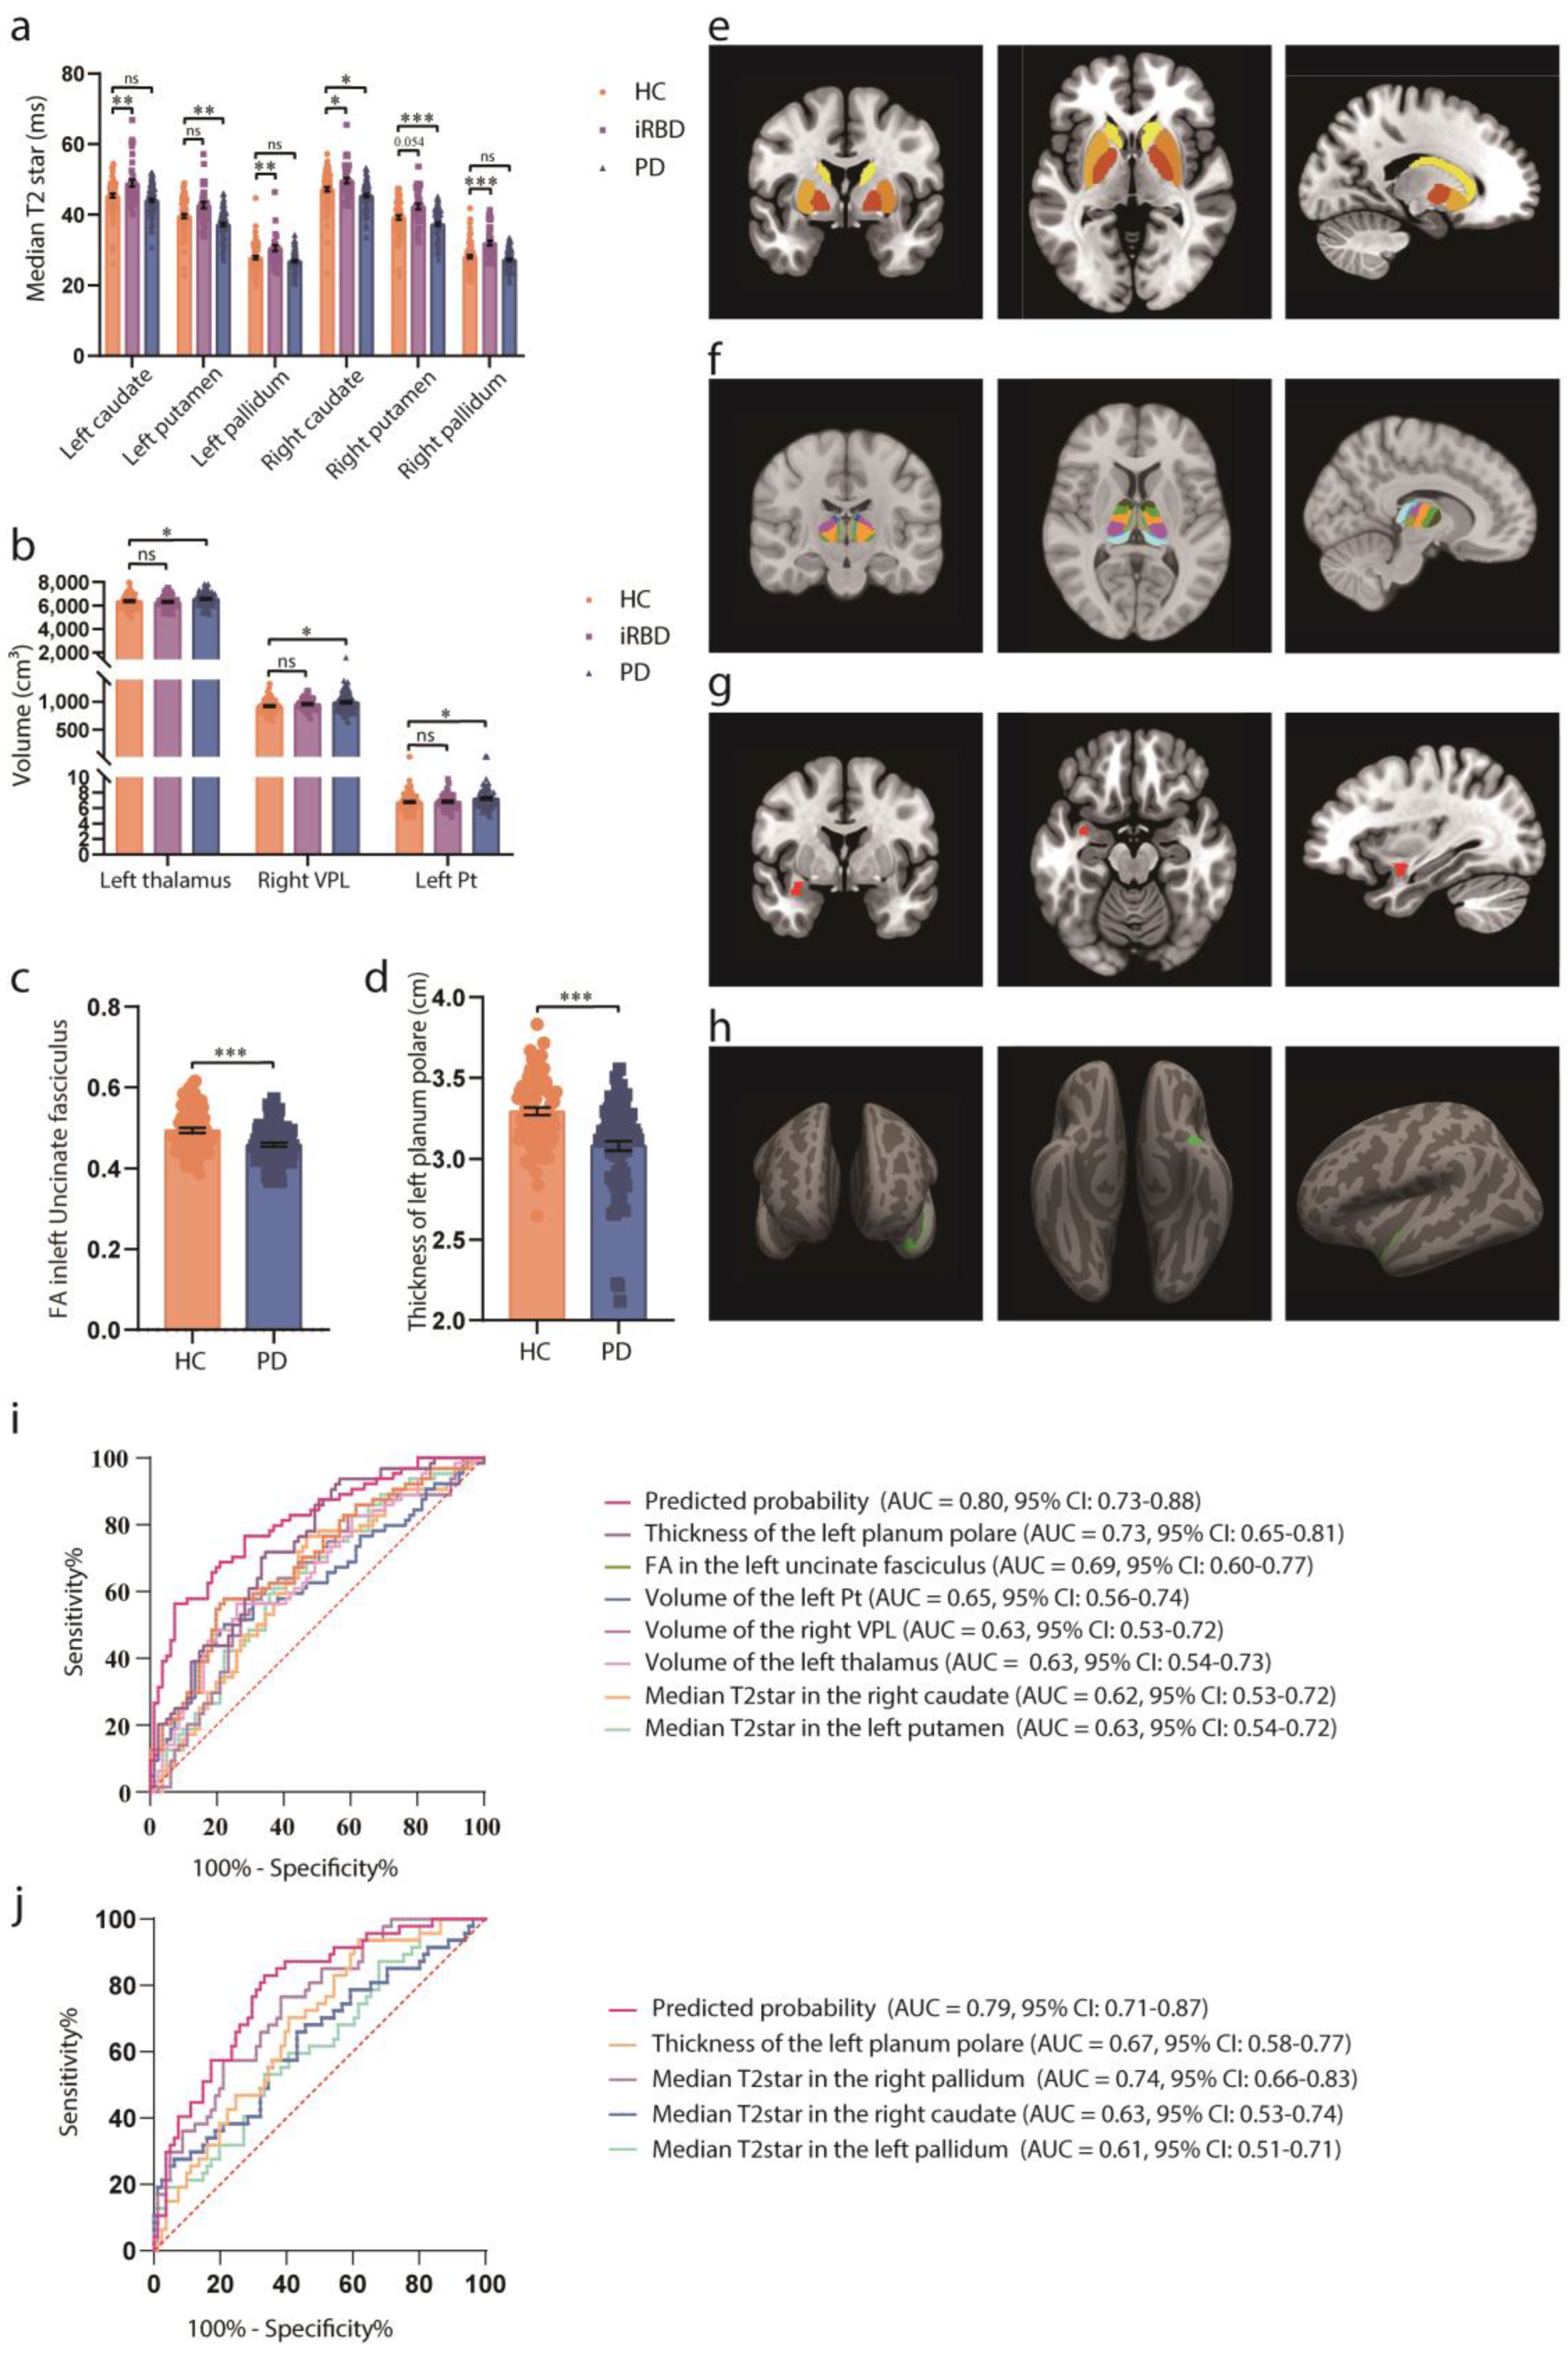

Table 1.
Clinicodemographic characteristics of the participants in the observational study.
| HC (n=81) |
iRBD (n=47) |
PD (n=85) |
p Value | |
|---|---|---|---|---|
| Age (y) | 62.77 ± 8.10 | 67.1 ± 5.68 | 67.87 ± 6.97 | <0.001 |
| Sex, n | 0.94 | |||
| Male | 40 (49%) | 23(49%) | 44 (52%) | |
| Female | 41 (51%) | 24(51%) | 41 (48%) | |
| Disease duration (m) | - | 50.65 ± 15.74 | 97.49 ± 36.24 | |
| H-Y stage | - | - | 1.97 ± 0.80 | |
| UPDRS I score | - | - | 9.02 ± 5.46 | |
| UPDRS II score | - | - | 11.84 ± 6.33 | |
| UPDRS III score | - | - | 33.13 ± 15.19 |
The clinicodemographic characteristics of the participants are analyzed using the chi-square test or ANOVA, depending on the type of dependent variables. Data are presented as the mean ± SD for continuous variables and as frequency (%) for categorical variables. Abbreviations: HC, healthy control; H-Y, Hoehn, and Yahr stage; iRBD, idiopathic rapid-eye-movement sleep behaviour disorder; PD, Parkinson’s disease; UPDRS, MDS Unified Parkinson Disease Rating Scale
Disclaimer/Publisher’s Note: The statements, opinions and data contained in all publications are solely those of the individual author(s) and contributor(s) and not of MDPI and/or the editor(s). MDPI and/or the editor(s) disclaim responsibility for any injury to people or property resulting from any ideas, methods, instructions or products referred to in the content. |
© 2025 by the authors. Licensee MDPI, Basel, Switzerland. This article is an open access article distributed under the terms and conditions of the Creative Commons Attribution (CC BY) license (http://creativecommons.org/licenses/by/4.0/).
Copyright: This open access article is published under a Creative Commons CC BY 4.0 license, which permit the free download, distribution, and reuse, provided that the author and preprint are cited in any reuse.


