
Submitted:
04 February 2025
Posted:
05 February 2025
You are already at the latest version
Abstract
Huanglongbing disease (HLB), caused by Candidatus Liberibacter asiaticus (CLas), affects all commercial citrus species. Persian lime (Citrus latifolia Tanaka), a crop of global economic importance, has shown tolerance to such disease. Efforts are therefore focused on prolonging the productive life of diseased trees through agronomic management. The objective of this study was to compare between healthy and HLB-affected Persian lime plants the effects of low (Ma-1), medium (Ma-2), and high (Ma-3) doses of macronutrients, in combination with treatments without the addition of micronutrients (Mi-1), using soil (Mi-2) or foliar (Mi-3) application. Treatments were applied every 18 days for one year. Even C. latifolia showed tolerance, HLB reduced its growth, chlorophyll content, and photosynthetic efficiency. In addition, it increased stem diameter of vascular bundles, reflectance in the visible spectrum, and the concentration of glucose, sucrose, starch, trans-cinnamic acid, benzoic acid, and salicylic acid in diseased plants. The hormonal response showed higher levels of benzoic acid and lower levels of salicylic acid than those reported in susceptible citrus. Those plants treated with low doses of macronutrients in combination with applying micronutrients to the soil (Ma-1+Mi-2) showed less effect of HLB with higher growth, chlorophyll concentration, and less starch accumulation. These results sug-gest that fractioning fertilizer application throughout the year might improve the efficiency of the agronomic HLB management and allow the reduction of the annual dose of fertilizers.
Keywords:
Candidatus Libetibacter asiaticus
; Persian lime
; Phytohormones
; macronutrients
; micronutrients
1. Introduction
Huanglongbing (HLB) is considered as the most destructive disease in the world for citrus, affecting all commercial species [1]. This disease is caused by a gram-negative α-proteobacteria, limited to phloem [2]. Candidatus Liberibacter asiaticus (CLas) is the species associated with HLB in Mexico and is spread in field by Diaphorina citri Kuwayama, the Asian citrus psyllid [3]. Citrus production profitability has significantly declined due to the high costs associated with managing the disease in affected areas [4]. HLB is now found in almost all producing countries, although the disease is restricted to foci in most regions where it is produced [5]. It has caused significant economic losses in producing countries such as China, Brazil, India, Mexico, and Spain. In Mexico, HLB is present in all 24 citrus-producing states [6].
Citrus plants susceptible to HLB express foliar symptoms, such as green islands, asymmetric mottling, lightening and thickening of veins, death of branches and secondary roots, deformation, reverse ripening, and premature fruit drop [1,7]. This is due to phloem blockage and photo-assimilate flow restriction, which affects carbohydrate metabolism. As a result, excessive accumulation of starch occurs at leaf level, causing the collapse of chloroplasts and the loss of chlorophyll [8]. The reduction in photo-assimilate flow to roots affects their proper development, limiting water and nutrient absorption. This limitation may occur due to thickening of xylem cell walls, which reduces vessel lumen and restricts the flow of water and nutrients, and ultimately results in water deficits [9].
HLB symptoms are different between tolerant and susceptible citrus. It has been reported that tolerant varieties could have a specific recognition system for CLas and a more efficient detoxification system, which reduces damages caused by reactive oxygen species (ROS) and the induction of the immune system, leading to a lower expression of foliar symptoms [10]. Furthermore, tolerant varieties could suppress the direct defense response to CLas infection, especially salicylic acid-mediated signaling [11]. However, no CLas effectors directly related to foliar symptoms have been identified, which has led to the hypothesis that HLB may act as an autoimmune disease [12].
In tolerant varieties, such as Persian lime, symptom development is slower, and diseased plants maintain their development and production despite suffering from the disease [13]. Furthermore, the effects of HLB on Persian lime at the subcellular level are less than in more susceptible varieties such as Mexican lime [14]. Despite of the above, Persian lime plants infected with HLB reduce fruit yield by approximately 2.4 t ha-1 due to a 17.3% reduction in fruit weight and 18.6% in juice volume; these effects on Persian lime yield have been similar in the states of Yucatan and Veracruz [5,15]. In Mexico, HLB management for both susceptible and tolerant citrus varieties relies on monitoring and controlling the insect vector, using certified plants, and promptly removing diseased plants in the early stages of infection. Additionally, cultural practices are implemented, which are aimed at coexisting with HLB, such as proper fertilization, all within the framework of the campaign against regulated citrus pests. This is further supported by the implementation of Phytosanitary Epidemiological Management Areas (AMEFIs for its acronym in Spanish) [6,16].
Balanced nutrition is crucial for maintaining plant health and vigor; healthy plants are known to be less susceptible to pathogen attacks [17]. Mineral nutrients are part of the plant’s first line of defense against pathogens since they are required to properly function defense mechanisms such as producing toxins, metabolites, and lignin. For example, calcium is a structural component of the cell wall, essential for its integrity and functioning, while zinc, iron, and manganese participate as cofactors during the synthesis of secondary metabolites [18]. Therefore, balanced fertilization has been suggested as a strategy to extend the production of trees affected by HLB. Mineral nutrition can be supplied through granular fertilizers added to the soil, as well as via foliar application of macro and micronutrients [19].
HLB- infected plants have shown a decrease in micronutrient availability in symptomatic leaves, including a significant reduction in Ca2+, Mg2+, Fe2+, Zn2+, and Cu2+ [20]. Field nutrient evaluations indicate that applying nitrogen, phosphorus, potassium, calcium, magnesium, copper, iron, and zinc to HLB-infected trees might mitigate the severity of the disease and enhance fruit production. This improvement is attributed to the reduction of disruptions in carbohydrate metabolism, and a decrease in the disease’s impact on plant growth and yield [21,22,23,24]. Foliar and soil application of calcium, magnesium, zinc and boron also significantly increased root lifespan [25]. High doses of Mn (4X) were associated with reduced CLas titers [26]. Thus, fruit production in diseased plants reported an increase of 45% with foliar application of micronutrients. However, applying doses that exceed recommended levels might reduce fruit yield by up to 25% [27].
Ensuring that the correct fertilizer is applied at the right time, in the right dose, in the right place, and from the right source improves the efficiency of fertilization programs [28,29]. Recently, a consistent and gradual application of fertilizers has been adopted for managing HLB in Florida, USA [30,31]. This approach consists in meeting the crop’s annual fertilizer requirement through multiple applications. Instead of applying all the fertilizer at once, smaller doses are administered more frequently. This method intends to provide the plant with a continuous supply of nutrients, reduce leaching losses, and prevent nutrient deficiencies associated with HLB. [29]. Using fertigation, up to 30 applications per year and up to 20 applications to the soil were made to irrigated plots, while under rainfed conditions, four to six fertilizations were carried out per year [30,31].
It is essential to identify the tolerance characteristics of Persian lime to determine molecular targets for developing effective disease management strategies. This information will also help to implement a balanced fertilization program tailored for Persian limes under conditions where HLB is present. Improved and balanced fertilization schemes are necessary for practical applications in the field, whether under irrigation or rainfed conditions. The objective of this work was to contrast the effect of low, medium, and high doses of individual macro-nutrients, as well as their combination with micronutrients using soil and/or foliar application, on Persian lime plants, both healthy and HLB-infected plants. To achieve this, three macronutrient and three micronutrient regimes were evaluated in plants, both with and without observable HLB symptoms at foliar level. The presence of HLB symptoms was confirmed by the number of bacteria found in veins, evaluating various physiological parameters, such as growth and development, photosynthetic rate, spectral reflectance of leaves and damage to vascular bundles. Additionally, plants’ metabolism was measured through the accumulation of starch and simple carbohydrates, as well as the accumulation of salicylic acid (SA) and its biosynthetic precursors, which play a role in the immune response to pathogens.
2. Results
2.1. Relative Quantification of 16S rDNA Gene of CLas After Fertilization Treatments
The change in relative accumulation of CLas was assessed based on the amplification of 16S rDNA gene at the end of summer, was evaluated by comparing different treatments to the Ma-1+Mi-1 treatment. No increase in the number of bacteria (with a value equal to or less than 1) was observed for the treatments with low and medium doses of macronutrients (Ma-1 and Ma-2) across all micronutrient levels (Mi-1, Mi-2, and Mi-3). In contrast, an increasing trend was observed with high doses of macronutrients at all three micronutrient levels (Figure 1), especially with the absence of micronutrients (Ma-3+Mi-1). This observation correlates with the response of other study variables and suggests that constant applications of high doses of fertilization, combined with the lack of micronutrients, could promote the proliferation of CLas and foster the development of the disease under the evaluated conditions.
2.2. Fertilization and the Percentage of Severity of HLB Symptoms in Leaves
At the end of the experiment, no significant differences were observed in the percentage of severity among the fertilization treatments (Figure 1). The percentage of severity did not exceed 8% for any treatment, which is low compared to the results reported for susceptible varieties and with what was observed in field conditions for Persian lime. This indicates that balanced fertilization was effective in delaying the progression of symptoms.
2.3. Fertilization on the Efficiency of Photosystem II (Fv/Fm) in Healthy and Diseased Plants
At the beginning of the experiment and before treatment applications, variation was observed in Fv/Fm average values in both groups of plants. During summer, Fv/Fm average values were lower in diseased plants (0.791 ± 0.008) than in healthy plants (0.80 ± 0.006). However, when fertilization treatments were applied, Fv/Fm average values were similar between sampling times. Treatment application improved and maintained photosynthetic efficiency in diseased plants over time, regardless of macro and micronutrient levels (Figure 2A).
2.4. Reflectance Spectrum on Leaves of Healthy and HLB Diseased Plants after Fertilization Treatments
Reflectance of both healthy and HLB-diseased Persian lime leaves was measured over a spectral range of 450 to 800 nm. Mean reflectance data collected during the experimental period revealed notable differences between healthy and diseased plant groups in both the visible light spectrum (VIS) and near-infrared (NIR) regions (Figure 2B). Trends observed in reflectance patterns aligned with previous reports on HLB-infected plants, whether they are symptomatic or asymptomatic. The analysis of the differential regions based on the mean reflectance per treatment showed that diseased plants had a higher percentage of reflectance at 550 nm compared to healthy plants. Conversely, at 790 nm, the response was the opposite (Figure 2C,D). The wavelengths of 550 nm (visible light) and 790 nm (near-infrared) were selected for mean comparisons between the study treatments because they showed the most significant variability. Unlike the trend in photosynthetic efficiency, at the beginning of the experiment (summer), no differences were observed between treatments in VIS or NIR, contrary to what occurred during winter and autumn. Overall, a significant variation in the percentage of reflectance was observed between healthy and diseased plant leaves. Additionally, no clear connection between the percentage of reflectance and fertilization treatments was found (Figures S1A,B).
2.5. Fertilization Impact on the Content of Chlorophyll, Saccharose, and Starch in Healthy and HLB-Diseased Leaves
At the end of the experiment, diseased plants were affected in all variables of carbohydrate and chlorophyll metabolism. Healthy plants showed 24.2% more chlorophyll on average (1.57 mg g-1 FW ± 0.20 SD) compared to diseased plants (1.19 mg g-1 FW± 0.11 SD). Also, healthy plants presented 75.4 % less sucrose concentration (1.68 mg g-1 FW ± 2.18 SD) in comparison to diseased plants (6.87 mg g-1 FW ± 2.39 SD), and 80% less starch (0.08 mg g-1 FW ± 0.03 SD) compared to diseased plants (0.41 mg g-1 FW ± 0.20 SD) (Figure S2A,B,C). Also, starch accumulation and several anatomical changes in central vein of the leaves were observed in diseased plants compared to healthy ones. Glucose content in leaves showed a similar trend to that observed in sucrose (data not shown). Low doses of macronutrients (Ma-1) were associated with the highest chlorophyll content and the lowest sucrose and starch contents in leaves of HLB-diseased Persian lime plants. In contrast, higher doses of macronutrients showed reduced chlorophyll content in healthy plants and a more significant starch accumulation in diseased plants (Figure 3A,E,H). Micronutrient levels did not have a significant effect on chlorophyll and sucrose content. However, in diseased plants, soil plus foliar application of micronutrients (Mi-3) resulted in the highest carbohydrate accumulation (Figure 3B,D,F).
2.6. Fertilization Impact on Cumulative Growth in Height, Canopy Volume and Stem Diameter in Healthy and HLB-Diseased Plants
Infection with CLas significantly affected cumulative growth of height and canopy volume and fostered a larger stem diameter vs. healthy plants (Figure S4A–C).
On average, healthy plants showed 17% more cumulative growth in height (132.58 cm ± 14.86 SD) compared to diseased plants (109.03 cm ± 12.04 SD). They also showed 33.75% more canopy volume (2.40 m3 ± 0.33 SD) than diseased plants (1.59 m3 ± 0.34 SD), while having 19.46% less stem diameter (9.44 mm ± 2.11 SD vs. 11.72 mm ± 2 SD in diseased plants). This difference may be attributed to an increase in the stem phloem area, as observed in the midrib of leaves (Figure S4A–C).
After fertilizing for one year every 18 days, the lowest doses of macronutrients were associated with the most significant cumulative growth in height, canopy volume, and stem diameter in healthy and diseased plants (Figure 4A,C,E). In contrast, micronutrient levels showed no significant effect in healthy or diseased plants (Figure 4B,D,F). Increased doses of macronutrients plus the application of micronutrients, both to the soil and foliar, do not seem to be favorable for promoting growth and development of HLB- infected Persian lime plants.
2.7. Fertilization Impact on Endogenous Content of Salicylic Acid and its Biosynthetic Precursors in Healthy and HLB-Diseased Plants
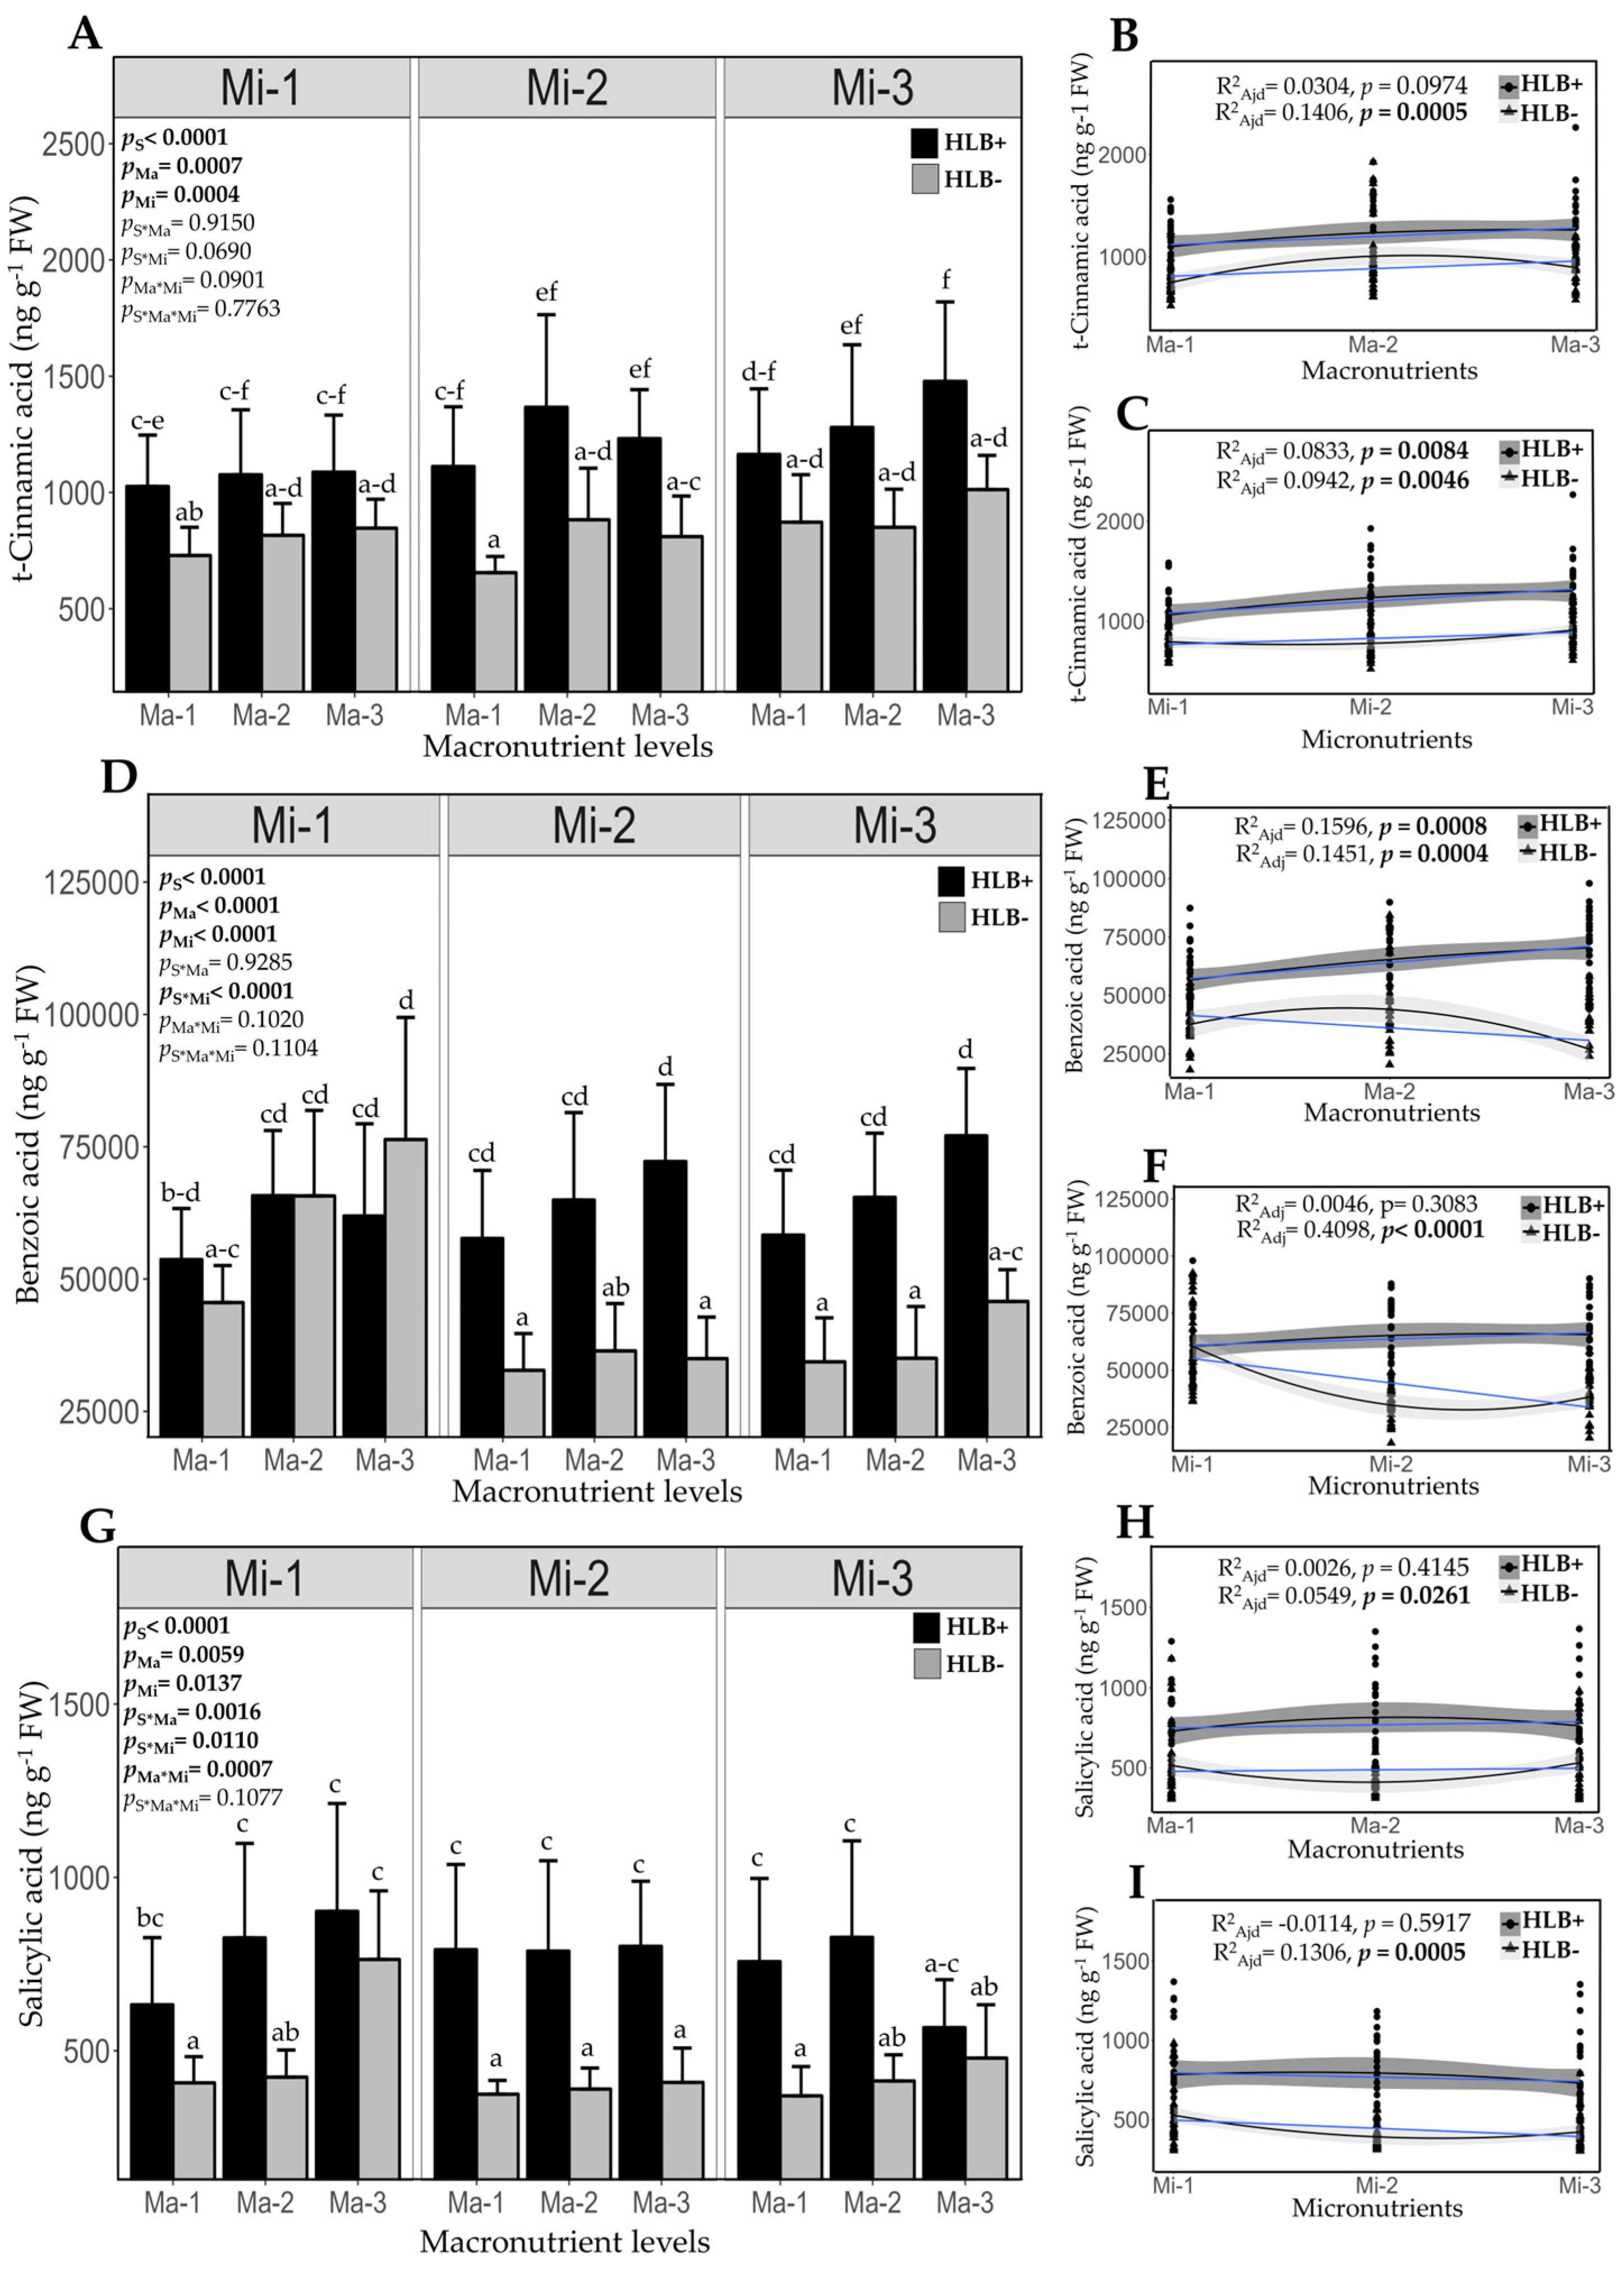
For a better understanding of hormonal response of Persian lime, which is considered tolerant to HLB, endogenous levels of salicylic acid and its biosynthetic precursors, trans-cinnamic acid (t-CA) and benzoic acid (BA), were quantified. CLas infection increased endogenous content of t-CA, BA, and SA in diseased plants compared to healthy plants. Specifically, healthy plants showed an average of 30.9% lower t-CA levels at 830.55 ng g-1 FW ± 99.84 SD vs. diseased plants, which had t-CA levels of 1202.15 ng g-1 FW ± 149.80 SDI. In addition, healthy plants had 29.47% lower BA levels (45,218.49 ng g-1 FW ± 15,608.23 SD) than diseased plants (64,104.37 ng g-1 FW ± 7,315.19 SD). Furthermore, salicylic acid (SA) levels were 41.5% lower in healthy plants (447.64 ng g-1 FW ± 122.69 SD) compared to diseased plants (765.72 ng g-1 FW ± 103.52 SD) (Figures 5A,D,G).
Consistent with the results above, the lowest doses of macronutrients were associated with the lowest concentrations of t-CA and BA in diseased plants, with an increase trend at higher doses. A similar trend regarding t-CA was observed in healthy plants; however, higher doses were associated with the lowest concentration of BA. SA concentration was similar at all macronutrient levels in diseased plants, while in healthy plants, it was lower at the average macronutrient dose (Figure 5B,E,H). Micronutrient deficiency was associated with lower t-CA concentrations in healthy and diseased plants. Furthermore, micronutrient application to the soil resulted in the lowest concentration of BA and SA in healthy plants; on the other hand, the concentration of these analytes was similar in diseased plants, regardless of micronutrient levels (Figure 5C,F,I). Differences in the hormonal response of healthy and HLB-infected plants suggest that nutrition may influence hormone regulation and potentially the ability of Persian lime to respond to HLB disease progression.
2.8. Variables Associated with Healthy and HLB-Diseased Plant Groups Obtained by Principal Component Analysis (PCA)
A principal component analysis (PCA) was performed with all dependent variables measured in both groups to understand the relationship of the variables, identify patterns in the plant groups, and reduce the dimensionality of the data. The first three principal components explained 61.89% of the total variance of the data (PC1 = 39.73%, PC2 = 12.26%, and PC3 = 9.90%). The principal components plot showed a clear separation between healthy and diseased plants, indicating differences in the linear properties between the study variables. Healthy plants were associated with higher values for height, canopy volume, photosynthetic efficiency, chlorophyll, and reflectance at 790 nm. In contrast, diseased plants showed elevated values for stem diameter, glucose, sucrose, starch, trans-cinnamic acid, benzoic acid, salicylic acid, and reflectance at 550 nm (Figure S5). These findings suggest that HLB significantly affected the majority of the variables studied, particularly those linked to growth and development, carbohydrate metabolism, reflectance, and hormone levels, despite the fact that Persian lime is generally considered tolerant to this disease.
3. Discussion
Persian lime is known to be tolerant to HLB, showing symptoms more slowly, which allows it to maintain development, cellular homeostasis, and productivity even when it is infected [13,32]. The tolerance observed in particular citrus fruits is linked to polyploidy in both rootstock and commercial varieties, which contributes to a more efficient detoxification system and improved regeneration of the phloem when infected by CLas [14,33]. In agreement with the above, the severity of HLB symptoms in leaves remained below 8% in all treatments after approximately two years of initial inoculation. In field conditions, however, a severity percentage greater than 40% has been reported in Persian lime trees [34], suggesting that fertilization may have contributed to the slow development of leaf symptoms.
CLas infection affects chlorophyll fluorescence parameters, including photosystem II efficiency (Fv/Fm) [35]. While diseased plants exhibited a lower total chlorophyll-content compared to healthy plants, their photosynthetic efficiency remained similar across both groups. This finding aligns with the low severity percentage observed in the leaves. Lower photosynthetic efficiency in diseased plants has been associated with greater damage to the photosynthetic apparatus due to HLB infection [35]. However, fertilization can enhance photosynthetic efficiency by reducing photoinhibition caused by stress [36]. Low doses of macronutrients seem to support stability in chlorophyll content and photosynthetic efficiency. This aligns with previous studies demonstrating how proper fertilization can enhance the chlorophyll index in leaves and promote greater photosynthetic capacity [37]. The reduction in chlorophyll content in the leaves of diseased plants was less than that reported in symptomatic trees under field conditions [38]. The loss of chlorophyll could result from the accumulation of carbohydrates, such as sucrose and glucose, which would repress some genes involved in photosynthesis [39]. Furthermore, accumulating starch in mesophyll chloroplasts would promote thylakoid rupture and degradation of chlorophyll [40].
The blockage of photo assimilate flow of in phloem due to HLB leads to an accumulation of carbohydrates in the leaves, including glucose, fructose, sucrose, and starch [41]. This accumulation can impact photosynthetic and reflectance parameters through changes in leaf pigments, their biochemical composition, and cellular structure [42]. Although Persian lime shows some tolerance to HLB, research indicates that diseased plants exhibit a higher accumulation of glucose, sucrose, and starch in their leaves compared to healthy plants. This finding confirms that the vascular system of Persian lime is affected by HLB, but to a lesser extent than in more susceptible citrus varieties and species. This accumulation of carbohydrates is a consequence of the reduction in the photo assimilate flow due to the obstruction of the pores of the phloem sieve plates. This phenomenon was observed in diploid varieties, such as the Mexican lime, and triploid varieties, such as the Persian lime. However, it is reported that the Persian lime presents a lower collapse of phloem cells, as well as an increase in the area of the phloem of the petioles [14], which coincides with the observations made in the veins of the leaves (Figure S3).
Leaf reflectance is affected by several characteristics, such as surface, internal structure, and biochemical composition [43,44]. Healthy and HLB-diseased Persian lime plants showed distinctive reflectance patterns in the VIS and NIR, consistent with previous reports on reflectance assessments in citrus. [42,45]. However, the low severity of symptoms generated a significant variation between plants and sampling times. Still, PCA analysis showed that reflectance at 550 nm is a variable associated with diseased plants, even with disease management actions, which could further mask symptom expression in Persian lime. Although the equipment demonstrated sensitivity to distinguish between healthy and diseased plants, even when fertilization treatments were applied, the variation seen between asymptomatic leaves and those with mild HLB symptoms poses a challenge for early detection, particularly using devices that only operate within the visible light spectrum (400-800 nm) and do not come with trained software to enhance detection accuracy. More advanced reflectance methods could improve efficiency in detecting HLB. Hu et al. [46] combined multi-color fluorescence images with multispectral reflectance and a pre-trained convolutional neural network model, which allowed them to detect HLB in the field with an efficiency greater than 96%.
Diseased Persian lime plants showed lower cumulative growth in height and canopy volume, as well as a greater stem diameter vs. healthy plants. The adverse impact of the disease on the height and canopy volume of affected plants has been well documented, alongside the beneficial effects of foliar micronutrients [47,48]. Our results are aligned with these findings where the mildest impact on growth variables in diseased plants occurred when low doses of macronutrients were combined with micronutrients in the soil, in contrast to higher doses. Although the increase in stem diameter in plants infected with HLB has not been previously reported, some studies indicate anatomical damage to the phloem due to the effect of HLB [49,50]. In addition, an increase in phloem thickness has been reported in Persian lime, attributable to more significant regeneration in response to HLB damage, which appears to be one of the tolerance characteristics provided by polyploidy. [14].
Phytohormones are crucial in regulating plant growth and development as well as in the signaling networks that coordinate most physiological functions in plants, including the response to pathogens [51]. This work evaluated the endogenous expression of salicylic acid and its biosynthetic precursors in the phenylamine ammonium lyase (PAL) pathway, trans-cinnamic acid, and benzoic acid. The results showed a higher concentration of t-CA, BA, and SA in diseased plants vs. in healthy plants, and this is consistent with previous reports in healthy [52] and diseased [53] orange plants. However, there are no reports of the hormonal response of Persian lime to CLas infection. Additionally, the quantification of these analytes in Persian lime leaves revealed lower concentrations of t-CA and BA at the lowest doses of macronutrients, and these levels have an upwards trend at higher doses. This finding suggests a more significant stress condition at the highest doses, aligning with changes in other growth variables, carbohydrate metabolism, chlorophyll content, and bacterial presence observed by the end of the experiment.
Previous research has shown differences in the levels of phytohormones, such as SA, between tolerant and susceptible citrus varieties. These findings align with our results regarding C. sinensis. Specifically, higher concentrations of SA and Me-SA were reported in tolerant grapefruit (C. paradisi Macf.) compared to susceptible C. sinensis. However, after inoculation with CLas, SA levels were reduced to less than half in grapefruit, while SA concentration in susceptible oranges increased [54]. Similarly, Suh et al. [11] found that metabolites related to the SA signaling pathway decreased in tolerant Sugar Belle® mandarin compared to susceptible Murcott mandarin. Furthermore, in Citrus reticulata Blanco, a moderately tolerant citrus, CLas infection repressed the SA and ethylene signaling pathway [55]. On the other hand, Curtolo et al. [40] did not report changes in the transcription of genes related to SA biosynthesis in P. trifoliata. The results suggest that the SA-mediated defense response could be suppressed in tolerant varieties upon CLas infection.
Although in this work SA levels increased upon CLas infection, the concentration found in HLB-tolerant Persian lime leaves was lower than that reported in susceptible varieties. The increase in BA levels could be associated with the increase in SA levels [56], which differs from our results and leads us to hypothesize a lower conversion of BA to SA. SA synthesis occurs via two chorismate-dependent pathways in the shikimic acid pathway. The first converts chorismate to isochorismate via isochorismate synthase (ICS) and then to SA via isochorismate pyruvate lyase (IPL) [57]. The second pathway is through PAL, which converts L-phenylalanine to cinnamic acid, which is converted into benzoic acid by aldehyde oxidase (AO) and finally into SA via benzoic acid-2-hydroxylase (BA2H) [56,57]. No homologous genes for IPL or BA2H have been found in citrus, suggesting that, in this case, the PAL-dependent pathway could be responsible for SA biosynthesis [53,58]. This statement accounts for the increased concentration of BA observed in Persian lime; however, it does not explain the reduced concentration of SA. All these ideas suggest a lower conversion rate of BA to SA both in healthy and diseased plants, which may indicate that Persian lime exhibits some tolerance to HLB. Furthermore, our results indicate a significant positive correlation between BA and SA content in healthy plants (R2 = 0.54) but not in diseased plants (R2 = 0.07). A possible characteristic of tolerant varieties is the coexistence with the disease, either restricting or delaying the defense response, thereby reducing damages caused by the disease and supporting the hypothesis that HLB is an autoimmune disease [12]. The hypothesis of SA biosynthesis via the PAL pathway has been raised based on the results in varieties susceptible to HLB; however, citrus fruits such as C. aurantifolia and C. latifolia have shown lower PAL activity than C. sinensis [59].
Overall, the analysis of the combination of macronutrient and micronutrient levels suggests that the low doses of macronutrients used in the present study, combined with soil application of micronutrients (Ma-1 + Mi-2), allow diseased plants to show greater height, canopy volume, chlorophyll concentration, as well as less starch accumulation in leaves. The results with lower than recommended doses agree with previous reports, where a potential reduction in N dose of up to 25% does not affect vegetative growth, juice yield, and juice quality in HLB-diseased citrus [60]. They also support the relieving effect of micronutrient application to HLB-diseased plants [24,48].
CLas infection induces phosphorus deficiencies in C. sinensis due to the overexpression of microRNAs, such as miR399, that encodes a ubiquitin-conjugating enzyme (PHO2) related to the degradation of phosphorus-transporting proteins [61]. A subsequent study confirmed that infection with CLas has a significant effect on the efficiency of phosphorus resorption; however, in tolerant varieties such as C. limon and C. maxima, infection with CLas did not affect phosphorus levels in leaves, unlike what was observed in C. reticulata, which is susceptible to HLB [62]. On the other hand, it is reported that diseased plants are more efficient in nutrient uptake, despite the reduction in root volume due to the effect of HLB. This is attributed to the overexpression of genes related to the transport of cations such as NH4+, K+, Zn2+, Fe2+, and Cu2+ [37].
The results indicate that the increase in macronutrient doses, along with the simultaneous soil and foliar application of micronutrients in short periods, reduces the efficiency of the applications, possibly due to the excessive presence of these micronutrients, which was reflected in variable effects on growth, carbohydrate metabolism and an increase in the number of bacteria. In addition, higher use of fertilizers was observed by applying lower doses, split into more applications per year, compared to the higher doses evaluated, also with a split application. Constant fertilization improves the availability and uptake of nutrients by citrus plants that have lost secondary roots due to the disease; it also reduces losses due to leaching [23]. Split fertilizer application was evaluated in citrus trees with HLB, and the results have shown an improvement in canopy volume and a reduction in nitrogen requirement with 20 applications per year, in addition to improving the nutritional content at the foliar level and the nitrogen content in the soil in the form of nitrates and ammonium [25]. These results require validation in the field, especially with trees in production, to determine the dose and number of annual applications according to the weather conditions in the citrus-growing areas of Mexico.
4. Materials and Methods
4.1. Study Site Description and Plant Material Used
The study was conducted in a greenhouse in Central Veracruz, Mexico (Lat. 19.194167, Long -96.343611). Persian lime (Citrus latifolia Tan.) plants, grafted onto 2-year-old macrophylla (Citrus macrophylla Macf.) rootstock, were purchased from a certified nursery, and transferred to a 40 x 40 cm container with a substrate based on a mixture of soil and Peat moss®, in a 2:1 ratio (pH: 5.75 ± 0.07, texture: sandy loam, organic matter: 16.70%, electrical conductivity: 1.9025 dS/m). A group of plants were grafted at the end of summer with buds from a tree confirmed positive by PCR for CLas, originating from plots of the National Institute of Forestry, Agricultural, and Livestock Research (INIFAP), Ixtacuaco Experimental Field. A healthy group of plants was grafted with buds produced in the certified nursery. The experiment started in summer, ending in autumn of the following year.
4.2. Fertilization Treatments
This study evaluated three levels of macronutrients —low (Ma-1), medium (Ma-2), and high (Ma-3)— and three conditions for micronutrient application: no additional application (Mi-1), soil-applied (Mi-2), and soil- and foliar-applied (Mi-3)] (Table S1). The amount of soil-applied micronutrients at medium and high doses of macronutrients was calculated based on the recommendations of Morgan and Kadyampakeni [31] for trees that are not in production, taking into account the amount of nitrogen needed. The treatment with foliar-applied micronutrients associated with low doses of NPK (Ma-1 + Mi-3) consisted of 1.1% B, 1.3% Zn, 6% Fe, 2.4% Mn, 0.25% Cu, and 0.25% Mo). Foliar-applied micronutrient treatments at medium and high macronutrient doses (specifically Ma-2+Mi-3 and Ma-3+Mi-3) contained 4.8% N, 4.9% Mg, 4.9% B, and 9.9% Zn, following the recommendations of commercially available products. Commercial granulated fertilizers were used for all soil treatments and applied every 18 days according to the recommendations of Atta et al. [63].
A 2x3x3 factorial design was used with two health levels (healthy and diseased plants), three macronutrient levels, and three micronutrient levels. The nine treatment combinations in each group of plants (healthy and diseased) were placed in four complete randomized blocks (four replicates per treatment).
4.3. Severity of Foliar Symptoms
The damage scale proposed by Gottwald et al. [64] was used. Each tree was divided into eight sections, individually assessed for severity on a scale of 0 to 5, based on the proportion of leaves showing HLB symptoms. The sum of the results of each section resulted in a range of severity per tree with values from 0 to 40. Each tree was divided into eight sections, which were individually assessed for severity on a scale of 0 to 5, based on the number of leaves showing HLB symptoms. The sum of the results for each section resulted in a range of severity per tree with values from 0 to 40. To standardize assessment criteria, photographs displaying the characteristic symptoms of HLB were printed. The percentage of severity for each tree was calculated using the Shokrollah et al. [65] formula:
where: = sum of the symptomatic plant and their corresponding rating, N = total number of sampled plants, and Z = highest rating.
4.4. DNA Extraction and CLas Detection
gDNA extraction was performed using the CTAB protocol [66] [66] from veins and four-leaf petioles of each plant taken from the middle part of the canopy. Confirmation of healthy and diseased plants at the start of the experiment was determined by PCR amplifying the 16S gene (rDNA) of CLas with the enzyme MyTaqTM DNA Polymerase (Bioline®, London, UK) and oligos OI/OI2c. PCR protocol started at 95°C for 5 min, followed by 35 cycles of 30 s at 94°C, 30 s at 62°C and 1 min at 72°C, with a final extension of 10 min at 72°C according to Jagoueix et al. [67].
At the end of the experiment, the gDNA from the four plants in each treatment was mixed equimolarly, and qPCR amplifications were conducted following the recommendations of Li et al. [68], with some modifications. Specific primers, CLas-4G [69], HLBr, and the HLBp probe were used to amplify the 16S gene of CLas. Additionally, primers COXF, COXR, and the COXp probe were used to quantify the endogenous COX gene [68]. Two replicates were run for each gDNA pool, and every reaction was performed in triplicate using the Taq PCR Master Mix Kit (Qiagen®, Hilden, Germany). The Ct obtained in qPCR reactions were used for the relative quantification of the CLas genes, using the 2−∆∆Ct method [70]. The relative quantification of the 16S rDNA gene of CLas was assessed at the end of the experiment, which took place in autumn. The changes in the amount of CLas under the fertilization treatments were compared to those of the Ma-1+Mi-1 treatment. The propagated error of the ∆CT values for the 16S and COX genes [70] was calculated.
4.5. Growth Variables
Stem diameter was measured using a digital vernier caliper at a height of 15 cm from the base of the stem. Canopy volume (CV) was determined by assessing the canopy diameter in both the east-west and north-south directions, considering plant height. Calculation was performed using the prolate spheroid formula VD (m3) = (4/3)*(π)*(height/2)*(average canopy radius)2 [71]. Monthly measurements were taken from the beginning of the experiment in the summer until its conclusion in the autumn of the following year. Net growth (in cm) per month was calculated by subtracting the previous month’s value from the value obtained in the current month for the three parameters evaluated. The monthly values were summed, with the final month’s value considered as the accumulated growth in height, canopy volume, and stem diameter.
4.6. Photosystem II (Fv/Fm) Efficiency
Maximum photosystem II efficiency (Fv/Fm) was measured in healthy and diseased Persian lime leaves using a portable OS30p fluorometer (Opti-Sciences). The leaves from healthy and diseased plants were adapted to dark conditions before measurements were taken. Data collection occurred under daylight conditions in the greenhouse at a consistent time in the morning.
4.7. Chlorophyll Quantification in Leaves
The methodology outlined by Das et al. [72], was applied for chlorophyll extraction, incorporating modifications from Flores-de la Rosa et al. [38]. The absorbance of the solution was measured at wavelengths of 645 and 633 nm using a spectrophotometer, with acetone serving as a comparative blank. The total chlorophyll content was calculated using the following formula [73]:
where: A = absorbance at a specific wavelength (633 and 645 nm), V = final volume of chlorophyll extracted in 80 % acetone, FW = sample fresh weight.
mg of total chlorophyll/g of tissue = [20.2(A645) + 8.02 (A633)]*V/1000*FW
4.8. Quantification of Sucrose and Starch in Leaves
Sucrose extraction was carried out using the methodology described by Geigenberger and Stitt [74]. For quantification, commercial kit SCA20 (Sigma-Aldrich®) was used. A calibration curve was constructed with pure rice starch to evaluate starch (y = 0.0011x + 0.0029, R2 = 0.9997). The extraction was performed according to the methodology reported by Zheng et al. [75], with modifications made by Flores-de la Rosa et al. [38], and quantification was performed by reading the absorbance at 594 nm.
4.9. Reflectance Measurement Using Spectrometry
A spectrometer with a spectral range of 339 to 822 nm and a resolution of 0.45 nm was used to assess changes in leaf reflectance resulting from the loss of photosynthetic pigments. Analyses were focused on the range of 450 to 800 nm. A QP600-025-VIS optical fiber was connected to a 74-UV series collimating lens, which was positioned 5 cm from the base of the module. Data capture was performed using Oceanview® software. The reflectance module was built under dark conditions, with two 90 w halogen lamps serving as the primary light source. A white polytetrafluoroethylene panel was used to calibrate the equipment. The results were analyzed by building spectrograms illustrating the percentage of reflectance of healthy and diseased plants.
4.10. Quantification of Benzoic Acid, trans-Cinnamic Acid and Salicylic Acid in Leaves Using GC-MS
To evaluate the hormonal response of healthy and HLB-diseased plants, the accumulation of salicylic acid (SA) and two precursors, benzoic acid (BA) and trans-cinnamic acid (t-CA) in leaves was quantified. This analysis was performed using gas chromatography/mass spectrometry (GC-MS), following the methodology reported by Hijaz et al. [76] and modified by Nehela et al. [52]. Derivatization of the standards was performed using the same method, and calibration curves were generated by injecting 1 µL of pure standards at concentrations of 100, 50, 20, 10, 5, 2 and 1 ng µL-1 for BA, and 10, 5, 2, 1, 0.5, and 0.2 ng µL-1 for both SA and t-CA. The GC-MS was operated in SIM and Scan modes. Quantitative and qualitative ions were monitored for each standard, and the results were compared with the NIST (National Institute of Standards and Technology) library using the MassHunter® program. Validation was conducted by assessing specificity, linearity, precision, accuracy, detection, and quantification limits, following Rawlinson et al. [77] criteria (Table S2).
4.11. Statistical Analysis
The analyses were conducted using RStudio version 4.3.1 [78]. The Shapiro-Wilk test was applied to assess the normality of the study variables. The Box-Cox transformation was applied for variables that did not meet the normality assumption. Additionally, variables with repeated measurements over time were evaluated by adjusting the data to correlation structures based on the AIC (Akaike Information Criterion) [79]. Additionally, the residuals, kurtosis, and homogeneity of variance were visually inspected after the transformations [80]. A mixed linear model was used to perform the analysis of variance (ANOVA). Also, Tukey’s multiple comparison method (p ≤ 0.05) was used to determine the differences between treatments. The levels of macro and micronutrients were adjusted using a second-degree polynomial regression model. In this regression analysis, the 95% confidence intervals, R2, R2Adj, and the p-value from the F test (p ≤ 0.05) were obtained. Finally, principal component analysis (PCA) was conducted to explore the linear relationship among the study variables in both groups of plants.
5. Conclusions
Broadly, the results for C. latifolia suggest that CLas spreads more slowly than in susceptible citrus, leading to a more gradual expression of symptoms. The disease affected plant development and physiological parameters related to photosynthesis, altering vascular structures and increasing starch accumulation in both the veins and the mesophyll of the leaves. Additionally, an increase in the endogenous content of salicylic acid and its biosynthesis precursors is confirmed in diseased plants compared to healthy ones. However, it was observed that the levels of benzoic acid in the leaves were higher, while the levels of salicylic acid were lower vs. findings reported in susceptible citrus varieties. This finding may suggest a reduced conversion of benzoic acid to salicylic acid. Regarding the impact of combinatorial treatments using macro and micronutrients, it was concluded that soil-application of low doses of macronutrients in combination with micronutrients (Ma-1 + Mi-2) resulted in less damage to Persian lime plants affected by HLB. This treatment promoted more significant plant development, improved photosynthetic performance, and reduced metabolic alterations, such as starch accumulation in the leaves of diseased plants. This finding suggests that when the application is made on an ongoing basis and at lower doses, it increases fertilizer utilization. In contrast, increasing the doses of macronutrients and simultaneously applying micronutrients to the soil and through foliar sprays does not seem advantageous, even for healthy Persian lime plants, under the conditions evaluated. These results highlight the importance of careful fertilization management to optimize its use and help reduce the negative effects of HLB on diseased Persian lime plants. It is essential to reassess the timing and dosage of fertilization practices in regions where HLB has become prevalent, such as in the citrus-growing states of Mexico. This reevaluation could lead to potential benefits in environmental sustainability and production costs.
Supplementary Materials
The following supporting information can be downloaded at the website of this paper posted on Preprints.org, Figure S1: Leaf reflectance percentage at A) 550 nm and B) 790 nm for macro and micronutrient levels. According to Tukey (p < 0.05), different letters represent significant differences. Values represent four replicates, mean ± standard deviation. Ma = macronutrients, Mi = micronutrients. Figure S2: Effect of CLas infection and fertilization treatments on the content of A) total chlorophyll, B) saccharose, and C) starch in leaves. The main effects, according to the general linear model (ANOVA), are indicated in graphs. According to Tukey (p < 0.05), different letters represent significant differences. The values represent four replicates, mean ± standard deviation. Ma = macronutrients, Mi = micronutrients. Figure S3: Histological sections of leaf midribs show accumulation of starch grains in collenchyma, parenchyma, and pith cells in HLB-diseased plants, vs. healthy plants. Diseased plants show anatomical changes in the vascular system, such as hyperplasia and increased phloem area. coll = collenchyma, par = parenchyma, Pf = phloem fibers, P = phloem, X = xylem, pi = pith, H = hyperplasia. Black arrows indicate the presence of starch. Figure S4: Effect of CLas infection and fertilization treatments on cumulative growth in A) height, B) canopy volume, and C) stem diameter. According to the general linear model (ANOVA), the main effects are indicated in the graphs. According to Tukey (p < 0.05), different letters represent significant differences. Values represent four replicates, mean ± standard deviation. Ma = Macronutrients, Mi = Micronutrients. Figure S5: Multivariate principal component analysis (biplot-PCA), including the study variables and their association with the groups of healthy and HLB-diseased Persian lime plants. Ht = height, CV = canopy volume, DT = trunk diameter, Chl = chlorophyll, Suc = sucrose, Glc = glucose, St = starch, tCA = trans-cinnamic acid, BA = benzoic acid, SA = salicylic acid, Refl = reflectance, Fv/fm = photosystem II efficiency. Table S1: Fertilization treatments evaluated in healthy and HLB-diseased plants, consisting of three levels of macro and micronutrients. Table S2: Validation parameters of the chromatographic method for the quantification of BA, t-CA, and SA.
Author Contributions
Conceptualization, methodology, investigation, validation and resources, L.A.P.-Z., J.A.V.-J., A.M.-H., F.O.-A., E.G.-P., and F.M-T.; formal analysis, L.A.P.-Z. and J.A.V.-J.; data curation, L.A.P.-Z.; writing—original draft preparation, L.A.P-Z.; writing—review and editing, L.A.P.-Z., J.A.V.-J., A.M.-H., F.O.-A., E.G.-P., and F.M-T; visualization, L.A.P.-Z. and J.A.V.-J.; supervision, J.A.V.-J. and A.M.-H.; project administration, L.A.P.-Z. and J.A.V.-J; funding acquisition, L.A.P.-Z. and J.A.V.-J. All authors have read and agreed to the published version of the manuscript.”
Funding
Research funds were provided by Consejo Veracruzano de Investigación Científica y Desarrollo Tecnológico (COVEICYDET) (Project No. 15 1136/2021). L.A.P.Z. scholarship was provided by CONAHCyT.
Data Availability Statement
Not applicable
Conflicts of Interest
The authors declare no conflicts of interest.
References
- da Graça, J.V.; Douhan, G.W.; Halbert, S.E.; Keremane, M.L.; Lee, R.F.; Vidalakis, G.; Zhao, H. Huanglongbing: An Overview of a Complex Pathosystem Ravaging the World’s Citrus: Citrus Huanglongbing. J. Integr. Plant Biol. 2016, 58, 373–387. [Google Scholar] [CrossRef]
- Killiny, N. Made for Each Other: Vector–Pathogen Interfaces in the Huanglongbing Pathosystem. Phytopathology® 2022, 112, 26–43. [Google Scholar] [CrossRef]
- Mora-Aguilera, G.; Robles-García, P.; López-Arroyo, J.I.; Flores-Sánchez, J.; Acevedo-Sánchez, G.; Domínguez-Monge, S.; Gutierrez-Espinosa, A.; Loeza-Kuk, E.; González-Gómez, R. Situación Actual y Perspectivas del Manejo del HLB de los Cítricos. Rev. Mex. Fitopatol. 2014, 32, 108–119, https://rmf.smf.org.mx/historicoRMF/Vol3222014/AR/32-2_03.pdf. [Google Scholar]
- Farnsworth, D.; Grogan, K.A.; Bruggen, A.H.C. van; Moss, C. The Potential Economic Cost and Response to Greening in Florida Citrus. Choices Mag. Food Farm Resour. 2014, 29, 188996, https://www.choicesmagazine.org/UserFiles/file/cmsarticle_393.pdf. [Google Scholar]
- Flores-Sánchez, J.L.; Mora-Aguilera, G.; Loeza-Kuk, E.; López-Arroyo, J.I.; Domínguez-Monge, S.; Acevedo-Sánchez, G.; Robles-García, P.; Flores-Sánchez, J.L.; Mora-Aguilera, G.; Loeza-Kuk, E.; et al. Pérdidas en Producción Inducidas por Candidatus Liberibacter asiaticus en Limón Persa, en Yucatán México. Rev. Mex. Fitopatol. 2015, 33, 195–210, https://rmf.smf.org.mx/historicoRMF/Vol3322015/AC/AC5.pdf. [Google Scholar]
- Villar-Luna, H.; Santos-Cervantes, M.E.; Rodríguez-Negrete, E.A.; Méndez-Lozano, J.; Leyva-López, N.E. Economic and Social Impact of Huanglongbing on the Mexico Citrus Industry: A Review and Future Perspectives. Horticulturae 2024, 10, 481. [Google Scholar] [CrossRef]
- Nehela, Y.; Killiny, N. Revisiting the Complex Pathosystem of Huanglongbing: Deciphering the Role of Citrus Metabolites in Symptom Development. Metabolites 2020, 10, 409. [Google Scholar] [CrossRef]
- Ribeiro, C.; Stitt, M.; Hotta, C.T. How Stress Affects Your Budget—Stress Impacts on Starch Metabolism. Front. Plant Sci. 2022, 13, 774060. [Google Scholar] [CrossRef]
- Kumar, N.; Kiran, F.; Etxeberria, E. Huanglongbing-Induced Anatomical Changes in Citrus Fibrous Root Orders. 2018. [CrossRef]
- Deng, H.; Achor, D.; Exteberria, E.; Yu, Q.; Du, D.; Stanton, D.; Liang, G.; Gmitter Jr., F. G. Phloem Regeneration Is a Mechanism for Huanglongbing-Tolerance of “Bearss” Lemon and “LB8-9” Sugar Belle® Mandarin. Front. Plant Sci. 2019, 10, 277. [Google Scholar] [CrossRef]
- Suh, J.H.; Tang, X.; Zhang, Y.; Gmitter, F.G.; Wang, Y. Metabolomic Analysis Provides New Insight into Tolerance of Huanglongbing in Citrus. Front. Plant Sci. 2021, 12, 710598. [Google Scholar] [CrossRef]
- Ma, W.; Pang, Z.; Huang, X.; Xu, J.; Pandey, S.S.; Li, J.; Achor, D.S.; Vasconcelos, F.N.C.; Hendrich, C.; Huang, Y.; et al. Citrus Huanglongbing Is a Pathogen-Triggered Immune Disease That Can Be Mitigated with Antioxidants and Gibberellin. Nat. Commun. 2022, 13, 529. [Google Scholar] [CrossRef]
- Folimonova, S.Y.; Robertson, C.J.; Garnsey, S.M.; Gowda, S.; Dawson, W.O. Examination of the Responses of Different Genotypes of Citrus to Huanglongbing (Citrus Greening) under Different Conditions. Phytopathology 2009, 99, 1346–1354. [Google Scholar] [CrossRef]
- Sivager, G.; Calvez, L.; Bruyere, S.; Boisne-Noc, R.; Brat, P.; Gros, O.; Ollitrault, P.; Morillon, R. Specific Physiological and Anatomical Traits Associated with Polyploidy and Better Detoxification Processes Contribute to Improved Huanglongbing Tolerance of the Persian Lime Compared with the Mexican Lime. Front. Plant Sci. 2021, 12, 685679. [Google Scholar] [CrossRef]
- Ortiz-Saavedra, S.; Domínguez-Monge, S.; Allende-Molar, R.; Mendoza-García, J.D.; Pérez-Hernández, O.; Rodríguez-Quibrera, C.G.; Curti-Díaz, S.A.; Flores-Sánchez, J.L.; Sarmiento-Tejeda, R. Influencia de Huanglongbing en Pérdidas de Producción y Calidad de Frutos de Limón Persa en Veracruz. Supl Rev Mex Fitopatol 2022, 40, S40, https://rmf.smf.org.mx/historicoRMF/suplemento/suplemento402022/resumenes.pdf. [Google Scholar]
- Alquézar, B.; Carmona, L.; Bennici, S.; Miranda, M.P.; Bassanezi, R.B.; Peña, L. Cultural Management of Huanglongbing: Current Status and Ongoing Research. Phytopathology® 2022, 112, 11–25. [Google Scholar] [CrossRef]
- Tripathi, R.; Tewari, R.; Singh, K.P.; Keswani, C.; Minkina, T.; Srivastava, A.K.; De Corato, U.; Sansinenea, E. Plant Mineral Nutrition and Disease Resistance: A Significant Linkage for Sustainable Crop Protection. Front. Plant Sci. 2022, 13, 883970. [Google Scholar] [CrossRef]
- Ahmad, K.; Ismail, S.I. Enhanced Nutritional Programme: An Innovative Approach to Controlling Plant Diseases in the Tropics. In Plant, Soil and Microbes: Volume 1: Implications in Crop Science; Hakeem, K.R., Akhtar, M.S., Abdullah, S.N.A., Eds.; Springer International Publishing: Cham, 2016; pp. 225–251. ISBN 978-3-319-27455-3. [Google Scholar]
- Ramirez, D.; Chaparro, J.; Wright, A.; Boman, B.; Gruber, B.; Ritenour, M.; Marino, S. Mitigation of Huanglongbing Effects on Grapefruit Trees Using Enhanced Nutritional Programs. Proc Fla State Hort Soc 2016, 51–55. [Google Scholar]
- Nwugo, C.C.; Duan, Y.; Lin, H. Study on Citrus Response to Huanglongbing Highlights a Down-Regulation of Defense-Related Proteins in Lemon Plants Upon ‘Ca. Liberibacter Asiaticus’ Infection. PLoS ONE 2013, 8. [Google Scholar] [CrossRef]
- Dong, Z.; Srivastava, A.K.; Liu, X.; Riaz, M.; Gao, Y.; Liang, X.; Tan, Q.; Sun, X.; Wu, S.; Hu, C. Interactions between Nutrient and Huanglongbing Pathogen in Citrus: An Overview and Implications. Sci. Hortic. 2021, 290, 110511. [Google Scholar] [CrossRef]
- Uthman, Q.O.; Kadyampakeni, D.M.; Nkedi-Kizza, P. Manganese Adsorption, Availability, and Uptake in Citrus under Microsprinkler Irrigation. Agrosystems Geosci. Environ. 2020, 3, e20061. [Google Scholar] [CrossRef]
- Atta, A.A.; Morgan, K.T.; Kadyampakeni, D.M.; Mahmoud, K.A. The Effect of Foliar and Ground-Applied Essential Nutrients on Huanglongbing-Affected Mature Citrus Trees. Plants 2021, 10, 925. [Google Scholar] [CrossRef]
- da Silva, J.R.; de Alvarenga, F.V.; Boaretto, R.M.; Lopes, J.R.S.; Quaggio, J.A.; Coletta Filho, H.D.; Mattos, D. Following the Effects of Micronutrient Supply in HLB-Infected Trees: Plant Responses and ‘Candidatus Liberibacter Asiaticus’ Acquisition by the Asian Citrus Psyllid. Trop. Plant Pathol. 2020, 45, 597–610. [Google Scholar] [CrossRef]
- Atta, A.A.; Morgan, K.T.; Hamido, S.A.; Kadyampakeni, D.M.; Mahmoud, K.A. Water and Soil Nutrient Dynamics of Huanglongbing-Affected Citrus Trees as Impacted by Ground-Applied Nutrients. Agronomy 2020, 10, 1485. [Google Scholar] [CrossRef]
- Zambon, F.T.; Kadyampakeni, D.M.; Grosser, J.W. Ground Application of Overdoses of Manganese Have a Therapeutic Effect on Sweet Orange Trees Infected with Candidatus Liberibacter Asiaticus. HortScience 2019, 54, 1077–1086. [Google Scholar] [CrossRef]
- Morgan, K.T.; Rouse, R.E.; Ebel, R.C. Foliar Applications of Essential Nutrients on Growth and Yield of ‘Valencia’ Sweet Orange Infected with Huanglongbing. HortScience 2016, 51, 1482–1493. [Google Scholar] [CrossRef]
- Zekri, M.; Obreza, T.A.; Koo, R.; Alferez, F.M. Irrigation, Nutrition, and Citrus Fruit Quality: SL 207 SS426, Rev. 4 2018. EDIS 2018 (April). Gainesville, FL:3. 2018. [CrossRef]
- Kadyampakeni, D.M.; Chinyukwi, T. Are Macronutrients and Micronutrients Therapeutic for Restoring Performance of Trees Affected by Citrus Greening? A Discussion of Current Practices and Future Research Opportunities. J. Plant Nutr. 2021, 44, 2949–2969. [Google Scholar] [CrossRef]
- Atta, A.A.; Morgan, K.T.; Kadyampakeni, D.M.; Kamal, M.A. Effect of Soil and/or Foliar Applied Nutrients on Leaf Nutrient Accumulation and Water Uptake on Huanglongbing Affected ‘Valencia’ Citrus Trees. Proc. Fla. State Hortic. Soc. 2018, 131, 58–64. [Google Scholar]
- Morgan, E.K.T.; Kadyampakeni, D.M. Nutrition of Florida Citrus Trees, 3rd Edition. 2020, 113. https://swfrec.ifas.ufl.edu/docs/pdf/soil-water/EDIS_SL253_Nutrition_FL_Citrus_Trees.pdf.
- Albrecht, U.; Bowman, K.D. Transcriptional Response of Susceptible and Tolerant Citrus to Infection with Candidatus Liberibacter Asiaticus. Plant Sci. 2012, 185–186, 118–130. [Google Scholar] [CrossRef]
- Sivager, G.; Calvez, L.; Bruyere, S.; Boisne-Noc, R.; Hufnagel, B.; Cebrian-Torrejon, G.; Doménech-Carbó, A.; Gros, O.; Ollitrault, P.; Morillon, R. Better Tolerance to Huanglongbing Is Conferred by Tetraploid Swingle Citrumelo Rootstock and Is Influenced by the Ploidy of the Scion. Front. Plant Sci. 2022, 13, 1030862. [Google Scholar] [CrossRef]
- Flores-Sánchez, J.L.; Mora-Aguilera, G.; Loeza-Kuk, E.; López-Arroyo, J.I.; Gutiérrez-Espinosa, M.A.; Velázquez-Monreal, J.J.; Domínguez-Monge, S.; Bassanezi, R.B.; Acevedo-Sánchez, G.; Robles-García, P. Diffusion Model for Describing the Regional Spread of Huanglongbing from First-Reported Outbreaks and Basing an Area Wide Disease Management Strategy. Plant Dis. 2017, 101, 1119–1127. [Google Scholar] [CrossRef]
- Cen, H.; Weng, H.; Yao, J.; He, M.; Lv, J.; Hua, S.; Li, H.; He, Y. Chlorophyll Fluorescence Imaging Uncovers Photosynthetic Fingerprint of Citrus Huanglongbing. Front. Plant Sci. 2017, 8. [Google Scholar] [CrossRef]
- Chen, Y.; Liu, L.; Guo, Q.; Zhu, Z.; Zhang, L. Effects of Different Water Management Options and Fertilizer Supply on Photosynthesis, Fluorescence Parameters and Water Use Efficiency of Prunella Vulgaris Seedlings. Biol. Res. 2016, 49, 12. [Google Scholar] [CrossRef]
- Shahzad, F.; Chun, C.; Schumann, A.; Vashisth, T. Nutrient Uptake in Huanglongbing-Affected Sweet Orange: Transcriptomic and Physiological Analysis. J. Am. Soc. Hortic. Sci. 2020, 145, 349–362. [Google Scholar] [CrossRef]
- Flores-de la Rosa, F.R.; Santillán-Mendoza, R.; Rodríguez-Quibrera, C.G.; Martínez-Ruiz, A.; Adame-García, J.; Luna-Rodriguez, M. Antioxidant Gene Expression, Chlorophyll, and Starch Content in Persian Lime (Citrus latifolia Tanaka Ex Q. Jiménez) Trees with HLB by Application of Elicitors of Plant Resistance. Mex. J. Biotechnol. 2021, 6, 86–102. [Google Scholar] [CrossRef]
- Smeekens, S. Sugar-Induced Signal Transduction in Plants. Annu. Rev. Plant Physiol. Plant Mol. Biol. 2000, 51, 49–81. [Google Scholar] [CrossRef]
- Curtolo, M.; de Souza, P.I.; Boava, L.P.; Takita, M.A.; Granato, L.M.; Galdeano, D.M.; de Souza, A.A.; Cristofani-Yaly, M.; Machado, M.A. Wide-Ranging Transcriptomic Analysis of Poncirus trifoliata, Citrus sunki, Citrus sinensis and Contrasting Hybrids Reveals HLB Tolerance Mechanisms. Sci. Rep. 2020, 10, 20865. [Google Scholar] [CrossRef]
- Rosales, R.; Burns, J.K. Phytohormone Changes and Carbohydrate Status in Sweet Orange Fruit from Huanglongbing-Infected Trees. J. Plant Growth Regul. 2011, 30, 312–321. [Google Scholar] [CrossRef]
- Weng, H.; Lv, J.; Cen, H.; He, M.; Zeng, Y.; Hua, S.; Li, H.; Meng, Y.; Fang, H.; He, Y. Hyperspectral Reflectance Imaging Combined with Carbohydrate Metabolism Analysis for Diagnosis of Citrus Huanglongbing in Different Seasons and Cultivars. Sens. Actuators B Chem. 2018, 275, 50–60. [Google Scholar] [CrossRef]
- Peñuelas, J.; Filella, I. Visible and Near-Infrared Reflectance Techniques for Diagnosing Plant Physiological Status. Trends Plant Sci. 1998, 3, 151–156. [Google Scholar] [CrossRef]
- Martínez-Martínez, V.; Gomez-Gil, J.; Machado, M.L.; Pinto, F.A.C. Leaf and Canopy Reflectance Spectrometry Applied to the Estimation of Angular Leaf Spot Disease Severity of Common Bean Crops. PLOS ONE 2018, 13, e0196072. [Google Scholar] [CrossRef]
- Deng, X.; Huang, Z.; Zheng, Z.; Lan, Y.; Dai, F. Field Detection and Classification of Citrus Huanglongbing Based on Hyperspectral Reflectance. Comput. Electron. Agric. 2019, 167, 105006. [Google Scholar] [CrossRef]
- He, C.; Li, X.; Liu, Y.; Yang, B.; Wu, Z.; Tan, S.; Ye, D.; Weng, H. Combining Multicolor Fluorescence Imaging with Multispectral Reflectance Imaging for Rapid Citrus Huanglongbing Detection Based on Lightweight Convolutional Neural Network Using a Handheld Device. Comput. Electron. Agric. 2022, 194, 106808. [Google Scholar] [CrossRef]
- Miles, G.P.; Stover, E.; Ramadugu, C.; Keremane, M.L.; Lee, R.F. Apparent Tolerance to Huanglongbing in Citrus and Citrus-Related Germplasm. HortScience 2017, 52, 31–39. [Google Scholar] [CrossRef]
- Kwakye, S.; Kadyampakeni, D.M.; Morgan, K.; Vashisth, T.; Wright, A. Effects of Iron Rates on Growth and Development of Young Huanglongbing-Affected Citrus Trees in Florida. HortScience 2022, 57, 1092–1098. [Google Scholar] [CrossRef]
- Koh, E.-J.; Zhou, L.; Williams, D.S.; Park, J.; Ding, N.; Duan, Y.-P.; Kang, B.-H. Callose Deposition in the Phloem Plasmodesmata and Inhibition of Phloem Transport in Citrus Leaves Infected with “Candidatus Liberibacter Asiaticus. ” Protoplasma 2012, 249, 687–697. [Google Scholar] [CrossRef]
- Esquivel-Chávez, F.; Valdovinos-Ponce, G.; Mora-Aguilera, G.; Gómez-Jaimes, R.; Velázquez-Monreal, J.J.; Manzanilla-Ramírez, M.Á.; Flores-Sánchez, J.L.; López-Arroyo, J.I. Análisis Histológico Foliar de Cítricos Agrios y Naranja Dulce con Síntomas Ocasionados por Candidatus Liberibacter Asiaticus. Agrociencia 2012, 46, 769–782. [Google Scholar]
- Gilroy, E.; Breen, S. Interplay between Phytohormone Signalling Pathways in Plant Defence – Other than Salicylic Acid and Jasmonic Acid. Essays Biochem. 2022, 66, 657–671. [Google Scholar] [CrossRef]
- Nehela, Y.; Hijaz, F.; Elzaawely, A.A.; El-Zahaby, H.M.; Killiny, N. Phytohormone Profiling of the Sweet Orange (Citrus Sinensis (L.) Osbeck) Leaves and Roots Using GC-MS-Based Method. J. Plant Physiol. 2016, 199, 12–17. [Google Scholar] [CrossRef]
- Nehela, Y.; Hijaz, F.; Elzaawely, A.A.; El-Zahaby, H.M.; Killiny, N. Citrus Phytohormonal Response to Candidatus Liberibacter Asiaticus and Its Vector Diaphorina Citri. Physiol. Mol. Plant Pathol. 2018, 102, 24–35. [Google Scholar] [CrossRef]
- Zou, X.; Bai, X.; Wen, Q.; Xie, Z.; Wu, L.; Peng, A.; He, Y.; Xu, L.; Chen, S. Comparative Analysis of Tolerant and Susceptible Citrus Reveals the Role of Methyl Salicylate Signaling in the Response to Huanglongbing. J. Plant Growth Regul. 2019, 38, 1516–1528. [Google Scholar] [CrossRef]
- Xu, M.; Li, Y.; Zheng, Z.; Dai, Z.; Tao, Y.; Deng, X. Transcriptional Analyses of Mandarins Seriously Infected by ‘Candidatus Liberibacter Asiaticus. ’ PLoS ONE 2015, 10. [Google Scholar] [CrossRef] [PubMed]
- Nehela, Y.; Taha, N.A.; Elzaawely, A.A.; Xuan, T.D.; A. Amin, M.; Ahmed, M.E.; El-Nagar, A. Benzoic Acid and its Hydroxylated Derivatives Suppress Early Blight of Tomato (Alternaria Solani) via the Induction of Salicylic Acid Biosynthesis and Enzymatic and Nonenzymatic Antioxidant Defense Machinery. J. Fungi 2021, 7, 663. [Google Scholar] [CrossRef]
- Coquoz, J.-L.; Buchala, A.; Métraux, J.-P. The Biosynthesis of Salicylic Acid in Potato Plants. Plant Physiol. 1998, 117, 1095–1101. [Google Scholar] [CrossRef]
- Nehela, Y.; Killiny, N. Gamma-Aminobutyric Acid Supplementation Boosts the Phytohormonal Profile in ‘Candidatus Liberibacter Asiaticus’-Infected Citrus. Plants 2023, 12, 3647. [Google Scholar] [CrossRef]
- Torres, L.M.F.; Olivas, A.F.; Fuentes, Y.M.O.; Arroyo, J.I.L.; Portugal, V.O.; Mendoza, A.B.; Morales, S.G.; Villa, V.M.Z. Comparison of Enzymes and Phenolic Compounds in Three Citrus Species Infected with Candidatus Liberibacter Asiaticus. Mex. J. Phytopathol. 2017, 35. [Google Scholar] [CrossRef]
- Esteves, E.; Maltais-Landry, G.; Zambon, F.; Ferrarezi, R.S.; Kadyampakeni, D.M. Nitrogen, Calcium, and Magnesium Inconsistently Affect Tree Growth, Fruit Yield, and Juice Quality of Huanglongbing-Affected Orange Trees. HortScience 2021, 56, 1269–1277. [Google Scholar] [CrossRef]
- Zhao, H.; Sun, R.; Albrecht, U.; Padmanabhan, C.; Wang, A.; Coffey, M.D.; Girke, T.; Wang, Z.; Close, T.J.; Roose, M.; et al. Small RNA Profiling Reveals Phosphorus Deficiency as a Contributing Factor in Symptom Expression for Citrus Huanglongbing Disease. Mol. Plant 2013, 6, 301–310. [Google Scholar] [CrossRef] [PubMed]
- Cao, J.; Cheng, C.; Yang, J.; Wang, Q. Pathogen Infection Drives Patterns of Nutrient Resorption in Citrus Plants. Sci. Rep. 2015, 5, 14675. [Google Scholar] [CrossRef]
- Atta, A.A.; Morgan, K.T.; Hamido, S.A.; Kadyampakeni, D.M. Effect of Essential Nutrients on Roots Growth and Lifespan of Huanglongbing Affected Citrus Trees. Plants 2020, 9, 483. [Google Scholar] [CrossRef]
- Gottwald, T.R.; Da Graça, J.V.; Bassanezi, R.B. Citrus Huanglongbing: The Pathogen and its Impact. Online. Plant Health Progress. http://agris.fao.org/agris-search/search.do?recordID=US201300872725.
- Shokrollah, H.; Lee, A.T.; Sijam, K.; Akmar, A.S.N. Potential Use of Selected Citrus Rootstocks and Interstocks against HLB Disease in Malaysia. Crop Prot. 2011, 30, 521–525. [Google Scholar] [CrossRef]
- Doyle, J.J.; Doyle, J.L. A Rapid DNA Isolation Procedure for Small Quantities of Fresh Leaf Tissue. Phytochem. Bull. 1987, 19, 11–15. [Google Scholar]
- Jagoueix, S.; Bove, J.M.; Garnier, M. The Phloem-Limited Bacterium of Greening Disease of Citrus Is a Member of the Alpha Subdivision of the Proteobacteria. Int. J. Syst. Bacteriol. 1994, 44, 379–386. [Google Scholar] [CrossRef]
- Li, W.; Hartung, J.S.; Levy, L. Quantitative Real-Time PCR for Detection and Identification of Candidatus Liberibacter Species Associated with Citrus Huanglongbing. J. Microbiol. Methods 2006, 66, 104–115. [Google Scholar] [CrossRef]
- Bao, M.; Zheng, Z.; Sun, X.; Chen, J.; Deng, X. Enhancing PCR Capacity To Detect ‘ Candidatus Liberibacter Asiaticus’ Utilizing Whole Genome Sequence Information. Plant Dis. 2020, 104, 527–532. [Google Scholar] [CrossRef] [PubMed]
- Livak, K.J.; Schmittgen, T.D. Analysis of Relative Gene Expression Data Using Real-Time Quantitative PCR and the 2−ΔΔCT Method. Methods 2001, 25, 402–408. [Google Scholar] [CrossRef]
- Kadyampakeni, D.M.; Morgan, K.T.; Schumann, A.W.; Nkedi-Kizza, P. Effect of Irrigation Pattern and Timing on Root Density of Young Citrus Trees Infected with Huanglongbing Disease. HortTechnology 2014, 24, 209–221. [Google Scholar] [CrossRef]
- Das, D.; Seal, P.; Biswas, A.K. Influence of Selenium on Growth, Antioxidants Production and Physiological Parameters of Rice (Oryza Sativa L.) Seedlings and its Possible Reversal by Coapplication of Sulphate. Am. J. Plant Sci. 2019, 10, 2236–2278. [Google Scholar] [CrossRef]
- Arnon, D.I. Copper Enzymes in Isolated Chloroplasts. Polyphenoloxidase in Beta vulgaris. Plant Physiol. 1949, 24, 1–15. [Google Scholar] [CrossRef]
- Fan, J.; Chen, C.; Brlansky, R.H.; Gmitter Jr., F.G.; Li, Z.-G. Changes in Carbohydrate Metabolism in Citrus sinensis Infected with ‘Candidatus Liberibacter Asiaticus.’. Plant Pathol. 2010, 59, 1037–1043. [Google Scholar] [CrossRef]
- Zheng, Y.; Kumar, N.; Gonzalez, P.; Etxeberria, E.d. Strigolactones Restore Vegetative and Reproductive Developments in Huanglongbing (HLB) Affected, Greenhouse-Grown Citrus Trees by Modulating Carbohydrate Distribution. Sci. Hortic. 2018, 237, 89–95. [Google Scholar] [CrossRef]
- Hijaz, F.; Killiny, N. Collection and Chemical Composition of Phloem Sap from Citrus sinensis L. Osbeck (Sweet Orange). PloS One 2014, 9, e101830. [Google Scholar] [CrossRef]
- Rawlinson, C.; Kamphuis, L.G.; Gummer, J.P.A.; Singh, K.B.; Trengove, R.D. A Rapid Method for Profiling of Volatile and Semi-Volatile Phytohormones Using Methyl Chloroformate Derivatisation and GC–MS. Metabolomics 2015, 11, 1922–1933. [Google Scholar] [CrossRef]
- RStudio Team. RStudio: Integrated Development for R. RStudio PBC 2023. Boston, MA http://www.rstudio.com/.
- Brochu, A.-S.; Durrivage, J.; Torres, D.; Pérez-López, E. Diet and Injection, Important Recommendations to Characterize Clavibacter michiganensis –Tomato Interactions. Plant Health Prog. 2023, 24, 475–481. [Google Scholar] [CrossRef]
- Kozak, M.; Piepho, H.-P. What’s Normal Anyway? Residual Plots Are More Telling than Significance Tests when Checking ANOVA Assumptions. J. Agron. Crop Sci. 2018, 204, 86–98. [Google Scholar] [CrossRef]
Figure 1.
Change in the number of bacteria for fertilization treatments compared to the Ma-1+Mi-1 treatment and its relationship with the severity of symptoms on leaves. Ma = Macronutrients, Mi = Micronutrients. Mean ± propagated error.
Figure 1.
Change in the number of bacteria for fertilization treatments compared to the Ma-1+Mi-1 treatment and its relationship with the severity of symptoms on leaves. Ma = Macronutrients, Mi = Micronutrients. Mean ± propagated error.
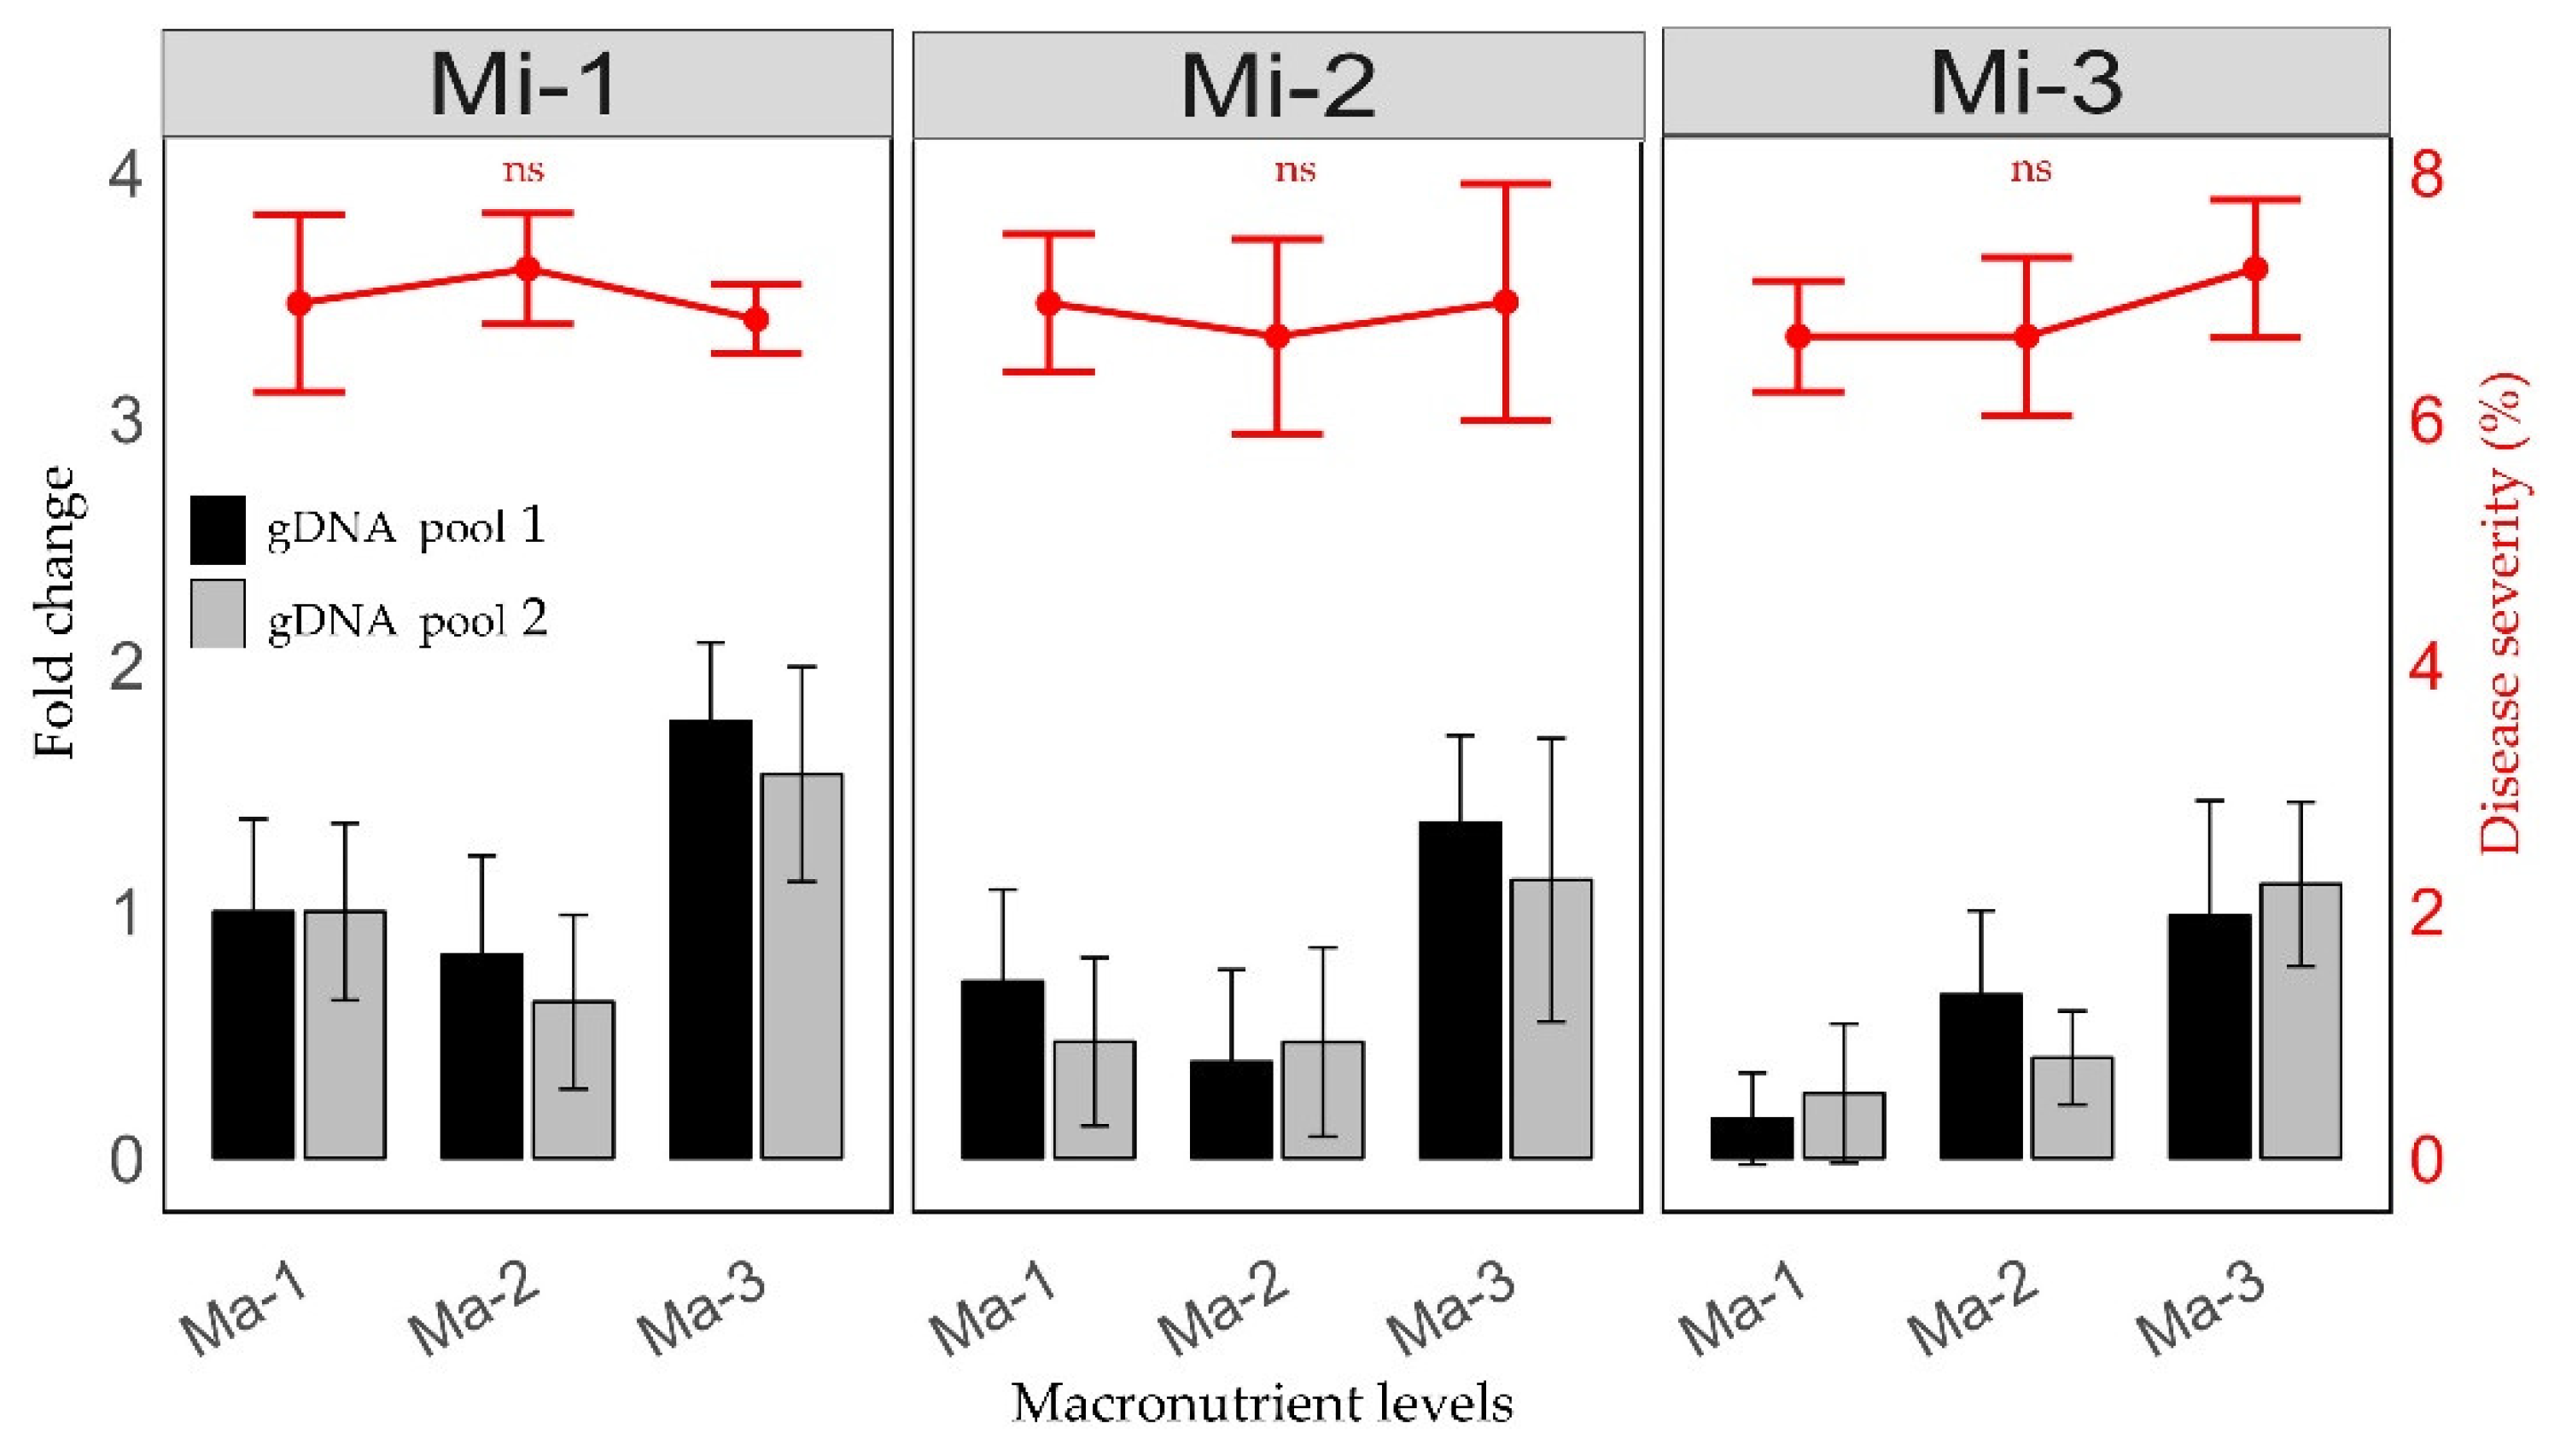
Figure 2.
A) Effect of CLas infection and fertilization treatments on the efficiency of photosystem II. B) Spectrograms with average reflectance for leaves of healthy plants (green line) and diseased plants (red line). C and D) Amplification of visible (VIS) and near-infrared (NIR) regions, with the average reflectance of the fertilization treatments.
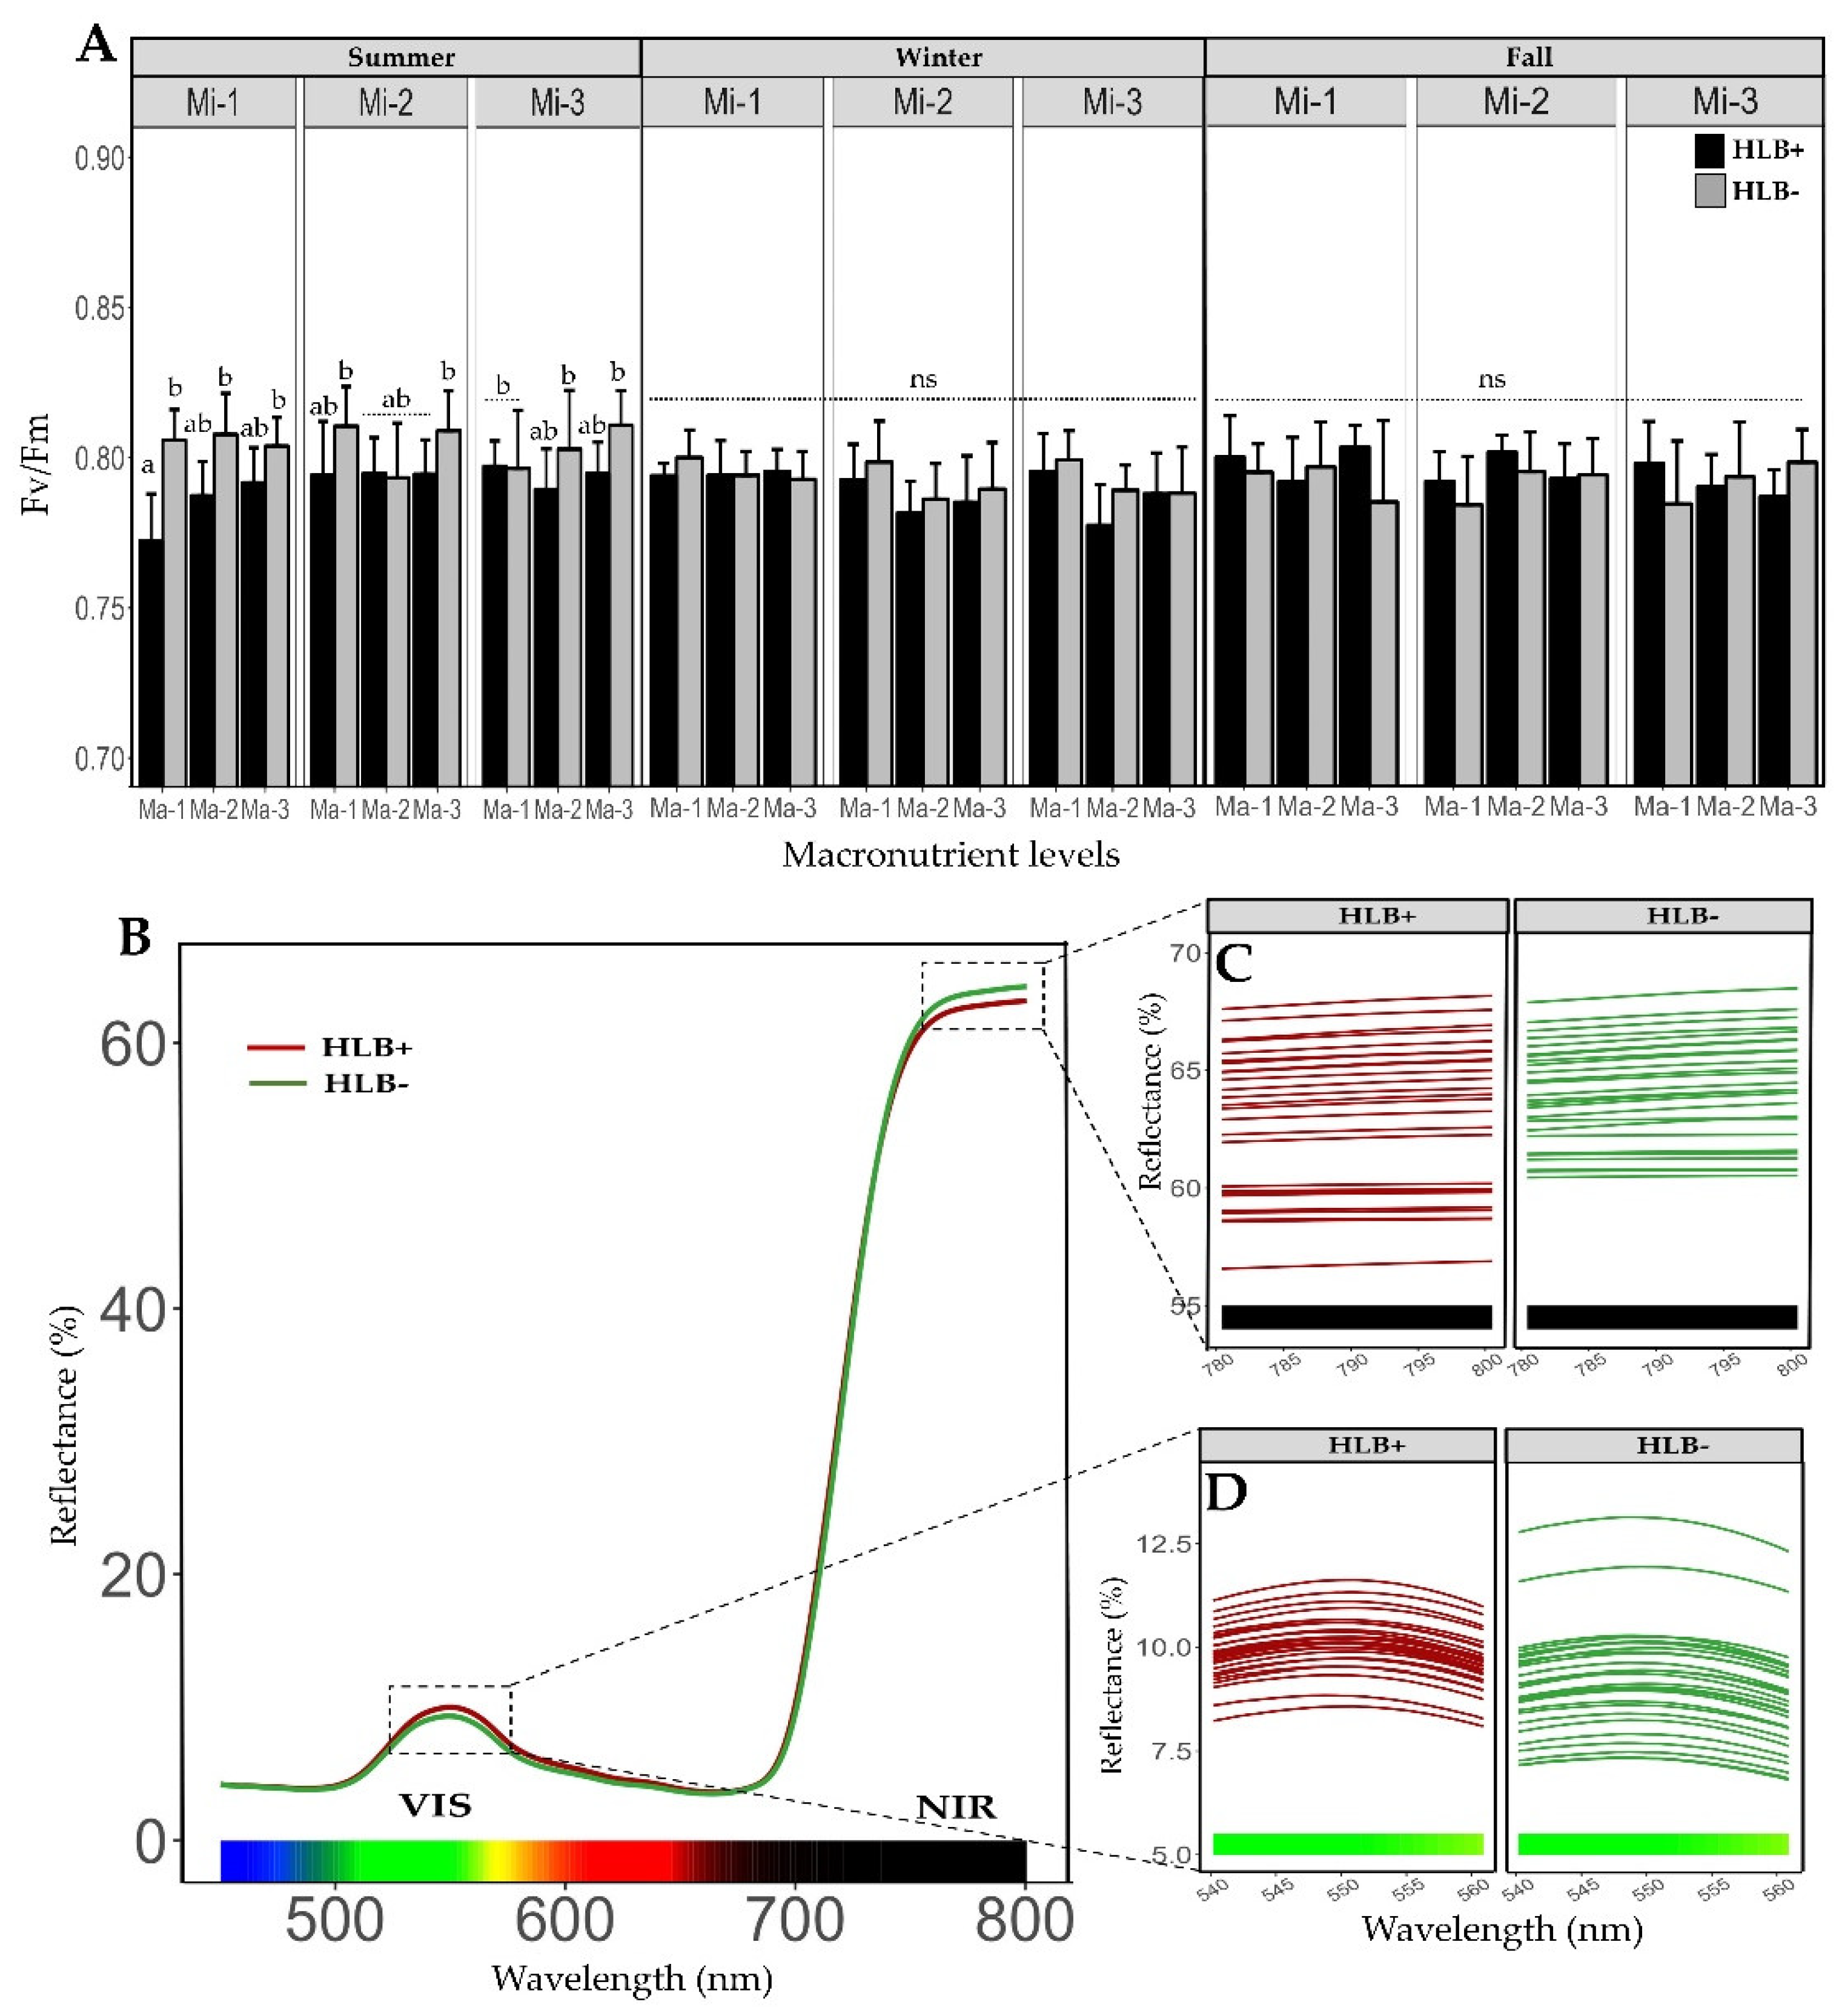
Figure 3.
Polynomial regression analysis for macronutrient (A, C, and E) and micronutrient (B, D, and F) levels and their effect on total chlorophyll, sucrose, and starch content in healthy and HLB-diseased plants. The blue line represents the linear fit of the data. Values represent four replicates, mean ± standard deviation. Ma = macronutrients, Mi = micronutrients.
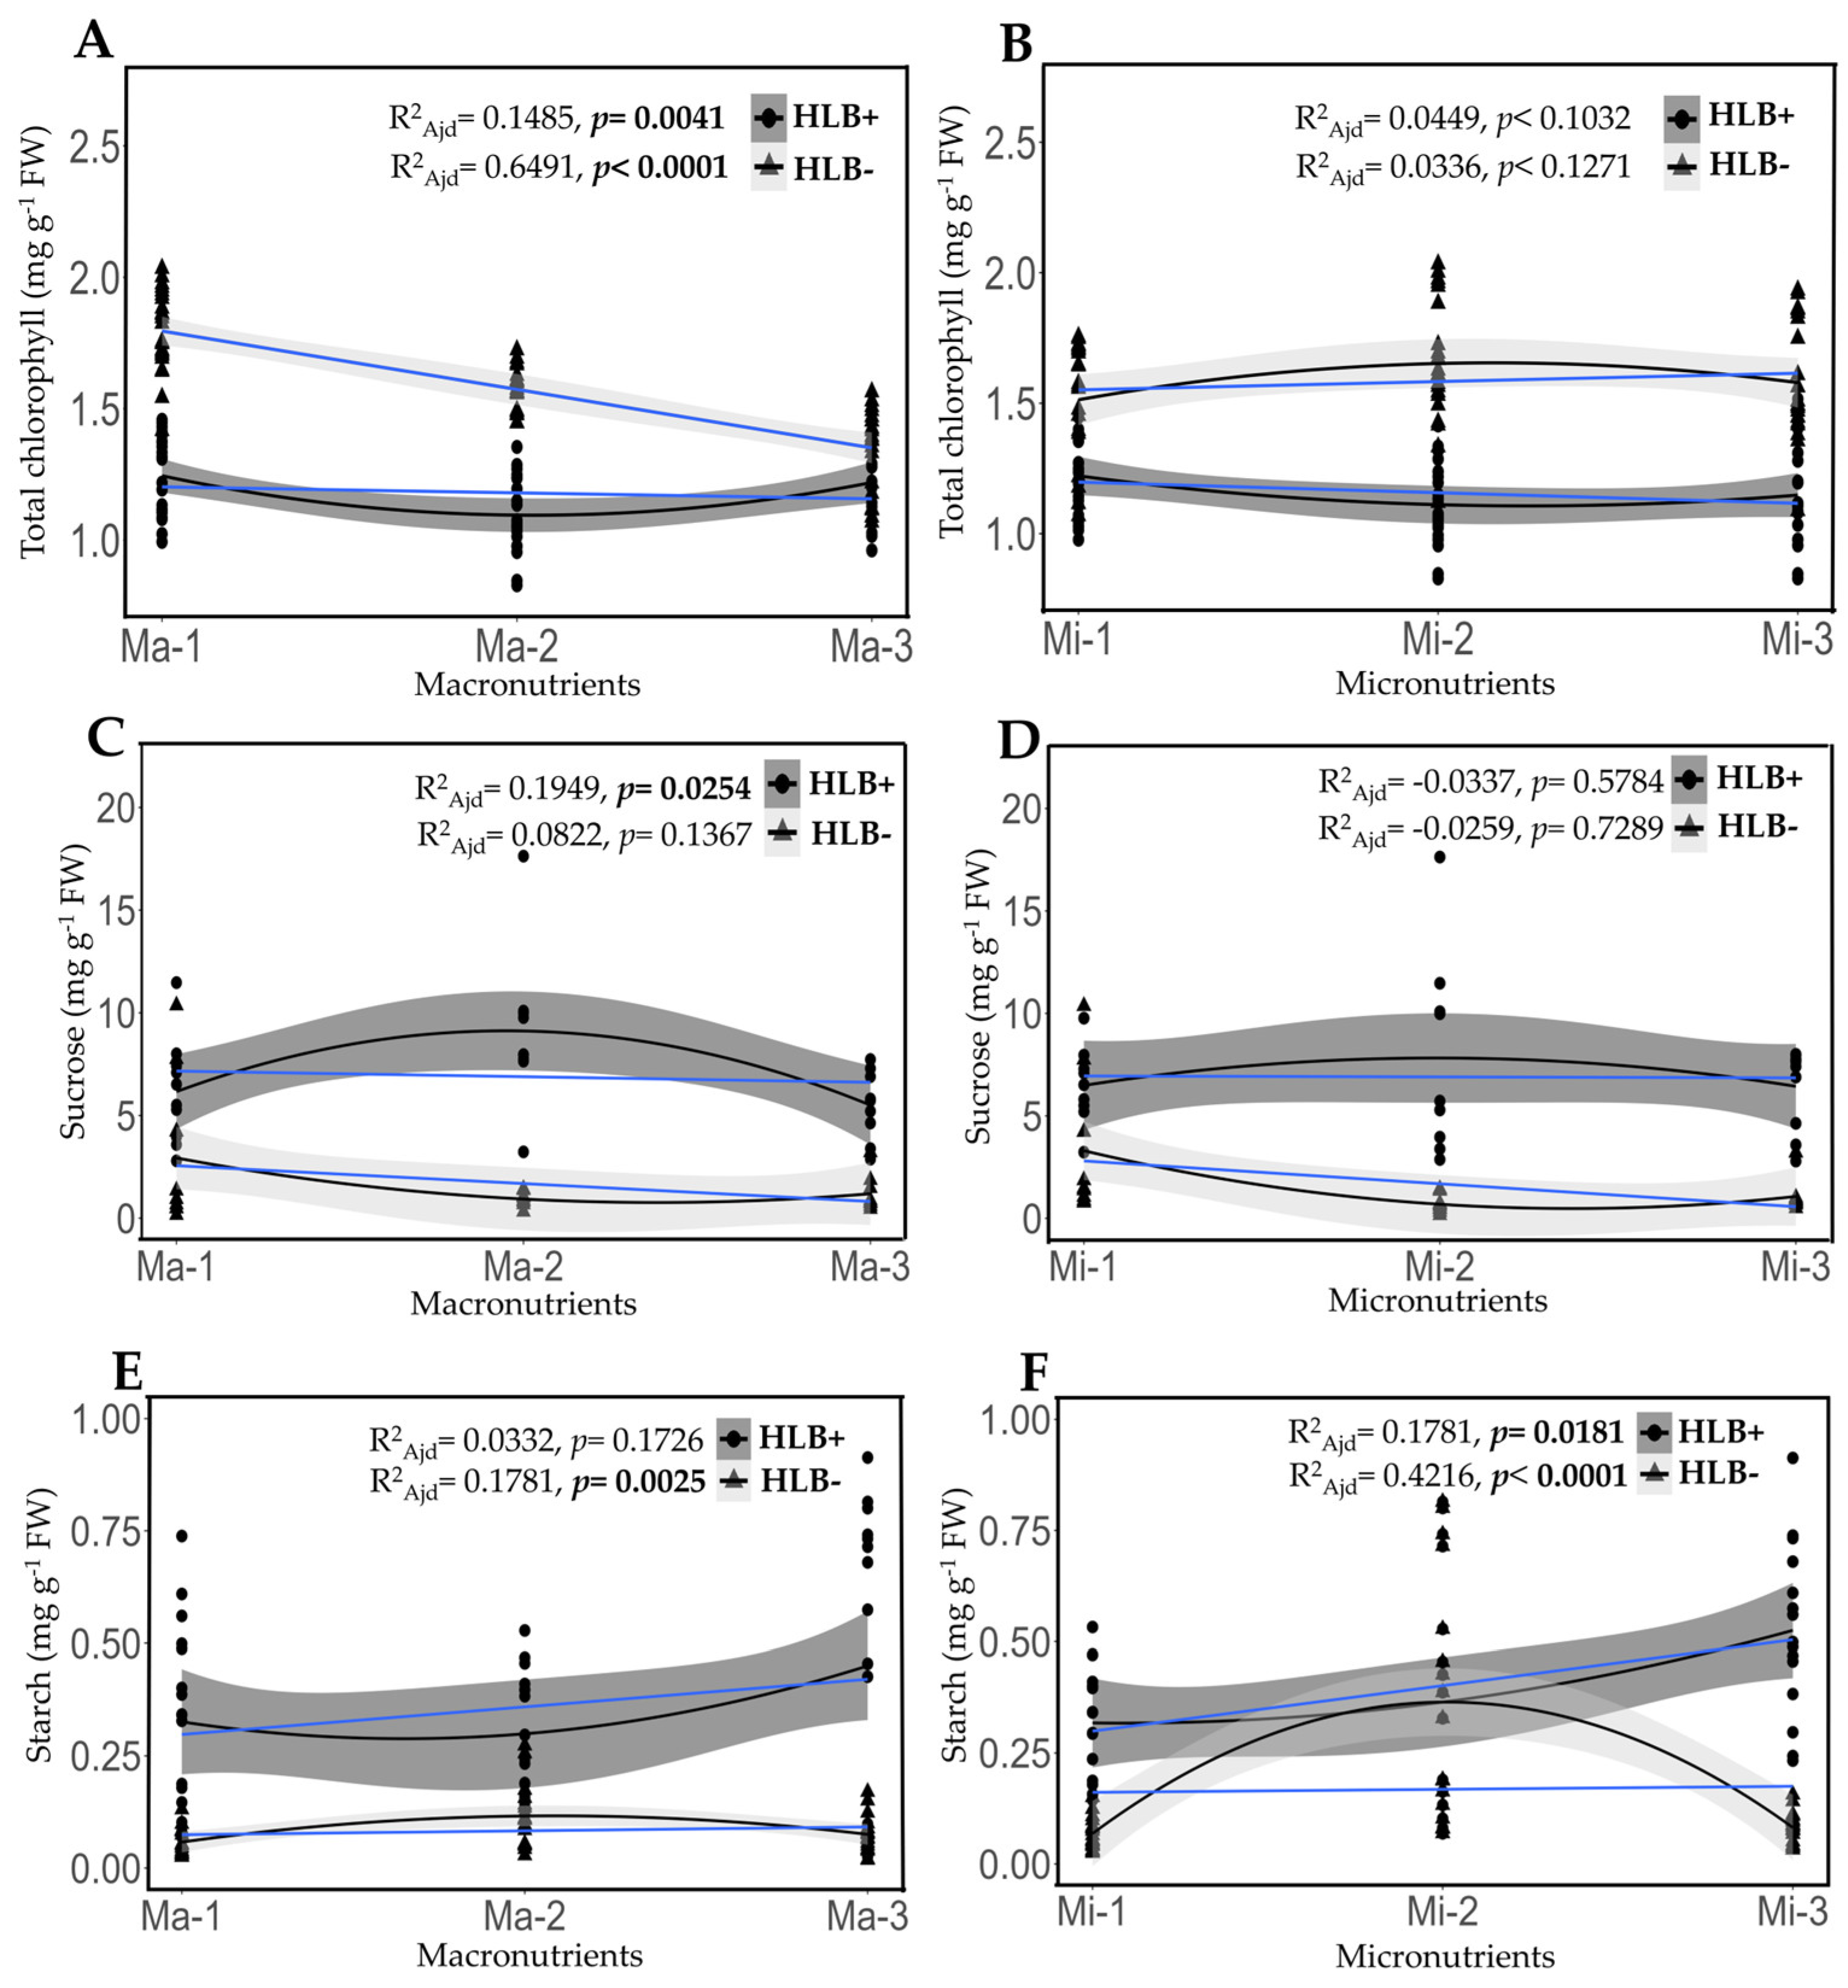
Figure 4.
CLas Infection and fertilization treatments had an impact on the growth and development of Persian lime plants. Polynomial regression analysis was conducted levels of macronutrients (A, C, and E) and micronutrients (B, D, and F) on cumulative growth measurements, including height, canopy volume, and stem diameter in both healthy and HLB-diseased plants. The blue line indicates the linear fit of the data. Values are expressed as mean ± standard deviation. Ma = macronutrients, Mi = micronutrients, CV = canopy volume, TD = stem diameter.
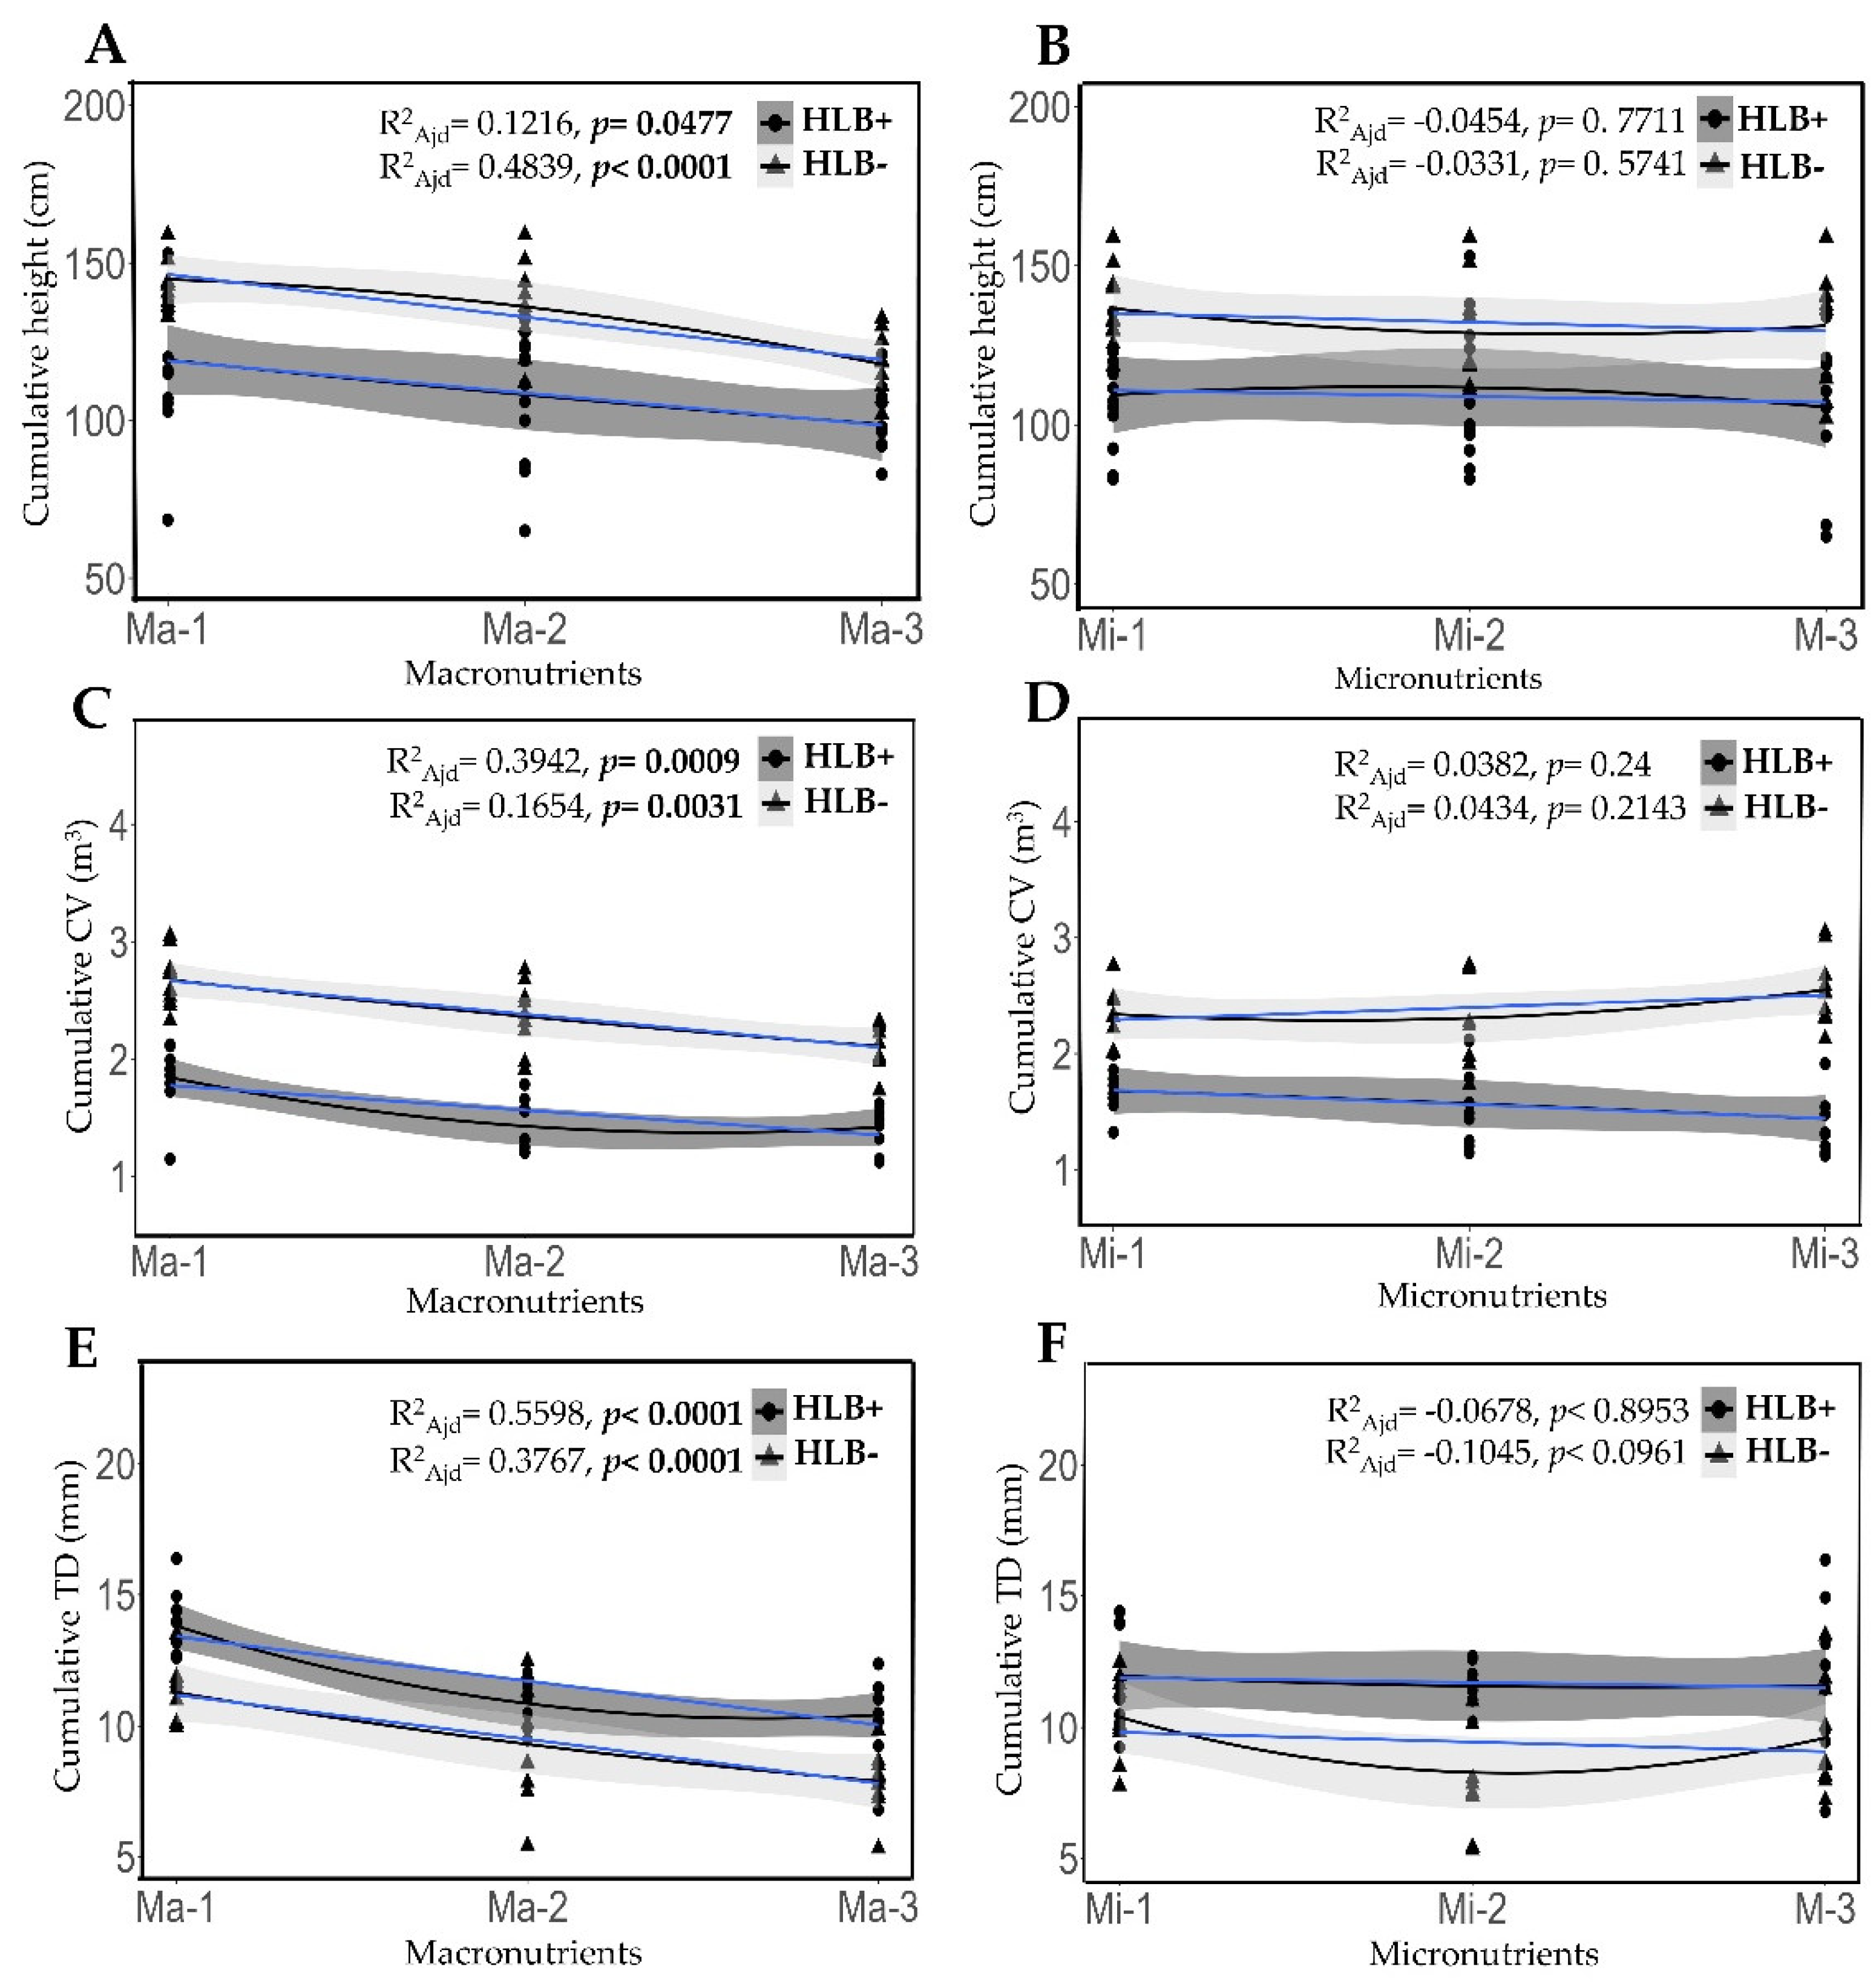
Figure 5.
Impact of CLas infection and fertilization treatment on endogenous salicylic acid and its biosynthetic precursors content. (A, D, and G) Concentration of trans-cinnamic acid, benzoic acid, and salicylic acid in leaves (B, C, E, F H, I). Polynomial regression analysis for macro and micronutrient levels in healthy and diseased plants. The blue line represents the linear fit of data. According to the general linear model (ANOVA), the main effects are shown within graphs. Different letters indicate significant differences (Tukey, p < 0.05). Values represent mean ± standard deviation. Ma = macronutrients, Mi = micronutrients.
Disclaimer/Publisher’s Note: The statements, opinions and data contained in all publications are solely those of the individual author(s) and contributor(s) and not of MDPI and/or the editor(s). MDPI and/or the editor(s) disclaim responsibility for any injury to people or property resulting from any ideas, methods, instructions or products referred to in the content. |
© 2025 by the authors. Licensee MDPI, Basel, Switzerland. This article is an open access article distributed under the terms and conditions of the Creative Commons Attribution (CC BY) license (http://creativecommons.org/licenses/by/4.0/).
Copyright: This open access article is published under a Creative Commons CC BY 4.0 license, which permit the free download, distribution, and reuse, provided that the author and preprint are cited in any reuse.


