4.1. Web Presence Results
The web presence stages and the corresponding percentage of compliance of different government agencies with each stage. The compliance rates were divided into four stages: (1) emerging, (2) enhanced, (3) transactional, and (4) connected.
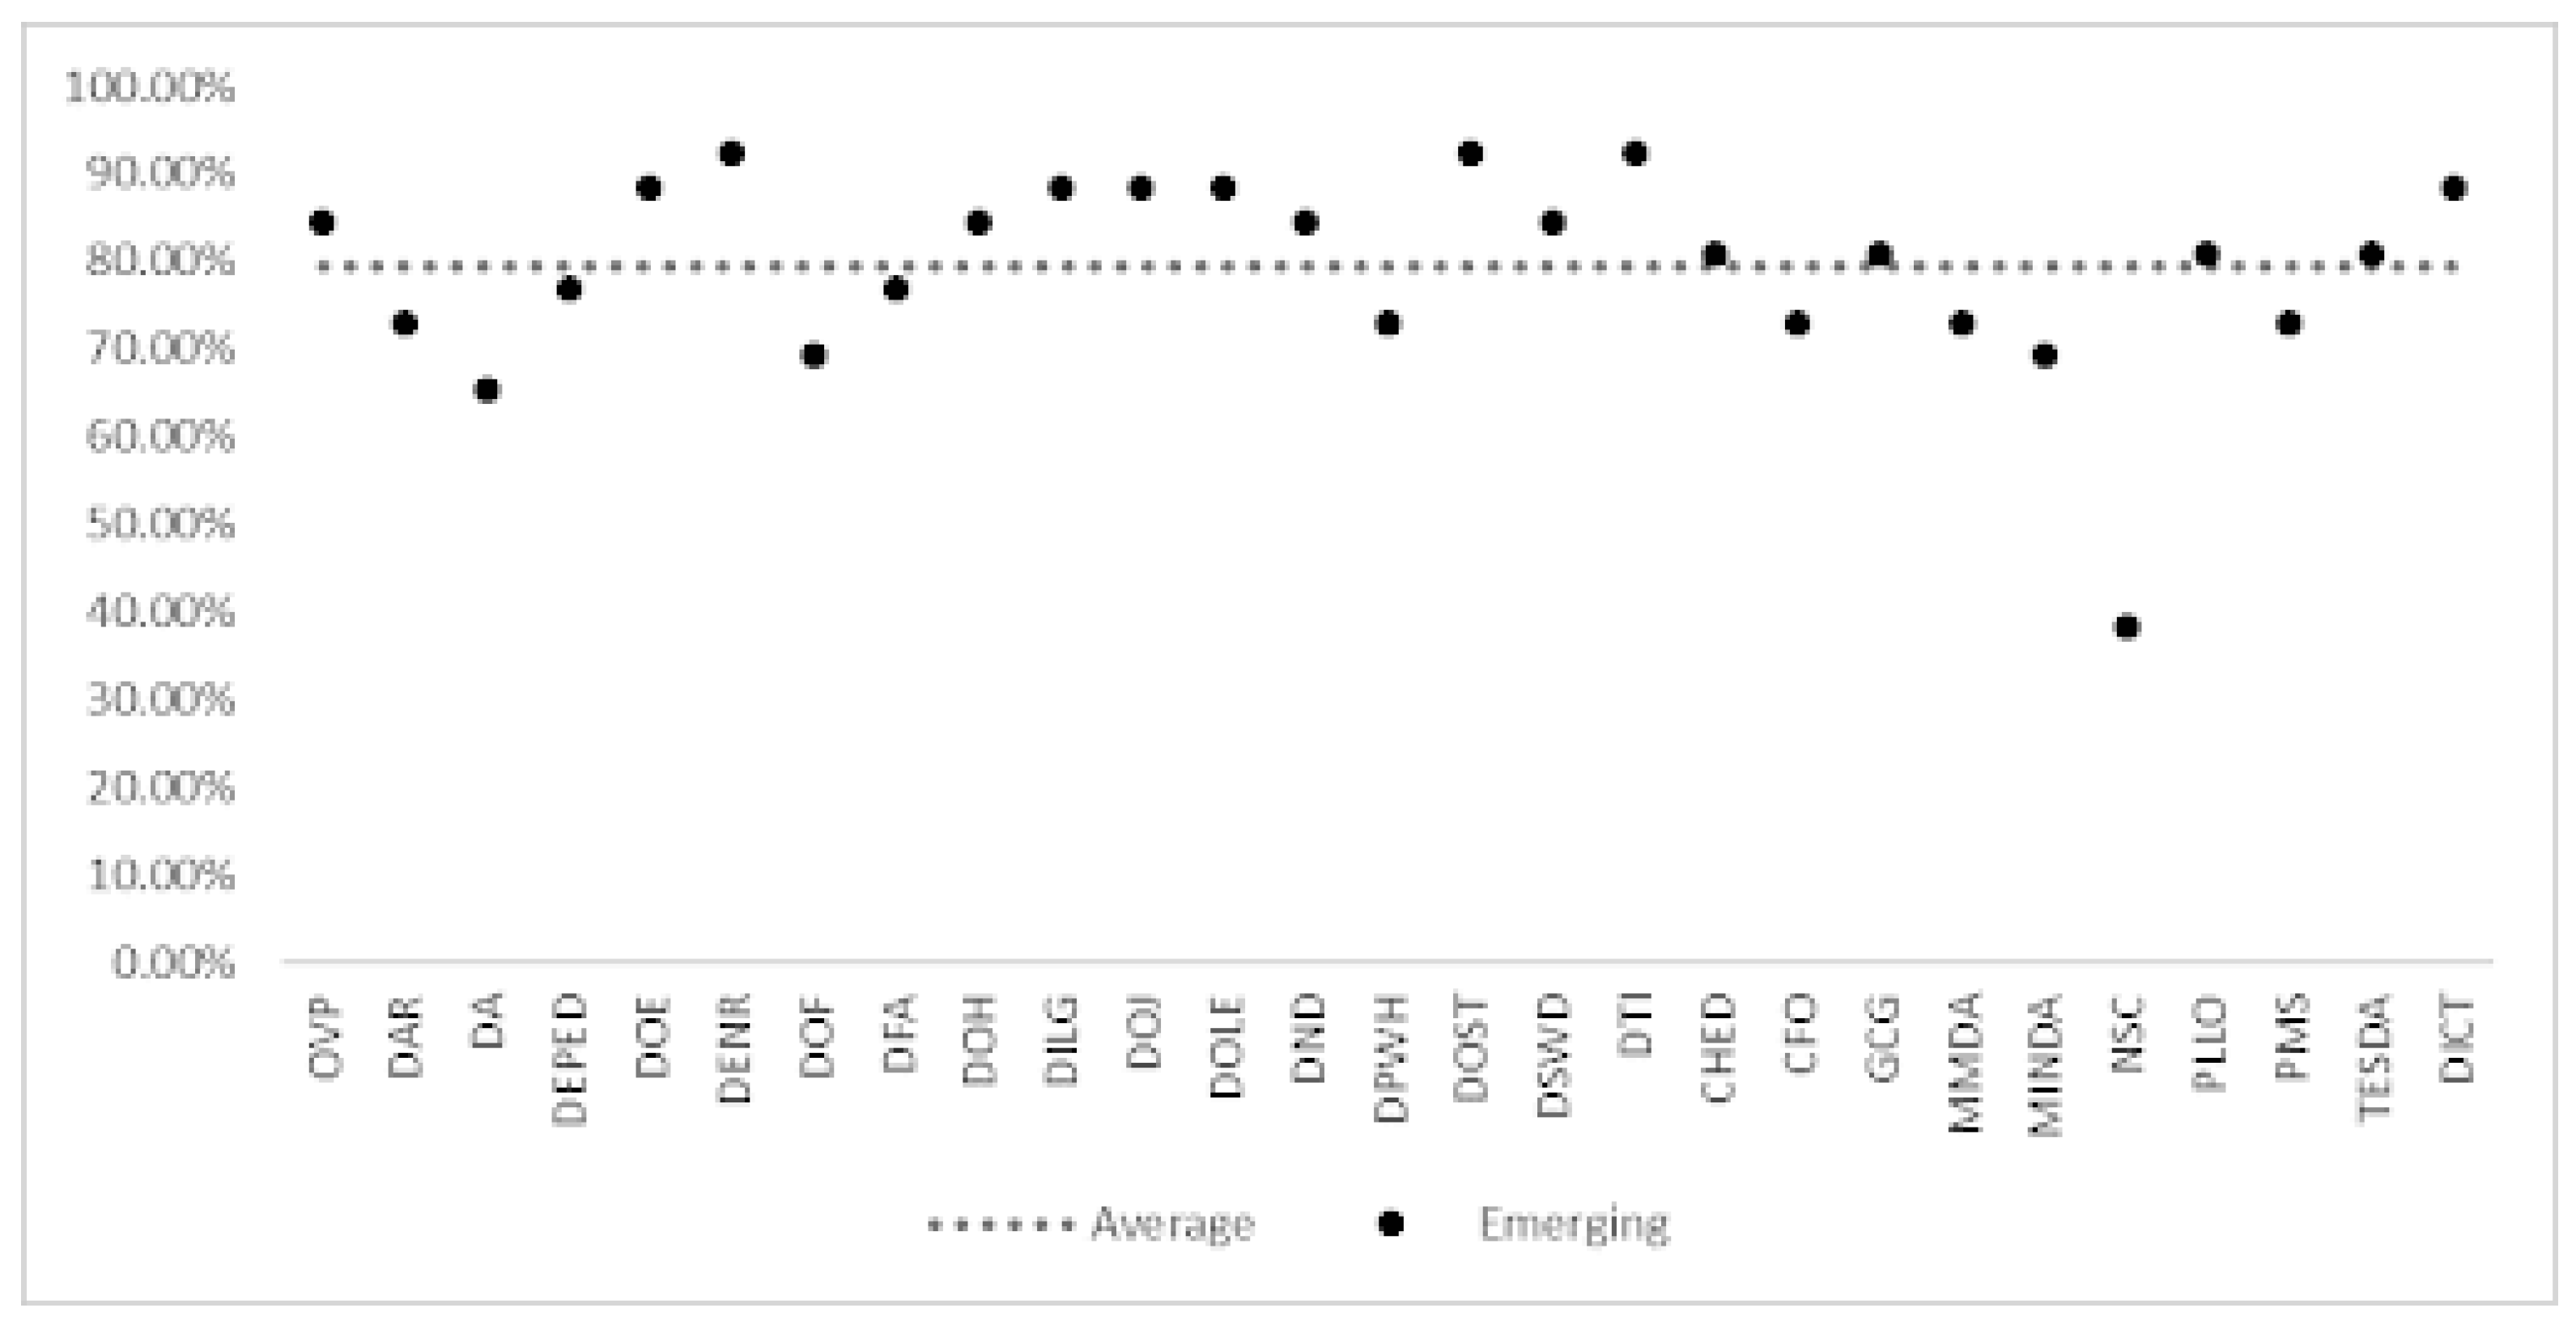
Figure 3 shows the emerging web presence stage, the websites achieved an average compliance rate of 79.34% on the 26 checkpoints. Furthermore, 16 out of 27 websites successfully met the required percentage of 80%. The agencies that demonstrated the highest compliance rates are DENR, DOST, and DTI, each achieving a compliance rate of 92.31% or 24 checkpoints. Conversely, NSC exhibited the lowest compliance rate with only 38.46% or 10 checkpoints.
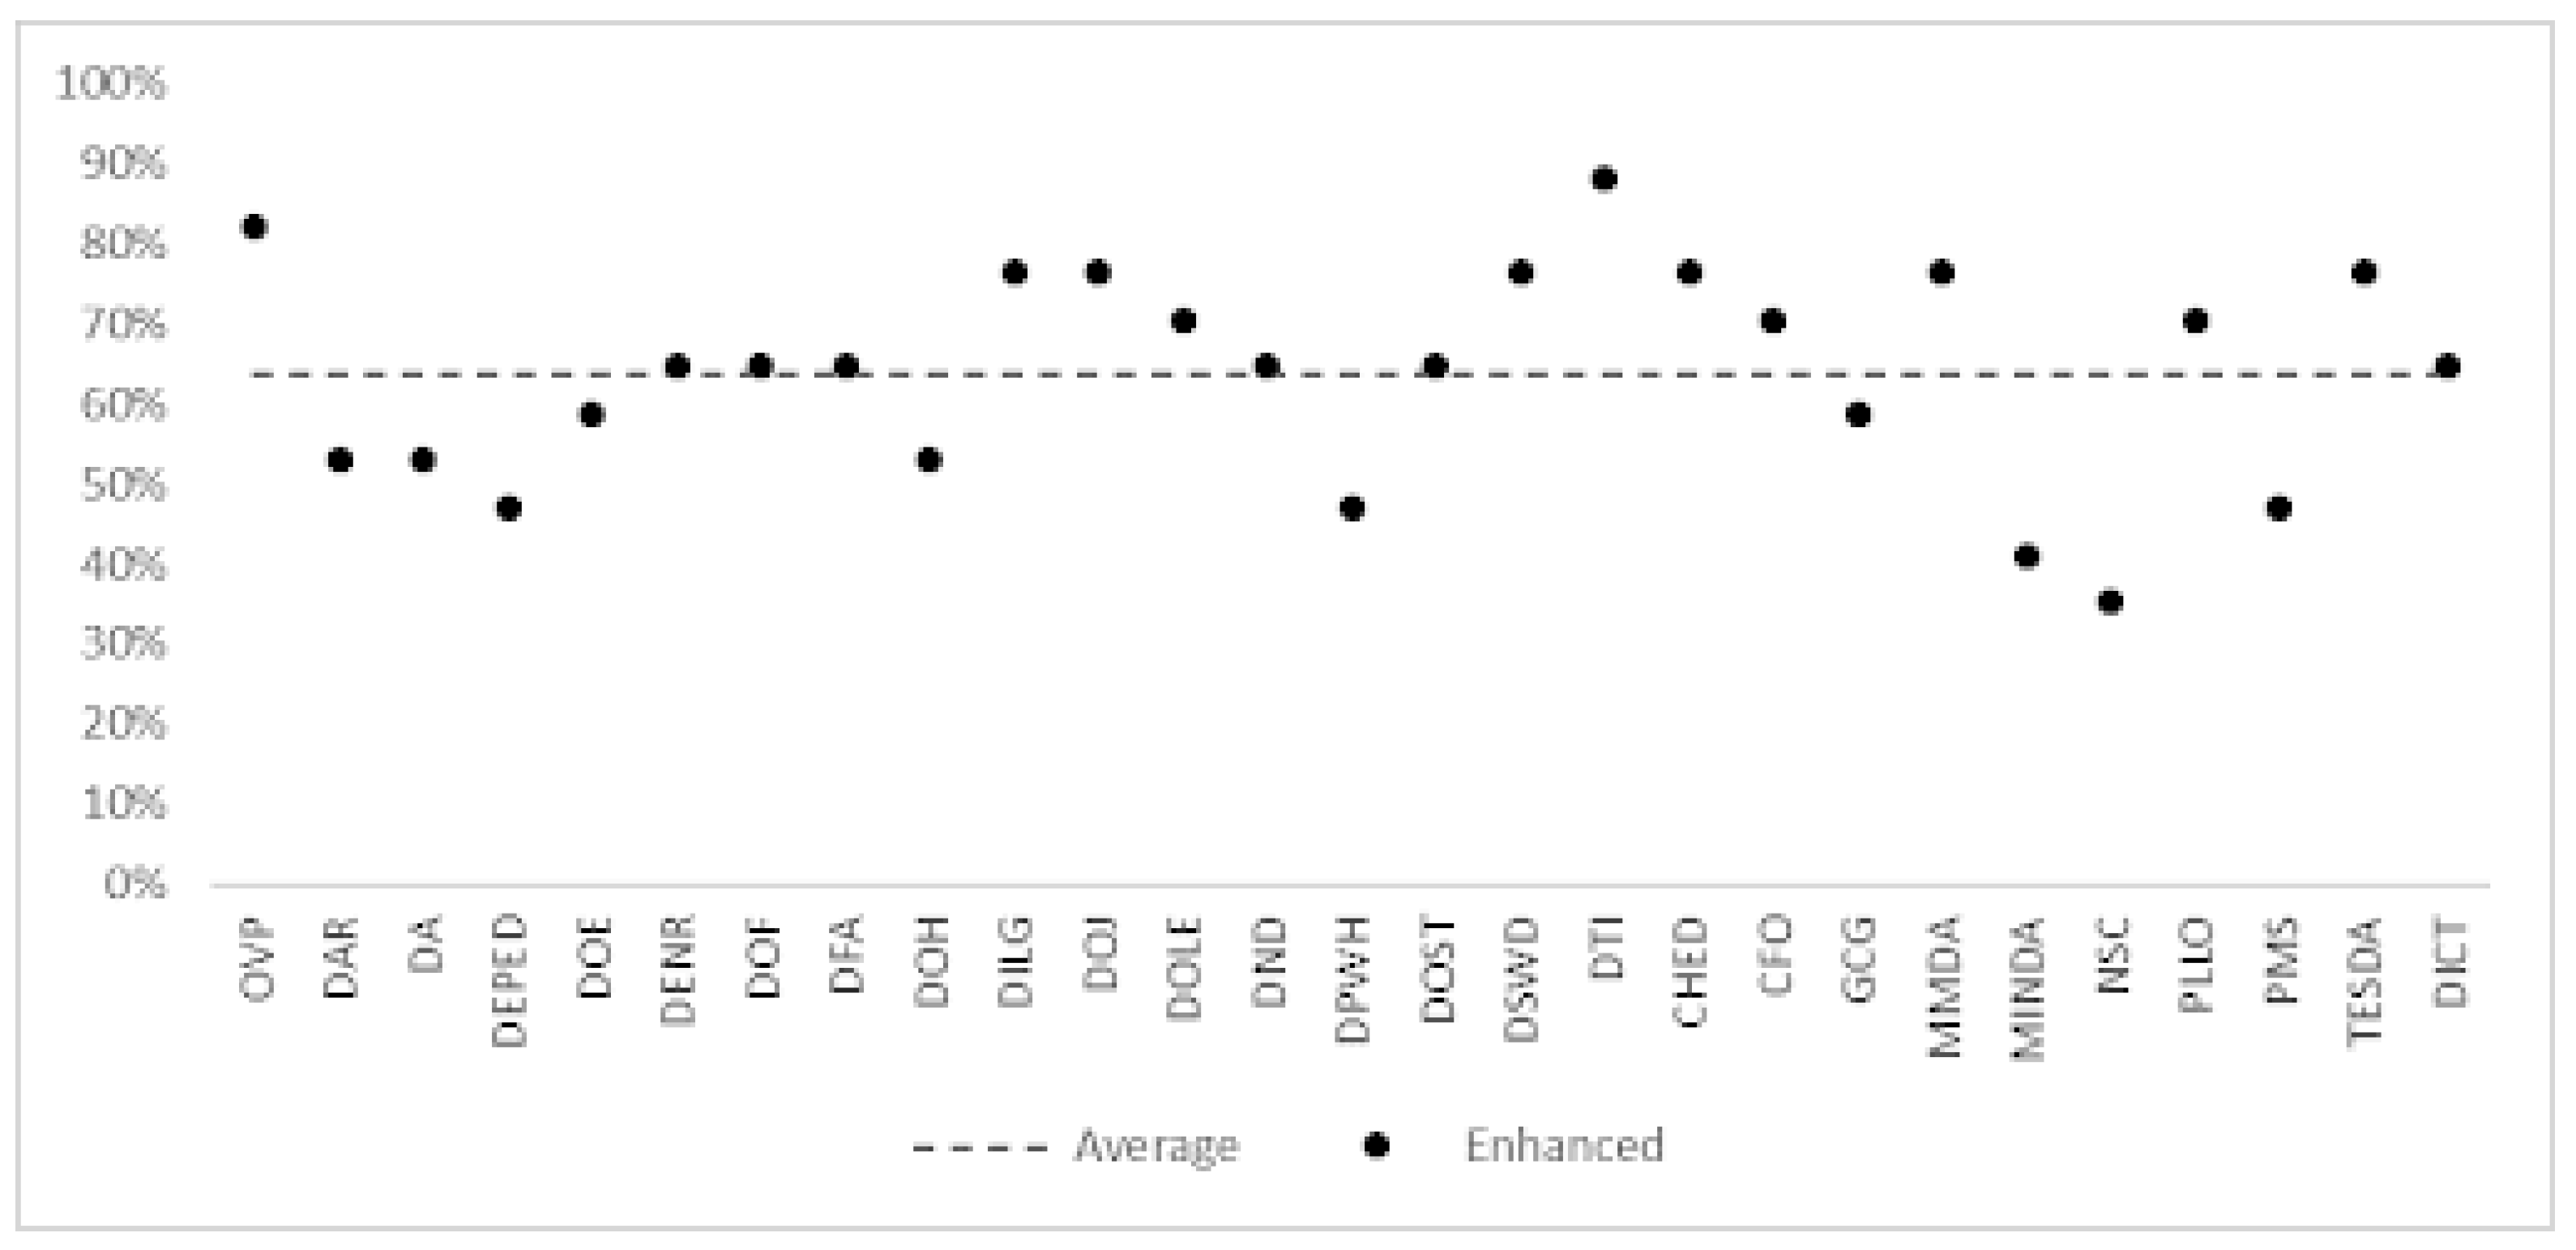
Figure 4 shows the stage 2, enhanced web presence, the compliance percentage significantly drops in all websites, averaging at 79.34%. Only two websites, DTI with 88.24% and OVP with 82.35%, were able to surpass the required percentage. This indicates that 93% (25) of the websites failed to meet the minimum requirement of 80% compliance for web presence.
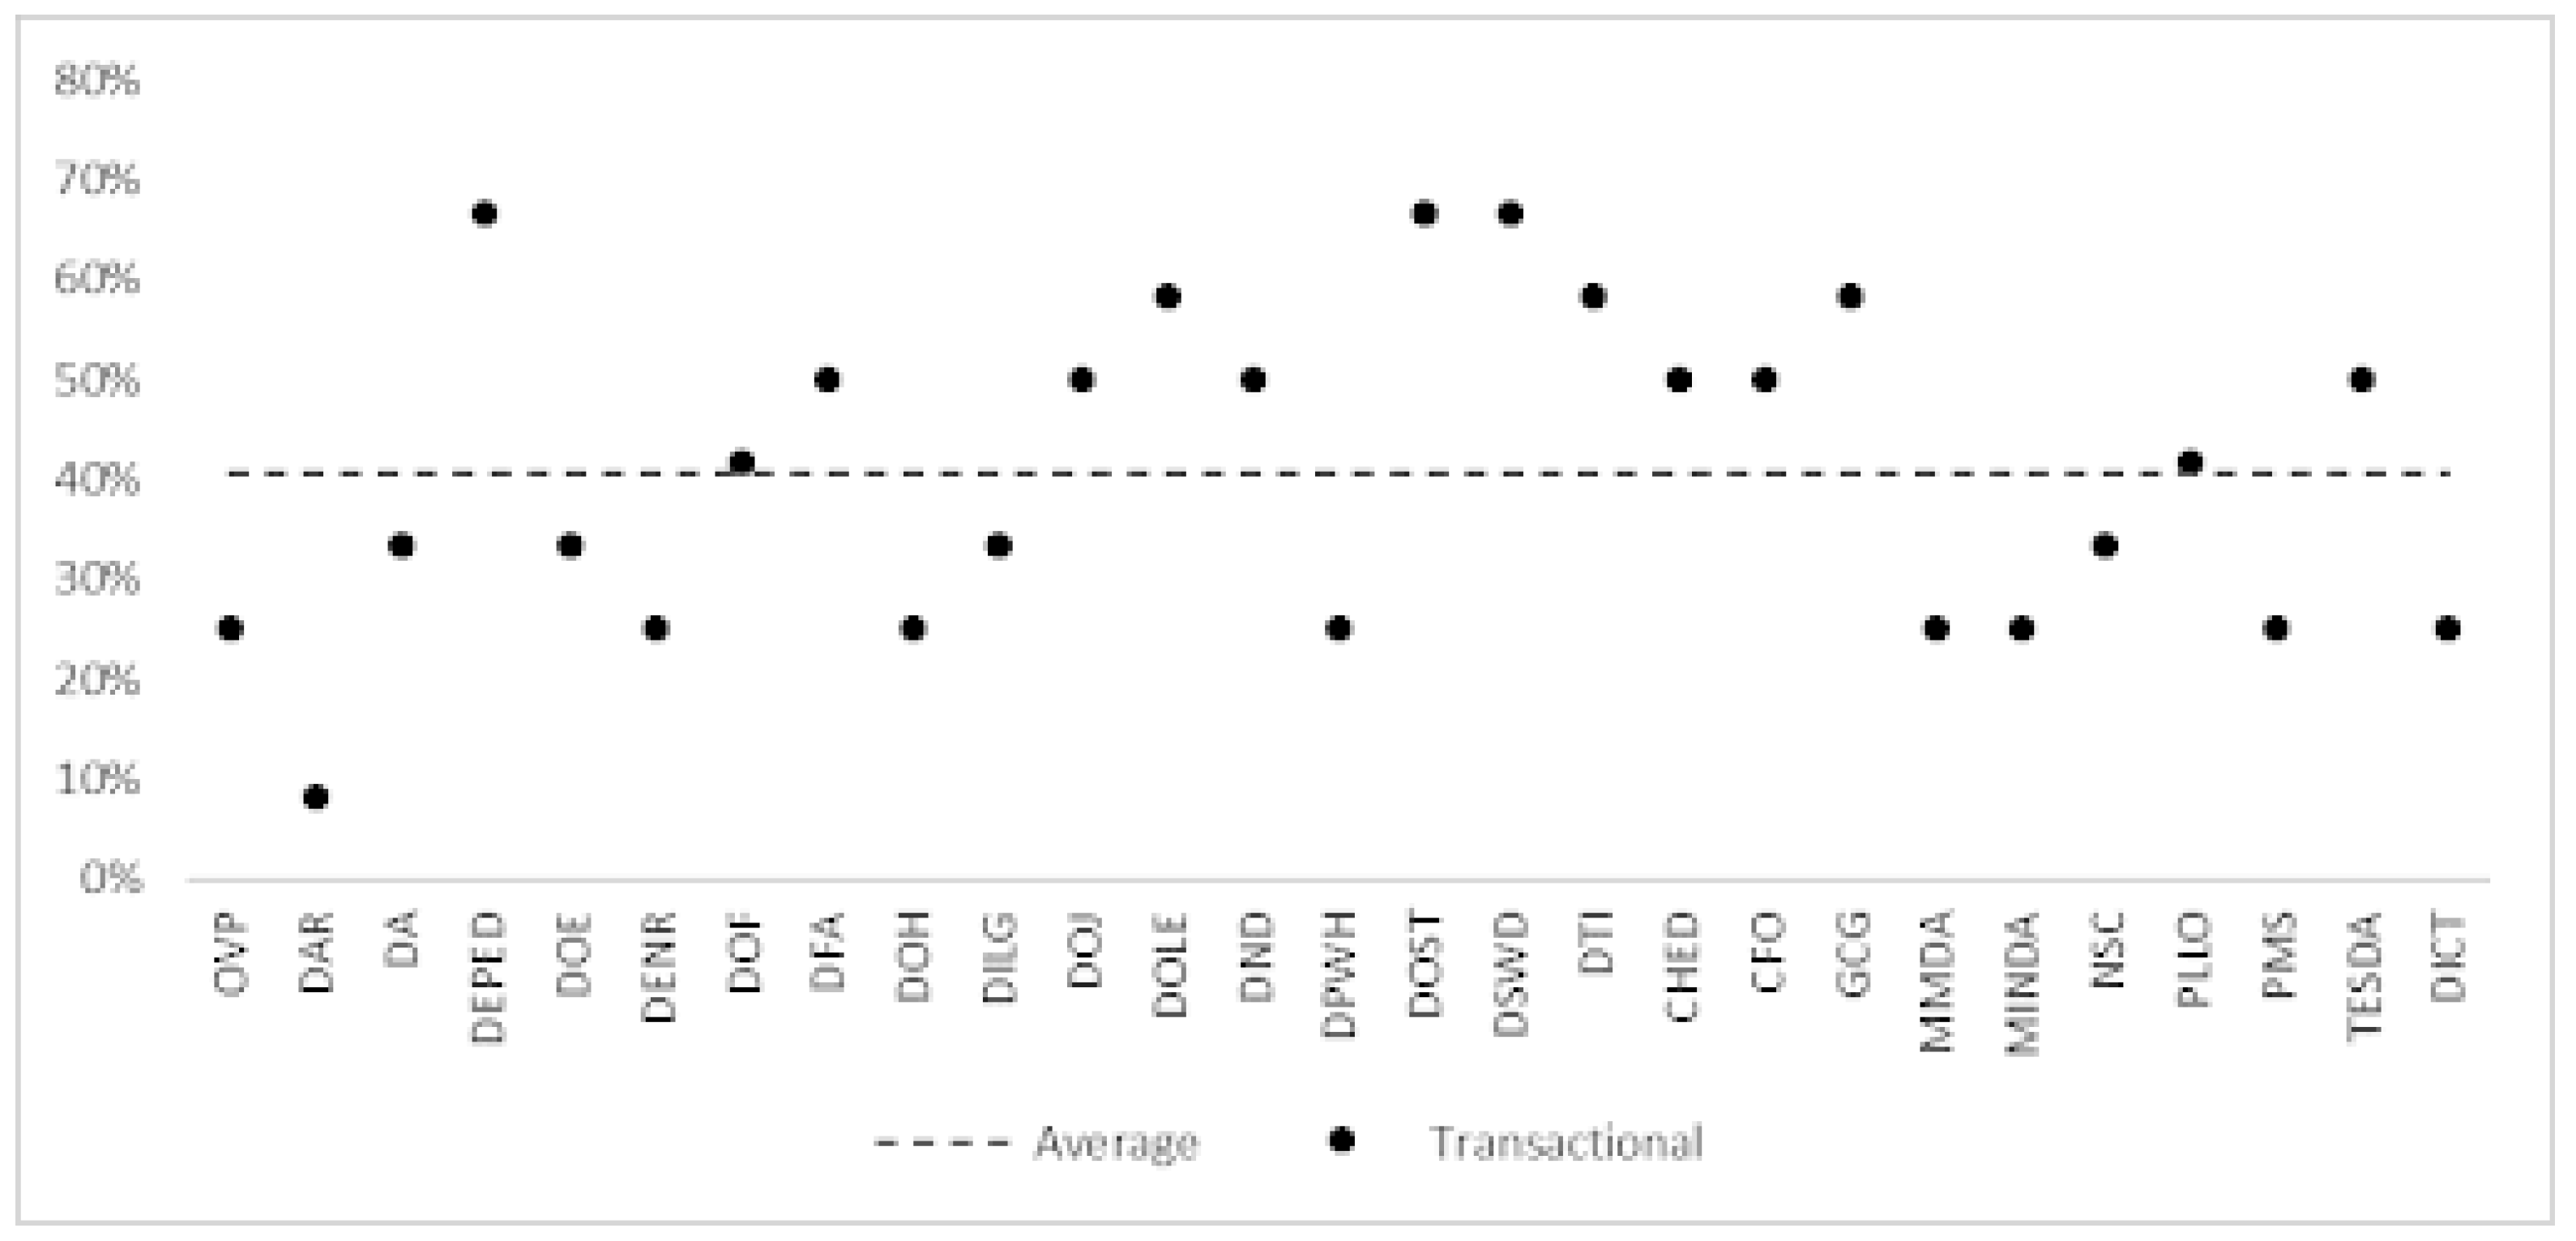
Figure 5 shows the stage 3, transactional, none of the websites were able to meet the required percentage of 80%. The average compliance rate across all websites is only 40.74%. The highest percentage compliance rate achieved is 66.67% by DEPED, DOST, and DSWD.
Finally,
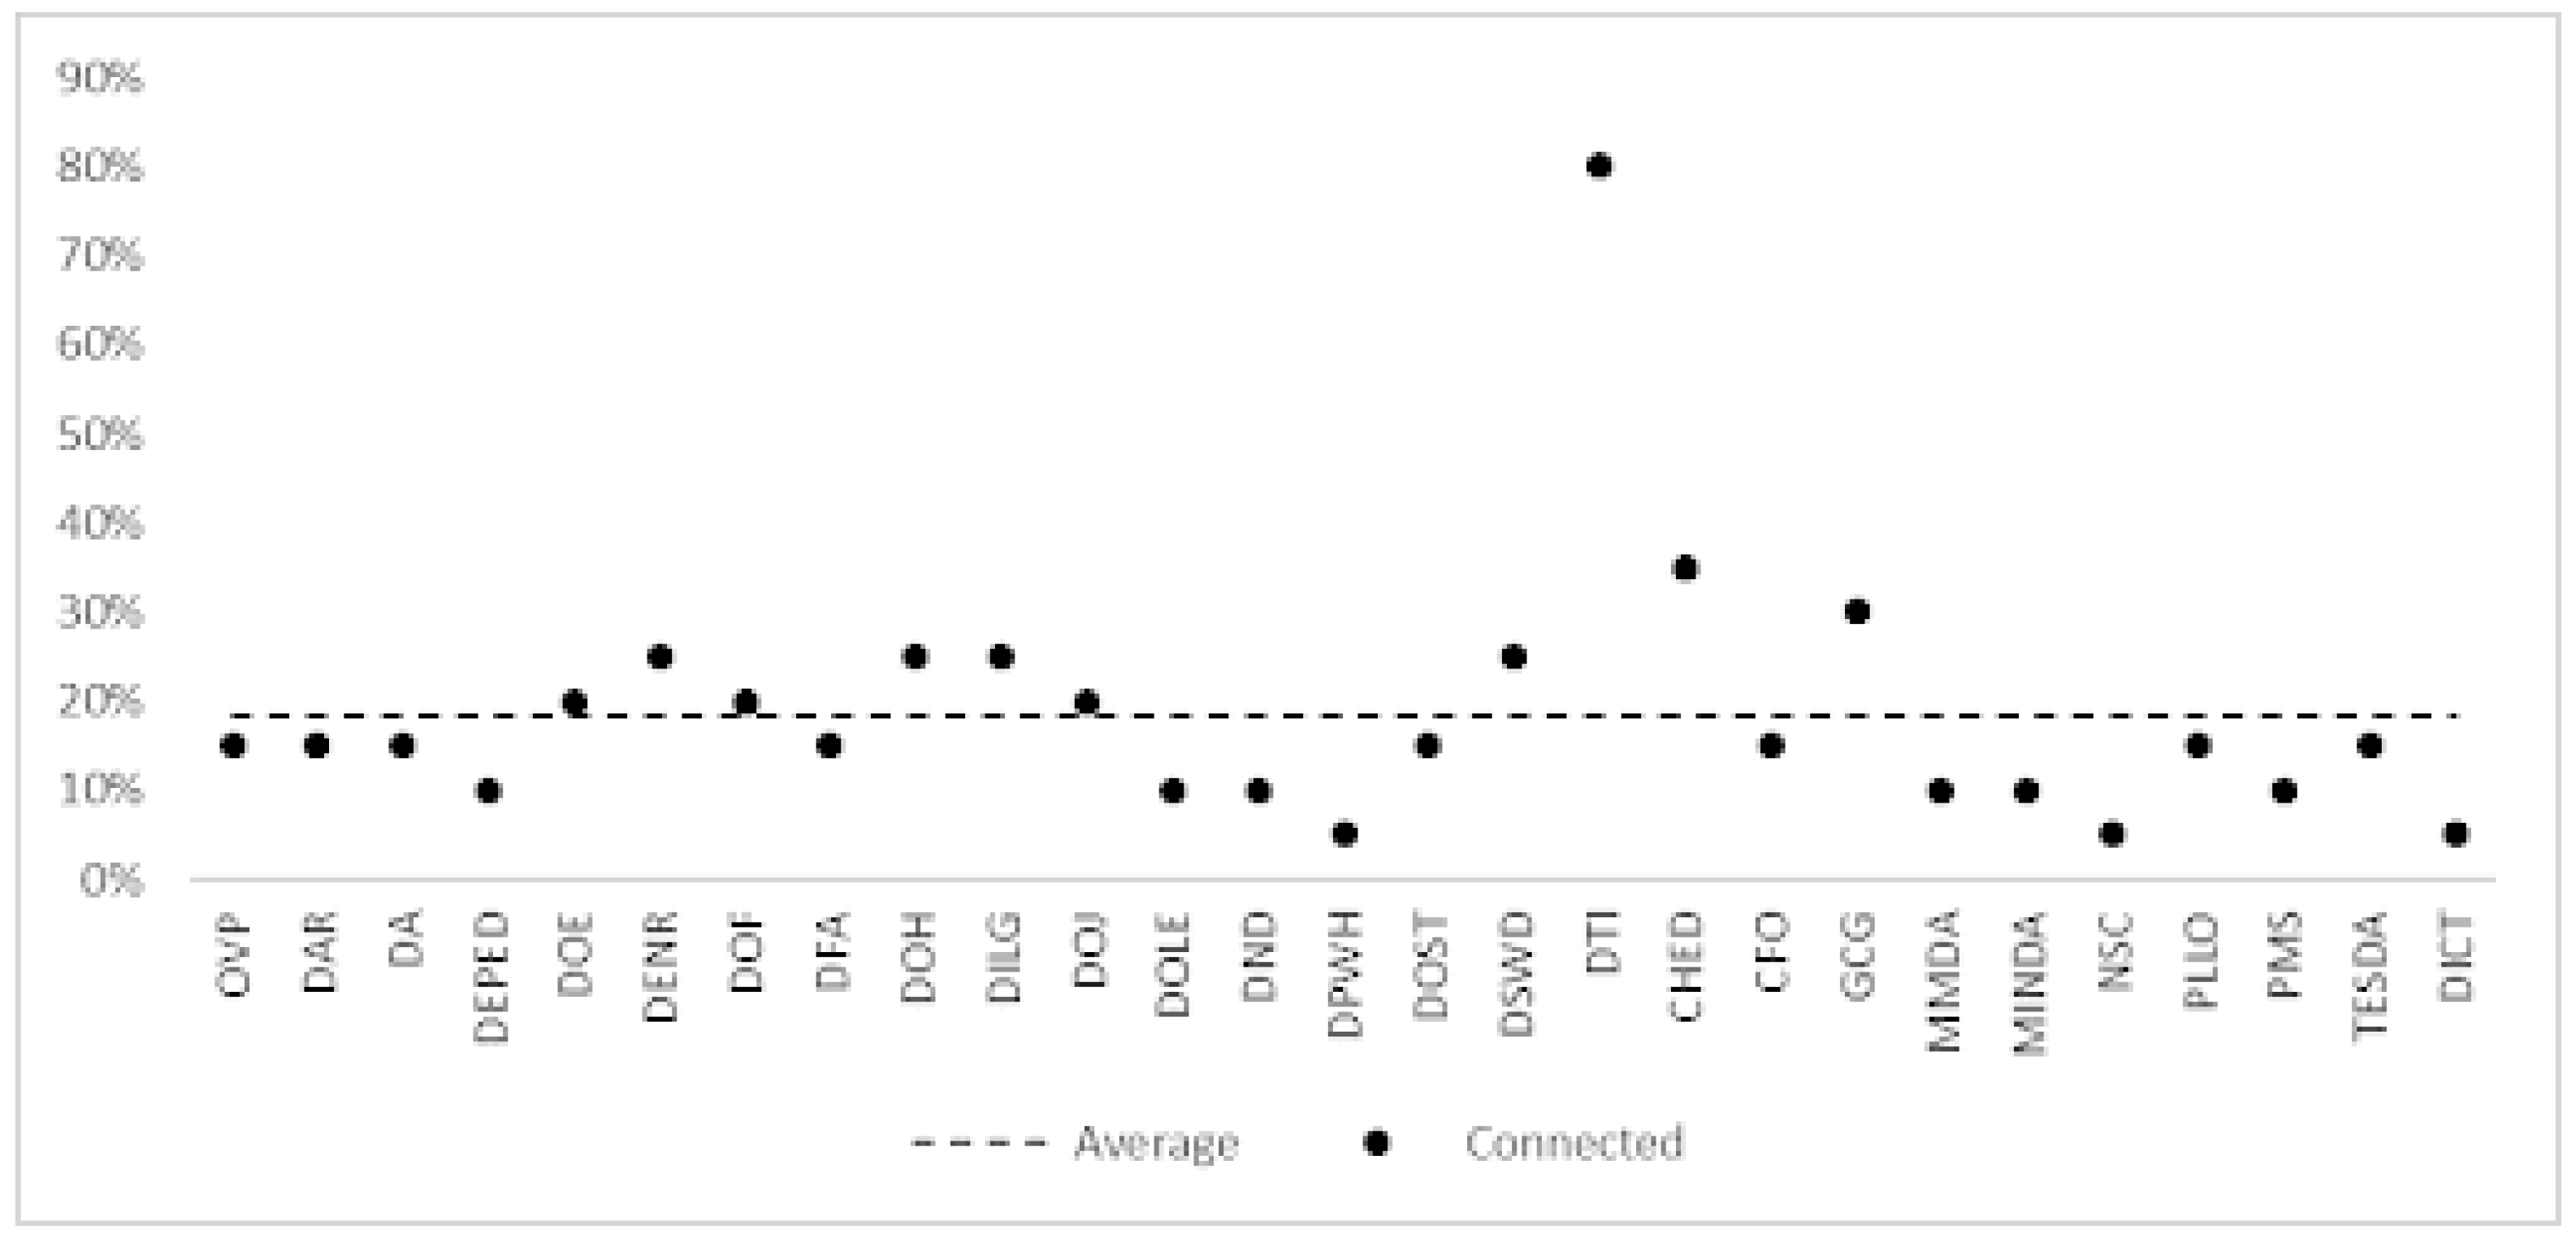
Figure 6, connected, the overall compliance percentages for all agencies are relatively low, with an average of 18.52%. However, DTI stands out with a compliance rate of 80%, being the only website that passed the required percentage. On the other hand, the remaining websites fall below 40% compliance. This highlights the high level of web interactivity and data exchange required in stage 4.
Table 5 shows the number of web presence compliant and non-compliant checkpoints for each government agency. Only the DTI website passed with a percentage of 82.67%, while the NSC has the lowest compliance percentage at 28%. Overall, the average compliance percentage for all government agencies in all four stages is 53.43%, indicating that there is still much room for improvement in their web presence. Government agencies should focus on enhancing their websites to improve compliance with web presence stages.
Table 6 shows checkpoints with compliance rate below 50% that need to be improved by government agency websites in different stages of web presence, from Stage 1 (Emerging) to Stage 4 (Connected). It highlights that as the stage gets higher, the compliance rate of the checkpoints decreases, indicating that there is a need for more improvement in the advanced stages. For instance, some of the checkpoints in Stage 4 have 0% compliance rate, such as e-signature and Opinion Polls.
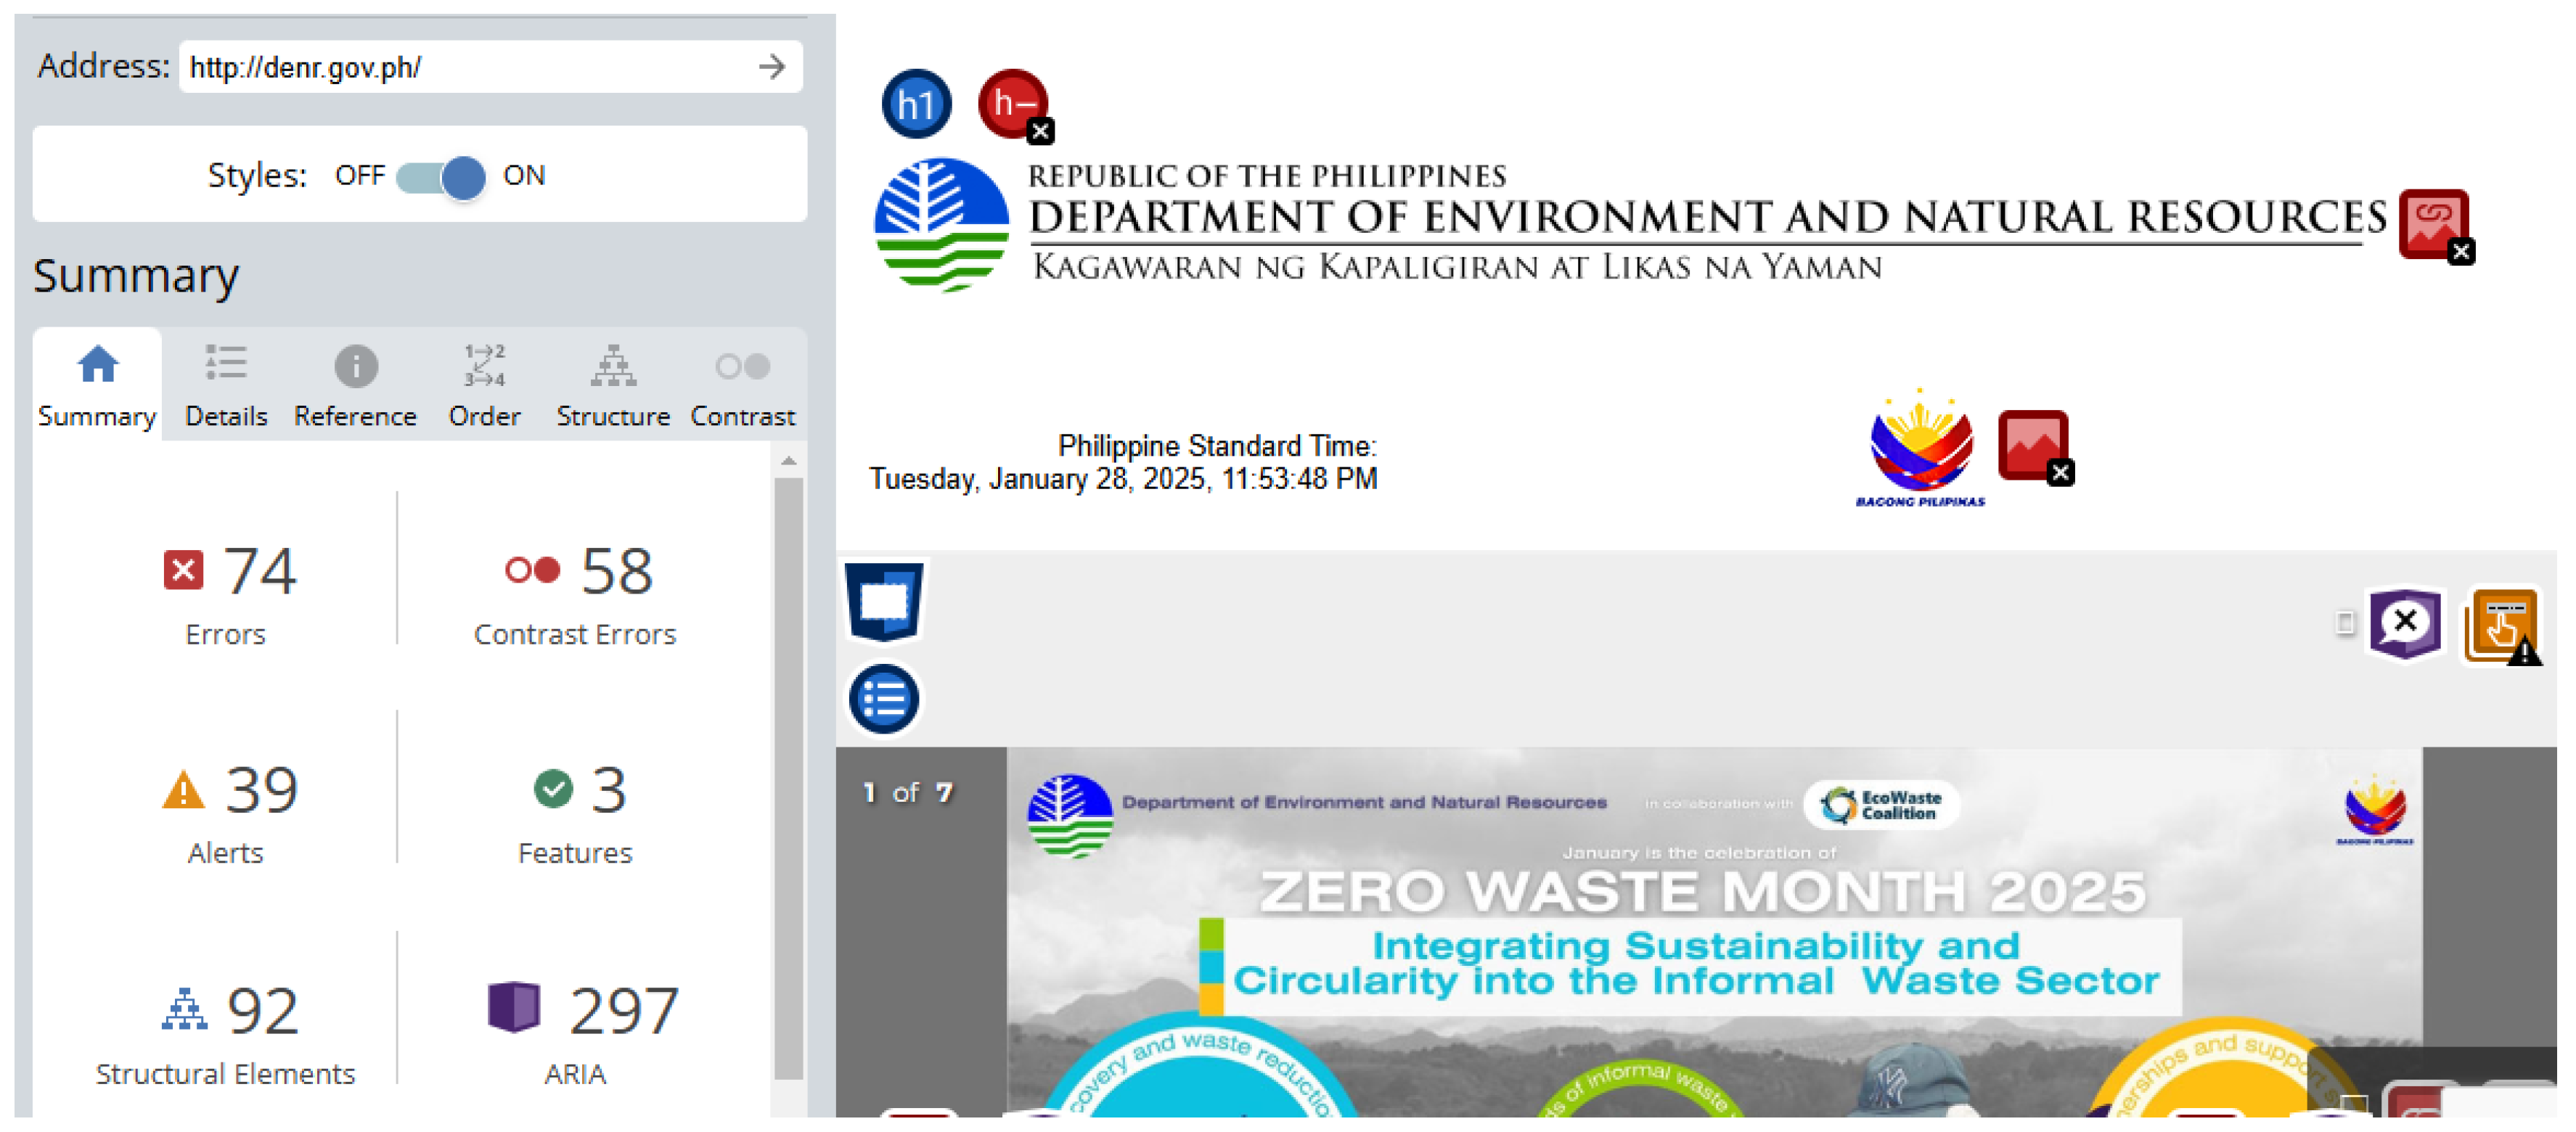
In addition, each checkpoint holds significant importance in ensuring compliance with standards and optimizing the user experience. Starting with Stage 1, accurately displaying the local time, especially in the context of the Philippines Standard Time, is vital for users to synchronize with events and deadlines efficiently. The Emerging Site Map and Citizen’s Charter are foundational elements that provide clarity and transparency in navigating the website and understanding governmental processes and services. Archives serve as a repository of historical data and documents, offering valuable insights and reference points for users seeking information or tracking past events. Moving to Stage 2, supporting Multiple Languages expands accessibility and inclusivity, accommodating users from diverse linguistic backgrounds. Enhanced User Login and Password features bolster security while ensuring a seamless and user-friendly authentication process. Leveraging Wireless Technology for Mobile Messages facilitates instant communication and updates, enhancing user engagement and responsiveness. In Stage 3, Captcha integration strengthens security measures, protecting against automated bots and unauthorized access. Transactional Email Alerts provide timely notifications, keeping users informed and involved in relevant activities. Confirmation of Request and e-Signature functionalities add layers of verification and authorization, enhancing the integrity and security of transactions. Finally, in Stage 4, Discussion Forums foster community engagement and collaboration, while Connected Opinion Polls gather valuable feedback and insights, shaping decision-making processes and fostering a sense of involvement among users. Each checkpoint, when meticulously addressed and optimized, contributes to a compliant, user-friendly, and impactful web presence. Overall, it suggests that agencies should focus on improving the checkpoints with low compliance rate to enhance their web presence and provide better services to their constituents.
4.2. Website Usability Results
The results of the evaluation of the government agency websites in terms of usability, specifically in the areas of accessibility, identity, navigation, and content.
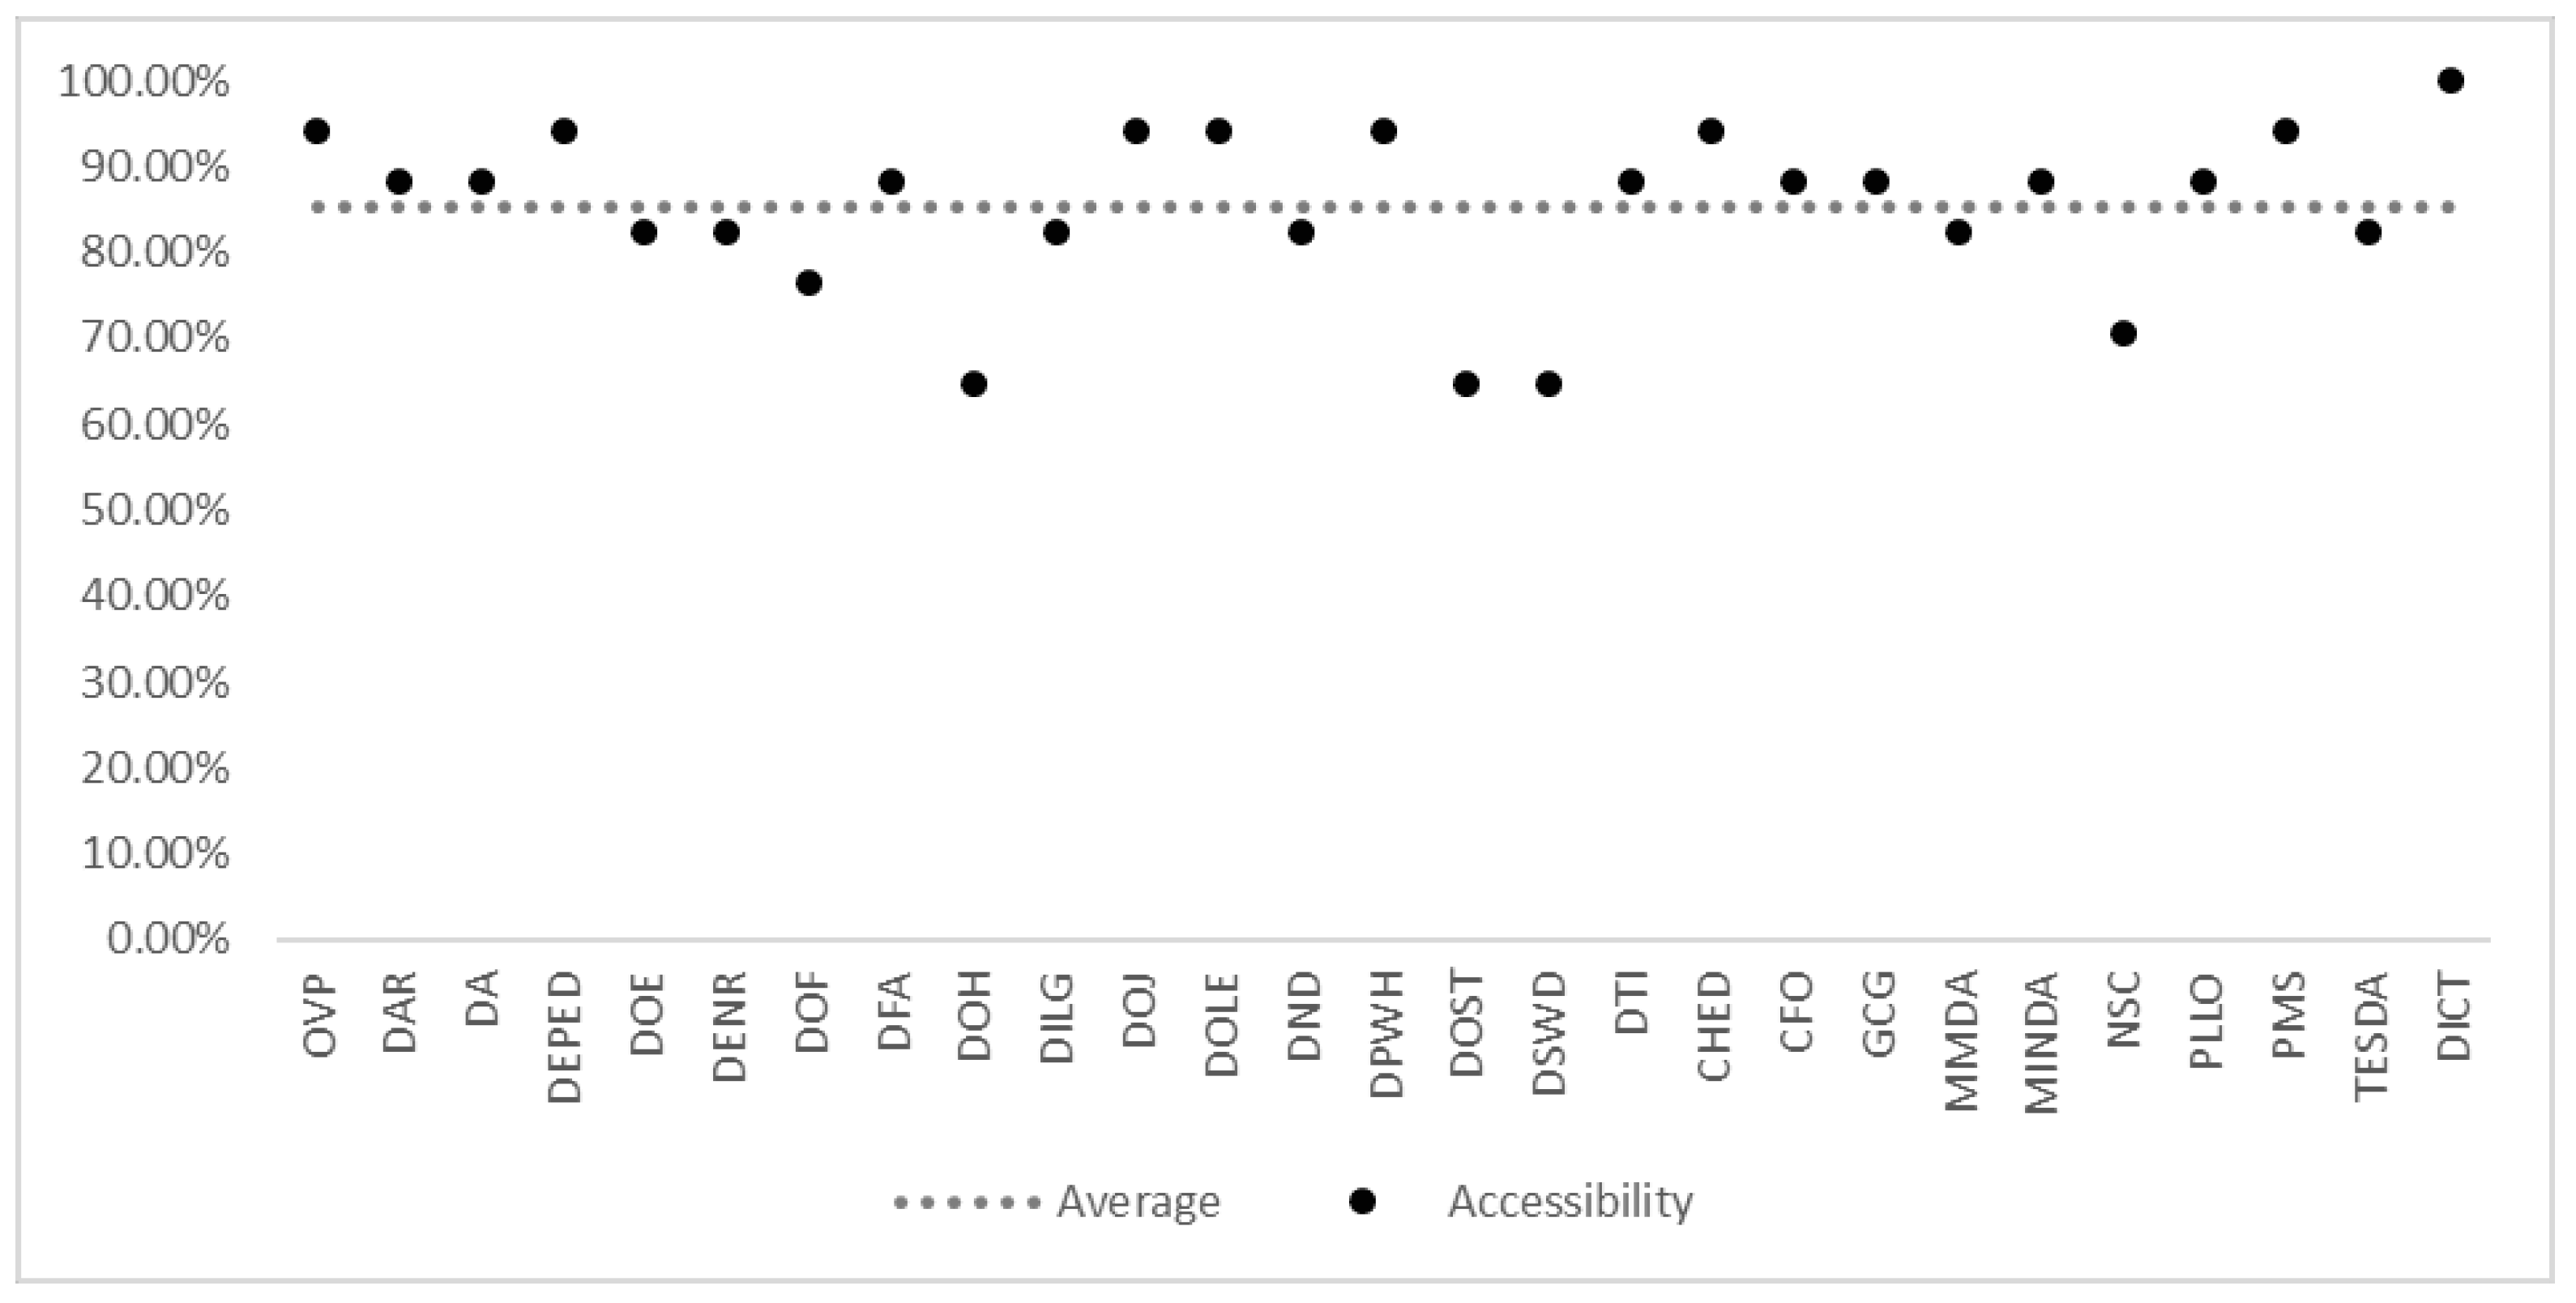
Figure 7 shows the Accessibility section which focuses on how easy it is for all users to access and use the website. The table shows that most government agency websites scored well in this section, with an average score of 85.19%. Specifically, 16 out of 27 agencies scored above 85%, with the highest score being 100% for DICT. The agency with the lowest score of 64.71% is DOH, DOST and DSWD.
In the Identity section,
Figure 8 shows that government agency websites have an average score of 78.60%. This section refers to how well a website’s design reflects the agency’s identity and branding. Only 8 out of 27 agencies scored above 85%, with the highest score being 94.44% for DTI and CFO. On the other hand, five agencies, DEPED, DFA, DND, NSC and PMS, scored below 70%, which indicates a need for improvement in their website design to better reflect their identity and branding.
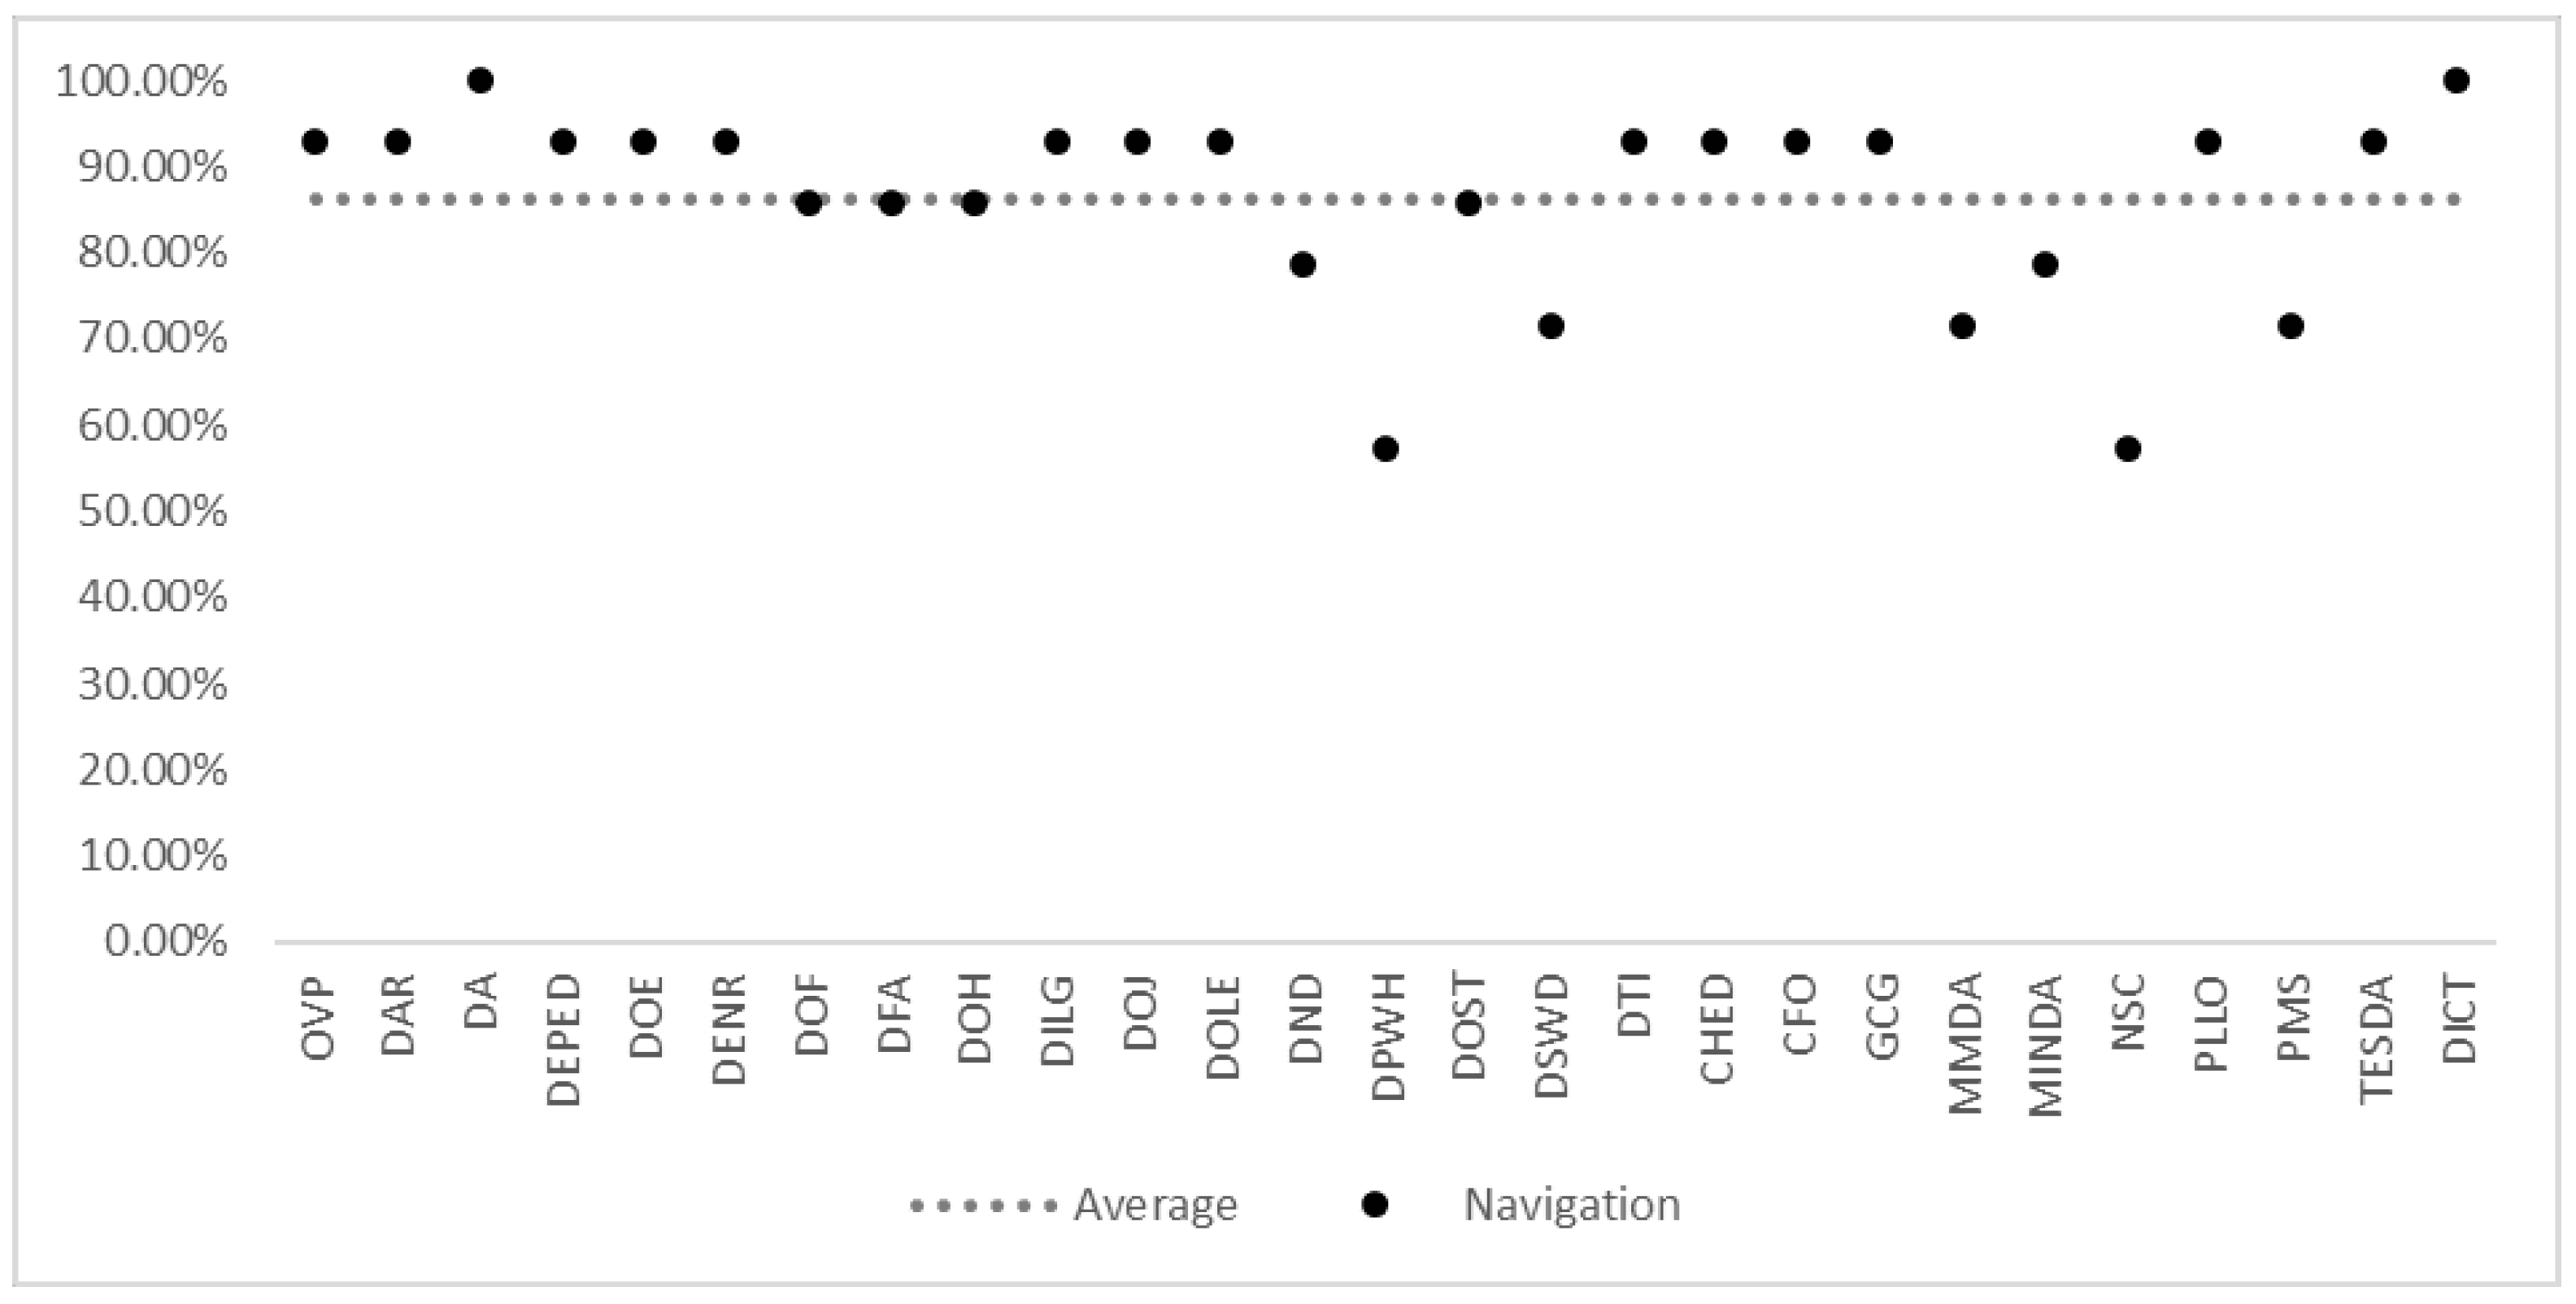
Figure 11 shows the Navigation section which measures how easily users can navigate the government agency websites. It indicates that most government agency websites scored well in this section, with an average score of 86.24%. Specifically, 20 out of 27 agencies scored above 85%, with the highest score being 100% for DA and DICT. On the other hand, the agencies with the lowest scores are DND, DPWH, DSWD, MMDA, MINDA, NSC and PMS, scoring below 80%. It is worth noting that navigation is crucial in ensuring a user-friendly website, as it affects user experience and engagement.
Finally,
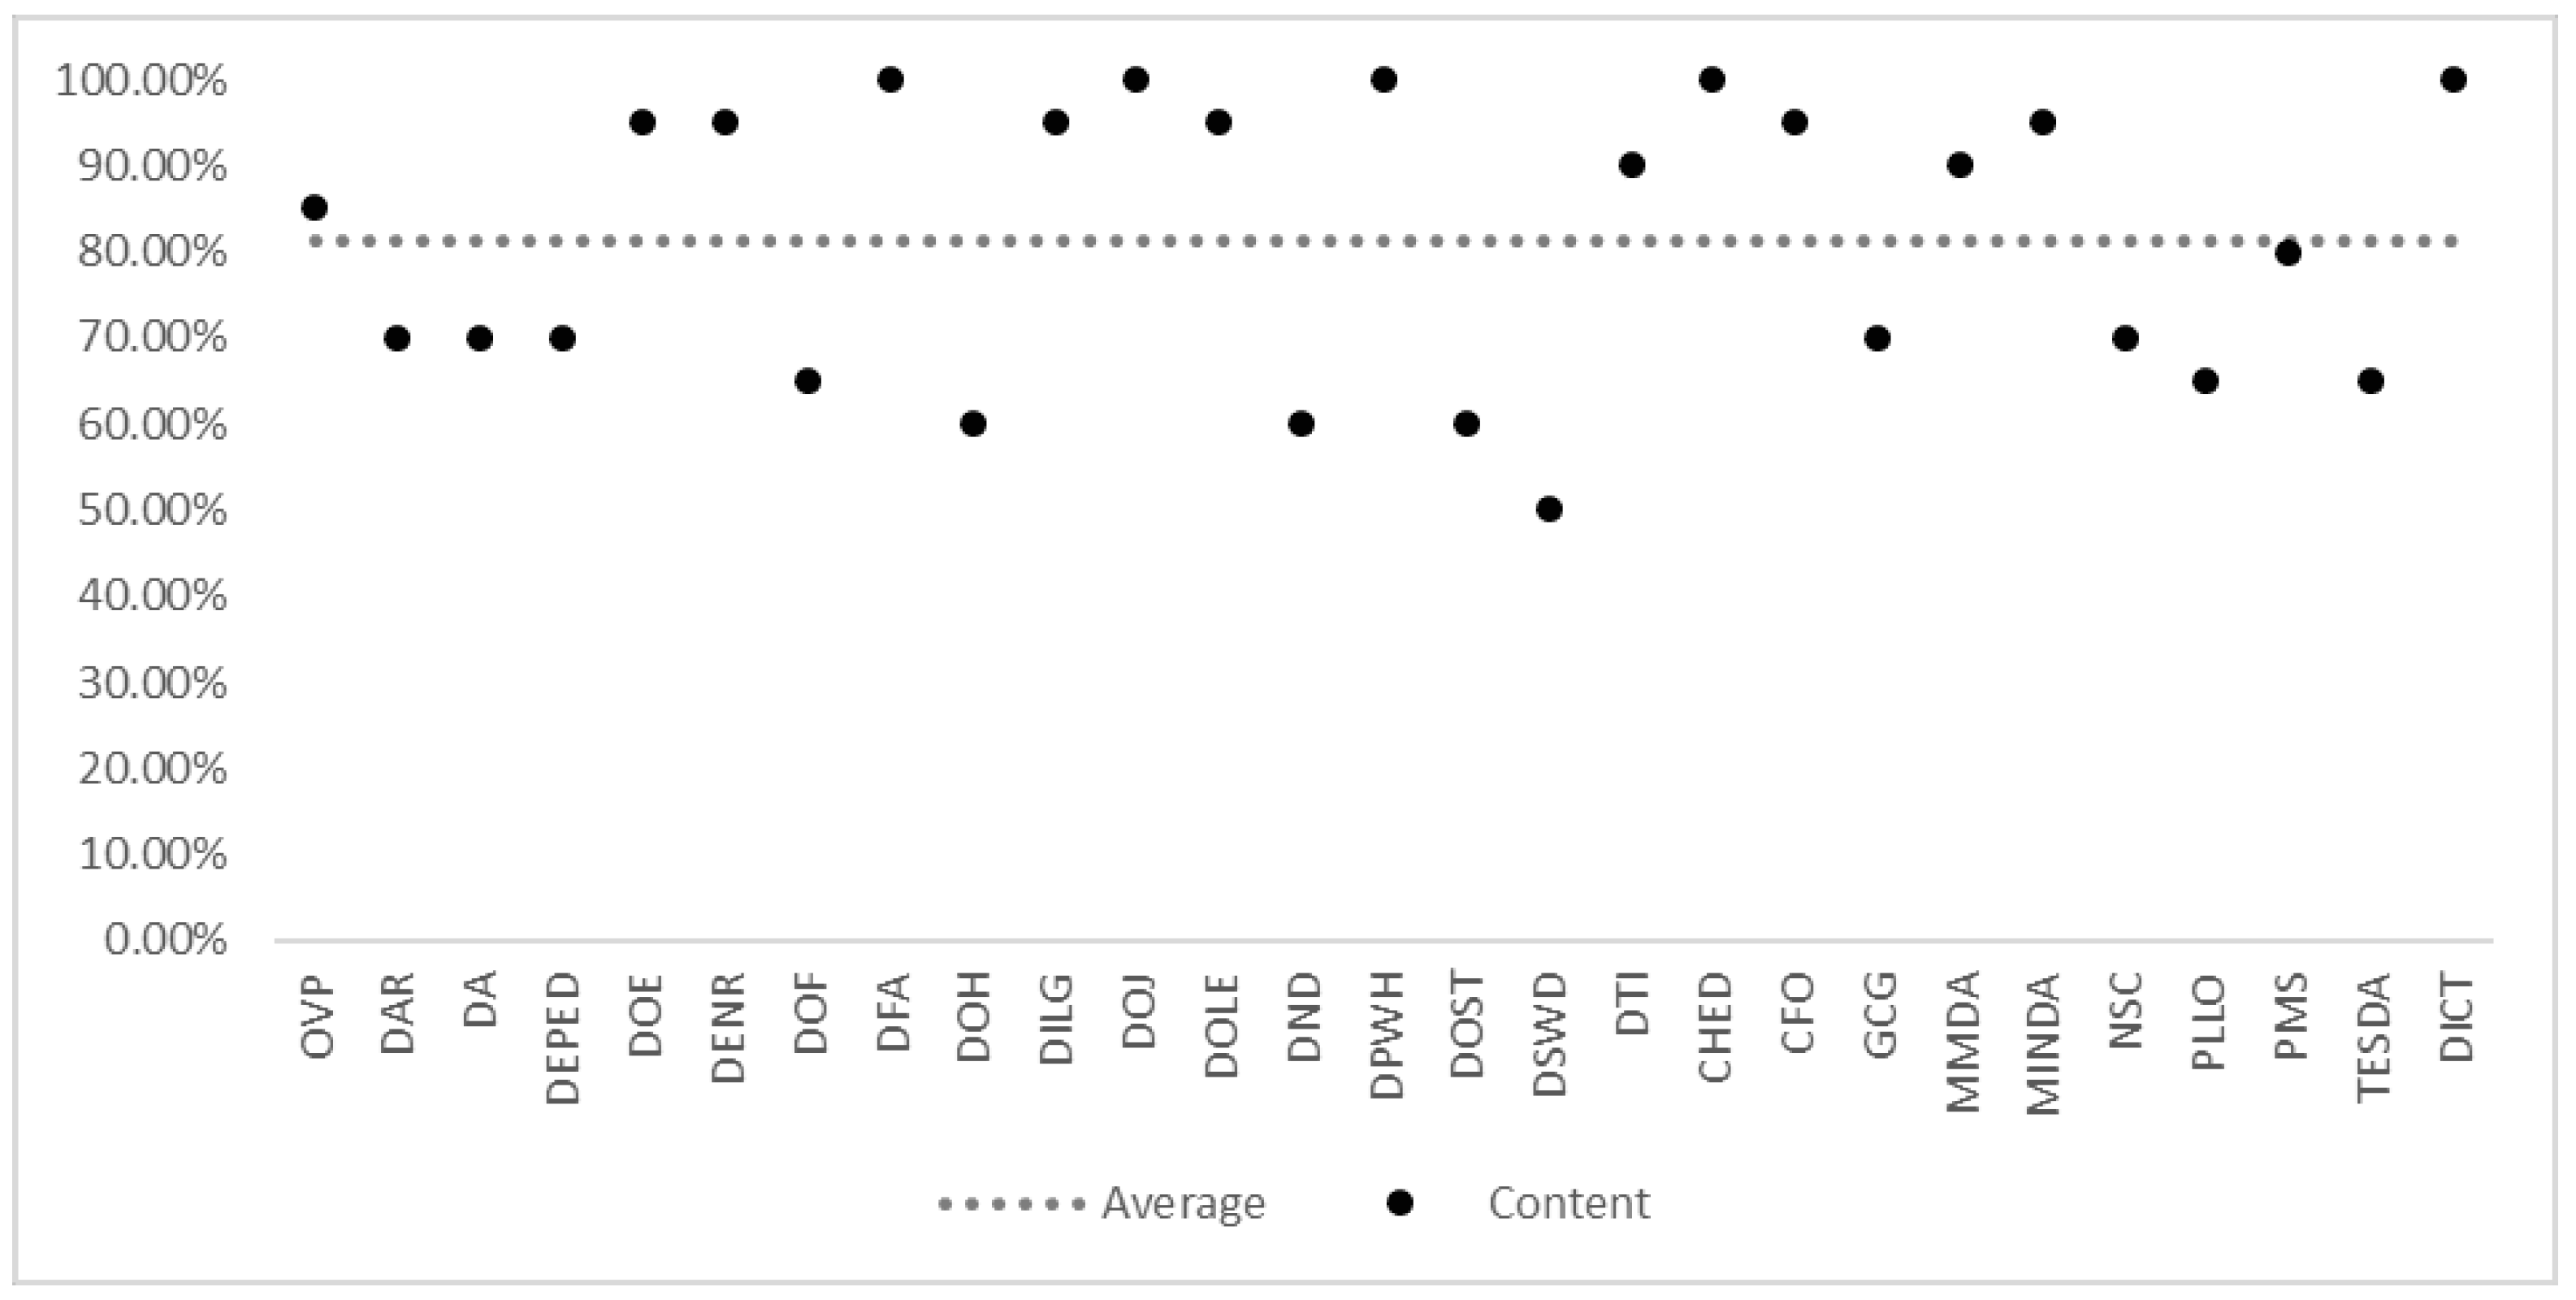
Figure 10 shows the Content section which refers to the information displayed on the government agency websites. From the figure, it can be seen that DFA, DOJ, DPWH, CHED and DICT are fully compliant with the content checkpoints with a score of 100%. OVP, DOE, DENR, DILG, DOLE, DTI, CFO, MMDA and MINDA are partially compliant with a score above 85%. On the other hand, DAR, DA, DEPED, DOH, DND, DOST, DSWD, GCG, NSC, PLLO, PMS and TESDA scored below 85%, indicating that they are non-compliant with the content checkpoints. The average score for this section is 81.11%, indicating that there is still a need for improvement in the content displayed on government agency websites.
Figure 10.
Result of the content section
Figure 10.
Result of the content section
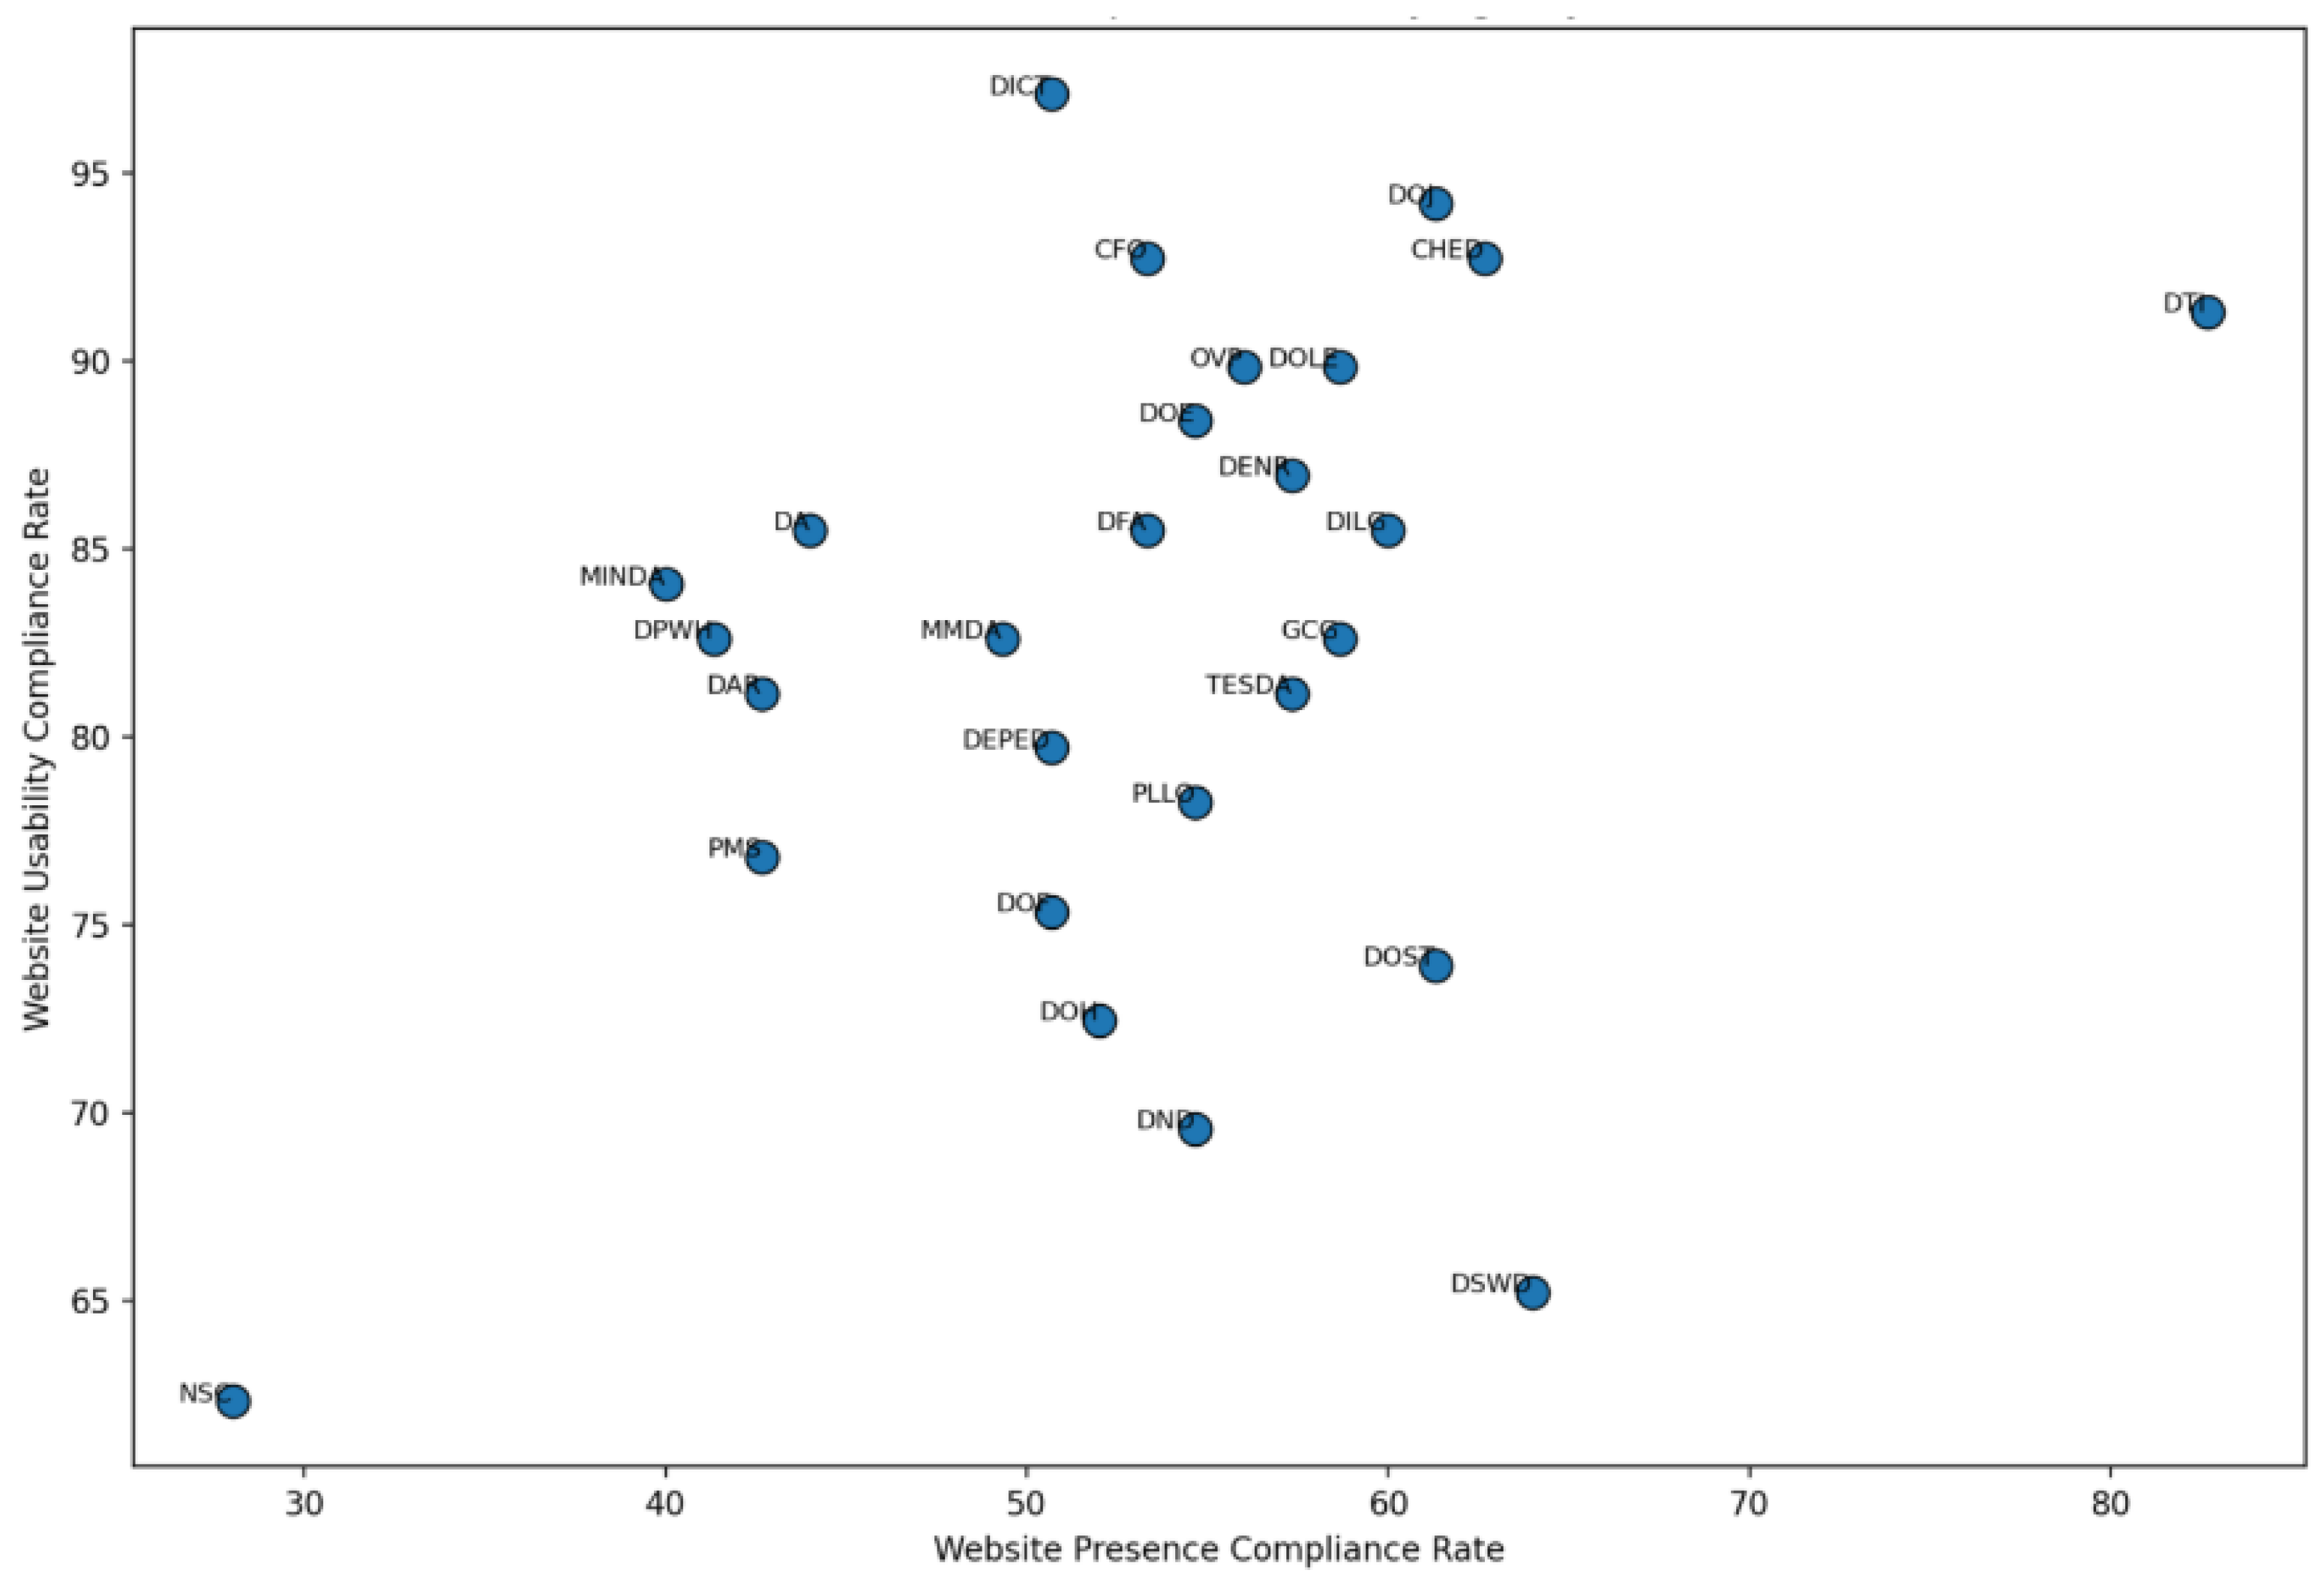
Figure 11.
Analysis across government agencies
Figure 11.
Analysis across government agencies
Table 7 shows the number of web usability complied and not complied checkpoints and the overall compliance percentage of each government agency. The average overall percentage of compliance for all agencies is 82.50%. Specifically, 12 out of 27 agencies are classified as partially compliant and scored above 85%, with the highest score being 97.10% for the DICT. However, 15 out of 27 agencies are considered noncompliant, with the lowest score being 62.32% for NSC. Overall, there is room for improvement for the government agency websites in terms of meeting the usability standards.
Table 8 shows various sections and their corresponding checkpoints with compliance rate below 65% and require improvement. One significant checkpoint is the compliance rate for images with appropriate ALT tags in the Accessibility section, with only 51.85% compliance. The Identity section has low compliance rates for having a Key Official Corner, fax number, and mobile number. The Navigation section has low compliance rates for providing a clear and well-structured site map or index and indicating the user’s current location within the site. The Content section has low compliance rates for providing meta descriptions and text labels for form inputs.
Moreover, each checkpoint for compliance plays a crucial role in ensuring that the website is accessible to all users, regardless of their abilities or limitations. Accessible images with appropriate ALT tags are essential as they provide alternative text descriptions for users who rely on screen readers or those who have images disabled in their browsers, enabling them to understand the content of the images. Flash and add-on usage must be minimized to ensure compatibility with assistive technologies and to prevent potential barriers for users with disabilities. Identity key official corner, including fax and mobile numbers, ensures that important contact information is readily available and accessible to all visitors, fostering inclusivity. A comprehensible site map or index aids navigation for users with cognitive disabilities or those who may have difficulty navigating complex website structures. A clear indication of the current location within the website helps users orient themselves and efficiently navigate through the content. Additionally, meta descriptions provide succinct summaries of page content, aiding users in understanding the relevance of the page before navigating to it. Text labels for form inputs are essential for users who rely on assistive technologies to interact with web forms effectively. Proper labeling of embedded multimedia content ensures that users can access and understand audio or video elements on the website. Descriptive alternative text for linked images enhances the user experience by providing context and aiding navigation. Lastly, appropriately handling decorative images ensures that they do not clutter the user experience or confuse users relying on screen readers. Overall, adherence to these checkpoints ensures that the website is accessible to all users, promoting inclusivity and compliance with web accessibility standards. Overall, there is a need to improve website accessibility to ensure that everyone can access and use the website with ease.
4.3. Comparative Analysis
The findings reveal significant disparities in compliance rates across agencies, with the largest gaps observed between web presence and website usability ratings.
For instance, the Department of Information and Communications Technology (DICT) recorded the highest usability compliance at 97.10%, surpassing its presence rate of 50.67% by 46.43 percentage points. Similarly, the Department of Justice (DOJ) and agencies like the Commission on Higher Education (CHED) and the Commission on Filipinos Overseas (CFO) showed substantial gaps, with usability rates exceeding presence compliance by 32.87 and 30.08 percentage points, respectively. In contrast, the Department of Social Welfare and Development (DSWD) exhibited the smallest disparity with a mere 1.22 percentage point difference between usability (65.22%) and presence (64.00%). However, certain agencies, such as the National Security Council (NSC), demonstrated underperformance, with presence compliance at only 28.00% and usability at 62.32%, highlighting the challenges faced in achieving balanced compliance. These findings suggest the need for targeted interventions to address the significant gaps and improve overall performance across both web presence and website usability dimensions.