Submitted:
03 February 2025
Posted:
04 February 2025
You are already at the latest version
Abstract
The assessment of learning achievements is a topic of great interest and has been widely addressed in educational institutions worldwide. Especially in the university context, it is a topic that has been widely addressed from different perspectives using quantitative and qualitative tools. This study presents the evaluation model for the achievement of learning outcomes in the Food Engineering career of the State Polytechnic University of Carchi, which is carried out at the end of each academic period by applying a structured test in each subject at each level. The data addressed in this study correspond to the academic period 2022A, which was collected in a database and processed using a proposed protocol of statistical tests composed of Mahalanobis distances as data processing technique and Kruskal-Wallis and Dunn- Šidák tests as tests for differences. The results show that the data collected through structured tests for the evaluation of learning achievements are susceptible to the presence of atypical observations and generally present a non-parametric behavior, so the application of data processing techniques before inferential analysis it's of vital importance. Furthermore, it has been found that not all subjects or levels tested show significant differences so subjects showing lower performance should only be classified as having learning problems if the differences observed by a statistical test are significant. In addition, the use of mean, median, mode, and trimmed mean as metrics for comparing attainment was compared and it was found that the most appropriate metrics for this task were the median and the trimmed mean.
Keywords:
learning achievements
; statistical evaluation
; higher education institutions
; performance evaluation by academic level
; performance by subject
1. Introduction
Academic evaluation at all levels is a subject that can be approached from different perspectives, where numerous researchers have made their proposals and contributions, both for the application of evaluation instruments and for the processing of the information obtained and the extraction of results. At the university level, this is a subject of particular interest since, in most institutions at local, regional, and international levels, teachers are the main people responsible for assigning grades and approving subjects by their students. However, contemporary educational models, such as the one implemented at the State Polytechnic University of Carchi (UPEC), include the component of academic monitoring by authorities such as the Academic Directorates, and even involve the Career Directorates as the first entity responsible for verifying the fulfillment of the learning achievements planned by the teacher in the syllabus of each of his subjects, and as the main component of accompanying the teacher and the chair in the process of continuous improvement. For this reason, in the UPEC Food Engineering degree program, since 2019, a verification model for evaluating learning achievements has been implemented, mainly consisting of a structured test applied at the end of each semester. It consists of multiple choice questions from each subject that the student has coursed, directly focused on the learning objectives proposed in the micro-curricular planning for the semester.
Several studies, such as [1,2,3,4,5], have described different strategies for assessing university students and the information processing techniques used. However, a large part of the proposals only descriptively approached their studies, which makes it difficult to extrapolate the observed results to other scenarios. For these reasons, this study presents a proposal for the statistical analysis of the results of structured tests for the assessment of learning outcomes in higher education institutions. The proposed statistical protocol involves the use of statistical techniques: Mahalanobis distances as a data processing technique and Kruskal-Wallis and Dunn-Sidak tests as tests for differences. The results showed the importance of data processing and the detection of atypical observations before performing contrasts in the obtained results, which can be seriously affected by harmful atypical data. Furthermore, by applying tests for differences with all the proposed categorical variables, it was possible to show that not all levels with their contrasted subjects reached the level of significance. This suggests that the results of the achievement of learning outcomes in higher education institutions should not be directly contrasted, but rather that it is necessary to use statistical hypothesis contrasts, where only comparisons that reach the level of significance allow the identification of subjects or levels that present problems in the achievement of learning outcomes and require action to be taken by the institution. In addition, it was observed that the samples obtained through structured tests have a non-parametric behavior, so the use of mean, median, mode, and the trimmed mean was contrasted to contrast the performance of subjects and levels, where it was found that the median and trimmed mean were the most appropriate metrics to make learning achievements comparisons and conclusions.
Related Works
The research of [6] was developed to analyze the commitment of university students through the use of a questionnaire that evaluates the adaptation and validation of university students in three universities in Chile, for which an exploratory and descriptive approach was used through a mixed quantitative-qualitative methodology. The results showed that the behavioral indices are satisfactory; however, it is necessary to implement strategies that allow improvement in the institutions, as well as to promote the sharing of goals and experiences for the common good.
In the study of [7] the analysis of the students of Pedagogy in Mathematics Education in Chile was developed, taking a sample of 32 future professionals. The authors used an exploratory approach, given the limited size of the sample, and mixed data collection techniques. The results obtained show that the related topics (knowledge in pedagogy, statistics, and probability) were below the national level, in addition, the subject programs do not present a renewal that significantly influences the progress of the students. In addition, the incidence of the topics allowed to consider challenges that contribute to taking action for the training of future professionals.
The work of [8] presents the analysis of the interaction of human resource management practices, job satisfaction, human capital competencies, organizational commitment, and what the effects are in university institutions. For which the methodological design used addressed a quantitative, non-experimental, transversal approach with an explanatory scope. In addition, a survey was applied with a sample of 84 individuals. The results showed that the variables of human capital and job satisfaction are positively related to educational performance since they are considered of vital importance by showing the employee's experience, knowledge, skills, and effort, where learning achievements and good academic indicators are the ones to be taken into account in the design of human resource management, benefiting job satisfaction.
The article by [9] details the process of implementing gamification as a teaching methodology for students to enhance the dynamic learning process in the subject of Statistics and Probability at the National University of Catamarca (UNCA). The results showed a mastery of communication and social tools, in addition to advances in ICT, however, more knowledge is needed regarding bibliographic review for the construction of tools that can be applied in engineering. For this reason, a fundamental tool called Quizizz has been applied, which evaluates students in a didactic and entertaining way, supporting the hypothesis that gamification contributes to the motivation and participation of students.
In the article [10] the possible consequences of the geographical location of the region of students in the areas of economics, accounting, administration, and related areas on their learning achievements were studied through evaluation in programs of higher education institutions in Colombia. This study focused on georeferenced and geolocated models in terms of face-to-face teaching methods, traditional distance, and virtual distance with correlational scope, in addition to the I of Moran autocorrelation coefficient. The results obtained show that a diversity of strategies for traditional and virtual distance education must be expanded, in addition, high achievements in the face-to-face modality are reflected in sectors such as Bogotá and Antioquia. The data did not show significant differences in terms of location, but trends and limitations in the sector that influence the results are visible.
In [11] the analysis of important conclusions and results of different studies related to virtual education strategies used by different university teachers is presented. A bibliographic review approach was used, in which 29 articles were selected between the years 2016 to 2021. The results showed that there is a diversity of strategies for teaching classes and an important action to be considered is the incorporation of information and communication technologies, which allows better planning in the creation of activities, commitment in students, and greater participation.
The study of [12] was developed to establish an interaction between digital literacy and satisfaction in the learning performance of university students of the Faculty of Education Sciences (FCEDUC) throughout COVID-19 in 2021, at the National University of Antiplano Puno (UNA). A quantitative, nonexperimental, and correlational design approach was developed, in addition to two instruments for data collection. With a sample of 290, significant data were obtained in the study variables, concluding that FCEDUC teachers significantly intervene in the learning performance of students, since they are trained in the development of activities and innovation of virtual environments.
The research of [13] was developed to determine how an inverted classroom influences, showing itself as a tool for achieving autonomous learning in higher education students. The present study was applied through a quasi-experimental subtype experimental design, in which a sample of 73 students was obtained with subgroups of 37 and 36, one of the control group and the other experimental, respectively, in addition, a survey was taken as a technique, and a questionnaire as instrument. The results obtained showed that the flipped classroom allows students to implement innovative technological tools to generate learning.
2. Materials and Methods
2.1. Study Area Description
The assessment of learning achievements in the Food Engineering career at the Carchi State Polytechnic University is an academic activity carried out since 2019 to evaluate the achievements and skills obtained by students at each level of the career, in each subject at the end of each semester. This evaluation consists of a structured test composed of 6 multiple-choice items for each subject that the student takes, which are evaluated in a period of 60 minutes. Each questionnaire for each subject was created in the UPEC virtual classroom system, which was implemented based on the Moodle virtual learning environment, and the questionnaire is presented interactively to the students using H5P's interactive learning objects framework. To construct the multiple-choice items, a question bank of 10 items is created, from which the system randomly selects 6 questions for each student. Subsequently, the results are weighted on the 10-point scale and the grades are extracted from the system to create a database per semester. The database used in this research consisted of 1043 observations of the grades received by each student in their respective assessments. This database was composed of 6 numerical variables for the score obtained in each question answered by the student, an additional numerical variable for the average obtained in the evaluation, and 3 categorical variables for the subject, level, and class to which each student belongs.
The database comprised the observations of students from the first to the ninth levels of the Food Engineering career, for whom the achievement of learning outcomes in the subjects was evaluated, as detailed in Table 1.
As mentioned above, the assessment for each subject included 6 multiple-choice items based on the learning objectives proposed by each teacher in the syllabus for their subject. Next, a statistical analysis of the results was performed to extract significant and inferential information from the sample. The statistical analysis proposed for the evaluation of learning outcomes in higher education institutions is composed of Mahalanobis distances as a data processing technique; the verification of parametric assumptions for the selection of a statistical test; the Kruskal-Wallis test as a test for identifying general differences; and the Dunn test as a paired posterior test for differences.
2.2. Statistical Analysis
Data screening: The database compiled is always vulnerable to the occurrence of atypical data, so it is recommended that all statistical analyses begin with the application of a data analysis protocol. One of the most used data processing tools for multivariate samples is computing the Mahalanobis distances for each observation, which measures the number of standard deviations an observation is from the mean in a distribution. Since outliers do not behave similarly to common observations, this measure can be used to find outlier observations. From a geometric perspective, the Euclidean distance is the shortest distance between two points, but it does not take into account the correlation between highly correlated variables [1,14]. The Mahalanobis distance differs from the Euclidean distance in that it takes into account the correlation between variables. It is a scale-invariant metric that gives the measure of the distance between a point that causes a , p-varied probability distribution and the mean of the distribution. Assuming that the distribution f_X (.) has finite second-order moments, the covariance matrix can be obtained as . In this way, the Mahalanobis distances are defined as:
General test for differences. The results obtained by processing the data, confirm that a data sample has been collected without the presence of alterations due to the influence of atypicals, and consists only of a set of variables that correctly explain the latent variables of research interest. When these data don’t meet the parametric assumptions, a nonparametric technique must be used for comparison. The Kruskal-Wallis test is a nonparametric alternative to one-way ANOVA, which assumes that the observations in each sample group come from a sample with the same distribution. The null hypothesis configured for this test is:
where is the median of the ith group defined by the categorical variable in the sample. In this case, the null hypothesis is equivalent to " H0: the samples come from identical populations". We define that represents the total number of observations , where represents the sample size of each group and represents the number of groups to be compared. The ranks are obtained for each observation in ascending or descending order of magnitude when ties exist. Thus, represents the rank assigned to the jth observation of the ith group, and represent the sum of the ranks assigned to the ith group , for . In this way, the static test is defined as:
where:
If there are no ties, is simplified to and the statistical test is reduced to:
Under the null hypothesis and the previously defined assumption, is asymptotically distributed in the chi-squared distribution with degrees of freedom [15,16].
Pairwise test for differences. This test was designed to compare more than two samples in a paired manner, thus it is an alternative posthoc test to the Kruskal-Wallis test, where when the significance level is reached at a general level, the Dunn's test can contrast each possible pair, and identify which pairs of groups present significant differences. The Dunn-Šidák test was proposed by [17], which was developed from the concept of equality proposed by Šidák. This update of the inequality term is considered an improved version of the Bonferroni inequality since the confidence intervals obtained in this case are smaller than those used in the Bonferroni test. In addition, depending on the size of the family used, the Dunn test can provide even smaller confidence intervals than the Tuckey test. For a given family-wise error rate (FWER) an error metric is defined, thus, the Dunn-Šidák contrast , can be calculated by the expression:
where:
and are the means of the considered samples, is the number of possible comparisons in the family, and the quantile is obtained from the Student's T probability distribution for a given degree of freedom ν. Finally, the confidence intervals for each possible Dunn- Šidák contrast are obtained by the expression:
3. Results
3.1. Data Treatment
The sample used for this study was made up of 1042 observations collected from students enrolled in the Food Science major in the 2022A academic period, for each of the subjects enrolled in each parallel and corresponding level. The database was structured using 10 variables as columns, 3 of which were categorical: subject, level, and parallel. In addition, there were a total of 7 numerical variables, which were the total score obtained in the evaluation of each subject and the score obtained in each of the 6 questions that made up each evaluation. The descriptive statistics of the numerical variables are presented in Table 2.
Next, a data treatment was applied to detect atypical observations in the sample, so Mahalanobis distances were calculated for each observation, obtaining a cut-off value of 24,322, using the quantiles of the chi-square distribution for an exclusion interval of 0.1% for the most distant distances. This identified and eliminated 31 atypical observations, leaving a final database of 1011 observations for analysis.
3.2. Tests for Differences
Next, difference tests were used as the first analysis strategy on the treated database to determine which levels and which subjects showed significant differences from the others, allowing improvement actions to be taken.
3.2.1. Diferences by Level
First, the parametric assumptions of normality, homogeneity, and homoscedasticity were checked to select the most appropriate statistical test for the evaluation. For this purpose, the Kolmogorov-Smirnov, Levene, and Breusch-Pagan tests were used, taking the level as a categorical variable and the grade obtained by each student in each evaluation as a numerical variable. In this way, for the normality test, p-values of , , , , , , , and respectively were obtained for each level, so that the significance level was not reached for any of the levels, and therefore the assumption of normality was rejected. Similarly, Levene's test for equality of variance and Breusch - Pagan's test for homoscedasticity yielded p-values of and , respectively, rejecting the assumptions of homogeneity and homoscedasticity. Figure 1 shows the QQ plot and scatter plot obtained from the sample.
As can be seen in Figure 1 and the p-values of the Kolmogorov-Smirnov, Levene, and Breusch-Pagan tests, the sample was not parametric, so the Kruskal-Wallis test was chosen as the general test for differences and the Dunn-Sidák test as the post hoc test for detecting significant differences in the groups that make up the sample. The results of the test for differences are presented in Table 2.

Table 2.
Descriptive statistics for the ordinal variables of the instrument applied to teachers.
| Kruskal-Wallis Test – Qualification ~ Subjects | |||||||||||||
|---|---|---|---|---|---|---|---|---|---|---|---|---|---|
| Kruskal Wallis χ2 | 95.304 | Degrees of freedom | 8 | p-value | 2.2e − 16 Significant |
||||||||
| Paired Test – Dunn- Šidák | |||||||||||||
| Fouth | Nineth | Eighth | First | Fifth | Second | Seventh | Sixth | ||||||
| Ninth |
pval = 0.00062 Significant |
||||||||||||
| Eighth |
pval = 0.31649 Not significant |
pval = 0.02063 Significant |
|||||||||||
| First |
pval = 0.00282 Significant |
pval = 1.00000 Not significant |
pval = 0.42292 Not significant |
||||||||||
| Fifth |
pval = 1.00000 Not significant |
pval = 3.5e − 05 Significant |
pval = 1.00000 Not significant |
pval = 0.00037 Significant |
|||||||||
| Second |
pval = 0.00849 Significant |
pval = 1.00000 Not significant |
pval = 1.00000 Significant |
pval = 1.00000 Significant |
pval = 0.00328 Significant |
||||||||
| Seventh |
pval = 0.00099 Significant |
pval = 1.00000 Not significant |
pval = 0.17073 Not significant |
pval = 1.00000 Significant |
pval = 4.7e − 05 Significant |
pval = 1.00000 Not significant |
|||||||
| Sixth |
pval = 1.00000 Not significant |
pval = 2.4e − 08 Significant |
pval = 0.03490 Significant |
pval = 1.6e − 07 Significant |
pval = 1.00000 Not significant |
pval = 3.5e − 06 Significant |
pval = 5.7e − 09 Significant |
||||||
| Third |
pval = 1.00000 Not significant |
pval = 6.2e − 05 Not significant |
pval = 1.00000 Not significant |
pval = 0.00134 Significant |
pval = 1.00000 Not significant |
pval = 0.00776 Significant |
pval = 0.00043 Significant |
pval = 1.00000 Not significant |
|||||
As can be seen in Figure 2 and Table 2 and Table 3, the Kruskal-Wallis test reached the level of significance with a p-value of , so it was concluded that there are significant differences between the groups that make up the sample, in this way the Dunn- Šidák paired posterior test was applied to identify the groups that presented these differences. By comparing each of the pairs of levels that make up the food career, it was possible to identify that: in general, the ninth-grade students are the ones who presented the best performance in the evaluation compared to the fourth, eighth, fifth, sixth, and third level students, reaching the level of significance with p-values of , , , and , respectively. First-level students performed better in the evaluation than fourth, fifth, sixth, and third-level students, reaching the significance level with p-values of , , , and , respectively. When comparing the seventh-level students, it was found that they reached a higher level of performance in the evaluation compared to the fourth, fifth, sixth, and third-level students, with p-values of , , , and . The second, third, fifth, and eighth-level students did not show significant differences among themselves, but their performance was significantly higher than that of the second and fourth-level students. Descriptively, due to the large presence of outliers in the sample and the fact that the sample is non-parametric, the median and the trimmed mean were considered robust indices of central tendency, so it is concluded that the ninth-level students were the ones who had the best performance in the evaluation and the fourth level students had the worst performance.
3.2.2. Differences by Subject
The database created was structured in such a way that information could be extracted from each level and a comparison could be made between the subjects that make up each of the 9 levels that make up the curricular network of the Food Engineering career. Similarly to what was presented in the previous section, the protocol of checking the assumptions was carried out using the Kolmogorov-Smirnov, Levene, and Breusch-Pagan tests, where again it was found that the sample was not parametric, so the Kruskal-Wallis test was selected as a general difference test and Dunn-Sidák test as a post hoc test to detect significant differences in the groups that make up the sample.
The analysis began with the comparison of the subjects that make up the first level of food technology studies, namely: linear algebra, biology, and general chemistry. The results of the difference tests are presented in Table 4.
As can be seen in Figure 3 and Table 4 and Table 5, the Kruskal-Wallis test reached the significance level with a p-value of 0.03925, so it was concluded that there are significant differences between the groups that make up the sample. Thus, the Dunn-Sidak paired post hoc test was used to identify the groups that present these differences. By comparing each of the pairs of first-level subjects, it was possible to determine that: when comparing the results of the subjects Linear Algebra and Biology, a better performance was identified in the Linear Algebra students, reaching the level of significance. Similarly, general chemistry students performed better than biology students, reaching the level of significance. Descriptively, the median and the trimmed mean were considered robust indices of central tendency, so it can be observed that, for the first level, the students achieved better performance in the subject of General Chemistry and lower performance in the subject of Biology.
For the second level of the food engineering career, there are the subjects: applied physics, general microbiology, nutrition, and organic chemistry. Similarly, the difference test protocol described above was applied and the results are presented in Table 6.
Figure 10.
Student grades for eight-level subjects.
As can be seen in Figure 4 and Table 6 and Table 7, the Kruskal-Wallis test did not reach the level of significance with a p-value of 0.1304, so it was concluded that there are no significant differences between the groups that make up the sample. The same result was found when performing the paired test, where none of the comparisons performed between the pairs of subjects of the second level reached the level of significance. Descriptively, the median and the trimmed mean were considered robust indices of central tendency, so it is observed that in the second level, the students achieved better performance in the subject of Applied Physics and lower performance in the subjects of General Microbiology and Organic Chemistry.
For the third level of the food engineering career, there are the subjects: Food Biochemistry, Fundamentals of Engineering, Food Microbiology, and Toxicology. Similarly, the difference test protocol previously described was applied and its results are presented in Table 8.
As can be seen in Figure 5 and Table 8 and Table 9, the Kruskal-Wallis test reached the level of significance with a p- p-value of , so it was concluded that there are significant differences between the groups that make up the sample, so the Dunn- Šidák paired t-test was applied to identify the groups that presented these differences. By comparing each pair of subjects at the second level, it was possible to determine that: the students of toxicology performed better than the students of food microbiology and reached the level of significance. Similarly, food biochemistry students performed better than food microbiology students, reaching the significance level. In the same way, the food biochemistry students performed better than the food microbiology students, reaching the level of significance. Descriptively, the median and the trimmed mean were considered robust indices of central tendency, so it is observed that for the third level, the students achieved better performance in the subject of Toxicology and lower performance in the subject of Food Microbiology.
For the fourth level of food technology, there are the subjects: instrumental analysis, food biotechnology, inferential statistics, transport phenomena, and basic thermodynamics. Similarly, the difference test protocol described above was applied and the results are presented in Table 10.
As can be seen in Figure 6 and Table 10 and Table 11, the Kruskal-Wallis test reached the level of significance with a p-value of , so it was concluded that there are significant differences between the groups that make up the sample, so the Dunn-Sidák paired post hoc test was applied to identify the groups that presented these differences. By comparing each of the pairs of fifth-grade subjects, it was possible to identify that: there are significant differences when comparing the grades of the subject Food Biotechnology, which presents a significantly higher performance than the subjects Food Biotechnology, Inferential Statistics, Transport Phenomena, and Basic Thermodynamics, with p-values of 0.01399, 0.01606, 0.00506, 0.00078, respectively. Descriptively, the median and the trimmed mean were considered robust indices of central tendency, so it is observed that for the fourth level, the students achieved better performance in the subject of food biotechnology and lower performance in the subject of instrumental analysis.
For the fifth level of food engineering, there are the subjects: bromatology, experimental design, standardization and quality assurance, rheology, and applied thermodynamics. Similarly, the difference test protocol described above was applied and the results are presented in Table 12.
As can be seen from Figure 7 and Table 12 and Table 13, the Kruskal-Wallis test reached the significance level with a p-value of 0.01684, so the paired t-test was performed. However, when performing the Dunn-Sidak test, it was found that none of the comparisons performed between the pairs of subjects of the second level reached the level of significance. Descriptively, the median and the trimmed mean were considered robust indices of central tendency, so it is observed that for the fifth level, the students achieved better performance in the subject of standardization and quality assurance and lower performance in the subject of food science.
For the sixth level of food technology, there are the subjects: food analysis, development of new products, containers and packaging, unit operations, food safety systems, and dairy technology. Similarly, the difference test protocol described above was applied and the results are presented in Table 14.
As can be seen in Figure 8 and Table 14 and Table 15, the Kruskal-Wallis test reached the significance level with a p-value of 0.01286, so it was concluded that there are significant differences between the groups that make up the sample. Thus, the Dunn-Sidak paired post hoc test was used to identify the groups that show these differences. When comparing each of the pairs of subjects of the sixth level, it was possible to determine that: there are significant differences when comparing the grades of the subject Unit Operations with that of New Product Development with a p-value of 0.012. Descriptively, the median and the trimmed mean were considered robust indices of central tendency, so it can be observed that, for the sixth level, the students achieved better performance in the subject of Unit Operations and lower performance in the subject of New Product Development.
For the seventh level of the food engineering career, there are the subjects: Project Design and Evaluation, Sensory Evaluation, Unit Operations II, Integrated Management Systems, Meat Product Technology, Fruit and Vegetable Technologies, and Degree Work I. Similarly, the difference testing protocol described earlier was applied and its results are presented in Table 16.
As can be seen in Figure 9 and Table 16 and Table 17, the Kruskal-Wallis test reached the significance level with a p-value of 0.005235, so it was concluded that there are significant differences between the groups that make up the sample. Thus, the Dunn-Sidak paired post hoc test was used to identify the groups that show these differences. By comparing each of the pairs of seventh-grade subjects, it was possible to identify that: there are significant differences when comparing the grades of the subjects, sensory evaluation, and fruit and vegetable technologies, which obtained a significantly higher performance than the project design and evaluation subject. with a p-value of 0.081 and 0.010 respectively. Descriptively, the median and the trimmed mean were considered robust indices of central tendency, so it is observed that for the seventh level, the students achieved better performance in the subject of Sensory Evaluation and lower performance in the subject of Project Design and Evaluation.
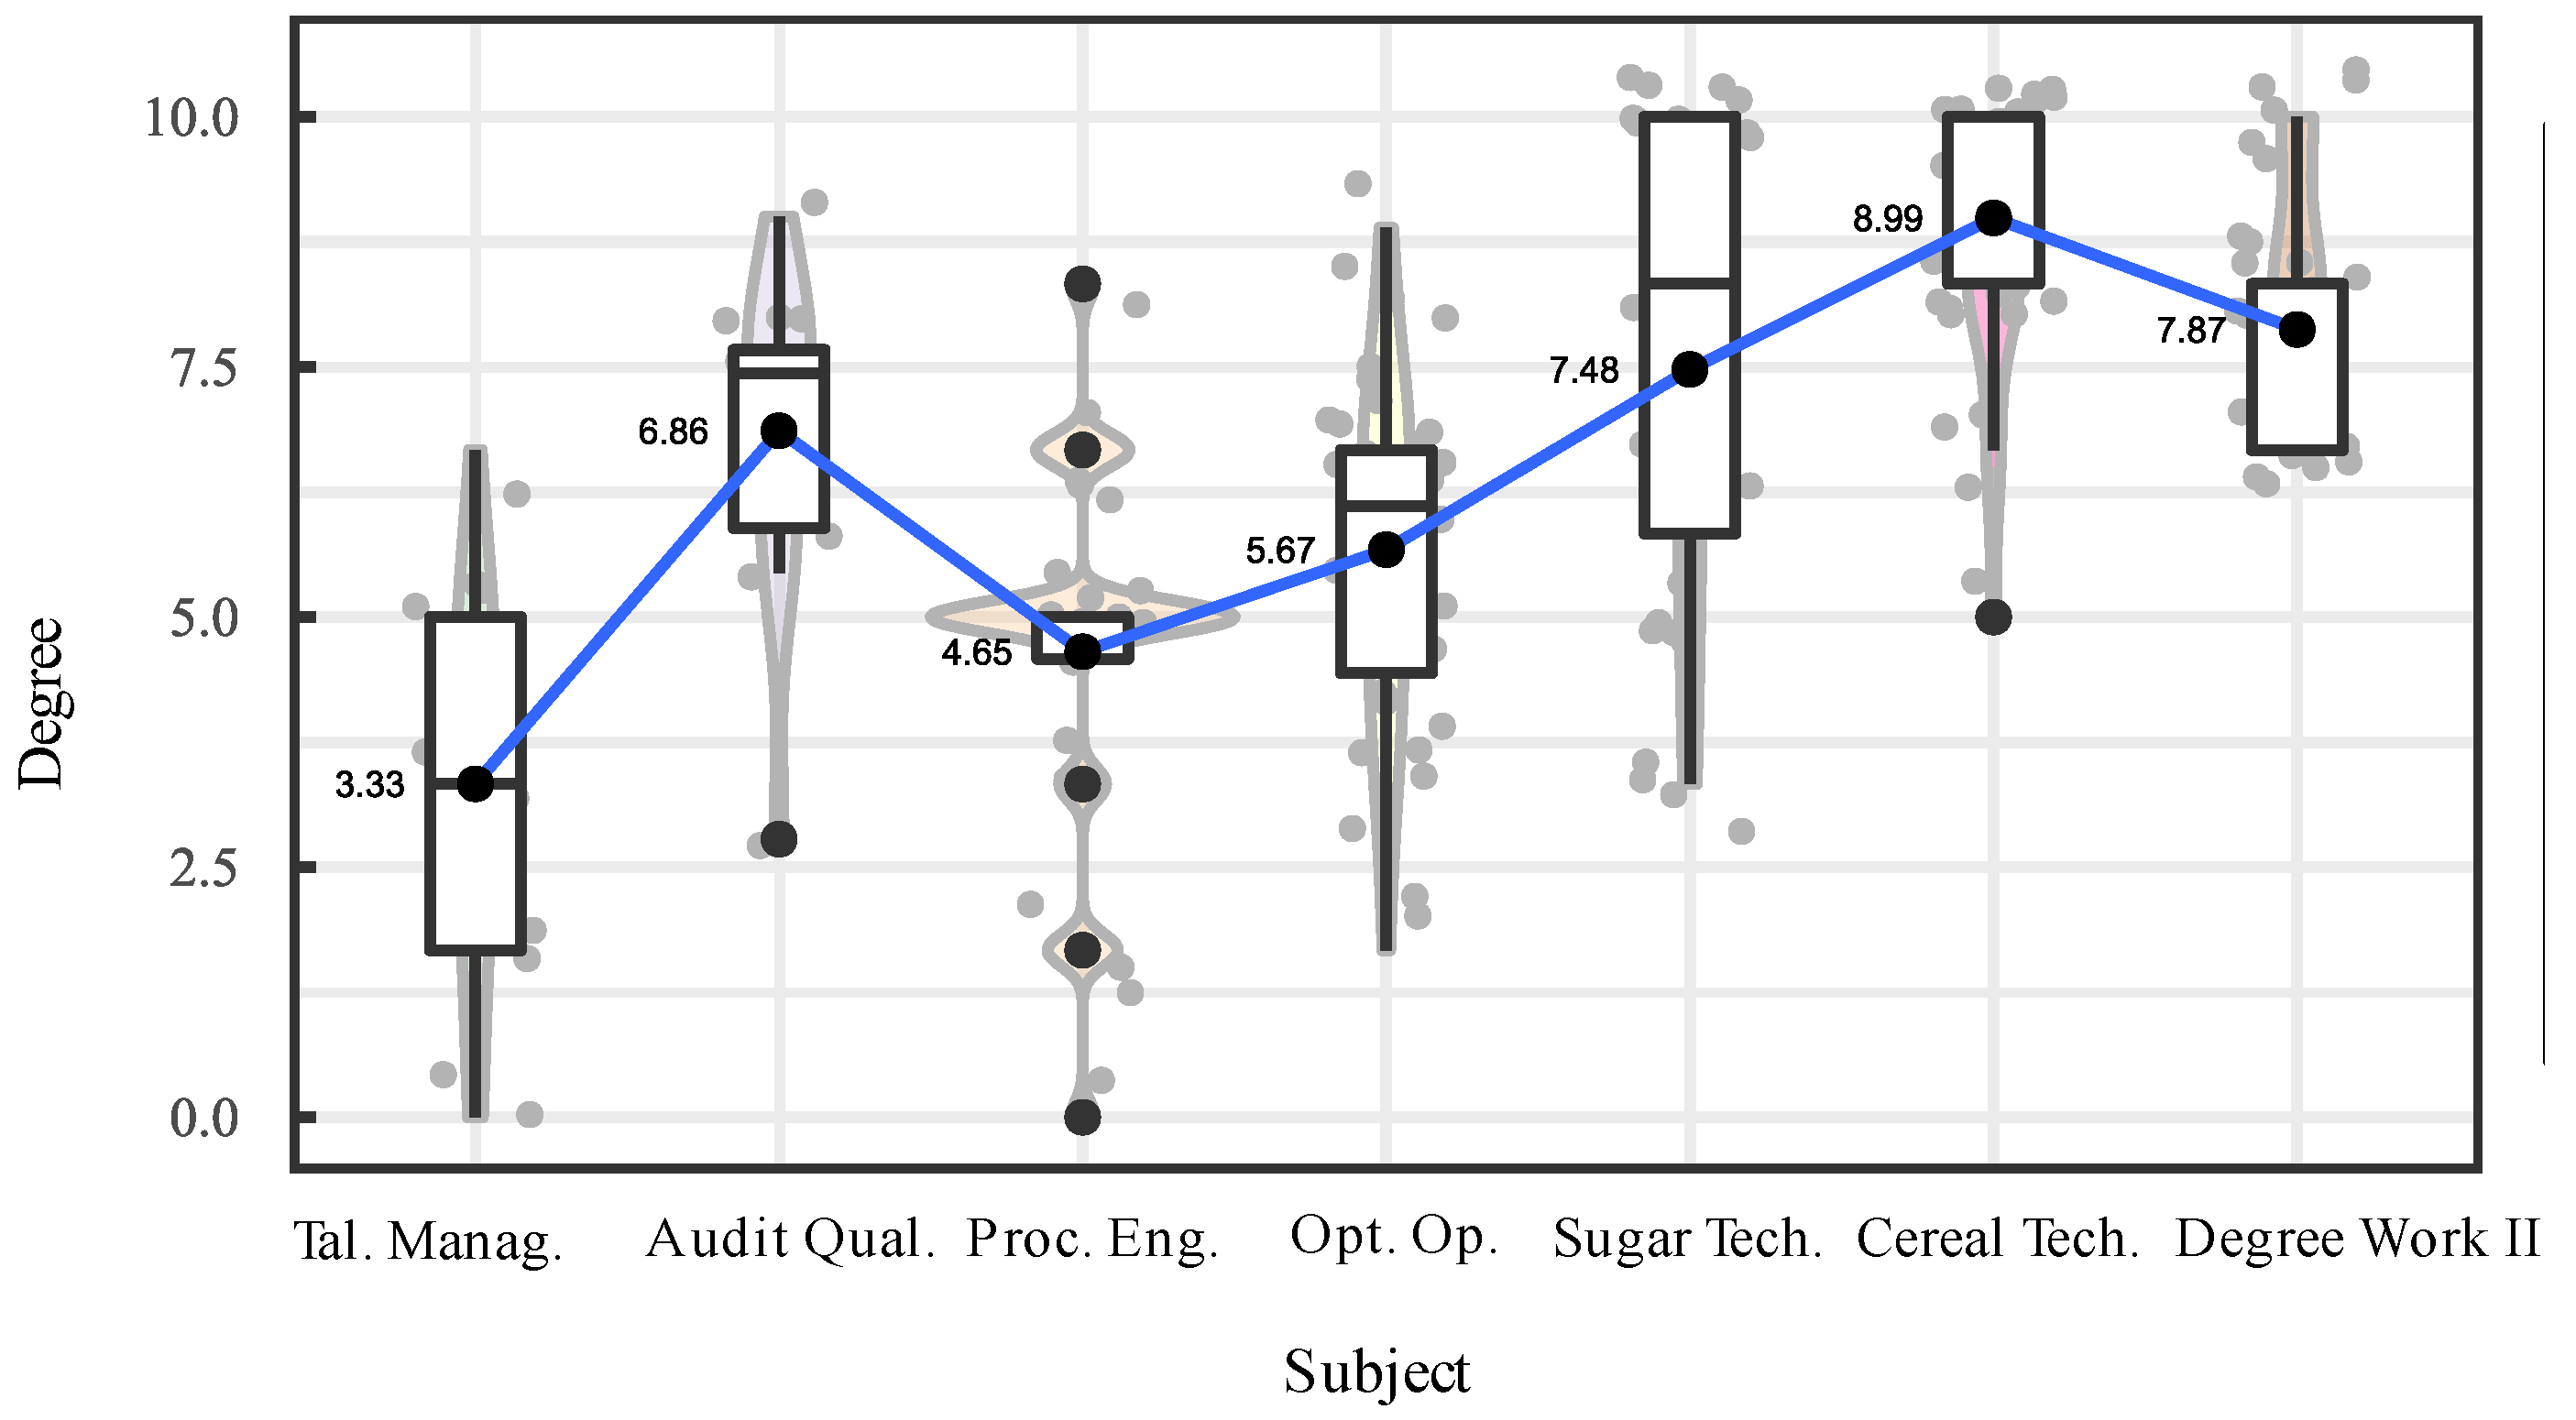
For the eighth level of the Food Engineering career, there are the subjects: Human Talent Management, Audit of Quality and Safety Systems, Food Process Engineering, Optimization of Operations and Processes, Sugar Technology, Cereal Technology, and Degree Work II. Similarly, the previously described protocol for testing differences was applied and the results are presented in Table 18.
As can be seen in Figure 8 and Table 14 and Table 15, the Kruskal-Wallis test reached the level of significance with a p- p-value of 2.2e-16, so it was concluded that there are significant differences between the groups that make up the sample, so the Dunn-Sidák paired t-test was applied to identify the groups that present these differences. When comparing the individual pairs of subjects of the eighth grade, it was possible to determine that: the grades obtained in the subject of cereal technology were significantly higher than in the other subjects, except for the subjects of sugar technology and degree work II. The subjects Sugar Technology and Degree Work II did not show significant differences among themselves but showed significantly higher performance than the subjects Human Talent Management, Auditing of Quality and Safety Systems, Food Process Engineering, and Optimization of Operations and Processes. Descriptively, the median and the trimmed mean were considered robust indices of central tendency, so it is observed that for the eighth level, the students achieved better performance in the subject of cereal technology and lower performance in the subject of human talent management.
Finally, for the ninth level of the Food Engineering degree, there are the subjects: Design and Organization of Industrial Plants and Degree Work III. Similarly, the difference test protocol described above was applied and the results are presented in Table 20.
Figure 11.
Student grades for ninth-level subjects.
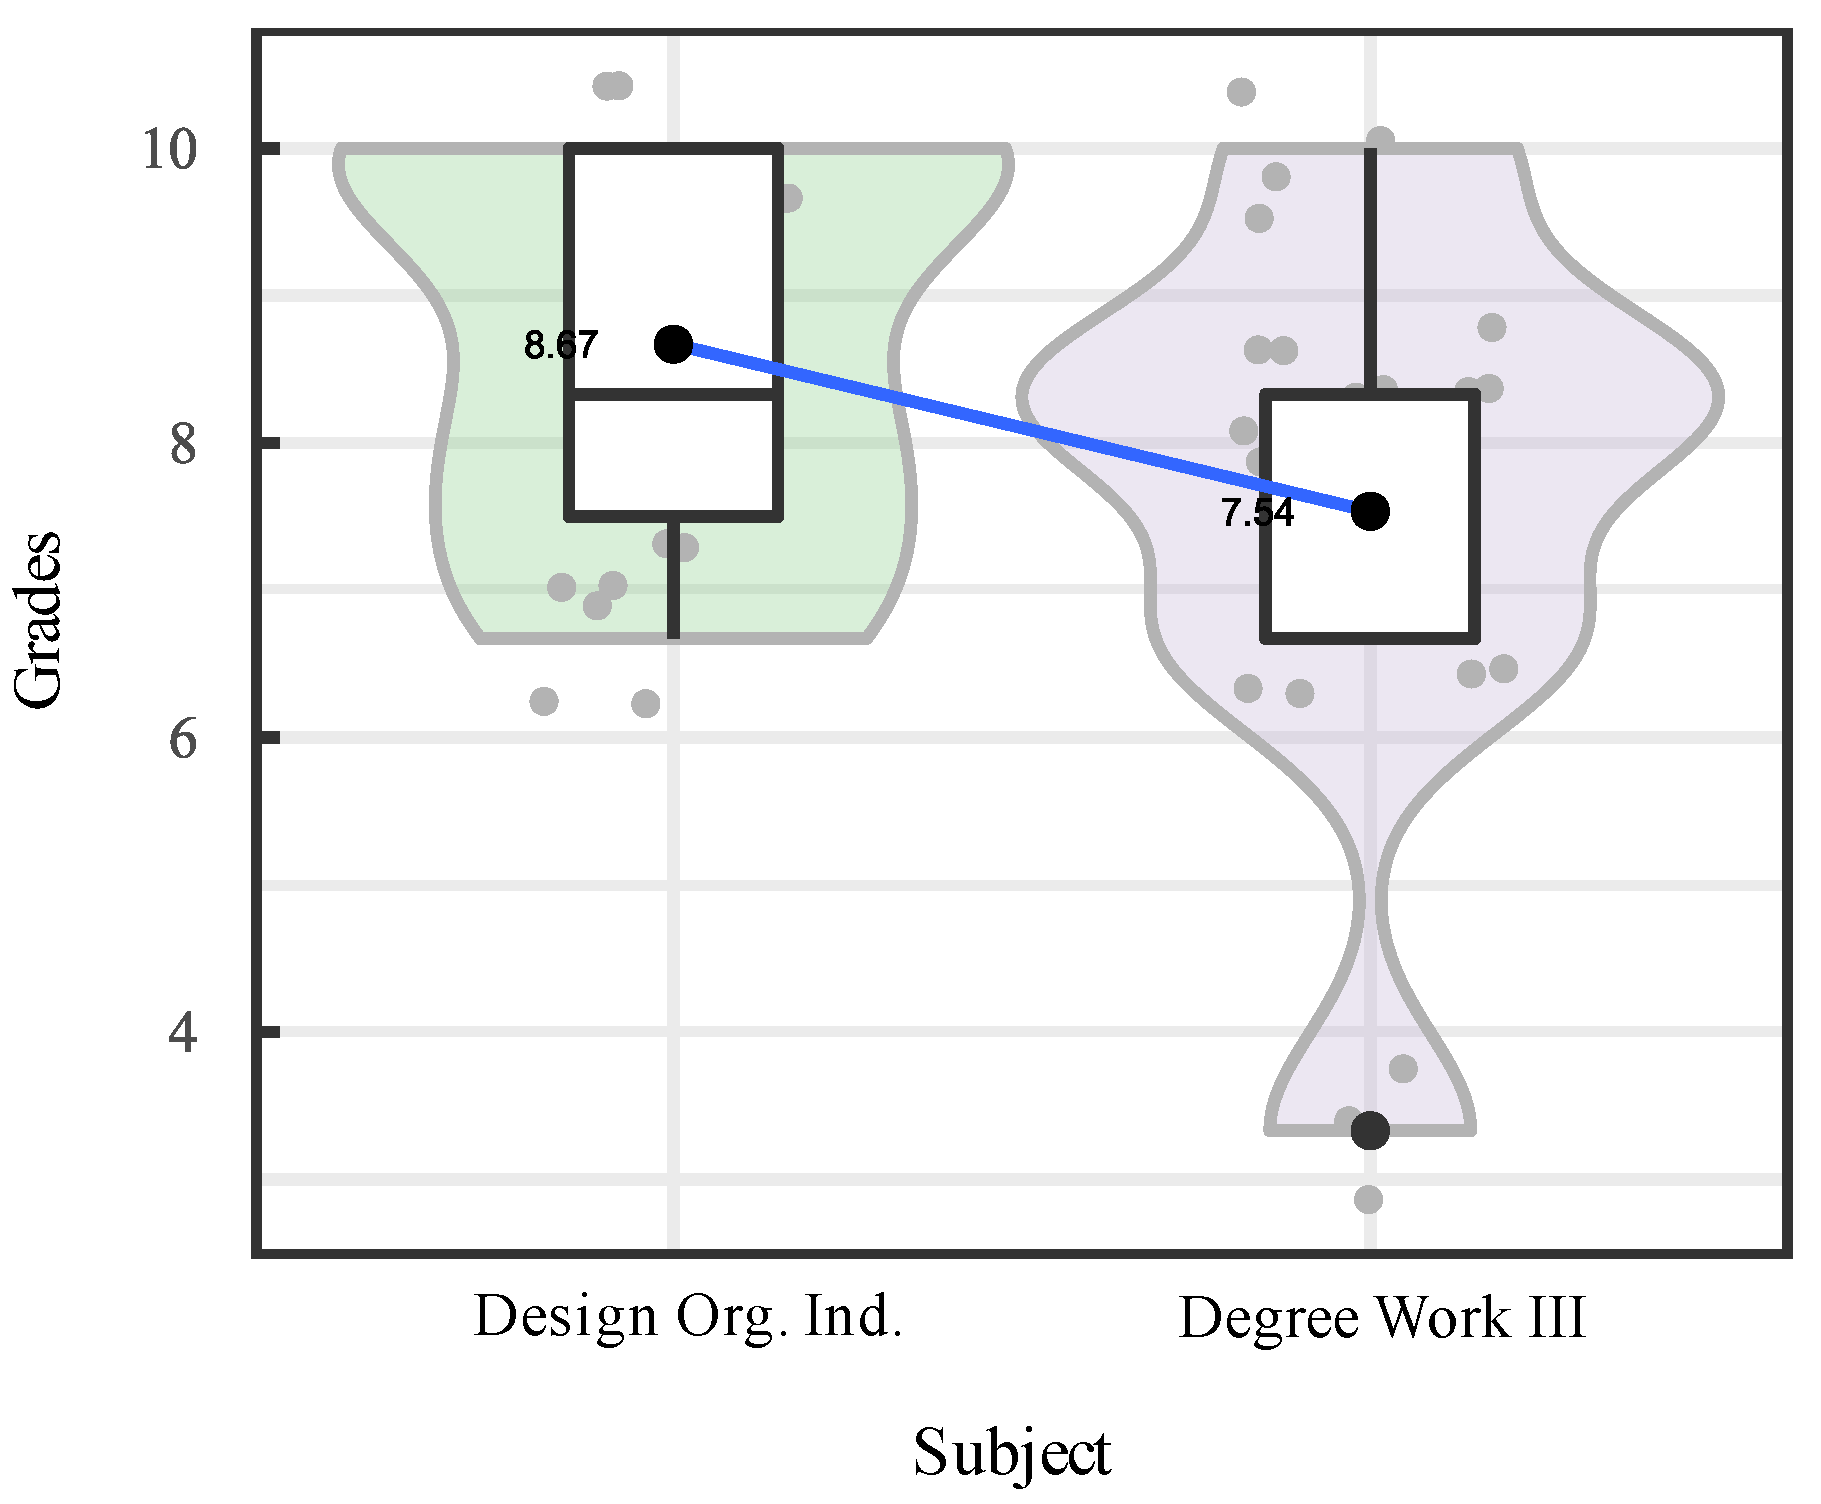
Descriptively, the median and the trimmed mean were considered robust indices of central tendency, so it is observed that by the ninth level, the students achieved a better performance in the subject of Design and Organization of Industrial Plants and a lower performance in the subject of Level III Work.
4. Discussion
In related studies, such as [1,2,3], it can be seen that the results of academic evaluations in educational institutions are usually analyzed only descriptively, primarily using the average as a comparative parameter. These studies constitute a theoretical basis of great importance, and their motivations and strategies have been taken into account in the construction of the evaluation instrument and the evaluation protocol applied to students. However, as demonstrated in this study, the scores obtained for the evaluation of the learning performance of students in higher education institutions are susceptible to the inclusion of atypical observations (as in this example, where 31 cases were detected), which can considerably modify the value of the statistical measures collected from the sample, so that the elimination of atypical data is of vital importance before the analysis of the information. Furthermore, in this study the use of different measures of central tendency such as the mean, median, mode, and trimmed mean was compared, where it was widely observed that the median and the mean trimmed at 10% are robust statistics that are not very susceptible to the presence of atypical and should be considered for the analysis of academic results in general in educational institutions and especially in this case that corresponds to the evaluation of learning achievements.
In addition, it has been observed that the samples collected for the analysis of the learning performance results are usually non-parametric, so it is suggested that their analysis be carried out using non-parametric statistical techniques, such as the Kruskal-Wallis and Dunn tests. It should be noted that, as seen in the second and fifth-level contrasts, the application of a difference test does not always yield significant differences. This means that looking at a descriptive statistic such as the mean in a structured assessment of learning outcomes does not always show that there is a greater or lesser performance of students in the contrasting groups. For this reason, before contrasting means, identifying problems in the teaching-learning process, or making decisions, it is necessary to apply an appropriate statistical protocol (such as a difference test) to know which contrasts reflect a significant difference and which subjects or levels of learning require action in the face of inferior performance that is not always significant. In other words, for the evaluation of learning achievements, subjects should be contrasted using the median or trimmed mean, and subjects with lower scores should be classified as problems requiring improvement actions only if the differences observed by a statistical test (such as the Dunn-Sidak test) are significant.
5. Conclusions
This research details the process of evaluation of learning achievements carried out in a higher education institution at the end of a teaching period, to determine whether the learning achievements proposed by the teachers in their syllabuses were achieved at the end of the teaching of each subject. For this purpose, an evaluation instrument was designed consisting of 6 random multiple-choice questions for each subject and career level. The results obtained were compiled in a database weighted on a scale of 10, using 7 numerical and 3 categorical variables. In addition, the use of a statistical protocol is proposed for the extraction of inferential information from the sample, composed of Mahalanobis distances as a data processing technique; the Kruskal-Wallis test as a general difference test; and the Dunn- Šidák test as a posterior paired test. The application of Mahalanobis distances allowed us to detect and remove 31 atypical observations, and the difference tests allowed us to identify significant differences in the achievement of students at 7 out of 9 levels.
From the results, it can be concluded that the application of data processing techniques such as Mahalanobis distances and and outlier rejection, is crucial for the evaluation of learning achievements. It was also found that significant differences in performance between subjects were not found at all levels. This shows that not every subject or parallel that presents a lower learning achievement index represents a problem in the achievement of learning outcomes for the institution, and only those subjects, parallels, or levels that show significant differences should be considered with a minor performance or classified as problems in the achievement of learning outcomes. Furthermore, in each of the contrasts made, the measures of central tendency, mean, median, mode, and trimmed mean were tested; where it was possible to conclude that the best measures that well reflect the results of the contrasts made are the median and the trimmed mean, therefore it is suggested that they be used for the analysis of learning achievements in higher education institutions.
Funding
This work was supported by State Polytechnic University of Carchi (www.upec.edu.ec).
Data Availability Statement
We provide all data gathered for experimental evaluation in the GitHub repository: https://github.com/erickherreraresearch/LearningAchievements for reproducibility.
Conflicts of Interest
The authors declare no conflict of interest.
References
- A. E. Jácome Ortega, J. A. Caraguay Procel, E. P. Herrera-Granda, and I. D. Herrera Granda, “Confirmatory Factorial Analysis Applied on Teacher Evaluation Processes in Higher Education Institutions of Ecuador,” in Advances in Intelligent Systems and Computing, Springer, 2020, pp. 157–170. [CrossRef]
- A. E. Jácome-Ortega, E. P. Herrera-Granda, I. D. Herrera-Granda, J. A. Caraguay-Procel, and A. V. Basantes-Andrade, “Análisis temporal y pronóstico del uso de las TIC, a partir del instrumento de evaluación docente de una Institución de Educación Superior,” Rev. Ibérica Sist. e Tecnol. Informação, vol. 2019, no. E22, pp. 399–412, 2019, [Online]. Available: https://www.proquest.com/openview/96910c7cb0c260ae2409940921c7f71b/1?pq-origsite=gscholar&cbl=1006393.
- C. P. Guevara-Vega, W. P. Chamorro-Ortega, E. P. Herrera-Granda, I. D. García-Santillán, and J. A. Quiña-Mera, “Incidence of a web application implementation for high school students learning evaluation: A case study,” Rev. Ibérica Sist. e Tecnol. Informação, vol. 2020, no. E32, pp. 509–523, 2020, [Online]. Available: https://www.proquest.com/openview/bfe21dc96eab6a1dd96d132373a9eefc/1?pq-origsite=gscholar&cbl=1006393.
- L. Meng, M. A. Muñoz, and D. Wu, “Teachers’ perceptions of effective teaching: a theory-based exploratory study of teachers from China,” Educ. Psychol., vol. 36, no. 3, pp. 461–480, Mar. 2016. [CrossRef]
- M. Huerta Rosales, “Evaluación basada en evidencias, un nuevo enfoque de evaluación por competencias,” Rev. Investig. la Univ. Le Cordon Bleu, vol. 5, no. 1, pp. 159–171, Jun. 2018. [CrossRef]
- G. Zapata, P. Leihy, D. Theurillat, G. Zapata, P. Leihy, and D. Theurillat, “Compromiso estudiantil en educación superior: adaptación y validación de un cuestionario de evaluación en universidades chilenas,” Calid. en la Educ., no. 48, pp. 204–250, Jul. 2018. [CrossRef]
- F. Rodríguez and D. Díaz, “Análisis de resultados de futuros profesores de matemática en los contenidos estadísticos y probabilísticos de la evaluación nacional diagnóstica,” PARADIGMA, pp. 142–164, Feb. 2021. [CrossRef]
- N. Pedraza, “Satisfacción laboral y compromiso organizacional del capital humano en el desempeño en instituciones de educación superior,” RIDE. Rev. Iberoam. para la Investig. y el Desarro. Educ., vol. 10, no. 20, Jan. 2020. [CrossRef]
- S. G. Pérez Ibarra, J. R. Quispe, F. F. Mullicundo, and D. A. Lamas, “Aplicación de la herramienta Quizizz como estrategia de gamificación en la educación superior,” XXIII Work. Investig. en Ciencias la Comput. (WICC 2021, Chilecito, La Rioja), no. August 2021, pp. 963–968, 2021.
- N. Arias, W. U. Rincón, and J. M. Cruz, “Diferencia de logro geolocalizado en educación presencial y a distancia en Colombia,” Rev. electrónica Investig. Educ., vol. 23, pp. 1–22, 2021. [CrossRef]
- A. Valverde and B. Solis, “Estrategias de enseñanza virtual en la educación superior,” Polo del Conoc., vol. 6, no. 1, pp. 1110–1132, Jan. 2021.
- E. E. Mancha, M. D. Casa, M. Yana, D. Mamani, and P. S. Mamani, “Competencias digitales y satisfacción en logros de aprendizaje de estudiantes universitarios en tiempos de Covid-19,” Comuni@cción, vol. 13, no. 2, pp. 106–116, Jun. 2022. [CrossRef]
- D. N. Ventosilla, H. R. Santa María, F. Ostos De La Cruz, and A. M. Flores, “Aula invertida como herramienta para el logro de aprendizaje autónomo en estudiantes universitarios,” Propósitos y Represent., vol. 9, no. 1, 2021. [CrossRef]
- H. Ghorbani, “MAHALANOBIS DISTANCE AND ITS APPLICATION FOR DETECTING MULTIVARIATE OUTLIERS,” FACTA Univ. Ser. Math. INFORMATICS, vol. 34, pp. 583–595, 2019. [CrossRef]
- F. Nwobi and F. Akanno, “Power comparison of ANOVA and Kruskal–Wallis tests when error assumptions are violated,” Adv. Methodol. Stat. / Metod. Zv., vol. 18, no. 2, pp. 53–71, 2021. [CrossRef]
- L. M. Chamorro-Hernandez, E. P. Herrera-Granda, and C. Rivas-Rosero, “Selection of the Processing Method for Green Banana Chips from Barraganete and Dominico Varieties Using Multivariate Techniques,” Appl. Sci., vol. 14, no. 7, p. 2682, Mar. 2024. [CrossRef]
- O. J. Dunn, “Estimation of the Means of Dependent Variables,” Ann. Math. Stat., vol. 29, no. 4, pp. 1095–1111, Feb. 1958, [Online]. Available: http://www.jstor.org/stable/2236948.
Figure 1.
Parametric assumptions, (a) Q-Q plot, (b) scatter plot.
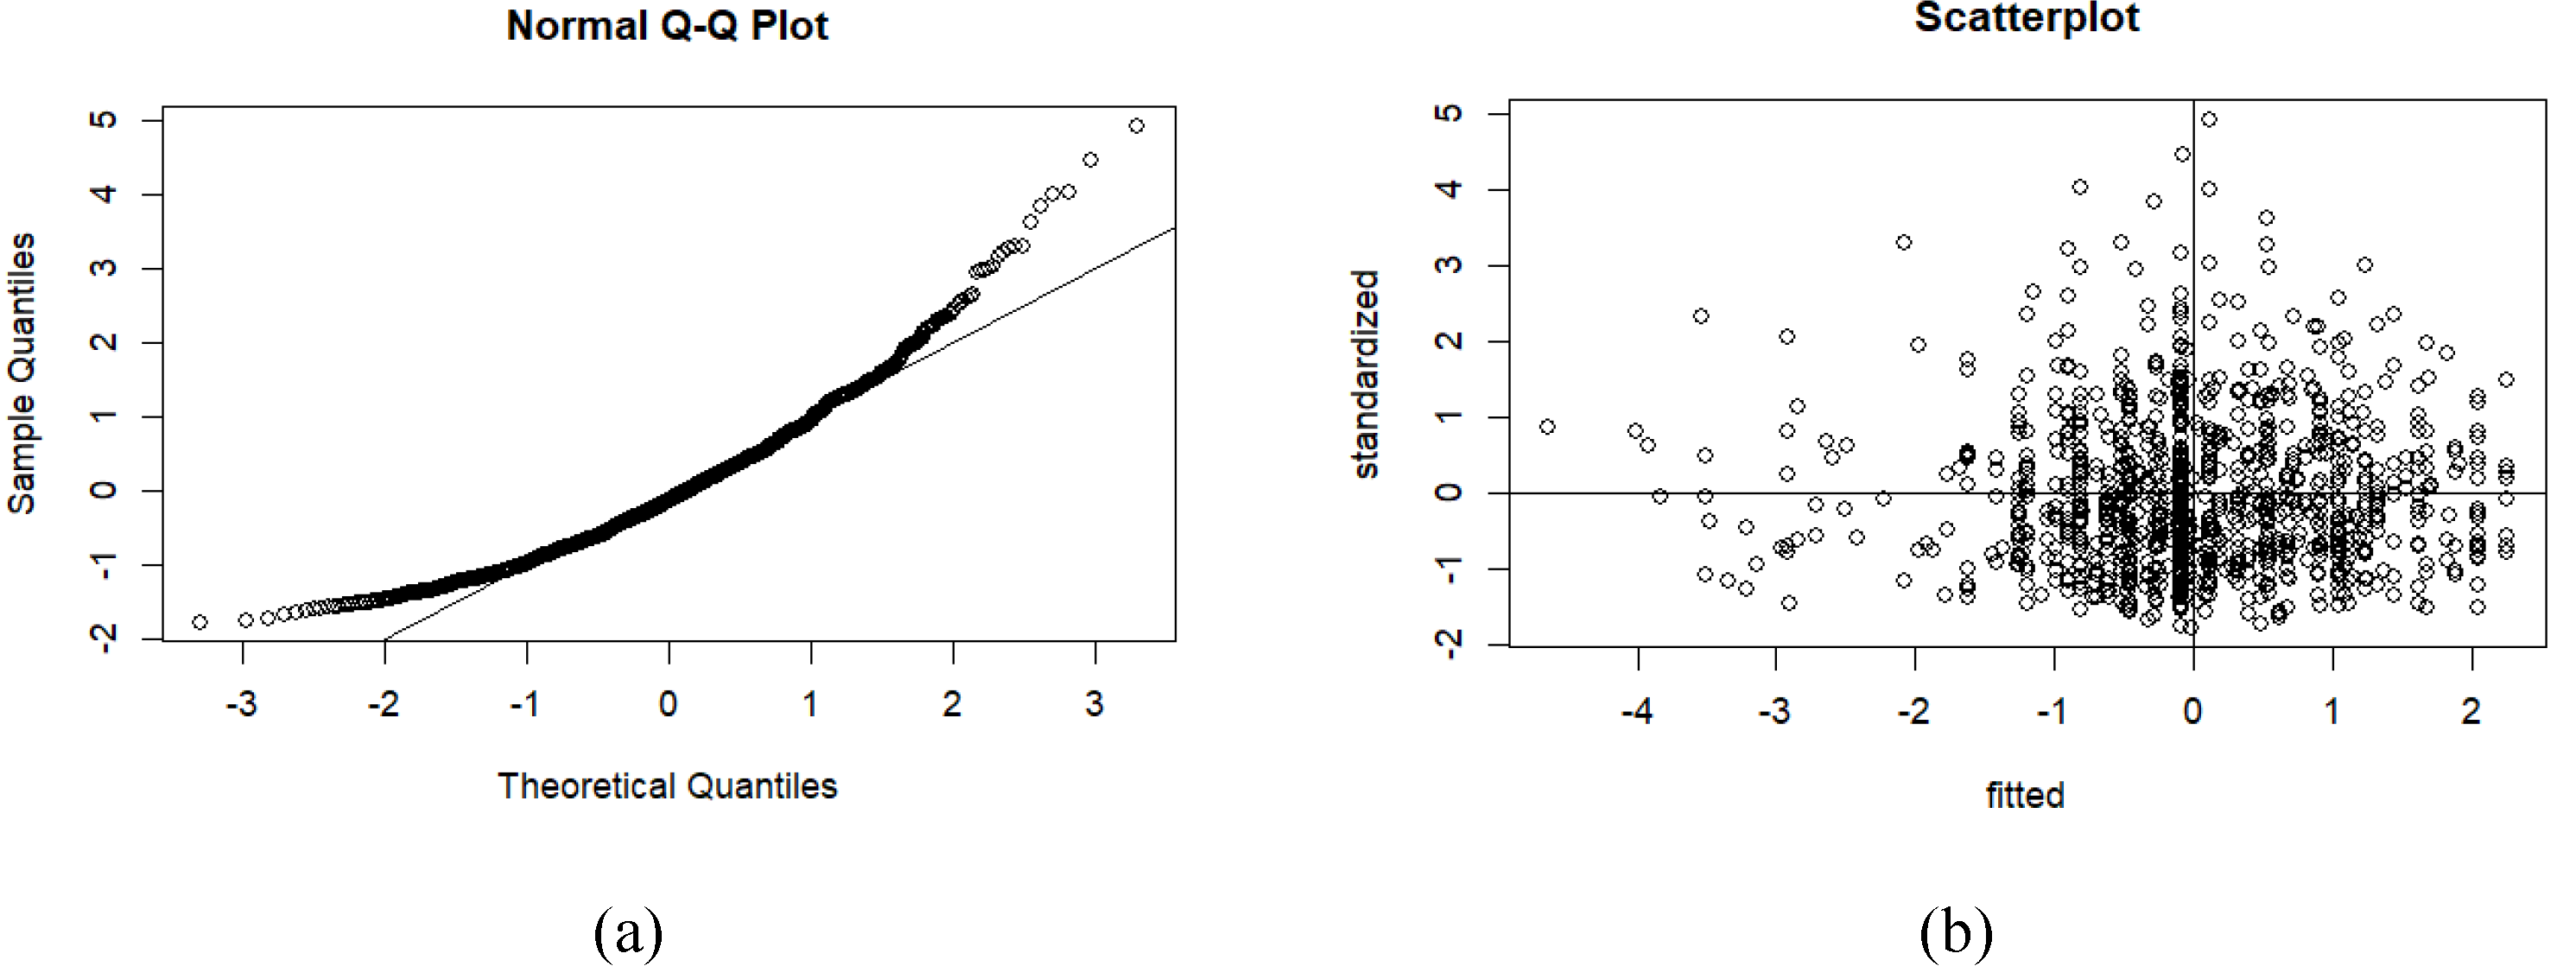
Figure 2.
Student grades for each level.
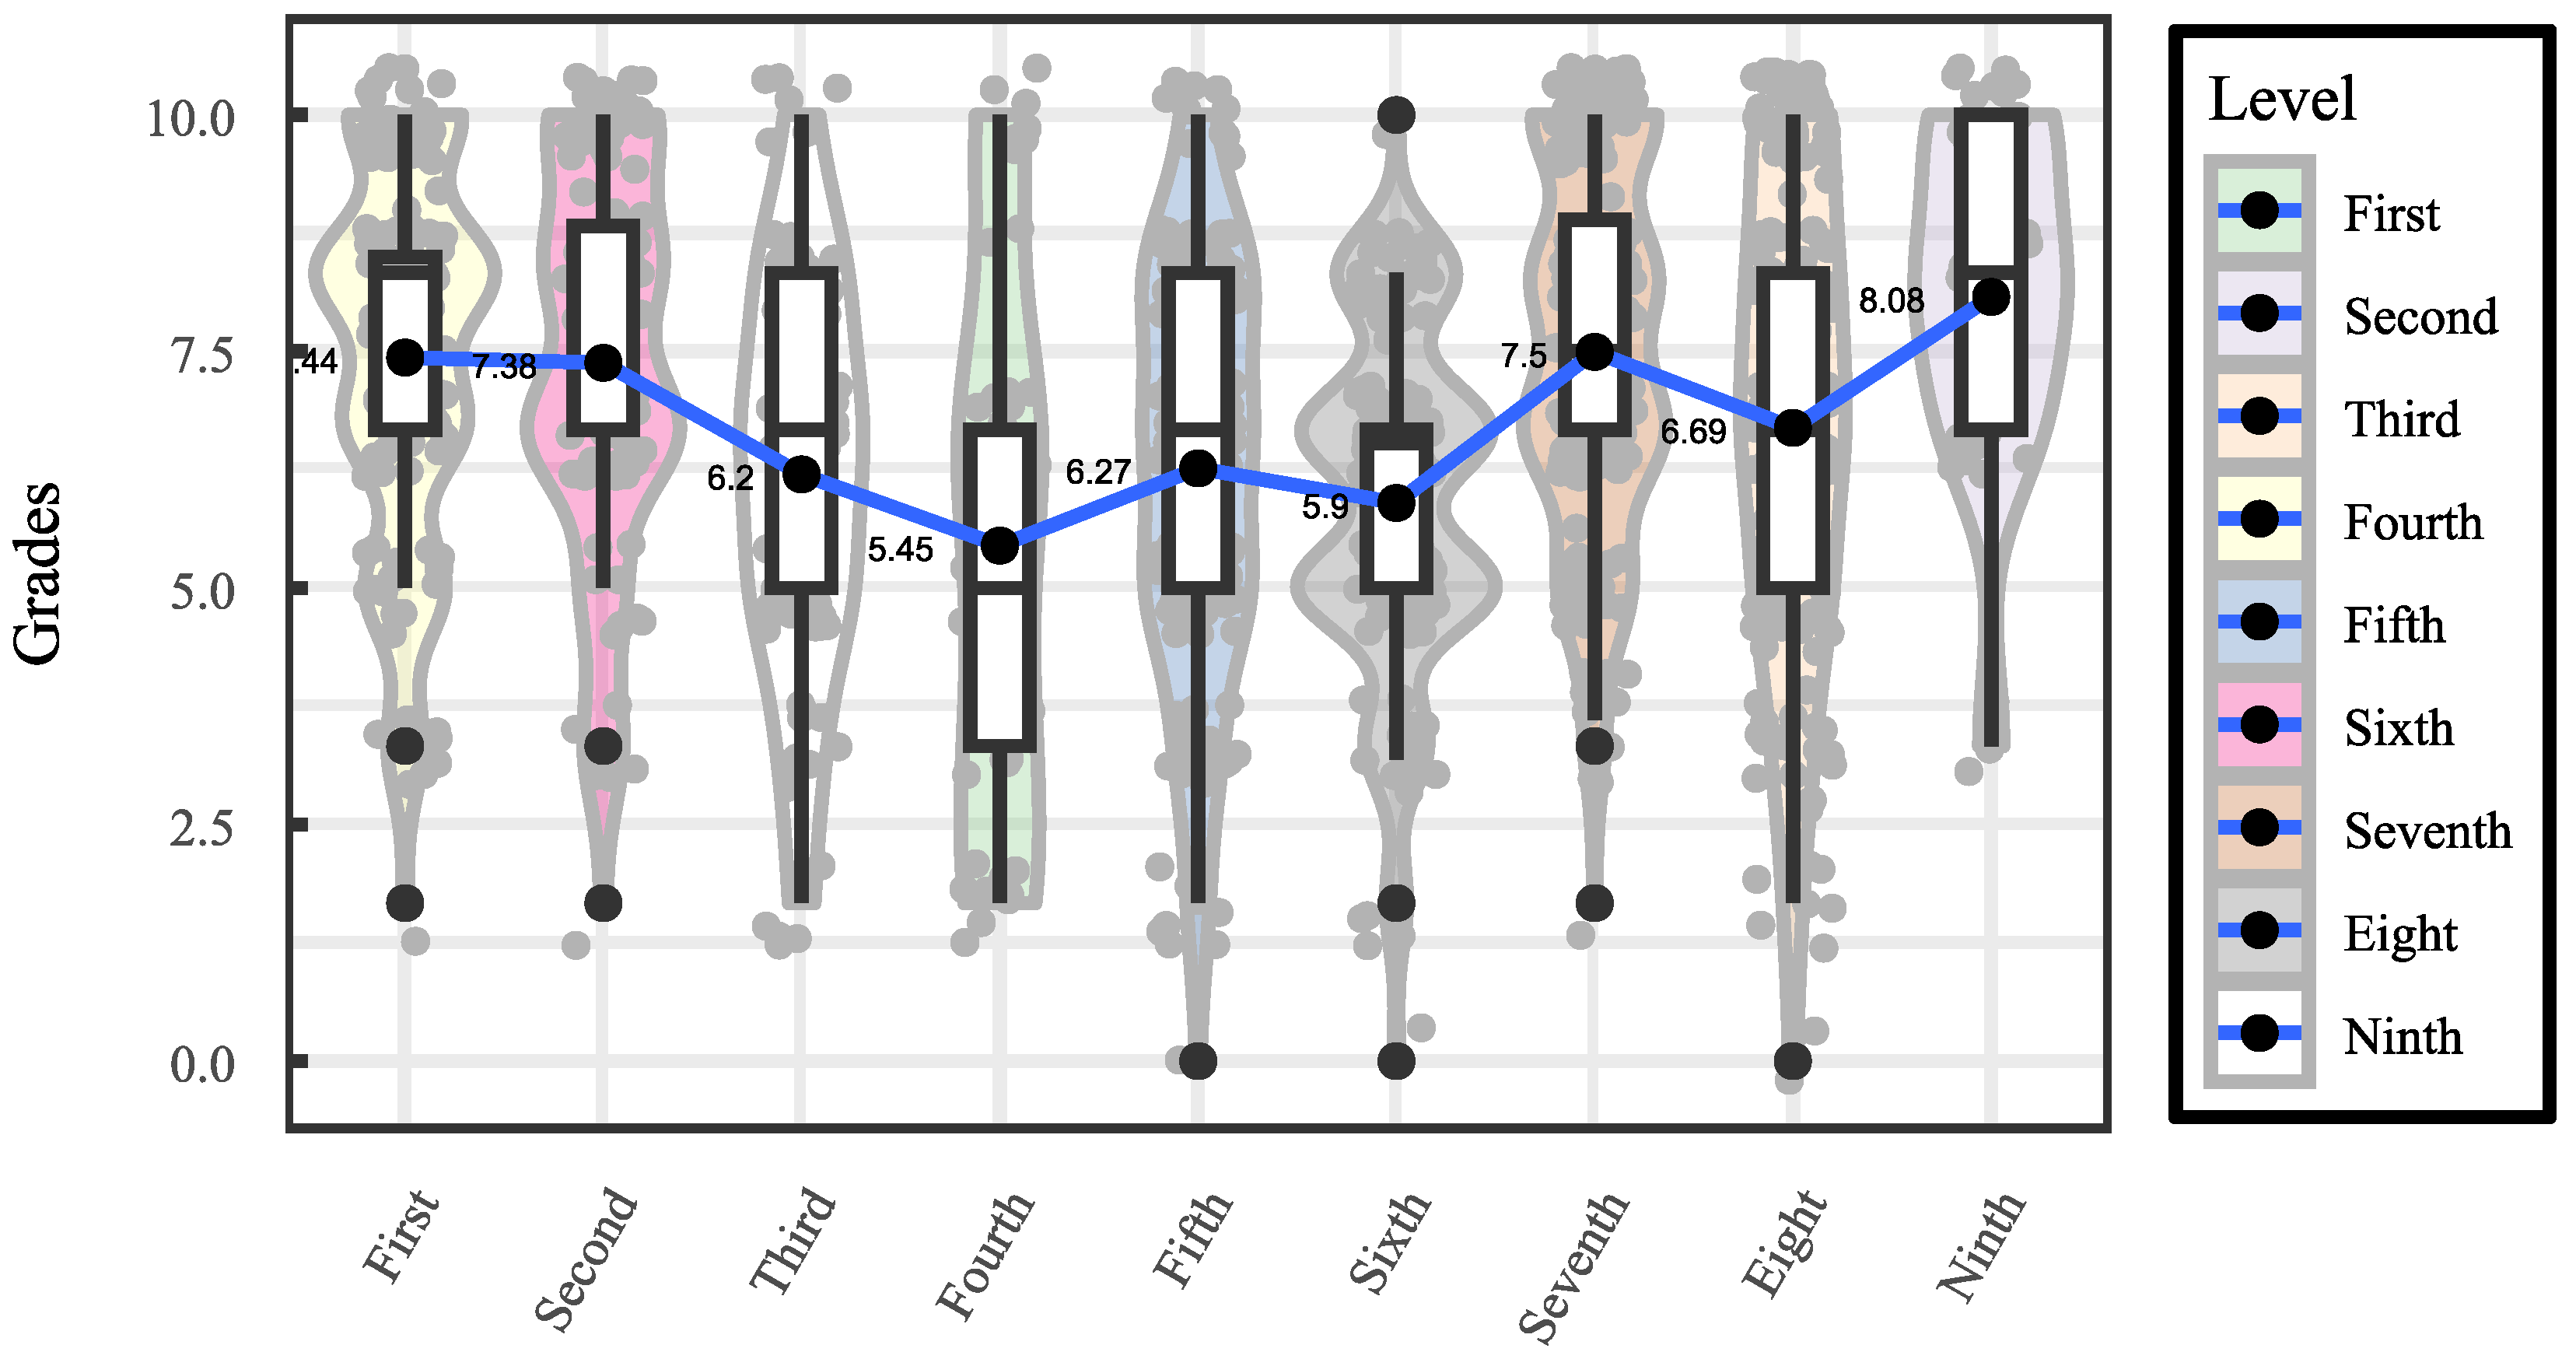
Figure 3.
Student grades for second-level subjects.
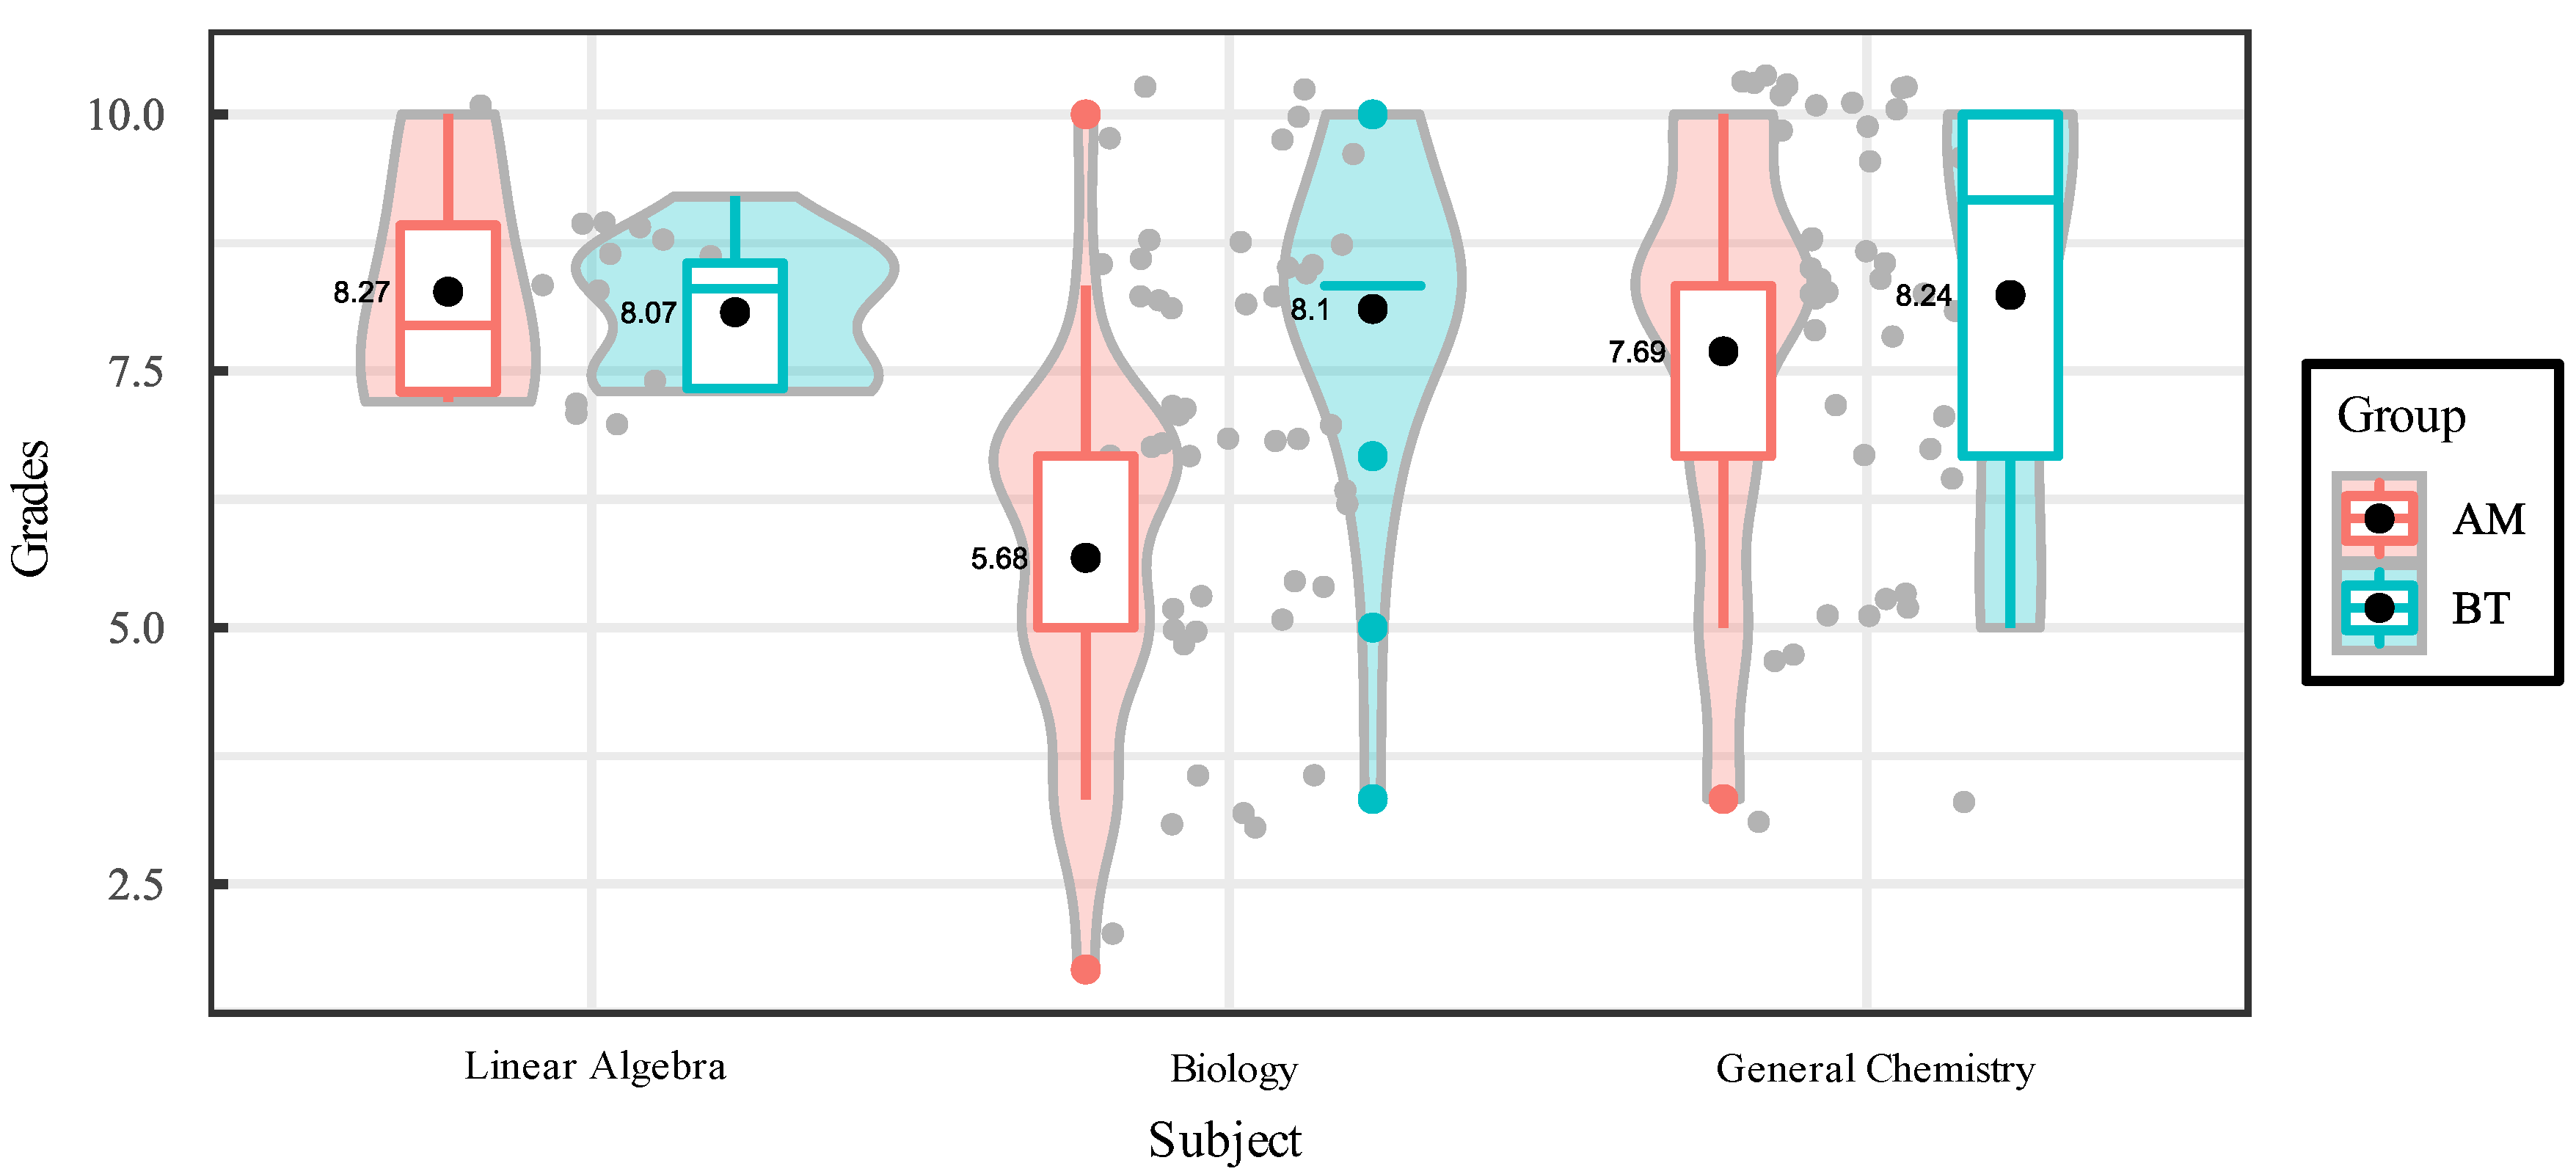
Figure 4.
Student grades for second-level subjects.
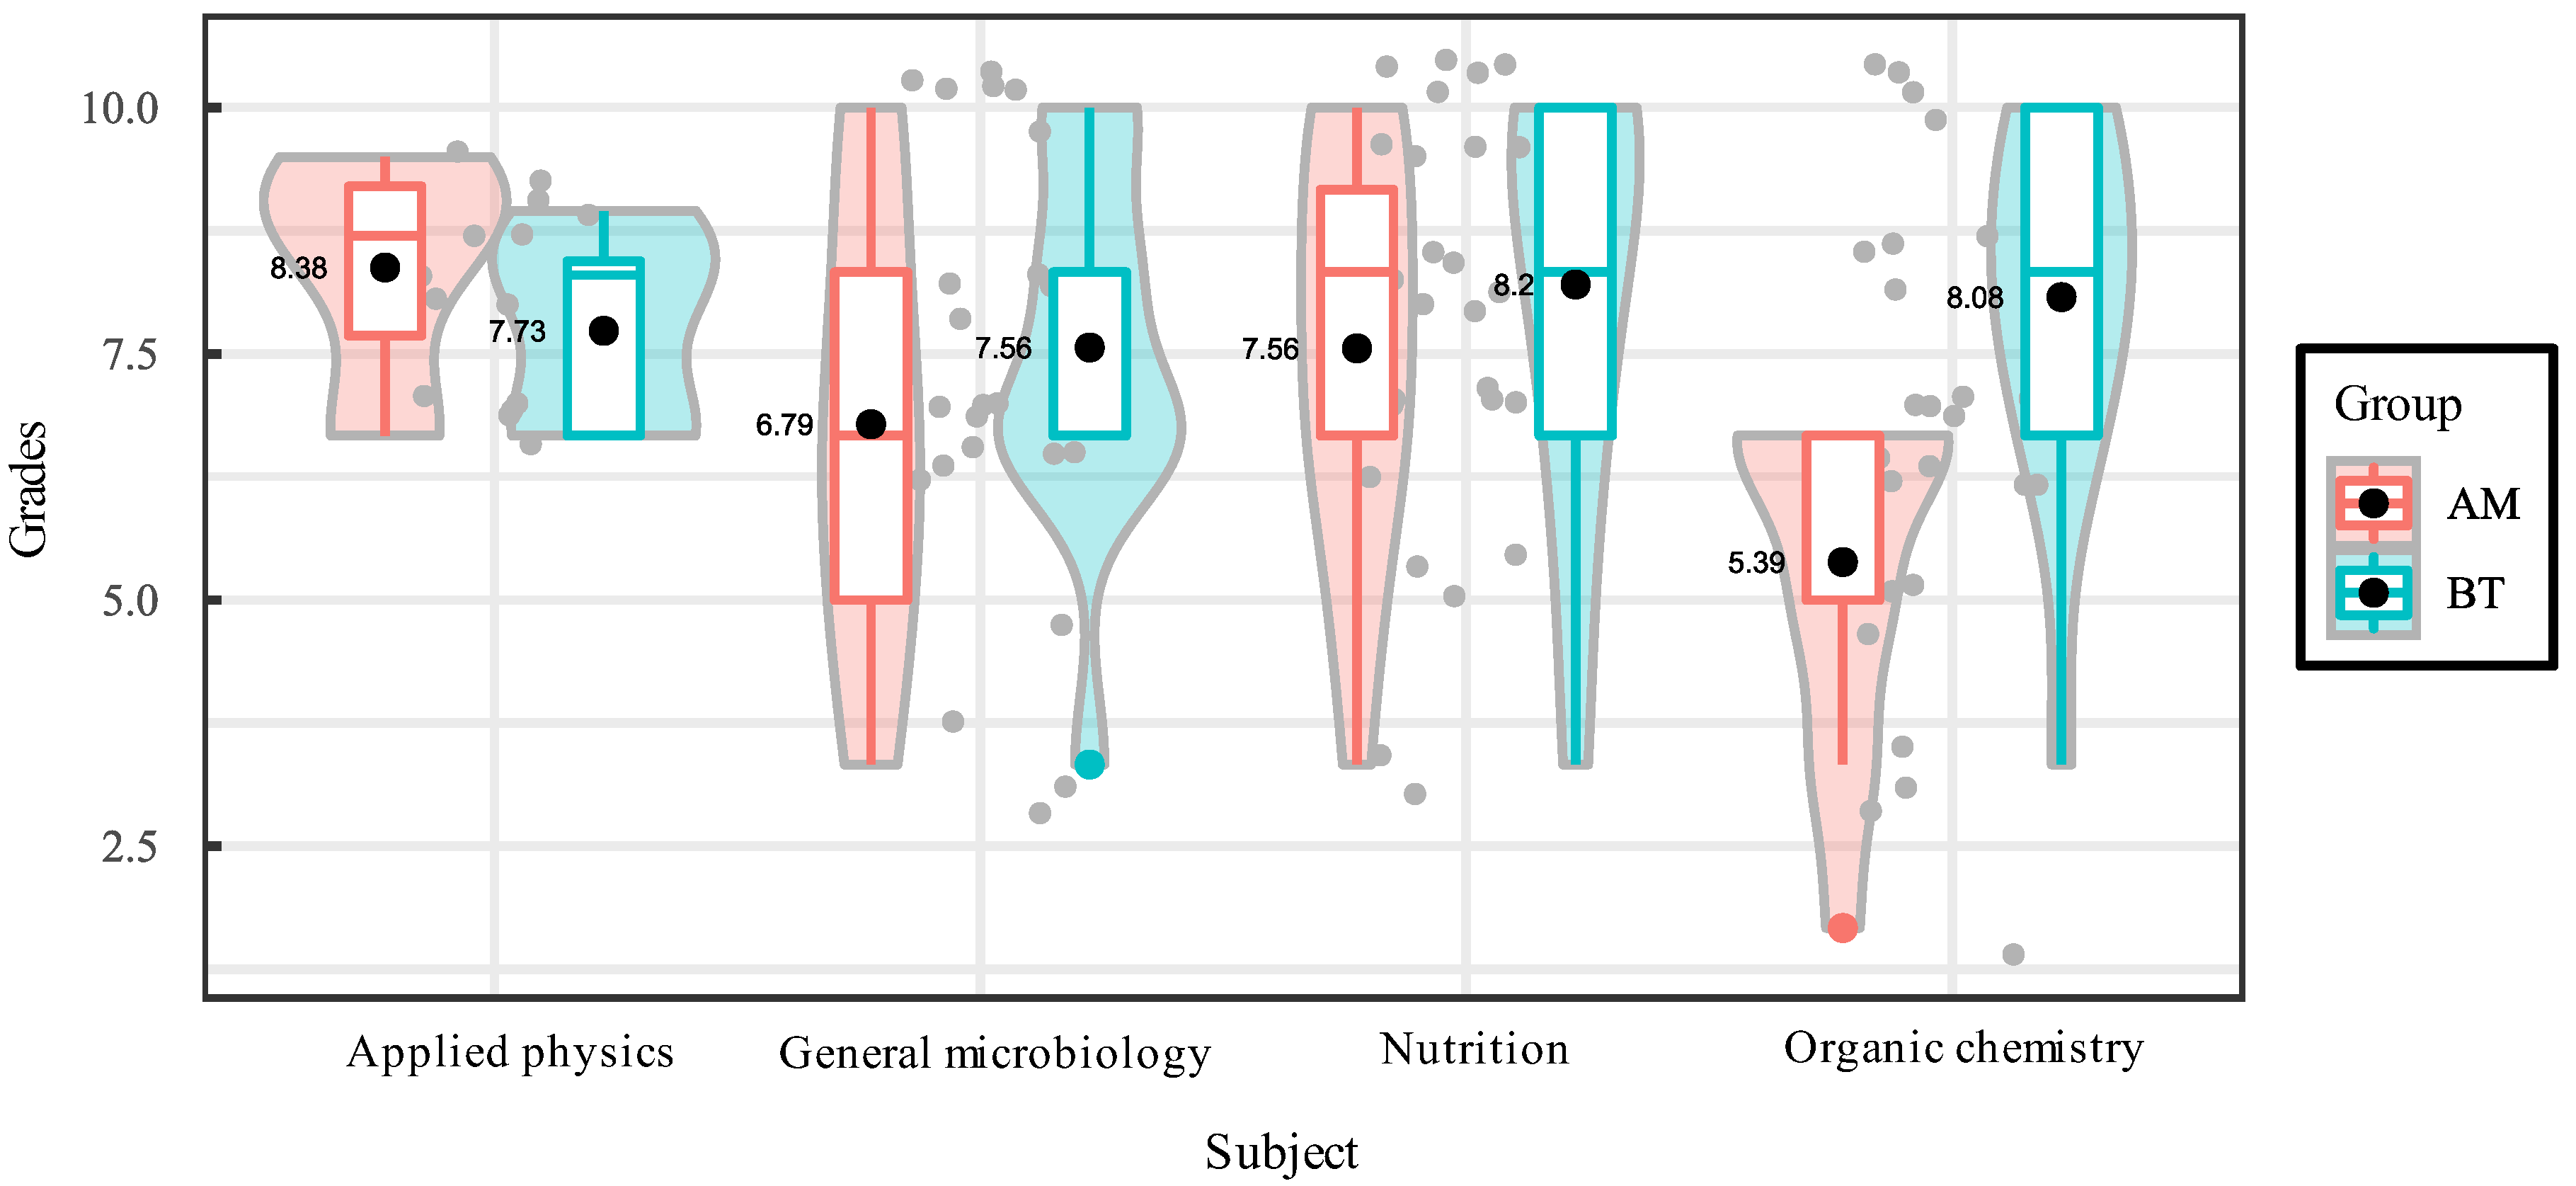
Figure 5.
Student grades for third-level subjects.
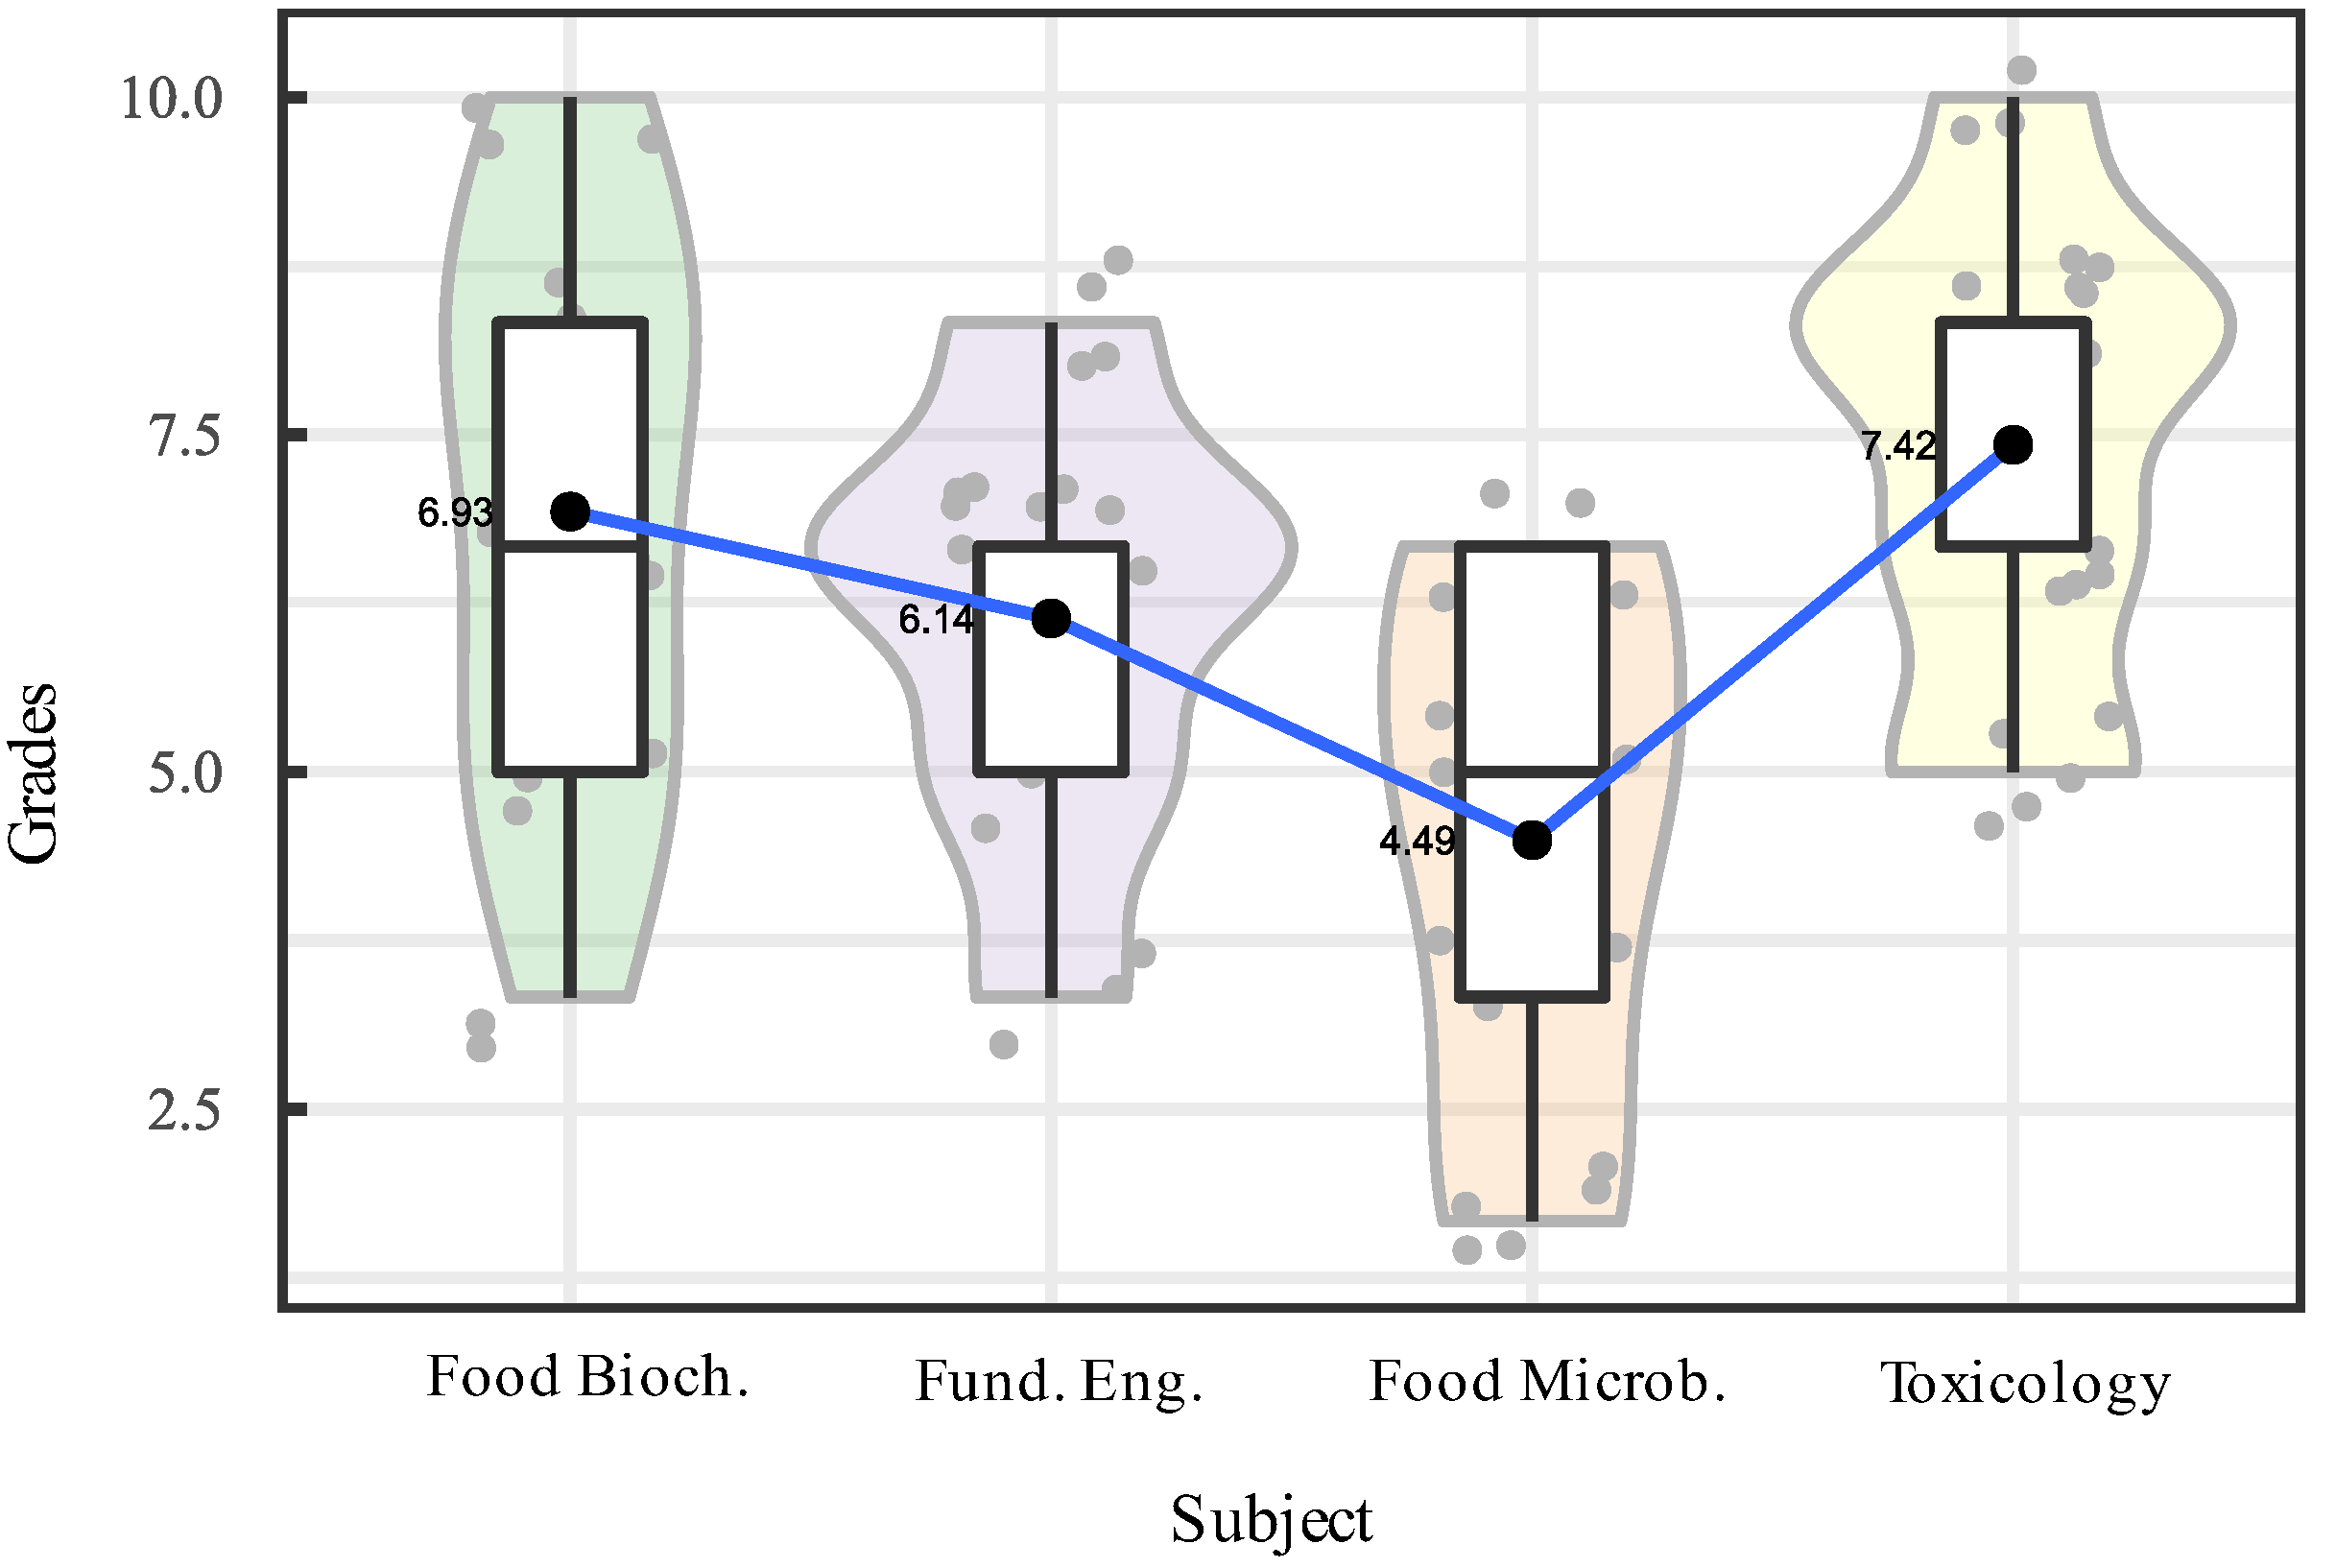
Figure 6.
Student grades for fourth-level subjects.
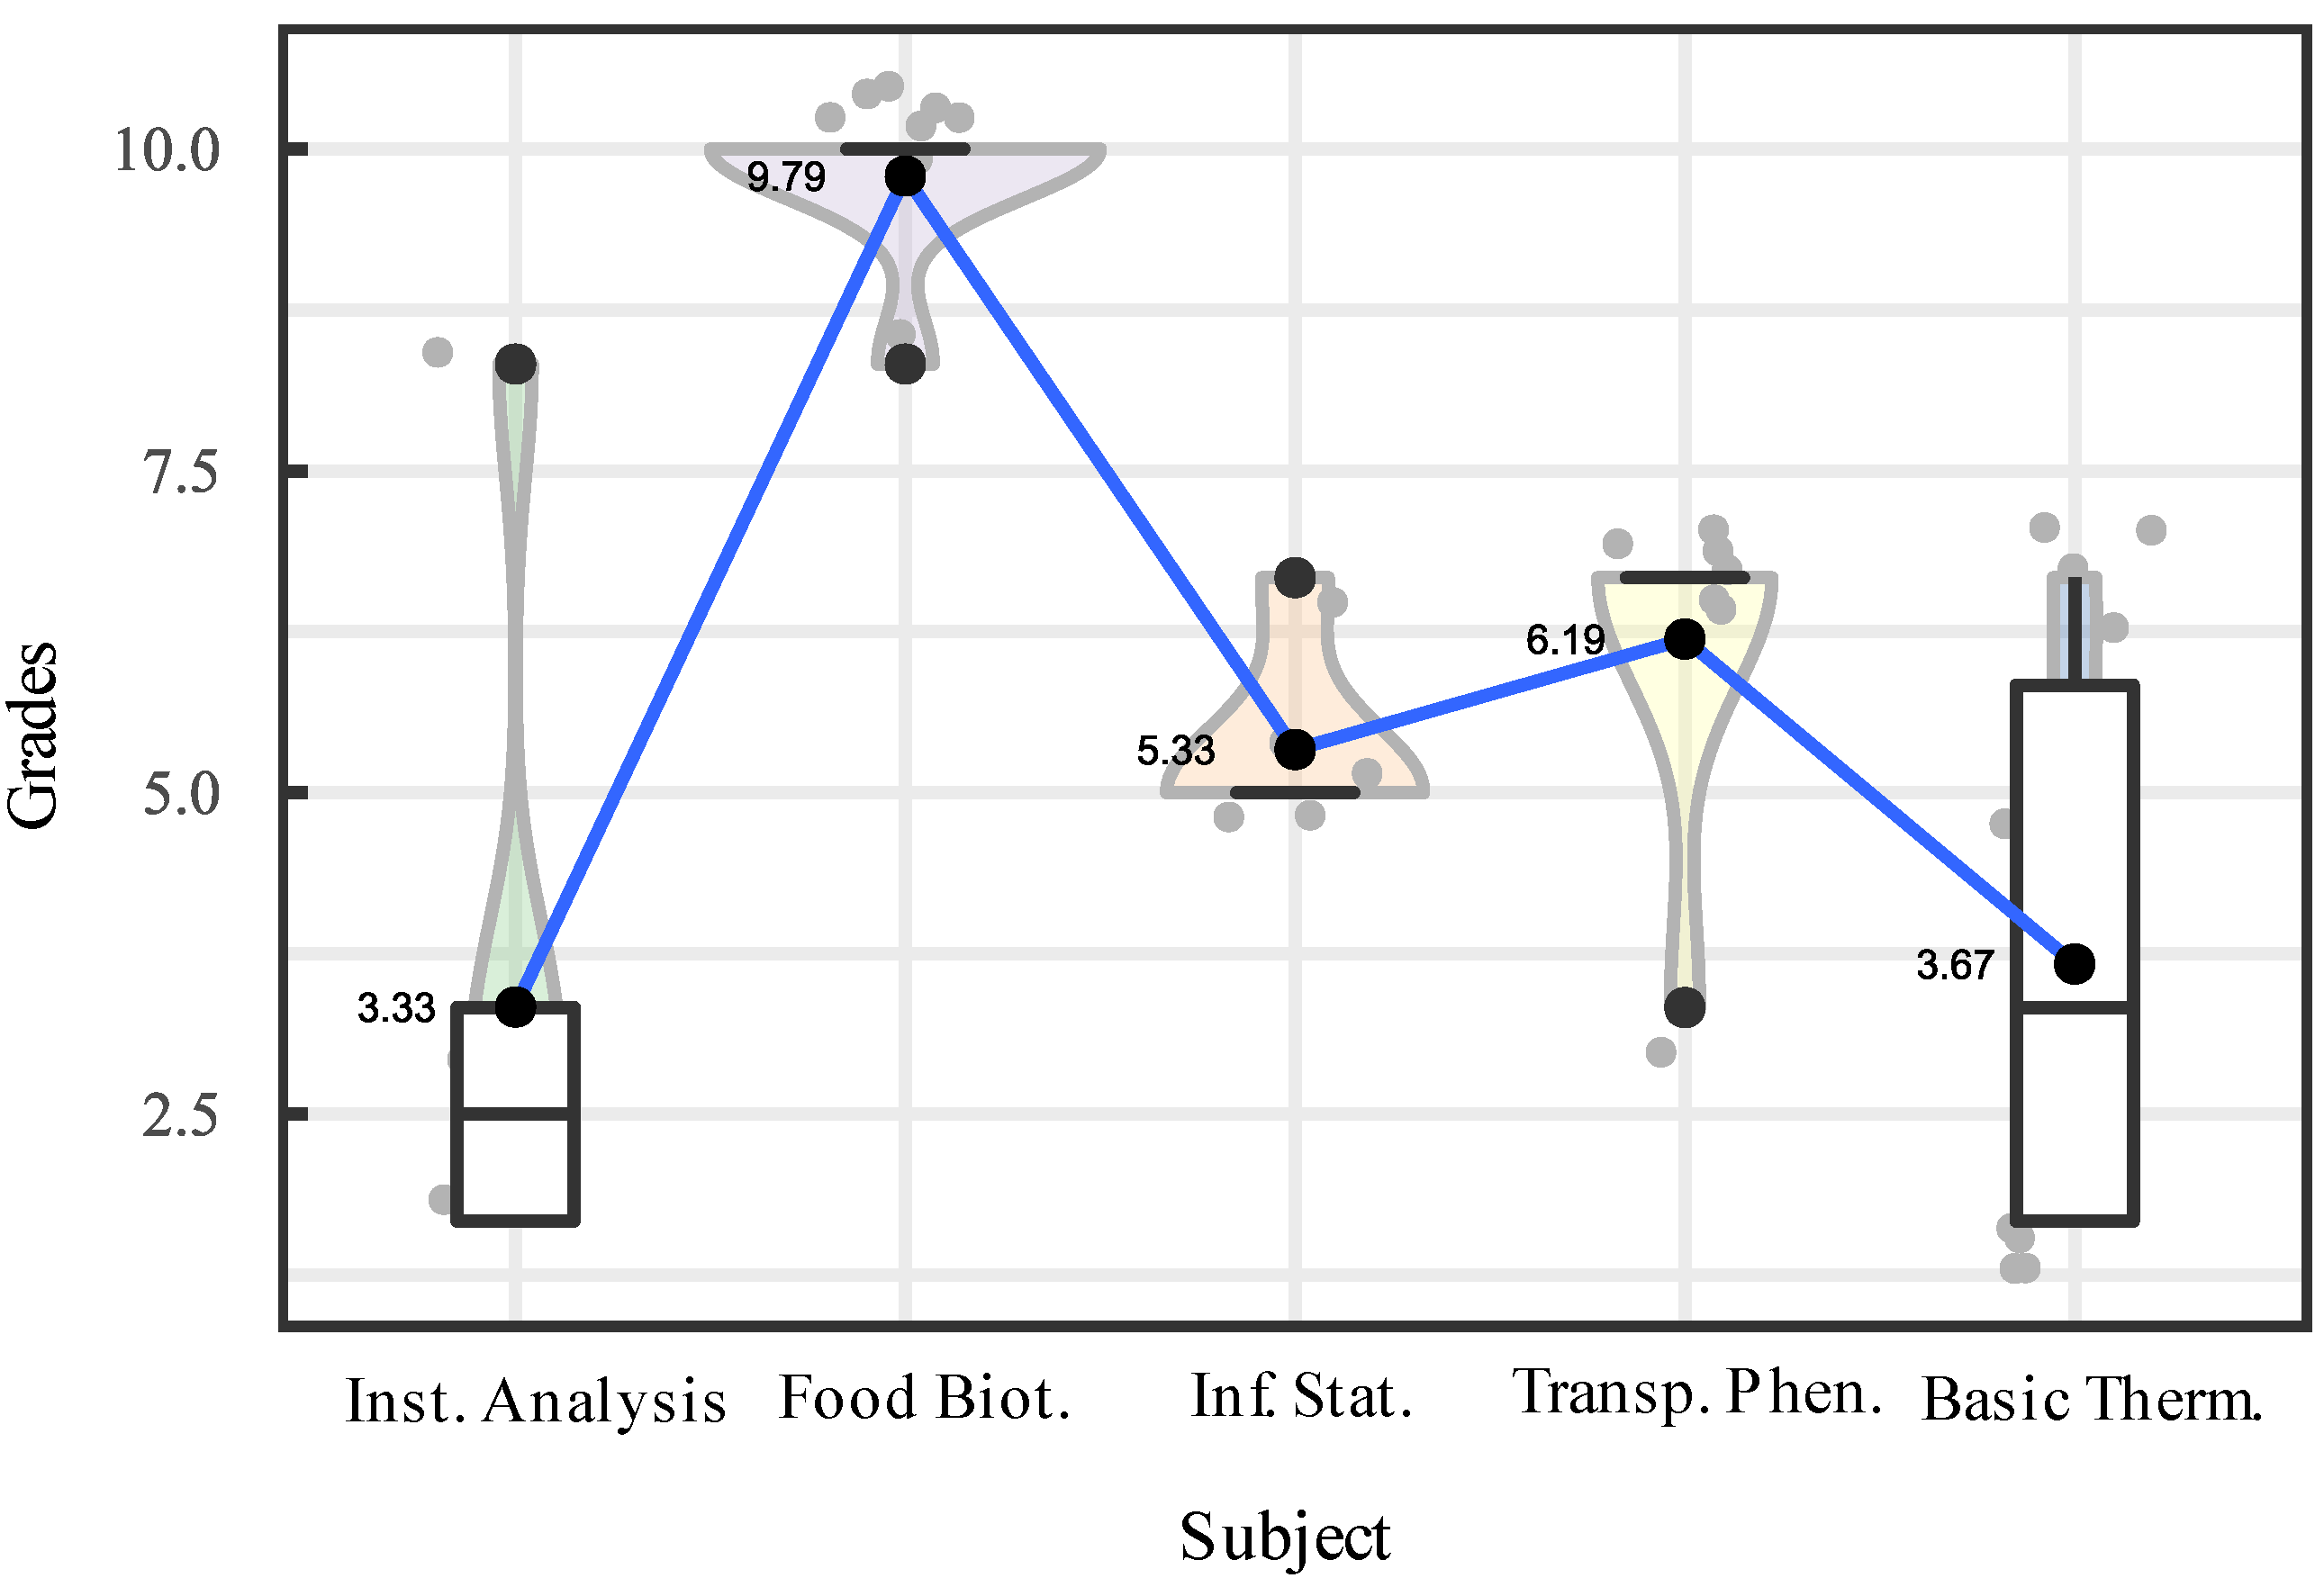
Figure 7.
Student grades for fifth-level subjects.
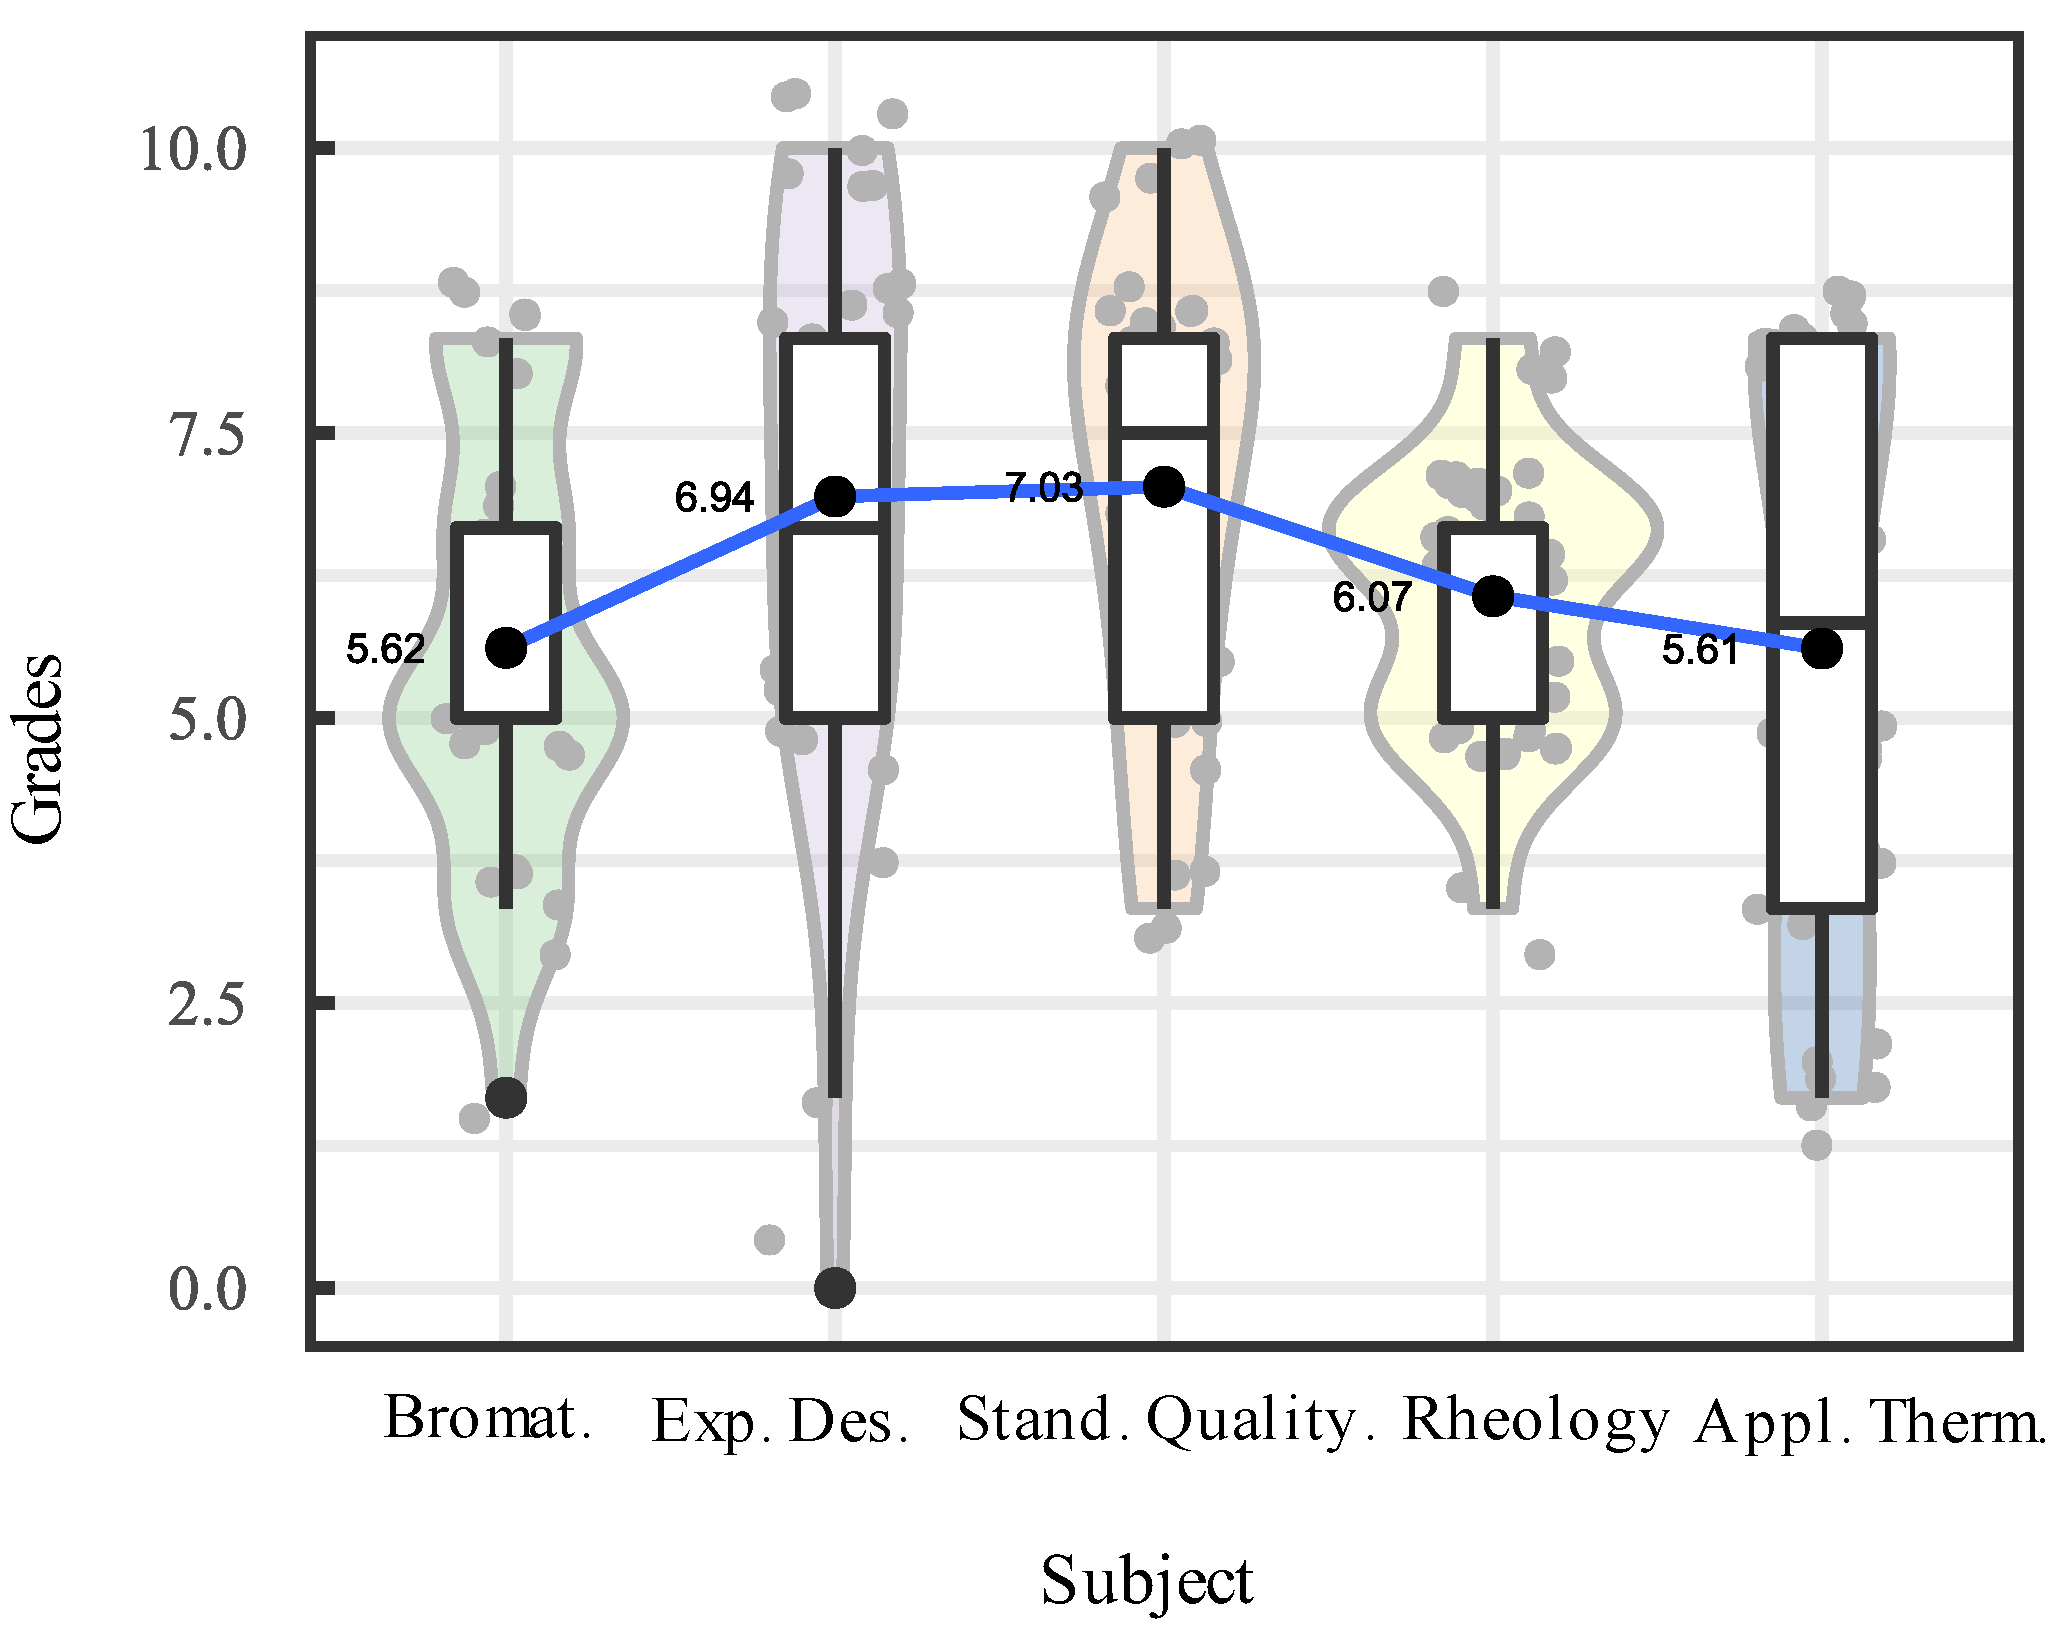
Figure 8.
Student grades for sixth-level subjects.
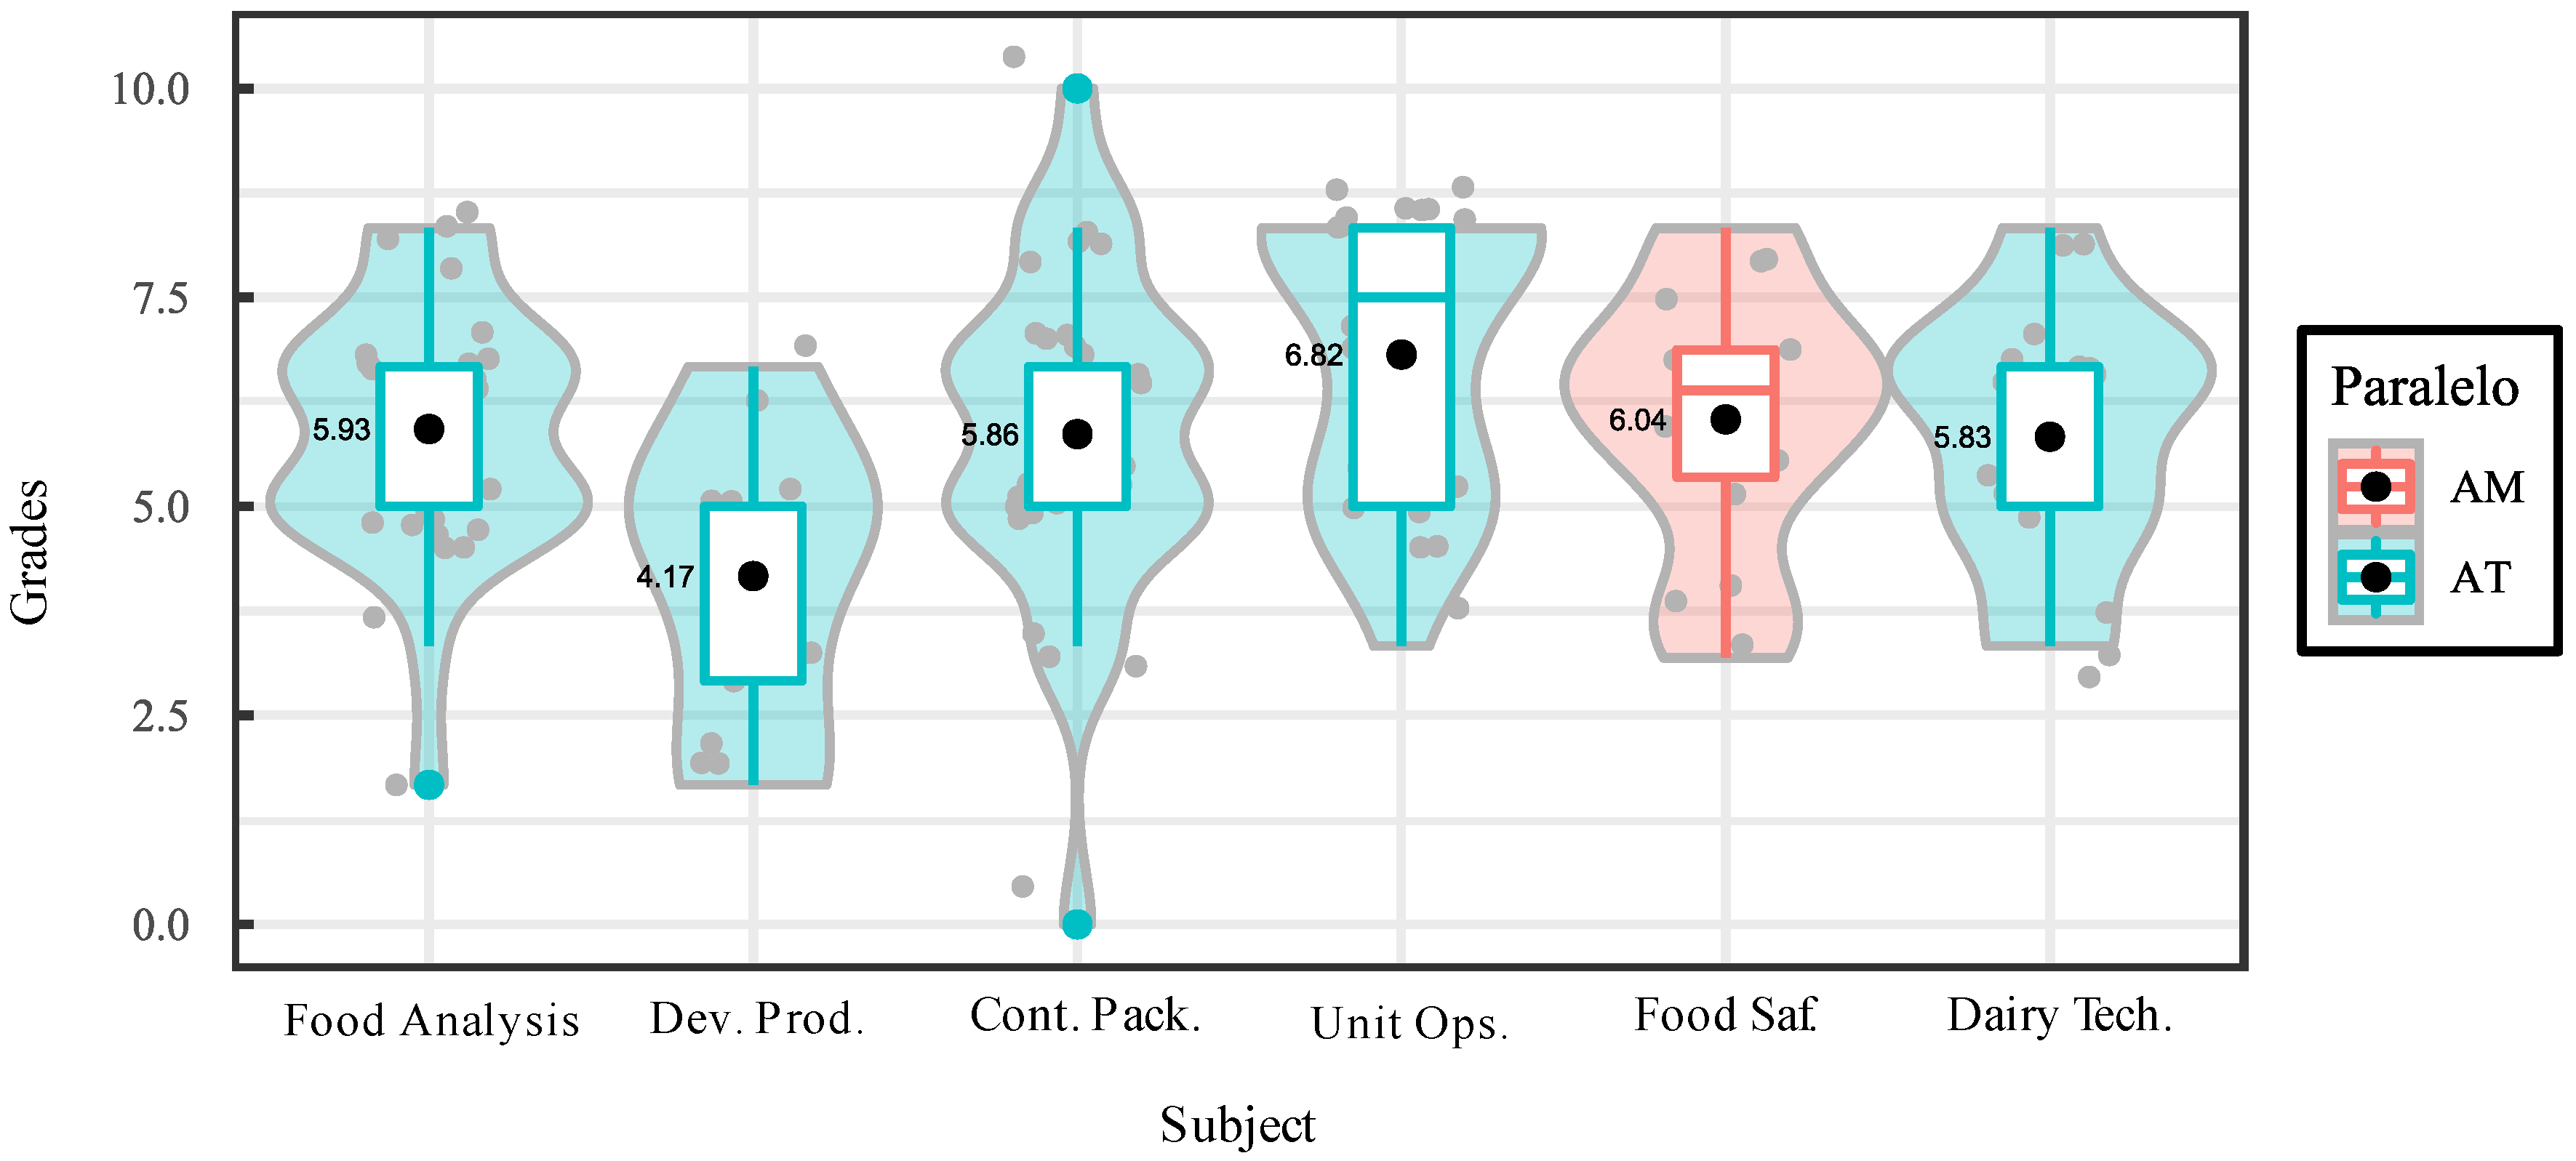
Figure 9.
Student grades for seventh-level subjects.
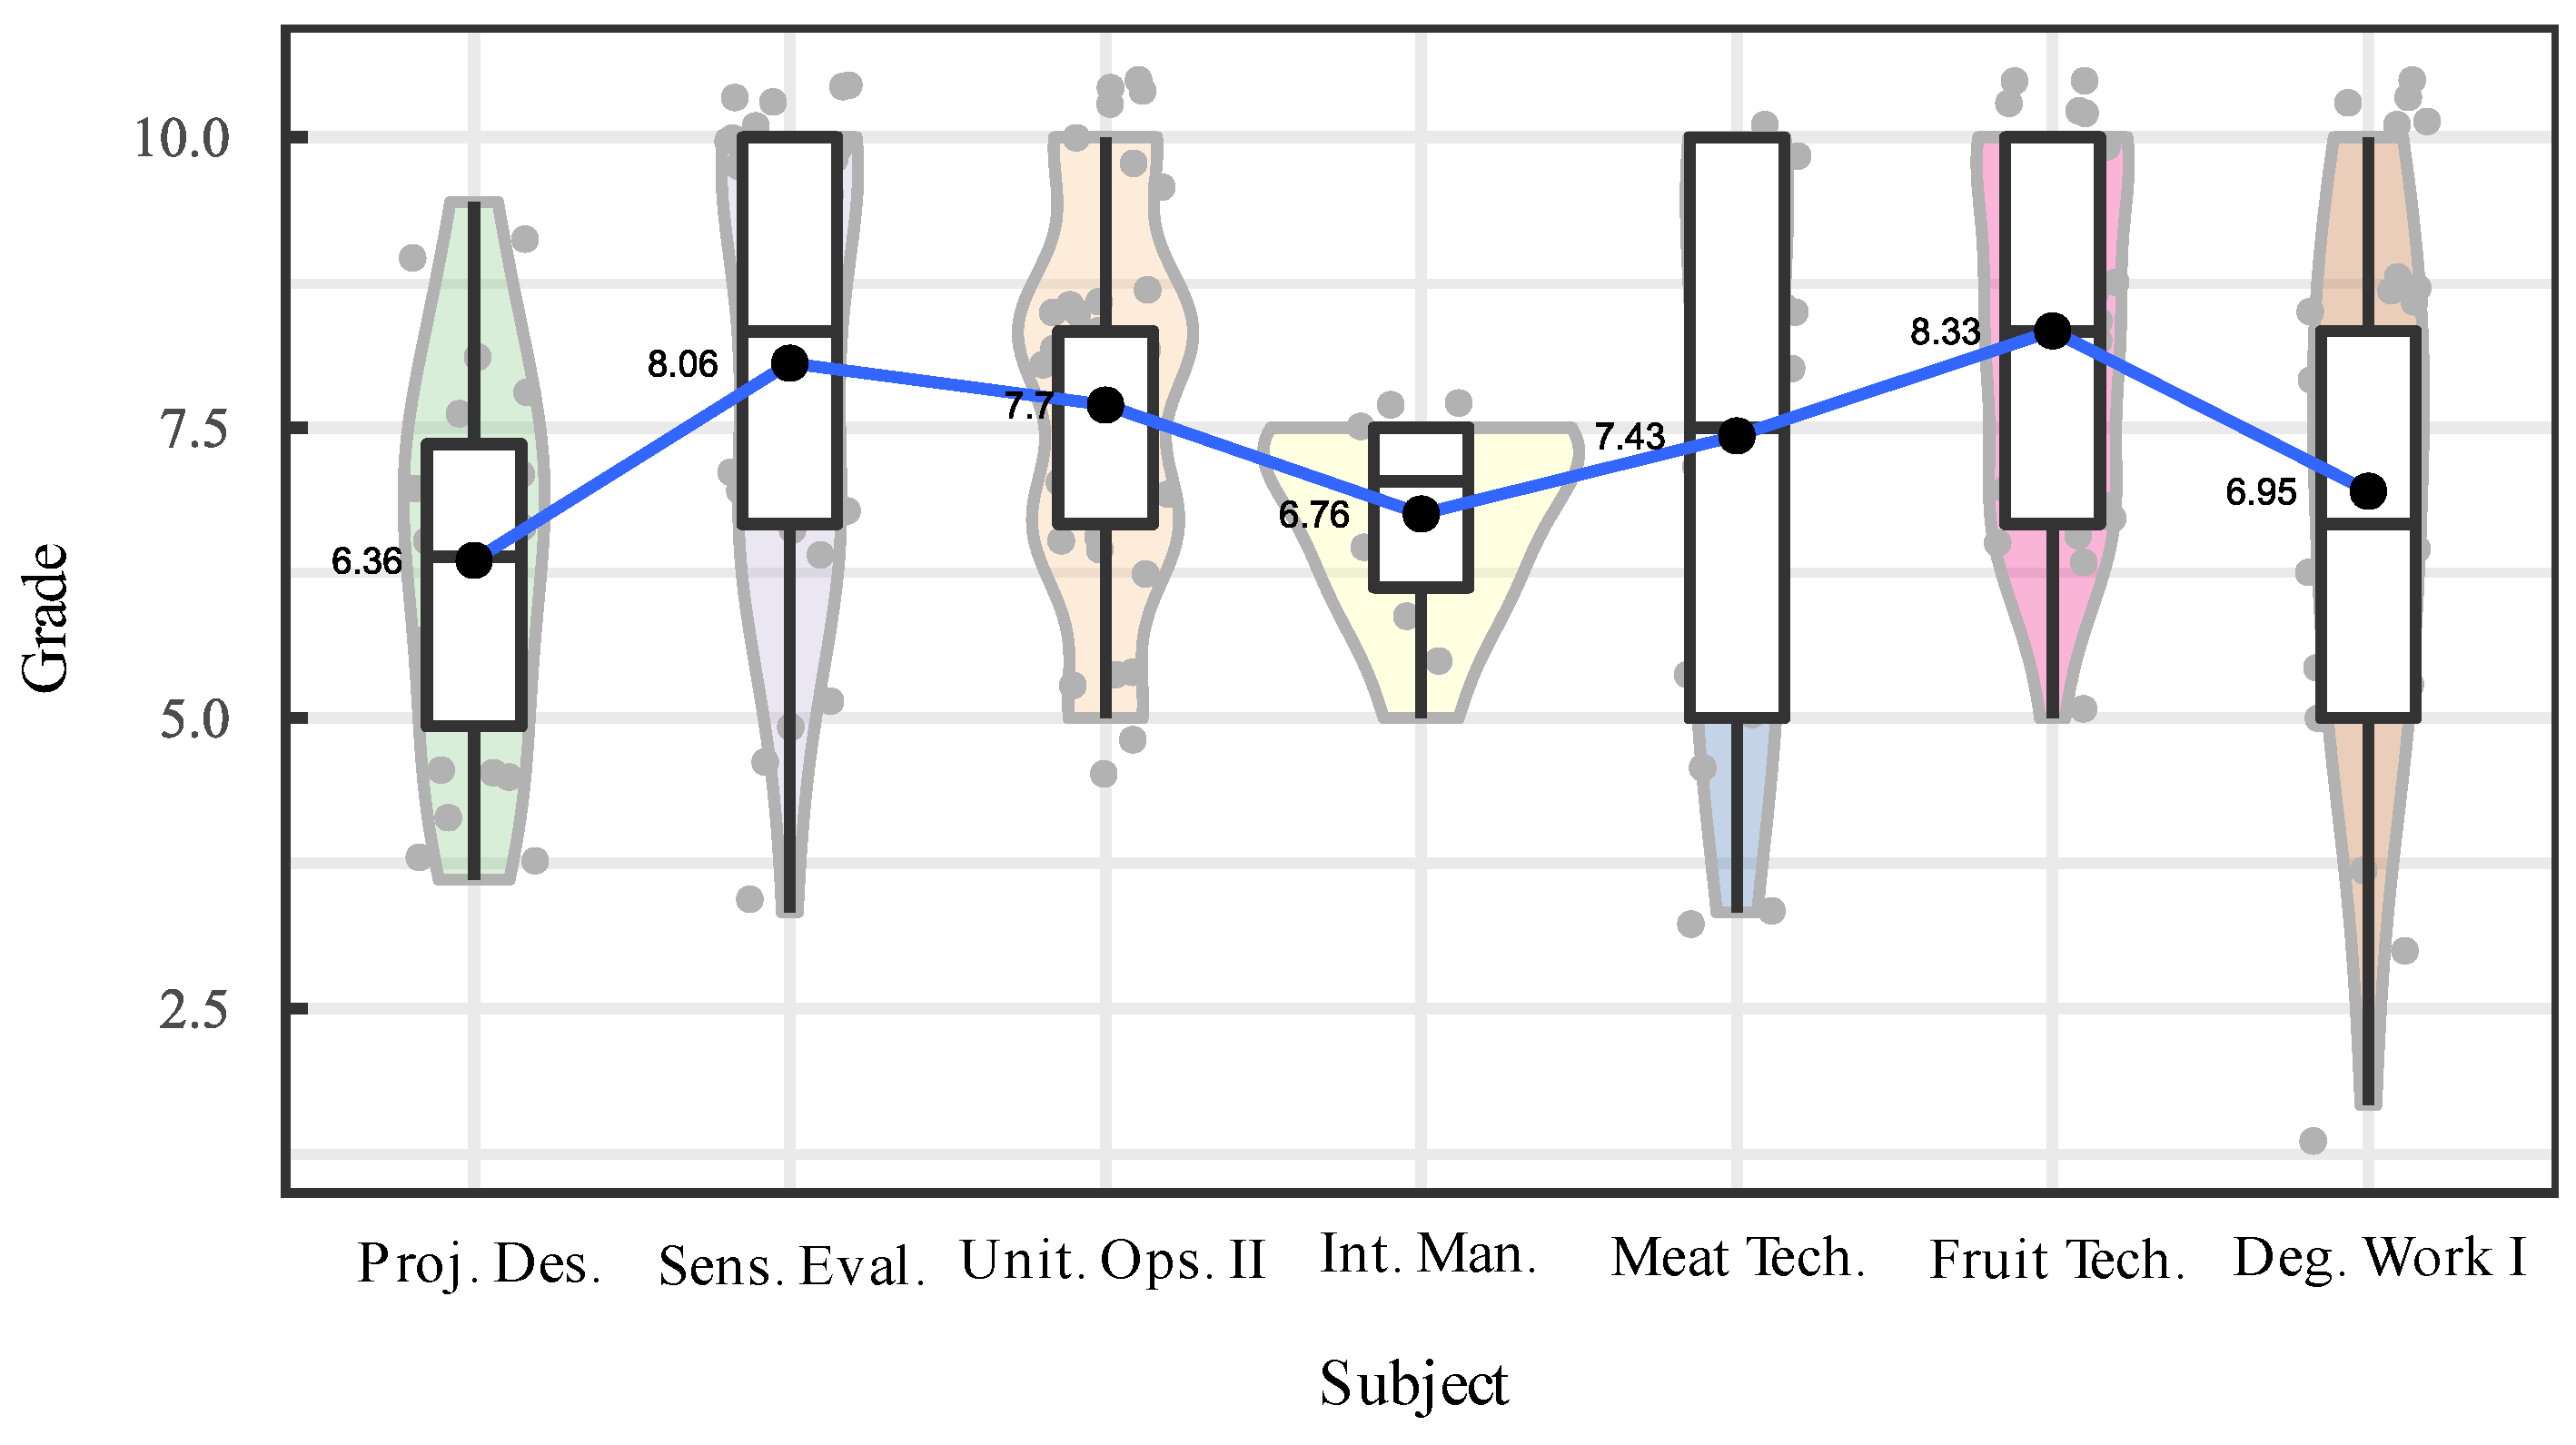
Table 1.
Subjects considered in the evaluation of the learning achievements of the food career in the period 2022A.
Table 1.
Subjects considered in the evaluation of the learning achievements of the food career in the period 2022A.
| First Level | Second Level | Third Level | Fourth Level | Fifth Level | |||||
|---|---|---|---|---|---|---|---|---|---|
| Code | Subject | Code | Subject | Code | Subject | Code | Subject | Code | Subject |
| A11 | Linear Algebra | A21 | Applied Physics | A31 | Food Biochemistry | A41 | Instrumental analysis | A51 | Bromatology |
| À12 | Biology | A22 | General Microbiology | A32 | Engineering Fundamentals | A42 | Food Biotechnology | A52 | Experimental Design |
| A13 | General Chemistry | A23 | Nutrition | A33 | Food Microbiology | A43 | Inferential statistics | A53 | Standardization and Quality Assurance |
| A24 | Organic Chemistry | A34 | Toxicology | A44 | Transportation Phenomena | A54 | Rheology | ||
| A45 | Basic Thermodynamics | A55 | Applied Thermodynamics | ||||||
| Sixth Level | Seventh Level | Eight Level | Ninth Level | ||||||
| Code | Subject | Code | Subject | Code | Subject | Code | Subject | ||
| A61 | Food Safety and Management Systems | A71 | Project Design and Evaluation | A81 | Human Talent Management | A91 | Design and Organization of Industrial Plants | ||
| A62 | Development of New Products | A72 | Sensory Evaluation | A82 | Audit of Quality and Safety Systems | A92 | Degree Work III | ||
| A63 | Containers and Packaging | A73 | Unit Operations II | A83 | Process and Food Engineering | ||||
| A64 | Unit Operations | A74 | Integrated Management Systems | A84 | Optimization of Processes and Operations | ||||
| A65 | Dairy Technology | A75 | Fruit and Vegetable Technology | A85 | Sugar Technology | ||||
| A76 | Meat Products Technology | A86 | Cereal Technology | ||||||
| A77 | Degree Work I | A87 | Degree Work II | ||||||
Table 2.
Descriptive statistics of students' grades.
| Mean | 6,810 | Variance | 4,980 | Maximum | 10,000 |
| Median | 6,670 | Standard Deviation | 2,230 | Q3 | 8,330 |
| Mode | 6,670 | Range | 10,000 | Median | 6,670 |
| Trimmed mean | 6.91 | Interquartile range | 3,330 | Q1 | 5,000 |
| Bias | -0.45 | Coeff . of variation | 32,770 | 5% quantile | 3,330 |
| Kurtosis | -0.30 | Standard error | 0.070 | Minimum | 0.000 |
Table 3.
Descriptive Statistics by Level.
| Level | Mean | Median | Mode | Trimmed mean | Std. deviation | Coeff. of variation | Bias | Kurtosis |
|---|---|---|---|---|---|---|---|---|
| First | 7.44 | 8.33 | 8.33 | 7.33 | 2.00 | 26.91 | -0.60 | -0.27 |
| Second | 7.38 | 6.67 | 6.67 | 7.47 | 2.07 | 28.06 | -0.54 | -0.31 |
| Third | 6.20 | 6.67 | 6.67 | 6.24 | 2.13 | 34.40 | -0.25 | -0.42 |
| Room | 5.45 | 5.00 | 6.67 | 5.41 | 2.91 | 53.43 | 0.19 | -1.16 |
| Fifth | 6.27 | 6.67 | 8.33 | 6.32 | 2.20 | 35.06 | -0.36 | -0.39 |
| Sixth | 5.90 | 6.53 | 5.00 | 5.99 | 1.83 | 30.94 | -0.46 | 0.23 |
| Seventh | 7.50 | 7.50 | 10 | 7.59 | 1.94 | 25.92 | -0.35 | -0.56 |
| Eighth | 6.69 | 6.67 | 6.67 | 6.82 | 2.48 | 37.03 | -0.47 | -0.36 |
| Ninth | 8.08 | 8.33 | 8.33 | 8.22 | 1.80 | 22.31 | -1.05 | 1.21 |
Table 4.
Results of the difference tests for the grades obtained by the students in the second-level subjects.
Table 4.
Results of the difference tests for the grades obtained by the students in the second-level subjects.
| Kruskal-Wallis Test – Qualification ~ Subjects | |||||
| Kruskal Wallis χ2 | 11.081 | Degrees of freedom | 2 | p-value | 0.003925 Significant |
| Pairwise Dunn- Šidák Test | |||||
| Linear algebra | Biology | ||||
| Biology |
pval = 0.009 Significant |
||||
| General Chemistry |
pval = 1.000 Not significant |
|
|||
Table 5.
Descriptive statistics of students' grades in second level subjects.
| Subject | Mean | Median | Mode | Trimmed mean | Std. deviation | Coeff. of variation | Bias | Kurtosis |
|---|---|---|---|---|---|---|---|---|
| Linear Algebra | 8.12 | 8.30 | 7.33 | 8.12 | 0.80 | 9.91 | 0.67 | 0.03 |
| Biology | 6.77 | 6.67 | 6.67 | 6.81 | 2.08 | 30.74 | -0.32 | -0.43 |
| General Chemistry | 7.92 | 8.33 | 10 | 8.04 | 2.04 | 25.73 | -0.70 | -0.60 |
Table 6.
Results of the difference tests for the grades obtained by the students in the subjects of the second level.
Table 6.
Results of the difference tests for the grades obtained by the students in the subjects of the second level.
| Kruskal-Wallis Test – Qualification ~ Subjects | |||||
| Kruskal Wallis χ2 | 5.5123 | Degrees of freedom | 3 | p-value | 0.1304 Note significant |
| Pairwise Dunn- Šidák Test | |||||
| Applied Physic | General Microbiology | Nutrition | |||
| General Microbiology |
|
||||
| Nutrition |
|
|
|||
| Organic Chemistry |
|
|
|
||
Table 7.
Descriptive statistics of students' grades in second-level subjects.
| Subject | Mean | Median | Mode | Trimmed mean | Std. deviation | Coeff. of variation | Bias | Kurtosis |
|---|---|---|---|---|---|---|---|---|
| Applied Physic | 8.06 | 8.44 | 6.67 | 8.06 | 1.12 | 13.91 | -0.38 | -1.72 |
| General Microbiology | 7.16 | 6.67 | 6.67 | 7.20 | 2.11 | 29.45 | -0.24 | -0.66 |
| Nutrition | 7.86 | 8.33 | 10.00 | 7.95 | 2.12 | 26.99 | -0.70 | -0.48 |
| Organic Chemistry | 6.73 | 6.67 | 6.67 | 6.81 | 2.23 | 33.20 | -0.40 | -0.19 |
Table 8.
Results of the difference tests for the grades obtained by the students in the subjects of the third level.
Table 8.
Results of the difference tests for the grades obtained by the students in the subjects of the third level.
| Kruskal-Wallis Test – Qualification ~ Subjects | |||||
| Kruskal Wallis | Degrees of freedom | 3 | p-value | 5.581e-05 |
|
| Pairwise Dunn-Šidák Test | |||||
| Food Biochemistry | Engineering Fundamentals | Food Microbiology | |||
| Engineering Fundamentals |
|
||||
| Food Microbiology |
|
|
|||
| Toxicology |
|
|
|
||
Table 9.
Descriptive statistics of students' grades in third-level subjects.
| Subject | Mean | Median | Mode | Trimmed mean | Std. deviation | Coeff. of variation | Bias | Kurtosis |
|---|---|---|---|---|---|---|---|---|
| Food Biochemistry | 6.93 | 6.67 | 8.33 | 6.93 | 2.17 | 31.32 | -0.16 | -1.14 |
| Engineering Fundamentals | 6.14 | 6.67 | 6.67 | 6.17 | 1.58 | 25.69 | -0.40 | -0.52 |
| Food Microbiology | 4.49 | 5.00 | 5.00 | 4.42 | 1.91 | 42.49 | -0.33 | -1.29 |
| Toxicology | 7.42 | 8.33 | 8.33 | 7.42 | 1.68 | 22.68 | -0.17 | -1.02 |
Table 10.
Results of the difference tests for the grades obtained by the students in the subjects of the fourth level.
Table 10.
Results of the difference tests for the grades obtained by the students in the subjects of the fourth level.
| Kruskal-Wallis Test – Qualification ~ Subjects | ||||||
| Kruskal Wallis | Degrees of freedom | 4 | p-value | 4.613e-05 | ||
| Later – Dunn- Šidák | ||||||
| Instrumental analysis | Food Biotechnology | Inferential Statistics | Transport Phenomena | |||
| Food Biotechnology |
|
|||||
| Inferential Statistics |
|
|
||||
| Transport Phenomena |
|
|
|
|||
| Basic Thermodynamics |
|
|
|
|
||
Table 11.
Descriptive statistics of students' grades in fourth-level subjects.
| Subject | Mean | Median | Mode | Trimmed mean | Std. deviation | Coeff. of variation | Bias | Kurtosis |
|---|---|---|---|---|---|---|---|---|
| Instrumental analysis | 3.33 | 2.50 | 1.67 | 3.33 | 2.58 | 77.38 | 1.94 | 3.97 |
| Food Biotechnology | 9.79 | 10.00 | 10.00 | 9.79 | 0.59 | 6.03 | -2.83 | 8.00 |
| Inferential Statistics | 5.33 | 5.00 | 5.00 | 5.33 | 0.75 | 14.00 | 2.24 | 5.00 |
| Transport Phenomena | 6.19 | 6.67 | 6.67 | 6.19 | 1.26 | 20.38 | -2.65 | 7.00 |
| Basic thermodynamics | 3.67 | 3.33 | 1.67 | 3.67 | 2.11 | 57.48 | 0.55 | -1.41 |
Table 12.
Results of the difference tests for the grades obtained by the students in the subjects of the fifth level.
Table 12.
Results of the difference tests for the grades obtained by the students in the subjects of the fifth level.
| Kruskal-Wallis Test – Qualification ~ Subjects | ||||||
| Kruskal Wallis | Degrees of freedom | 4 | p-value | 0.01684 | ||
| Posteriori – Dunn- Šidák test | ||||||
| Bromatology | Experimental design | Standardization and assurance of quality | Rheology | |||
| Experimental design |
|
|||||
| Standardization and quality assurance |
|
|
||||
| Rheology |
|
|
|
|||
| Applied Thermodynamics |
|
|
|
|
||
Table 13.
Descriptive statistics of students' grades in fifth-level subjects.
| Subject | Mean | Median | Mode | Trimmed mean | Std. deviation | Coeff. of variation | Bias | Kurtosis |
|---|---|---|---|---|---|---|---|---|
| Bromatology | 5.62 | 5.00 | 5.00 | 5.67 | 1.91 | 34.08 | 0.01 | -0.81 |
| Experimental design | 6.94 | 6.67 | 5.00 | 7.08 | 2.59 | 37.32 | -0.77 | 0.43 |
| Standardization and assurance of quality | 7.03 | 7.50 | 8.33 | 7.05 | 2.06 | 29.33 | -0.45 | -0.76 |
| Rheology | 6.07 | 6.67 | 6.67 | 6.08 | 1.24 | 20.41 | -0.12 | -0.14 |
| Applied Thermodynamics | 5.61 | 5.84 | 8.33 | 5.65 | 2.75 | 48.99 | -0.29 | -1.63 |
Table 14.
Results of the difference tests for the grades obtained by the students in the subjects of the sixth level.
Table 14.
Results of the difference tests for the grades obtained by the students in the subjects of the sixth level.
| Kruskal-Wallis Test – Qualification ~ Subjects | ||||||||||
| Kruskal Wallis χ2 | 14.474 | Degrees of freedom | 4 | p- value | 0.01286 Significant |
|||||
| Posteriori – Dunn- Šidák test | ||||||||||
| Food analysis | Development of new products | Containers and packaging | Unit Operations | Food safety systems | ||||||
| Development of new products |
|
|||||||||
| Containers and packaging |
|
|
||||||||
| Unit Operations |
|
|
|
|||||||
| Food safety systems |
|
|
|
|
||||||
| Dairy Technology |
|
|
|
|
|
|||||
Table 15.
Descriptive statistics of students' grades in sixth-level subjects.
| Subject | Mean | Median | Mode | Trimmed mean | Std. deviation | Coeff. of variation | Bias | Kurtosis |
|---|---|---|---|---|---|---|---|---|
| Food analysis | 5.93 | 6.67 | 5.00 | 6.00 | 1.56 | 26.25 | -0.48 | 0.91 |
| Development of new products | 4.17 | 5.00 | 5.00 | 4.17 | 1.81 | 43.47 | -0.25 | -1.13 |
| Containers and packaging | 5.86 | 6.67 | 5.00 | 5.93 | 2.03 | 34.70 | -0.60 | 1.58 |
| Unit Operations | 6.82 | 7.50 | 8.33 | 6.92 | 1.70 | 24.90 | -0.50 | -1.33 |
| Food safety systems | 6.04 | 6.39 | 6.39 | 6.04 | 1.62 | 26.76 | -0.42 | -0.56 |
| Dairy Technology | 5.83 | 6.67 | 6.67 | 5.83 | 1.54 | 26.40 | -0.26 | -0.61 |
Table 16.
Results of the difference tests for the grades obtained by the students in the subjects of the seventh level.
Table 16.
Results of the difference tests for the grades obtained by the students in the subjects of the seventh level.
| Kruskal-Wallis Test – Qualification ~ Subjects | |||||||
| Kruskal Wallis χ2 | 18.434 | Degrees of freedom | 6 | p- value | 0.005235 Significant |
||
| Posteriori – Dunn- Šidák test | |||||||
| Design and evaluation. of projects | AssessmentSensory | OperationsUnitary II | System ofIntegrated Management | Product Technology Meat | Frut Technologies . and Veg . | ||
| Sensory evaluation |
|
||||||
| Unitary Operations II |
|
|
|||||
| Integrated Management Systems |
|
|
|
||||
| Meat Products Technology |
|
|
|
|
|||
| Fruit and Vegetable Technologies |
|
|
|
|
|
||
| Degree Work I |
|
|
|
|
|
|
|
Table 17.
Descriptive statistics of students' grades in seventh-level subjects.
| Subject | Mean | Median | Mode | Trimmed mean | Std. deviation | Coeff. of variation | Bias | Kurtosis |
|---|---|---|---|---|---|---|---|---|
| Design and evaluation. of projects | 6.36 | 6.39 | 5.83 | 6.36 | 1.71 | 26.91 | -0.01 | -0.88 |
| Sensory evaluation | 8.06 | 8.33 | 10.00 | 8.15 | 1.95 | 24.21 | -0.58 | -0.63 |
| Unitary Operations II | 7.70 | 8.33 | 8.33 | 7.71 | 1.64 | 21.32 | -0.15 | -0.91 |
| Integrated Management Systems | 6.76 | 7.04 | 7.50 | 6.76 | 0.87 | 12.82 | -0.98 | 0.11 |
| Meat Products Technology | 7.43 | 7.50 | 10.00 | 7.50 | 2.30 | 31.01 | -0.28 | -1.25 |
| Fruit and Vegetable Technologies | 8.33 | 8.33 | 10.00 | 8.40 | 1.53 | 18.38 | -0.32 | -1.08 |
| Degree Work I | 6.95 | 6.67 | 8.33 | 7.04 | 2.23 | 32.06 | -0.43 | -0.36 |
Table 18.
Results of the difference tests for the grades obtained by the students in the subjects of the eighth level.
Table 18.
Results of the difference tests for the grades obtained by the students in the subjects of the eighth level.
| Kruskal-Wallis Test – Qualification ~ Subjects | ||||||||
| Kruskal Wallis χ2 | 18.434 | Degrees of freedom | 6 | p-value | 0.005235 Significant |
|||
| Posteriori – Dunn- Šidák test | ||||||||
| Design and evaluation. of projects | AssessmentSensory | OperationsUnitary II | System ofIntegrated Management | Product Technology Meat | Fruit and Vegetable Technologies | |||
| Sensory evaluation |
|
|||||||
| Unitary Operations II |
|
|
||||||
| Integrated Management Systems |
|
|
|
|||||
| Meat Products Technology |
|
|
|
|
||||
| Fruit and Vegetable Technologies |
|
|
|
|
|
|||
| Degree Work I |
|
|
|
|
|
|
||
Table 19.
Descriptive statistics of students' grades in eight-level subjects.
| Subject | Mean | Median | Mode | Trimmed mean | Std. deviation | Coeff. of variation | Bias | Kurtosis |
|---|---|---|---|---|---|---|---|---|
| Design and evaluation. of projects | 6.36 | 6.39 | 5.83 | 6.36 | 1.71 | 26.91 | -0.01 | -0.88 |
| Sensory evaluation | 8.06 | 8.33 | 10.00 | 8.15 | 1.95 | 24.21 | -0.58 | -0.63 |
| Unitary Operations II | 7.70 | 8.33 | 8.33 | 7.71 | 1.64 | 21.32 | -0.15 | -0.91 |
| Integrated Management Systems | 6.76 | 7.04 | 7.50 | 6.76 | 0.87 | 12.82 | -0.98 | 0.11 |
| Meat Products Technology | 7.43 | 7.50 | 10.00 | 7.50 | 2.30 | 31.01 | -0.28 | -1.25 |
| Fruit and Vegetable Technologies | 8.33 | 8.33 | 10.00 | 8.40 | 1.53 | 18.38 | -0.32 | -1.08 |
| Degree Work I | 6.95 | 6.67 | 8.33 | 7.04 | 2.23 | 32.06 | -0.43 | -0.36 |
Table 20.
Descriptive statistics of students' grades in ninth-level subjects.
| Subject | Mean | Median | Mode | Trimmed mean | Std. deviation | Coeff. of variation | Bias | Kurtosis |
|---|---|---|---|---|---|---|---|---|
| Design and organization of industrial plants | 8.67 | 8.33 | 10.00 | 8.71 | 1.37 | 15.75 | -0.33 | -1.60 |
| Degree work III | 7.54 | 8.33 | 8.33 | 7.62 | 2.00 | 26.57 | -1.01 | 0.61 |
Disclaimer/Publisher’s Note: The statements, opinions and data contained in all publications are solely those of the individual author(s) and contributor(s) and not of MDPI and/or the editor(s). MDPI and/or the editor(s) disclaim responsibility for any injury to people or property resulting from any ideas, methods, instructions or products referred to in the content. |
© 2025 by the authors. Licensee MDPI, Basel, Switzerland. This article is an open access article distributed under the terms and conditions of the Creative Commons Attribution (CC BY) license (http://creativecommons.org/licenses/by/4.0/).
Copyright: This open access article is published under a Creative Commons CC BY 4.0 license, which permit the free download, distribution, and reuse, provided that the author and preprint are cited in any reuse.


