1. Introduction
It is a fact that lithium-ion cells are being used in larger devices and therefore already need battery packs, as is the case in electric vehicles. In most accidents, thermal runaway (TR) of a single cell occurs first, and then the heat dissipates into adjacent cells and thermal runaway propagation occurs. Therefore, it is important to investigate the mechanism of thermal runaway propagation and to determine the key parameters during thermal runaway propagation in a battery.
This article will analyze the behavior of cylindrical cells after inducing thermal runaway in a single cell and the behavior of a pouch cell subjected to overcharge at different ambient temperatures. Initial failures in lithium-ion cells can be due to mechanical failure [
1], thermal failure [
2] or electrical failure [
3]. It is important to understand the behavior of lithium-ion cells under these failures to develop safe cells.
A lithium-ion battery can present risks throughout its lifetime if the electrolyte is damaged and does not perform its function of separating the anode and cathode. Whether due to mechanical damage, such as a fall or a heavy blow, overcharging or complete discharge, or temperatures outside the range recommended by the manufacturer, a hazardous situation can arise in which the so-called ‘Thermal Runaway’ (TR) or ‘Exothermic Reaction Out of Control’ is triggered, an extremely exothermic process that is impossible to stop and which causes flammable gases that can cause a metallic fire within a few minutes. A single faulty cell is enough to cause a chain reaction with severe consequences. When this chain reaction occurs, it cannot be stopped, so the only solution is to contain the reaction as much as possible so that it affects the minimum number of cells around it.
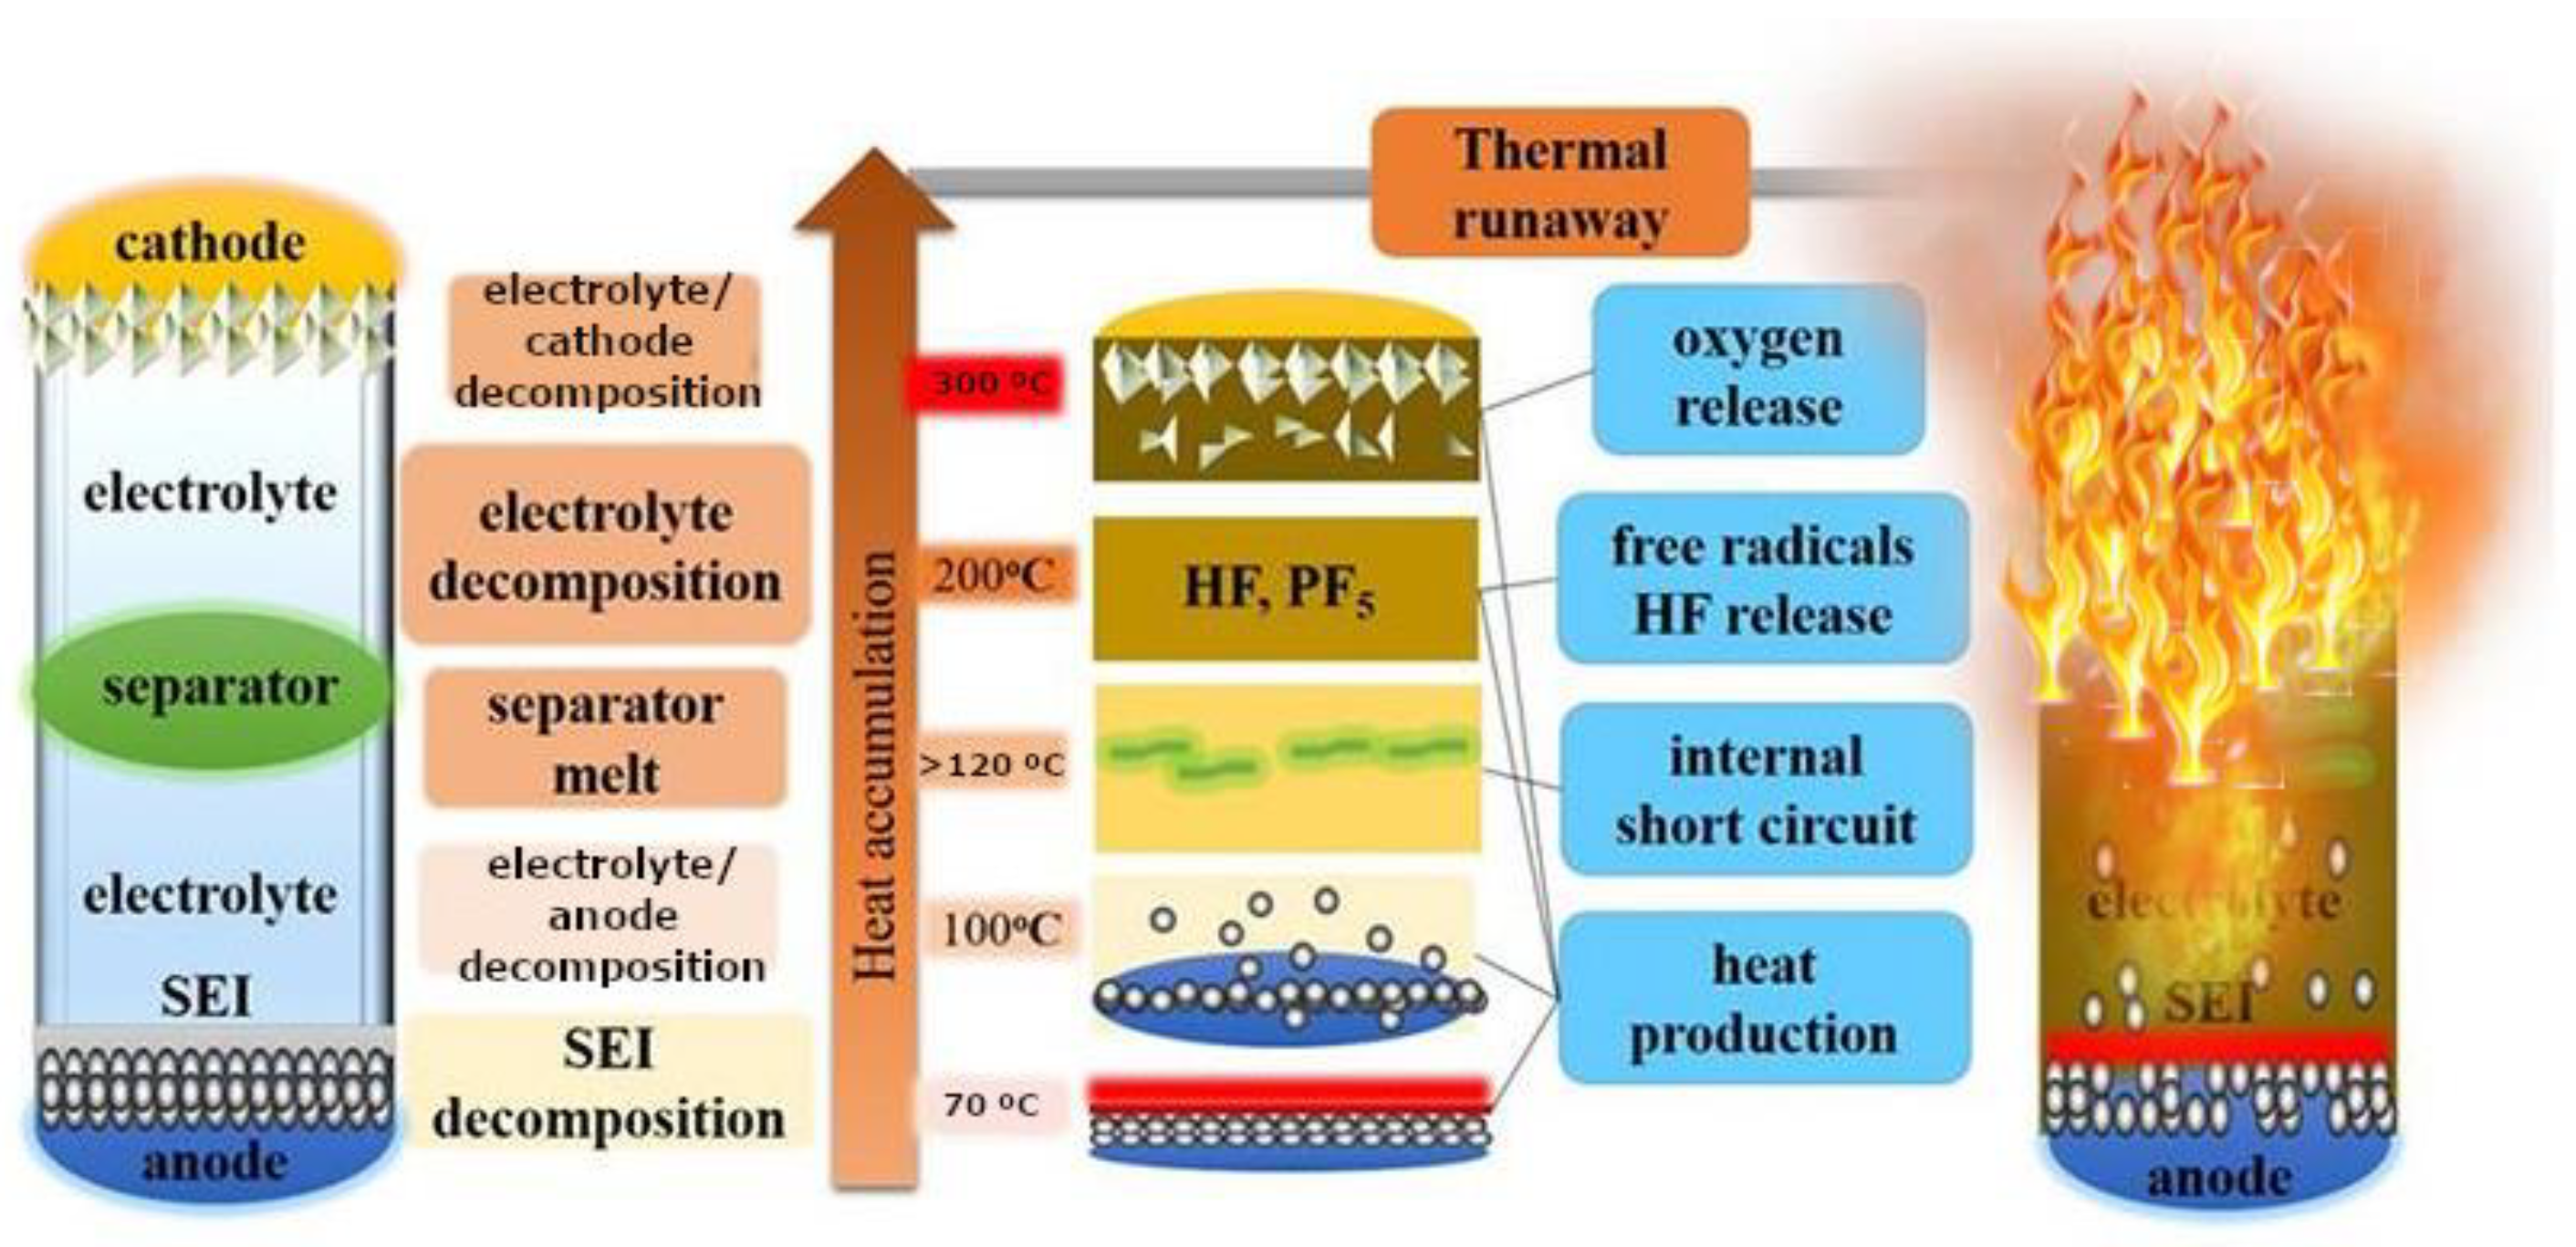
Lithium-ion cells normally operate or behave safely in a temperature range not exceeding 100 °C without being affected. The temperature values to be considered are the maximum permissible temperature to which the cells can be subjected is 60 °C, at 70 °C the electrolyte starts to volatize. As can be seen in the
Figure 1, if the temperature exceeds this critical value of 100 °C, various decomposition reactions begin to take place inside the lithium-ion cells. For temperature values above 120 °C (approximately), decomposition of the solid electrolyte interface, SEI, occurs first. The SEI is a very thin layer of material that does not exist when the cell is manufactured; this layer is formed when the cell is first charged, it interposes itself between the anode and the electrolyte and its function is to prevent reactions between them. However, when the cell reaches 120 °C, the SEI decomposes, degrades and can allow the anode to contact the electrolyte, and an exothermic reaction can occur between the lithium intercalated in the anode and the electrolyte.
In principle, any severe abuse of a cell can lead to TR, so there are multiple methods to initiate TR. Some of the most used methods are heating (thermal failure), perforation of the cell (mechanical failure) and overcharge/over discharge (electrical failure). New methods of external heating, internal heating of the cell by inserting a heating device inside the cell or creating an external short circuit through a heating device have also been developed. Studies [
5] have shown that inductive heating can also be a useful method for analyzing TR.
The TR behavior of individual lithium-ion cells has been studied [6-18]. Typical responses include venting of battery gases, ejection of cell contents, extreme temperatures and in some cases cell self-ignition and projection of battery/cell materials. The failure of a single cell does not pose much risk, but the thermal and electrical impact on other cells in the module can be sufficient to cause a cascading TR effect. And considering that the battery may be installed in an electric vehicle, we can consider the risk involved.
It is observed that cylindrical cells are less prone to propagation due to the limited contact between neighboring cells. Concluding from several studies [
9] that the electrical connection is important as the 10s1p arrangement showed no fault propagation through the module, while the 1s10p did have an energy leakage that consumed the module minutes after the onset of the fault.
In contrast, modules built with pouch cells show strong heat transfer between cells, as there is a large surface area of cells in direct contact, allowing faults to propagate through the entire battery, for all series or parallel configurations tested [
19].
The spacing and arrangement of the cells in a battery pack have an influence on the thermal propagation in the batteries. TR and its propagation occur if the spacing reaches a certain critical value. If the test is performed in an enclosed space, the probability of thermal runaway propagation in the battery pack is higher than in the case of testing in an open space [
20]. On the other hand, if the cells are placed in a vertical arrangement, the probability of TR propagation is higher than in the case of horizontal arrangement [
20]. Experimental results [
20] show that when the SoC of the cells is 100%, and the spacing is more than 2 mm in the horizontal direction and 8 mm in the vertical arrangement, thermal runaway propagation of the battery pack hardly occurs in an open environment. In a closed environment, there is less chance of uncontrolled heat transfer in the batteries, in this case when the horizontal spacing is greater than 4 mm or the vertical spacing between cells is greater than 8 mm, uncontrolled thermal runaway does not occur.
Several studies were carried out by researchers to analyze the behavior of lithium-ion cells under external heating conditions. Huang et al [
21] used an electric heater to heat three 50 Ah lithium-ion cells to different SoCs and concluded that the cell only ignited when the cell surface reached 112 to 121 °C. The cell response and TR characteristics depend on the SoC, if the SoC is increased the time from heating to ignition is gradually reduced [21-23] and the reactions become more dangerous.
Feng et al. [
24] divided the internal chemical reactions occurring in lithium-ion cells into different stages depending on the temperature they reach. When lithium-ion cells overheat, their temperature gradually increases. The SEI, a passive layer that covers the negative electrode surface and is formed by electrolyte degradation, begins to decompose when the cell reaches a temperature between 90-130 °C [
25]. As the SEI decomposes, the electrolyte reaches the graphite surface more easily and reacts readily with the intercalated lithium to release oxygen and generate more heat [
26]. On the other hand, polyethylene (PE) can melt at 130-140 °C, causing an internal micro short-circuit, and thus a continuous increase in battery temperature [
27].
When the temperature reaches about 200 °C, the cathode materials start to decompose and release oxygen [
28]. In addition, the decomposition reaction of the SEI layer and the chemical reaction between the electrolyte and the metal oxide materials of the cathode is accelerated, as well as the reaction between the electrolyte and the negative active substances, which will produce more heat and gases [
23] such as O
2, CO, HF and NO [29-33]. As the temperature increases, the internal chemical reaction of the cell becomes increasingly intense and complex, generating a large amount of heat and combustible gases [
34], then a TR reaction occurs, causing the lithium-ion cell to catch fire or even explode. It is important to understand the risk/hazard of designing individual cells and battery packs, and modules to avoid or minimize the impact of TR.
However, there are few studies on methods to assess the safety of battery cells or modules.
Studies indicate that TR only occurs when the SoC is above 50%. On the other hand, the critical spacing that triggers TR is 4 and 6 mm for 80% and 100% SoC batteries respectively [
35]. Feng et al. [
36] conducted a mechanical abuse (penetration) test that induced TR on a 6-cell module in series contact and concluded that the cell casing transfers the most heat and developed a thermally resistant layer between the cells to prevent TR propagation in the module [
37].
Lopez et al [
38] analyzed the influence of cell spacing on TR and concluded that the spacing between cells in the battery pack greatly affects TR propagation. They analyzed different battery modules in series and concluded that the key to TR propagation is heat conduction.
Therefore, there are several studies on the propagation of TR in series-connected battery modules [36-38] but there are few studies to analyze the propagation of TR in parallel-connected battery modules. Wilke et al. [
39] showed that the temperature increase after TR in a parallel connected battery cell module is higher than if the cells in the module are connected in series. Lamb et al. [
40] also found that the temperature rise in a module with cells connected in parallel was higher and the TR propagation was accelerated.
Gao et al. [
41] carried out a study of TR propagation in a large format battery module with parallel connections, 18 parallel pouch cells of 24 Ah, it is observed that the undamaged cells transfer current to the cell experiencing TR, which causes it to experience a 10 higher temperature compared to a module with the cells connected in series. The module with parallel connections is less safe.
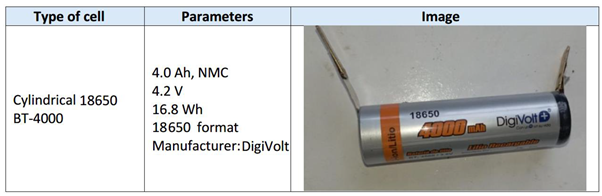
2. Materials and Methods
This section analyses the tests performed using different TR initiation methods: mechanical abuse tests, overcharge tests and inductive heating tests. Different types of cells were used for this purpose, cylindrical cells for the thermal failure test and for the mechanical failure test, and pouch cells for the electrical failure test. Table 4.1 shows the properties of tested cells.
Table 1.
Technical specifications of the cells used in the tests.
Table 1.
Technical specifications of the cells used in the tests.
| Cell type |
Parameters |
Image |
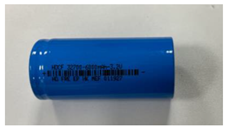
| 32700 Cylindrical cell |
6.0 Ah, LiFePO4
3.2 V
19.2 Wh
32700 Format
Manufacturer:
HAIDI |
 |
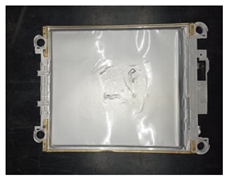
Pouch AESC
Nissan Leaf (2018)
Battery structure:
24 modules
8 cells for each module |
56.3 Ah, NMC 523
3.65 V
205.49 Wh
Manufacturer:
Envision AESC |
 |
In all the tests carried out, the internal resistance of the cells (untested and tested) was measured with the battery tester BT3564 (HIOKI, Japan). With this equipment, the internal resistance and open-circuit voltage of a battery up to 1000 V can be measured simultaneously, allowing the condition of high-voltage batteries in electric vehicles or plug-in hybrid vehicles to be checked.
2.1. Mechanical Abuse Test
In mechanical abuse tests, an object penetrates or pierces the battery (breaking or weakening the mechanical integrity). For example, the extent to which nail penetration (internal short-circuit) or crushing (shock) affects the functionality and safety behavior of the battery is examined.
In this test, 32700 lithium-ion cylindrical cells are to be used, penetrated with a sharp object in the lateral area, i.e. pierced perpendicular to the longitudinal axis of the cell until short-circuit is achieved, and in the upper area, i.e. pierced parallel to the longitudinal axis of the cell until short-circuit is achieved. These tests will be repeated for different cell states of charge (SoC) (50% and 100%). The aim is to analyze how the cell structure influences the mechanical test and how its state of charge influences it. A table with the specifications of the tests to be carried out is shown below (
Table 2).
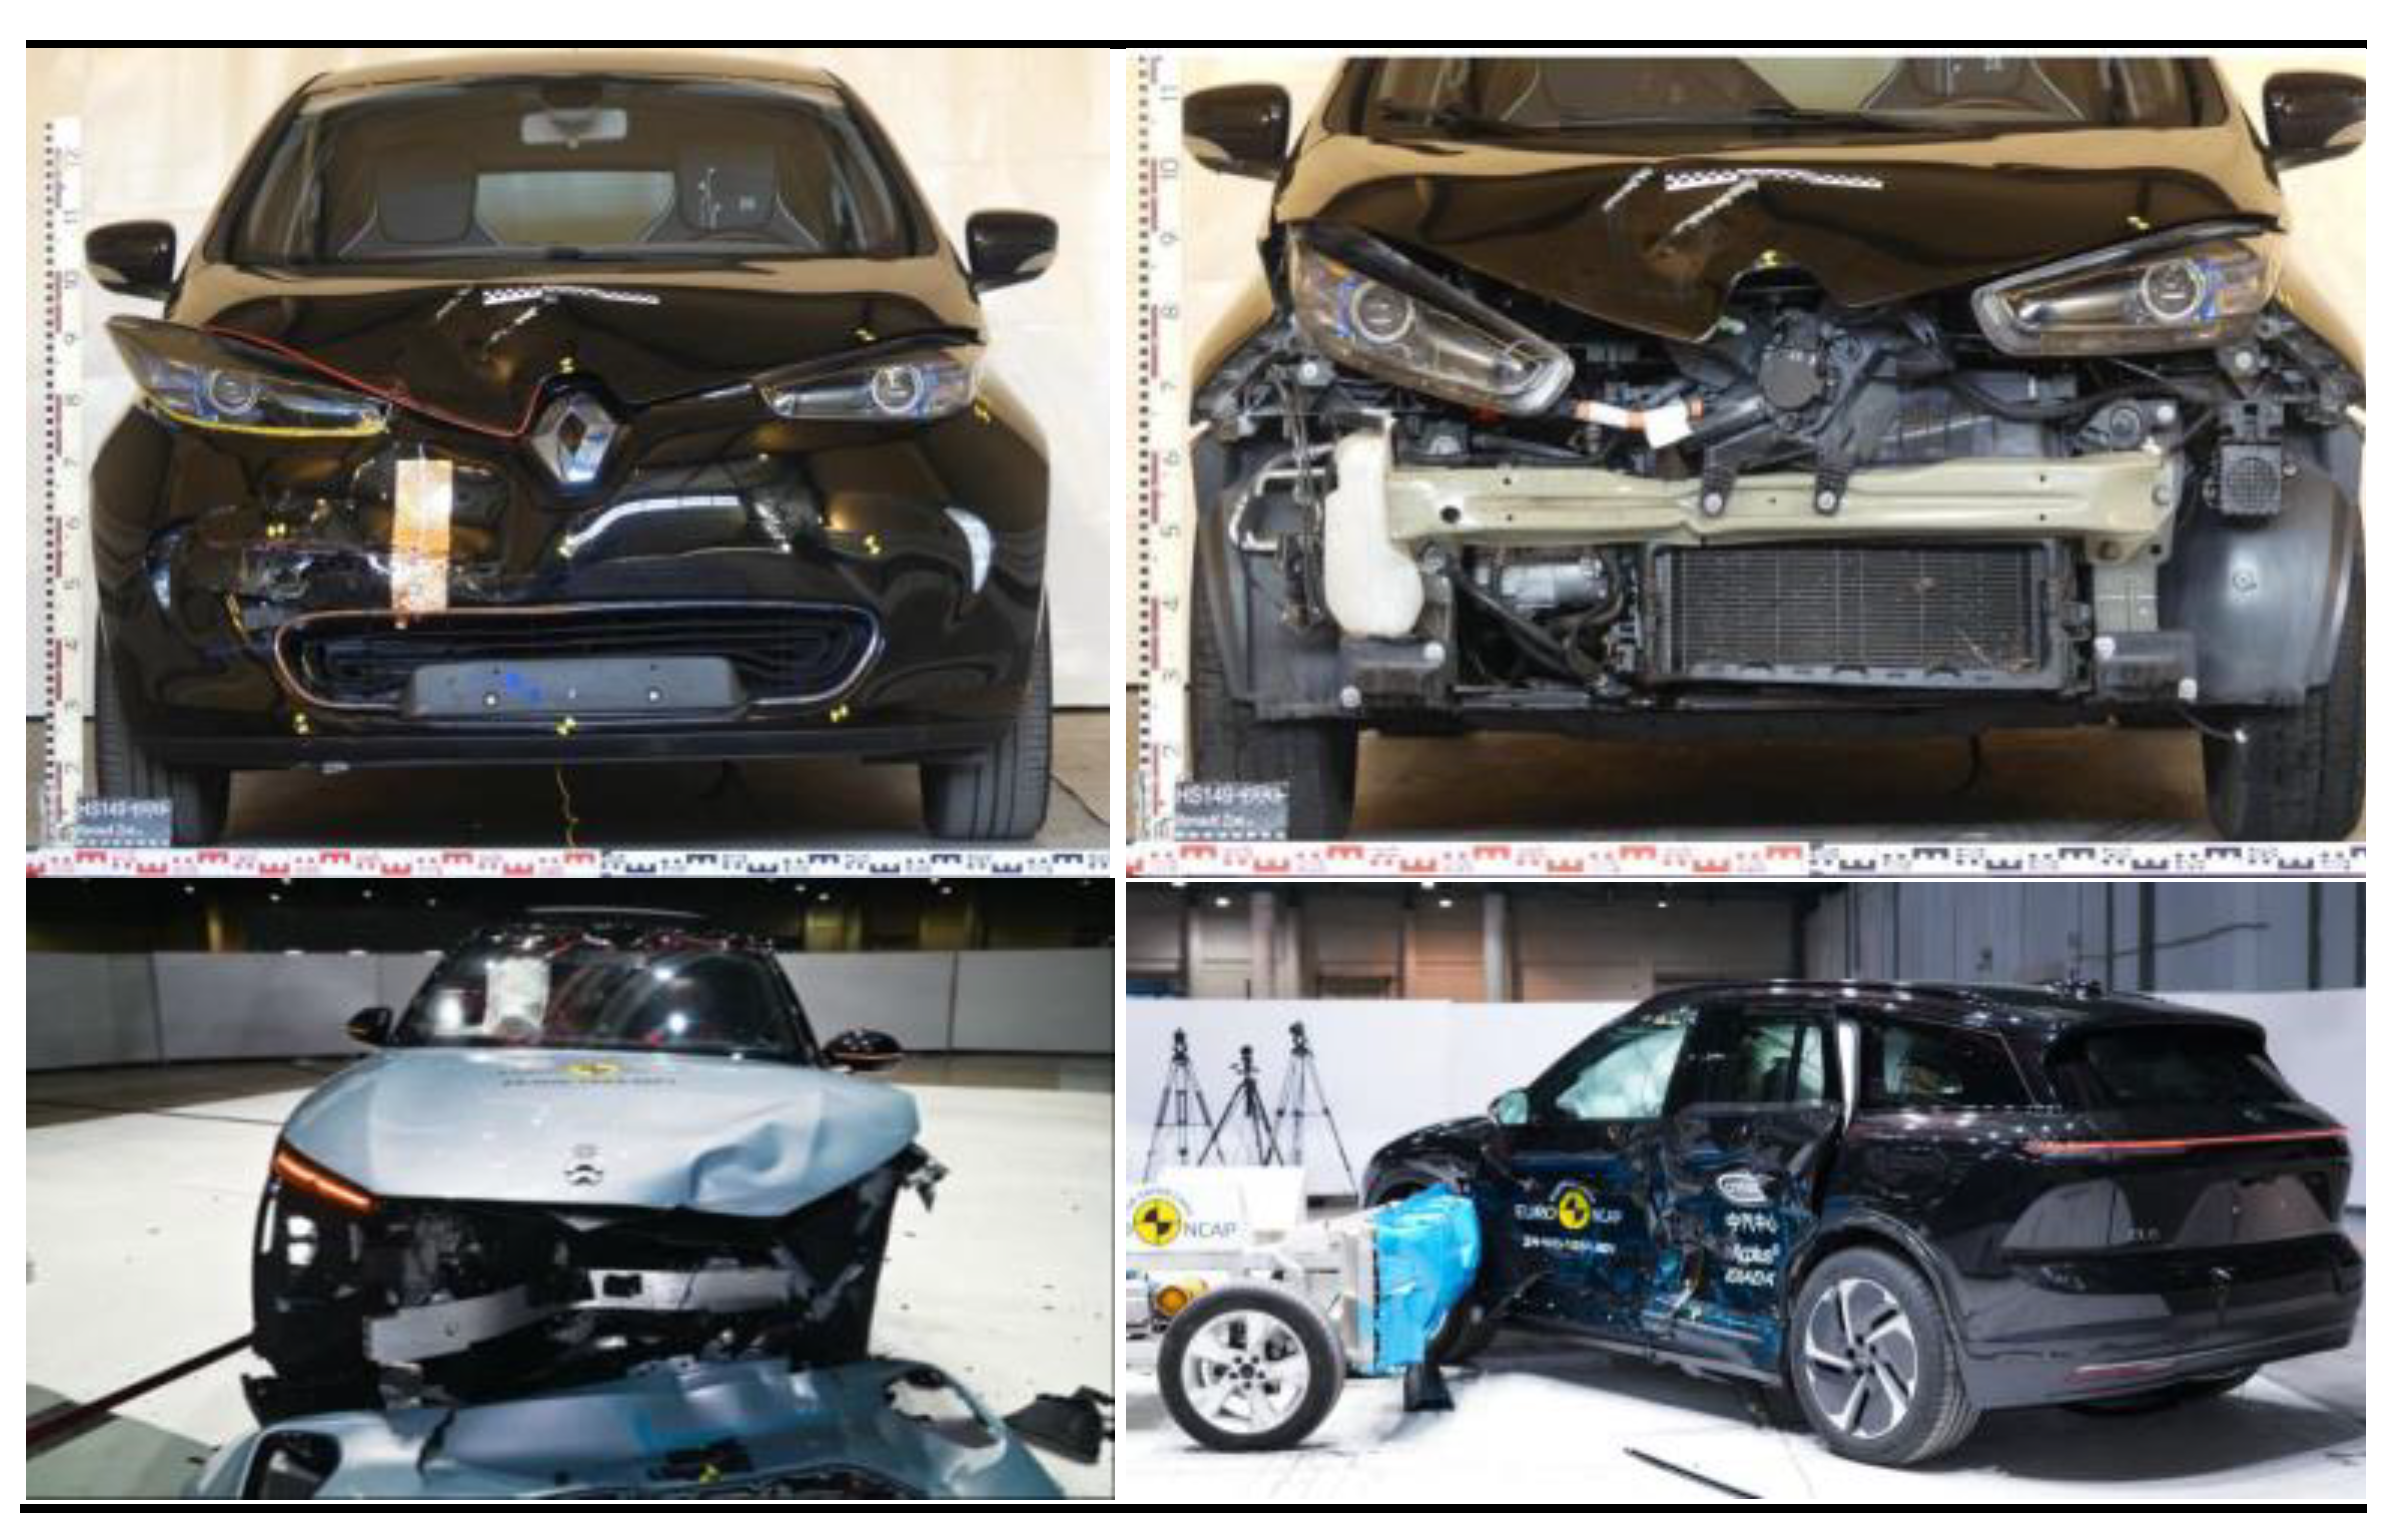
The risk of TR occurring in a battery due to mechanical damage caused by a perforation or significant deformation of the battery can occur in electric or hybrid vehicles due to a collision of a certain intensity in which the vehicle is involved. The impact or collision between electric vehicles reaches tens or even hundreds of g, and the failure of the lithium-ion battery can cause TR, which can lead to a subsequent vehicle fire [
42].
Through theoretical analysis and by performing calculations [
42], the optimal design method of lithium-ion batteries is studied: it is concluded that increasing the separator thickness and increasing the elastic modulus can inhibit the voltage reduction of lithium-ion batteries under impact, we should note that increasing the elastic modulus will theoretically not affect the capacity of the battery, so it is the best option. The research [
42] carried out, analyzes in depth the failure phenomenon, mechanism and modelling method of lithium-ion batteries under extremely strong impact conditions, which is of great importance for the design optimization of lithium-ion battery design and the improvement of lithium-ion battery design under extreme mechanical conditions.
Mechanical testing is a commonly used method to assess the safety of batteries. The blunt rod mechanical test method, as well as penetration with sharp nails, was carried out on commercially available cells. The evaluation was carried out on different cell types as well as varying test conditions [
43]. The results obtained under ambient conditions differed little from traditional sharp nail penetration tests. When performed at elevated temperatures, the results were found to be highly dependent on the internal structure of the cell. Computed tomography images showed differences in behavior depending on whether a solid core was used in the cylindrical cell structure. Pouch cells were also tested, which showed that a complete penetration of the cell was necessary for failure to occur inside the cell.
According to the study carried out [
43], the results of mechanical tests depend on the test conditions, the type of cell (structure) tested and how these conditions interact with each other. It is important to note that the conditions of use of the battery (vehicle, mobile phone or other) will govern the mechanical abuse conditions to which the battery is subjected to assess its safety. In the case of a battery on board a vehicle, it could be exposed to significant mechanical deformation during a road accident (
Figure 2). Mechanical abuse techniques remain a widely accepted method for assessing the safety and abuse response of lithium-ion batteries/cells. However, changes in test conditions and even changes in cell construction can result in significantly different responses. The influence of these changes on the result of a mechanical test is important to understand how the results of standard test techniques can correlate with the safety of a given cell.
Due to the importance of understanding the failure behavior of lithium-ion batteries under mechanical abuse for the safety of electric vehicles, the failure behavior and mechanical properties of Lithium-ion Prismatic Batteries (LPB) under quasi-static and dynamic loads are investigated experimentally [
46]. For this purpose, a universal testing machine (2 mm/min) and a drop tower (1 m/s and 5 m/s) were used, respectively. The results show that the loading rate influences the failure behavior and mechanical properties of LPBs. The main failure behavior of the LPB under a cylindrical impactor acting in the X-direction is the fracture of the shell as well as the bulging of the jellyroll structure of the cell, while in the Y-direction it is the wrinkling of the shell as well as the delamination and folding of the jellyroll structure.
The internal short-circuit of lithium-ion batteries would be triggered by the inevitable collision of the electric vehicle, posing serious threats to the safety and stability of the battery system. However, there is a lack of research on the internal short-circuit mechanism of lithium-ion batteries subjected to dynamic impact loads. There are studies [
47] that define a coupled multi-physics model to describe the mechanical, electrical and thermal response of this type of battery under dynamic loads. This model allows predicting whether internal short-circuit occurs and analyses the evolution of the TR for different battery SoCs and for different impact energies. This model is only valid for small size batteries, more research should be done to extend it to larger battery models.
In this study [
47], three parameters are combined to describe the behavior of an internal short circuit in a lithium-ion battery under dynamic load. Voltage drop is the most intuitive for determining whether internal short-circuit occurs after the test, the magnitude of the voltage drop can be used to identify the internal short-circuit mode. Finally, strain is used as a criterion for triggering the internal short circuit in the battery model. On the other hand, the temperature can reflect the degree of danger involved. On the mechanical side, the maximum short-circuit deformation increases with impact energy and decreases with increasing SoC [
47]. Comparing the effects of quasi-static and dynamic loading, it is observed that the short-circuit deformation when the battery is subjected to quasi-static loading is higher than when it is subjected to dynamic loading. The maximum TR temperature of a lithium-ion battery with 100% SoC in the drop-weight test (dynamic test) is 120 °C only, much lower than the temperature detected in the quasi-static compression test case. This is due to two key factors, the electrolyte jet and the chemical reaction time.
Most of the safety problems with lithium-ion batteries are due to mechanical failures, but their dynamic failure mechanism is still not very clear. In one study [
48], a test-based computational battery model is established to analyze the mechanical response of the battery. Secondly, from this model, the dynamic response of the battery under different conditions is analyzed, factors such as end cap and battery SoC correlation are analyzed, also the failure behavior under high-speed load is analyzed. Future research will focus on dynamic impact testing using more mature and detailed numerical simulation models to study the mechanical behavior of batteries in a collision.
It should be noted that the energy released during the combustion of a lithium-ion cell is not the energy stored in the cell, there is an enhancement factor. Several studies conclude that the energy released in the combustion of lithium-ion batteries depends on several factors such as: battery size and technology, state of charge, stored energy and construction characteristics. A study conducted at the University of Science and Technology in Hefei (China) on the effect of state of charge on the TR of 18650 lithium-ion batteries [
49] concludes that the energy released is increased by 2.5 times the energy stored in the battery. This study also concludes that as the SoC increases, the energy released also increases from 21.33 KJ for a new cell with a 25% SoC to 61.72 KJ for a new cell with a 100% SoC.
Another study carried out by the US Naval Research Laboratory [
50] shows that depending on the material of the battery casing, it will contribute one or the other energy to the total combustion energy of the battery pack. Once the combustion energy has been adjusted for the casing material, it is concluded that the combustion energy usually has an increase factor of 6 with respect to the energy stored in the battery. Comparing the fire behavior of battery packs with different SoC states of charge [
51], it is observed that gas venting, ignition and material ejection occur earlier in the pack with higher SoC. In addition, the severity of ejection and combustion behavior worsens with increasing SoC, revealing that the battery pack with higher SoC has a higher fire behavior risk due to material instability.
2.2. Electrical Abuse Test: Overcharge
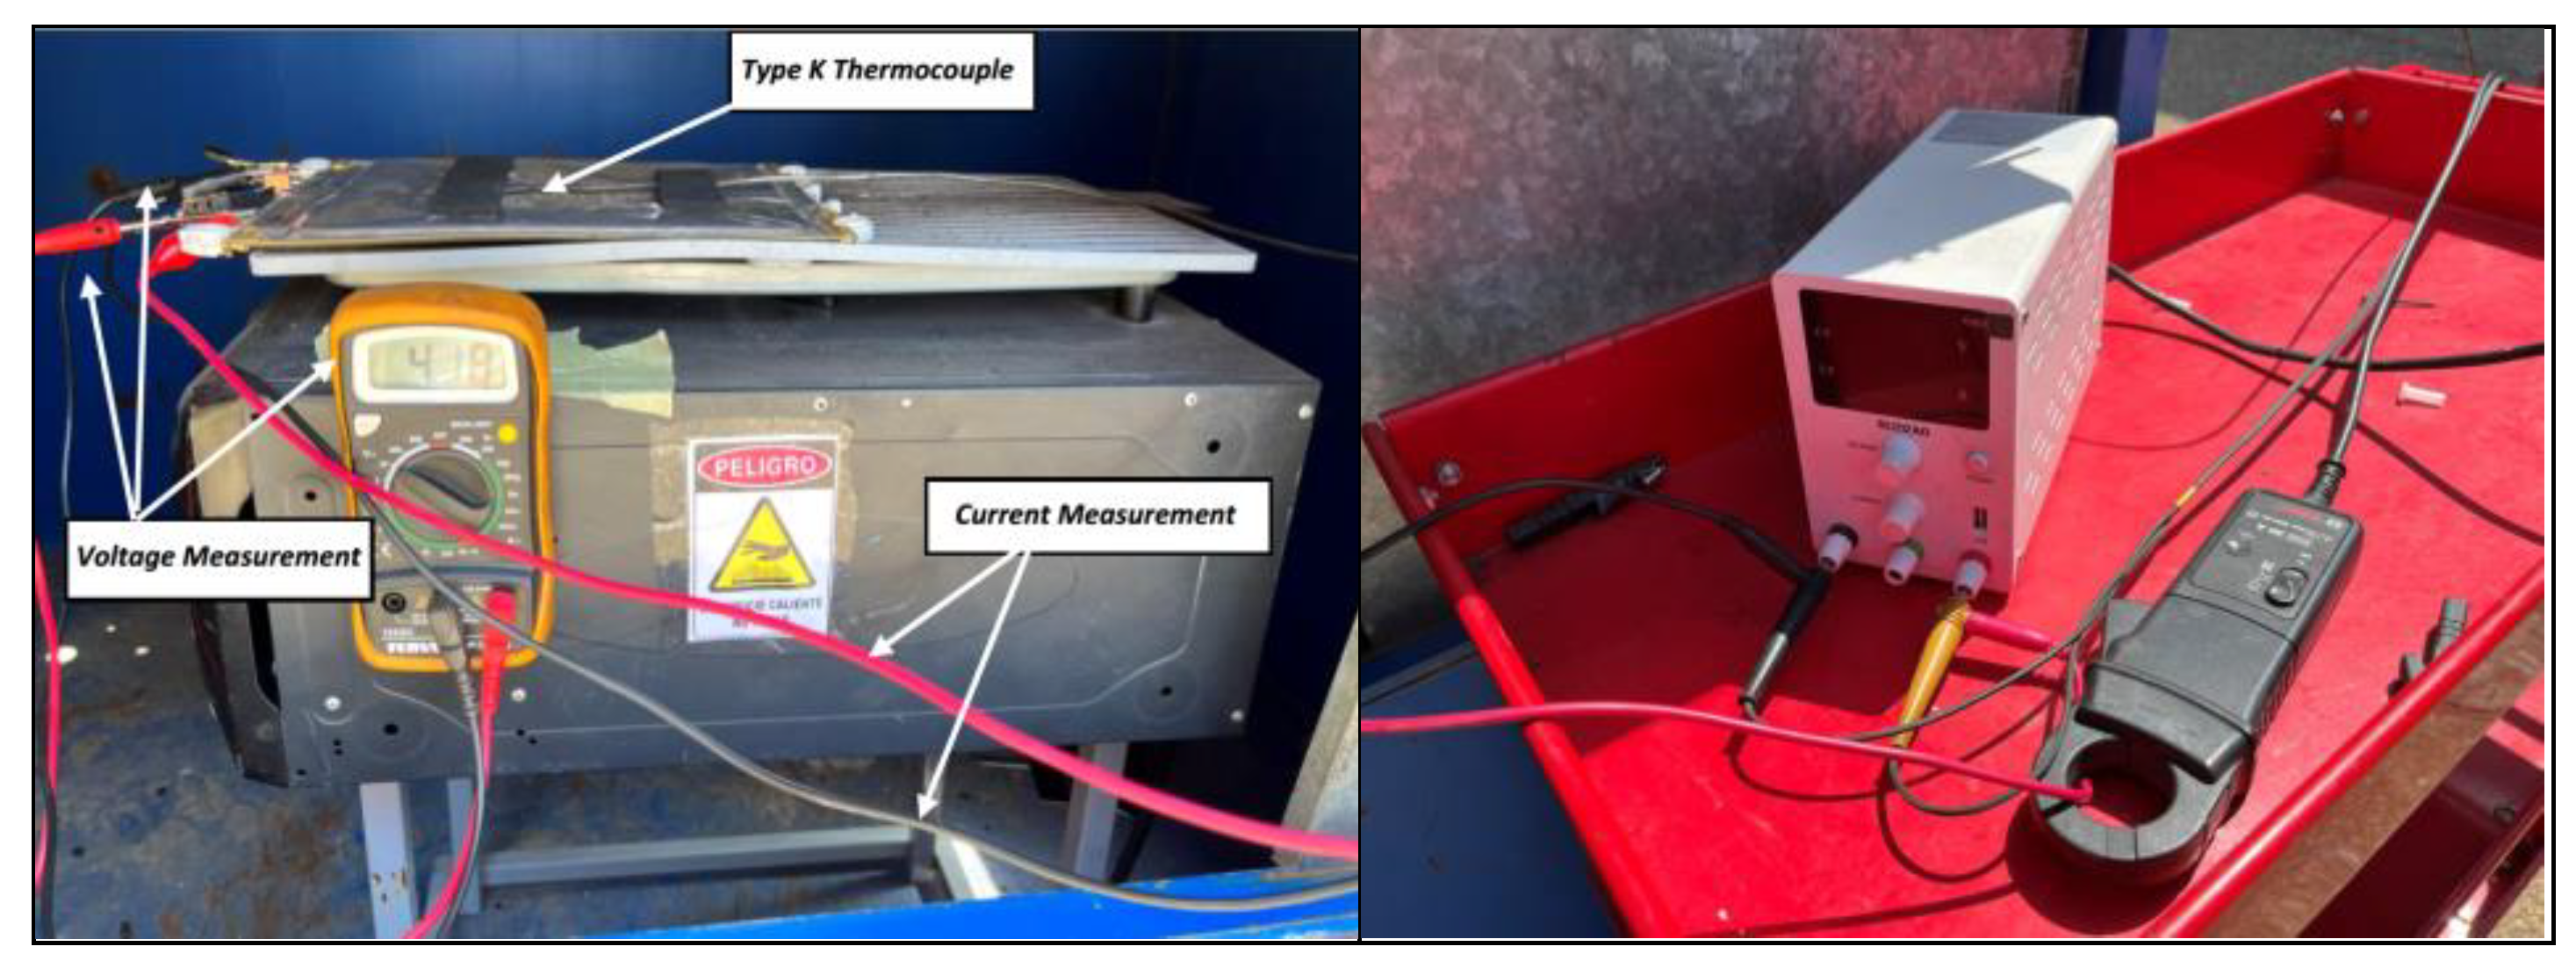
In this type of test, the battery/cells are deliberately overcharged with a higher voltage level. As a result, the battery heats up until it rapidly enters a critical state, resulting in TR. The charging test is carried out by charging a cell with a direct current (DC) of I= 10 A (corresponds to 1/5.6C). A DC charger is used to carry out the overcharge, where 10 A is set as the supply data. The current, voltage and temperature will be measured throughout the test.
In this test, pouch cells with 100% load rate will be tested at different ambient temperatures (
Table 3). It is expected that these tests will be extended in the future for different loading rates of these pouch cells. It should be borne in mind that the ambient temperature will vary as it is not controlled, because what we are trying to reproduce is a real overcharge condition of an electric vehicle.
The effect of the overcharge on the pouch cells tested will be analyzed by simulating their behavior in conditions where they can operate at ambient temperature and at a lower temperature. The aim is to analyze the behavior at room temperature of a pouch cell that fails due to overcharge, since the behavior of lithium-ion batteries under adverse circumstances has been analyzed and is well known, but failures can also occur under normal conditions. For this reason, this test is performed while keeping the cell in its nominal operating temperature range.
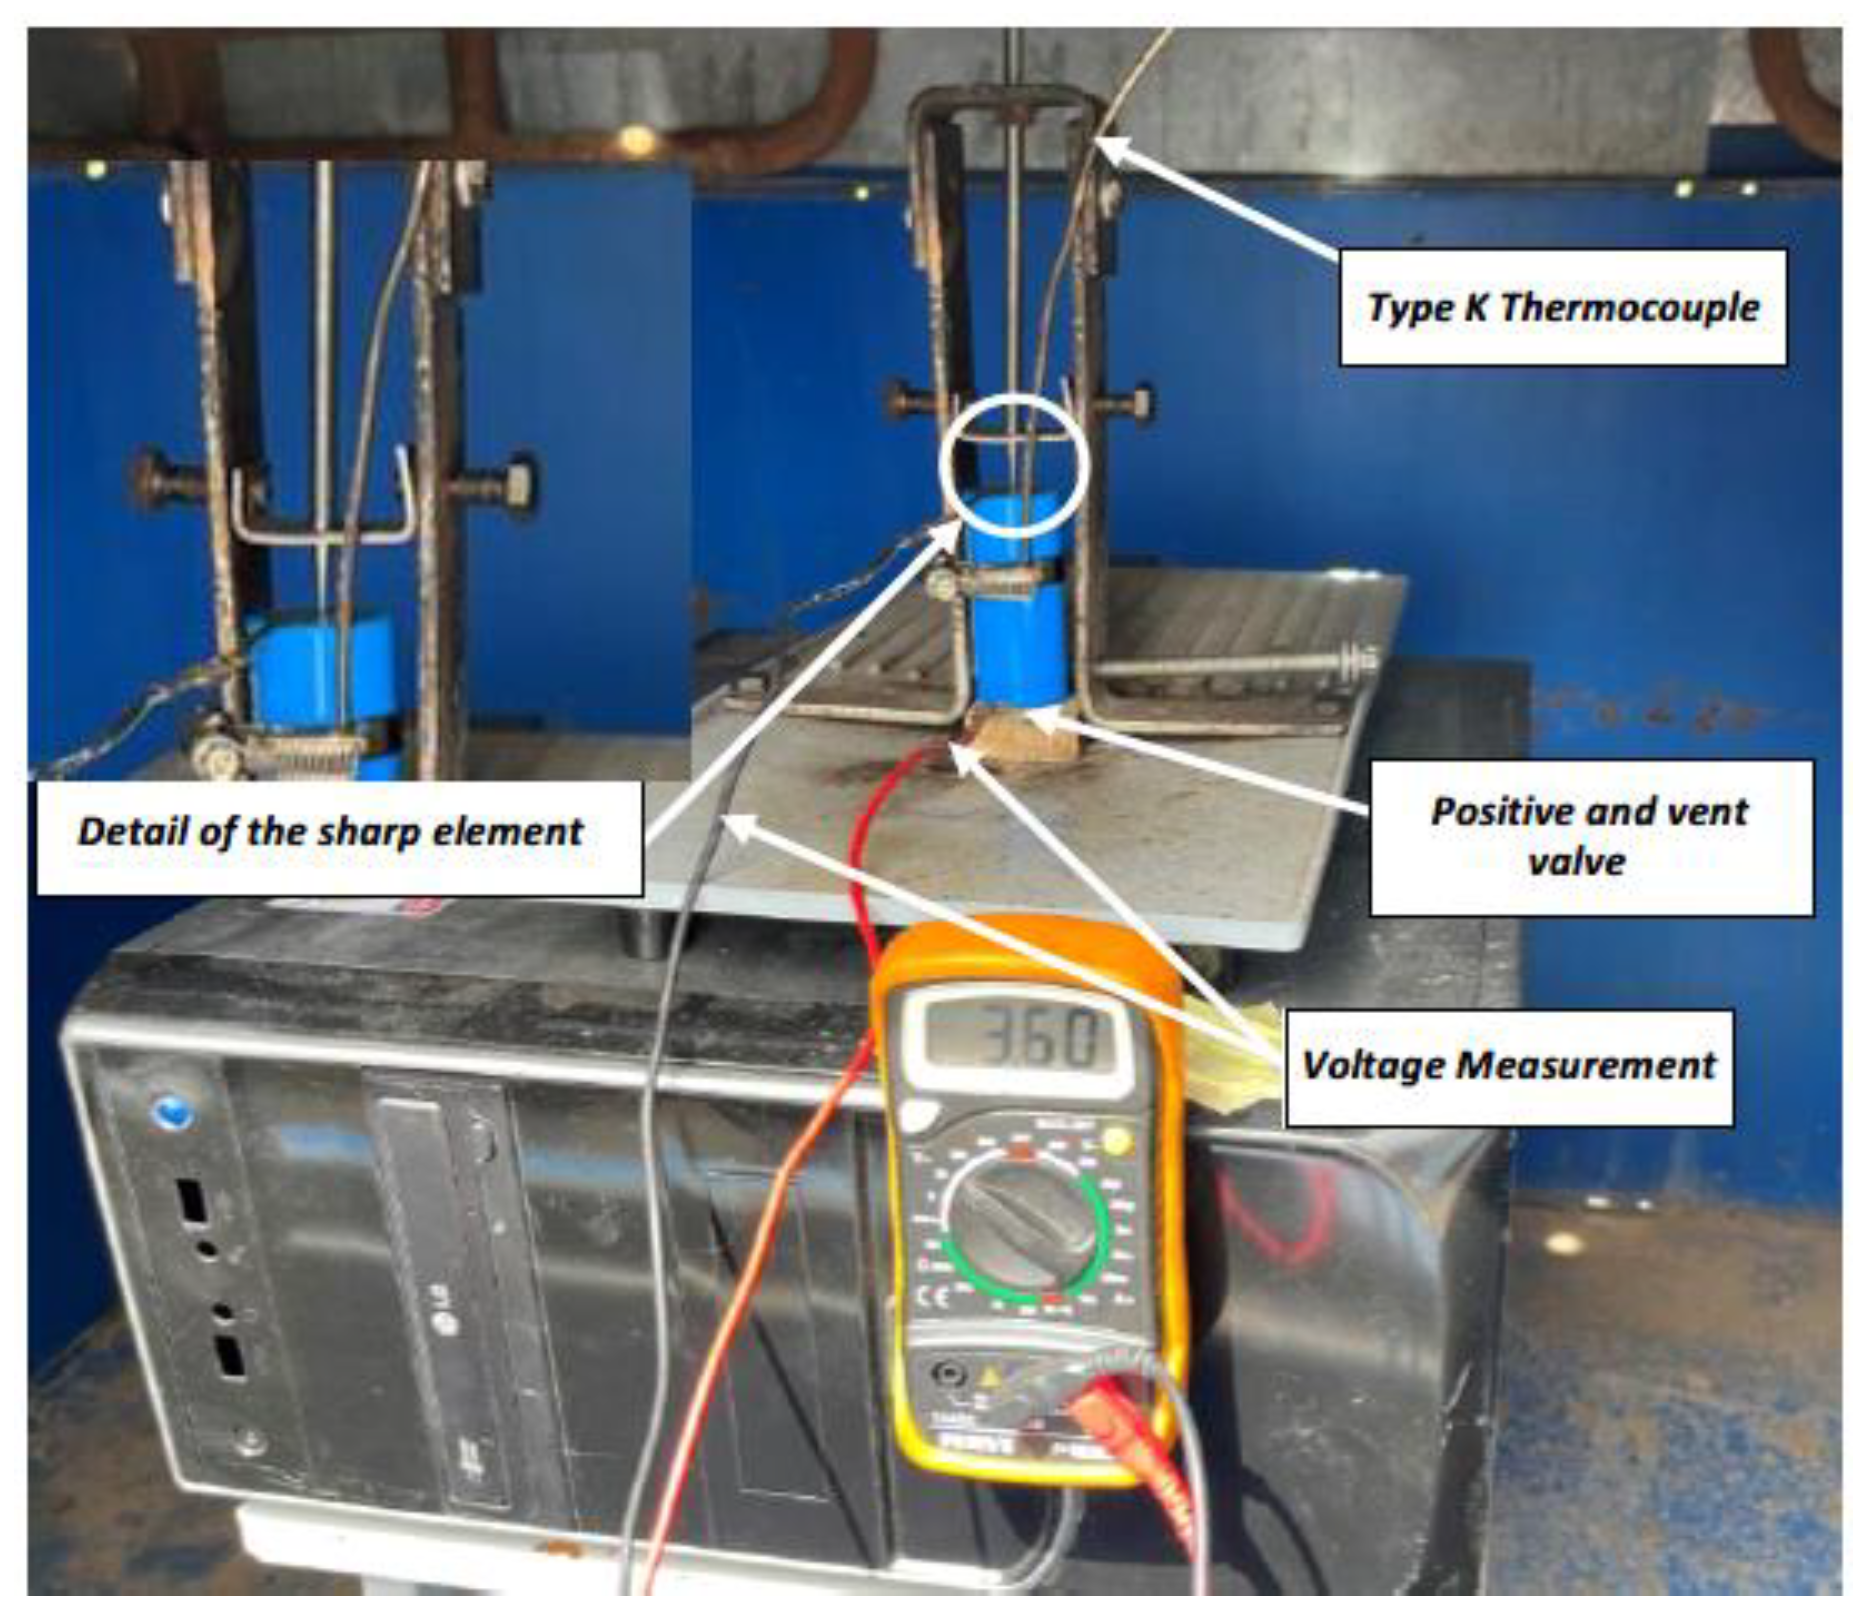
Figure 3 shows the set-up of the overcharge test carried out.
Nissan Leaf AESC cells (40 kWh), with a nominal capacity of 56.3 Ah, will be tested. These cells have a medium-high capacity, so an overcharge failure can have significant consequences due to the high energy density of the cell.
The cathode of this type of cell is made of NMC 523 (LiNi0,50Mn0,20Co0,30O2) and the anode is composed of carbon/graphite. The nominal voltage of the cell is 3.65 V with a maximum charge voltage (DC-CV) of 4.2 V. It will be charged at 10 A as indicated which corresponds to 1/5.6C, where C is the nominal capacity, in this case 56.3 Ah.
The controlled overcharge test consists of charging the cell with a constant current (DC) of 10 A up to 5.9 V with a current source, exceeding the maximum value indicated by the manufacturer of 4.2 V. During the test, the ambient temperature was measured, and the cell temperature was also measured using a type K thermocouple (Type K thermocouple AISI 310 Stainless Steel Sheath), which withstands temperature values of up to 1,100 °C punctual and 1,050 °C sustained, placed in the center of the cell. On the other hand, voltage measurement was performed by connecting the equipment to the cell terminals and current measurement.
It should be noted that different studies [
52] indicate that in the case of cycling between extreme SoC levels, overdischarge and overcharge are the factors that contribute most to battery degradation, therefore in future lines of research, these tests will be repeated on different SoCs to analyze how the state of charge influences overcharge abuse at different ambient temperatures.
2.3. Thermal Abuse Test: Heating
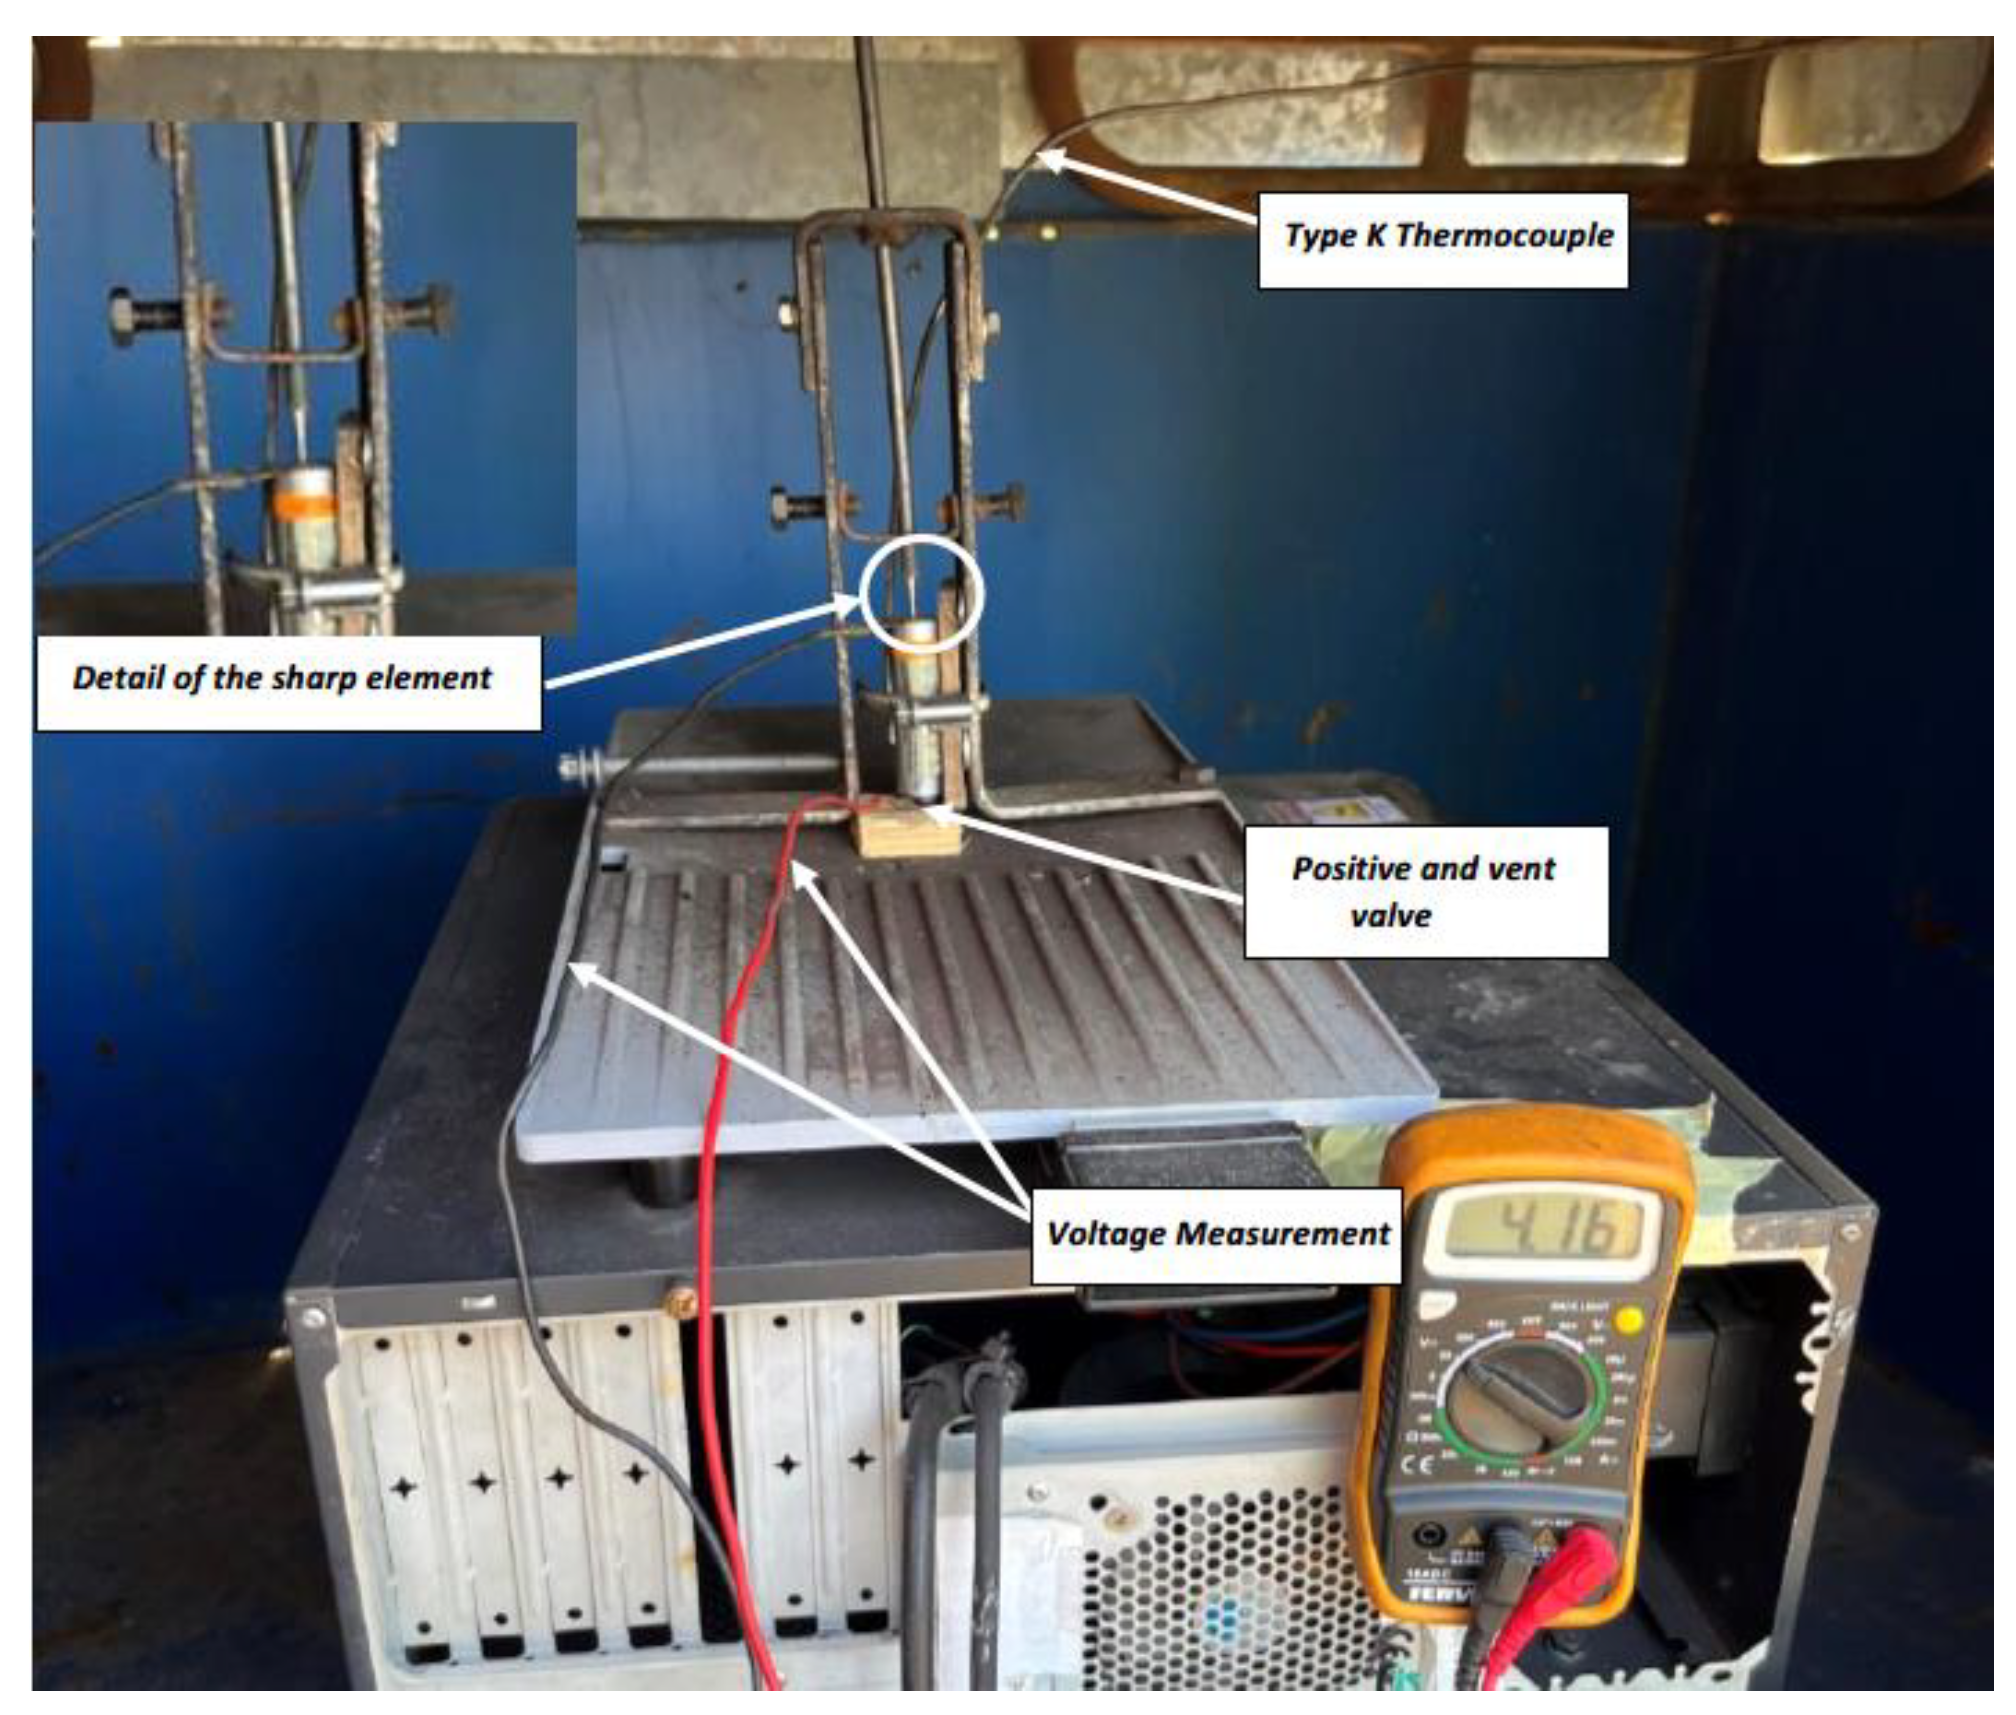
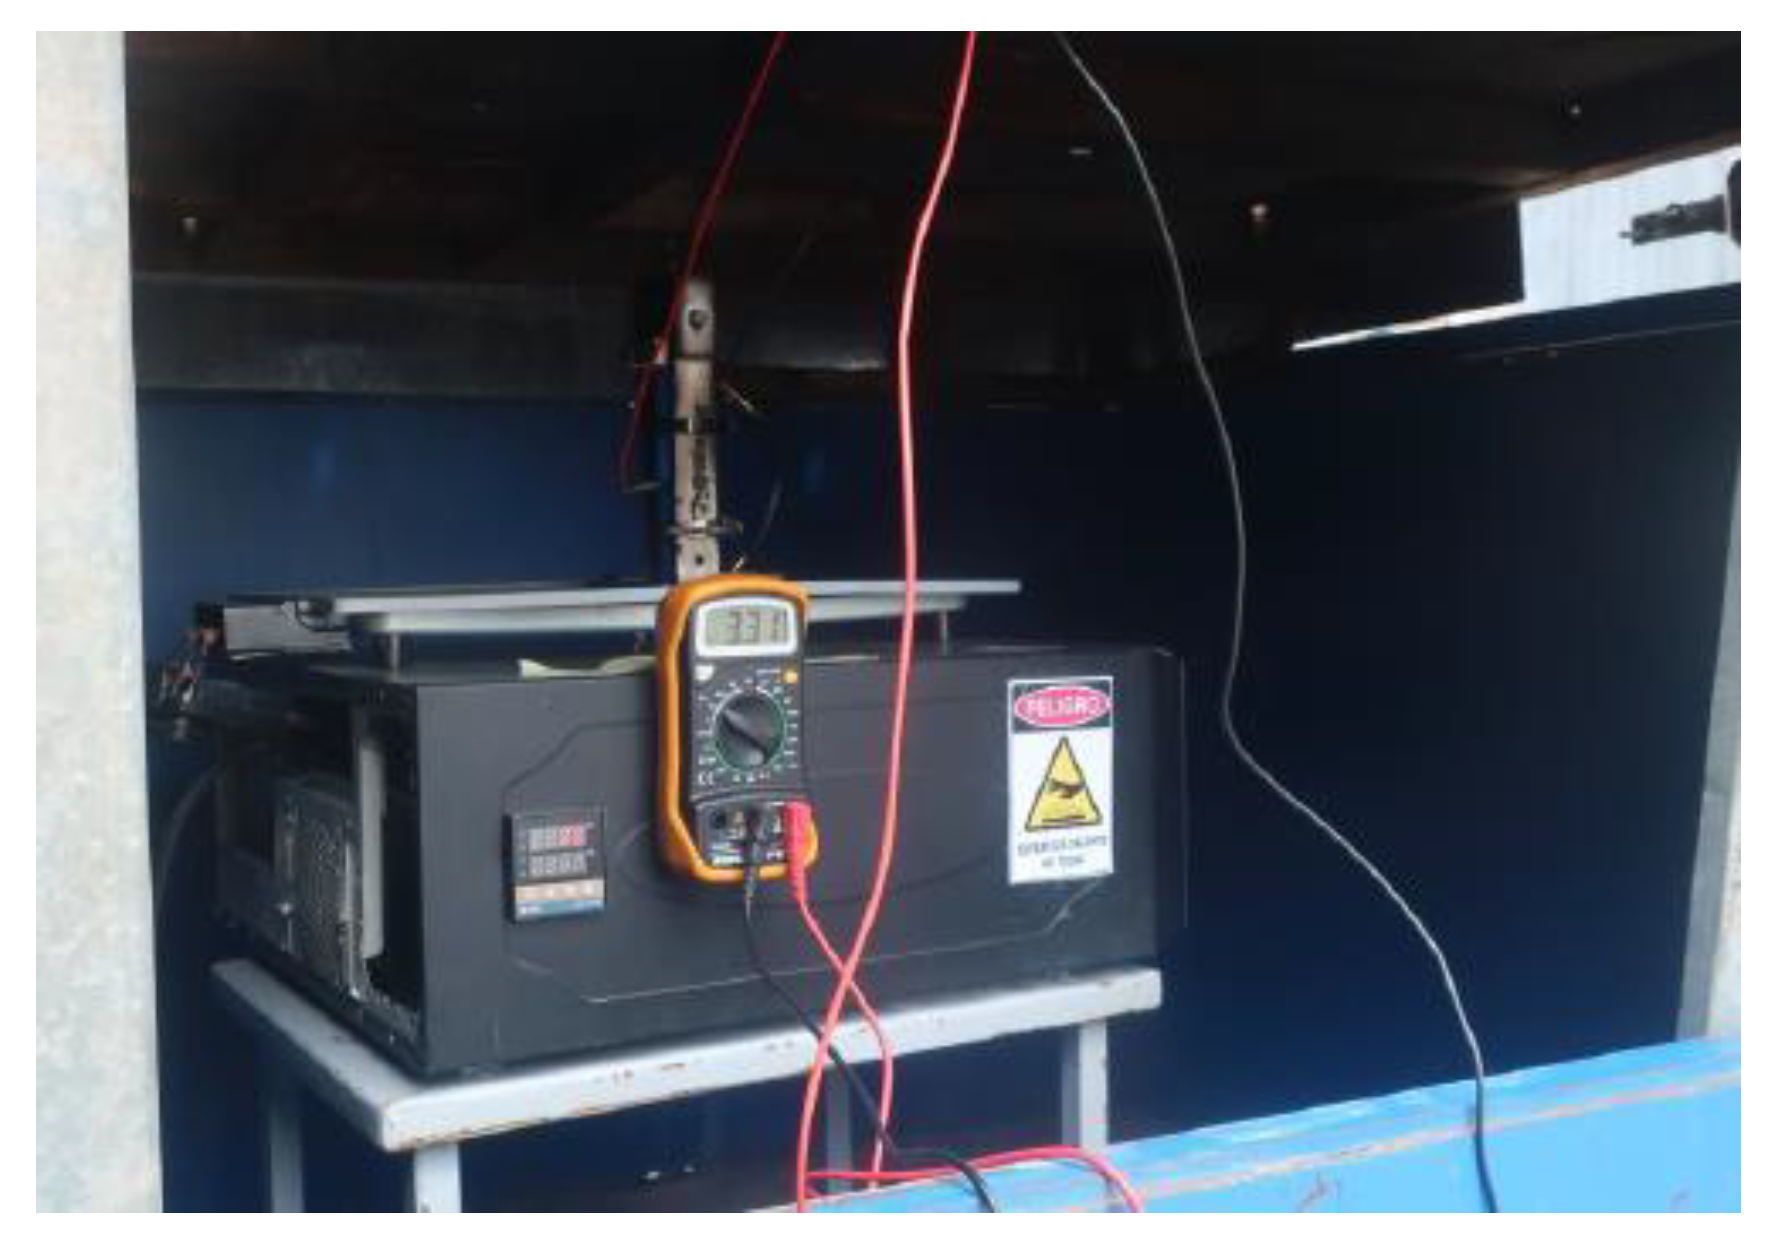
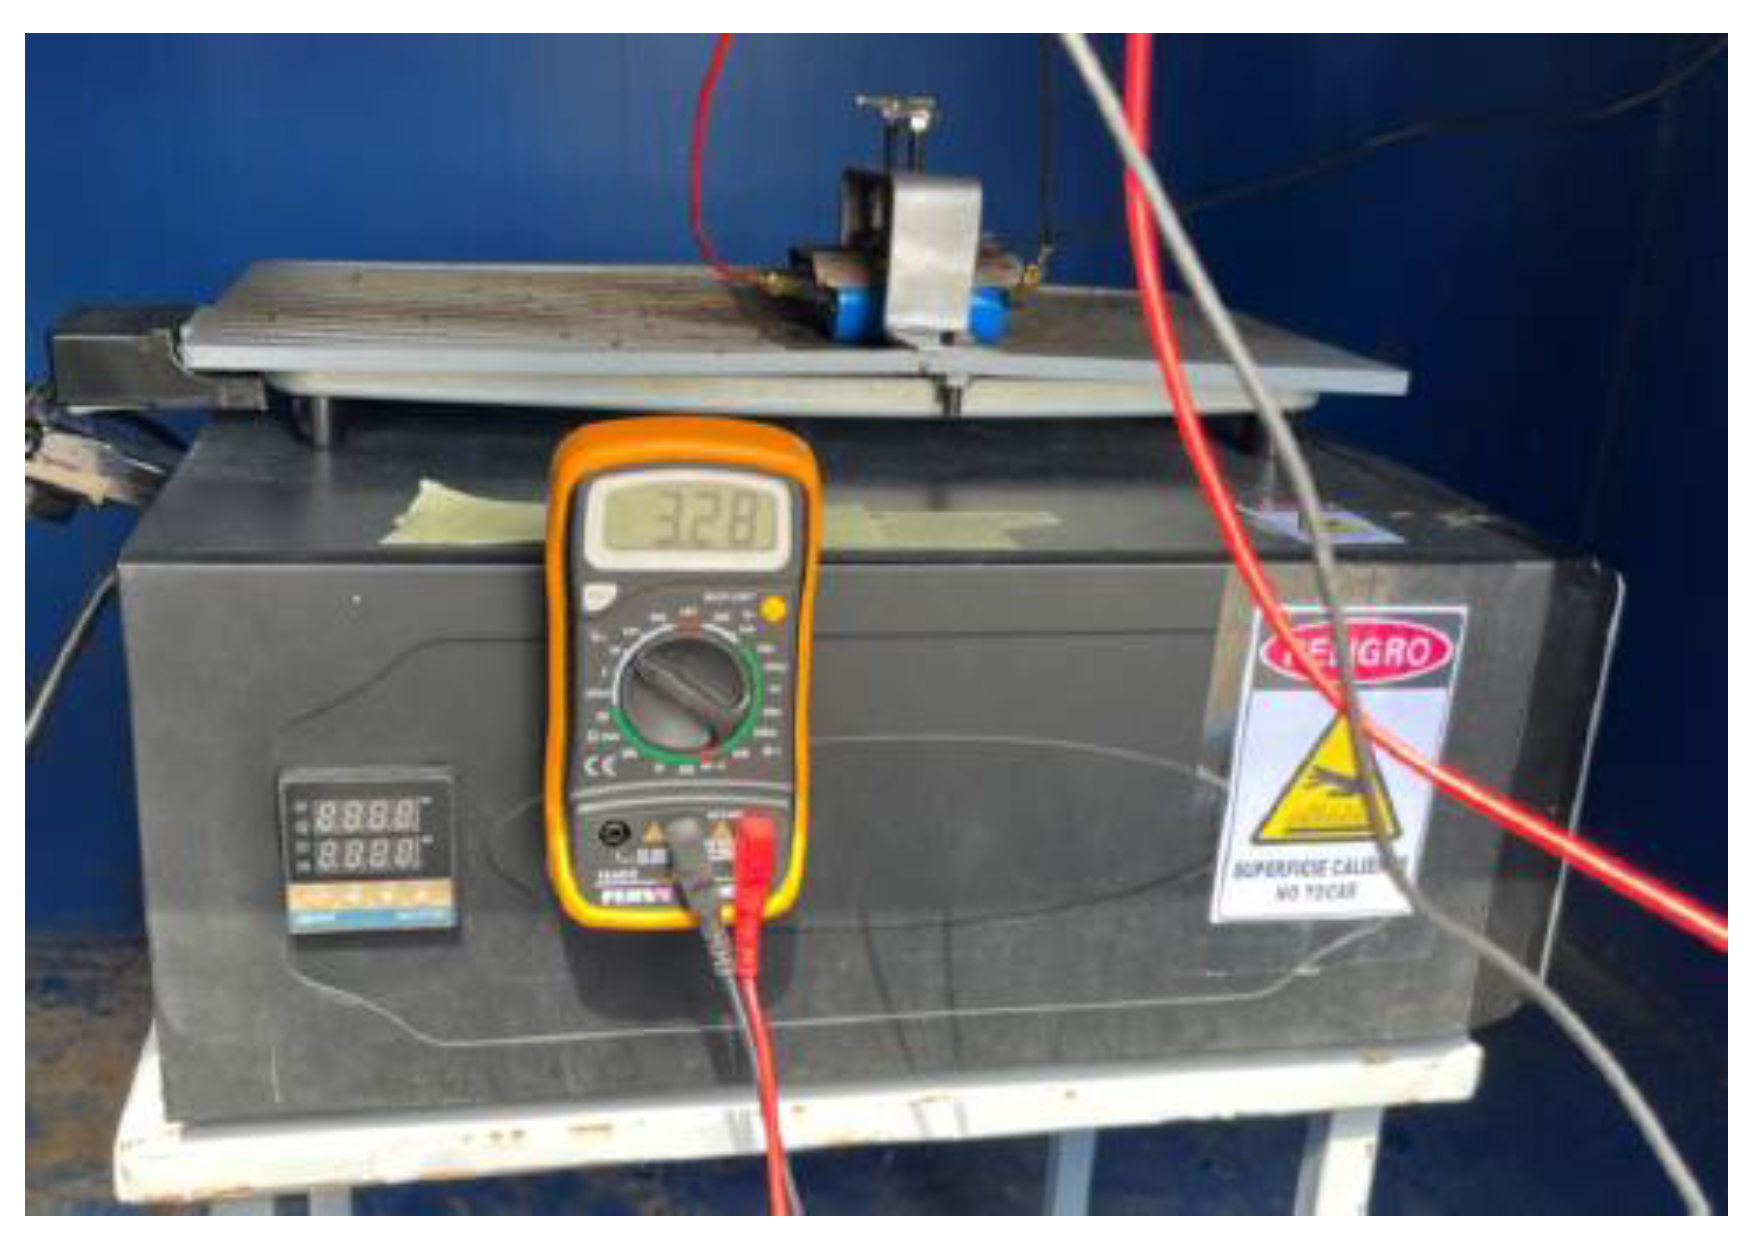
During thermal tests, batteries/cells are subjected to ambient temperatures, either at low temperatures or at elevated temperatures, and tests performed at elevated temperatures in particular, lead to a TR in most cases. To perform heating tests, one of the tested cells will be instrumented in such a way that maximum information on the behavior of the cells can be obtained. For this purpose, type K thermocouples, Type K Thermocouple AISI 310 Stainless Steel Sheath, which withstand temperature values of up to 1,100 °C punctual and 1,050 °C sustained, are fixed on the cells on the outside of their casing or enclosure.
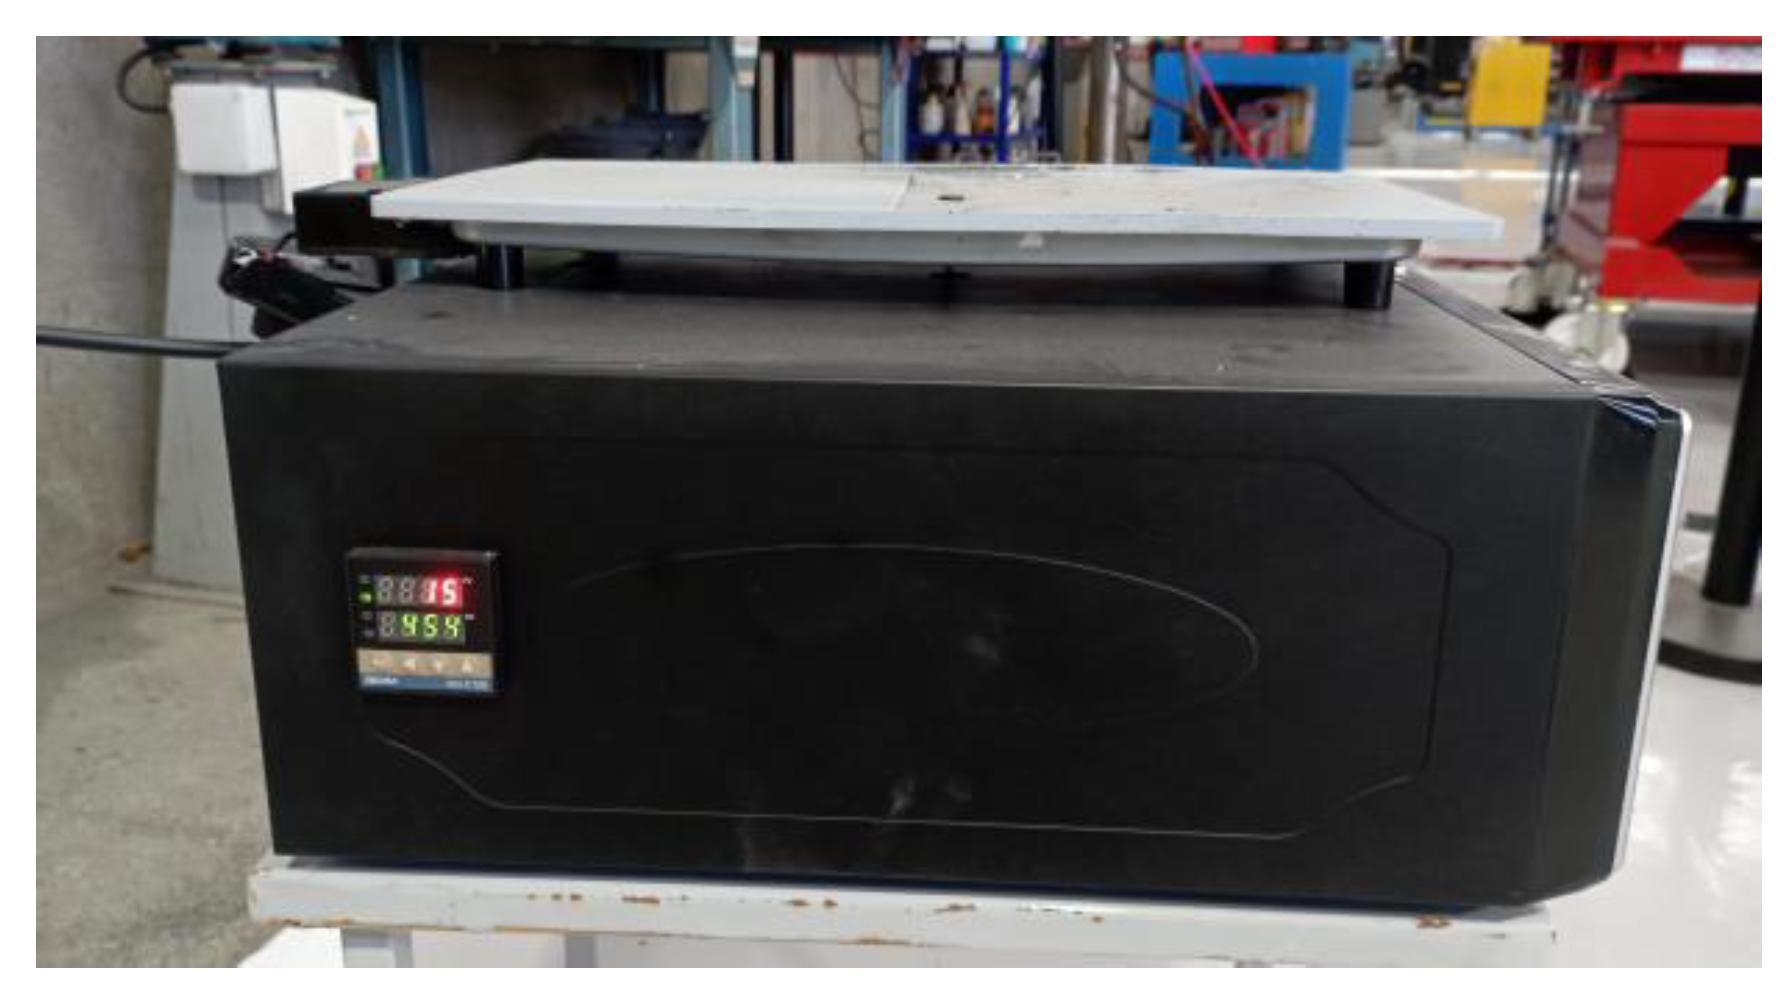
Heating of the cells is carried out using an electric iron instrumented with a PID (proportional integral derivative control) thermostat. A thermographic camera will also be used to monitor the T of the cells, as well as a voltmeter that will indicate when the cell voltage drops, which indicates that the cell is no longer functioning properly and may be due to the TR reaction having started. It should be borne in mind that, as the cells are joined together to carry out the test, they are not a purchased module, and therefore do not have a BMS to manage the behavior of the group of cells. Below is an image (
Figure 4) of the equipment used to heat the cells.
A summary of the test conditions and results obtained is shown in the following
Table 4.
3. Results
In this section we will analyze the results obtained in each of the tests carried out on the cells under study.
3.1. Mechanical Abuse Test Results
The results of the mechanical abuse tests carried out are shown below (
Table 5).
The results obtained in each of the tests will be analyzed in depth to draw conclusions.
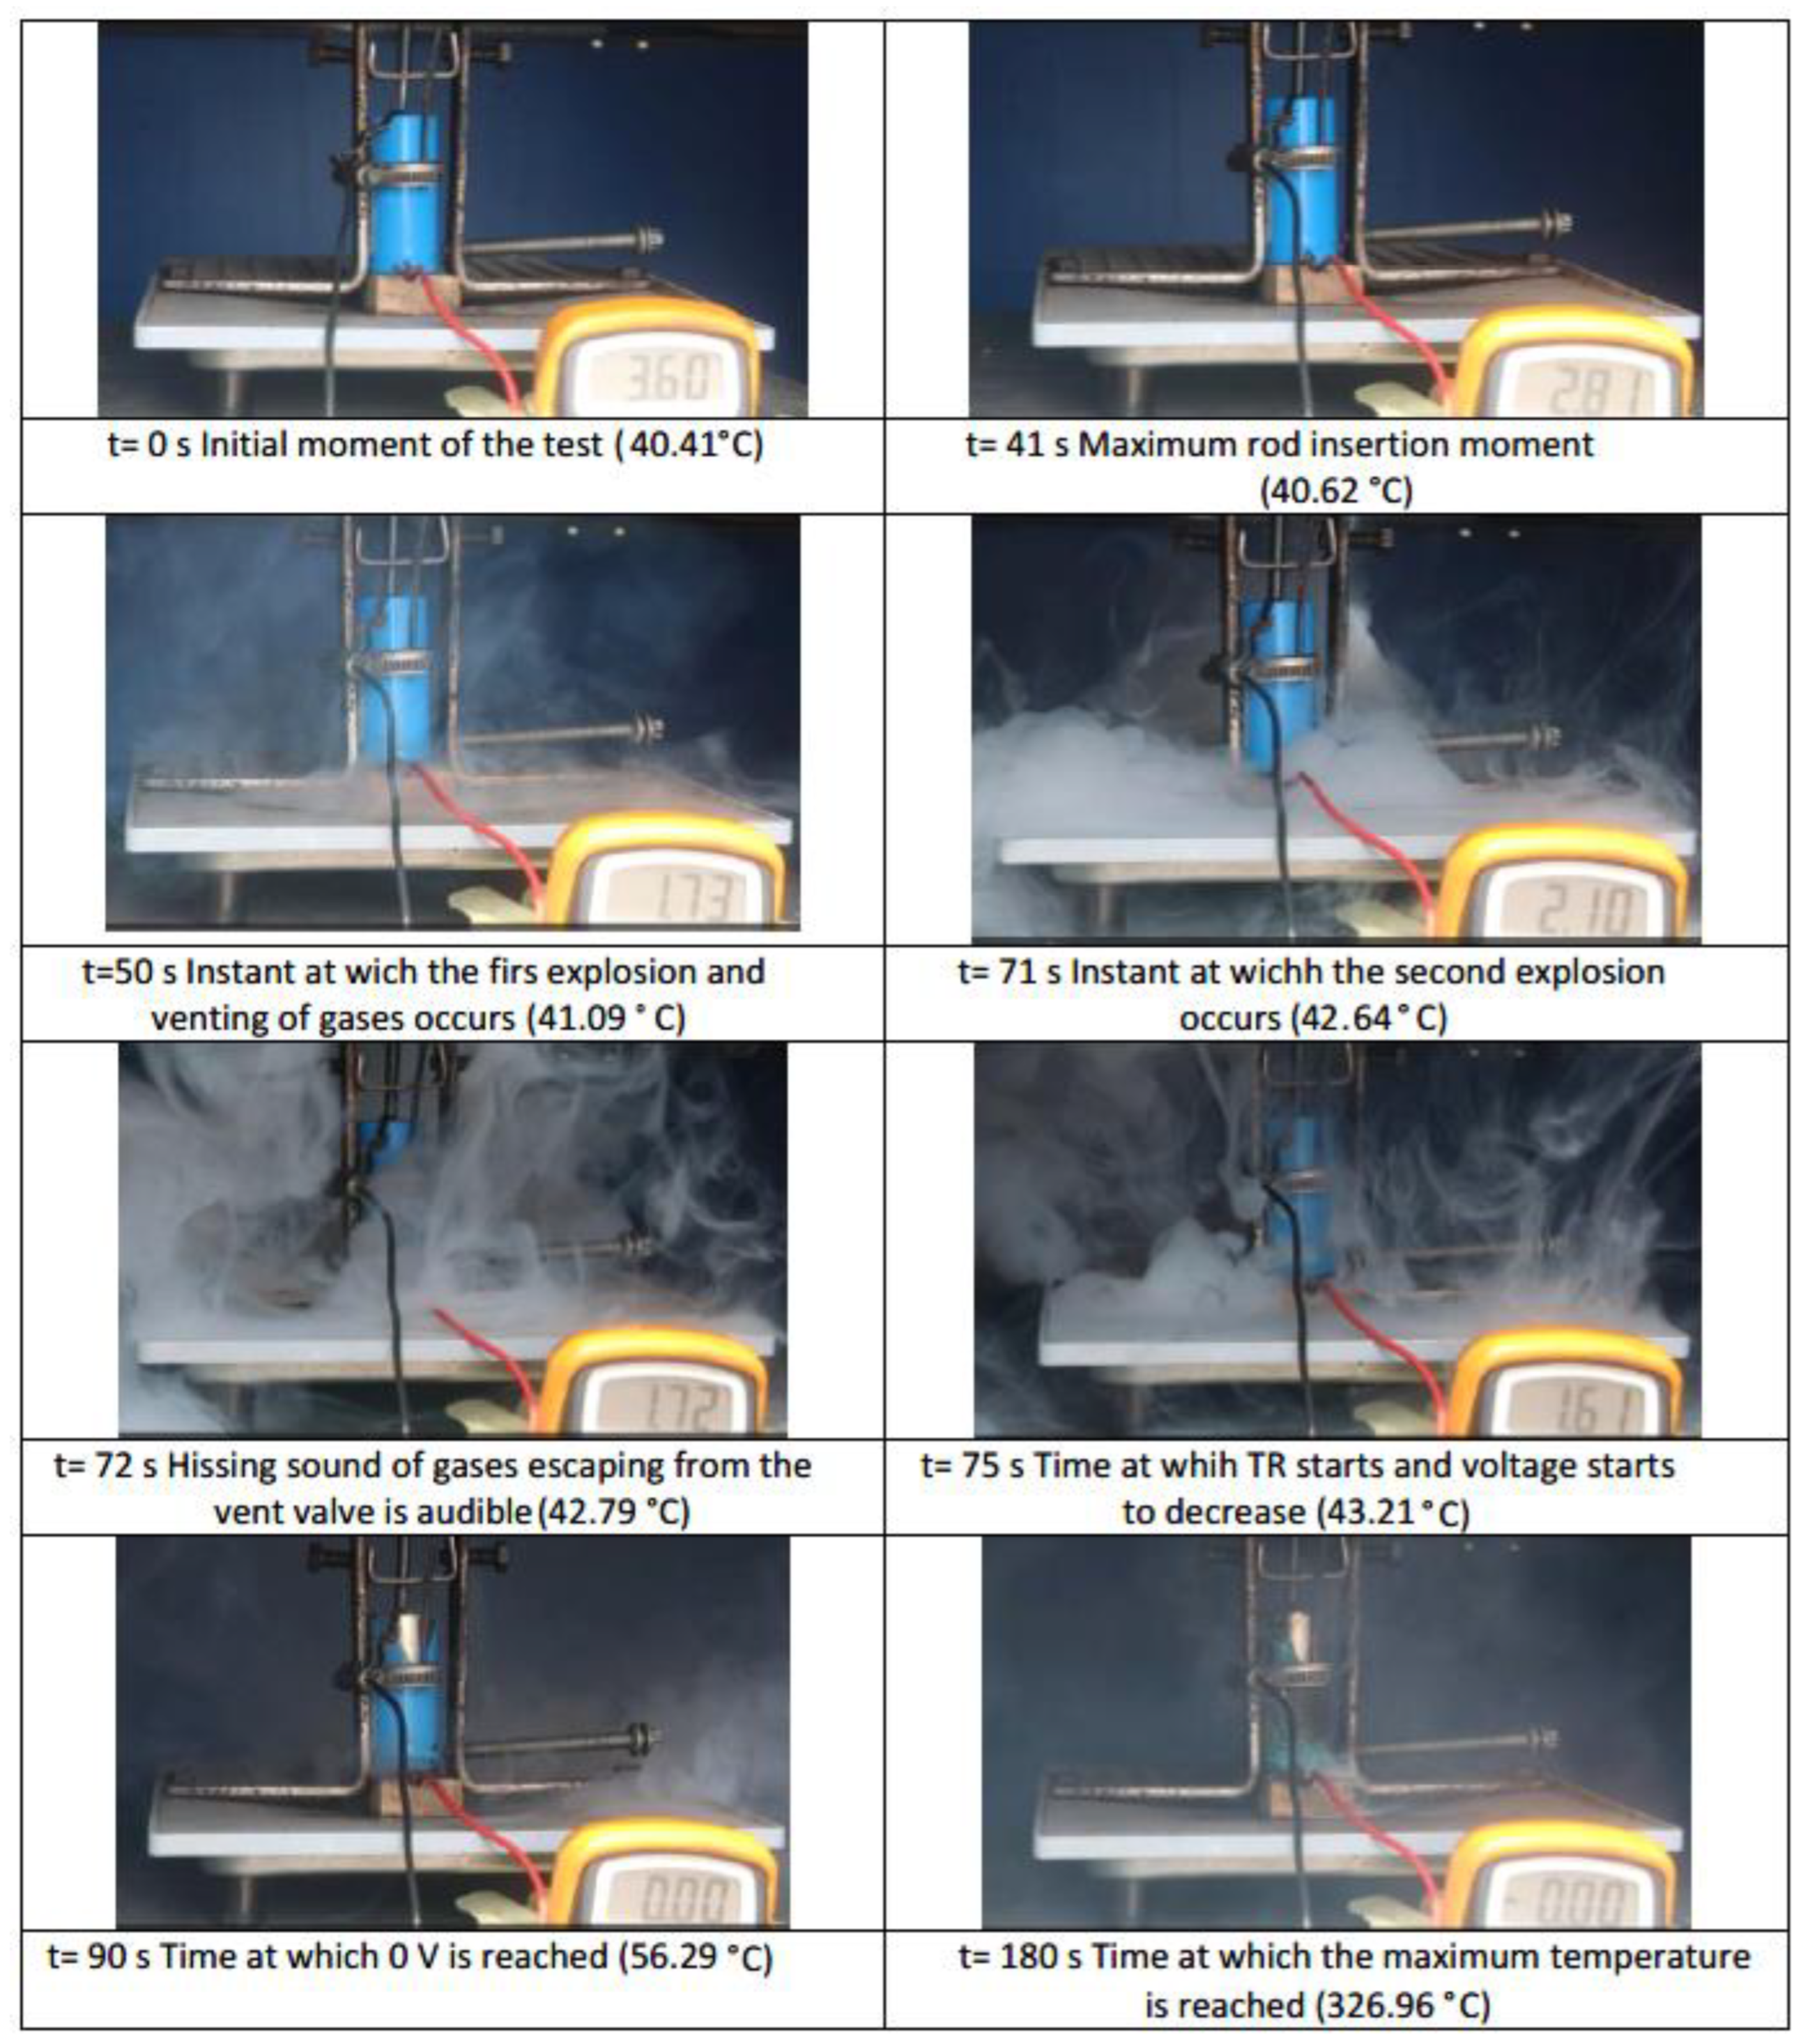
3.1.1. Test 1: Horizontal SoC 100% (cell A)
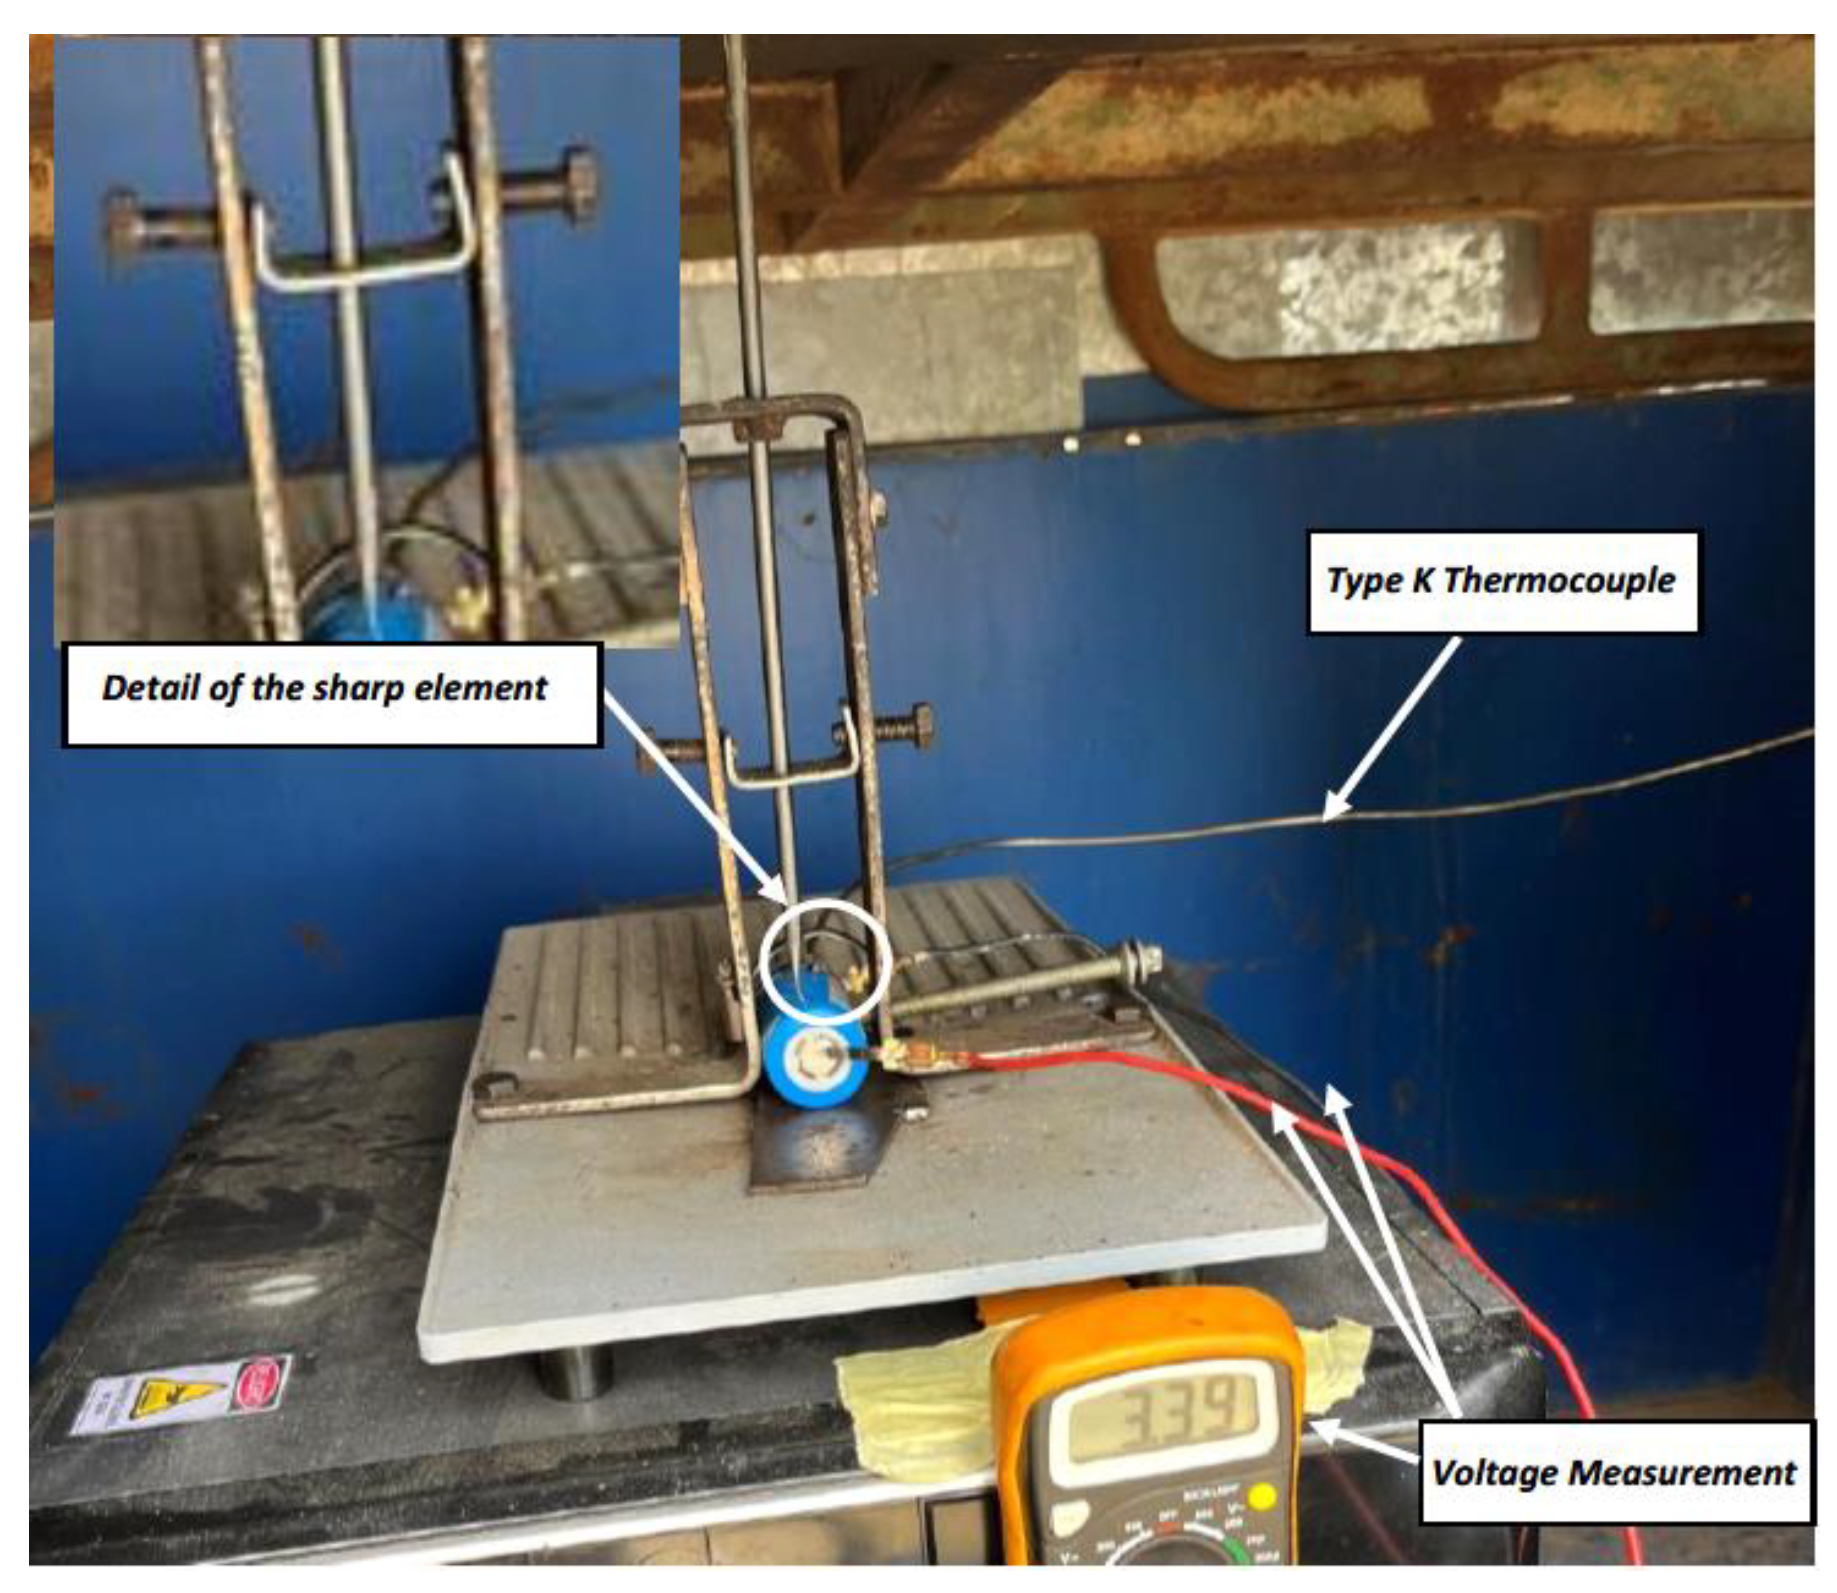
The test is carried out on a 32700 cylindrical cell in a horizontal arrangement with a SoC of 100%. A type K thermocouple is placed on the cell to measure its temperature and a voltmeter is used to measure the voltage during the test. A tool has been prepared to pierce the cell horizontally (perpendicular to the longitudinal axis of the cylindrical cell) with a sharp tool, the
Figure 5 shows the test set-up.
Images of the state of cell A after the perforation test in the direction perpendicular to its longitudinal axis are shown below (
Figure 6).
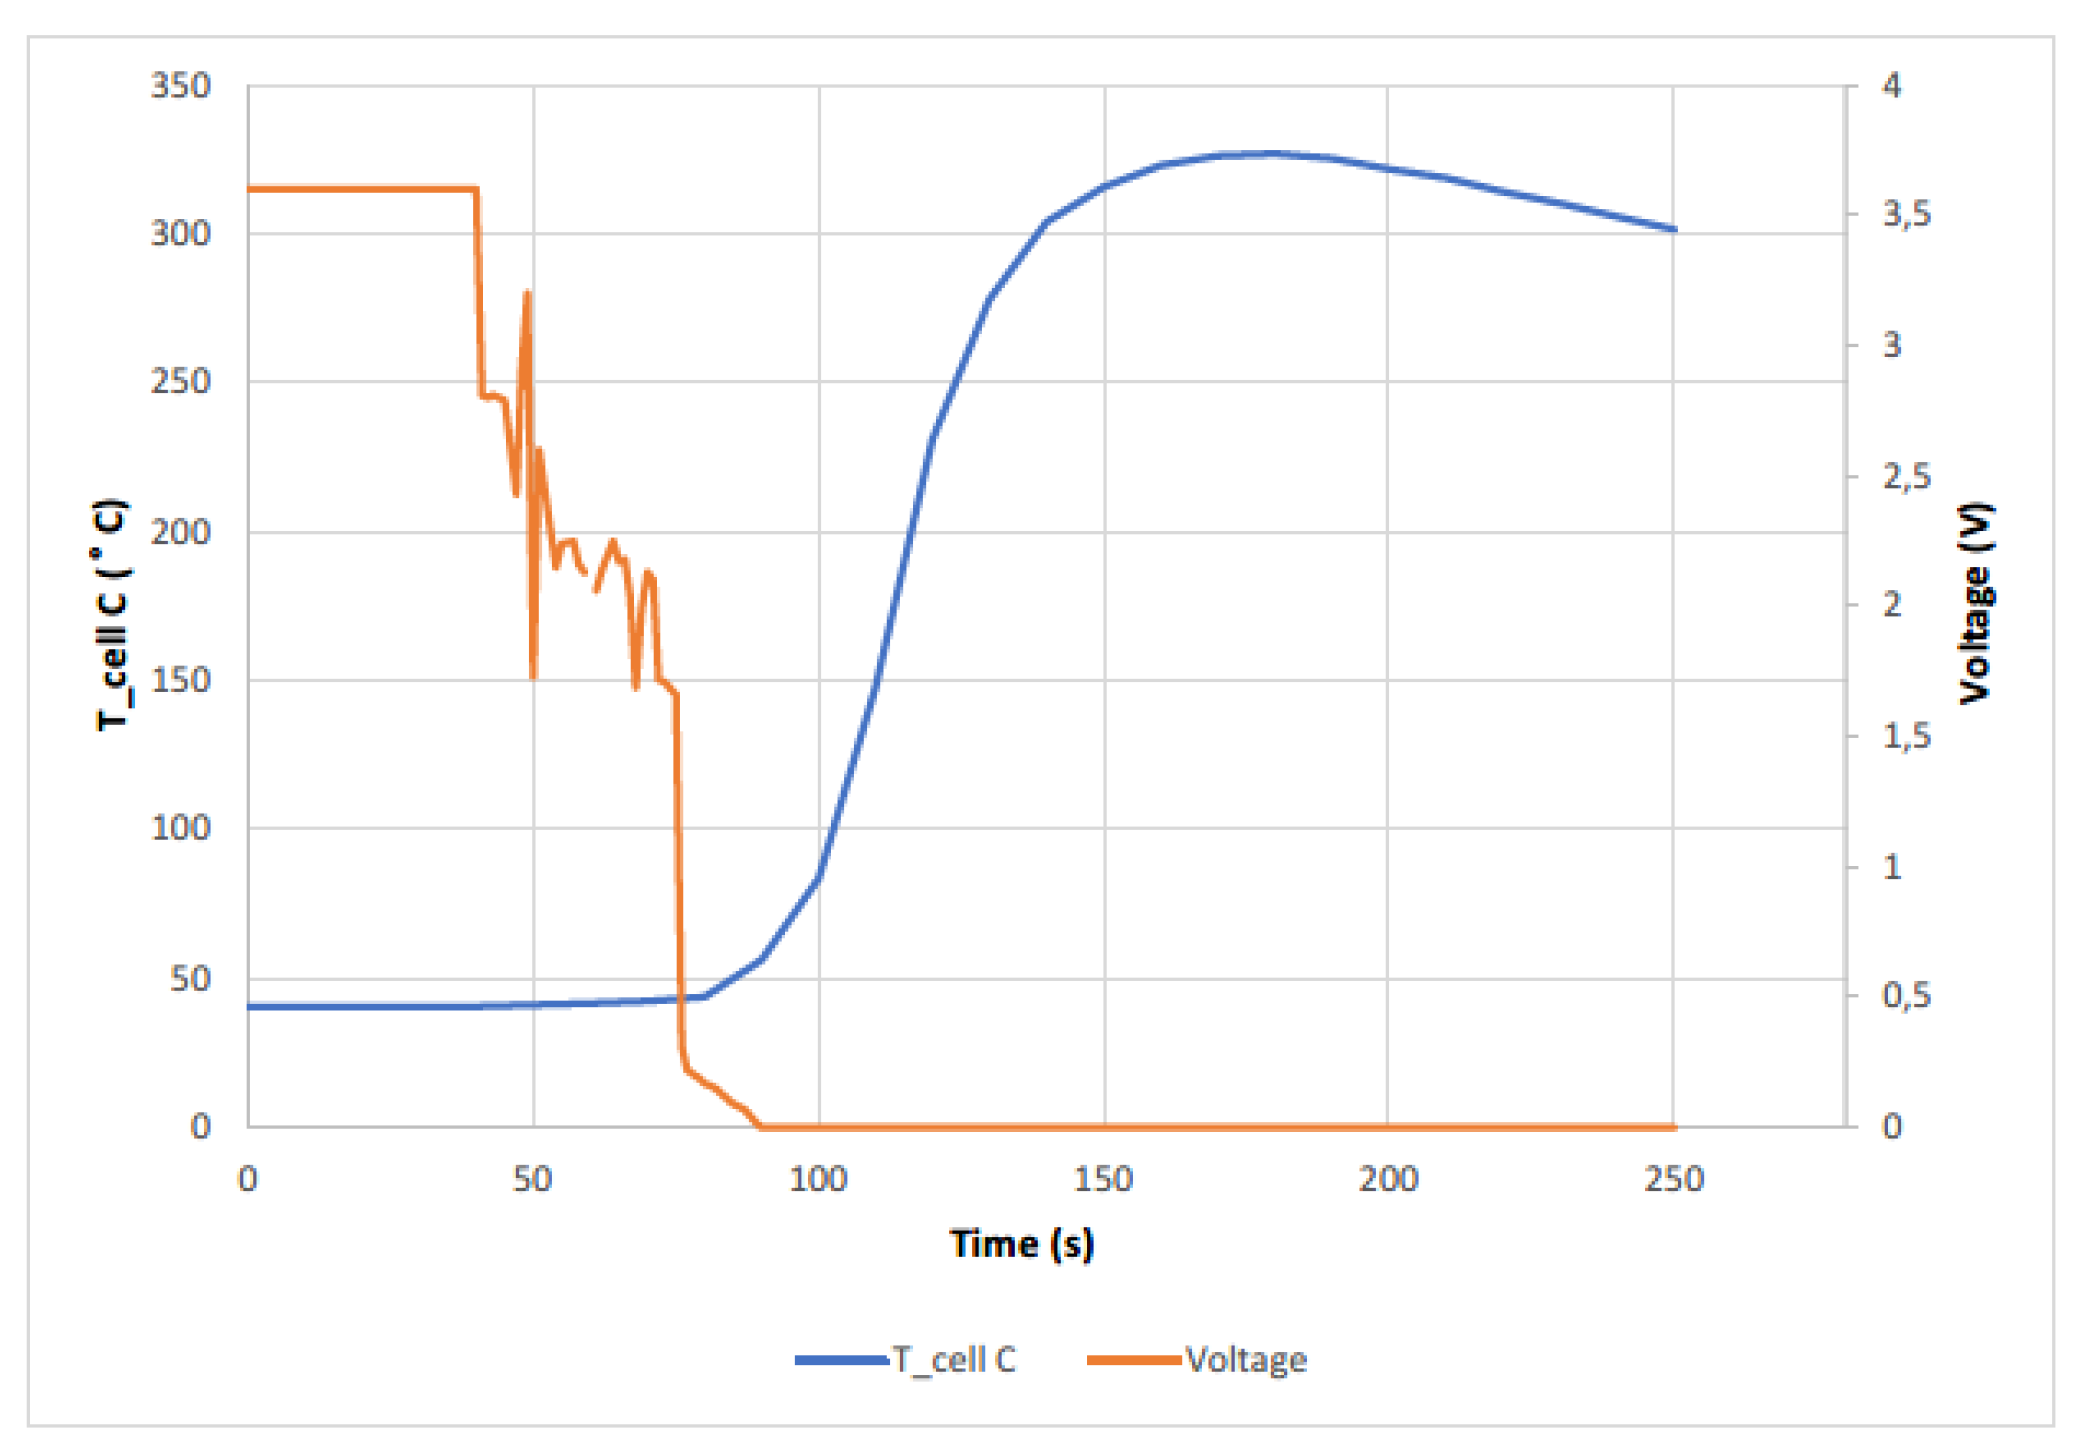
During the test of penetration of a rod into the cell perpendicular to its longitudinal axis, it was observed that a certain penetration of the rod into the cell is necessary to trigger theTR process. The venting of the cell took place through the vent valve located at the positive pole of the cell. It can be concluded that a significant damage to the competent cell internals is necessary to trigger the TR process.
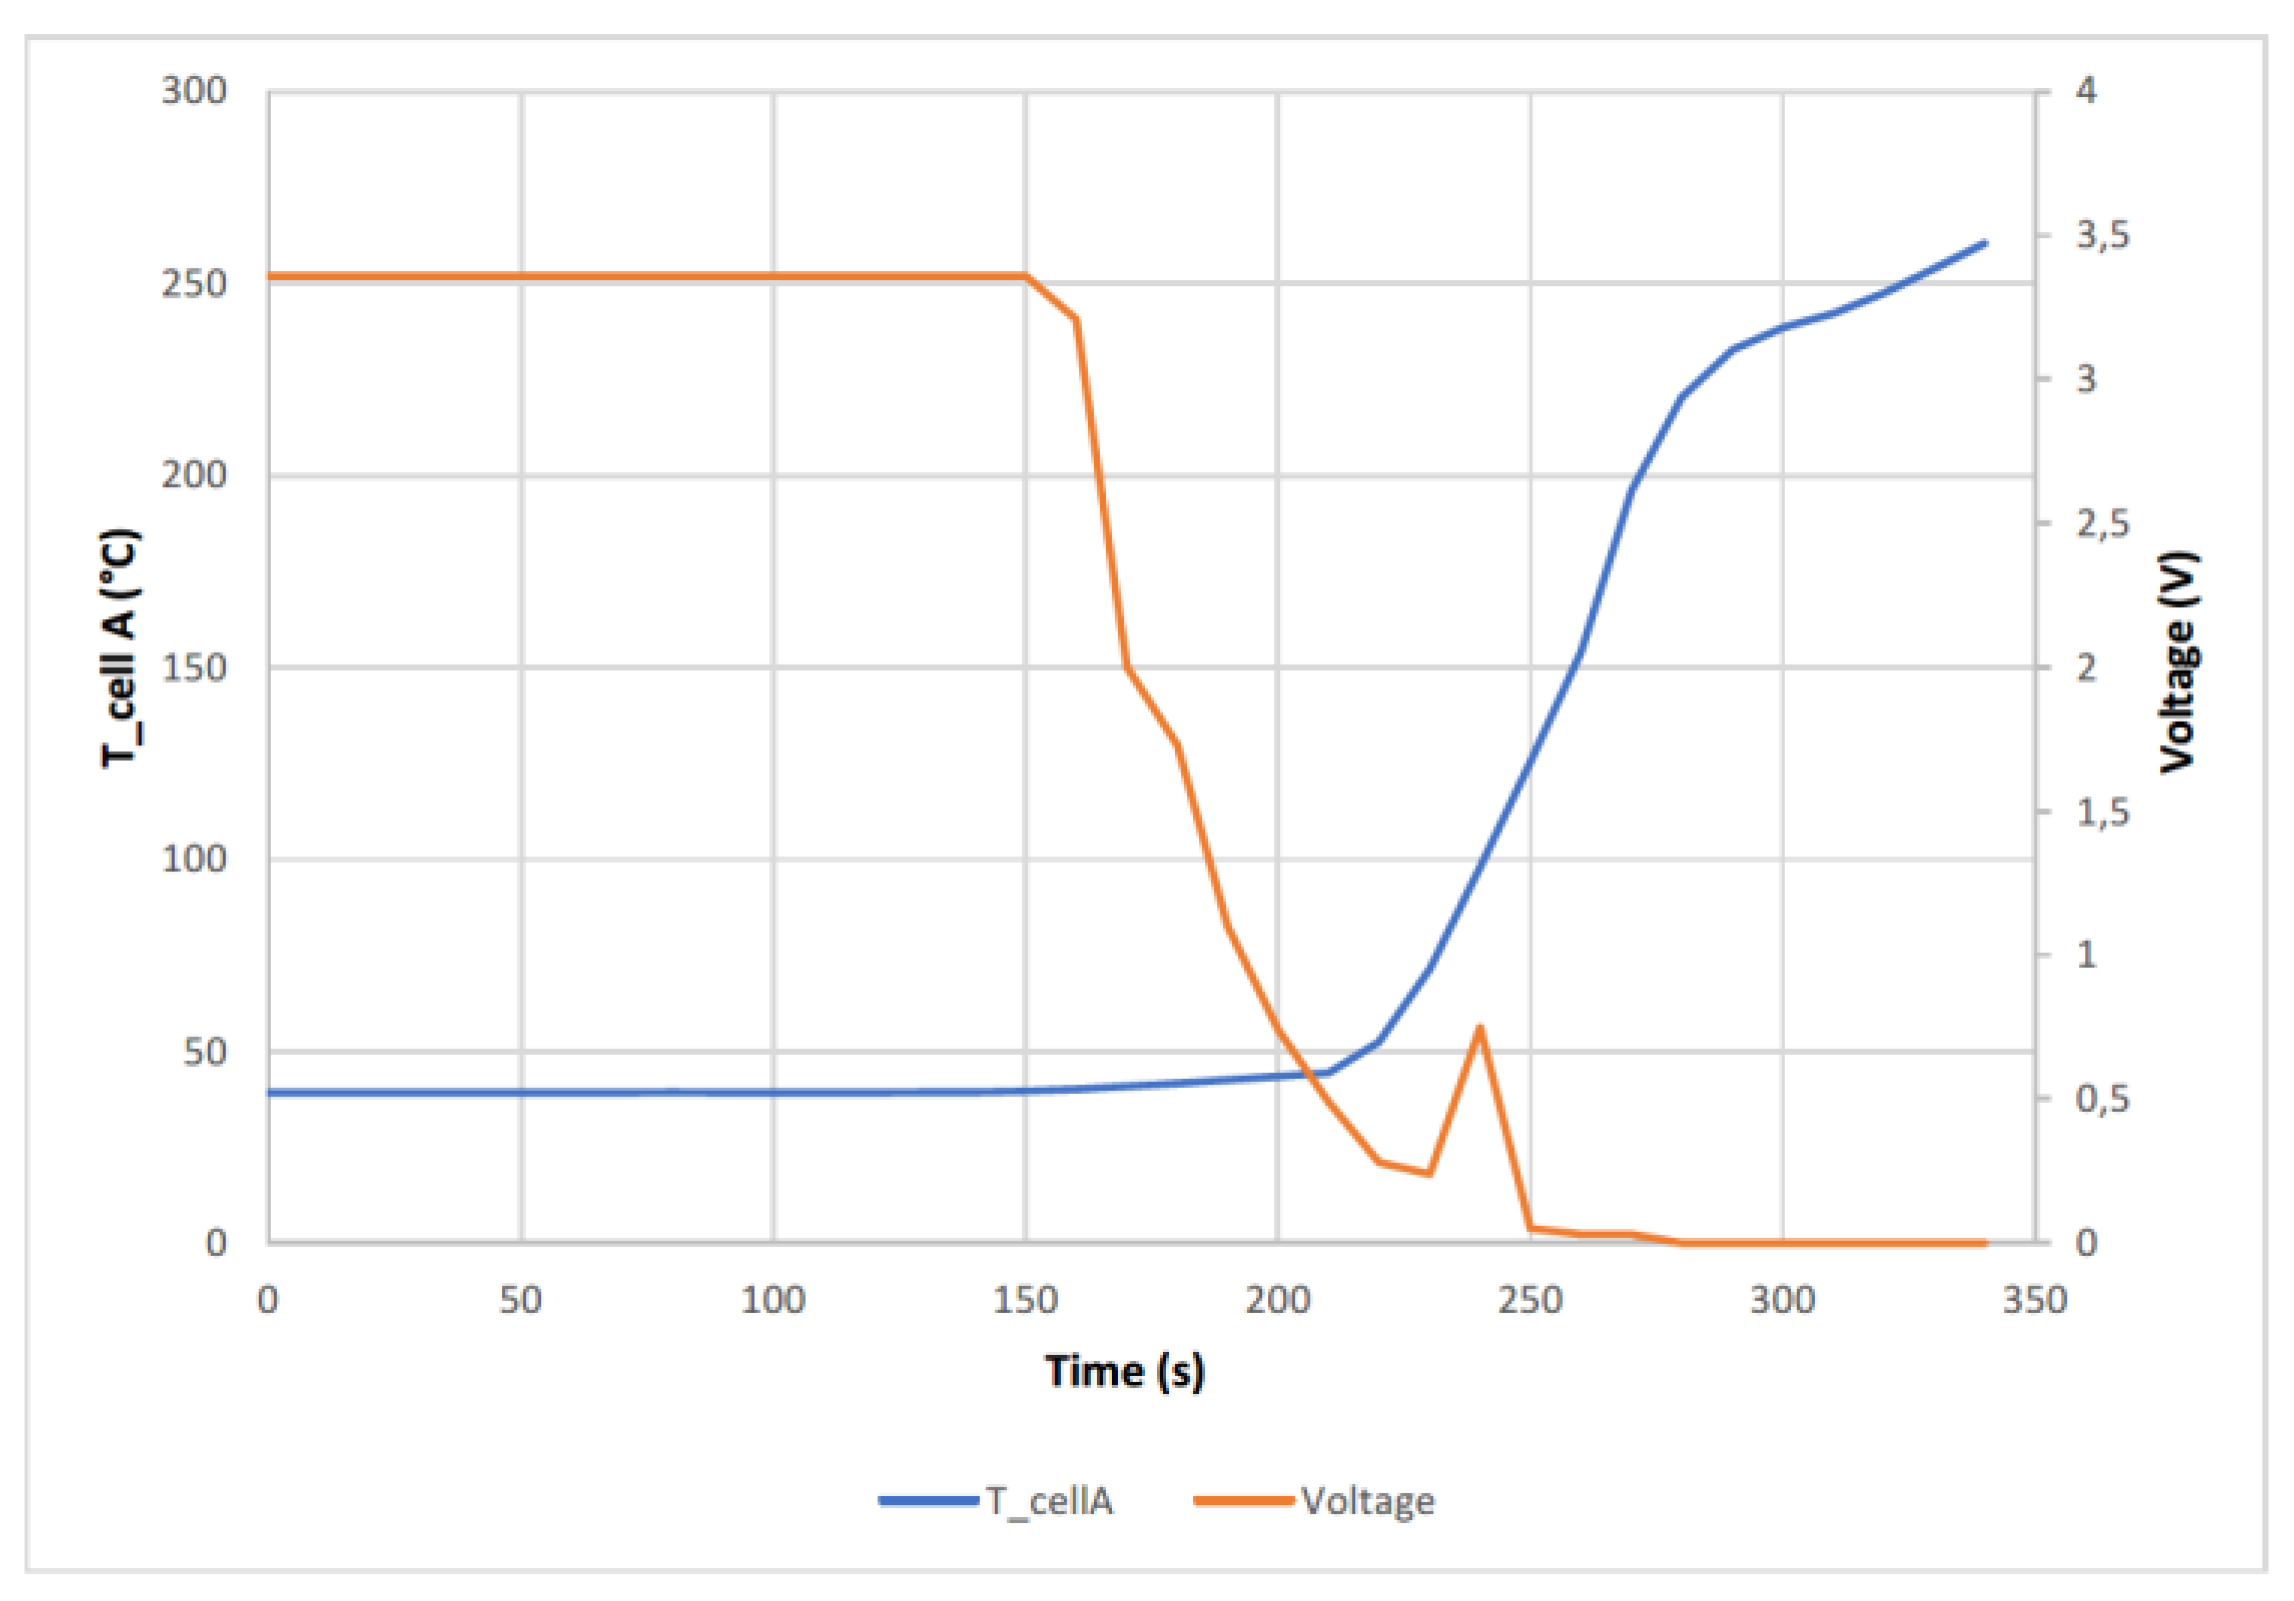
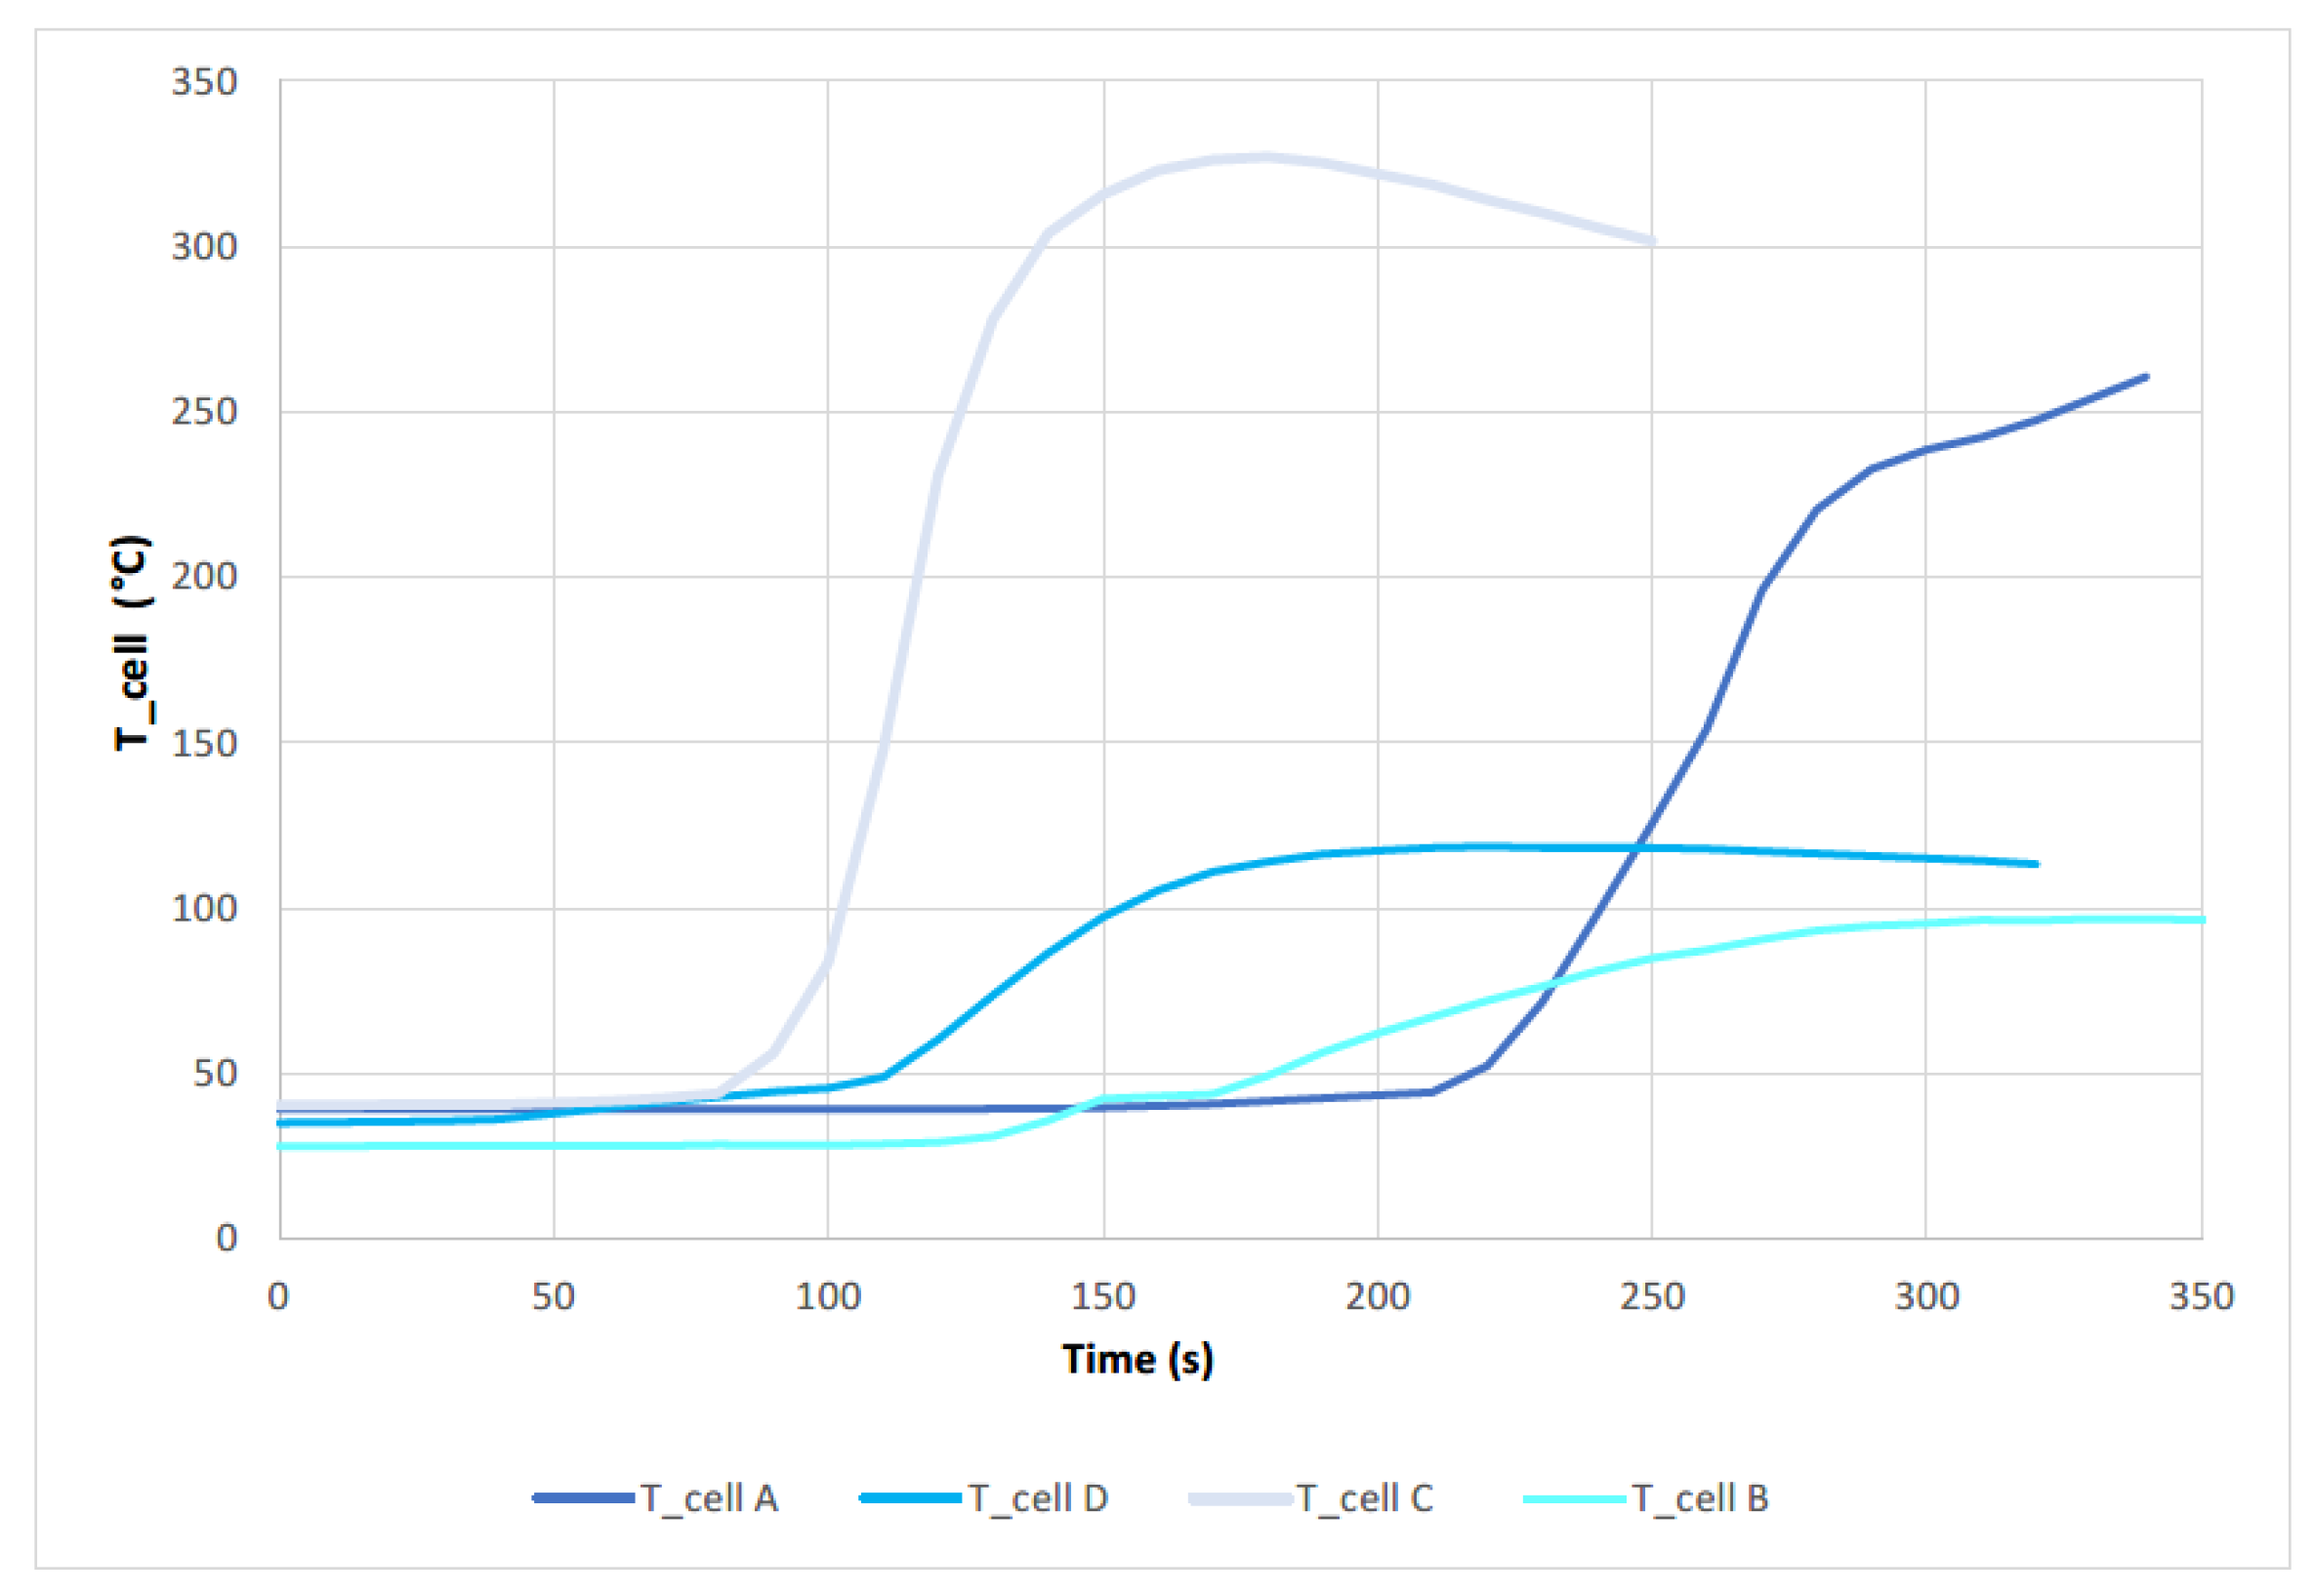
The cell reached a maximum temperature of 261 °C, when compared to other studies carried out on NMC cells [
53], it is observed that the maximum temperature peak is lower in the case of LFP cells (tested) than in the case of NMC cells. In the following graph (
Figure 7), the temperature reached by the A cell as well as the voltage behaviour is observed.
In the
Figure 7 when the TR process starts to occur, the voltage starts to drop, but not abruptly, then it can be seen a small voltage rise that corresponds to a second event, identified by a more violent exit of the gases and the electrolyte, and then drops to 0 V. This small voltage peak also corresponds to a change in the slope of the cell temperature curve. The voltage drop is due to delamination of the electrodes. After the voltage drop, a temperature rise occurs as the rate of heat production is greater than the rate of release it possesses. In the figure above, the short-circuit is not as abrupt as in the case of NMC lithium-ion batteries [
53].
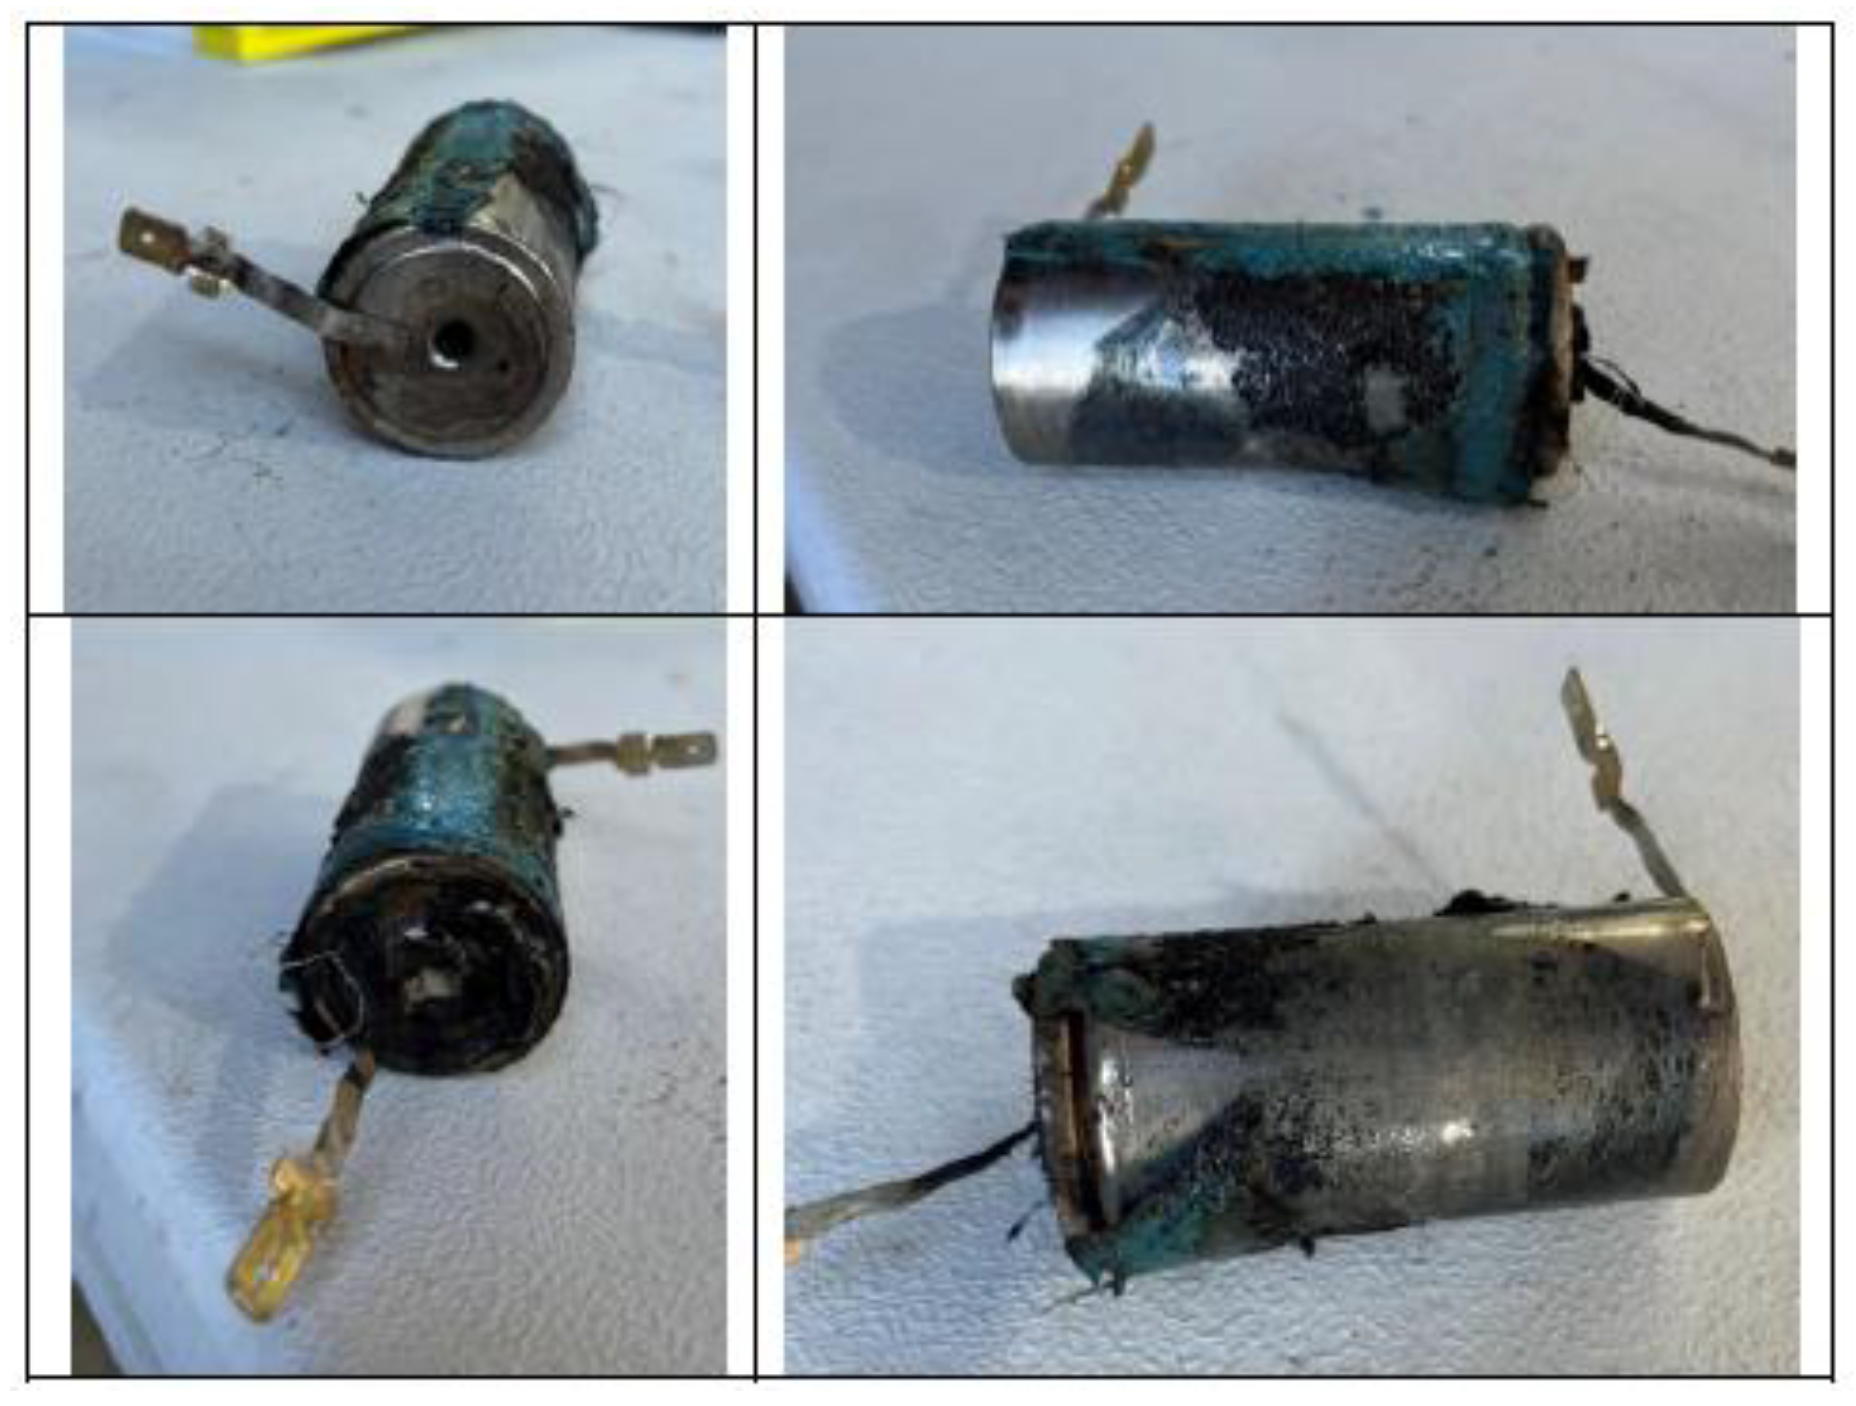
Below is an image (
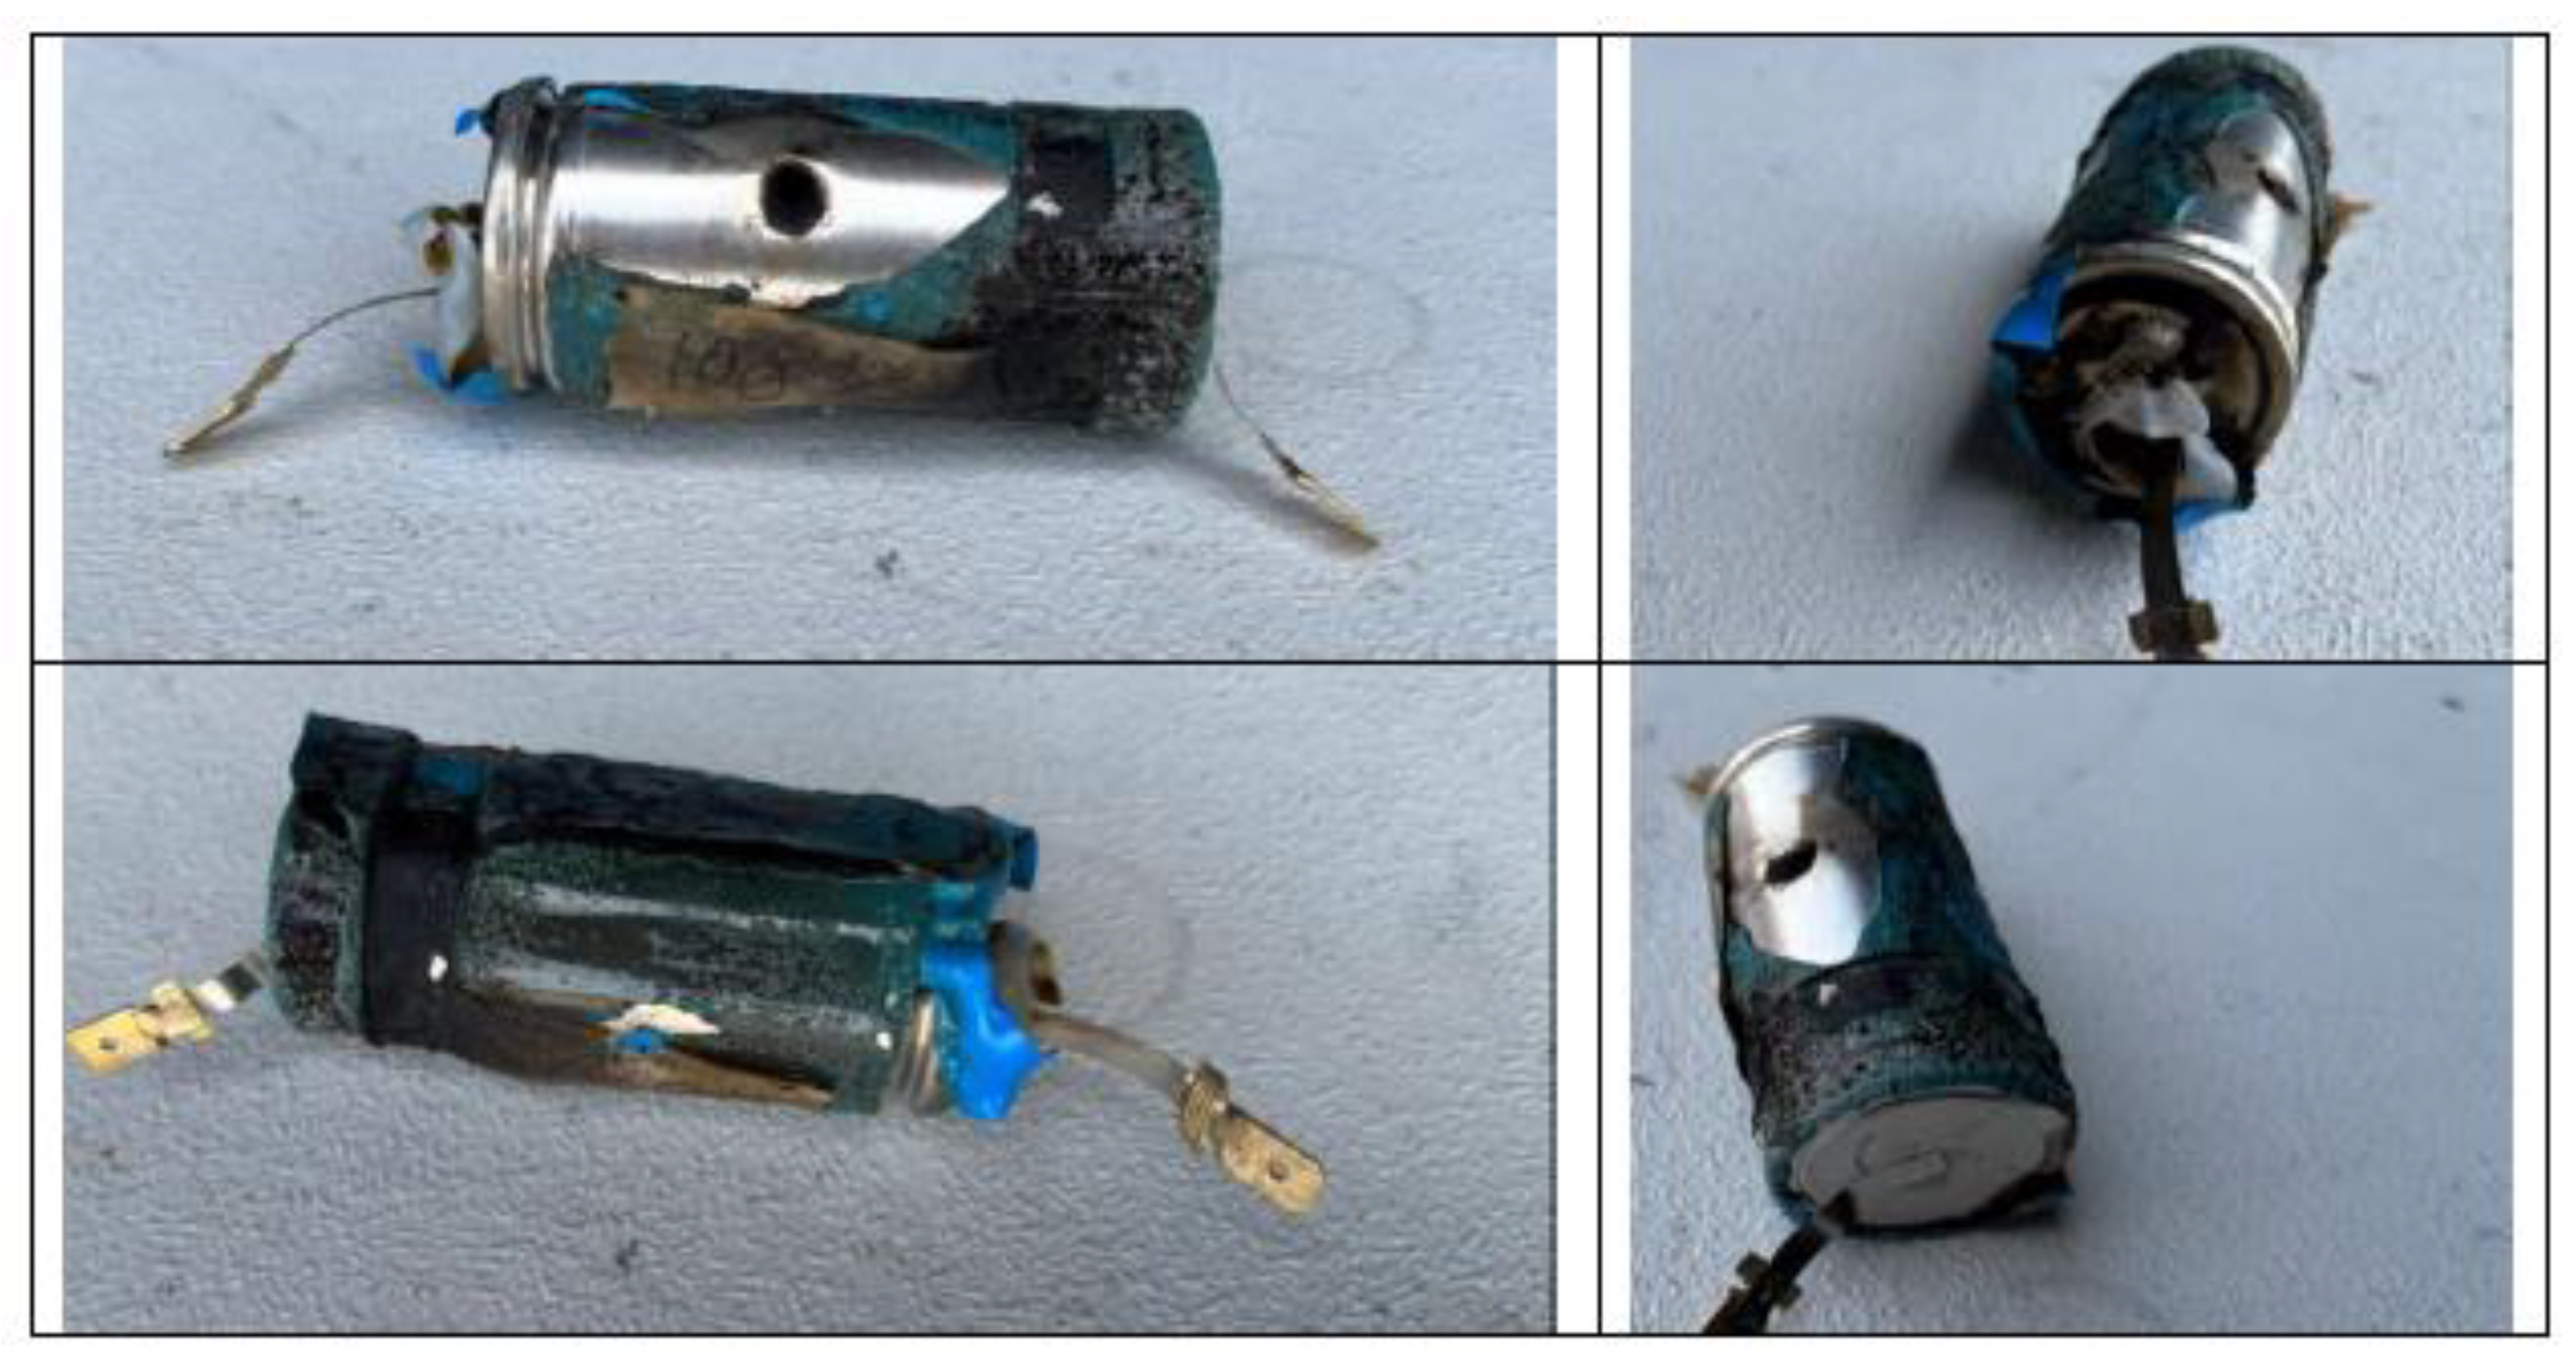
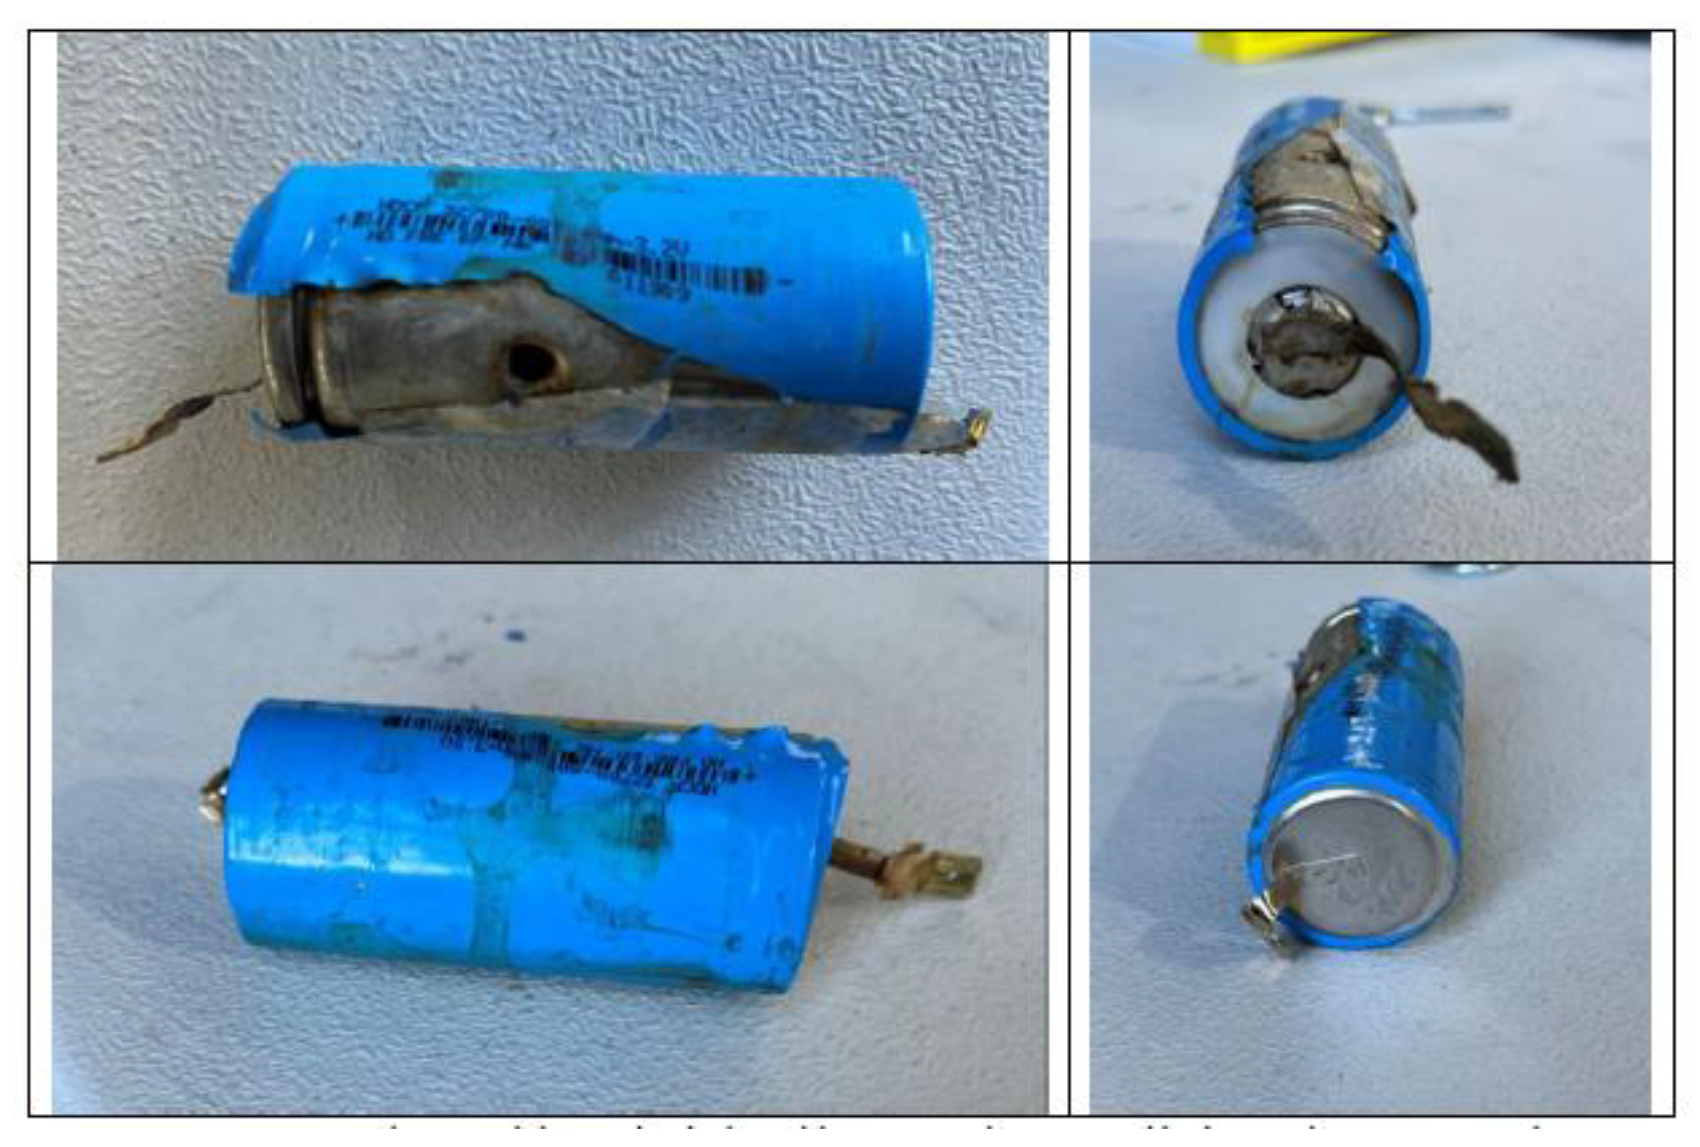
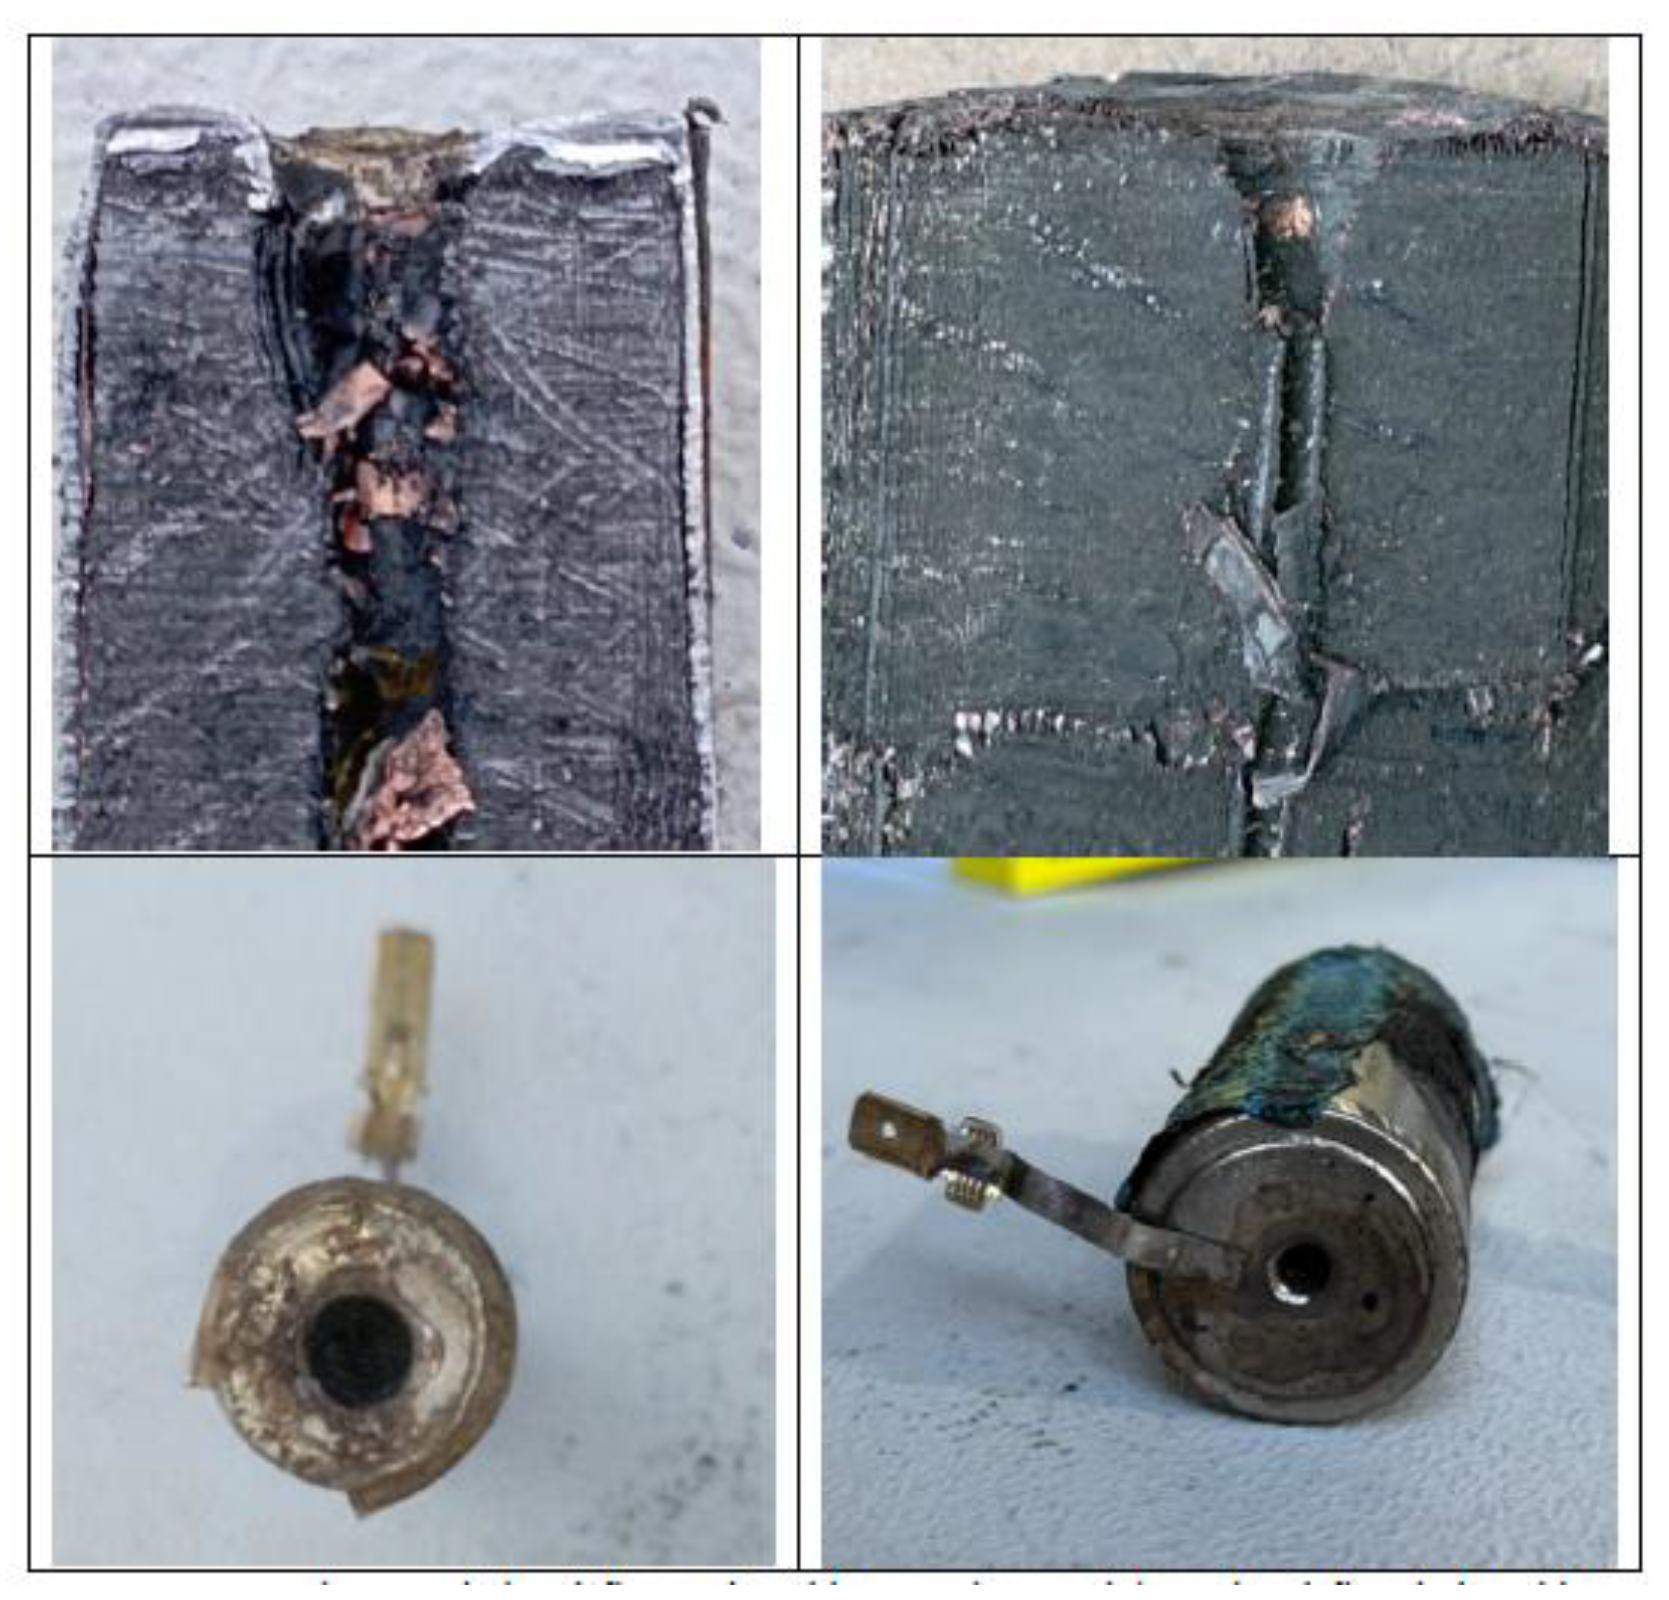
Figure 8) of the sectioned cell after undergoing the test, in which a significant perforation of the cell can be seen before the short-circuit occurs, as well as considerable damage to the electrodes in the perforation. It can also be observed that in this type of cell the central part is solid, while in other types of cells this central part is empty, as in the case of LG 2200 mAh cells, model ICR18650 S3.
In
Figure 8, the image of the cell (left) shows significant damage to the electrode as a whole, with no collapse of the central cavity because it is solid. The detailed image of the perforation point (right) shows significant damage to the electrodes leading to the short circuit. No molten particles of the electrode materials are observed as the melting temperature of the aluminium (660 °C) and copper (1,080 °C) is higher than the maximum temperature reached by the cell during the TR process.
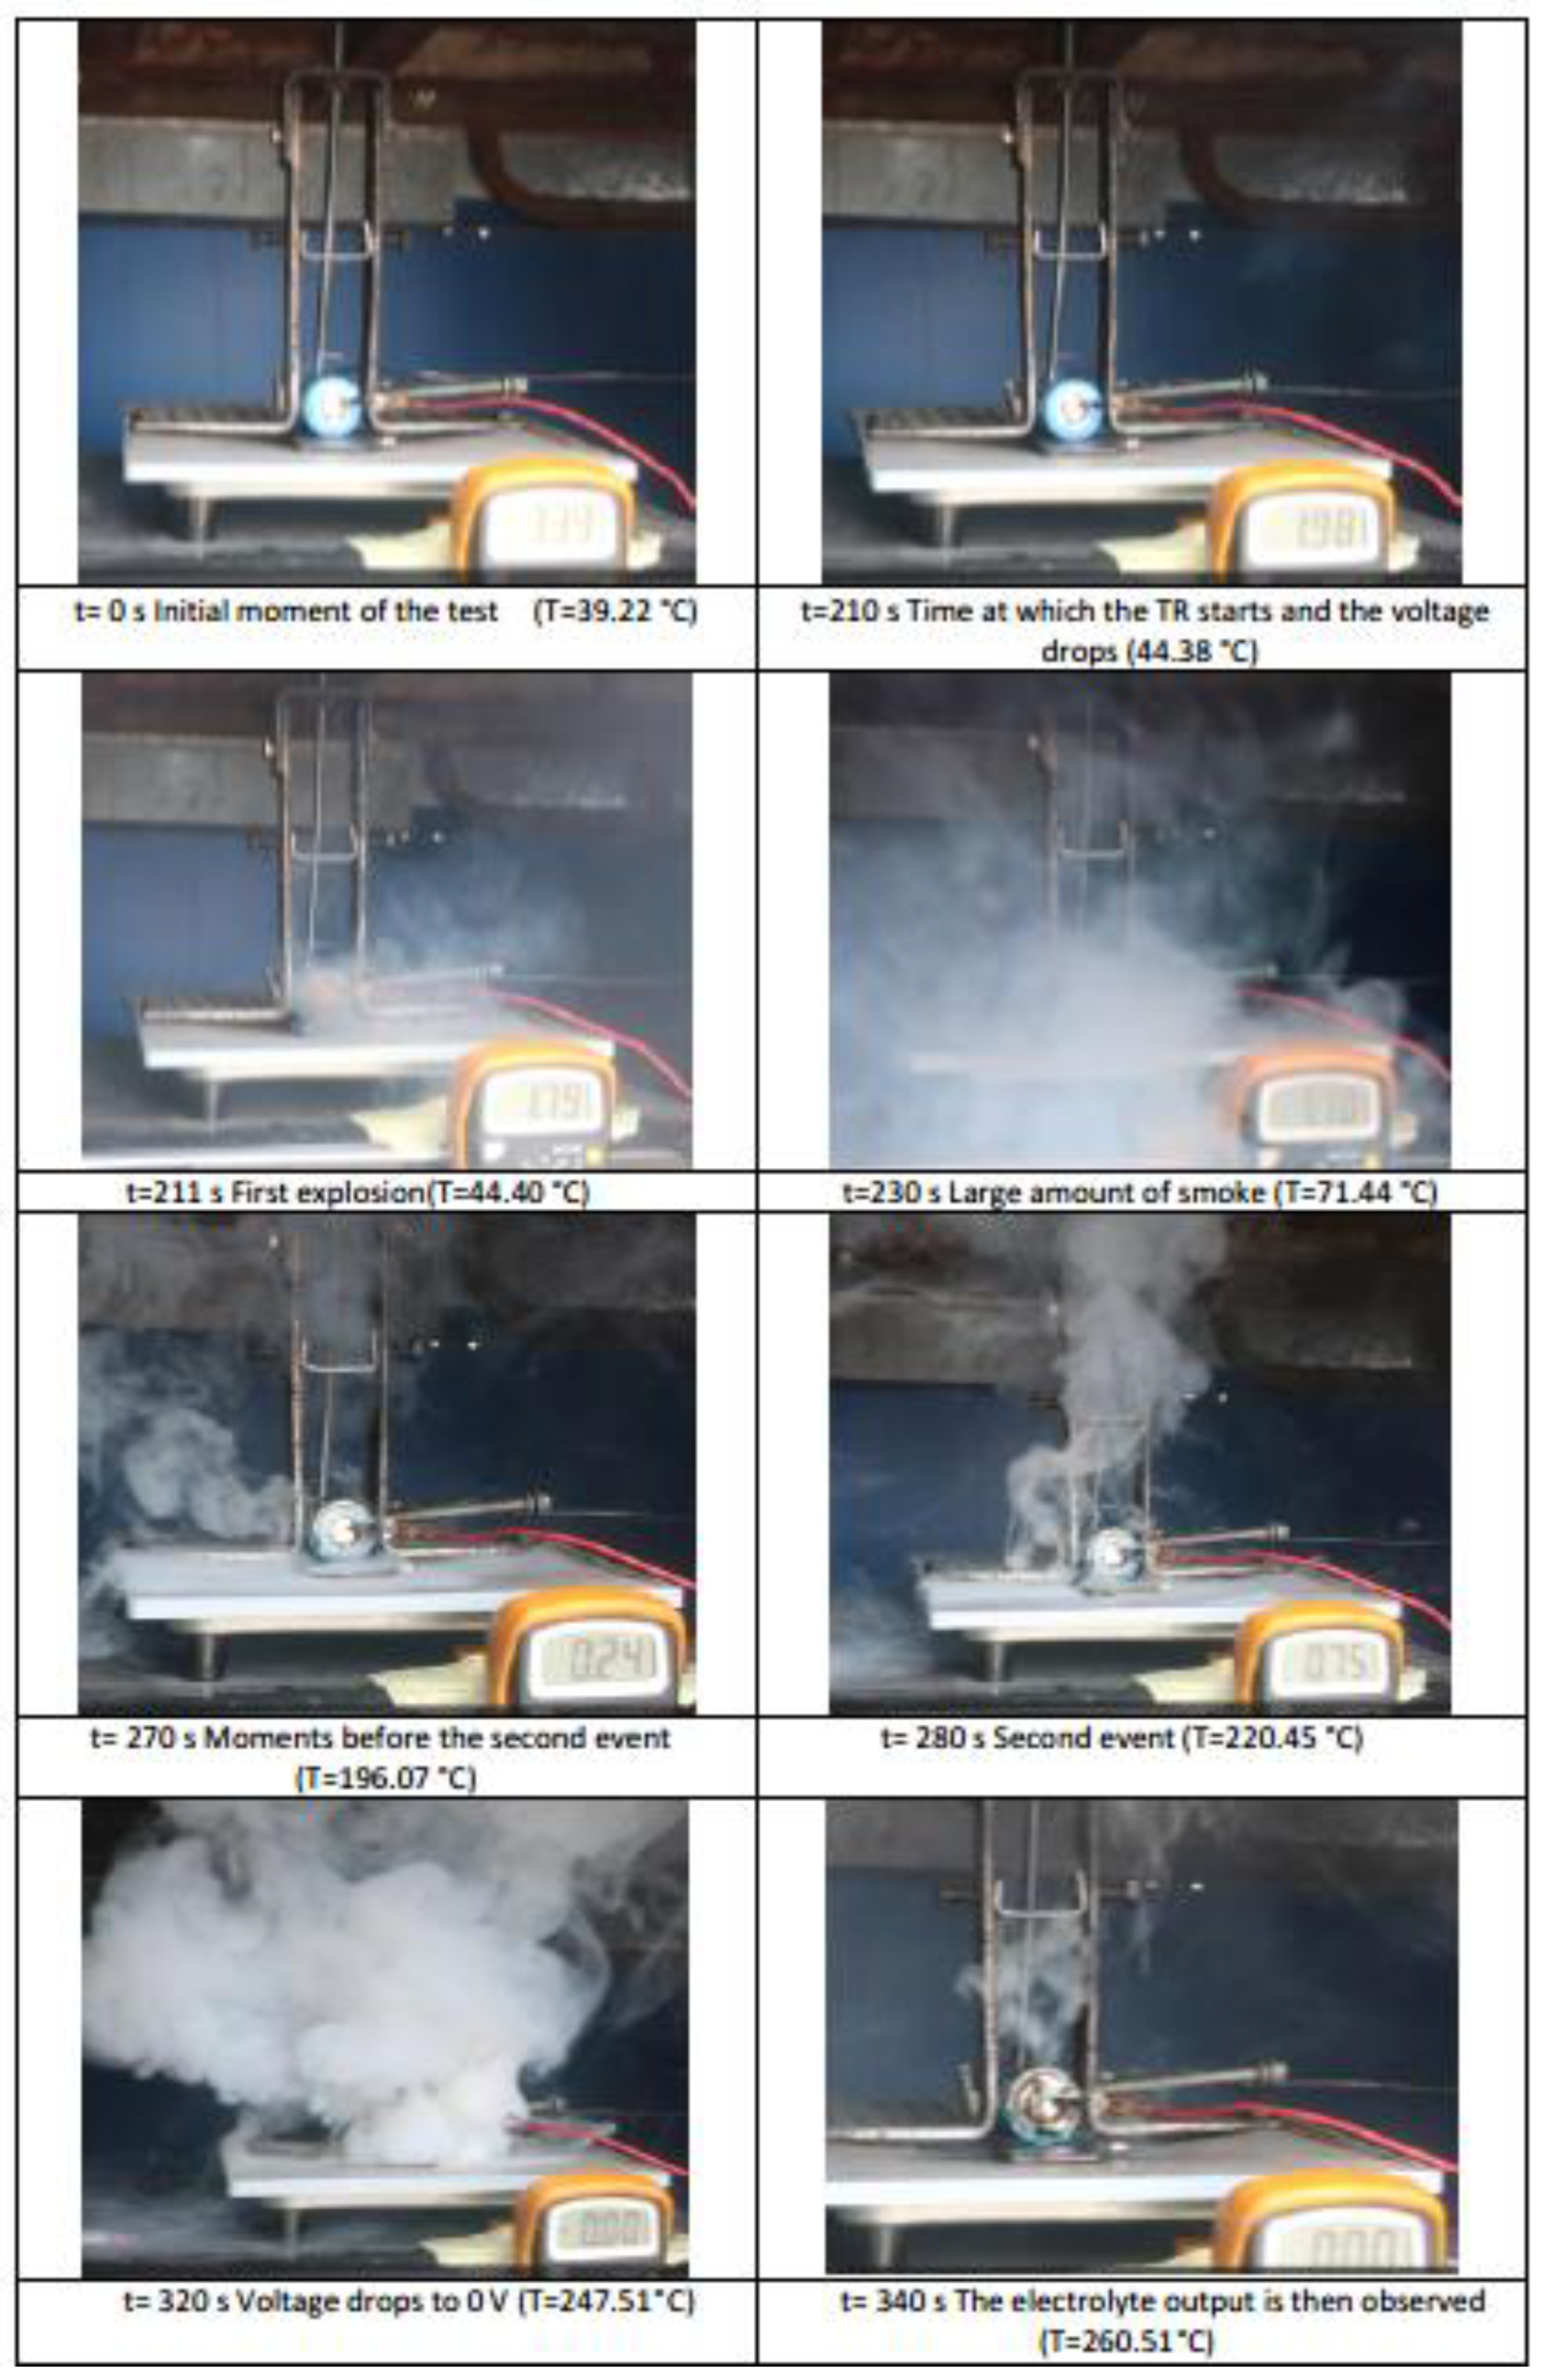
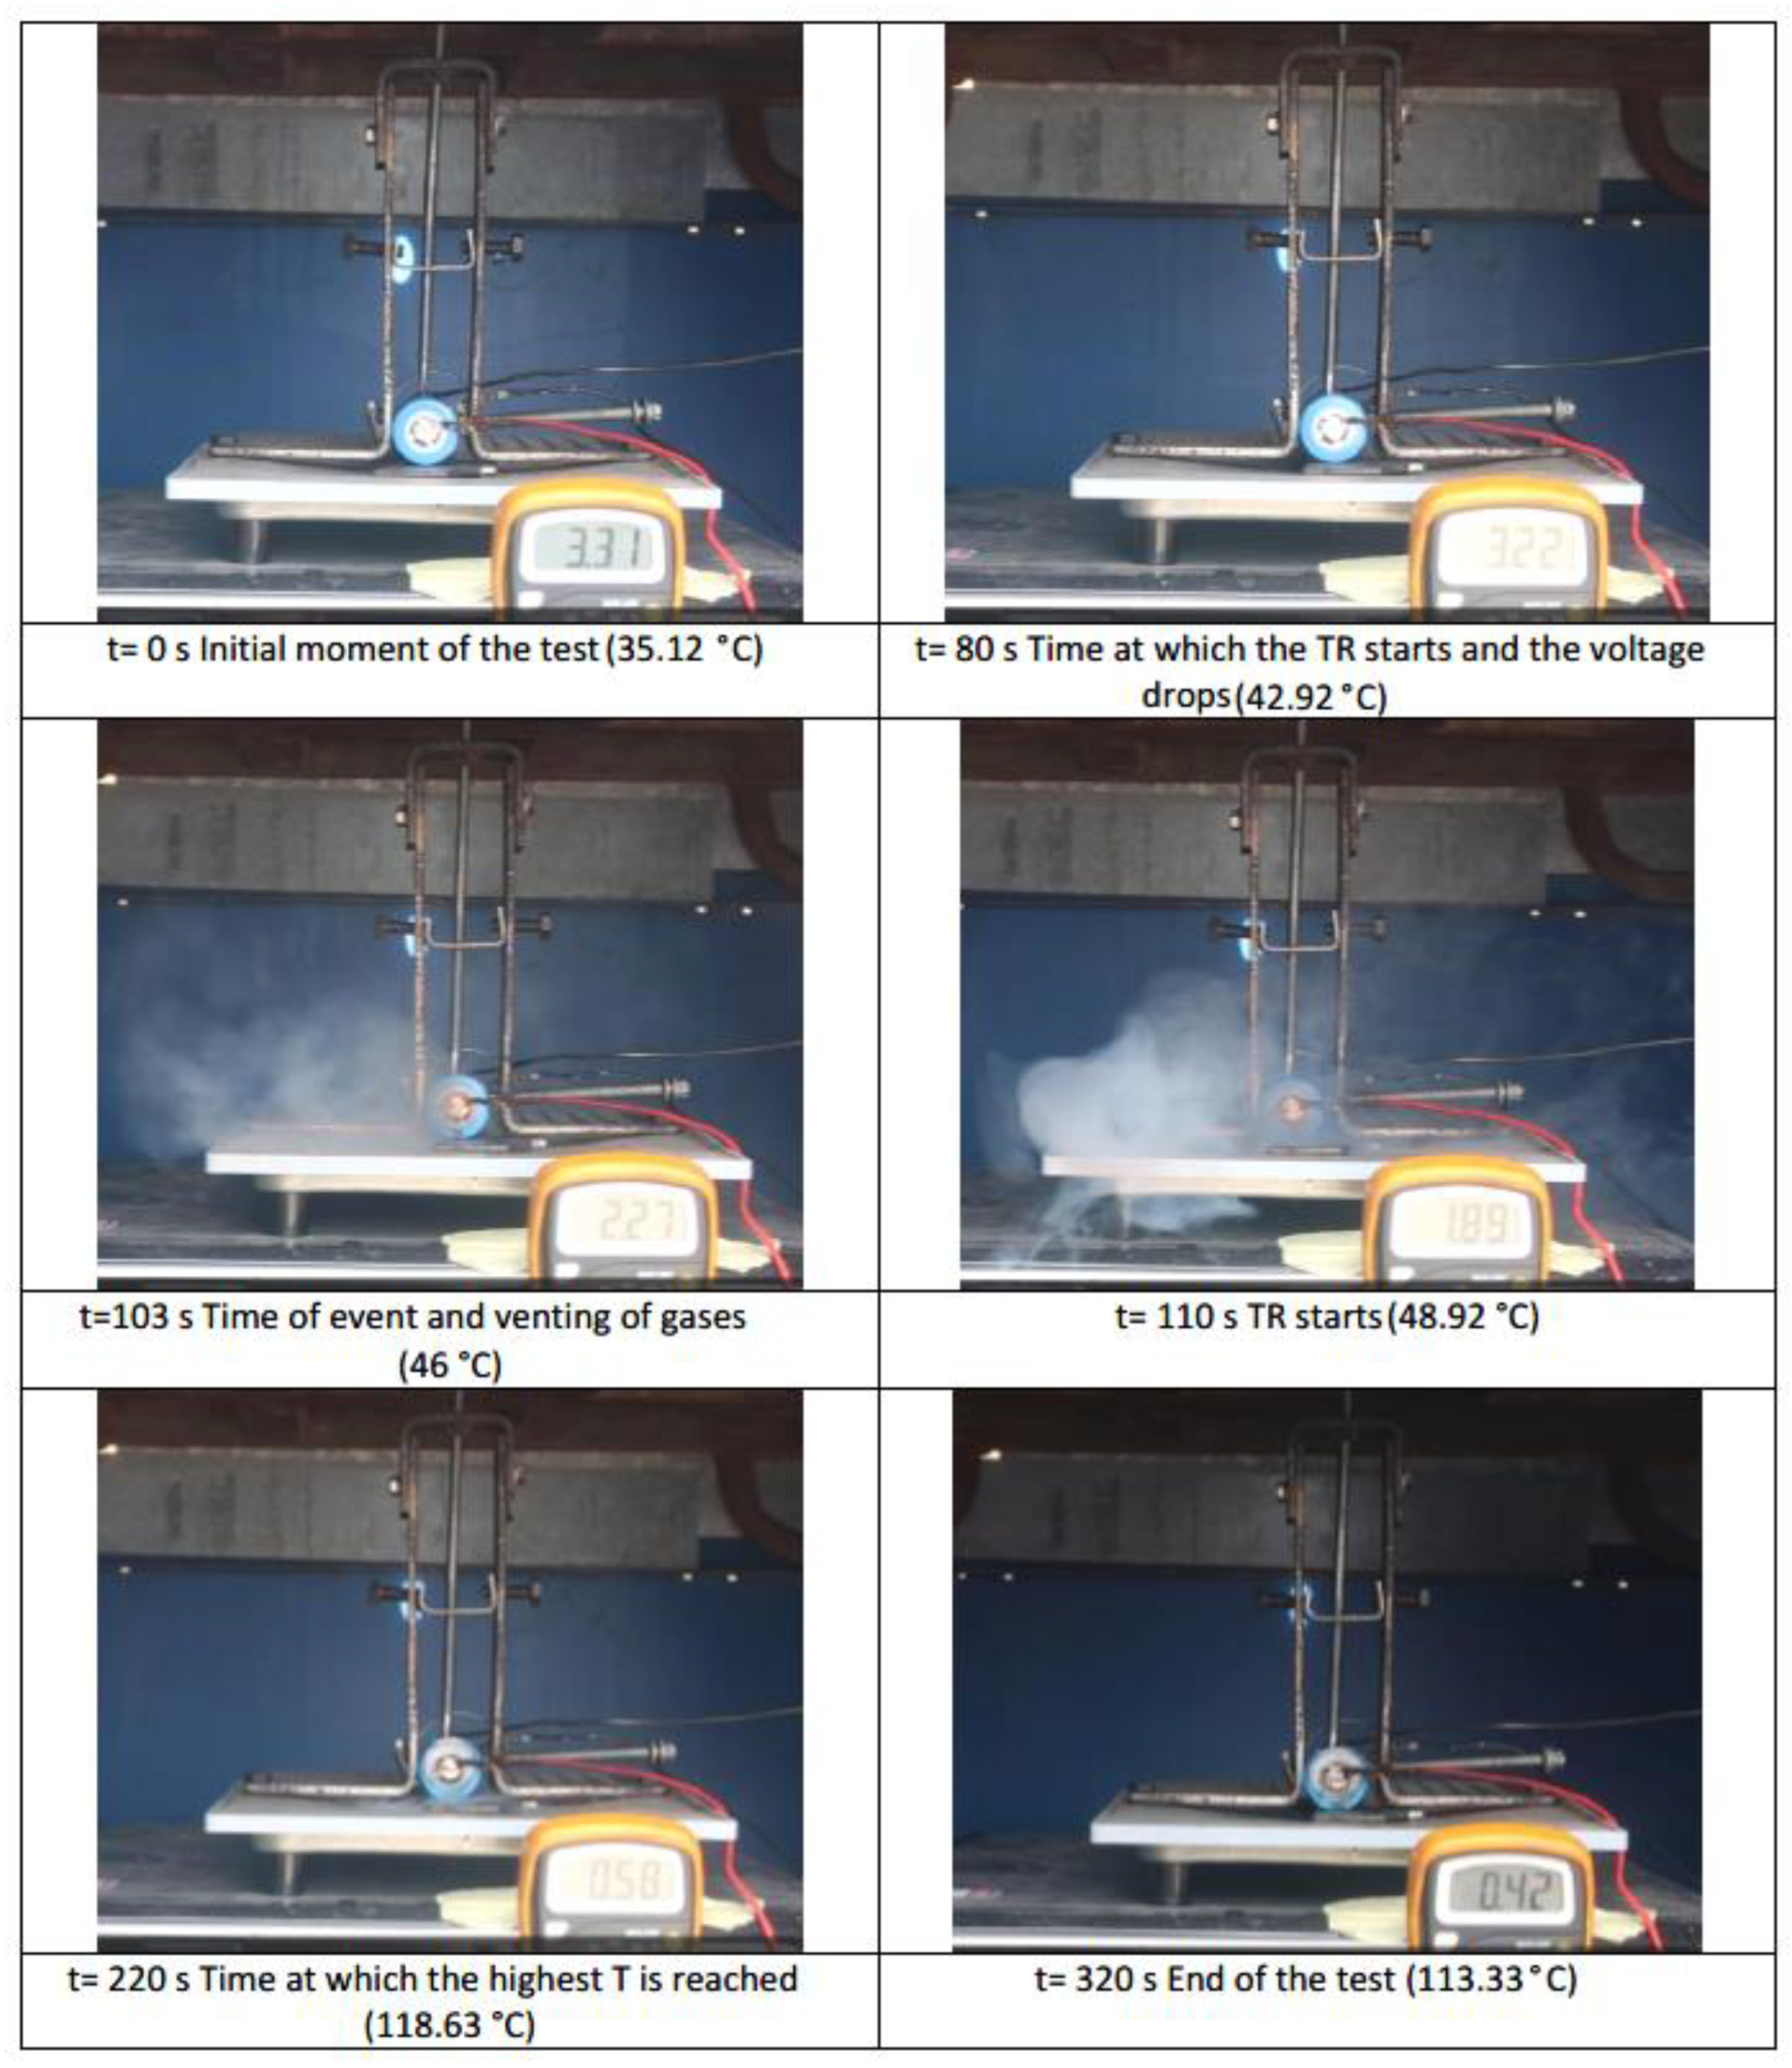
Images of the test are shown in the
Figure 9, corresponding to the events identified as most significant during the mechanical abuse test carried out. Until the cell is perforated by a few millimeters, the effects of TR do not begin, even if the puncture is evident, so it is concluded that damage must take place of a certain level on the internal components of the cell (electrodes) for the short-circuit to occur. Venting of the cell gases takes place through the vent valve located on the positive pole. The generation of gases is due to reactions and evaporation of part of the electrolyte. After vapor venting, electrolyte venting is observed. In the case of the LFP cell analyzed, as the maximum temperature reached is lower than the melting temperature of the cathode aluminum, no traces of the cathode aluminum are observed.
In
Figure 9 it can be seen how two distinct events are identified, which are also identified in the graph (
Figure 7), and at the end there is a total discharge of the cell, leaving it at 0V.
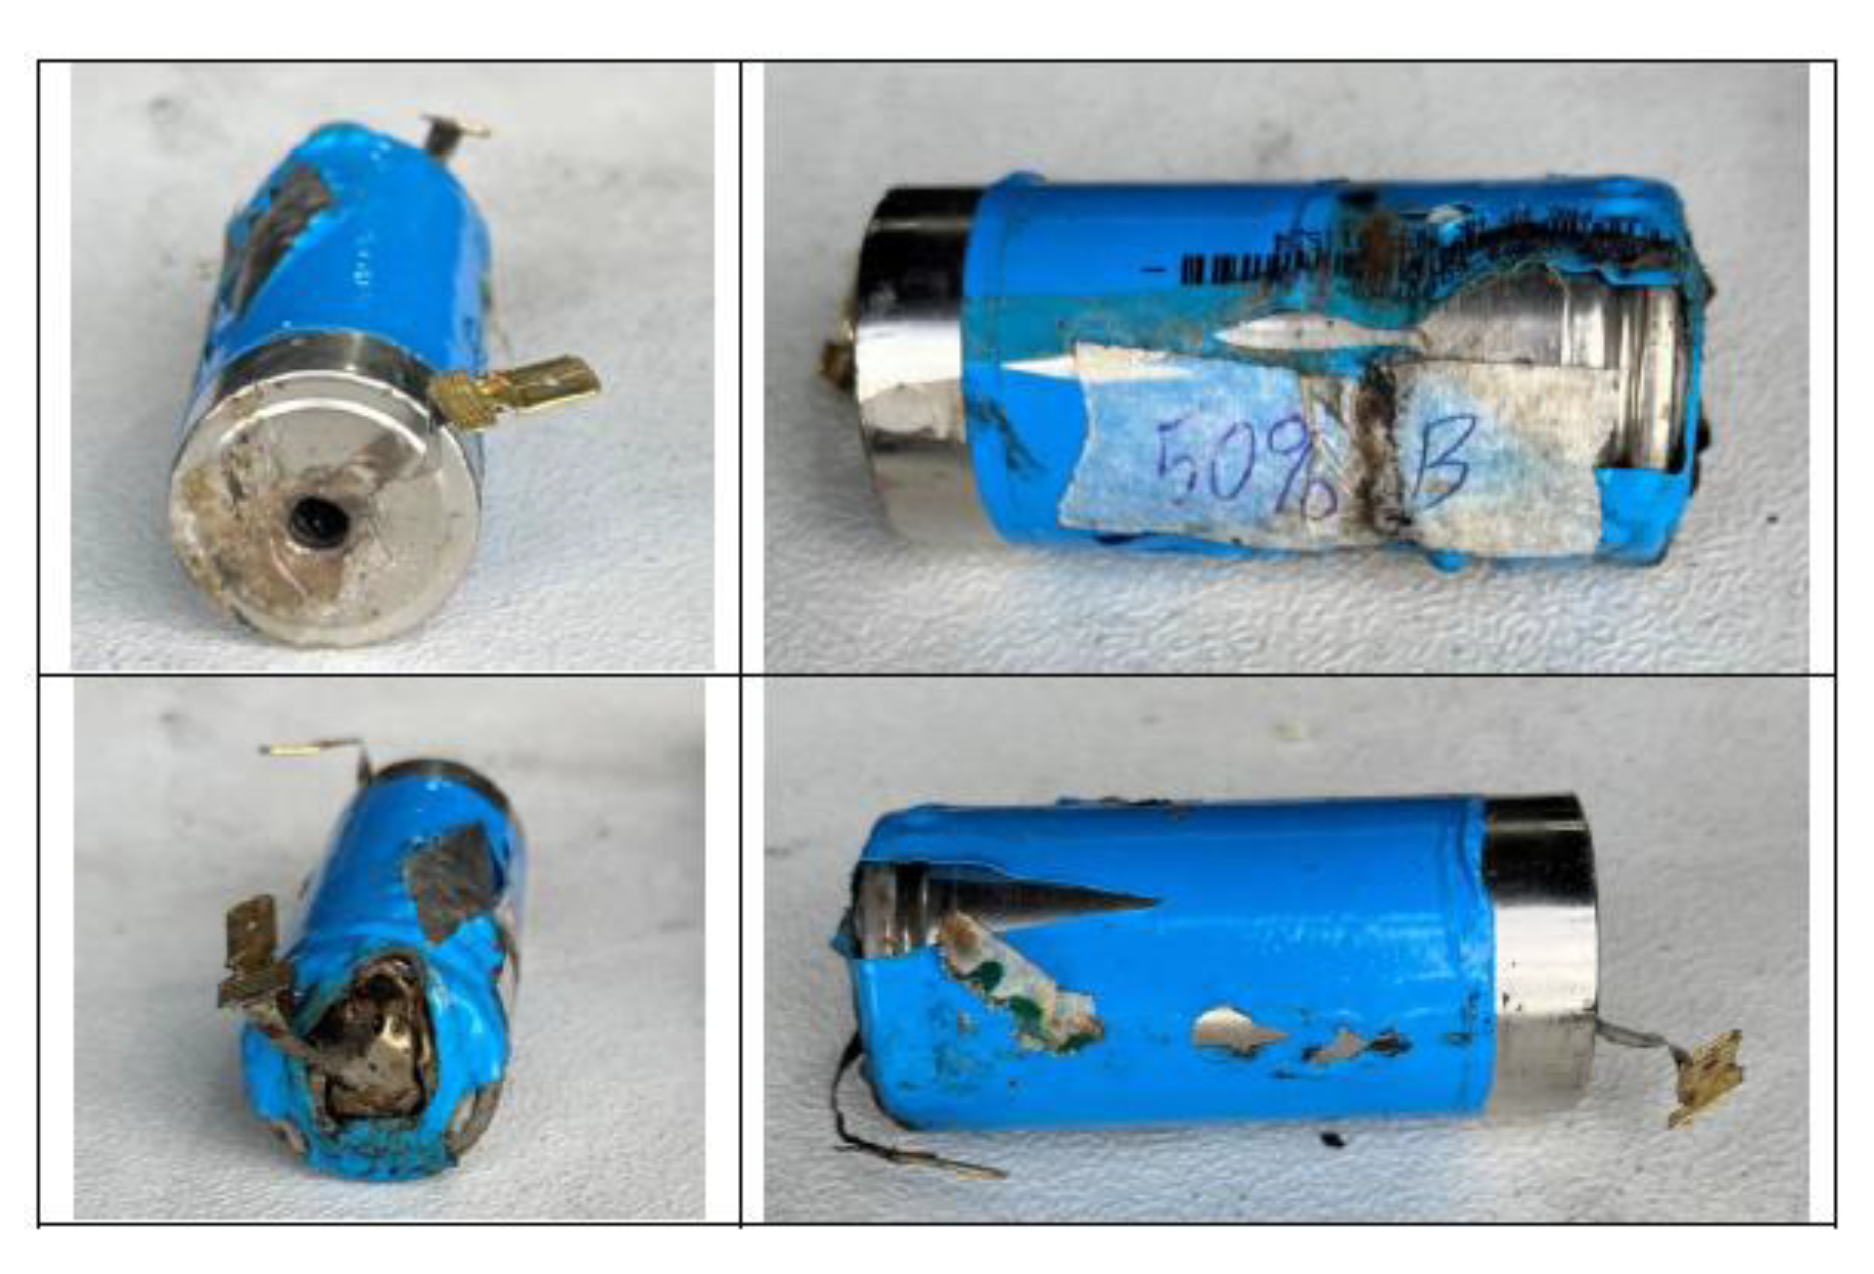
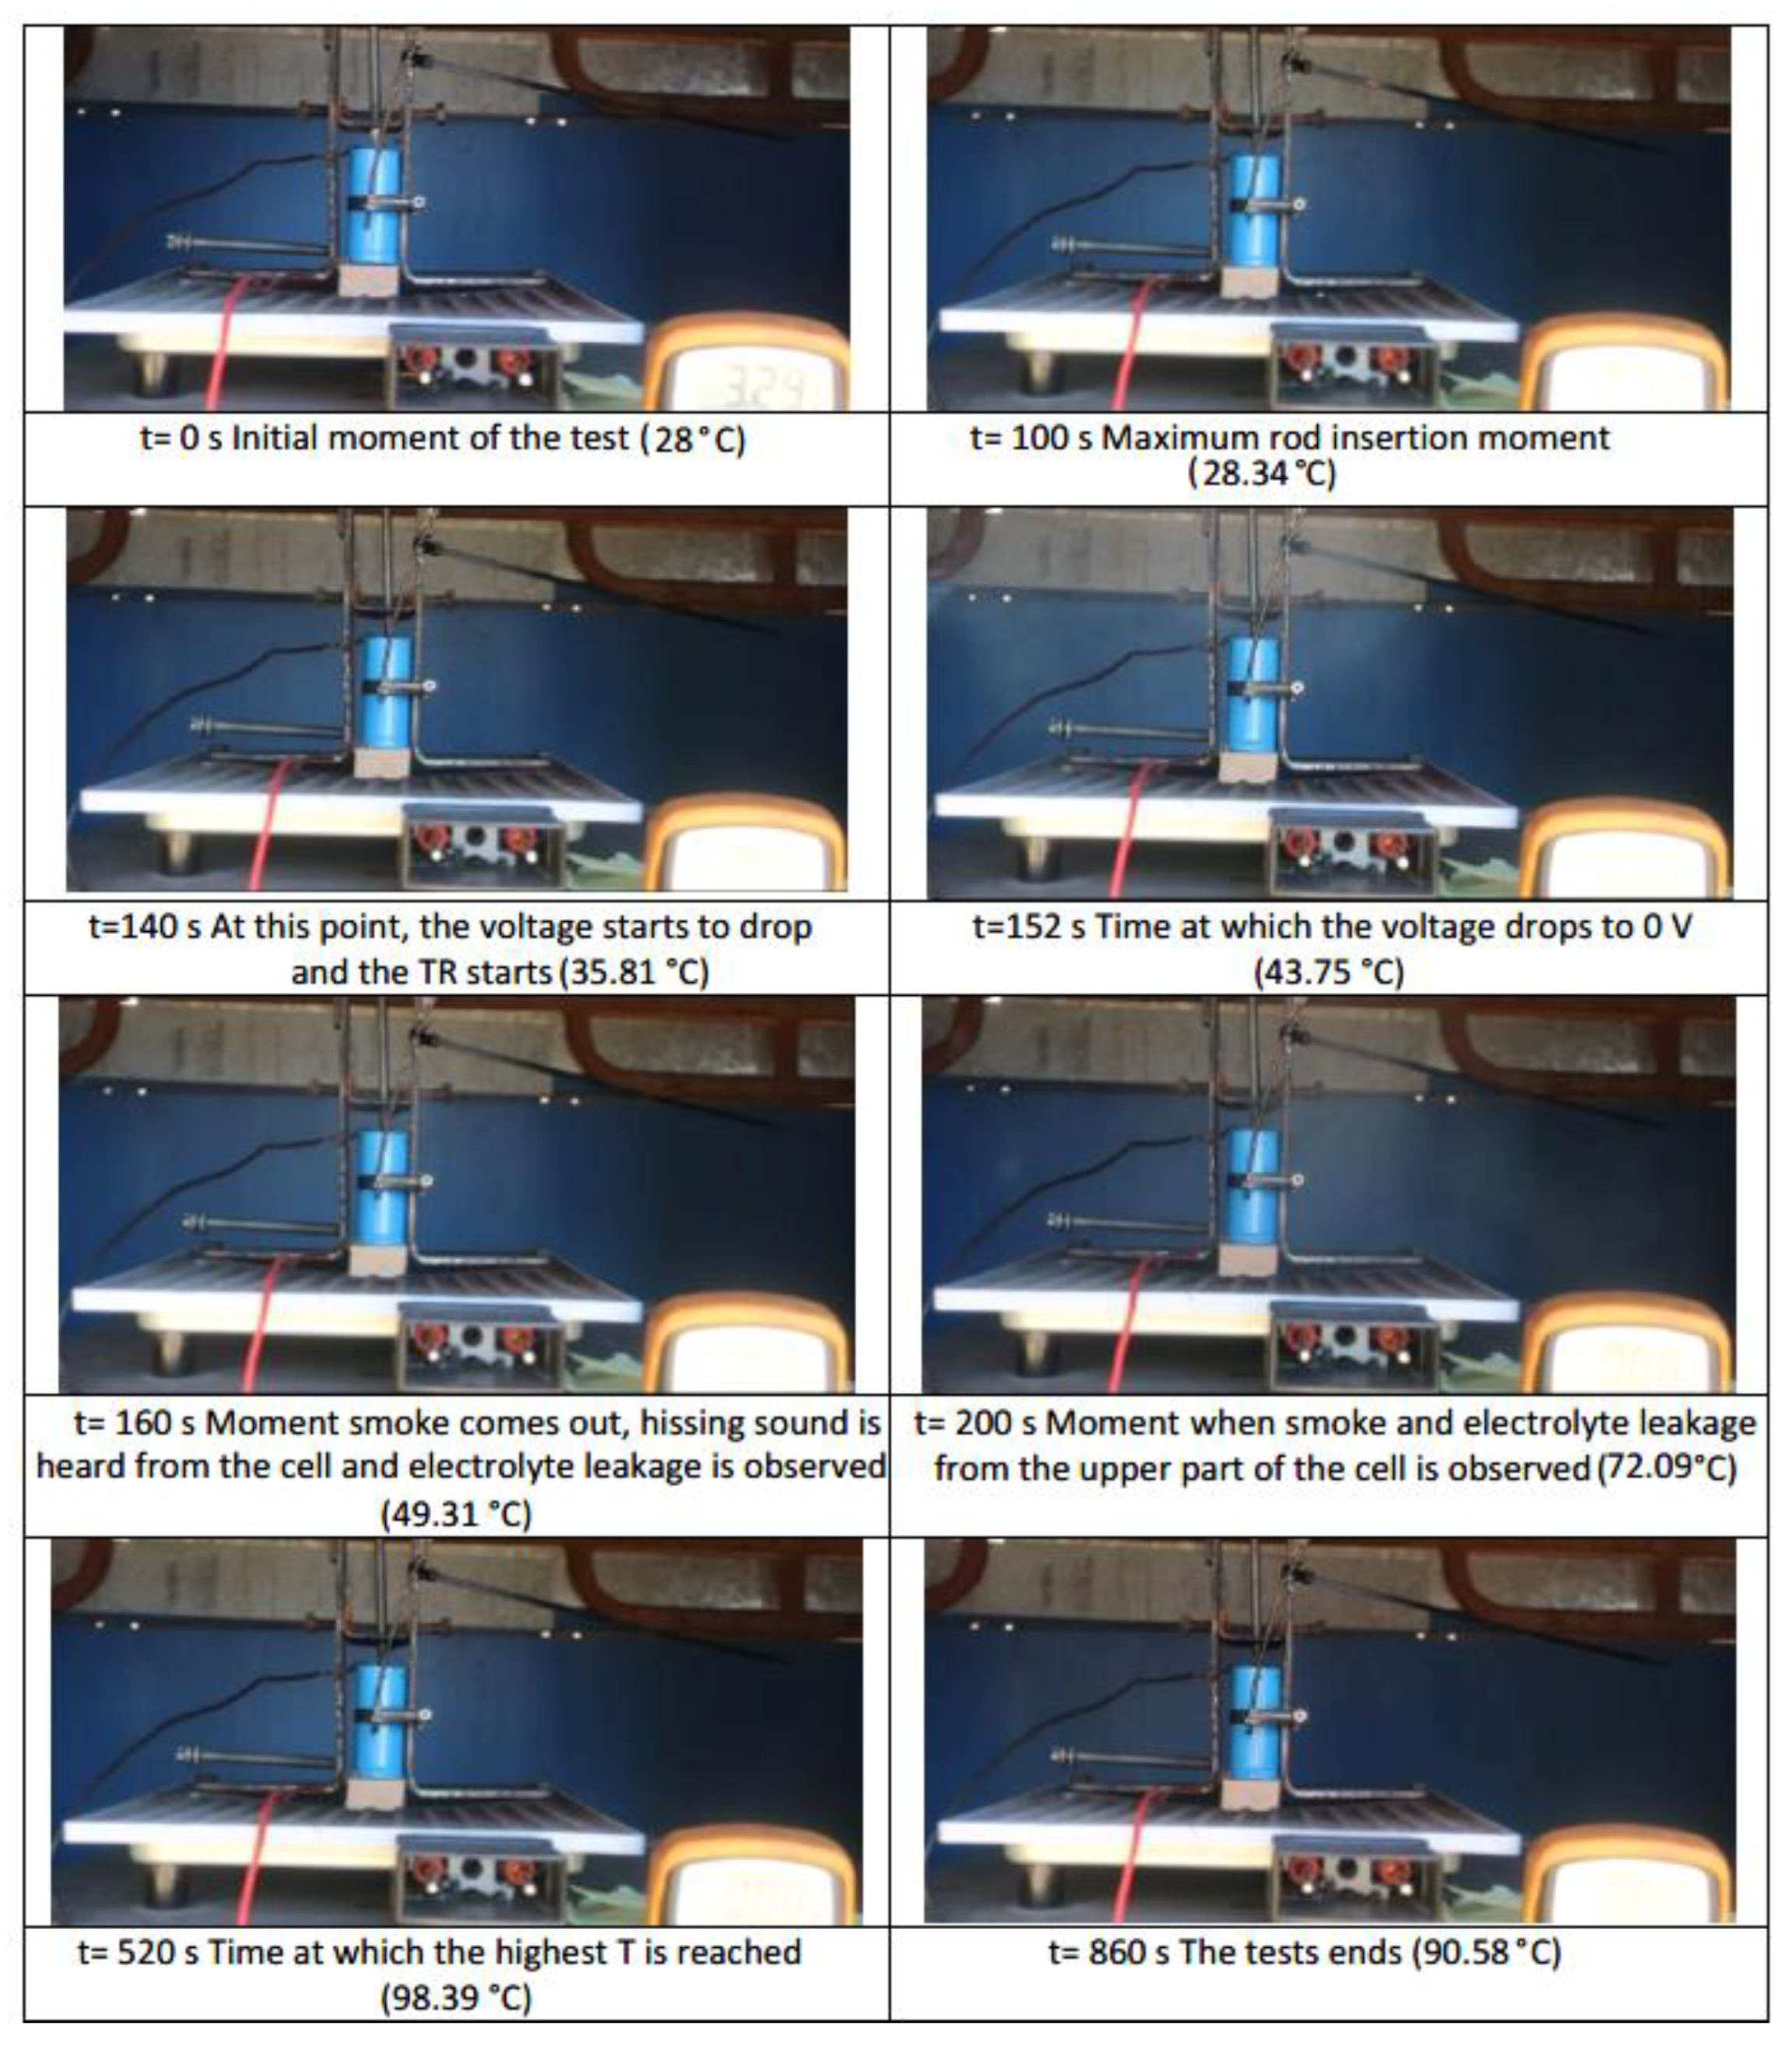
3.1.2. Test 2: Horizontal SoC 50% (cell D)
The test is carried out on a 32700 cylindrical cell in a horizontal arrangement with a SoC of 50%. As in the previous tests, a type K thermocouple is placed on the cell to measure its temperature and a voltmeter is used to measure the voltage during the test. The cell is perforated in a direction perpendicular to its longitudinal axis with a sharp element.
Below are images of the state of cell D after the perforation test (
Figure 10).
During the penetration test of a rod into the cell in the direction perpendicular to its longitudinal axis, it was observed that some penetration of the rod is necessary to trigger the TR process. It is concluded that cell D (SoC 50%) is less damaged than cell A (SoC 100%) when subjected to the same perforation test in the direction perpendicular to its longitudinal axis. In the case of cell D, the positive pole where the vent valve is located is hardly damaged, so it can be concluded that there is little or no gas volume coming out of the vent valve.
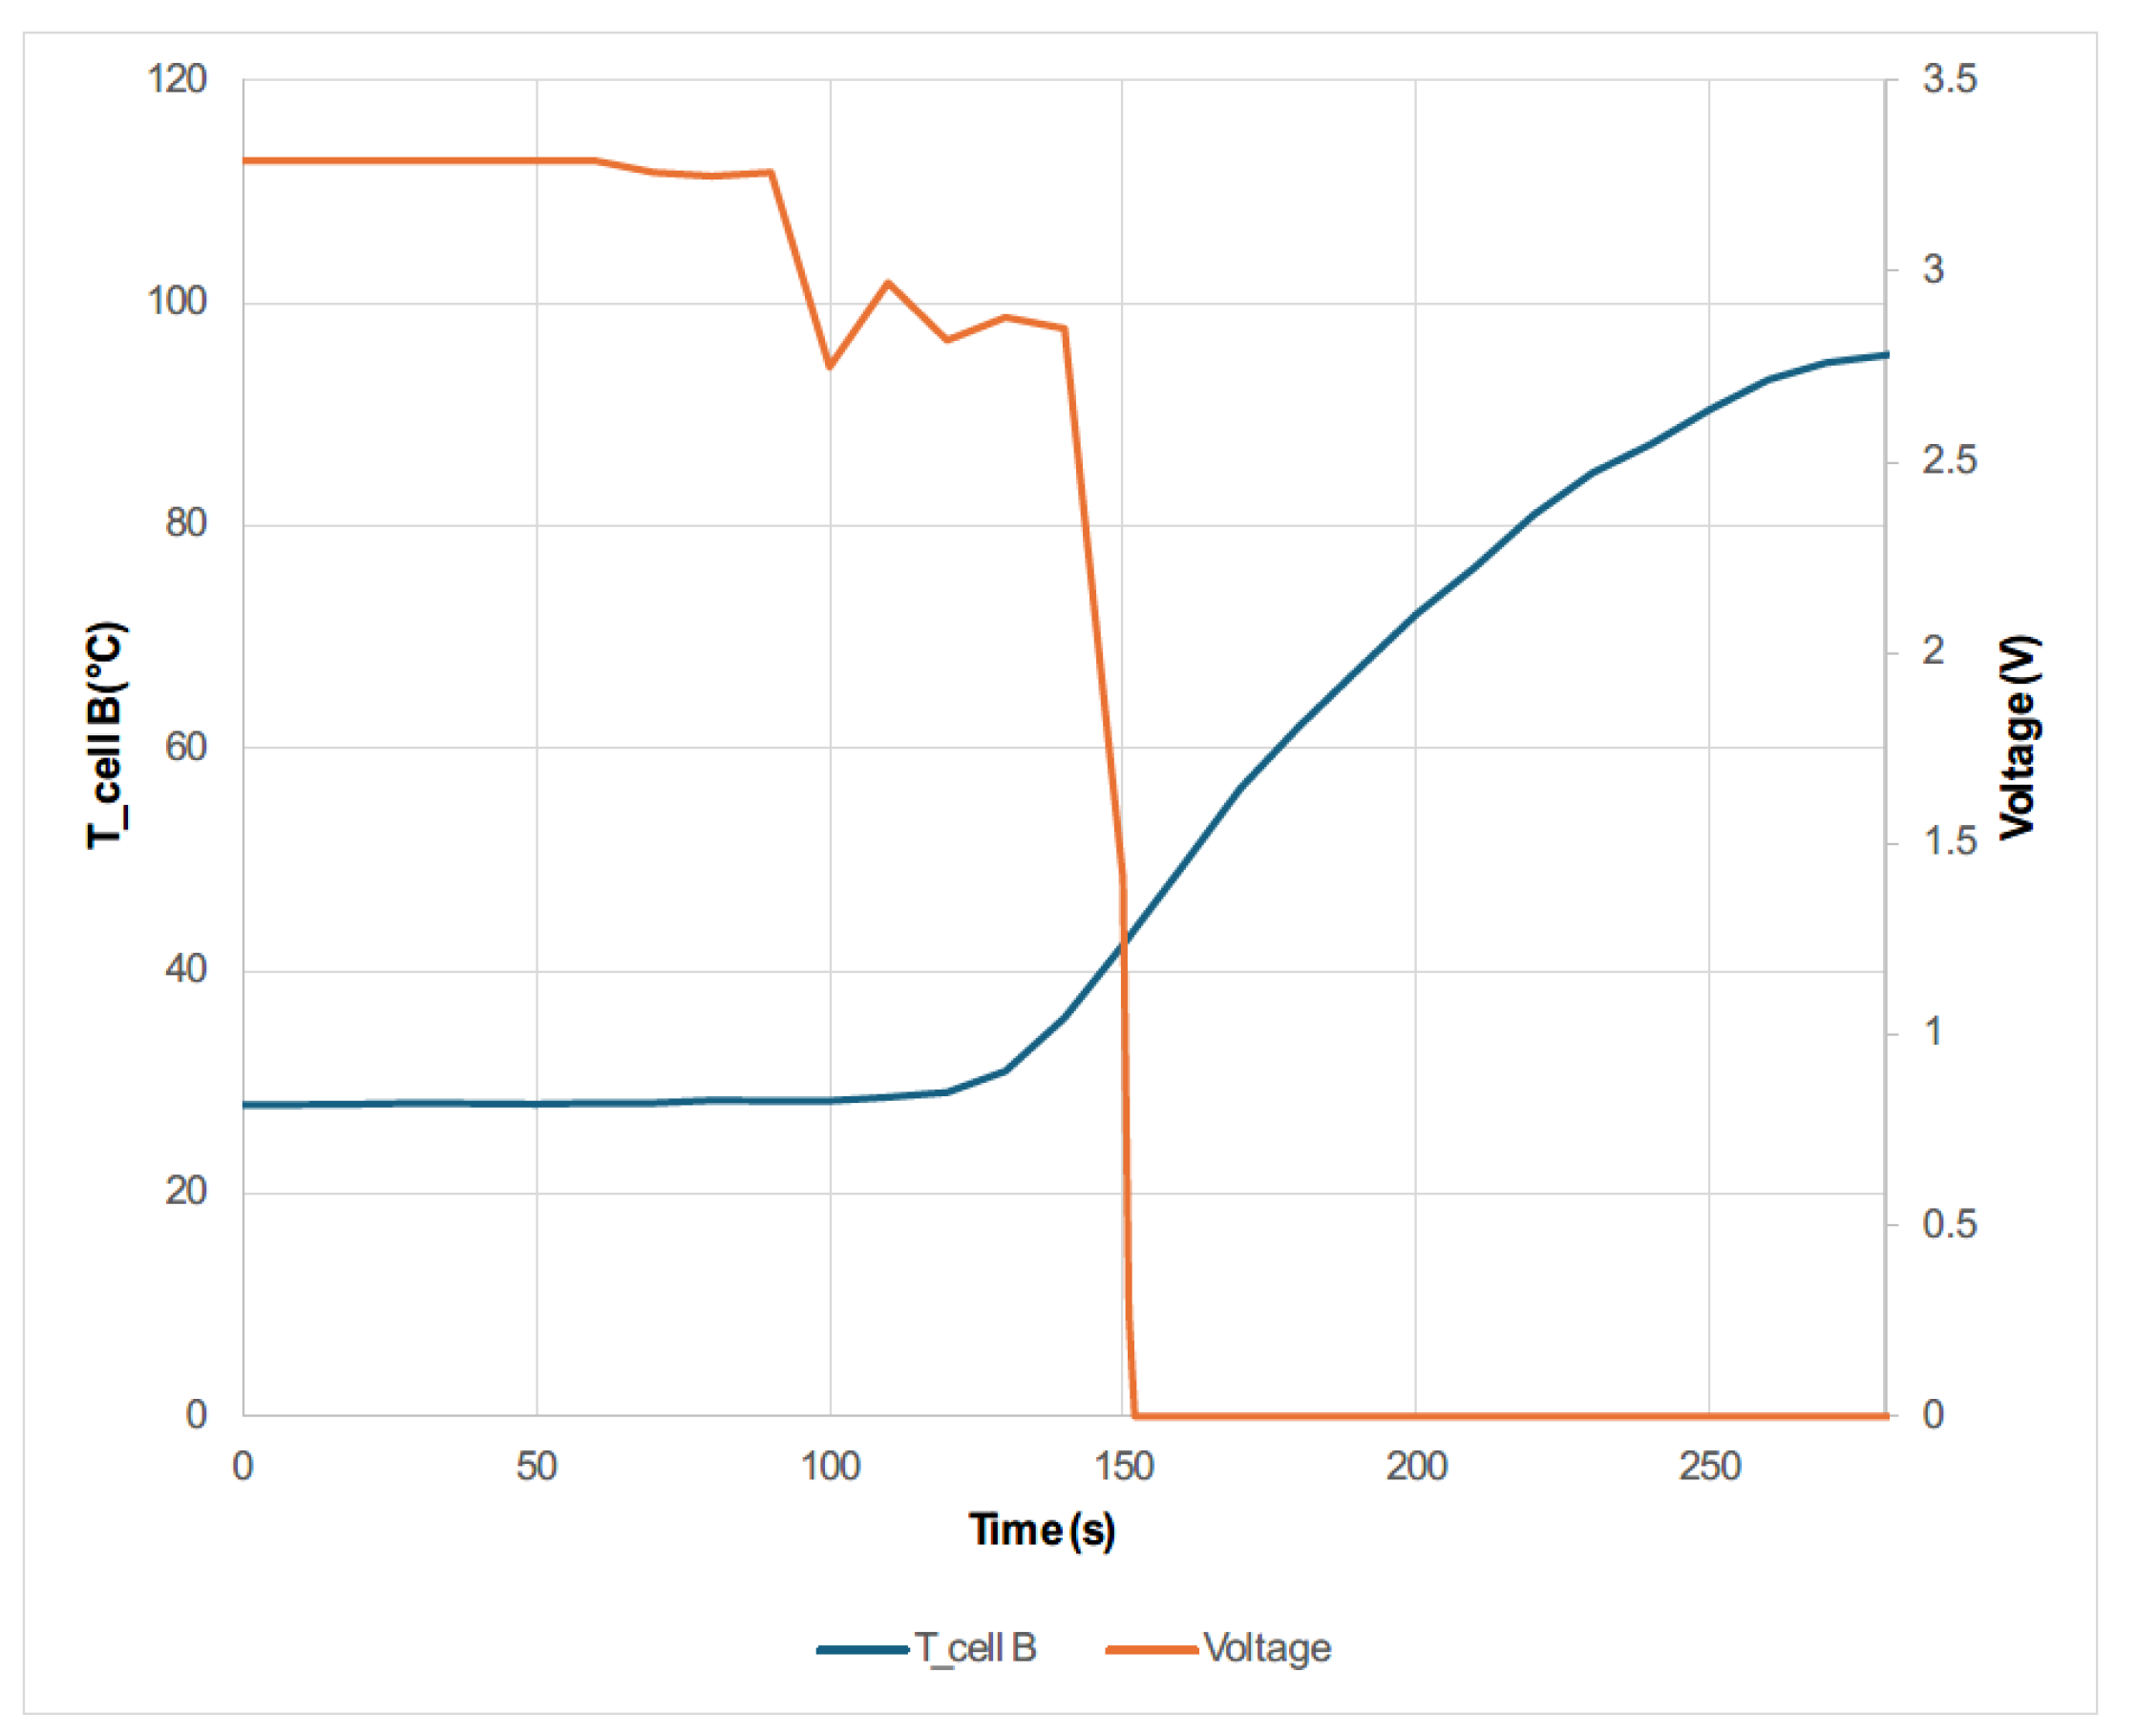
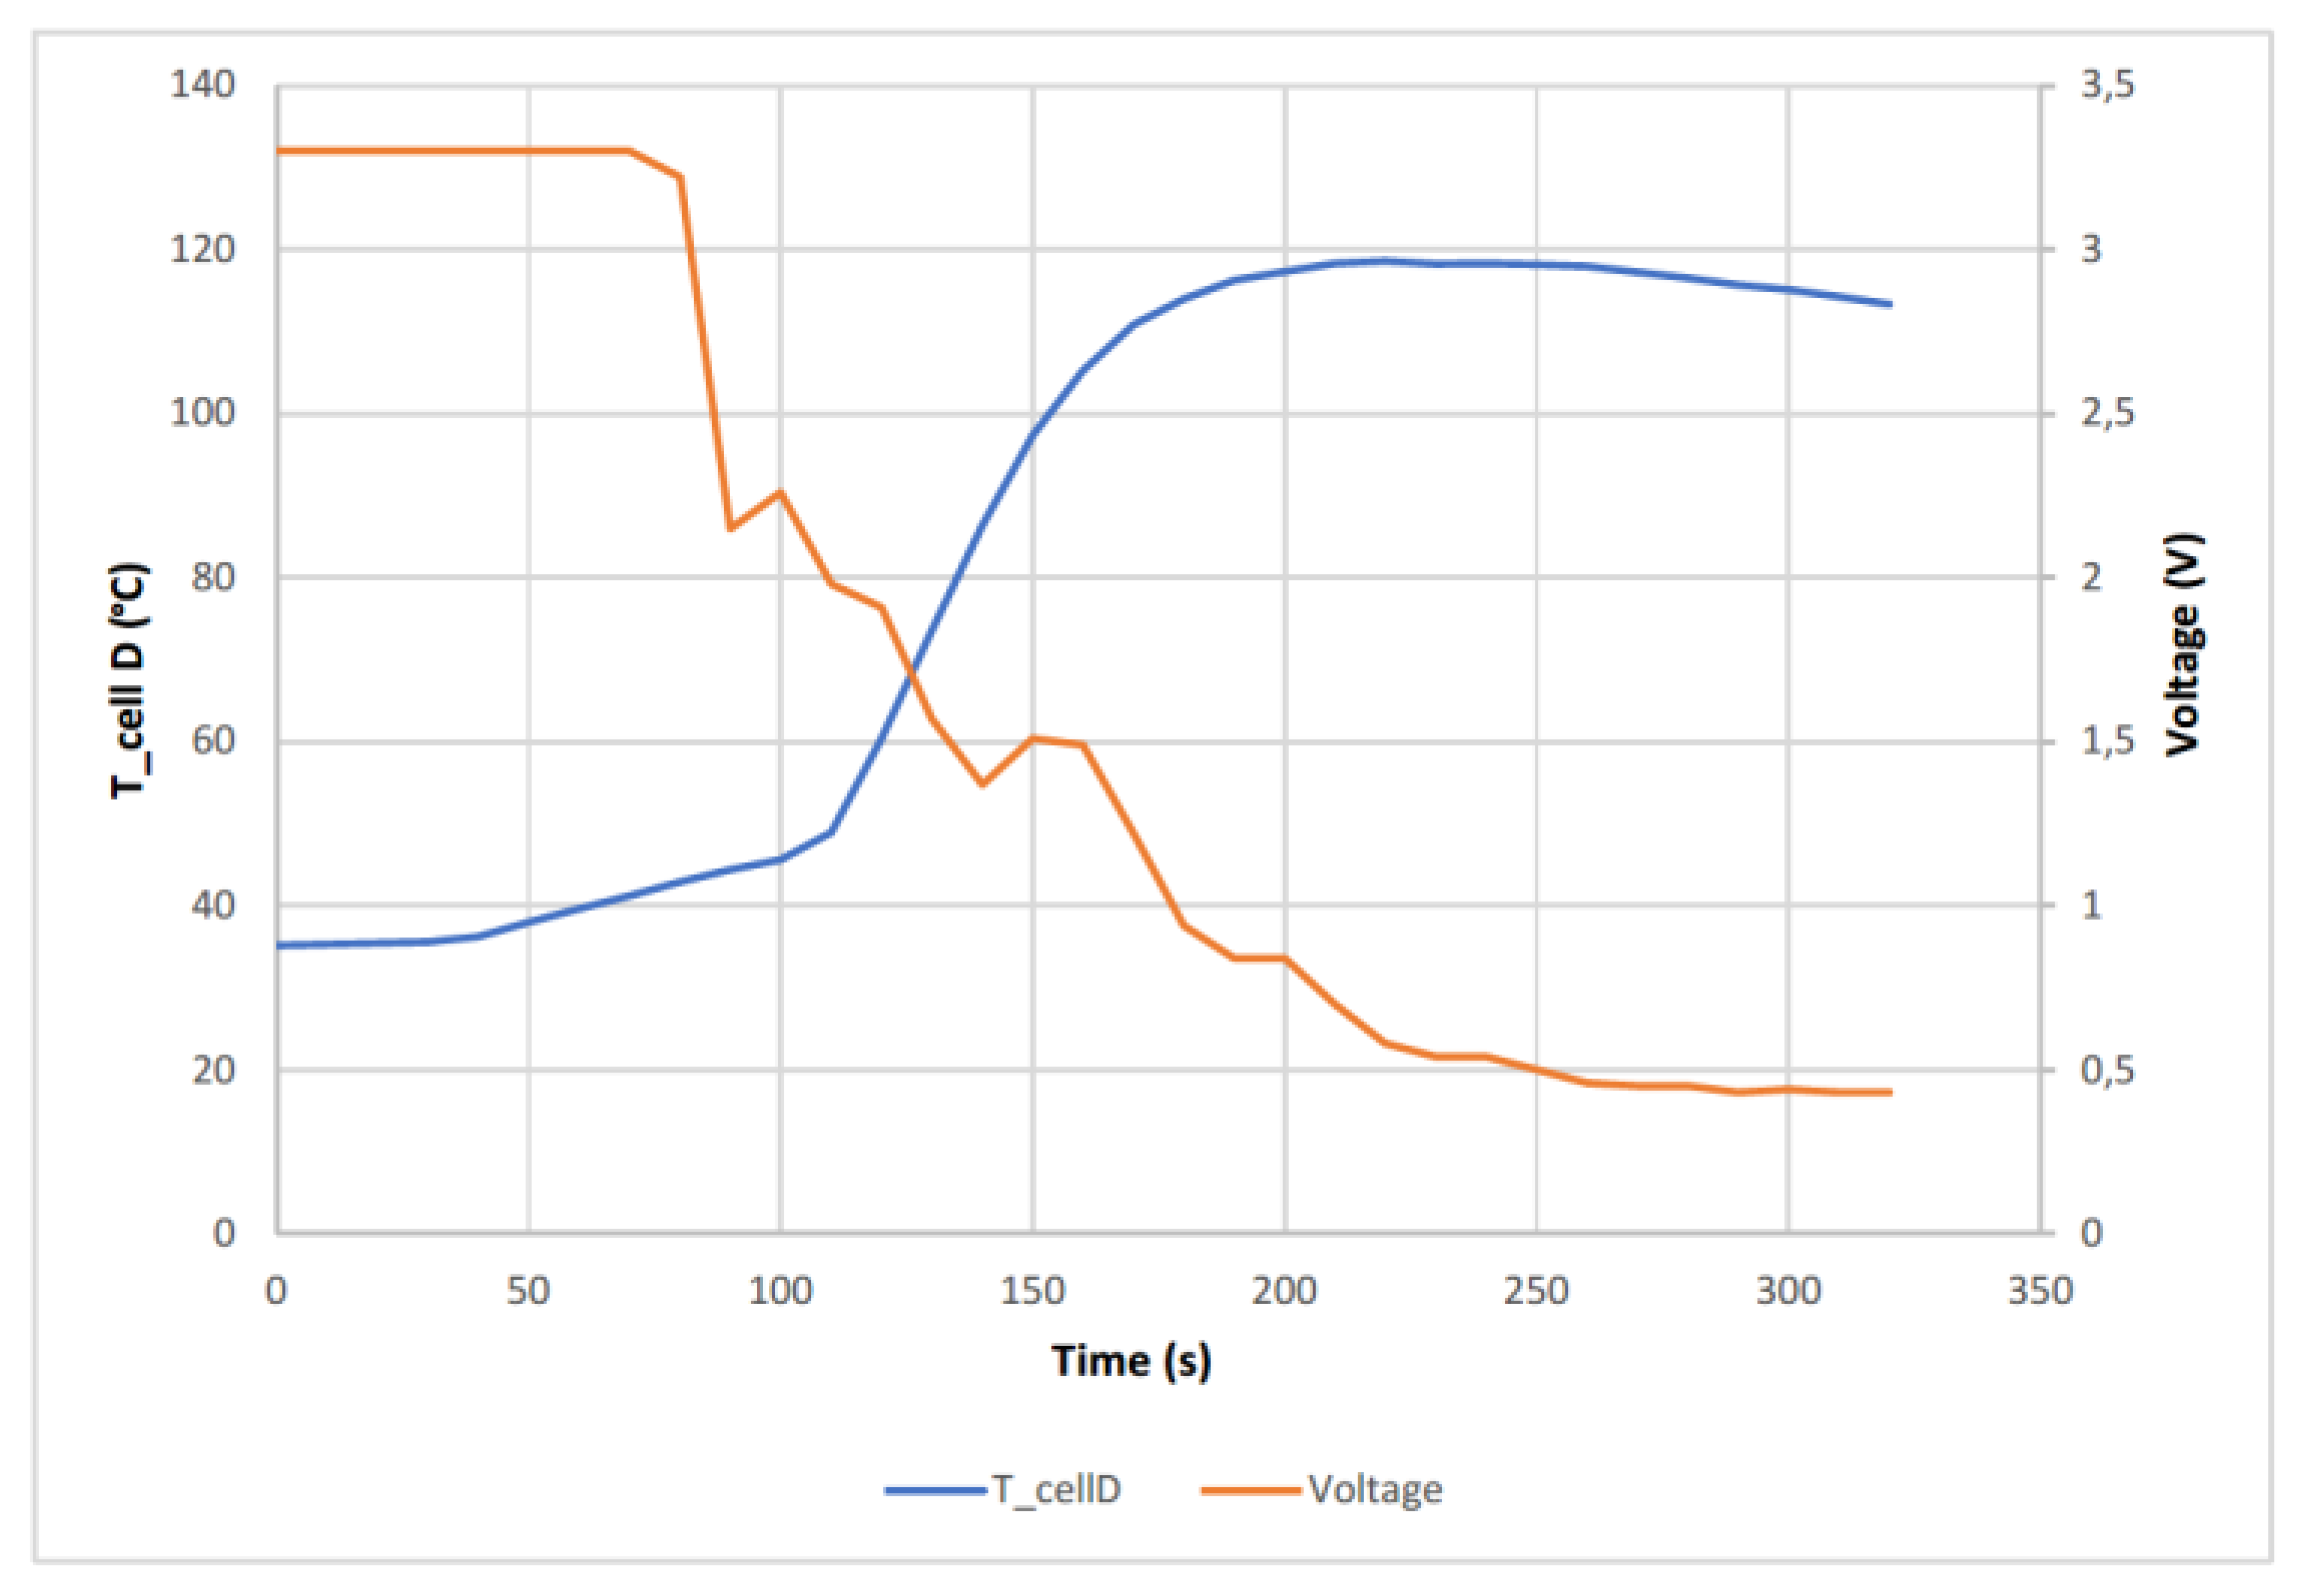
Cell D (SoC 50%) reached a maximum temperature of 118.26 °C, well below the 261 °C reached in the case of cell A (SoC 100%). The following graph (
Figure 11) shows the temperature reached by cell D as well as the voltage behavior.
At first there is a sharp voltage drop, but later the voltage drop is gentler and causes a thermal runaway accompanied by venting of hot vapors through the vent valve in at the positive pole of the cell, without observing electrolyte leakage. The voltage drop is not abrupt because it needs to be tapped several times until it penetrates far enough to produce the short circuit, when the short circuit occurs, the temperature rises more rapidly, indicating that TR occurs. In this case the cell voltage does not reach 0 V, but remains at 0.45 V.
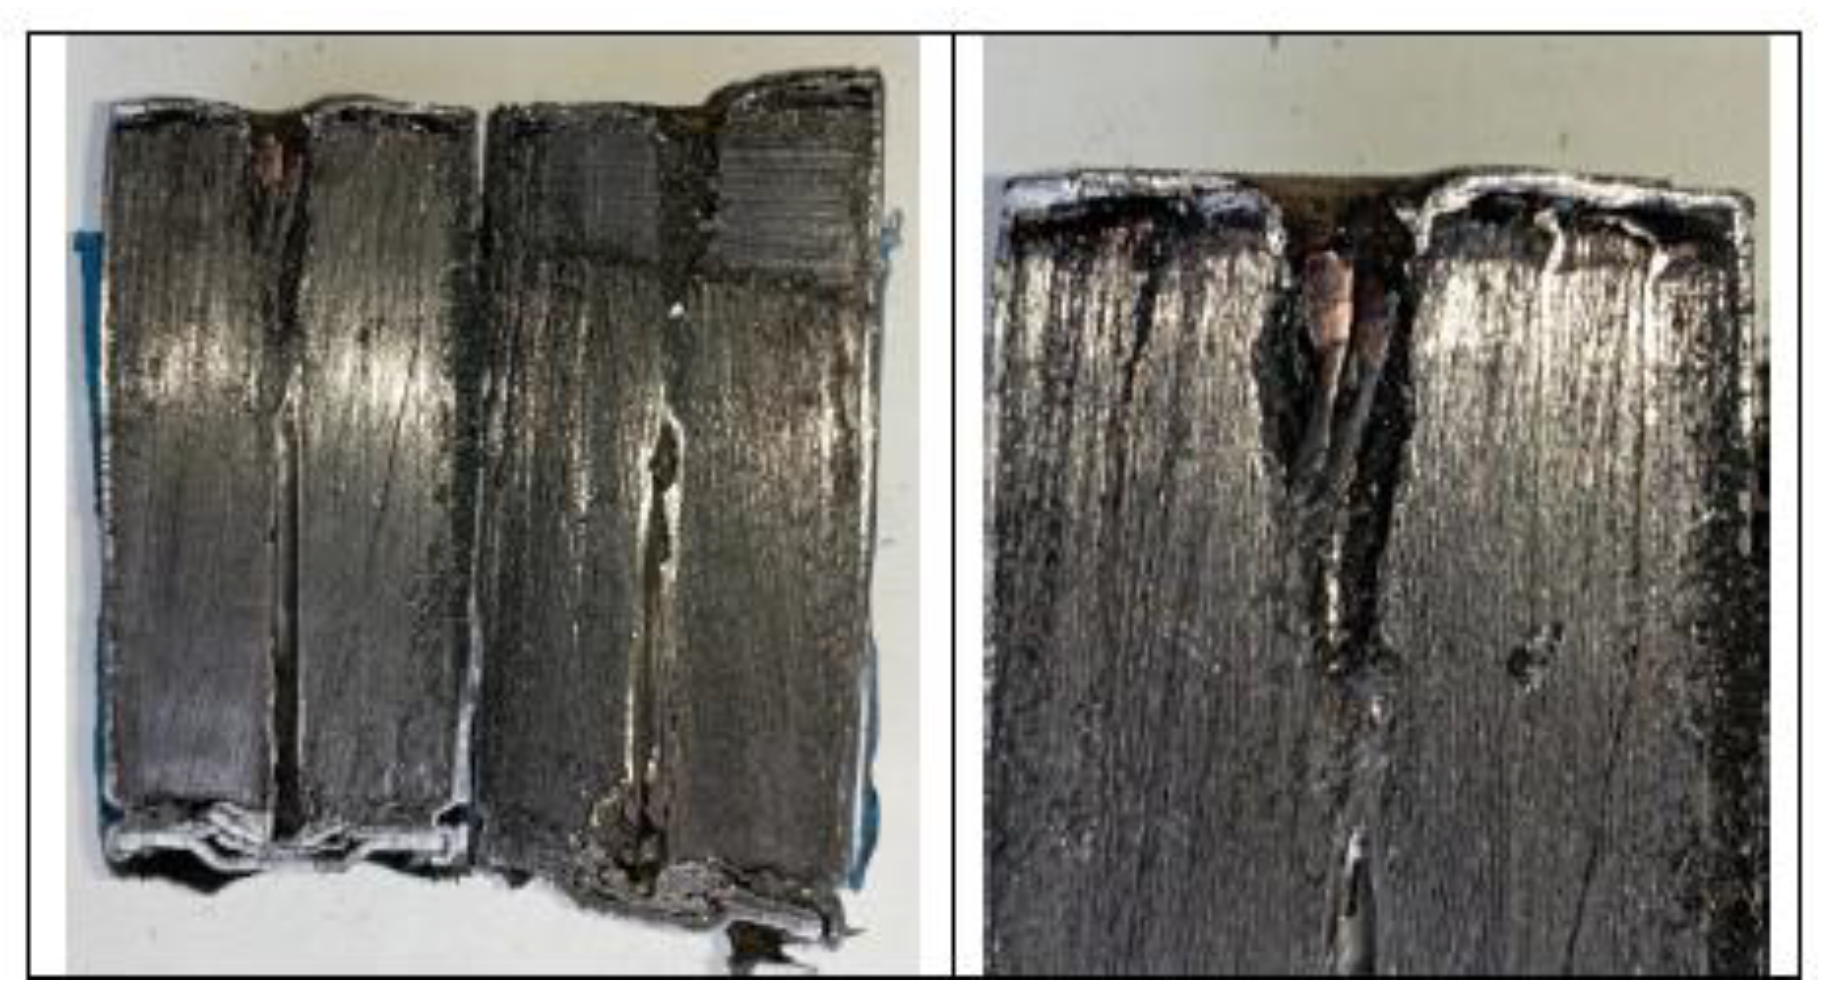
The image below (
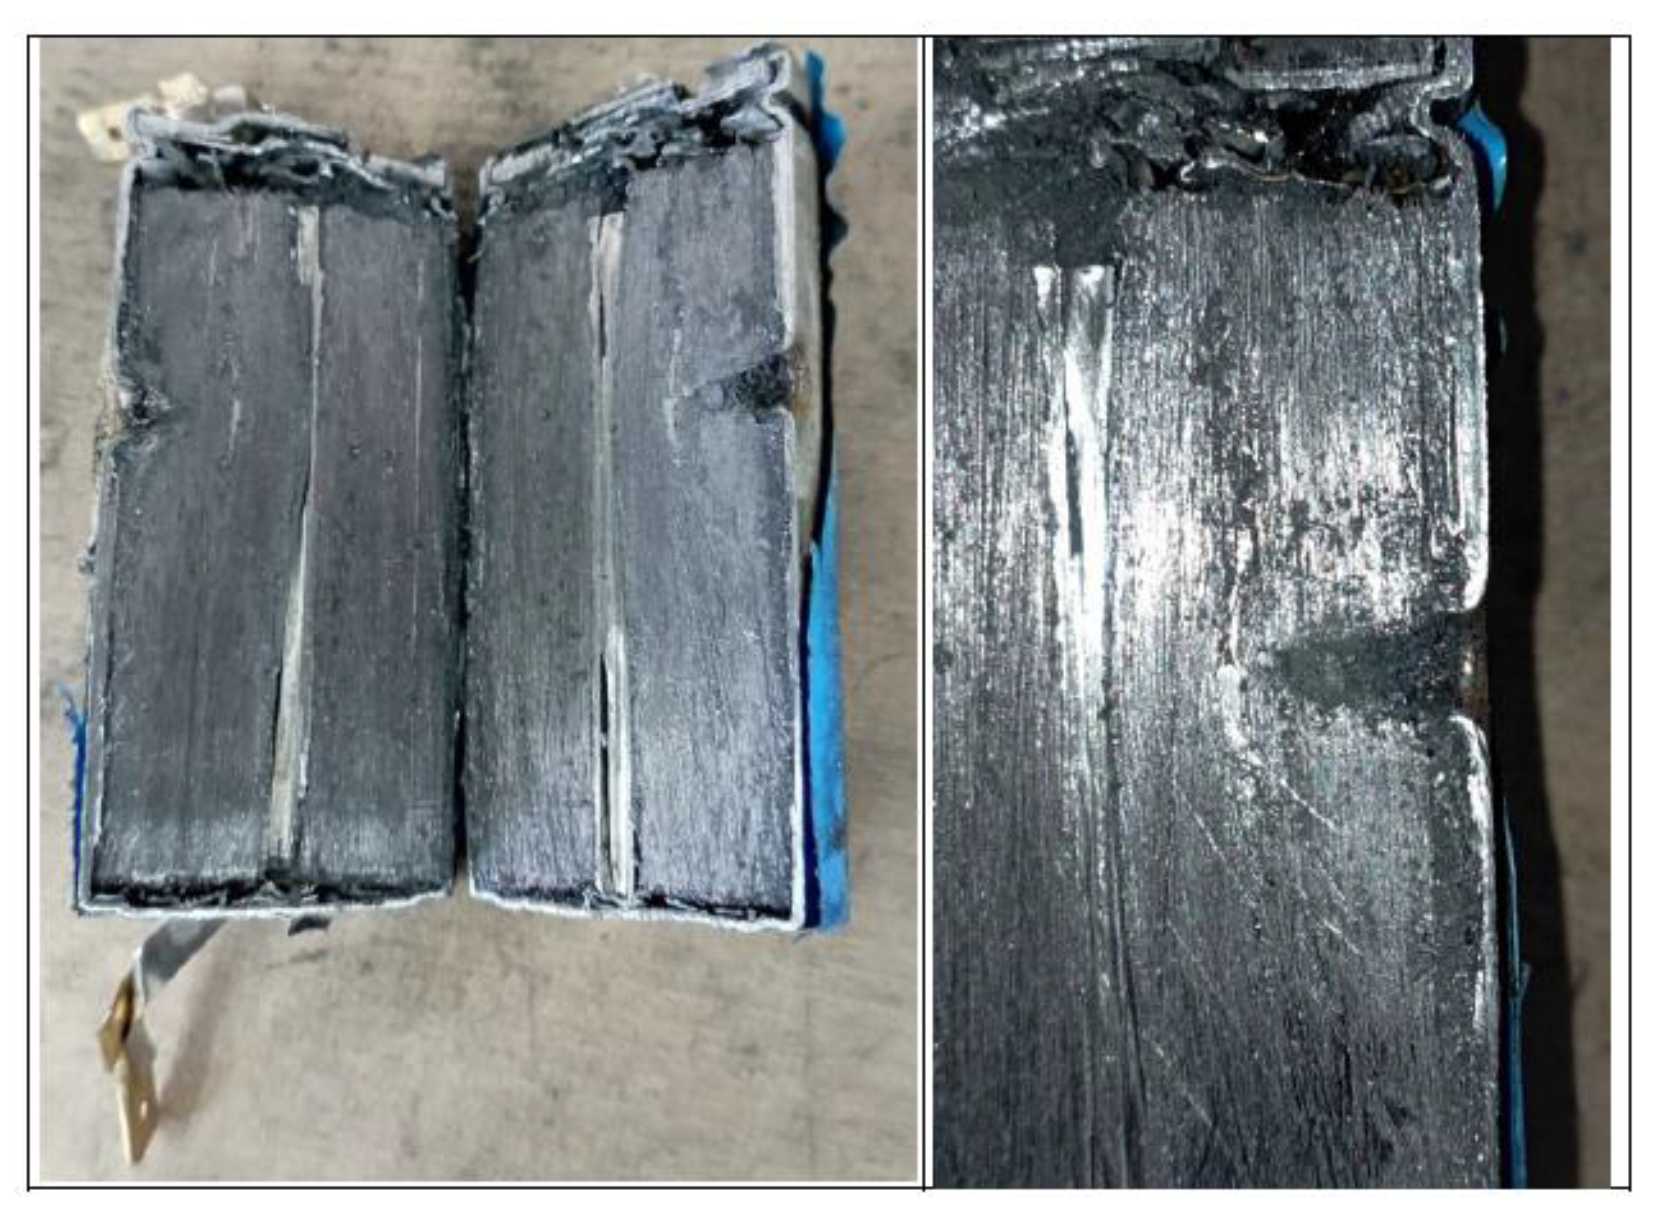
Figure 12) shows a picture of the cell sectioned after the test, in which a significant perforation of the cell can be observed before the short circuit occurs. However, there is no major damage to the electrodes and the cell is not burnt.
In this case, the perforation is identified, but no major damage to the electrodes is observed that is not due to the perforation. Also in this case, no remnants of the melted electrode material are observed.
In the
Figure 13, there are images from the test that correspond to the events identified as most significant during the mechanical abuse test carried out. The following images (
Figure 13) show that the events experienced by cell D are less intense than those experienced by cell A, with no electrolyte leakage. It can therefore be concluded that cell D (SoC 50%) experiences milder exothermic reactions than those experienced by cell A (SoC 100%) when subjected to the same perforation test in a direction perpendicular to its longitudinal axis, so it can be stated that, given the same mechanical abuse by horizontal perforation, the behavior of the more heavily loaded cells will be more dangerous.
3.1.3. Test 2: Vertical SoC 100% (cell C)
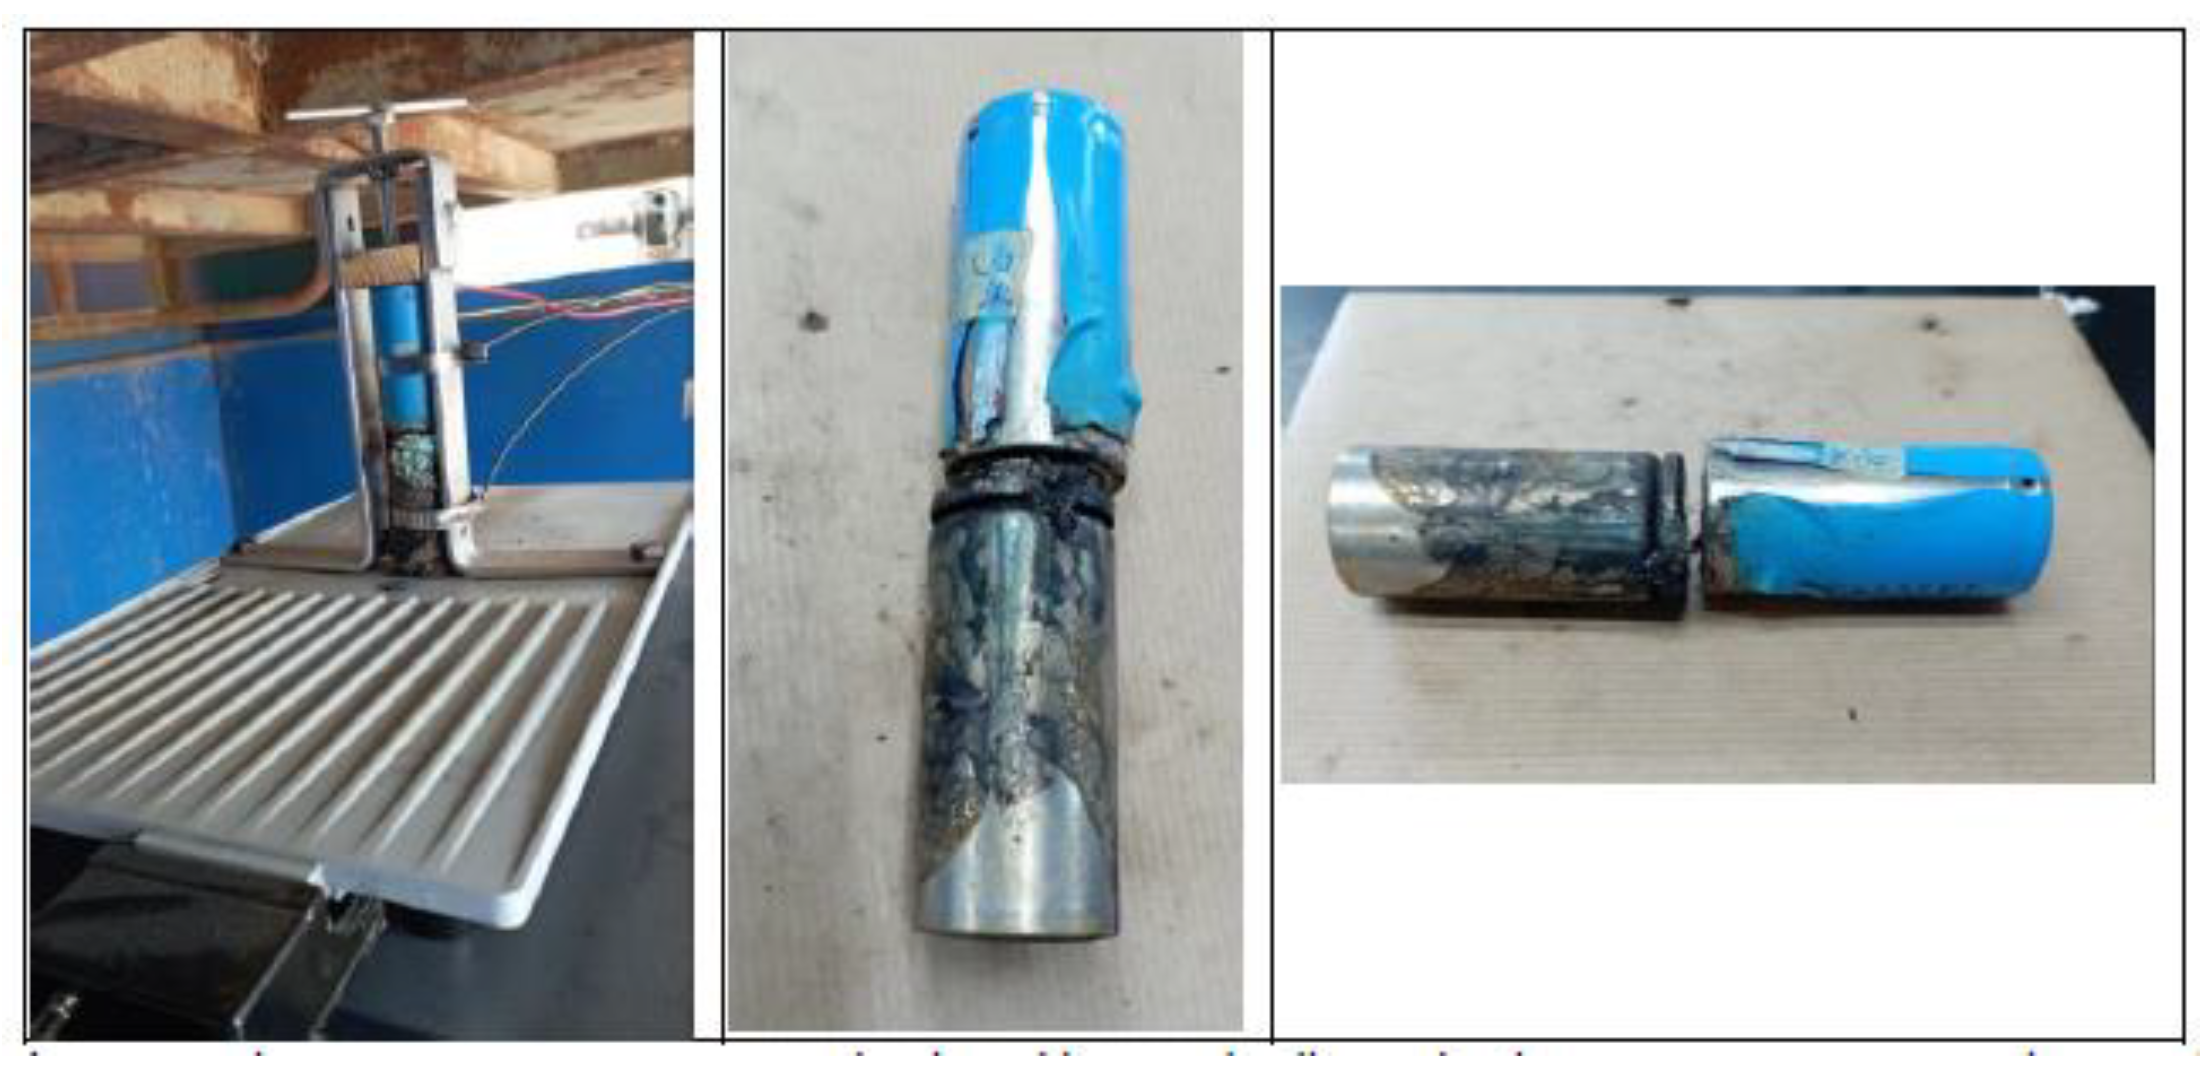
The test is performed on a 32700 cylindrical cell in vertical arrangement (with the vent valve at the bottom) with a SoC of 100%. As in the previous tests, a type K thermocouple is placed on the cell to measure its temperature and a voltmeter is used to measure the voltage during the test. The cell is performed in the direction of its longitudinal axis with a sharp element, the following image (
Figure 14) shows the set-up of the test.
In this test, a block of wood is placed to prevent the positive pole of the cell from short-circuiting with the cell, since the upper part of the cell is the negative pole and, as it is perforated, the rod with which it is perforated is also negatively charged, so if the positive pole were to come into contact with the metal plate, a short-circuit would occur, since the plate would be negatively charged when it comes into contact with the cell casing (also negative). The following pictures (
Figure 15) show the state of cell C after the perforation test.
During the test of penetration of a rod into the cell in the direction of its longitudinal axis, it was observed that some penetration of the rod is necessary to trigger the TR process. The venting of the cell took place through the cell vent valve located at the positive pole of the cell, which in this case is located at the bottom (depending on the arrangement of the cell during the test). It can be concluded that significant damage to the competent internals of the cell is necessary for failure to occur.
The cell reached a maximum temperature of 326.95 °C. The following graph (
Figure 16) shows the temperature reached by cell C, as well as the voltage behavior. The voltage drops, at the beginning, when the cell is hit, is abrupt up to 2.43 V, but then rises again before the first explosion, where the voltage drops until it explodes again, and the Thermal Runaway occurs, and the voltage drops to 0 V at the same time as the temperature rises. In this test it can be clearly seen how the gases come out of the lower part of the cell (according to the layout of the test) where the vent valve is located.
The following images (
Figure 17) show the state of the cell after the test. The first images show the state in the upper part (negative pole), where the cell is perforated. While the rest of images show the state of the cell in longitudinal direction, in which the damage produced by the perforation can be observed, as well as the state of calcination of the cell. Damage can also be seen in the transverse direction of the cell, but this has probably been caused by the device used to hold the cell in place so that it does not move during the test.
Below are images (
Figure 18) from the test that correspond to the events identified as most significant during the mechanical abuse test.
3.1.4. Test 4: Vertical SoC 50% (cell B)
The test is performed on a 32700 cylindrical cell in vertical arrangement (with the vent valve at the bottom) with a SoC of 50%. As in the previous tests, a type K thermocouple is placed on the cell to measure its temperature and a voltmeter is used to measure the voltage during the test. The cell is perforated in the direction of its longitudinal axis with a sharp element,
Below are images of the state of cell B after the perforation test (
Figure 19).
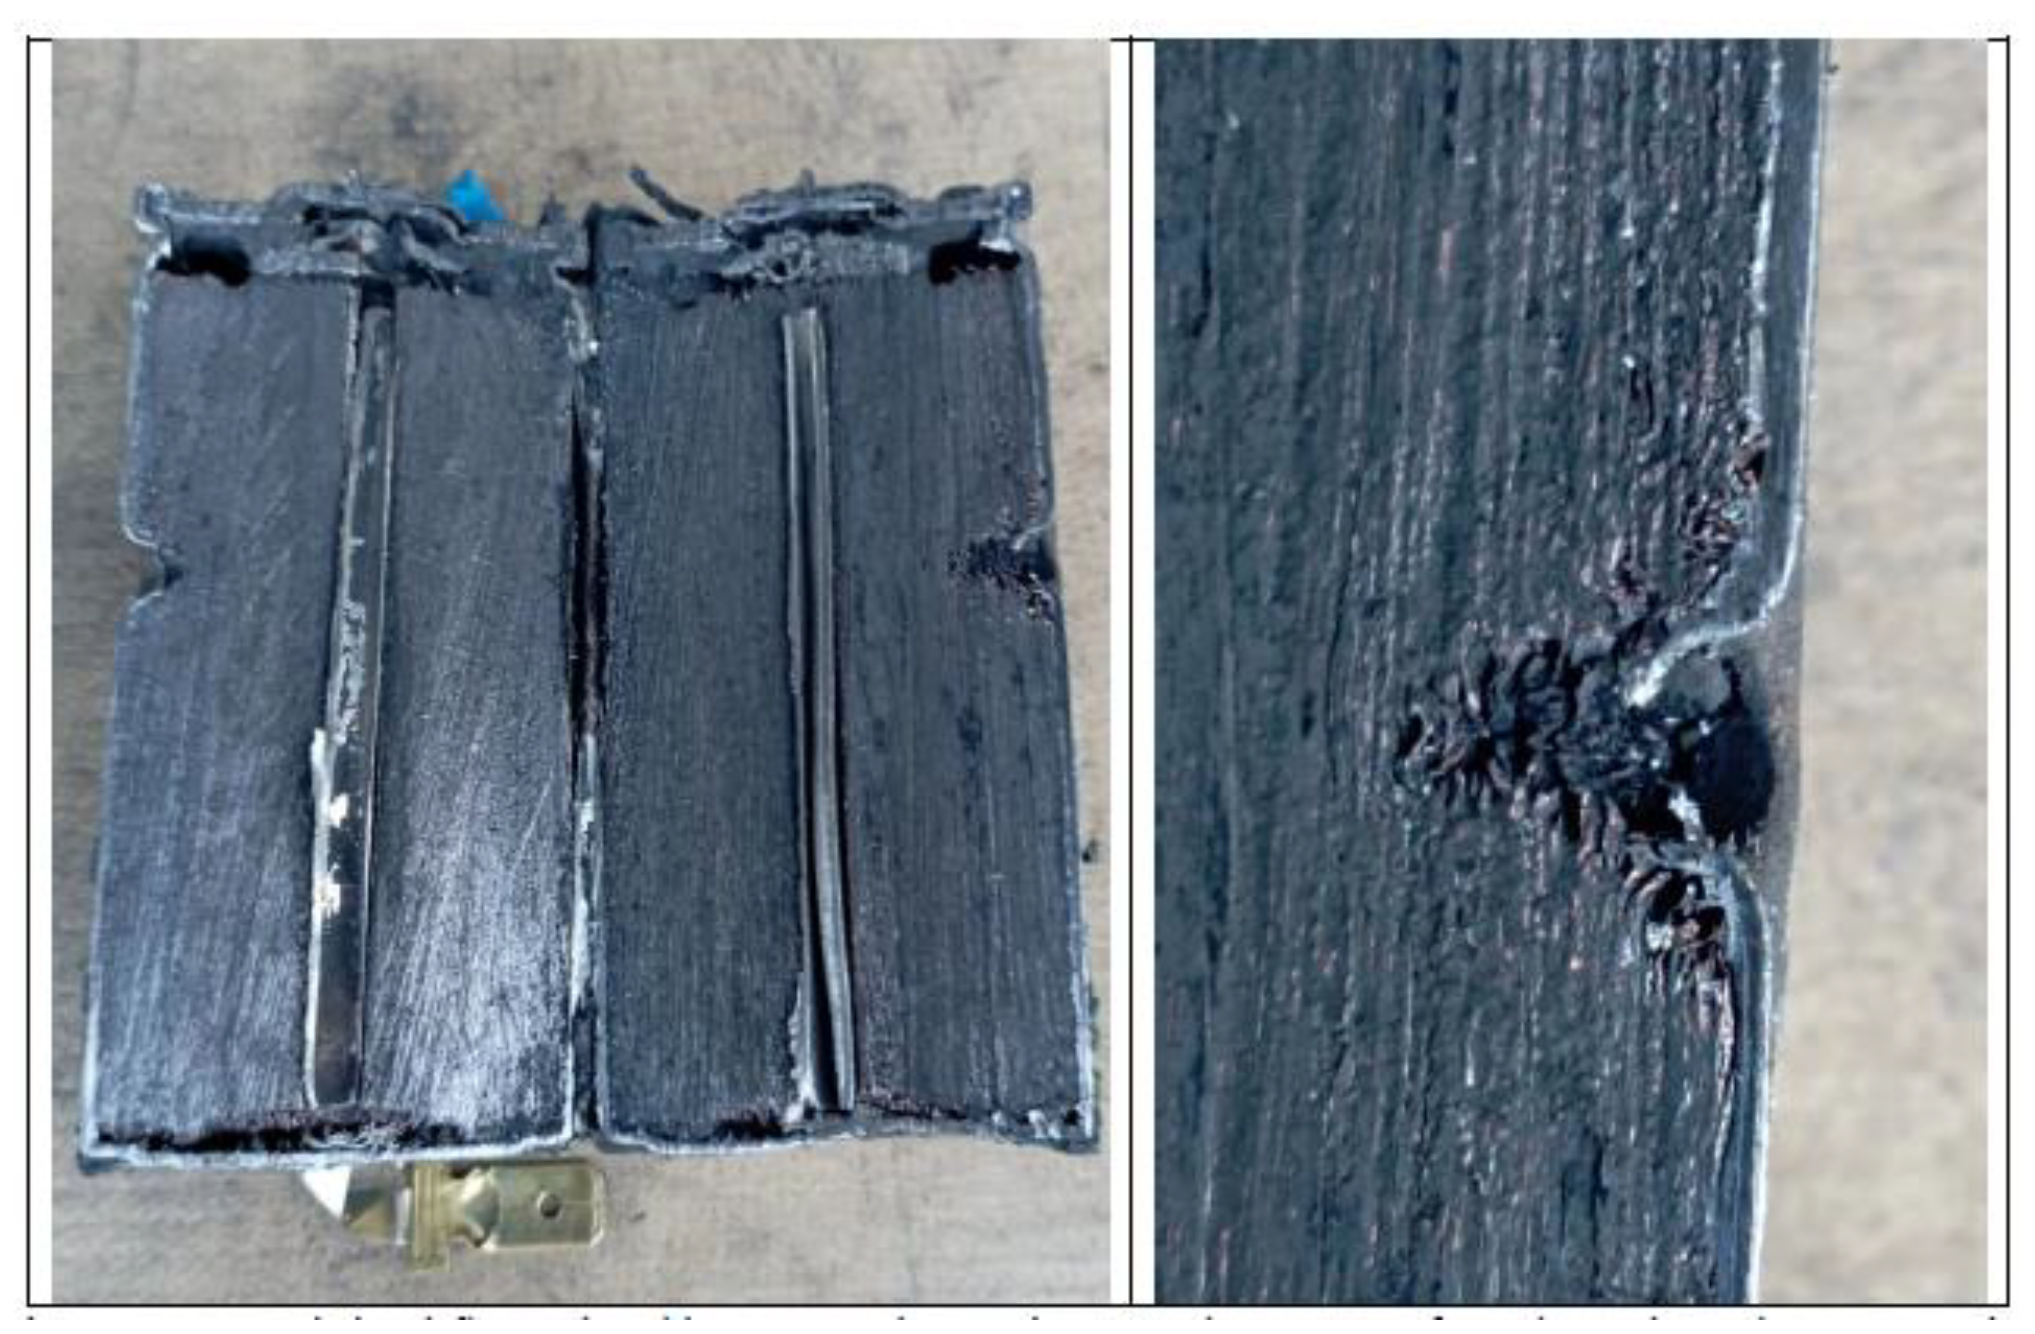
Figure 17.
Image of the damage in cell B tested, where you can clearly see the perforation, it has undergone.
Figure 17.
Image of the damage in cell B tested, where you can clearly see the perforation, it has undergone.
During the penetration test of a rod into the cell in the direction perpendicular to its longitudinal axis in the case of this cell with a SoC of 50%, it was observed that it was also necessary to penetrate the cell with a SoC of 50%, it was observed that some penetration of the rod was also necessary to trigger the TR process. The venting of the cell occurred through the cell vent valve located at the positive pole of the cell. It can be concluded that a major damage to the competent cell internals is necessary for the failure to occur.
The cell reached a maximum temperature of 98.39 °C, which is much lower than the maximum temperature reached by cell C with 100 % SoC (326.95 °C), which was subjected to the same test. In the graph (
Figure 18) shows the temperature reached by cell B as well as the voltage behavior.
Figure 18.
Temperature and voltage of cell B (SoC 50%) as a function of time, during the mechanical abuse test, in which it is subjected to a perforation in a direction of the longitudinal axis of the cell until a short circuit.
Figure 18.
Temperature and voltage of cell B (SoC 50%) as a function of time, during the mechanical abuse test, in which it is subjected to a perforation in a direction of the longitudinal axis of the cell until a short circuit.
In the figure above (
Figure 18) when the TR process starts to occur, the voltage begins to fall, with no subsequent voltage rise until it reaches 0 V.
Figure 19.
Image of the damage in cell B tested (SoC 50%) for mechanical abuse by perforation in the direction of the longitudinal axis of the cell.
Figure 19.
Image of the damage in cell B tested (SoC 50%) for mechanical abuse by perforation in the direction of the longitudinal axis of the cell.
Figure 19 shows images of the state of the cell after the test, in longitudinal direction, in which the damage produced by the perforation can be observed, as well as the state of the electrodes. The damage is less than in the case of cell C (SoC 100% and perforated in the direction of the longitudinal axis of the cell), with more pronounced damage on the outside of the inner zone. Damage can also be seen in the transverse direction of the cell, as in the case of cell C, but this has probably been caused by the device used to hold the cell in place so that it does not move during the test. The images show the copper collector of the anode to be less damaged than in the case of cell C tested. No melted particles from the electrode materials are visible. The picture on the right shows a detail of the perforation point, damage to the electrodes leading to the short-circuit can be observed. Below (
Figure 20) are images of the test corresponding to the events identified as most significant during the mechanical abuse test:
During this test, it is observed that the outflow of gases and electrolyte leakage takes place at the top, the area where the perforation takes place, instead of through the vent valve, unlike the rest of the mechanical abuse tests in which the outflow of gases and electrolyte has taken place through the vent valve. It is observed that in the case of perforation in the direction of the longitudinal axis when SoC 50%, the events experienced are less intense than in the case of being charged to 100% (SoC 100%). To analyze the condition of the cells after the tests, the internal resistance of the cells was also measured before and after the test, and the following results were obtained (
Table 6).
The table above (
Table 6) shows that the cell with the highest final resistance after the test and the highest ΔDCIR (mΩ) is cell C, so that only by measuring the internal resistance we can state that the cell that suffers the most damage and is the most degraded and deteriorated is the cell in test 3, cell C with a load state of 100% subjected to a perforation test in the direction of its longitudinal axis, in the area of the negative pole. And the cell with the lowest internal resistance after the test and the lowest ΔDCIR (mΩ) is cell D, so it is the one that suffers the least damage, it is the cell subjected to a perforation test in a direction perpendicular to the longitudinal axis of the cell, with a state of charge of 50%.
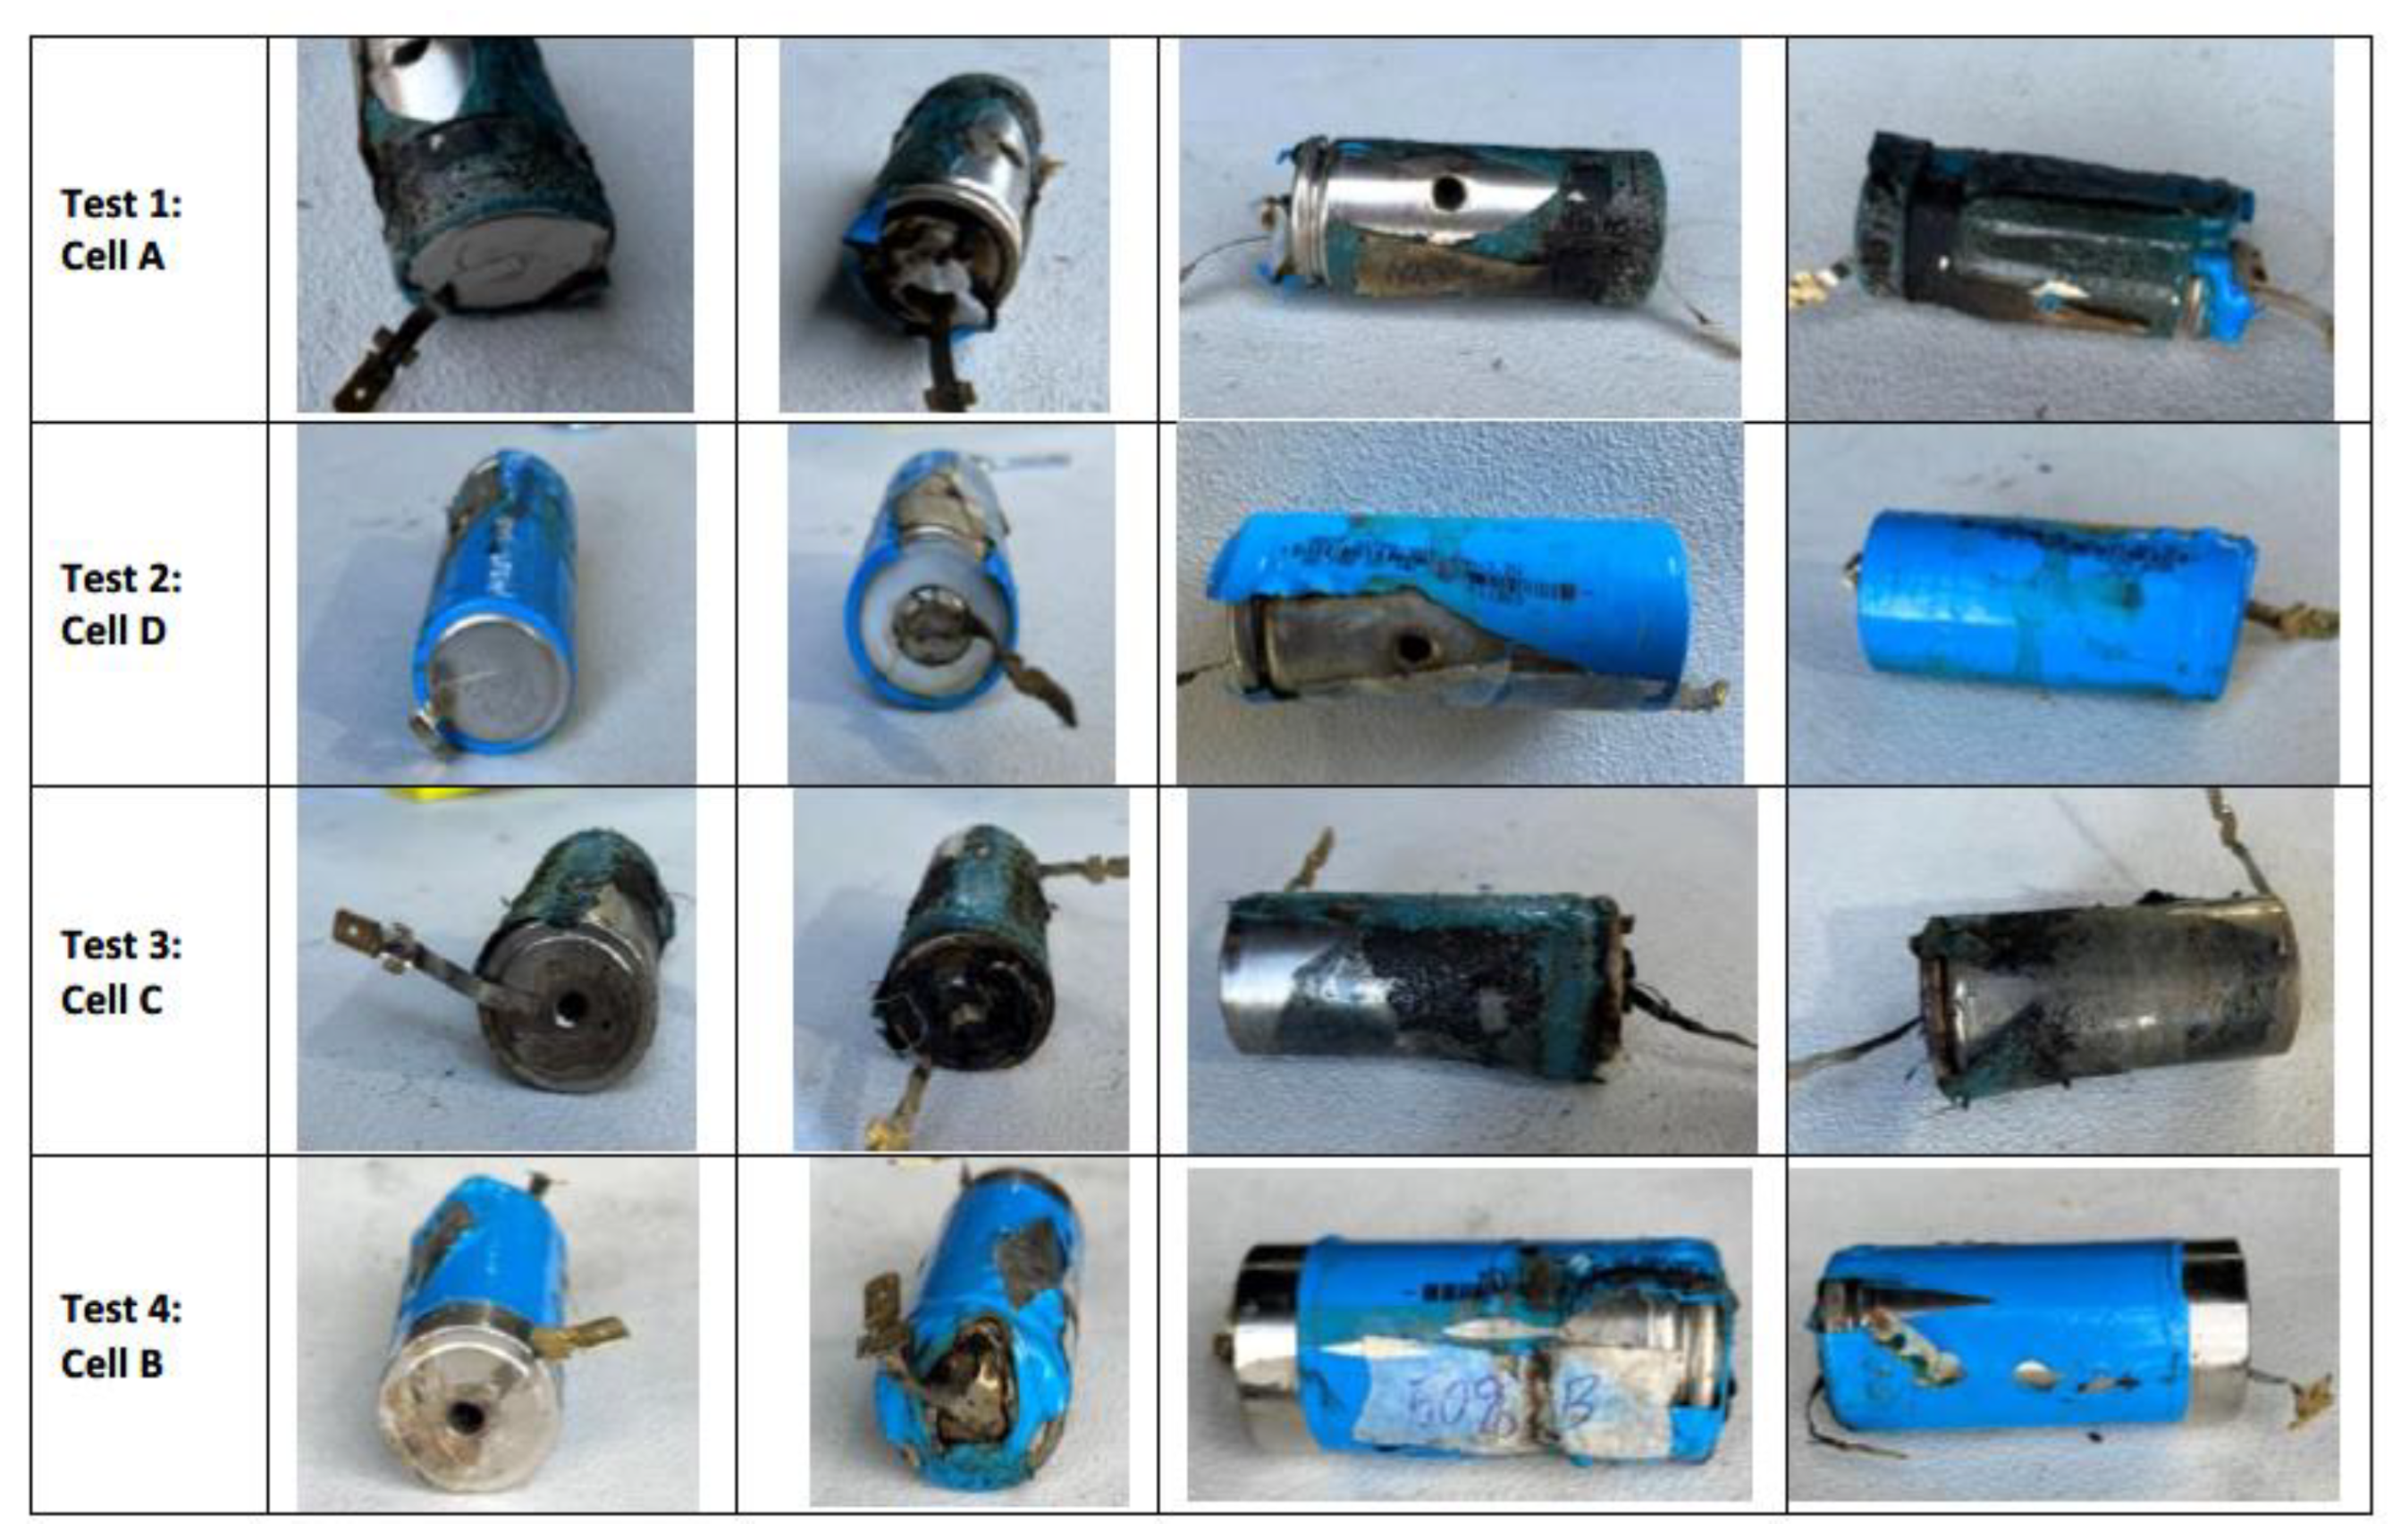
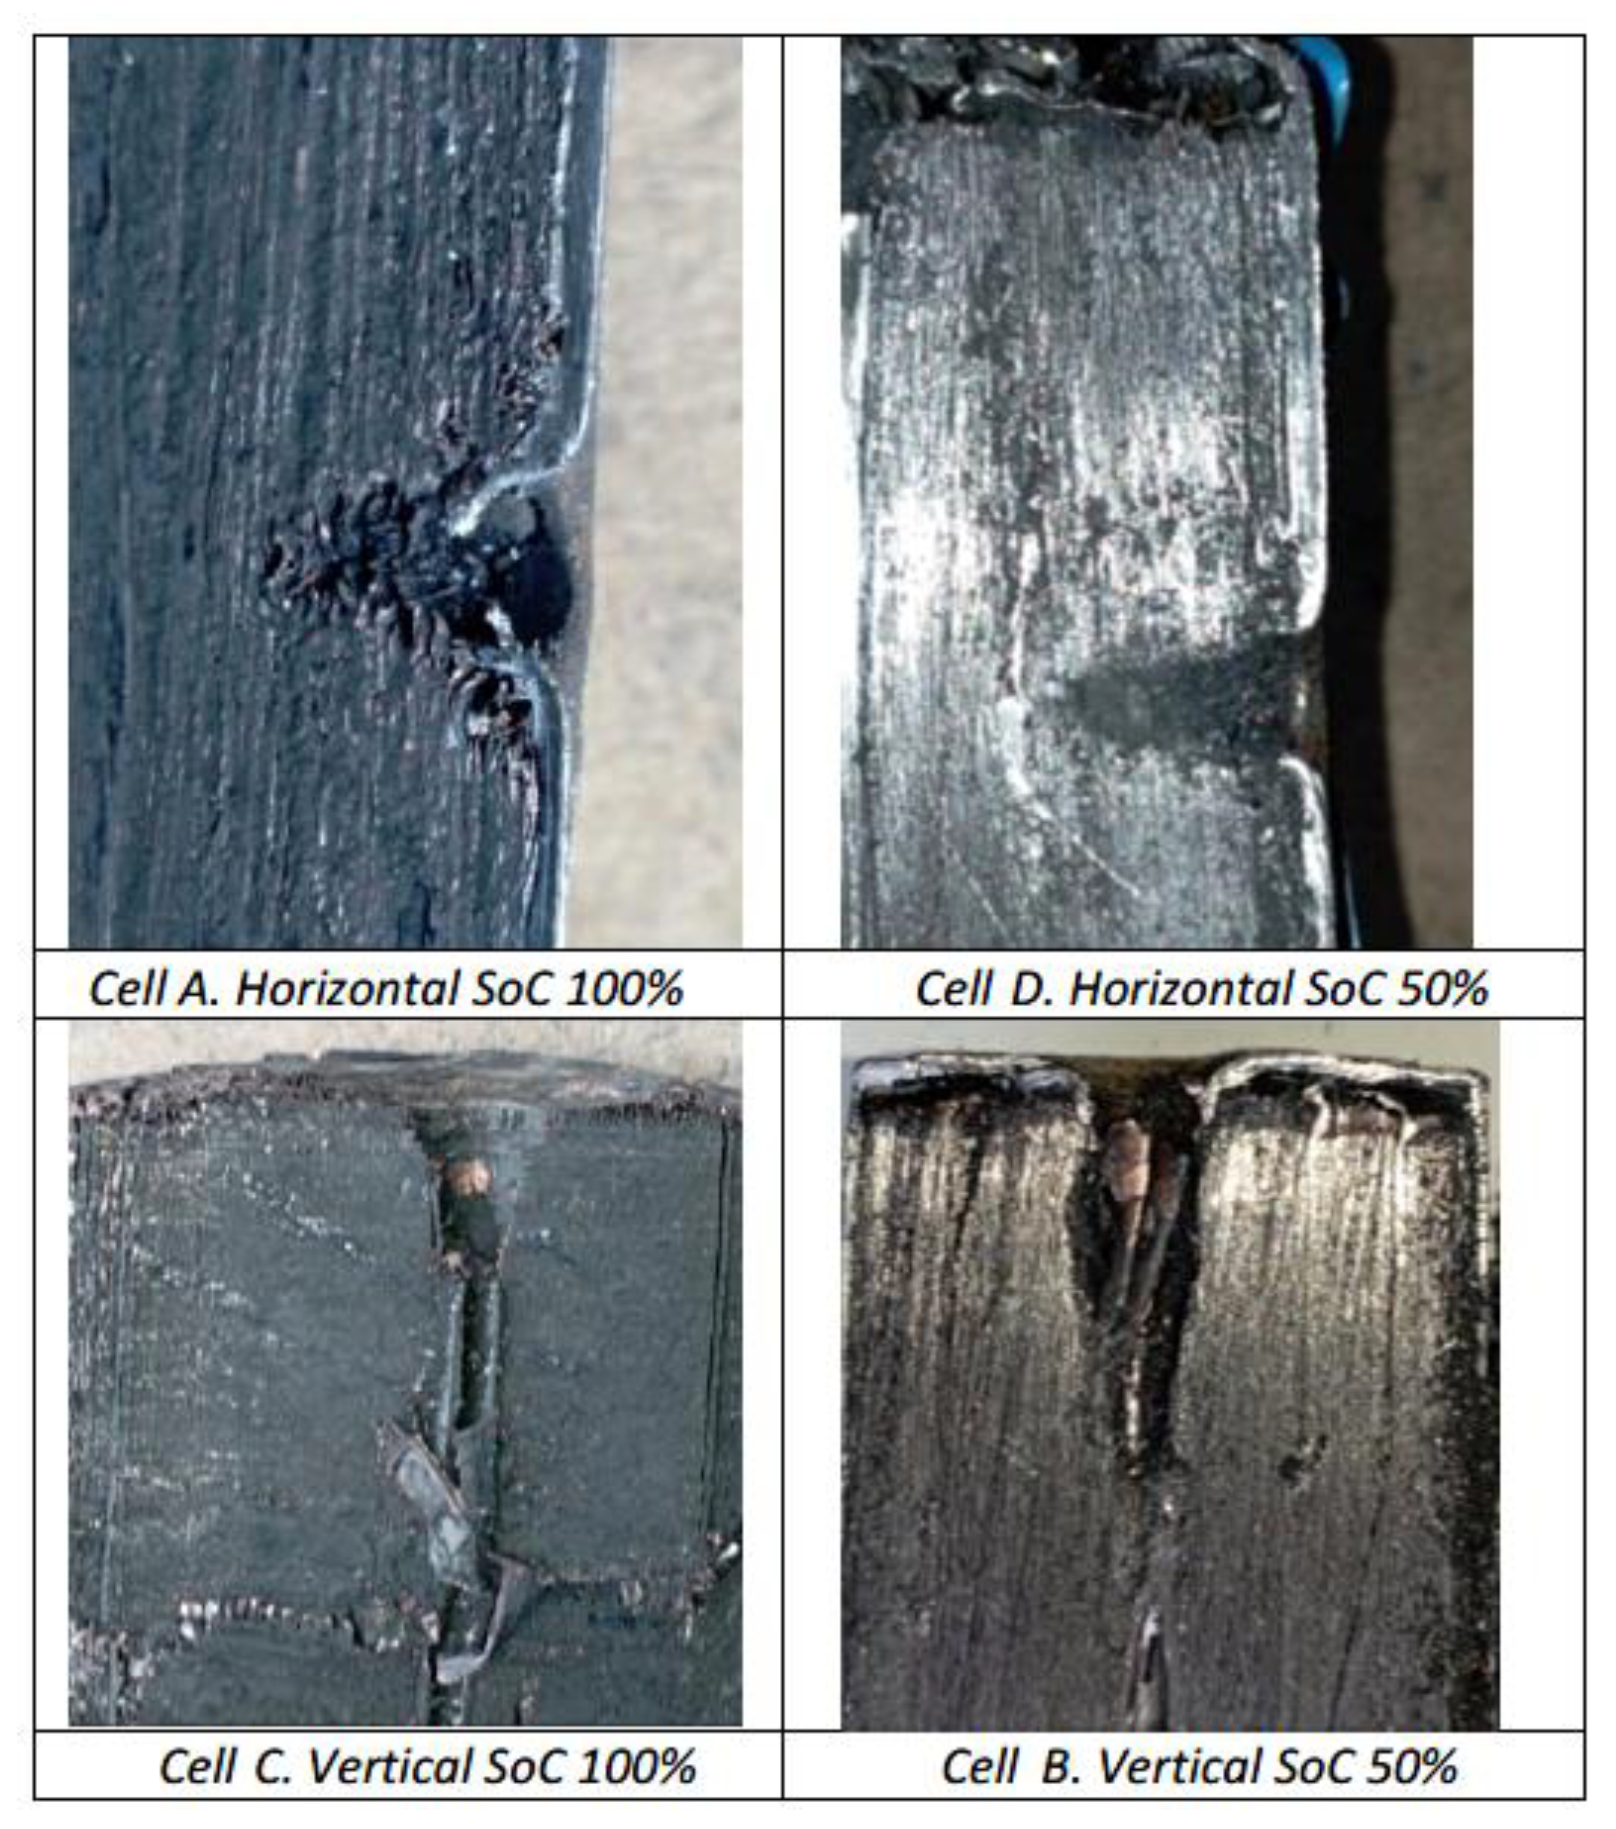
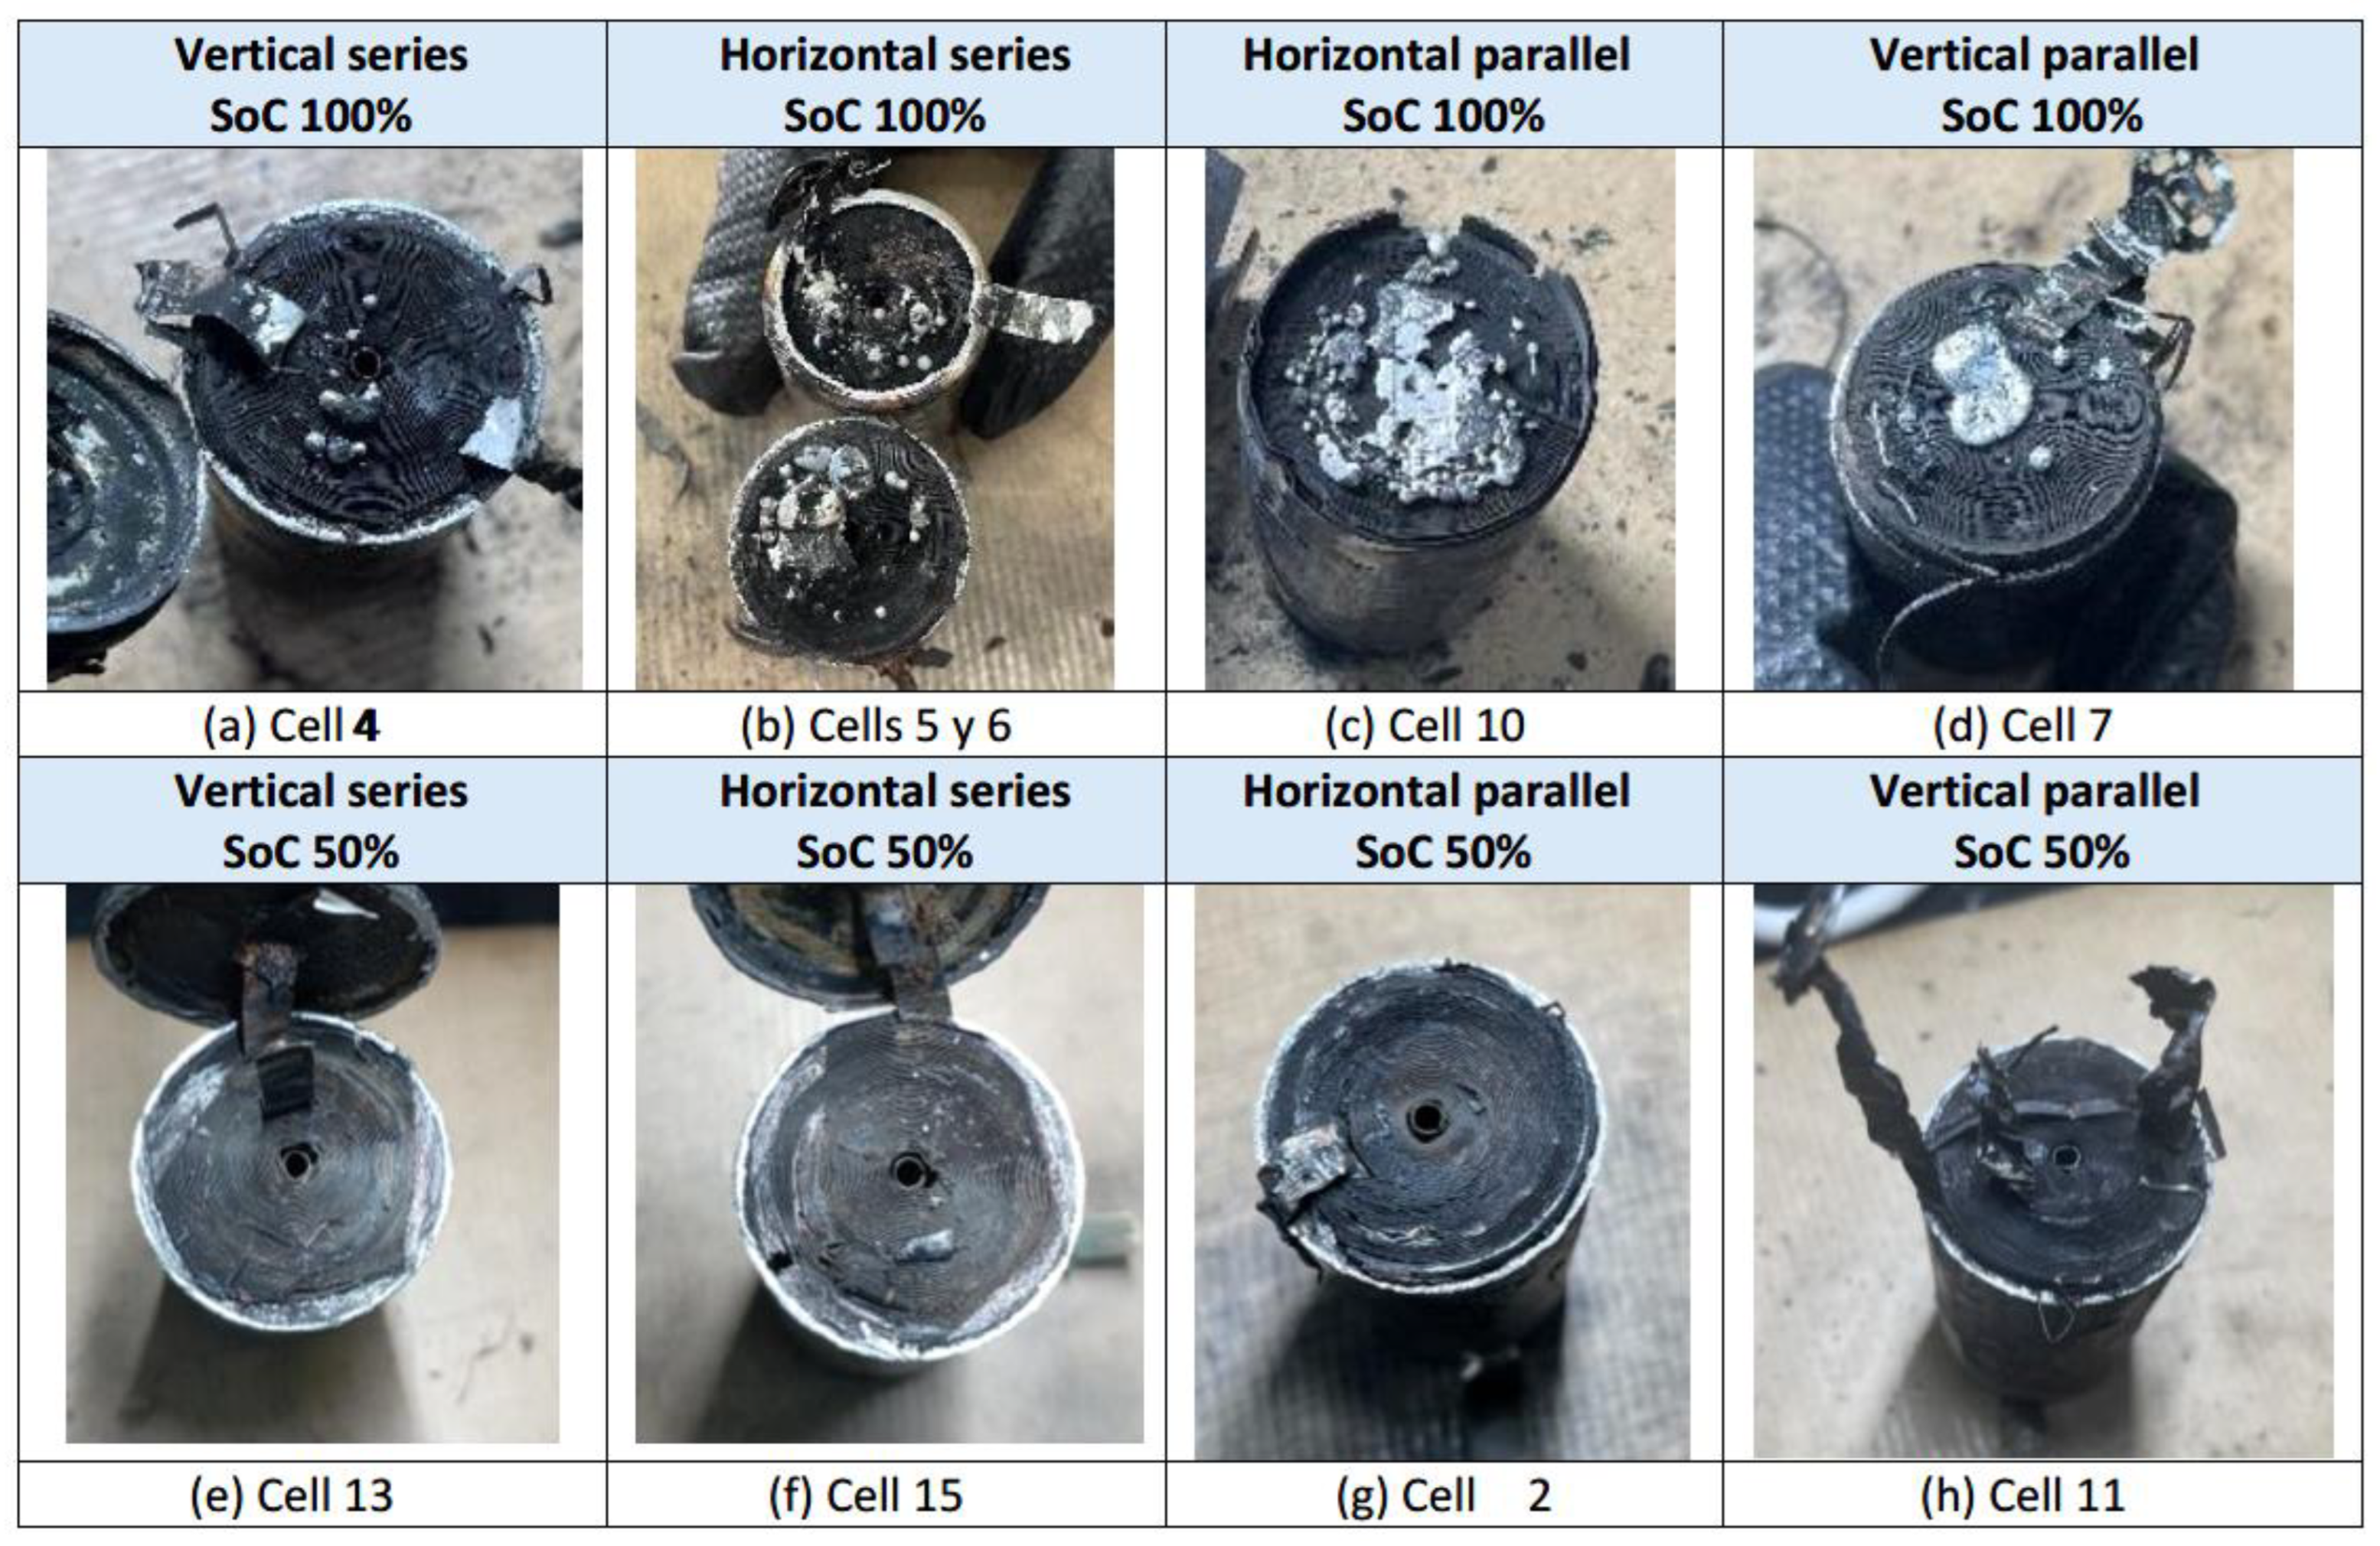
To complete the analysis, a qualitative comparison of the final state of the cells after the test is carried out, as shown in the following figure (
Figure 21). Analyzing the final state of the cells in their external area, it can be concluded that qualitatively the cells most affected are those with 100% state of charge, so it can be concluded that the state of charge is one of the most influential factors when it comes to producing Thermal Runaway after mechanical abuse by perforation. Regarding the area where the perforation is performed (in the direction perpendicular to the cell longitudinal axis or in the direction of the cell longitudinal axis), after analyzing the final state of the cells externally and internally (
Figure 21 and
Figure 22), as well as the maximum temperature reached after the Thermal Runaway (
Figure 23), it is concluded that perforation in the direction of the cell longitudinal axis is more dangerous.
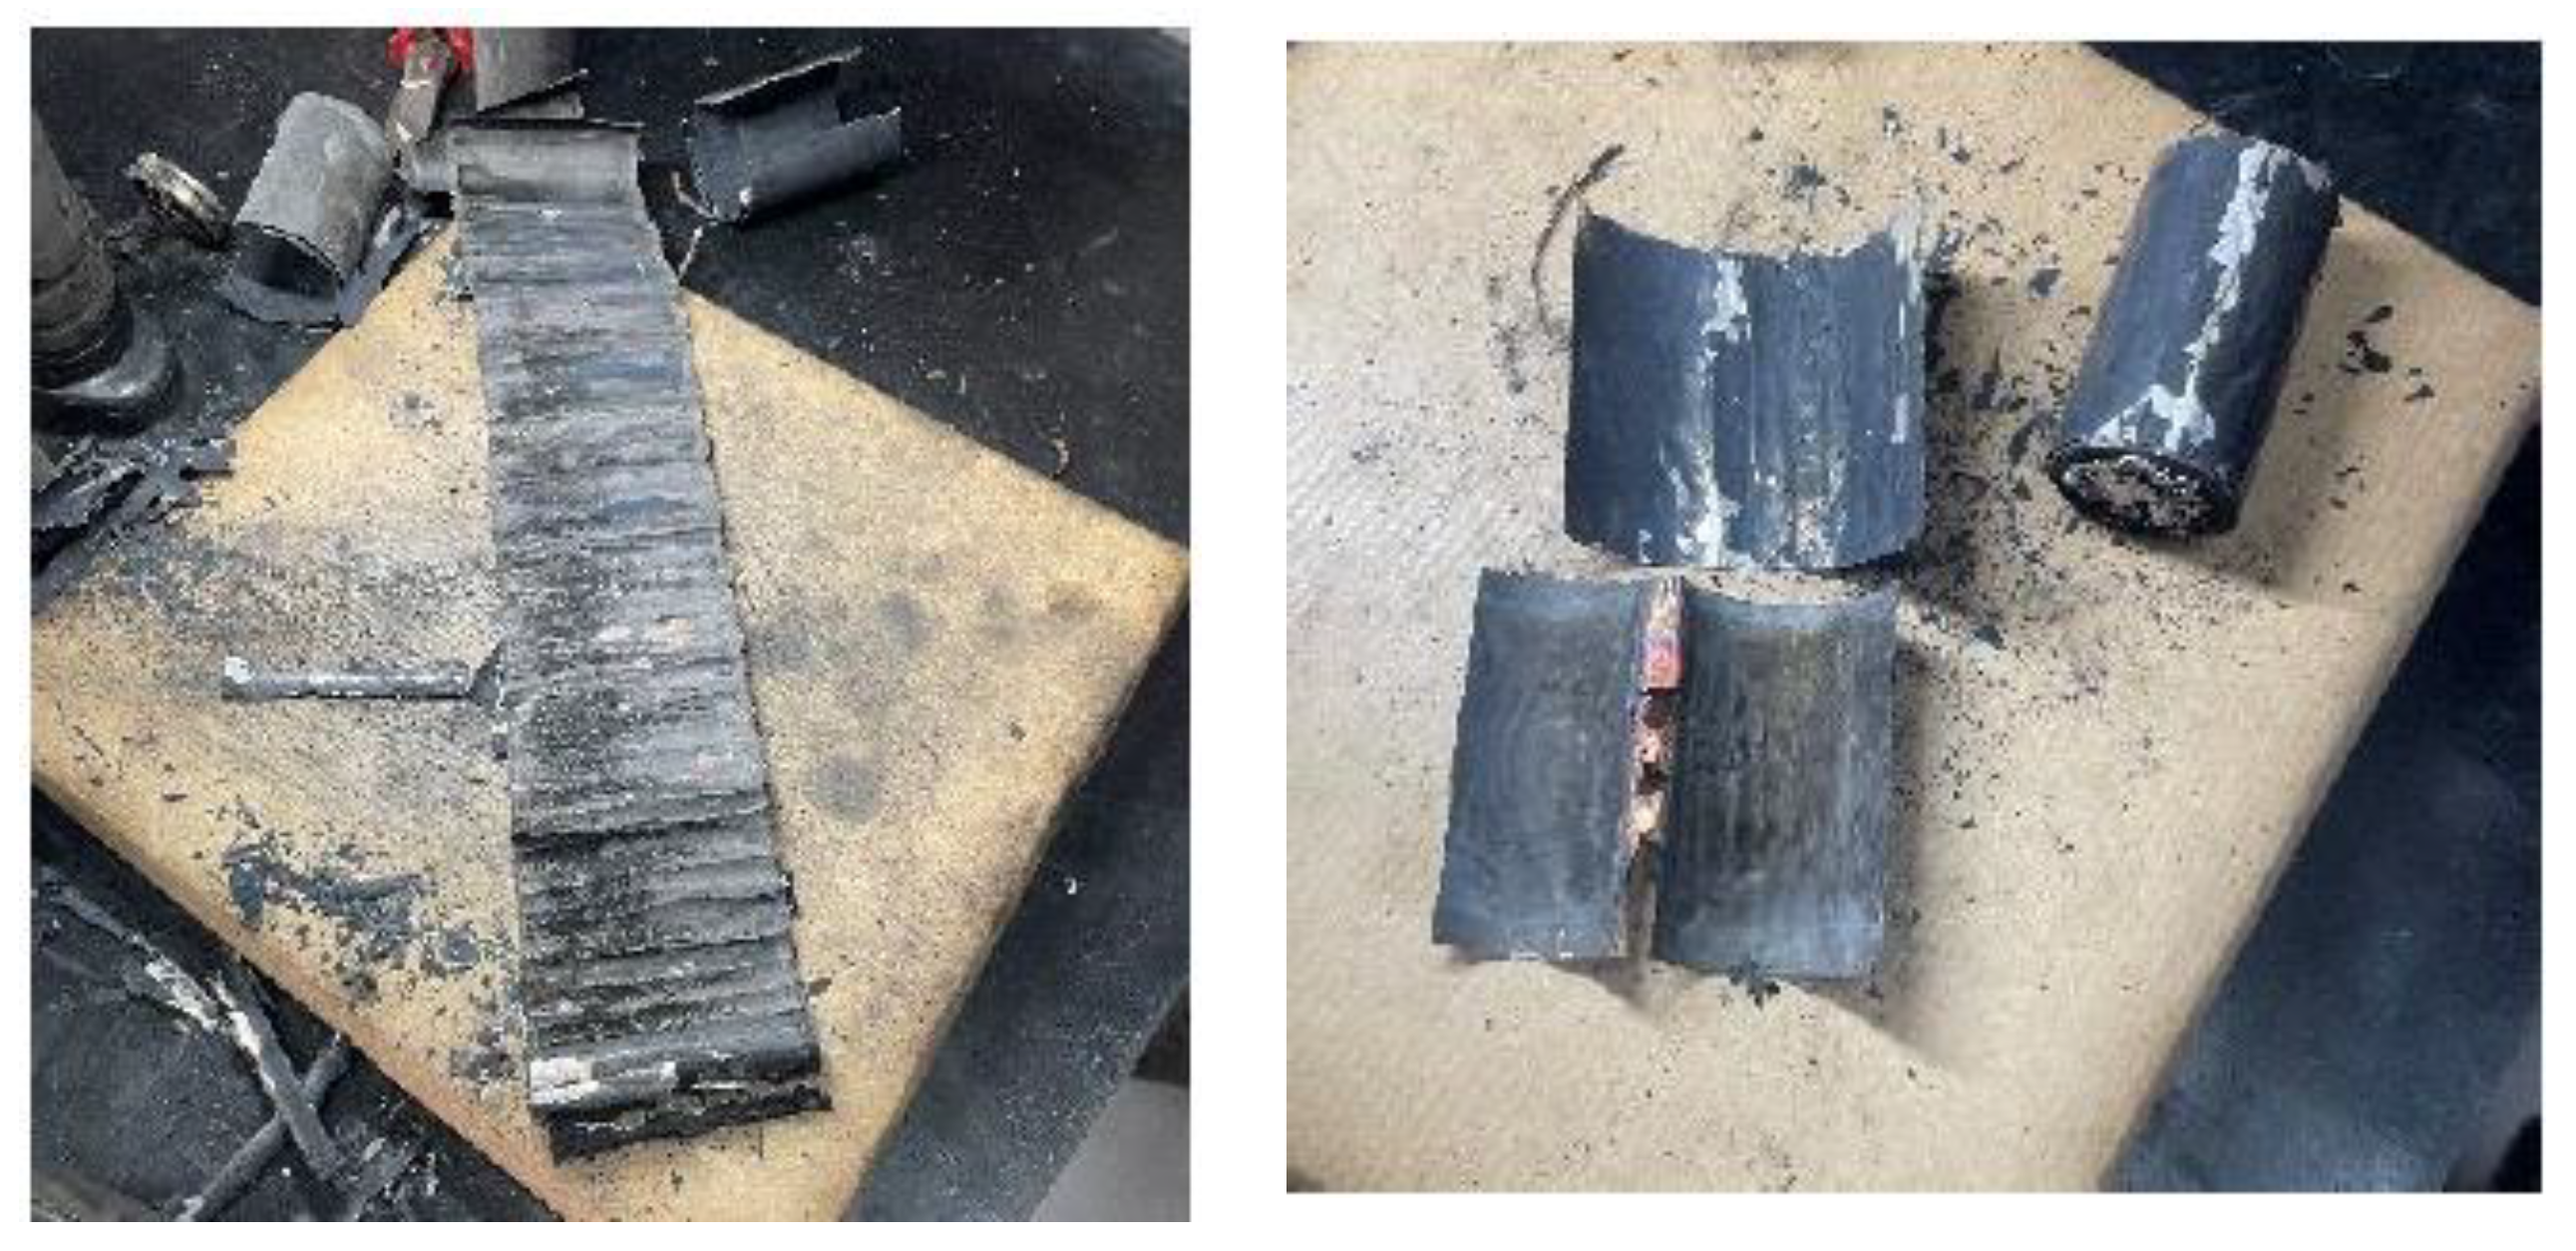
The following images show a comparison of the final state of the cells after the test, once they have been sectioned to analyze their interior (
Figure 22).
The following
Figure 23 shows a comparison of the temperature curves achieved by the different cells tested. The cell that reaches a higher temperature after the TR is cell C, with a SoC of 100% and subjected to a perforation test in the direction of the longitudinal axis. This corresponds to the results obtained when comparing the final state of the tested cells. The cell reaching the next highest temperature value is cell A, with a SoC of 100%, and tested by perforation in a direction perpendicular to the longitudinal axis of the cell. However, if the two cells are compared with a SoC of 50% (cell D (perforation in the direction perpendicular to the cell longitudinal axis) and cell B (perforation in the direction of the cell longitudinal axis)) show the same behavior, but in this case, a worse result is obtained for the case of cell D, perforated in the direction perpendicular to the longitudinal axis of the cell. Therefore, no conclusions can be drawn as to which penetration direction is worse. If we consider the ambient temperature at which the test is carried out (
Table 5), since it is not a controlled temperature, it has very different values. ranging from 28 °C to 45 °C, justifying the fact that in the case of cell D a higher temperature is obtained in the test than in the case of cell B, since in the first case the ambient temperature is almost 20 °C higher than in the second case. It is therefore concluded that the worst case scenario for a failure due to mechanical abuse by perforation is that the cell/battery is 100% charged and the perforation occurs in the direction of the longitudinal axis. At It can also be seen in the
Figure 23 that the first to reach the TR is cell C, followed by cell D, cell B and cell A, so it can be concluded that the start of the TR is strongly influenced by the ambient temperature.
Below is a graph (
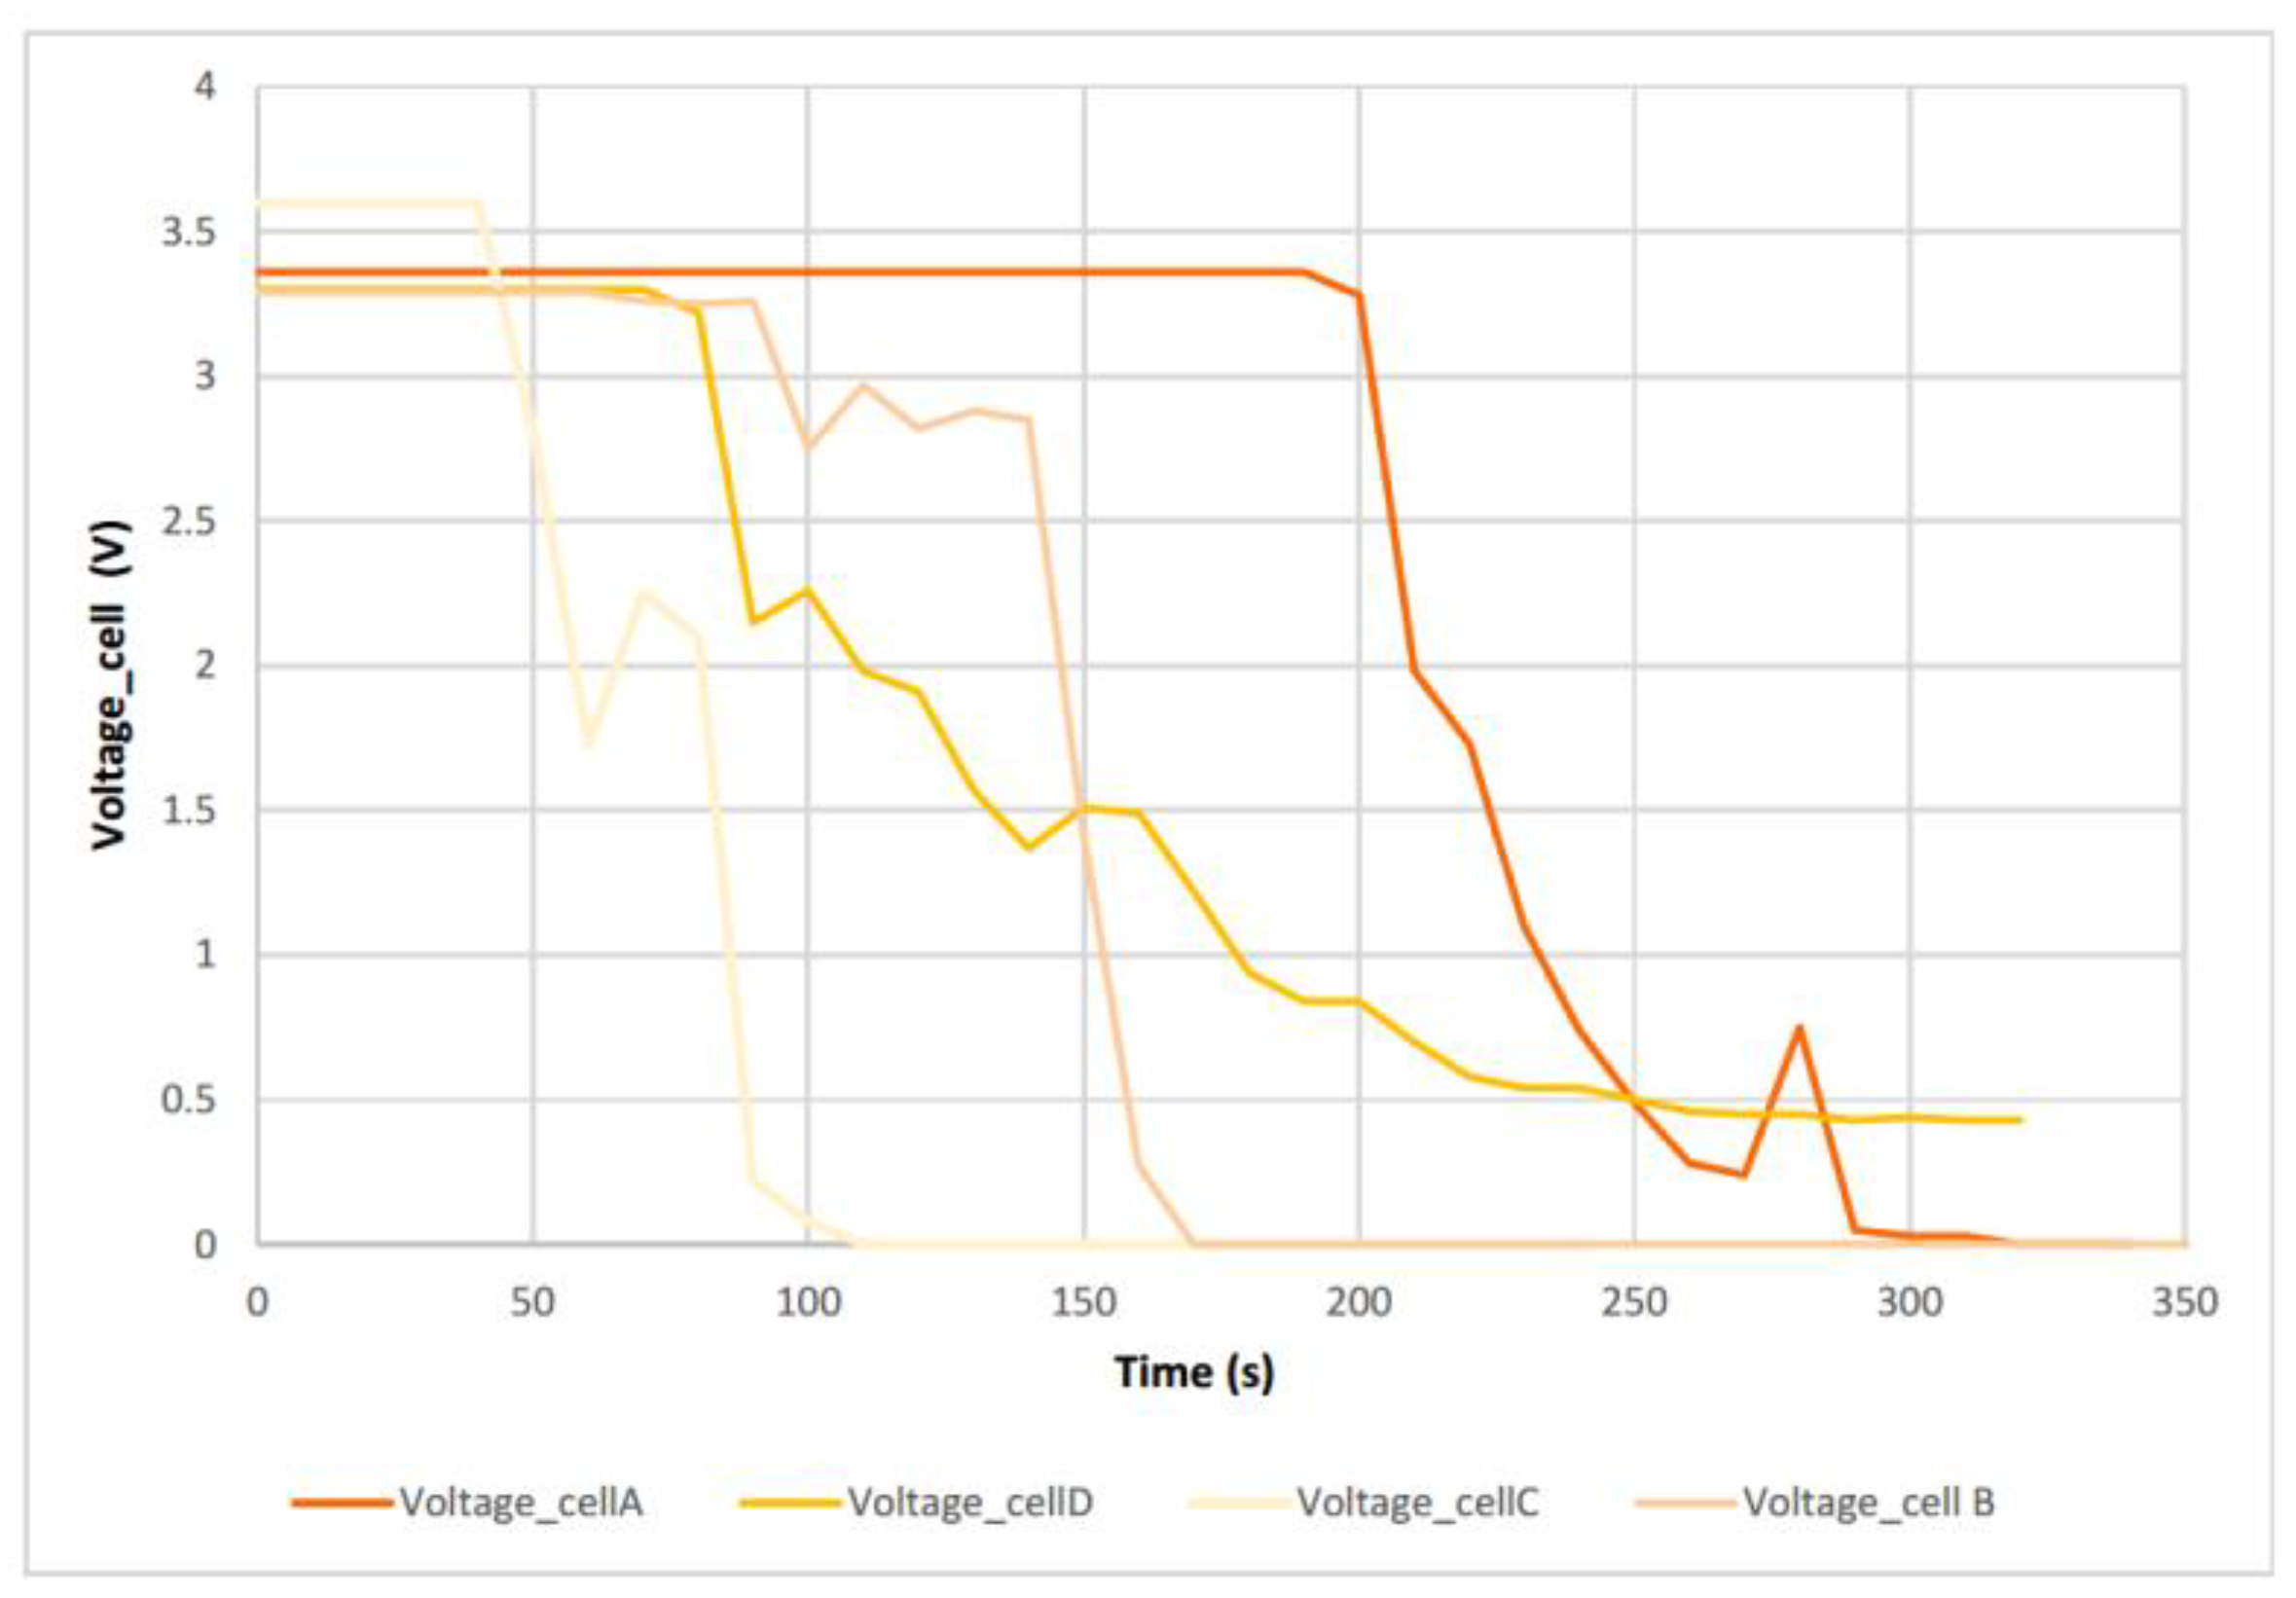
Figure 24) comparing the voltage behavior of each of the cells tested. After the test, the only cell that does not remain discharged at 0 V is cell D (SoC 50%), perforated in the direction transverse to the cell longitudinal axis. Cell C is the first cell in which the voltage drops, followed by cell D, cell B and cell A, corresponding to the behavior of the temperature curves, i.e., when the voltage starts to drop the temperature starts to rise.
Once it has been proven that the most dangerous arrangement and situation in the event of a perforation is the vertical cell with a SoC of 100%, a new test is carried out with a lithium ion NMC cell with a SoC of 100%, which has been subjected to a perforation test in the direction of the longitudinal axis of the cell, in order to compare the behavior of an LFP cell with an NMC cell, in the most dangerous arrangement under mechanical abuse by perforation. The specifications of the NMC cell to be tested are shown below (
Table 7).
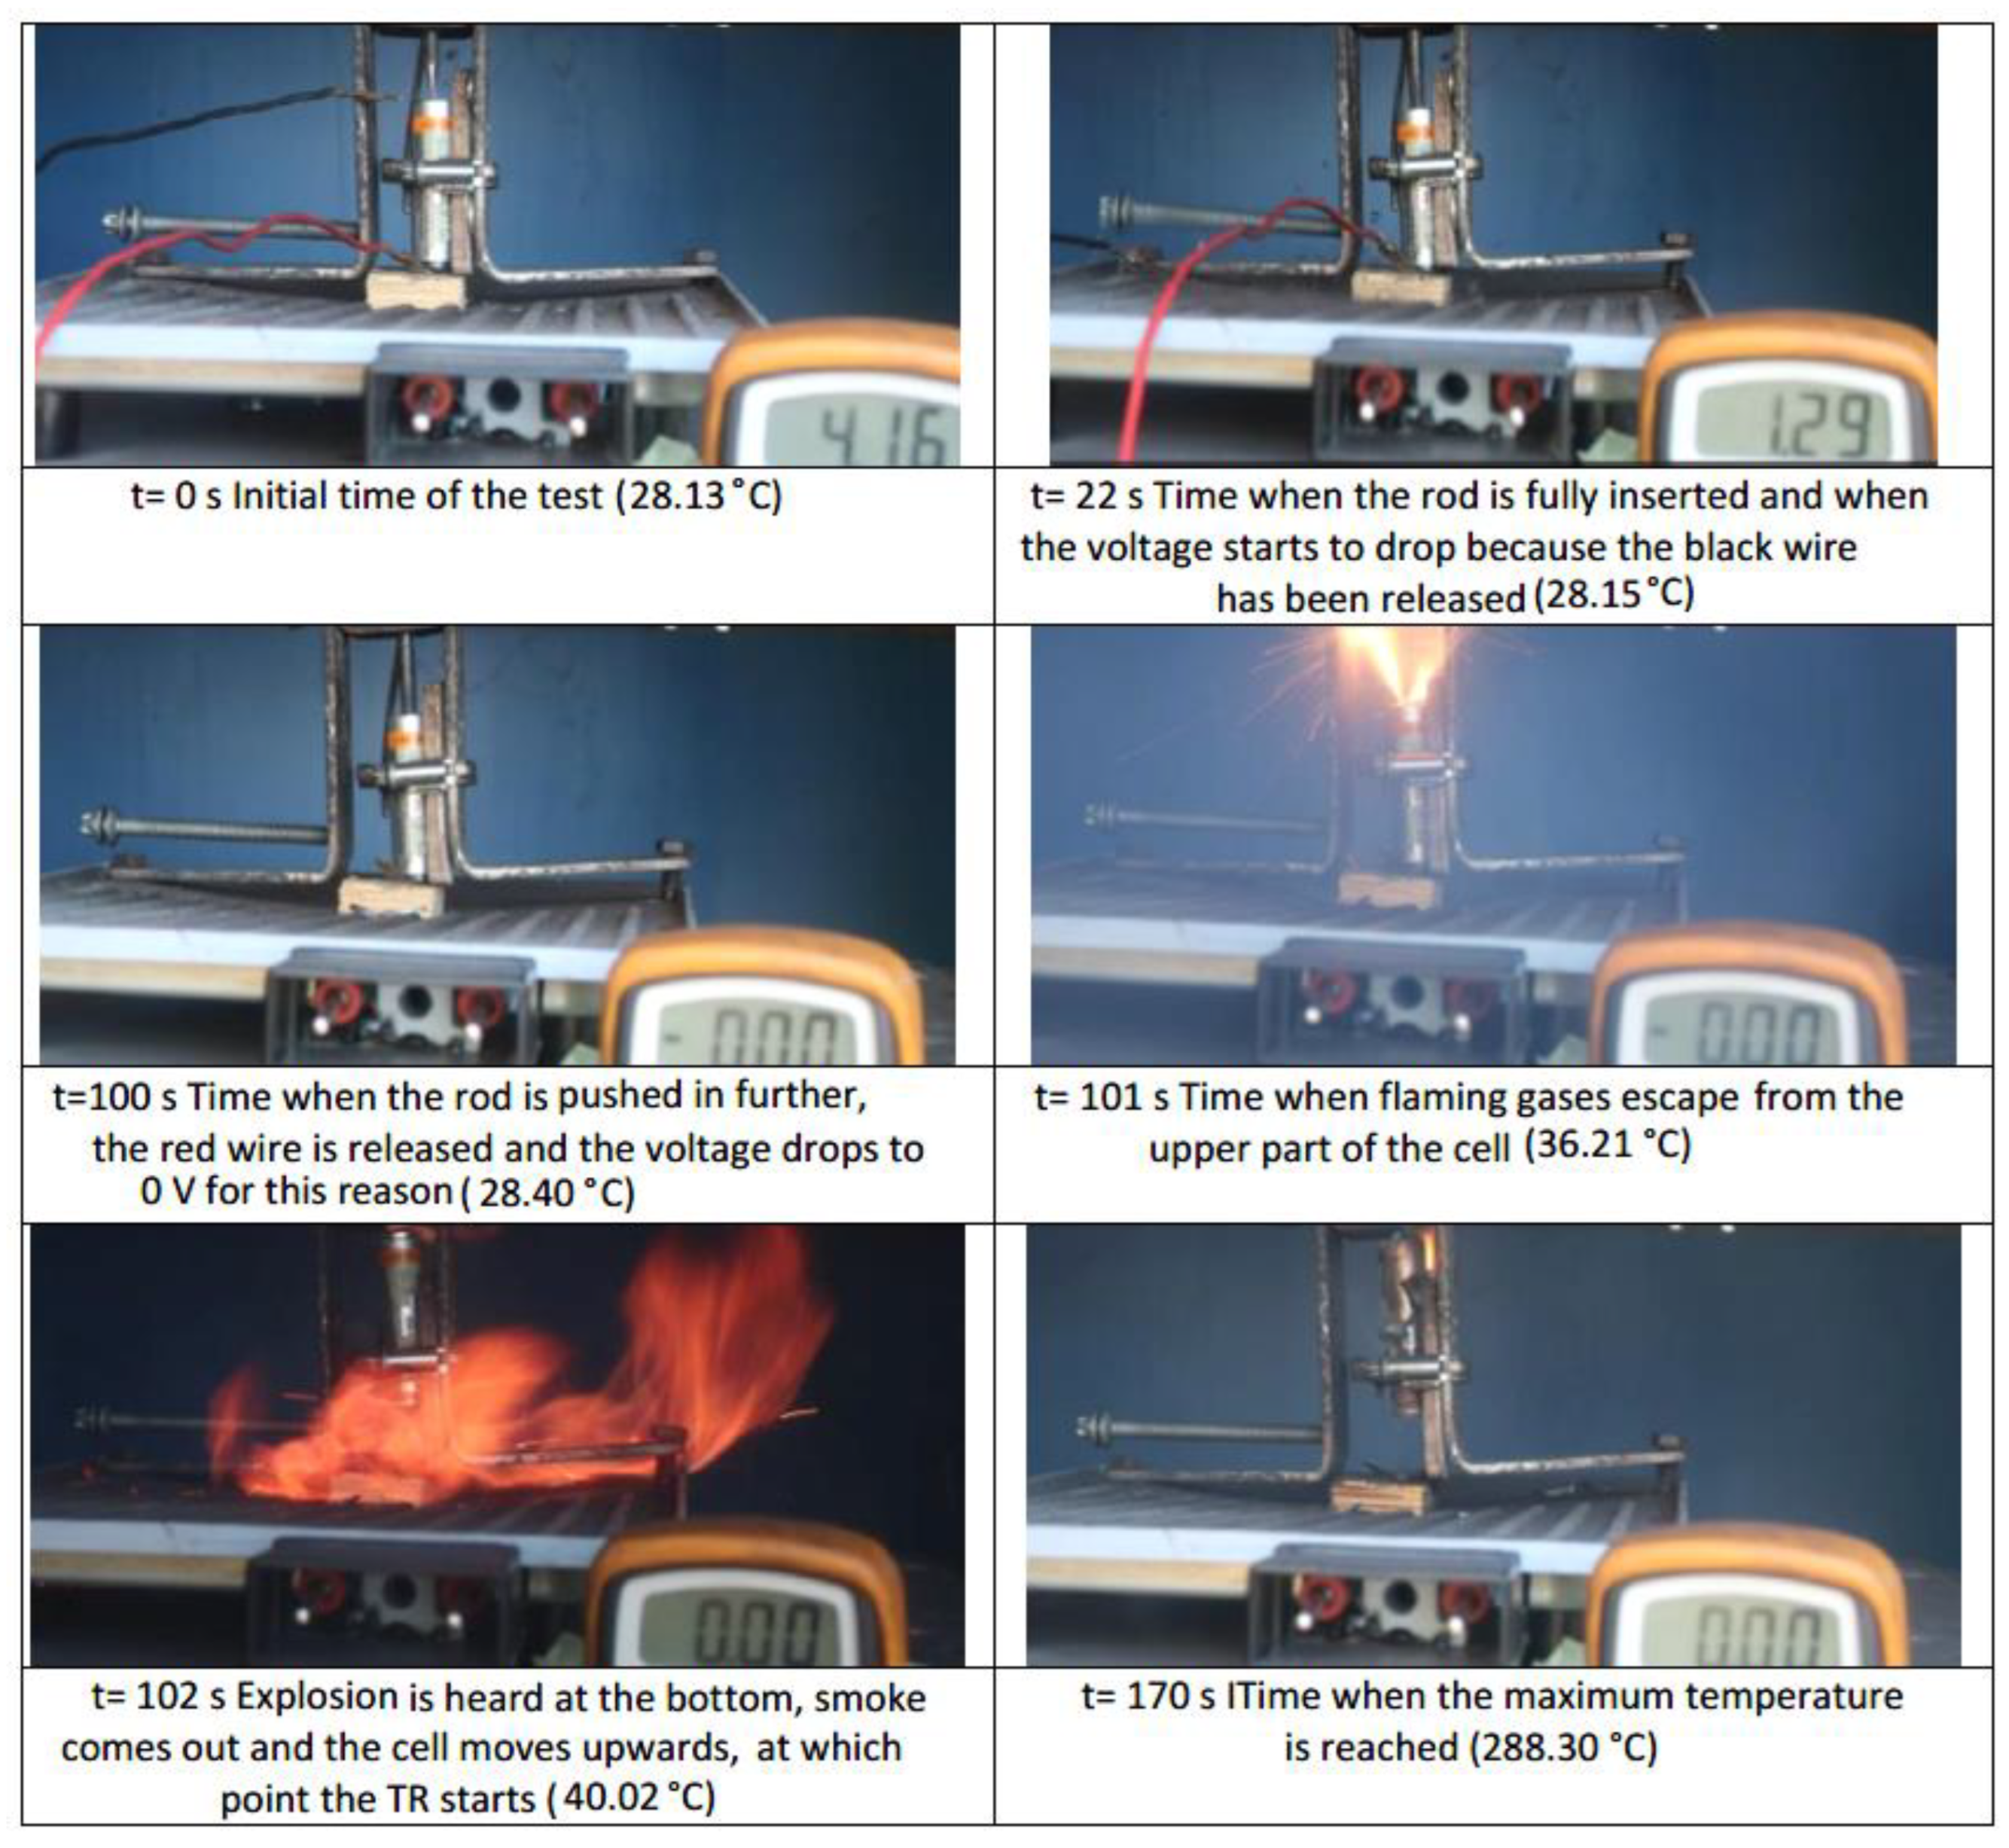
3.1.5. Test 5: Vertical SoC 50% (lithium-ion cell NMC)
The test is performed on a cylindrical 18650 cell in vertical arrangement (with the vent valve at the bottom) with a SoC of 100%. As in the previous tests, a K-type thermocouple is placed on the cell to measure its temperature and a voltmeter is used to measure the voltage during the test. The cell is perforated in the direction of its longitudinal axis with a sharp element, the following
Figure 25 shows the set-up of the test.
In this test, a block of wood is placed to prevent the positive pole of the cell from short-circuiting with the yield since the upper part of the cell is the negative pole and, as it is perforated, the rod with which it is perforated is also negatively charged, so that if the positive pole were to come into contact with the metal plate, a short-circuit would occur, since the plate would be negatively charged when it comes into contact with the cell casing (also negative).
During the test of penetration of a rod into the cell in the direction of its longitudinal axis, it was observed that some penetration of the rod is necessary to trigger the TR process, as was the case with the LFP cell. The major difference with the LFP cell is the behavior of the cell upon failure due to mechanical abuse. It first explodes at the top (negative pole) and the vent valve does not act first as it did in the case of the LFP cell. On the other hand, after the first event, it does explode through the vent valve (positive pole) and has such an intensity that the cell moves upwards, if it had not been clamped it would have been projected during the test. It can be concluded that the LFP cell is safer than the NMC cell.
The voltage drops at the beginning when the cell is hit is abrupt, but this voltage drop is since during the test the black wire connected to the negative pole of the cell to measure the voltage has been released, so the voltage behavior cannot be analyses in this test. If the temperature behavior is analyzed, the TR starts at 102 s and that the maximum temperature reached is 288.30 °C.
The following images (
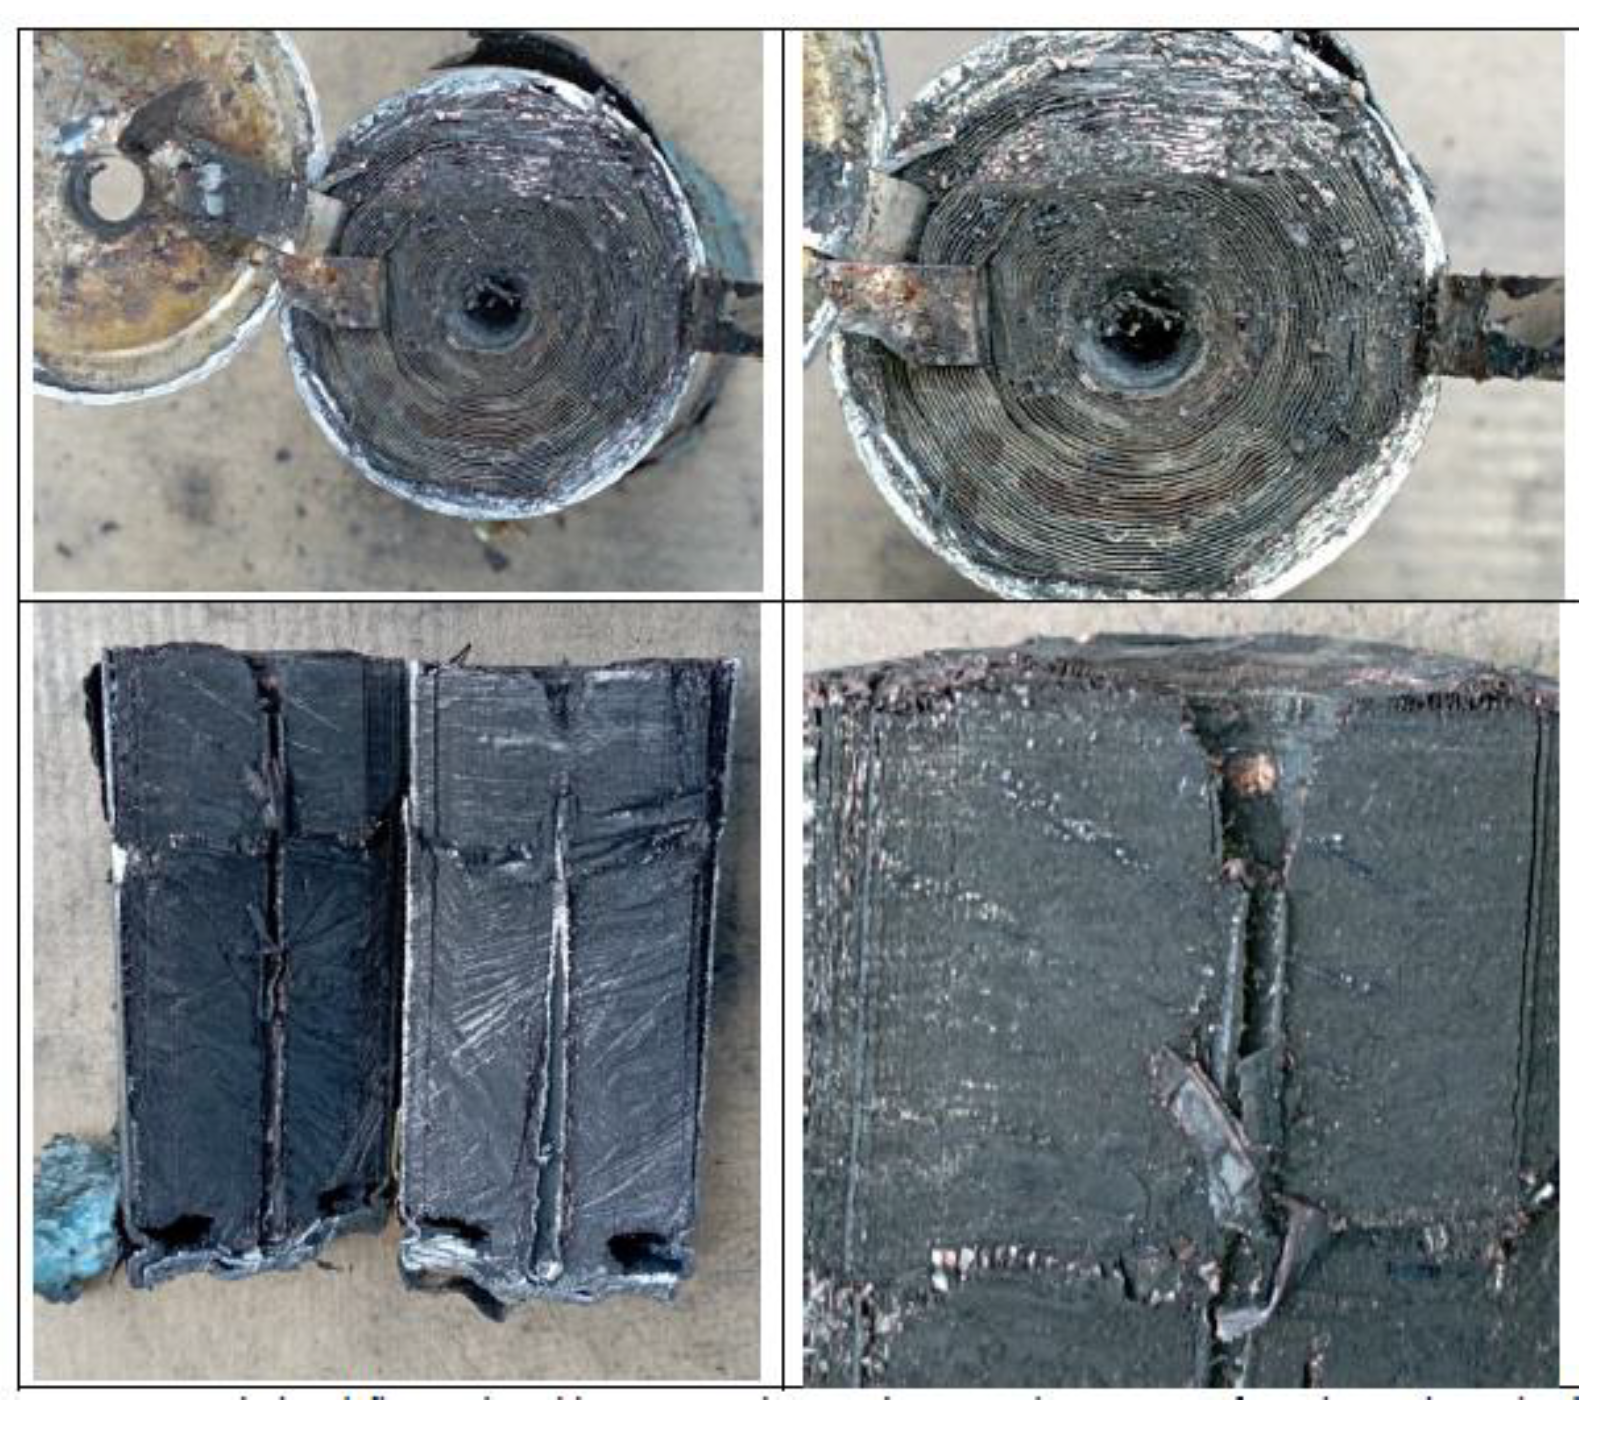
Figure 26) compare the state of the C cell (SoC 100%, perforation in the direction of the cell longitudinal axis and LFP chemistry) with the state of the NMC cell (SoC 100%, perforation in the direction of the cell longitudinal axis and NMC chemistry), both inside and outside.
It is observed that the LFP cell (
Figure 26 right) is more damaged internally, visually it can be seen that it is more calcined than the NMC cell (
Figure 26 left), this may be attributable to the higher maximum temperature reached. However, to better characterize the damage, a more detailed analysis of the compounds generated during the reaction that has taken place would have to be carried out. On the other hand, it can also be observed that although the rod is the same, the resulting hole is larger in the case of the NMC cell (
Figure 26 left), this may be due to an explosion and fire occurring at the top. In addition, it can also be observed that the copper collector (of the negative anode) is more damaged in the case of the NMC cell than in the case of the LFP cell.
Below are images (
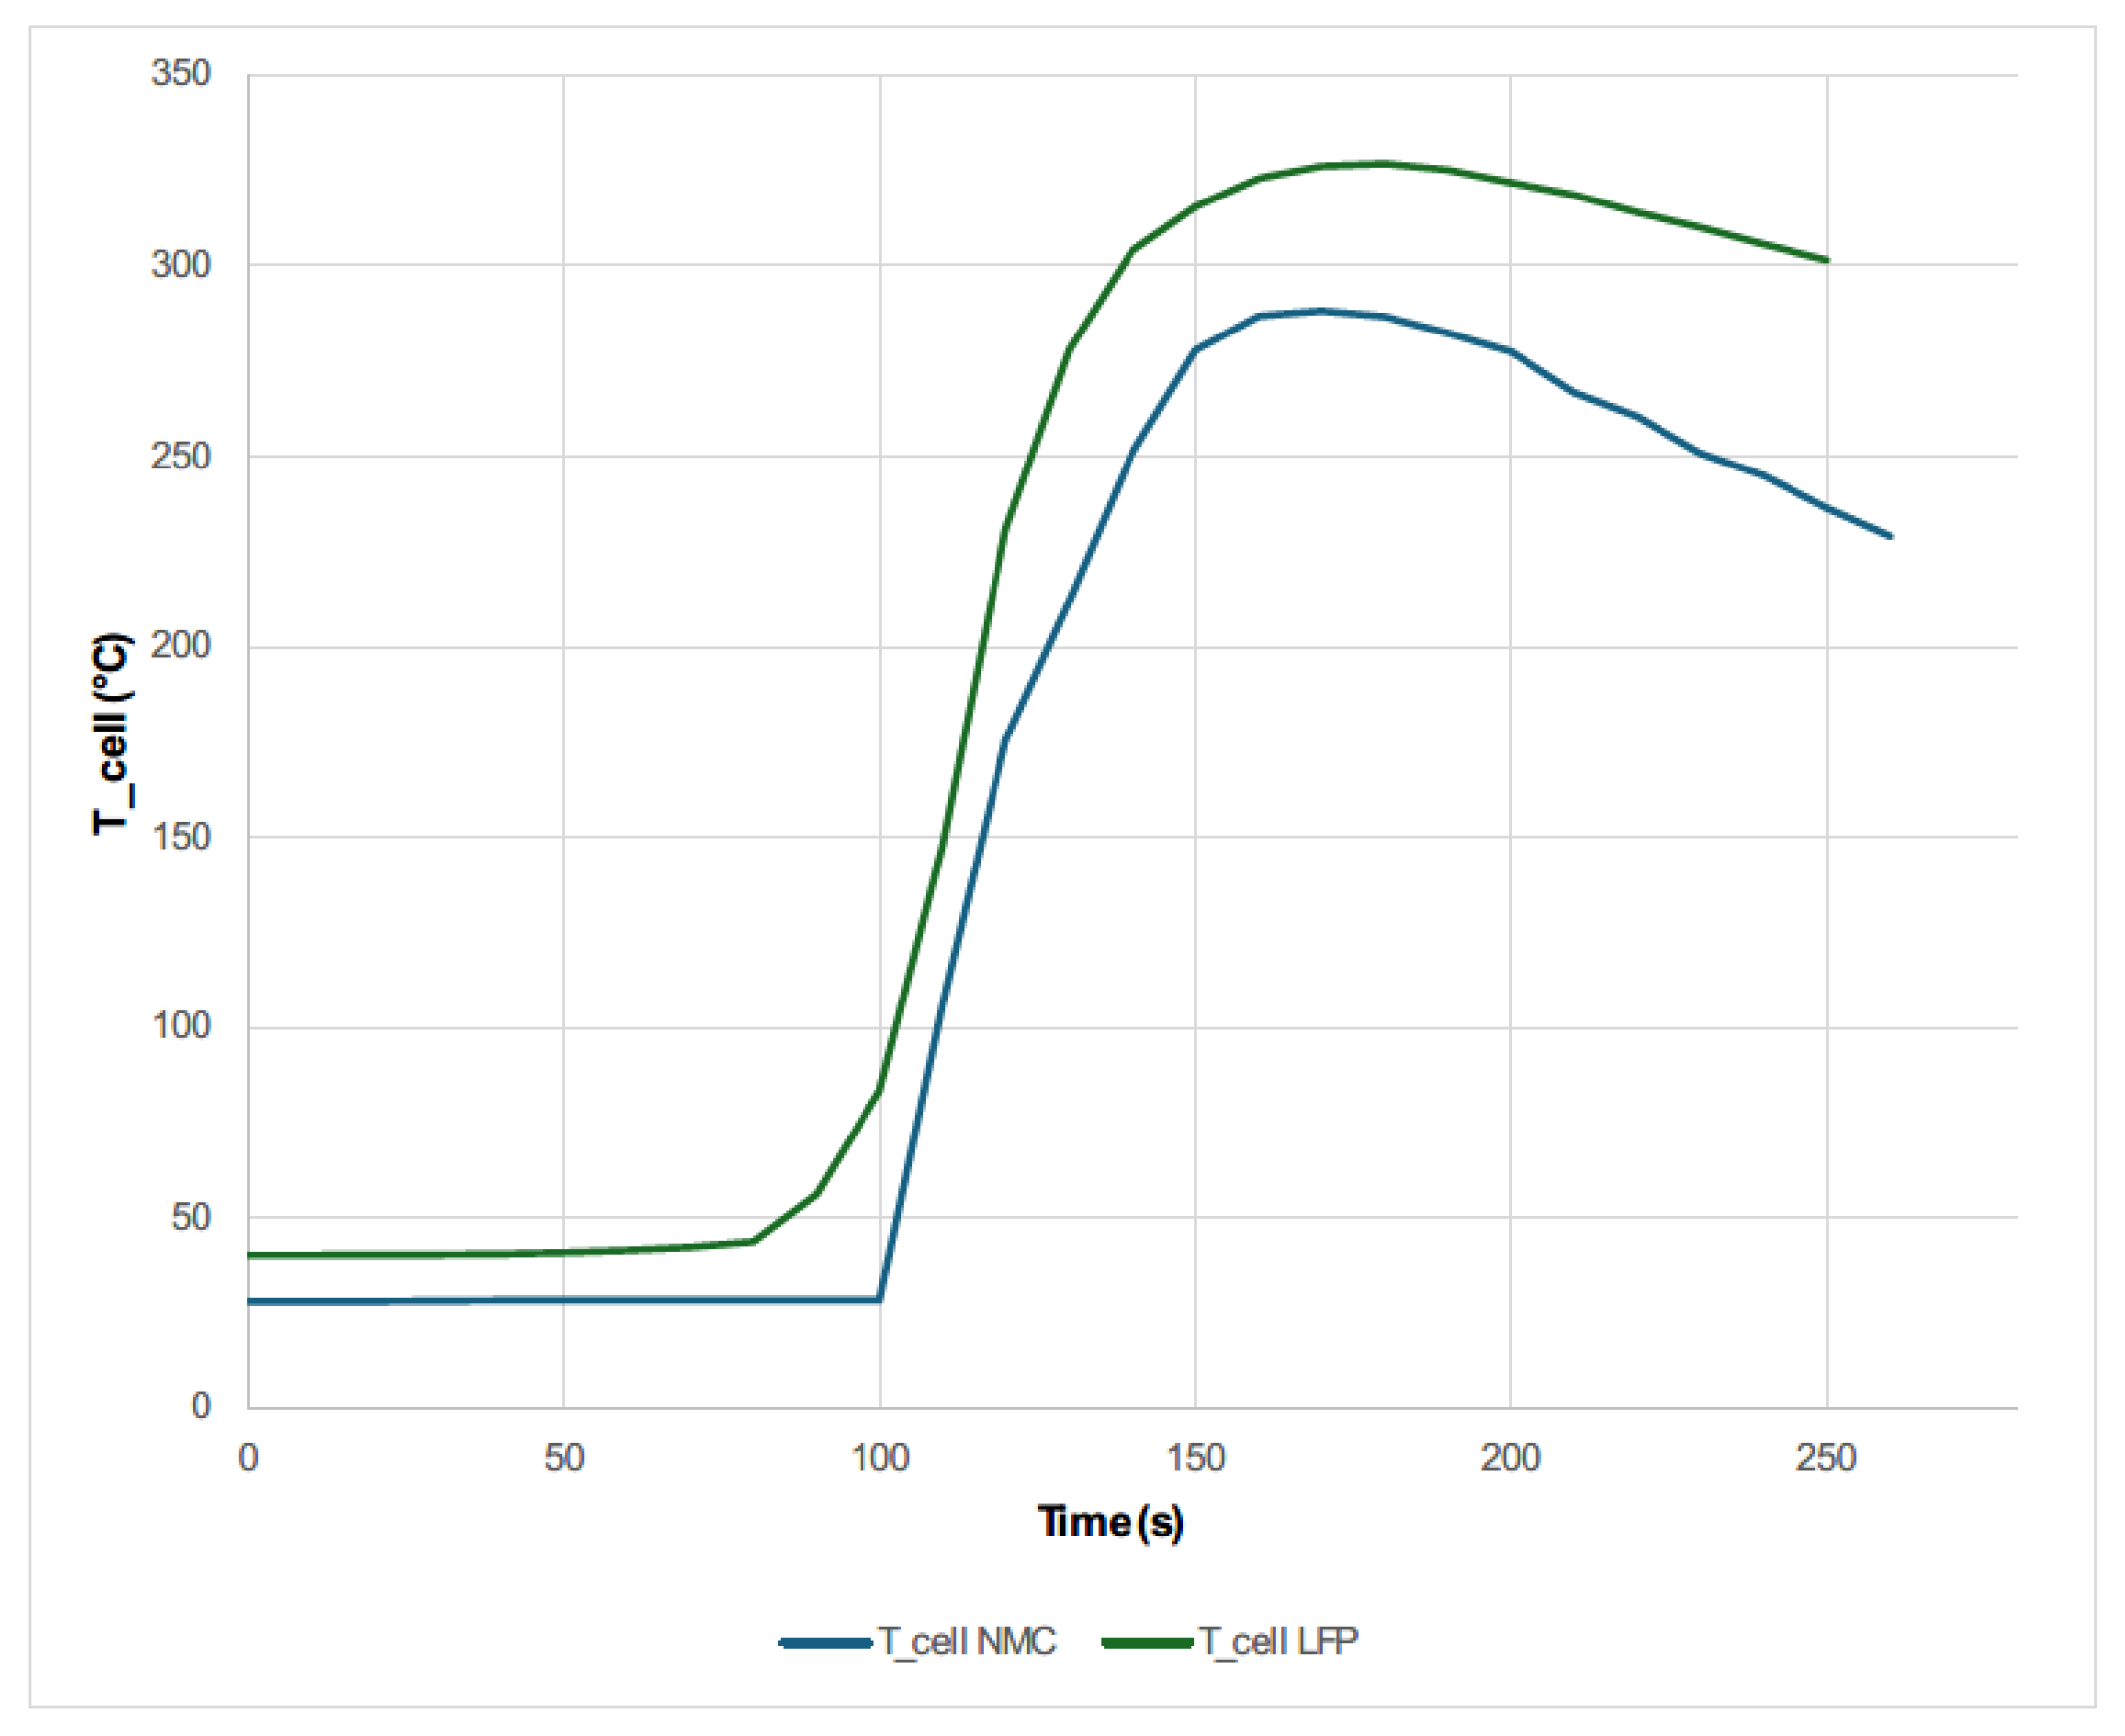
Figure 27) corresponding to the events identified as most significant during the mechanical abuse test by perforation of the NMC cell. It can be seen how the NMC cell, when subjected to mechanical abuse by perforation, catches fire, while the LFP cell subjected to the same test does not catch fire, but only gases escape from the lower part of the cell (according to the layout of the test).A graph comparing the temperature reached by the LFP cell and the NMC cell is shown in the
Figure 28.
The LFP cell reaches a higher maximum temperature, and the thermal runaway reactions start earlier than in the case of the NMC cell, but it must be taken into account that when testing at ambient temperature and not in a climatic chamber in order to reproduce real mechanical abuse conditions, the ambient temperature was lower on the day of the NMC cell test than the ambient temperature on the LFP cell test day. The difference in the behavior of the two cells under the same mechanical abuse by perforation can be explained by the fact that nickel-manganese-cobalt (NMC) and lithium-iron-phosphate (LFP) batteries differ in several important respects. While NMC batteries offer higher energy density and specific power, LFP batteries stand out for their safety, thermal stability and longer life.
LFP batteries have excellent thermal stability, which minimizes the risk of thermal runaway, a potentially catastrophic phenomenon in which the battery temperature rises rapidly, causing a fire or explosion. The chemical stability of LFP batteries contribute to their ability to withstand high temperatures without compromising safety. They are less prone to internal short circuits, which reduces the likelihood of critical failures.
To explain the differences seen in the comparison made, there is a study that analyses the TR of LFP cells of different diameters and concludes that the one with the largest diameter is the most dangerous one [
54] due to its physical behavior. The hazards of the 26650 LiFePO
4 cells are due to excessive heat due to internal short circuits above the critical temperature, which were largely attributed to the collapse of the separator integrity. Therefore, the danger of 26650 LFP cells is not due to chemical activity. As future lines of research, it is recommended the repetition of mechanical abuse tests to compare NMC cells and LFP cells of the same diameter.
The maximum temperature (Tmax) of an 18650 LFP cell is normally approximately 250°C. TR in this type of cell occurs at temperatures above 210°C. Therefore, the 18650 LFP cell is a safer battery under abuse compared to other cells [55-57].
Therefore, after comparing the NMC cell and the LFP cell subjected to the same mechanical abuse by perforation, it is concluded that the NMC cell catches fire while the LFP cell does not, however the maximum temperature reached by the LFP cell is higher than that reached by the NMC cell, this may be due on the one hand to the fact that the tests were carried out at ambient temperature and the day the LFP cell was tested the ambient temperature was higher than the day the NMC cell was tested. On the other hand, the fact that the maximum temperature reached is lower in the case of the LFP cell than in the case of the NMC cell may be since the cells tested by mechanical abuse by perforation have different diameters and there are studies [55-57] that indicate that the size of the cells influences their behavior in the event of thermal runaway. Therefore, a comparison should be made between NMC and LFP cells of the same diameter, subjected to the same perforation mechanical abuse test to analyze the temperature profile reached.
3.2. Electrical Abuse Test Results: Overcharge
The overcharge electrical abuse test was carried out on two pouch cells with a 100% State of Charge (SoC) at different initial ambient temperatures. These tests are carried out to evaluate the effects of overcharge on cells under different operating conditions without exceeding the maximum temperature indicated by the manufacturer. The specifications of the overcharge tests carried out are shown below (
Table 8).
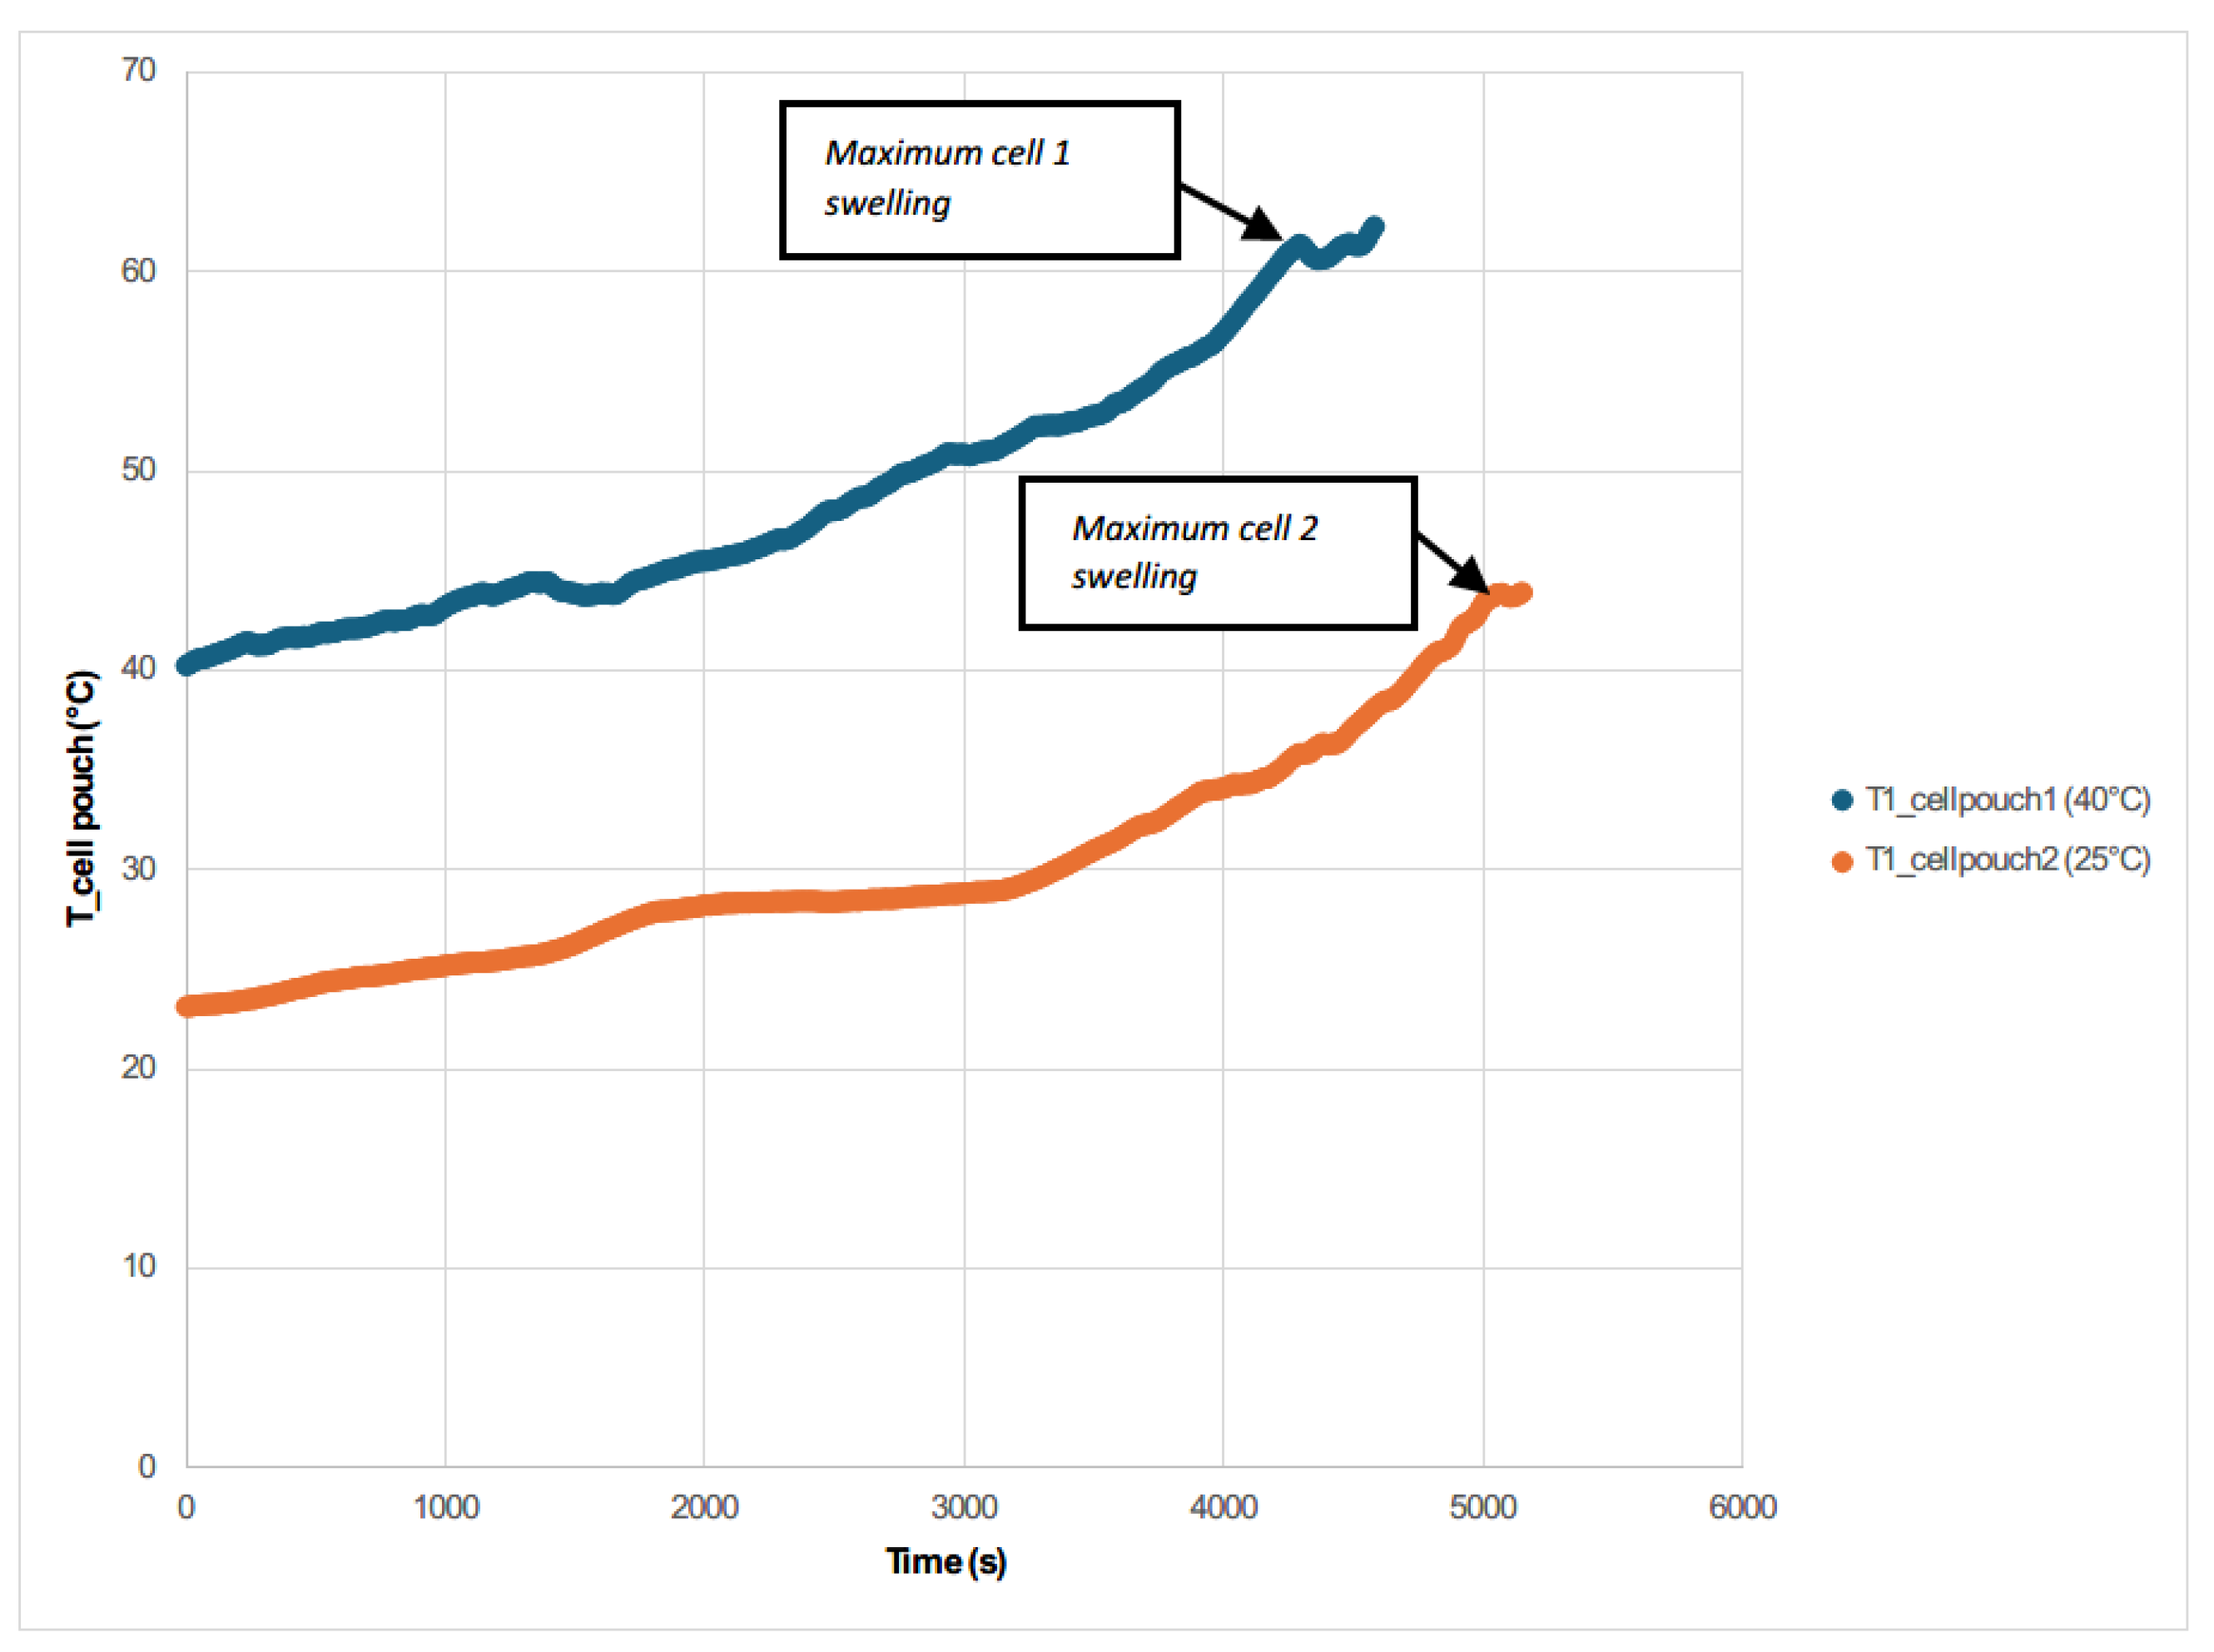
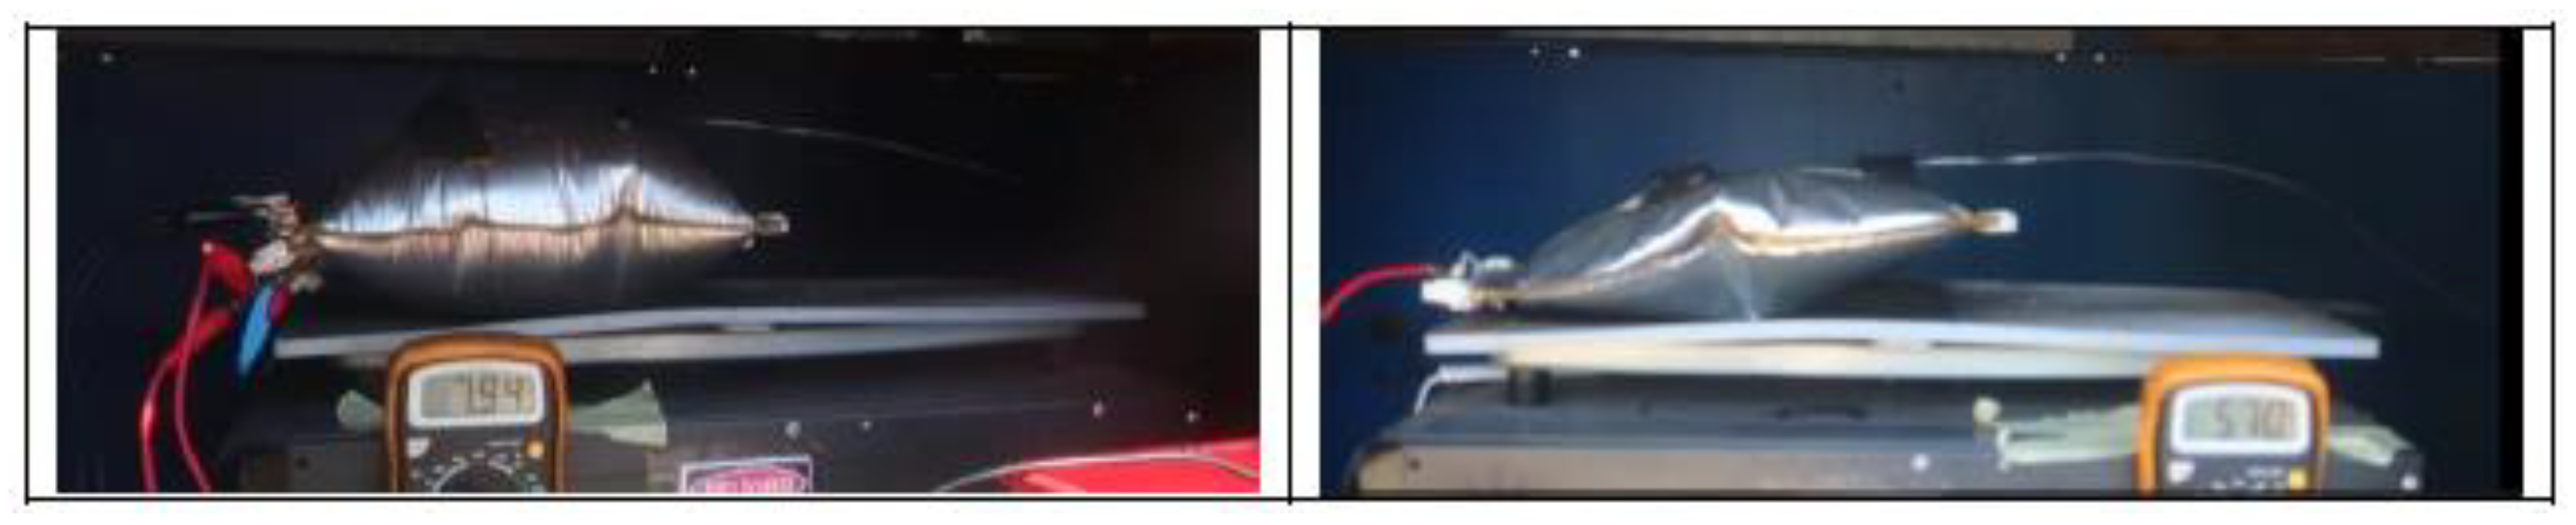
The following figure shows the temperature measured during the overcharge tests, for the two cells tested, after exceeding the nominal voltage of 4.2 V and reaching 7.94 V in the case of the first cell tested and 5.94 V in the case of the second cell tested. A rapid increase in cell temperature is observed (
Figure 29), corresponding to cell swelling and the formation of gases inside the cells.
It can be deduced and verified that overcharging a battery results in an increase in the temperature of the battery, its swelling due to the vaporization of the electrolyte or even the loss of containment and the release of gases to the outside, as has been shown in other studies [
58]. In the case of the pouch 1 cell tested at an elevated ambient temperature of approximately 40 °C, when significant swelling is reached and the power supply is turned off for safety, the voltage starts to drop, the swelling also drops and after a few moments a venting of gases takes place. If the battery does not have a disconnecting circuit, interrupting the current when it experiences a temperature above a set threshold (usually 90 °C), if no safety venting system is provided, there is a possibility of battery fire or even explosion exists [
59,
60].
It is observed that during the tests, none of the cells overheat above 60 °C, so that the cells are kept below the accepted values (80-90 °C) as the temperatures at which the first uncontrolled temperatures above which the first uncontrolled thermal runaway reactions occur [
61]. However, gases are produced under these mildly abusive conditions, only once they are the cut-off voltage, in this case 4.2 V, is reached.
It is concluded that if the ambient temperature is higher, the effects on the overcharged cell are more dangerous, as the cell temperature is higher. On the other hand, the temperature of the cell is seen to be increasing from the beginning of the test as the test is reproducing a load under normal conditions, uncontrolled ambient temperature conditions, i.e., the tests are not performed in a climatic chamber where the ambient temperature is controlled. In ambient temperature controlled tests, the temperature of the cell is not raised until the internal short-circuit occurs due to a fault. The tests are performed in this way because temperature-controlled tests have already been carried out, but never tests that reproduce the actual conditions under which a load is carried out.
After analyzing the two tests, it is concluded that when the maximum voltage is reached due to the overcharge is when the maximum temperature is reached and when the maximum swelling of the two cells is reached. Only in the case of the cell tested by overcharge at an ambient temperature of 40 °C does gas venting occur, while in the case of the cell tested at a lower ambient temperature (25 °C) no gas venting occurs. It is also concluded that once the overcharge is over (the power supply is switched off) the reactions inside the cell continue to take place, causing the cells to swell again because gases are produced in the reactions that take place.
The following
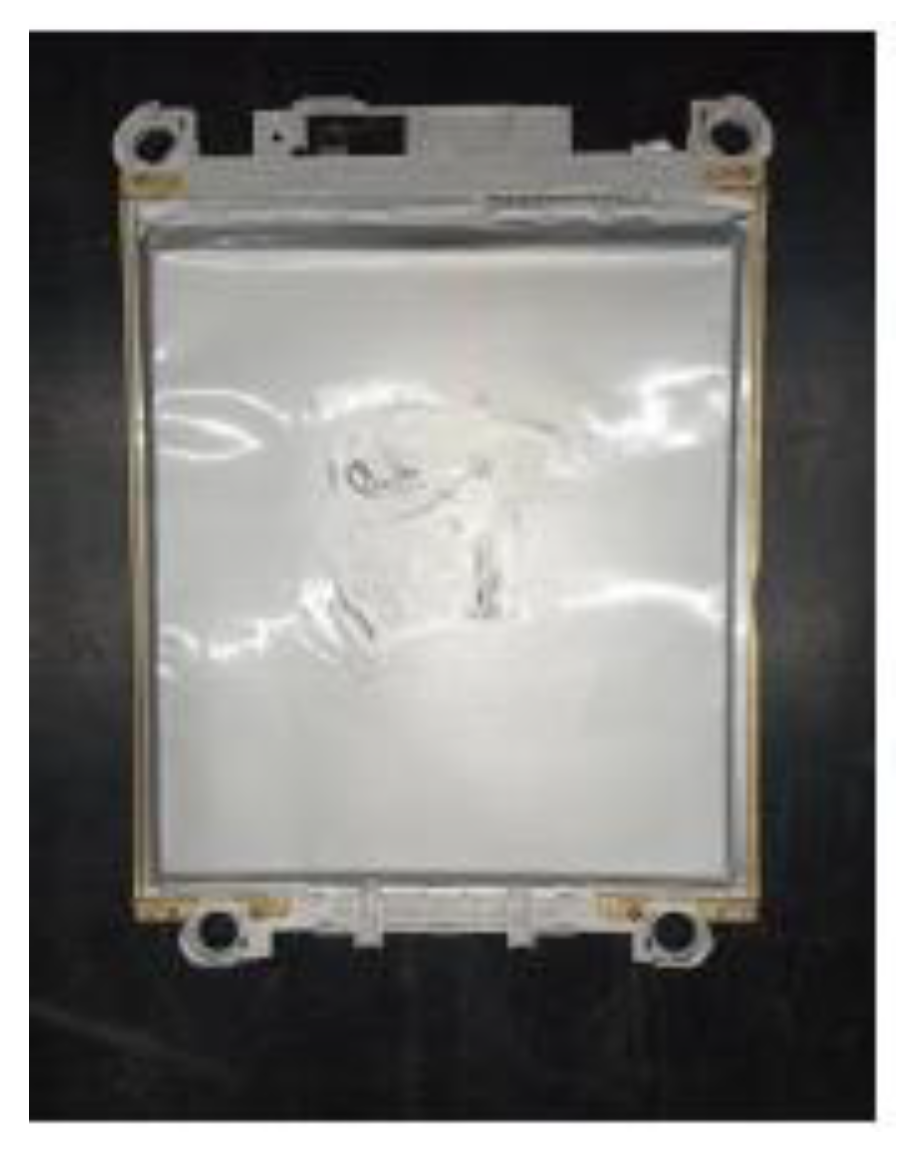
Figure 30 shows a reference cell in its original state before testing.
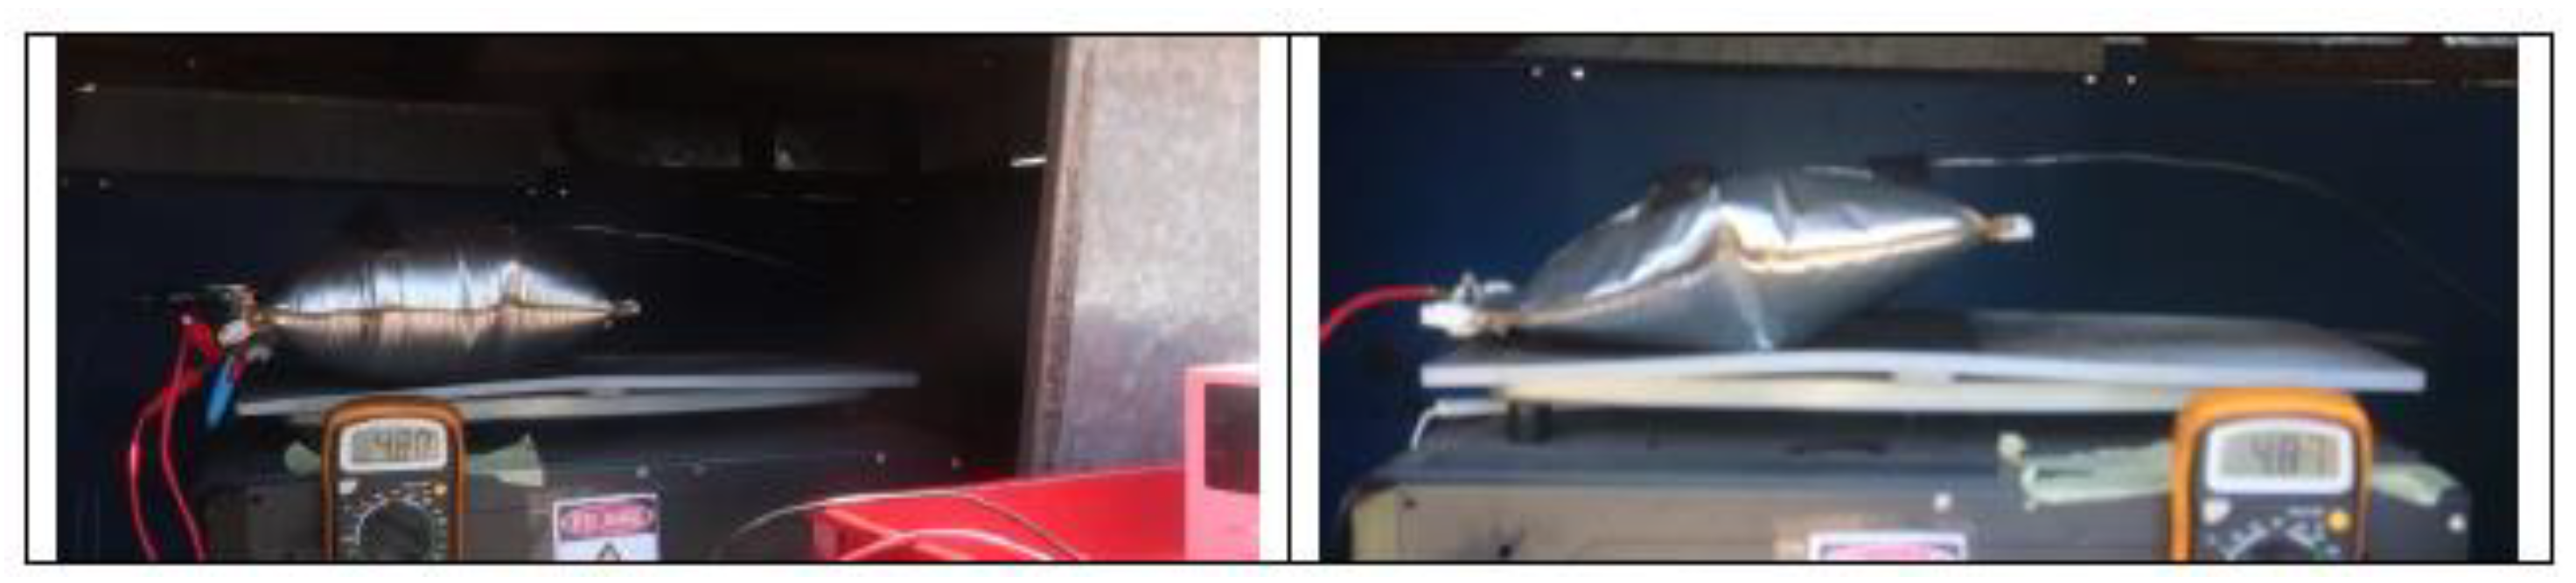
A comparison of the state of the tested pouch cells at different times of maximum swelling during the test is shown below (
Figure 31).
Both
Figure 31 and
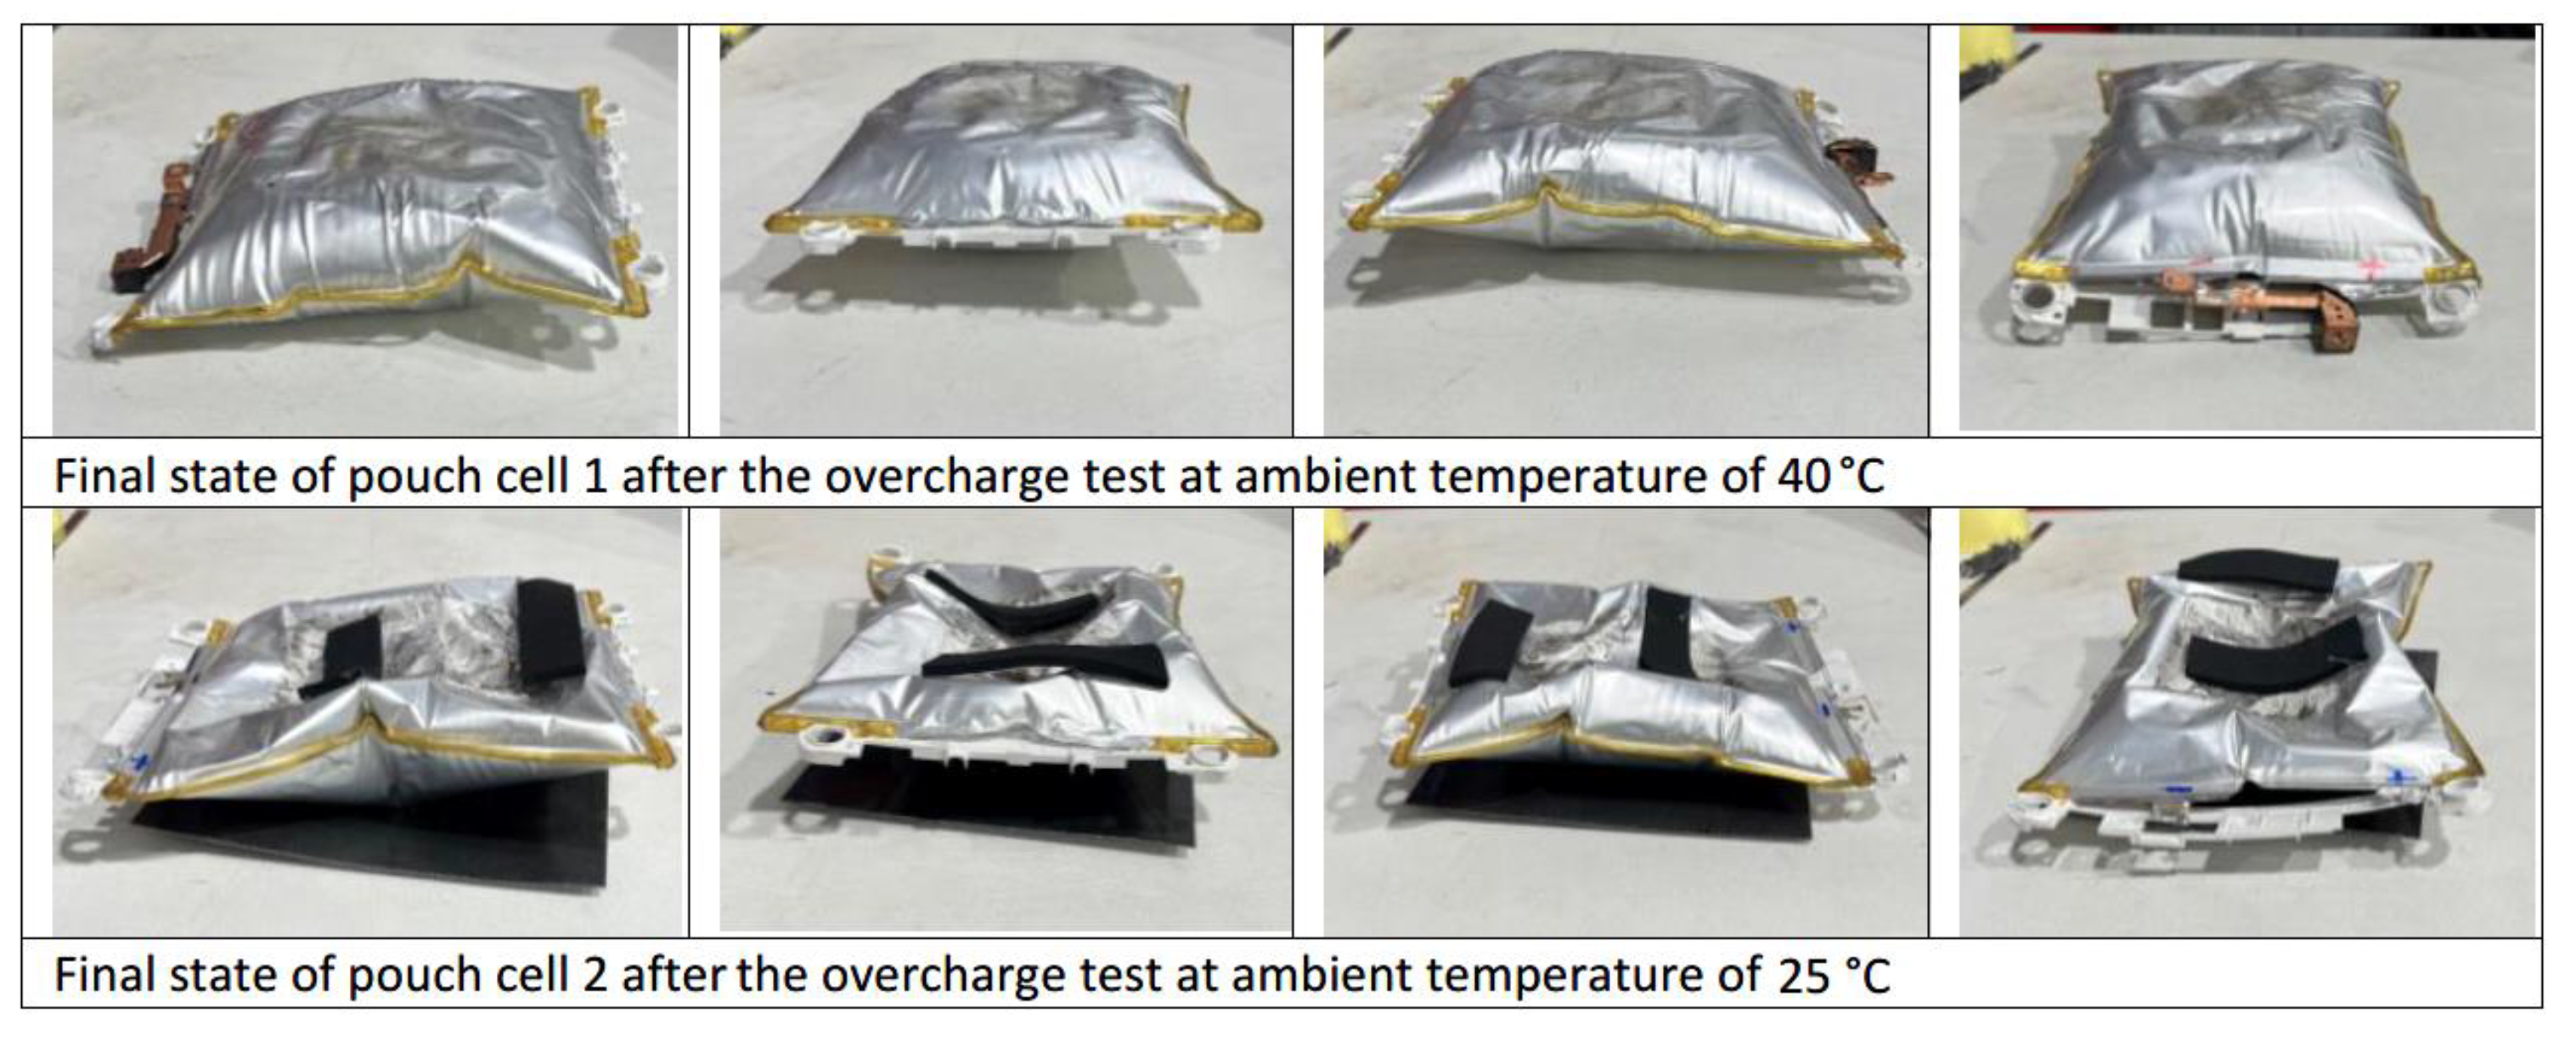
Figure 32 show that pouch cell 1 tested by overcharging at an ambient temperature of 40 °C is more swollen than pouch cell 2 tested by overcharging at an ambient temperature of 25 °C. In addition, the maximum voltage reached is higher in the case of pouch cell 1 before removing the power supply, despite using the same power supply in both tests. Images of the state of the tested pouch cells one day after the test are shown below (
Figure 33).
The state of the tested cells is analyzed the day after the test (
Figure 33) to study the evolution of their state. It is concluded that once the tested cell is stable, the swelling of the pouch cell tested by overcharging at a higher temperature is greater than in the case of the pouch cell tested at a lower temperature.
Whether the cells are swollen is due to the amount of gas produced, and this amount of gas is directly related to the capacity, energy density and SoC of the cell. Furthermore, increasing these parameters leads to more severe TR [
62,
63]. Also, the charging rate influences the magnitude of gas formation: the cell can explode at high current, while it only swells at low current [
64].
With respect to literature data, we observed lower carbon dioxide concentrations, in favor of higher hydrogen concentrations, especially in the case of the overcharged cell at room temperature (14% and 69% for CO
2 and H
2, respectively). On the contrary, the results obtained for the cell supercharged at 50 °C (33% and 35% for CO
2 and H
2, respectively) [
65] seem to be more in agreement with the values presented in previous works [66-69].
The internal resistance of the tested pouch cells, before the test and after the test, is shown below (
Table 9) to analyze the increase in cell resistance as a function of the temperature at which the test was carried out.
As can be seen in
Table 9, the difference in DCIR between the measurements at the beginning of the tests and at the end of the tests shows that the cell with the highest ΔDCIR is the cell subjected to the overcharge test at the highest ambient temperature, which coincides with the cell that has swollen the most.
Therefore, it can be concluded that the environmental conditions in which a cell operates can affect the severity of a failure.
For safety reasons, batteries and therefore lithium-ion cells should not be charged near flammable materials or objects. They should also not be charged in places where the temperature is high or where they are exposed to direct sunlight. On the other hand, it must be considered that during the charging of the cells heat is generated, for this reason the cells must not be covered during charging.
The battery charging process is important, the choice of battery type involves suitable operating conditions, as well as vibrations, ensuring tightness through the design of a battery casing and a suitable working temperature range by applying a suitable cooling system. In addition to the climatic conditions, it is necessary that the charging and discharging parameters are adequate and compatible with the requirements set by the manufacturers. The BMS supervises the loading and unloading process, operating in conjunction with the on-board and off-board charger, but on occasion there may be a malfunction of the charger or the BMS, or a failure by design. It should also be noted that when the vehicle is running with a charged battery, and regenerative braking is used, it could damage the battery by overcharging by supplying a high current to an already charged battery.
It is therefore concluded that the charging process of an electric vehicle battery is an important aspect to consider. The choice of one type of battery or another is based on the battery having the right operating conditions, requiring among other things the right charging, and discharging parameters, which is taken care of by the BMS, but failures can occur that lead to overcharging.
These tests conclude that overcharging an electric vehicle with a pouch cell battery pack (tested cells) at elevated temperatures, for example on a summer day at midday, is critical and dangerous.
The same overcharge tests should be repeated at different ambient temperatures, with different cell types and with different SoCs.
3.3. Thermal Abuse Test Result: Heating
In the thermal abuse by heating, using thermocouples, a thermographic camera and voltmeters, the time and temperature at which the main events occur during this type of abuse on the cells tested were determined. According to studies carried out [
70] with 18650 Lithium-ion cells, the following phases have been identified:
Initiation of TR with smoke production without flame.
Venting and ignition of the released gases, a flame is visible during this phase.
Catastrophic failure of the cell with the presence of flame.
The results of the various thermal abuse tests carried out on different cell arrangements in terms of position (vertical or horizontal) and connection (series or parallel connection), and on different states of charge are shown below.
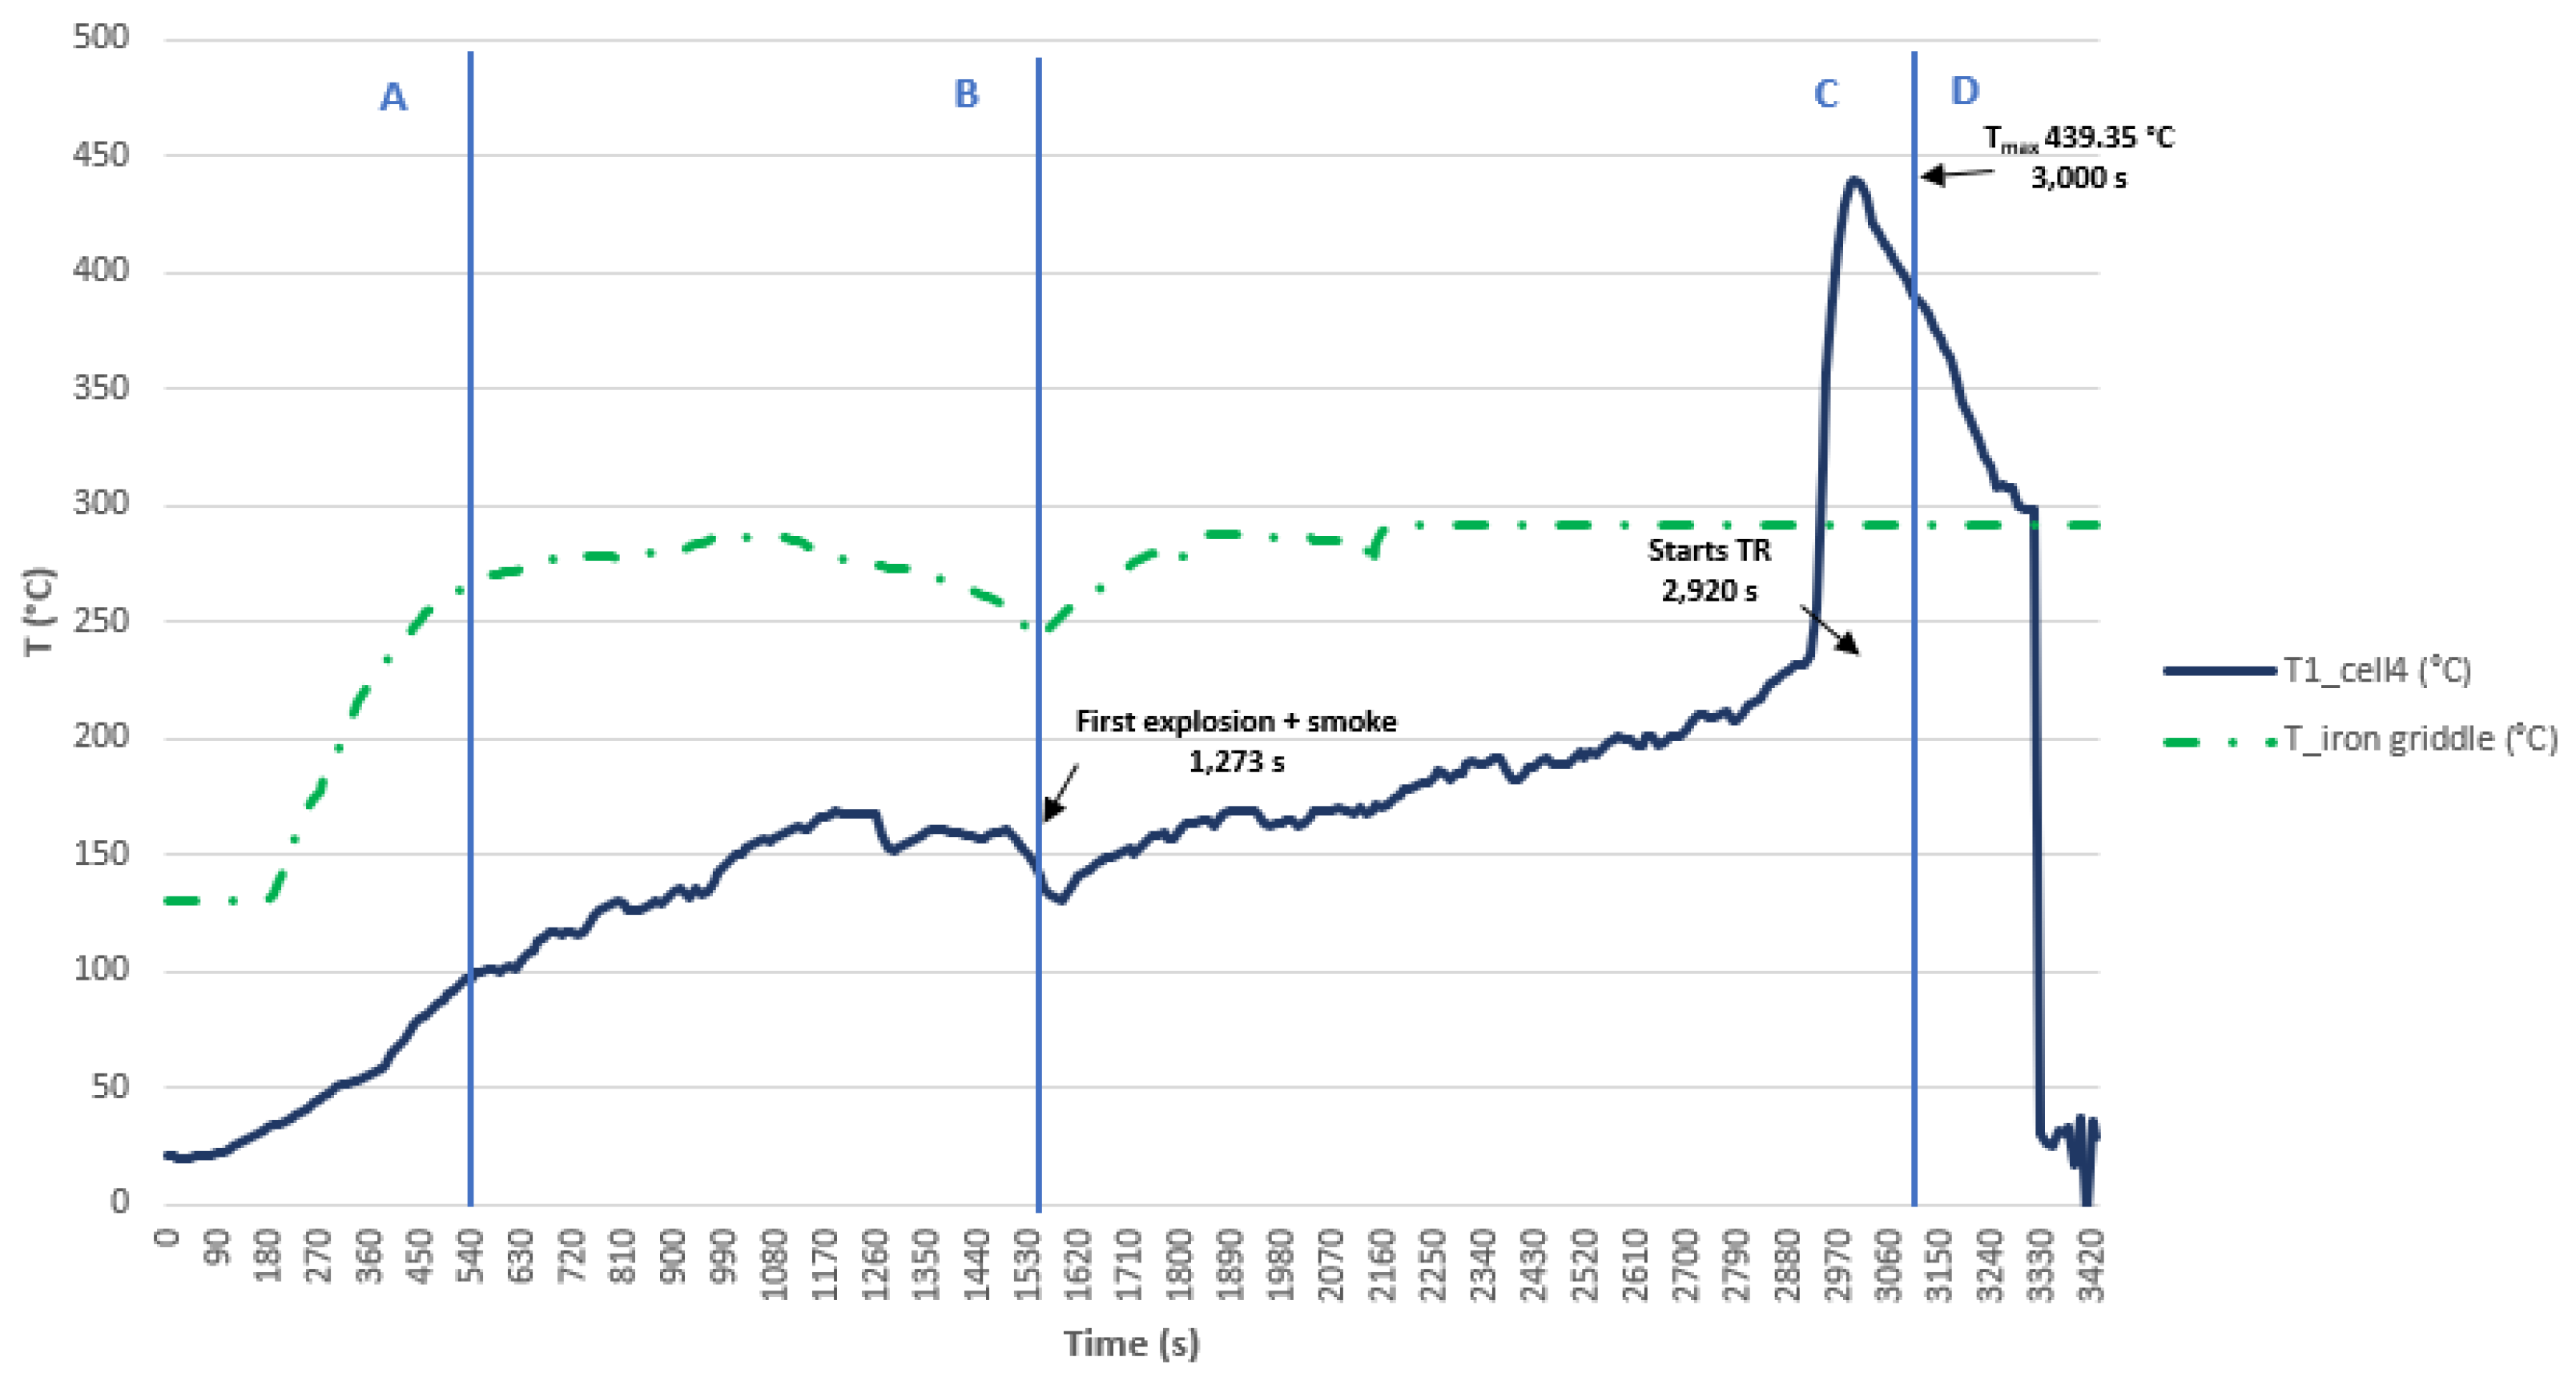
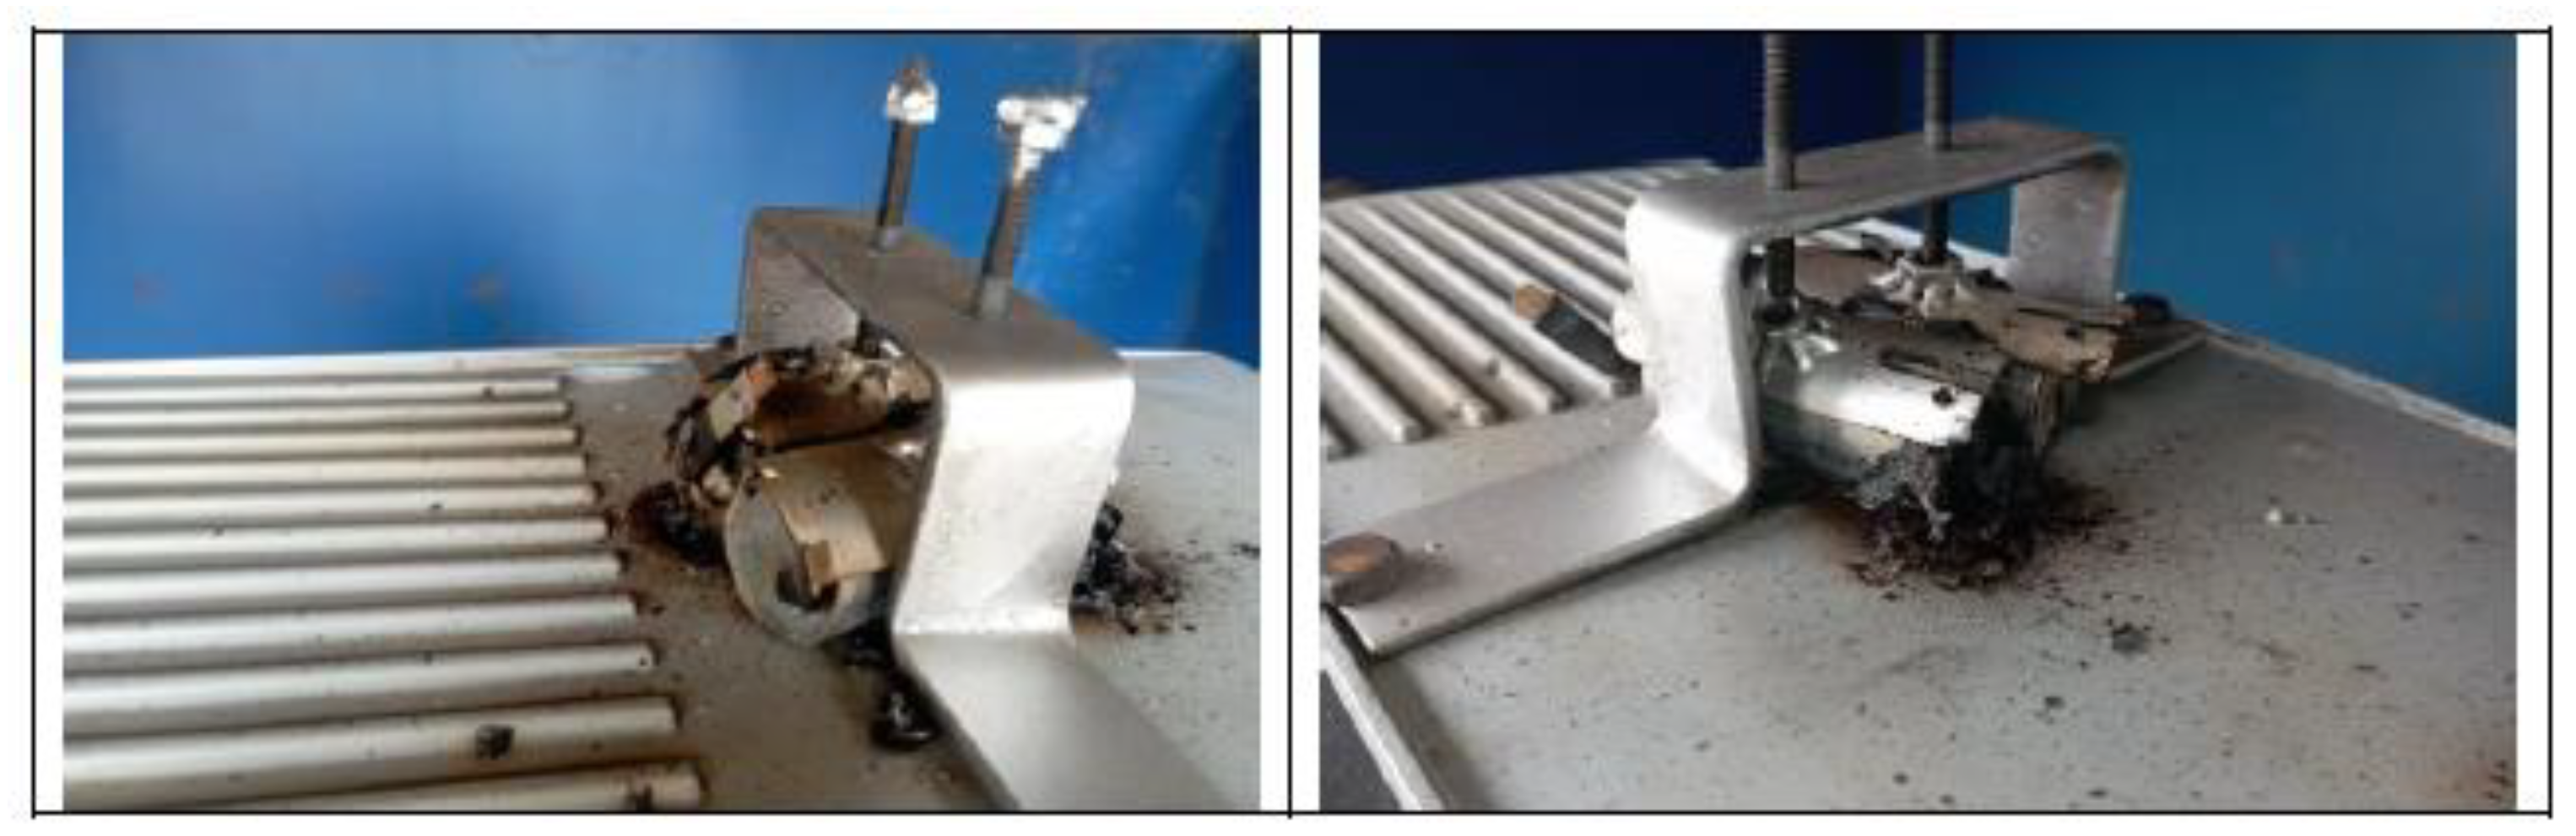
3.3.1. Test 1: Vertical, Series Connection and SoC 100% (Cell 4 Bellow and Cell 3 Above)
The test is carried out on two 32700 cylindrical cells in vertical arrangement connected in series, each having a SoC of 100%. The type K thermocouple is placed on cell 4 to measure the temperature reached during the test. The following images (
Figure 34) show the state of the cells after the heating test.
A graph showing the temperature reached by the electric griddle and the temperature reached by cell 4 during the test can be seen below, and the different phases through which the cell passes during the test are identified on the graphs (
Figure 35). In this test it takes a long time to reach the TR, because the area where the test was carried out in this case was not completely sheltered from the wind and on the day of the test there was a lot of wind, which meant that the plate did not raise the temperature quickly. Therefore, from this test we can keep the value of the maximum temperature reached (439.35 °C) during the Thermal Runaway process but not the time in which the maximum temperature is reached.
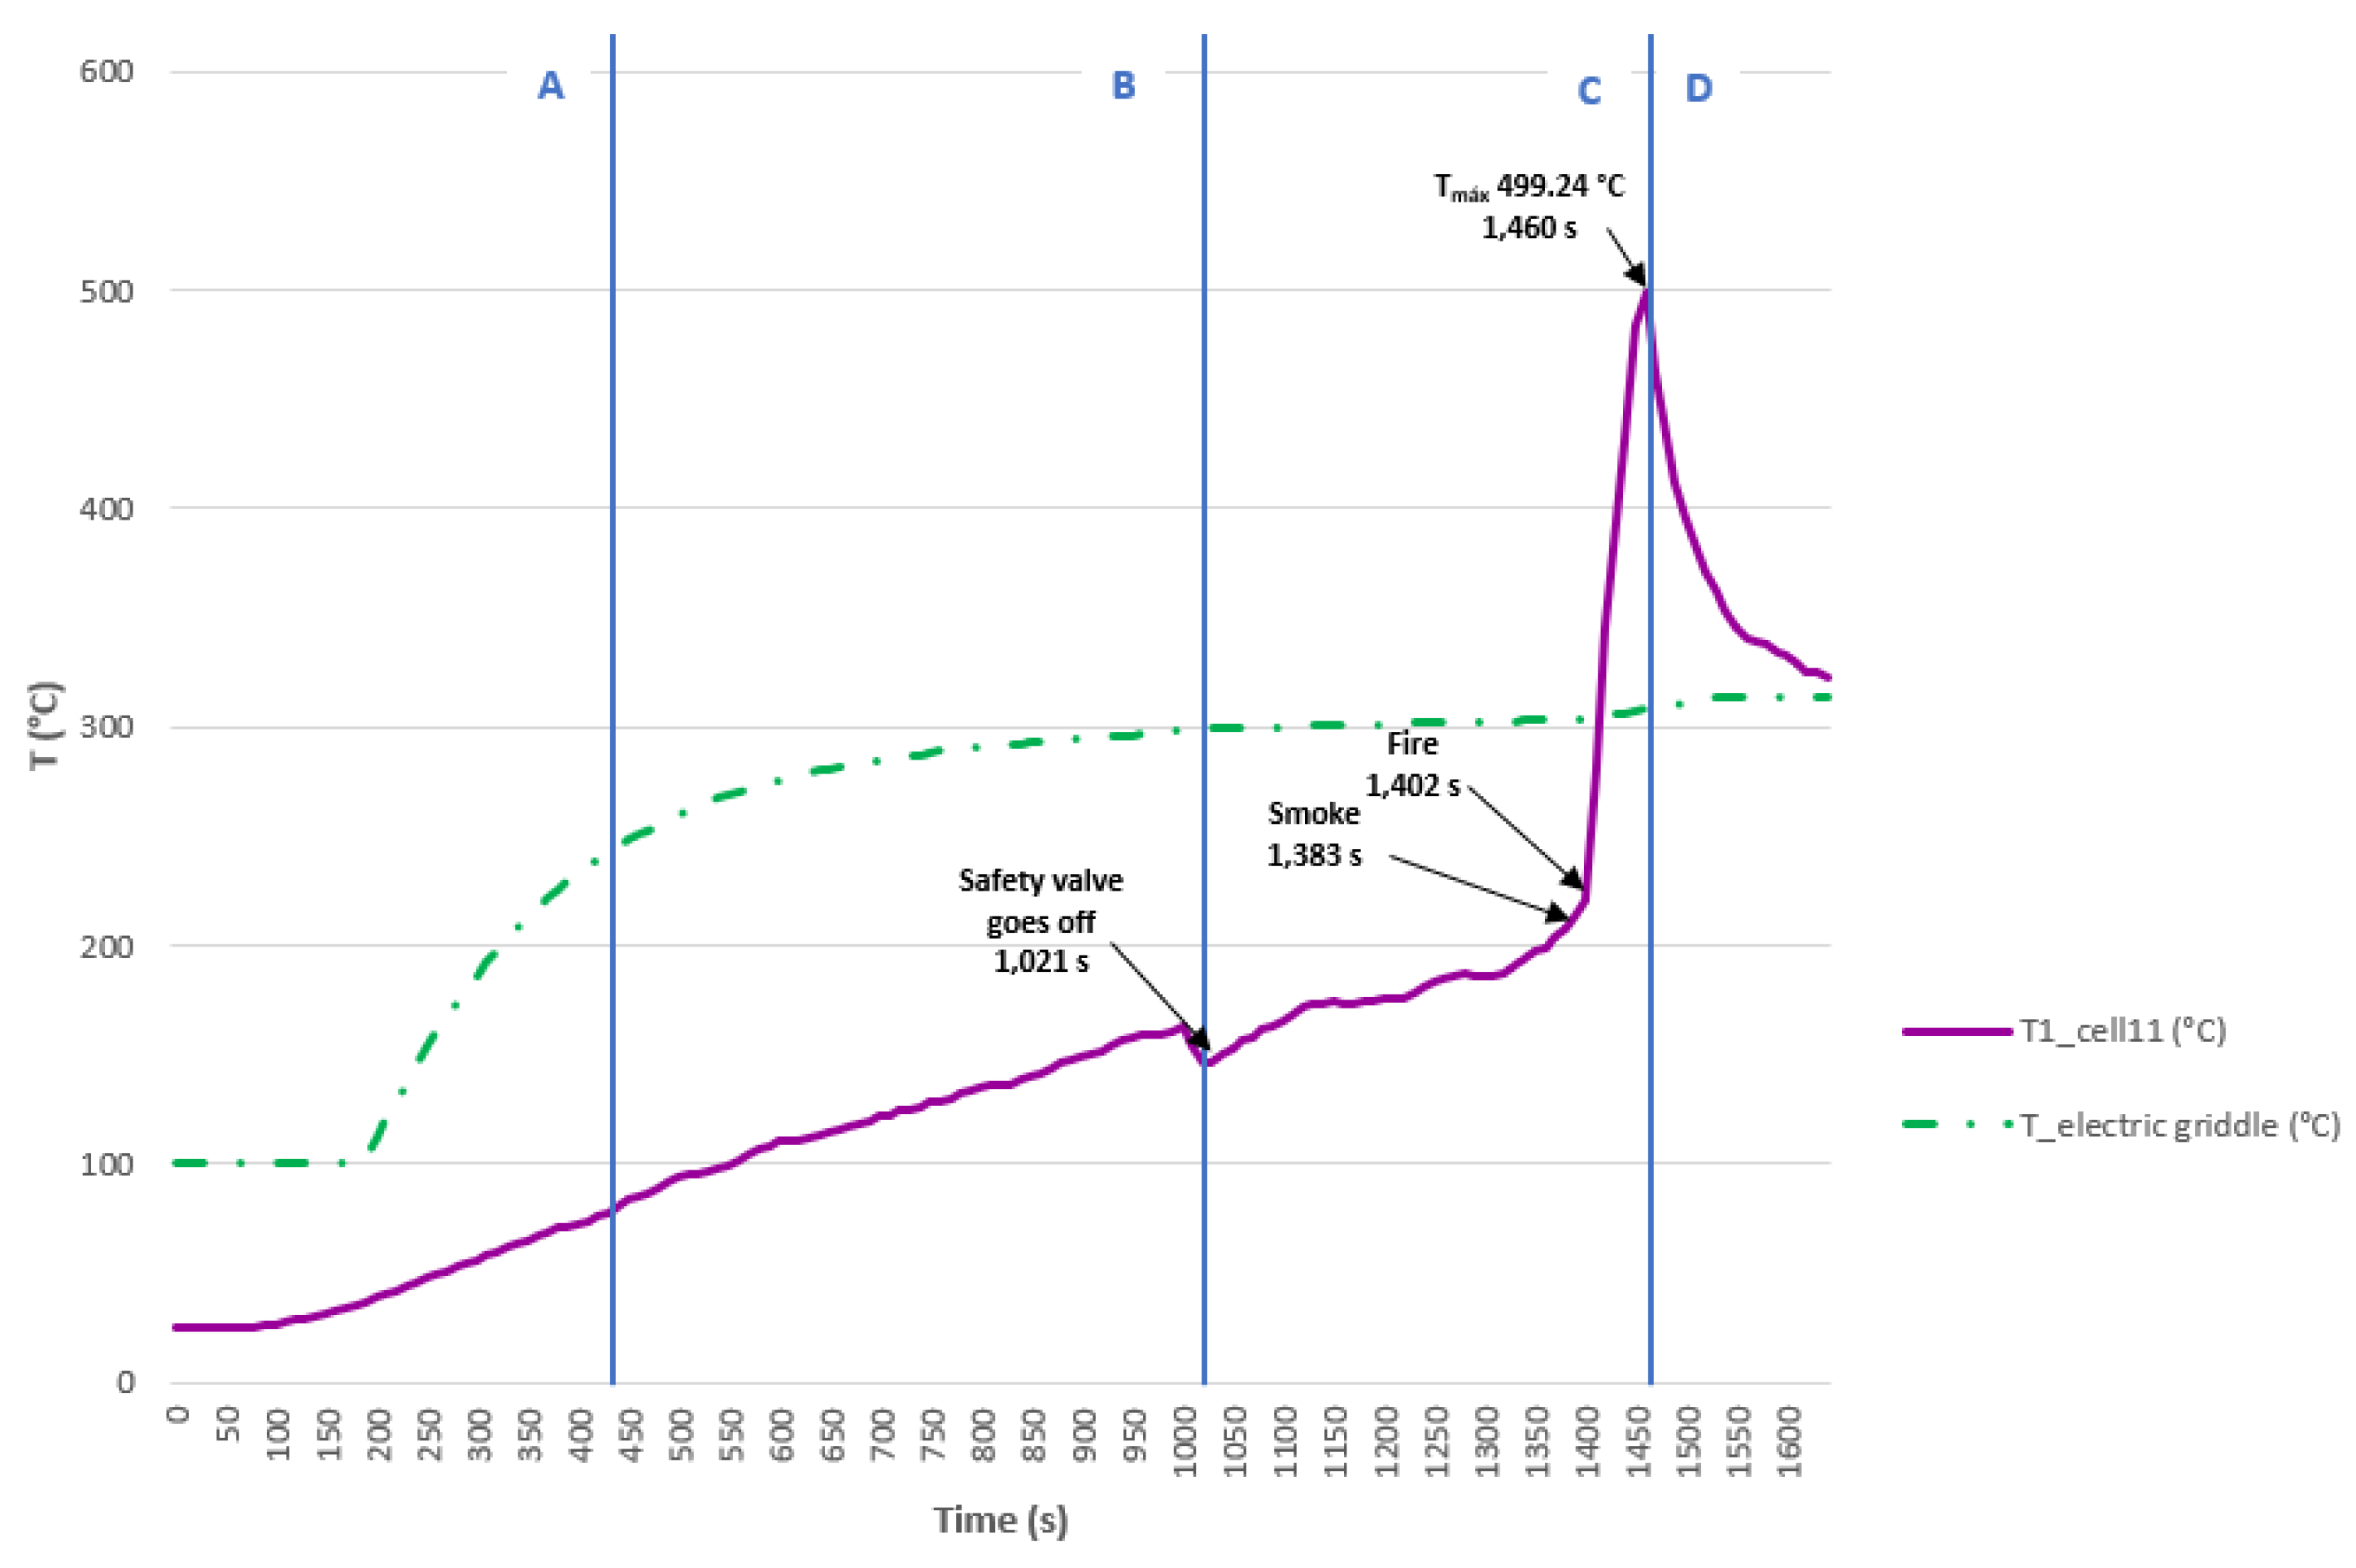
The regions indicate the following: (A) cell surface temperature below 90 °C, only due to induction heating of the griddle (B) cell temperature >90 °C, heating plus heating contribution due to internal cell reactions, (C) TR and (D) cooling.
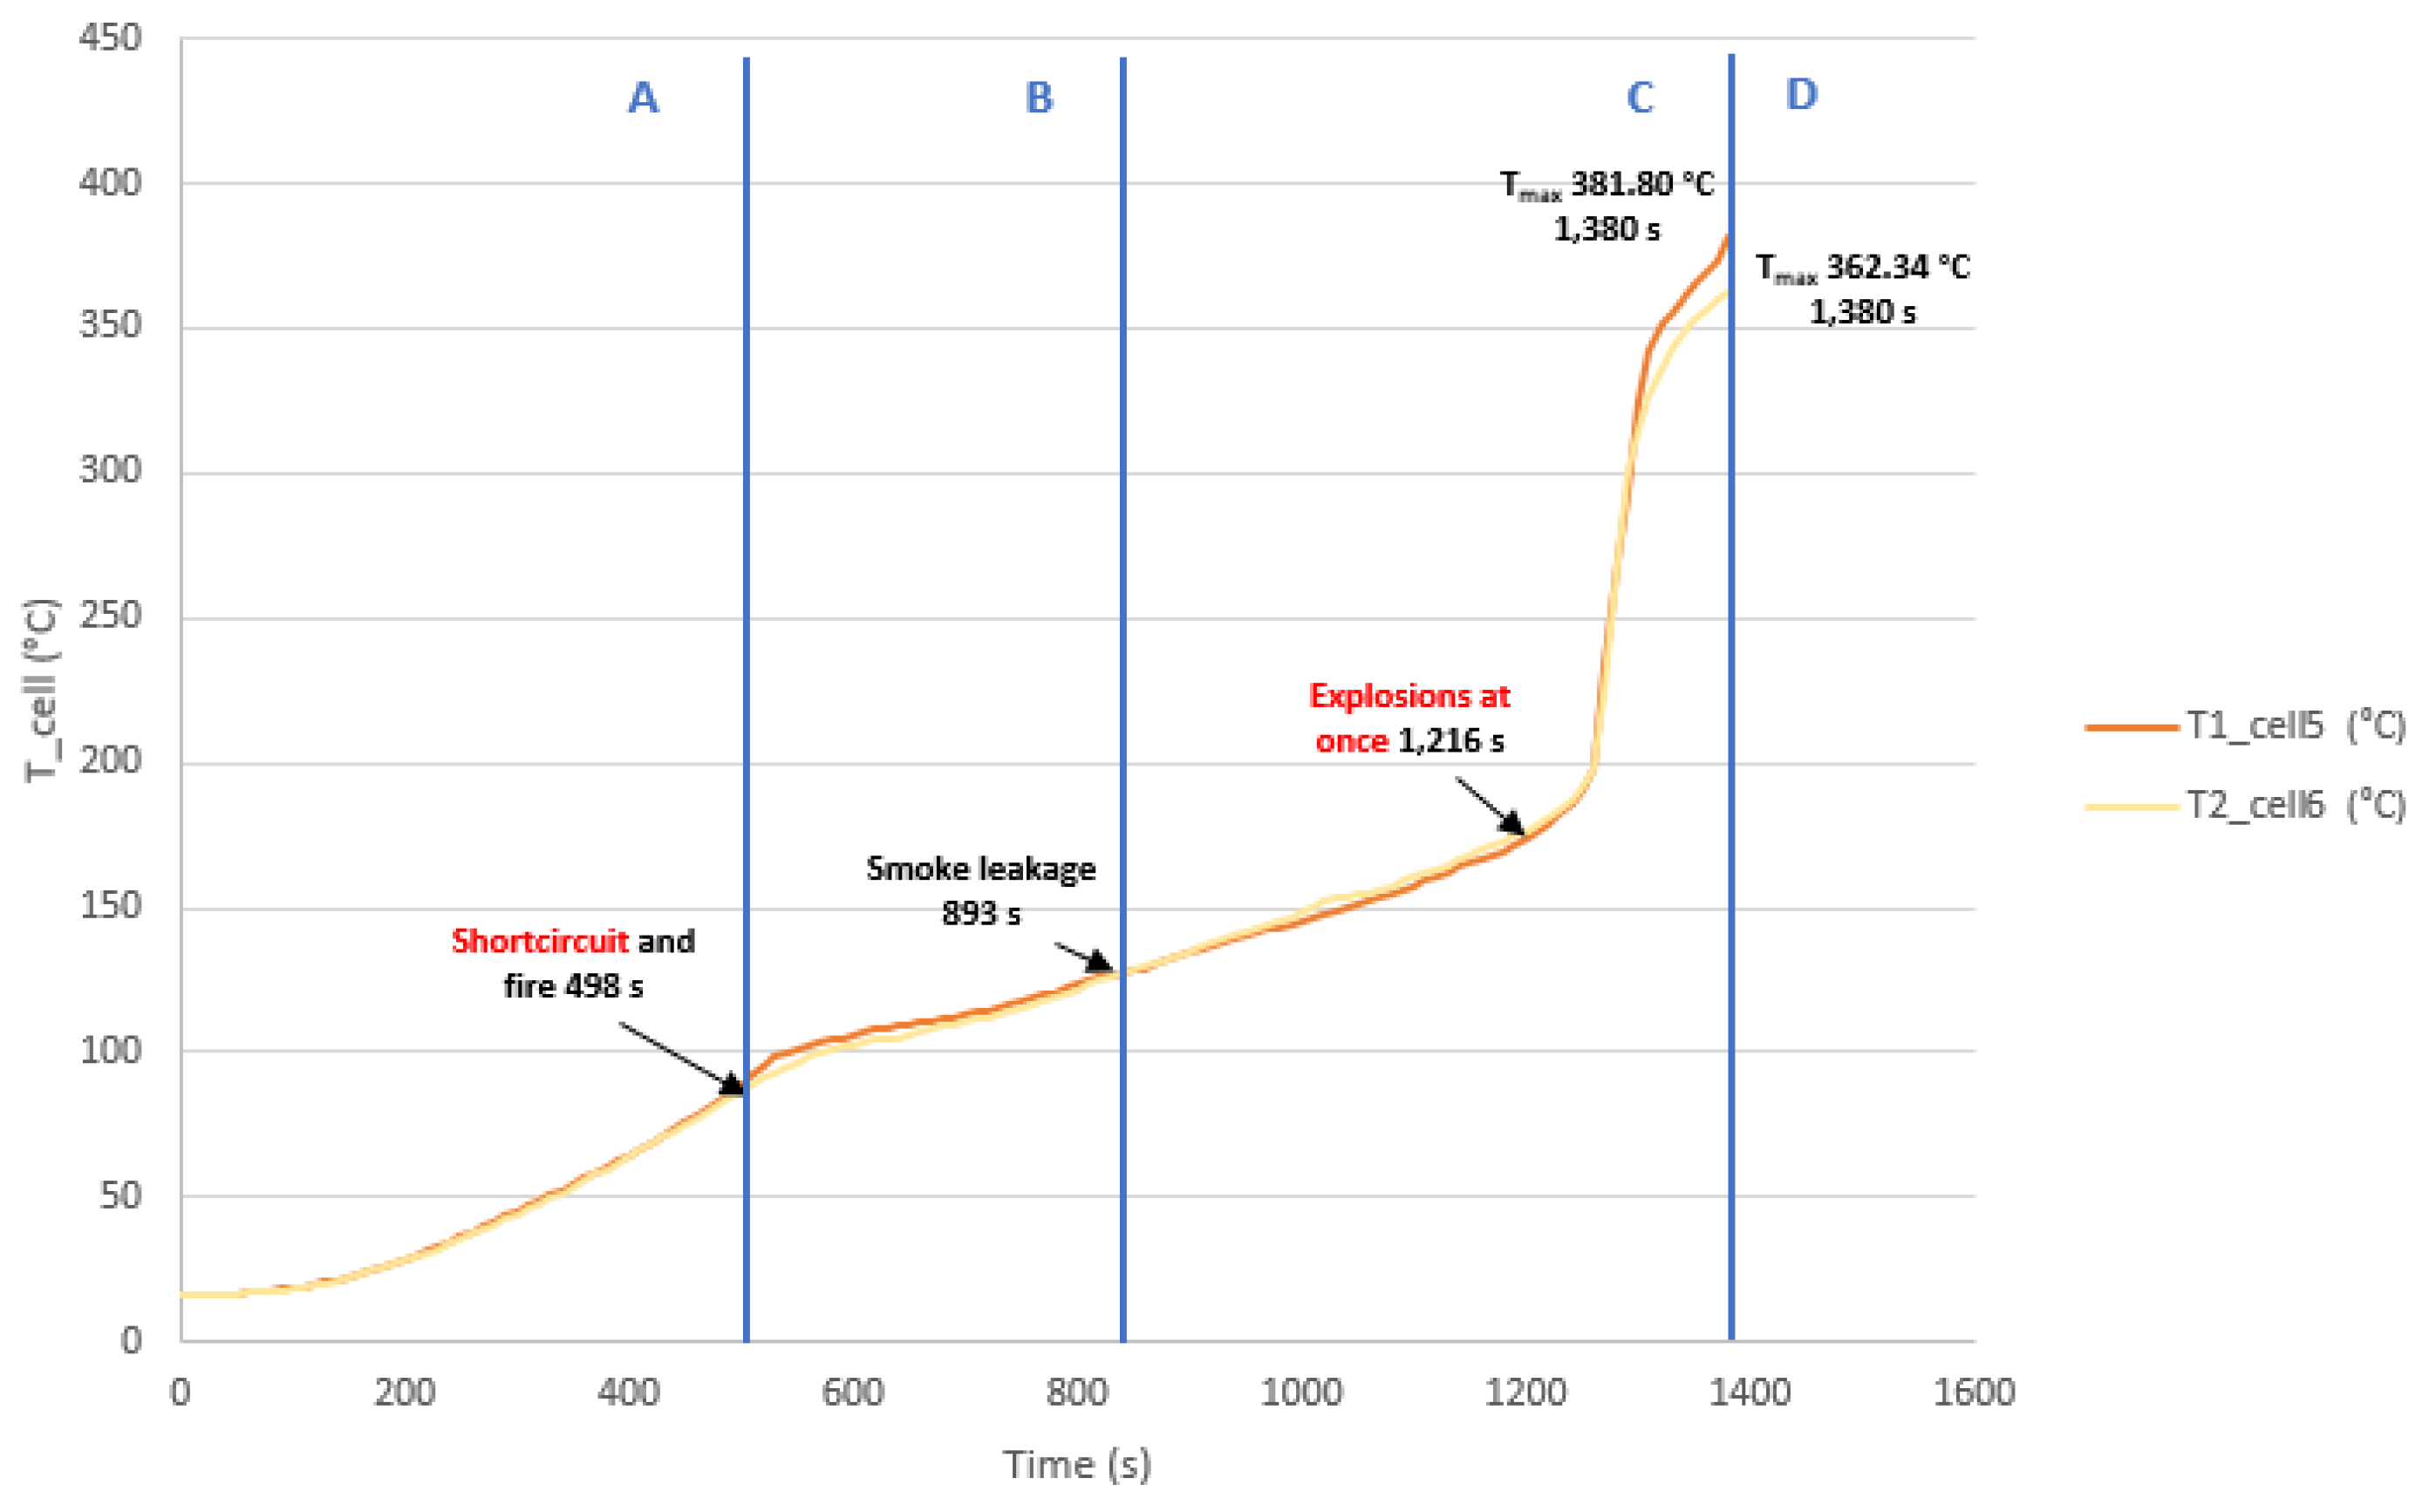
3.3.2. Test 2: Horizontal, Series Connection and SoC 100% (Cell 5 and Cell 6)
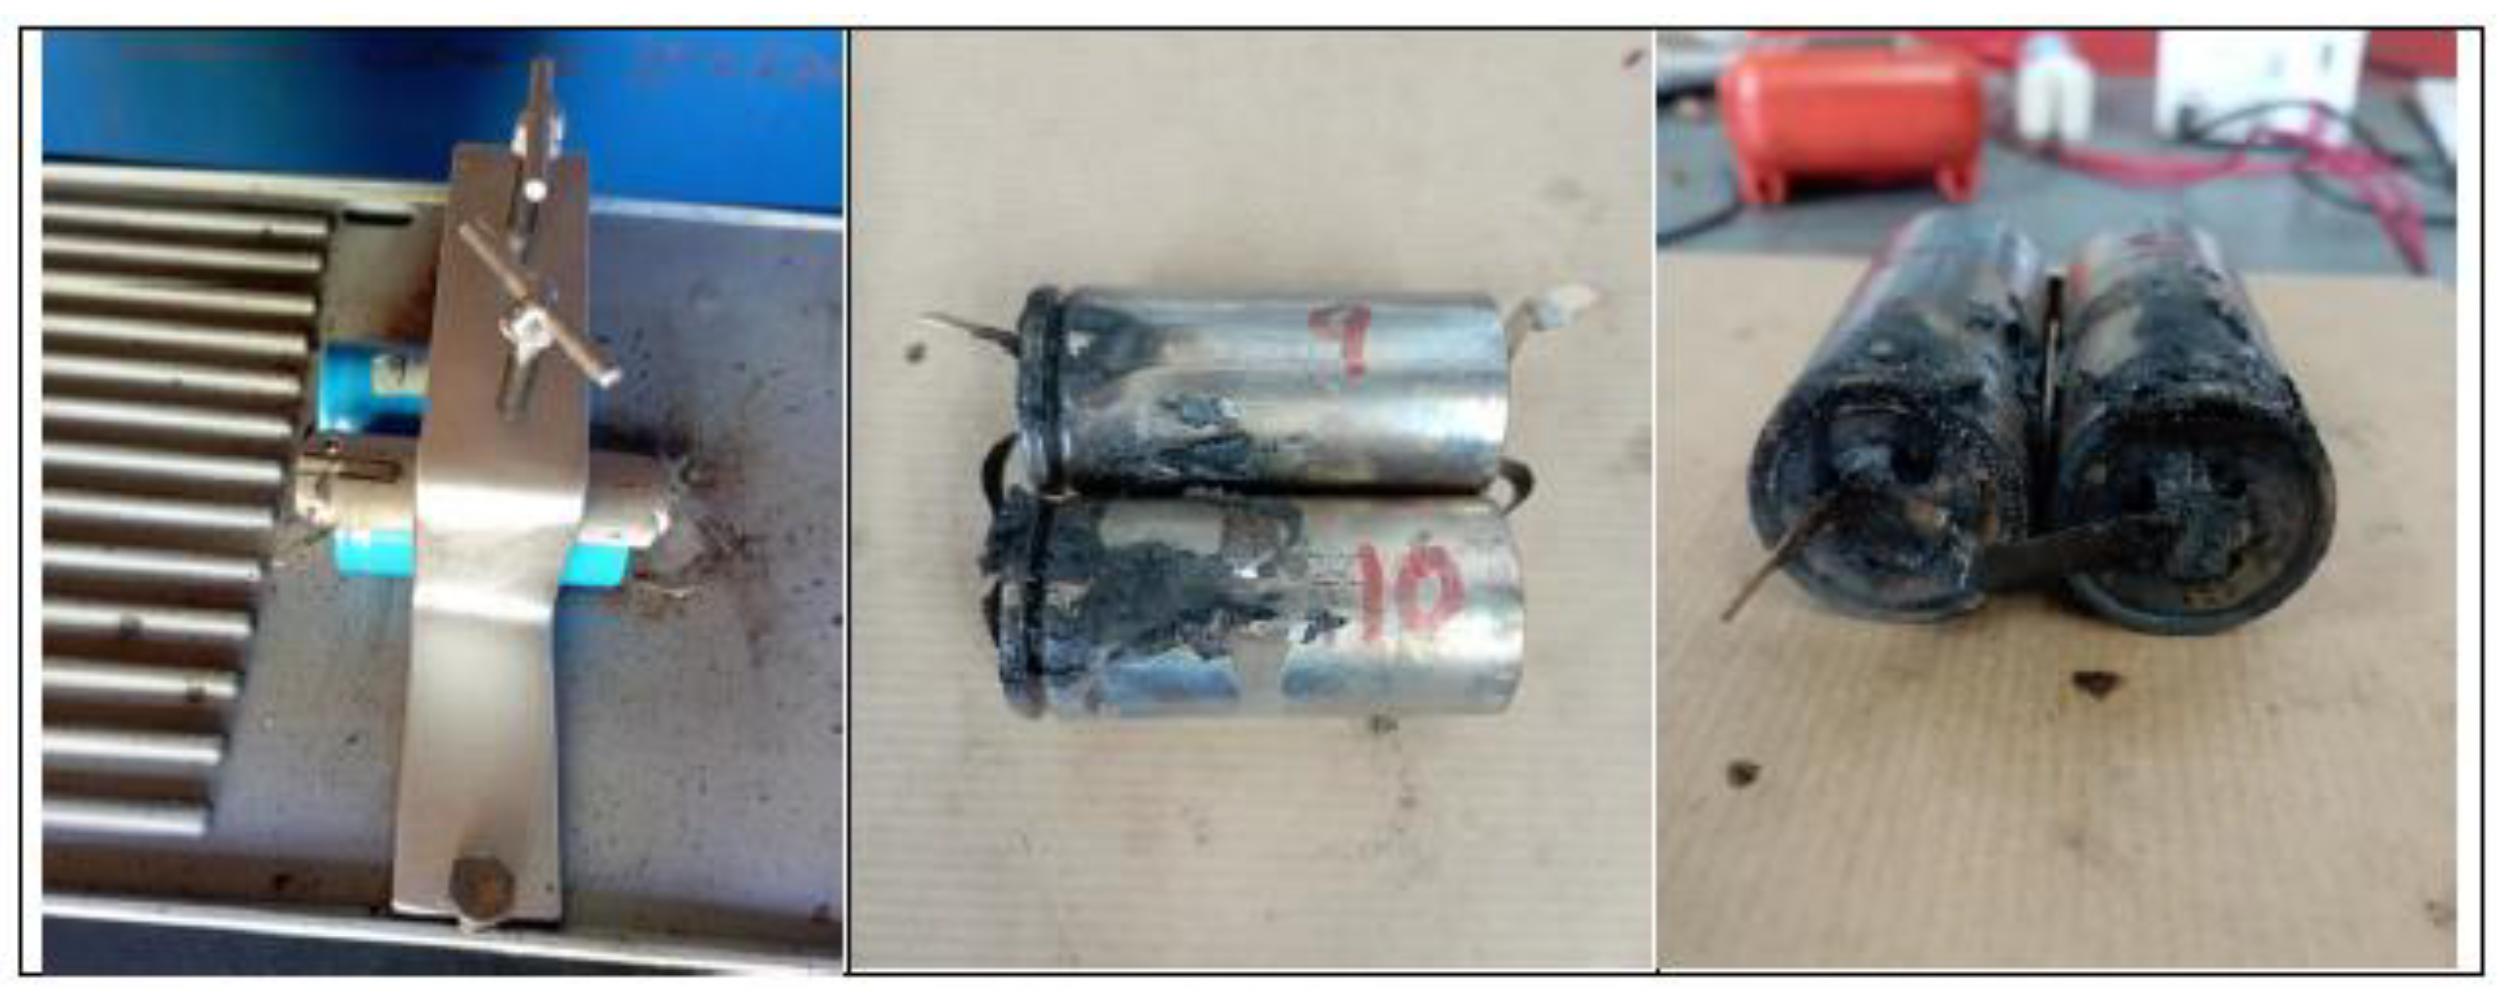
The second test is performed on two horizontally arranged 32700 cylindrical cells connected in series, each having a SoC of 100%. Two K-type thermocouples are placed on cell 5 and cell 6, respectively, to measure their temperature. The following images (
Figure 36) show the state of the cells after the heating test.
Below is a graph (
Figure 37) showing the temperature reached by the griddle and the temperature reached by cell 5 and cell 6 respectively, the different phases through which the cell passes during the test are identified on the graphs.
In this test, the TR is reached earlier, because the area is already sheltered from the wind. It is observed that the temperature profile is similar for cell 5 and cell 6 as they are arranged horizontally on the heating plate. In this test, the maximum temperature value reached in the case of cell 5 is 381.80 °C and in the case of cell 6 is 362.24 °C, during the Thermal Runaway process, although the cooling phase is not recorded.
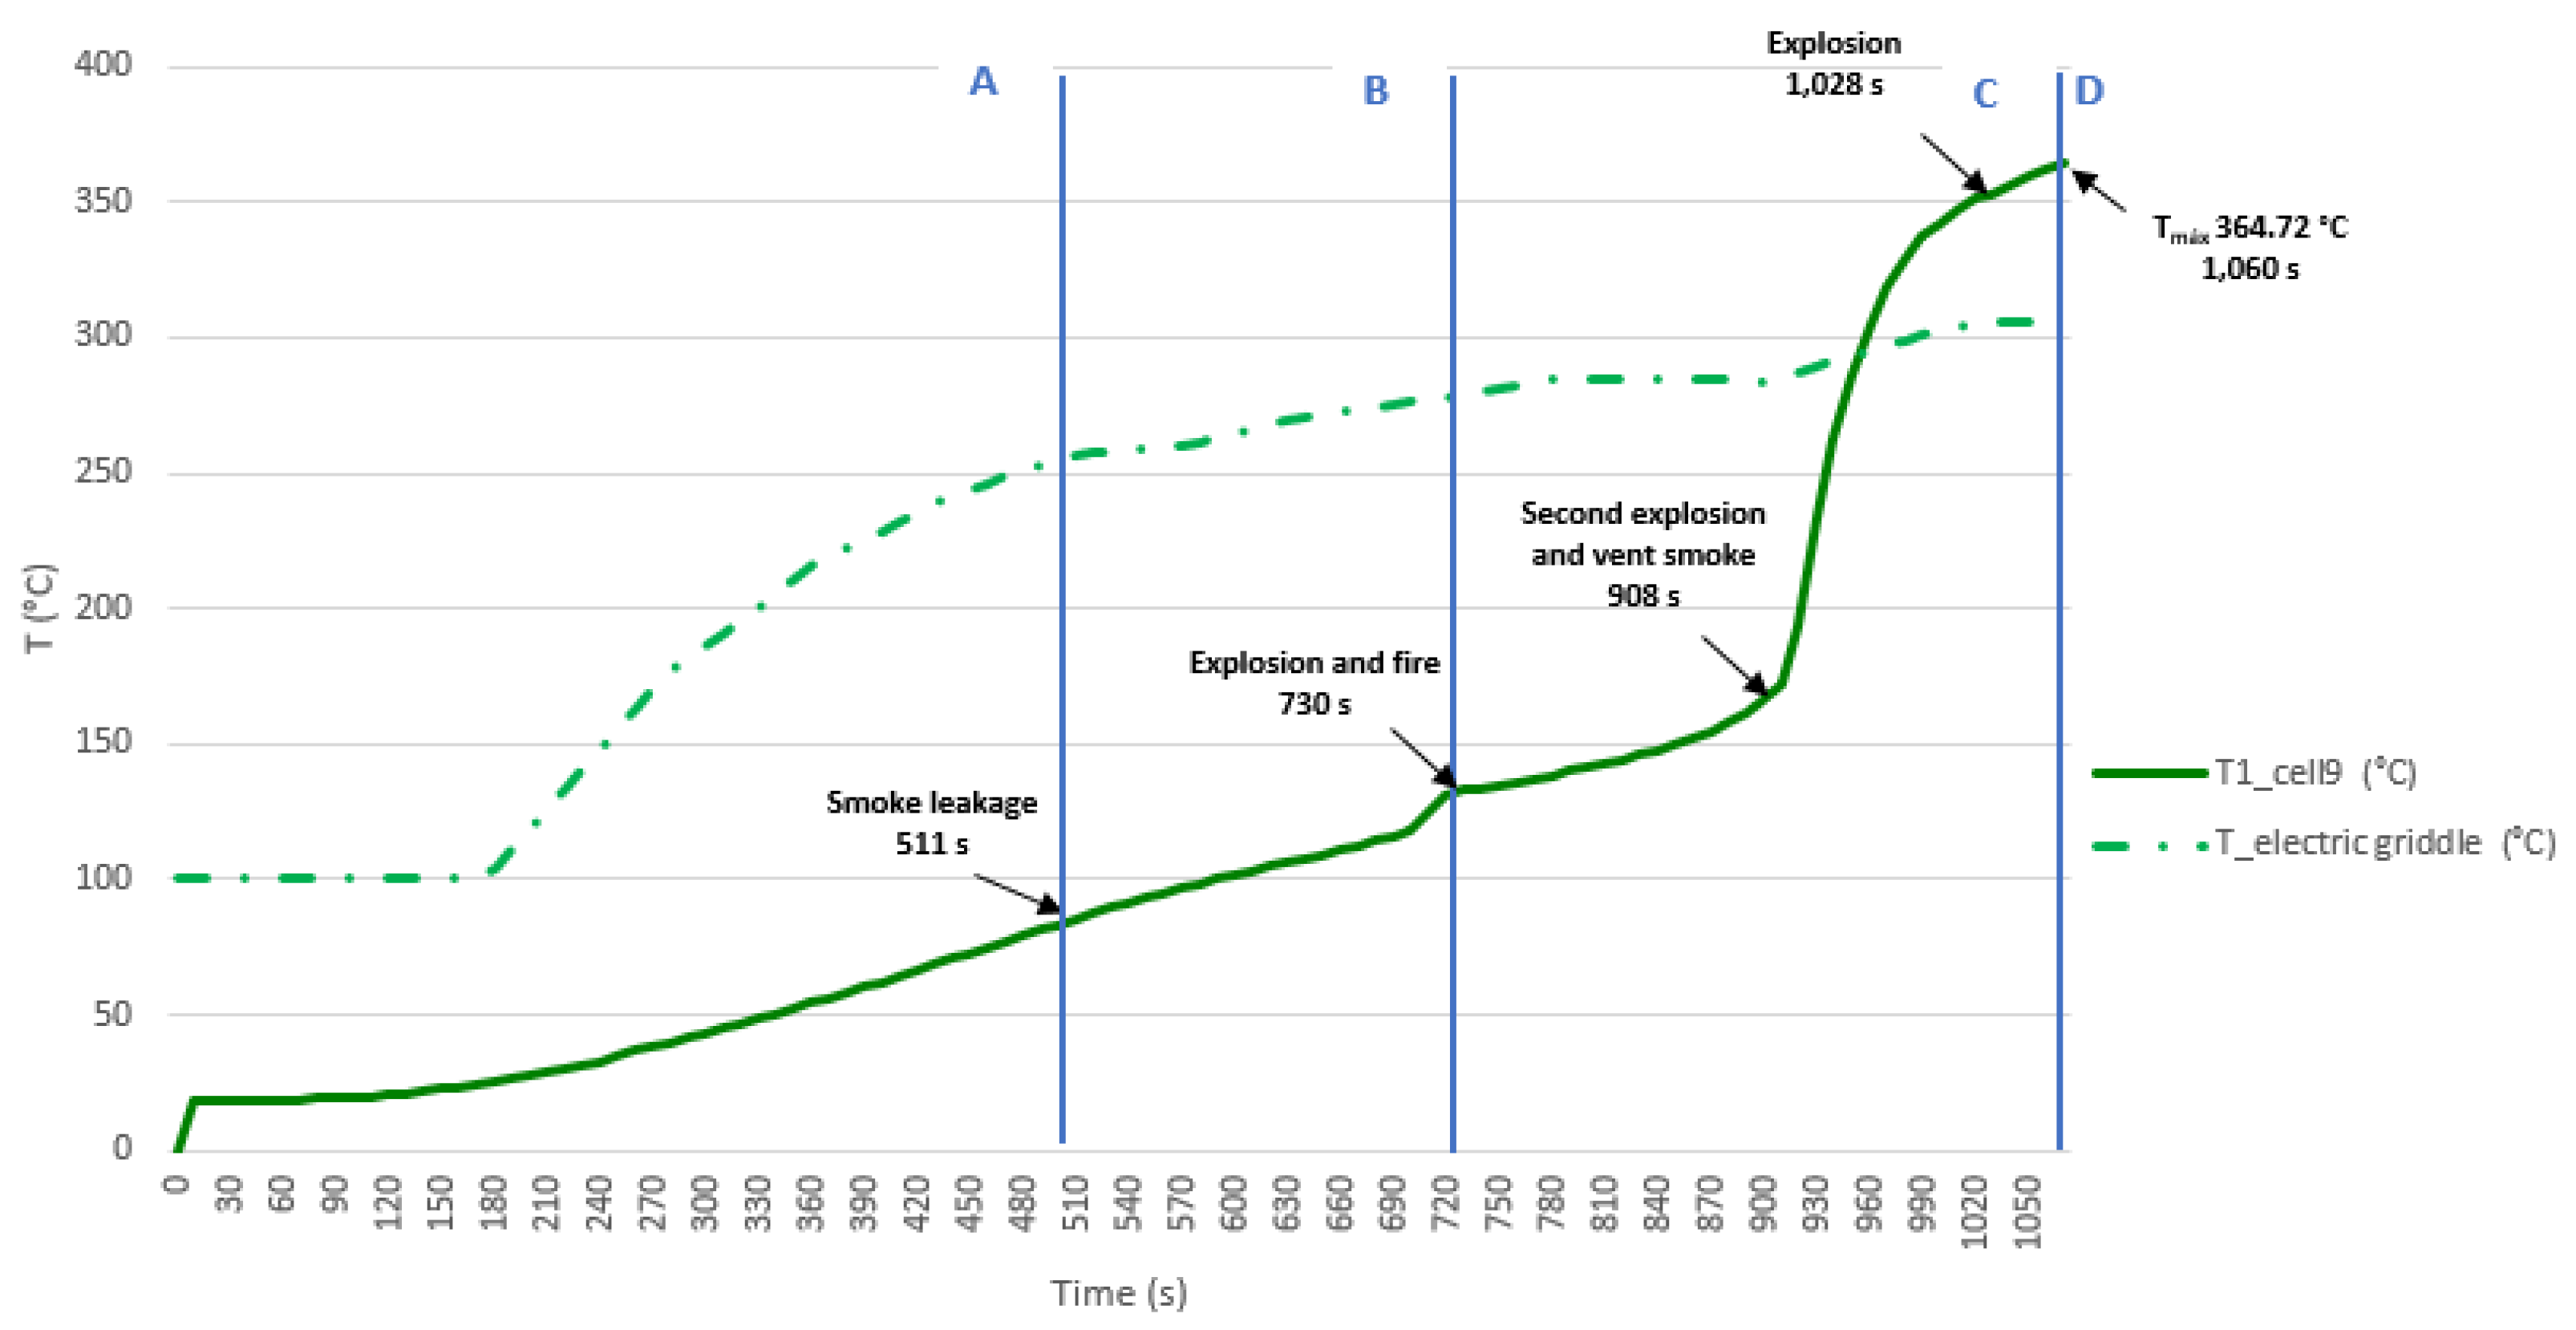
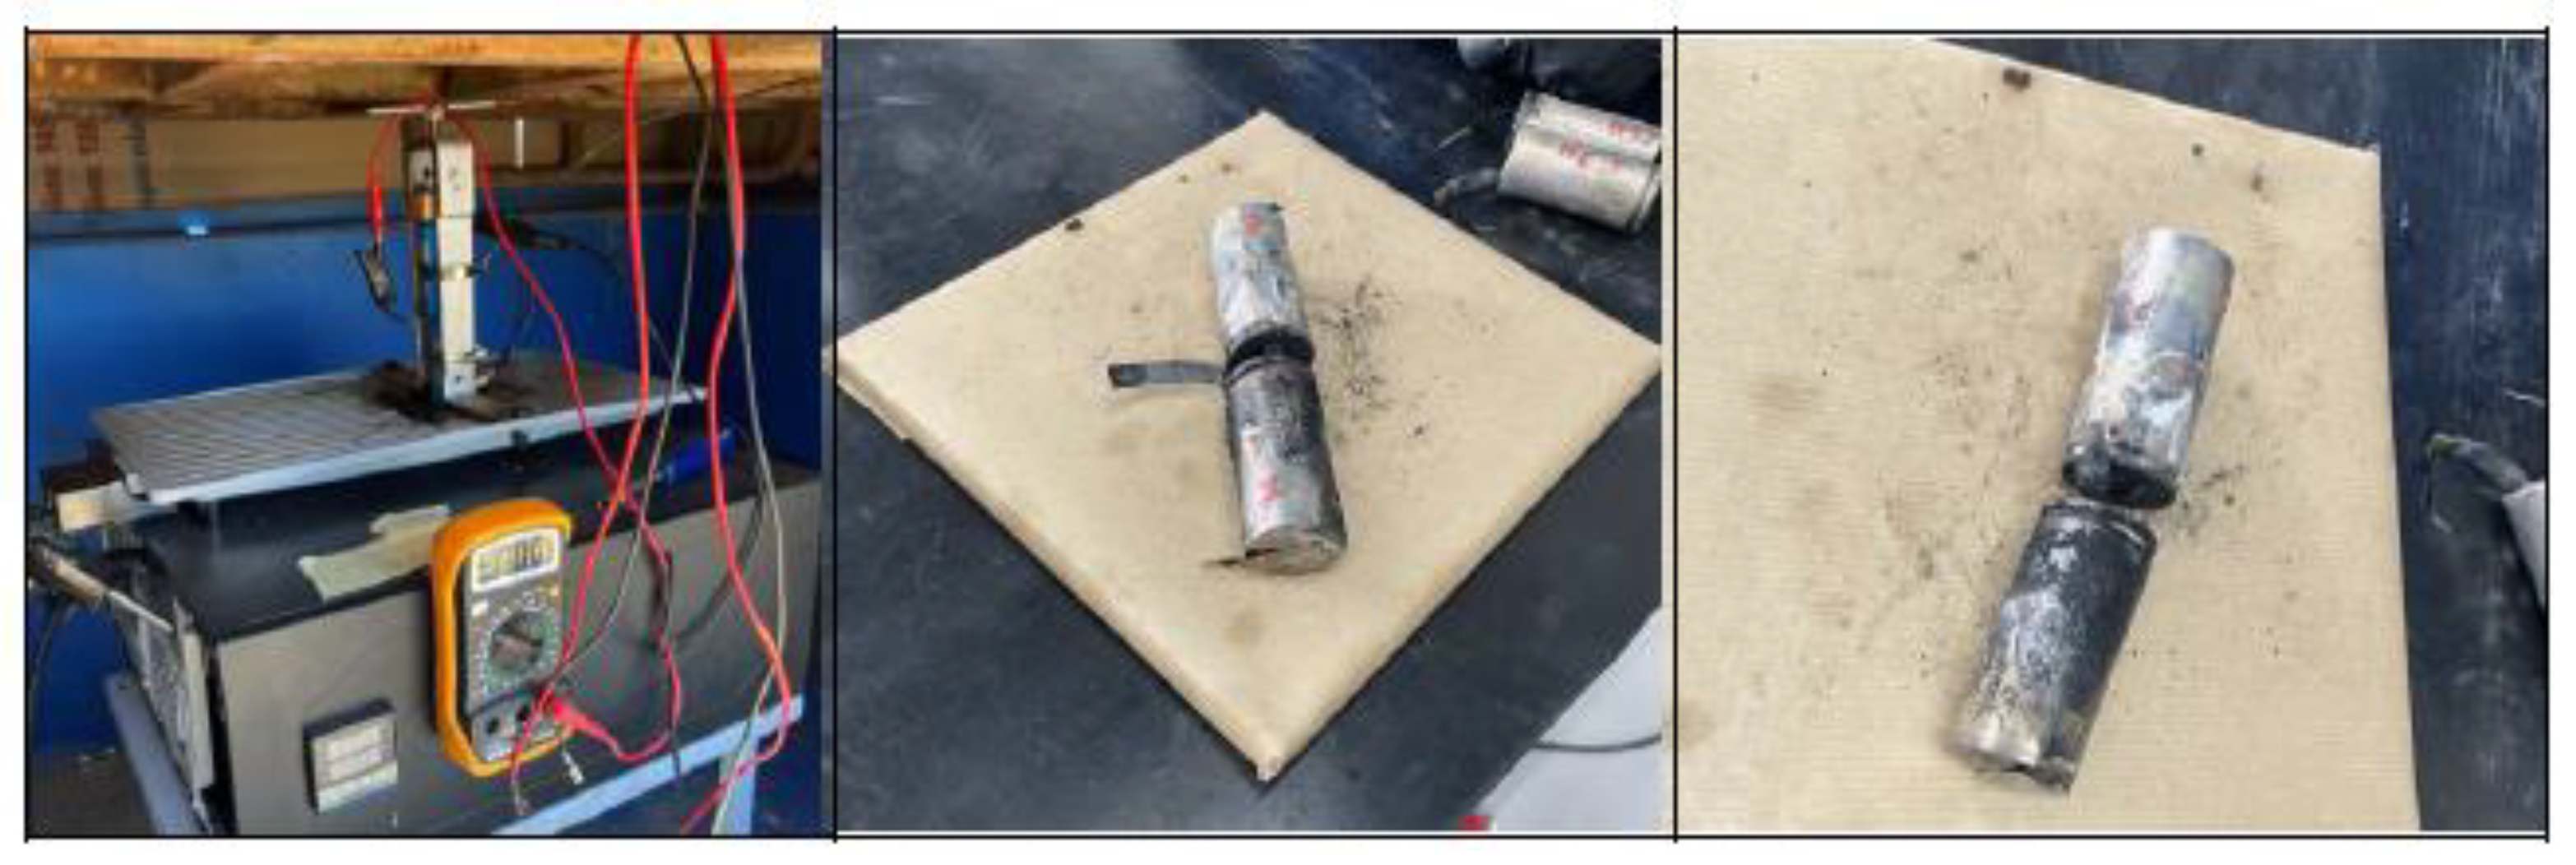
3.3.3. Test 3: Horizontal, Parallel Connection and SoC 100% (Cell 9 and Cell 10)
The third test is performed on two horizontally arranged 32700 cylindrical cells connected in parallels, each having a SoC of 100%. The K-type thermocouple is placed on cell 9, to measure their temperature. The following images (
Figure 38) show the state of the cells after the heating test.
A graph (
Figure 39) showing the temperature reached by the electric griddle and the temperature reached by the cell 9 is shown below, the different phases through which the cell passes during the test are identified on the graphs. From the second test onwards, the rest of the tests are carried out in a space with a structure sheltered from the wind. In this case, as it has already been observed in the previous test 2 that the temperature profile of the two cells placed horizontally on the heating plate is similar, in this test the thermocouple is only placed in one of the cells in horizontal arrangement, specifically in cell 9. In this test, the maximum temperature value reached in the case of cell 9 is 364.72 °C, during the TR process, although the cooling phase is not recorded during the test. It is observed that in horizontal arrangement with the same SoC, the TR is reached earlier if the cells are connected in parallel.
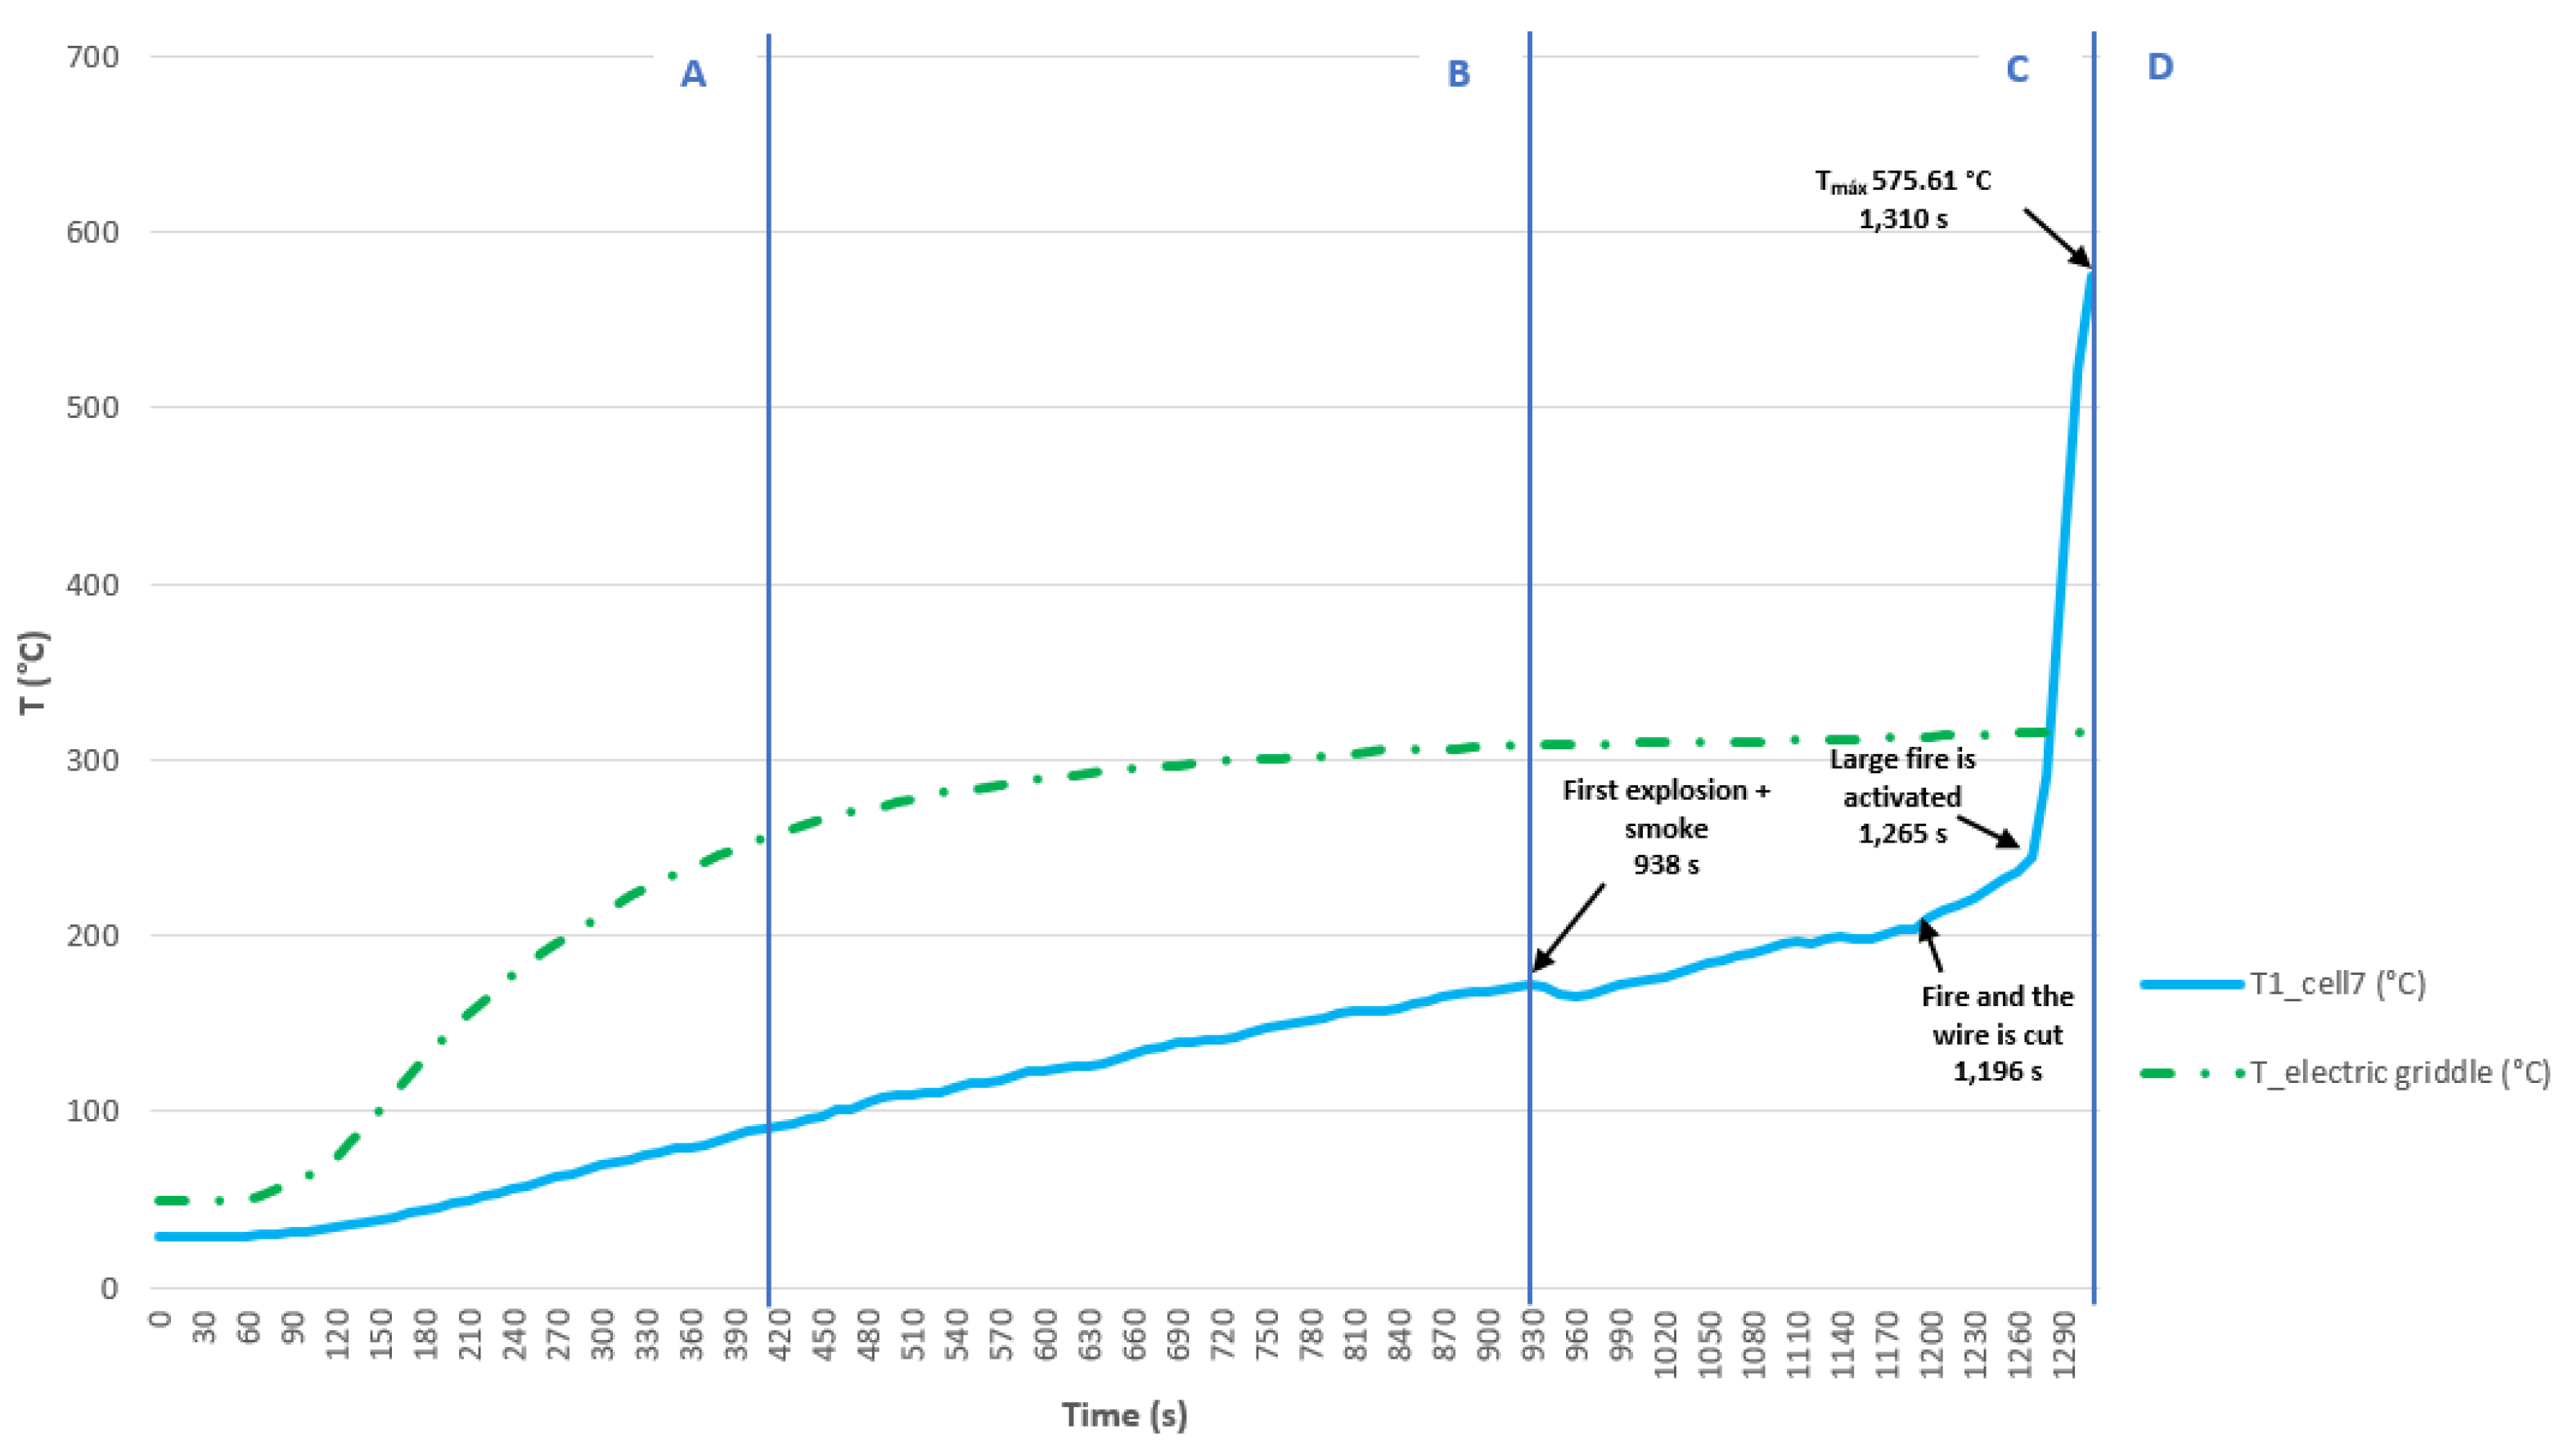
3.3.4. Test 4: Vertical, Parallel Connection and SoC 100% (Cell 7 (Bellow) and Cell 8)
The test is carried out on two 32700 cylindrical cells in vertical arrangement connected in parallel and each having a SoC of 100%. The type K thermocouple is placed on cell 7 to measure its temperature; this cell is the one placed underneath and in contact with the electric griddle. Below (
Figure 40) are some images of the state of the cells after the heating test:
In the
Figure 40, cell 7 is more damaged than cell 8, as it is the one that is more exposed to heat and experiences TR. Below is a graph (
Figure 41) showing the temperature reached by the grill and the temperature reached by cell 7, the different phases through which the cell passes during the test are identified on the graphs. In this test, the maximum temperature value reached in the case of cell 7 is 575.61 °C, during the Thermal Runaway process, although the cooling phase is not recorded during the test. It is observed that in vertical arrangement with identical SoC, in this case 100%, the maximum temperature reached in the Thermal Runaway process is higher in the case of being connected in parallel than in series.
3.3.5. Test 5: Vertical, Parallel Connection and SoC 50% (Cell 11 (Bellow) and Cell 12)
The test is carried out on two 32700 cylindrical cells in vertical arrangement connected in parallel and each having a SoC of 50%. The type K thermocouple is placed on cell 11 to measure its temperature; this cell is the one placed underneath and in contact with the electric griddle. An image is shown below before the test is performed (
Figure 42).
Below are images (
Figure 43) of the state of the cells after carrying out the heating test.
In the previous images cell 11 is more damaged than cell 12 since it is the one that is most exposed to heat and the one that experiences TR. In the
Figure 44 it can be seen the temperature reached by the electric griddle and the temperature reached by cell 11. In this test, the maximum temperature value reached in the case of cell 11 is 499.24 °C, during the TR process. If the temperature profile of this test is compared with the previous one, it is observed that as the SoC decreases, the maximum temperature reached is lower and the time to reach the maximum temperature is longer.
3.3.6. Test 6: Horizontal, Parallel Connection and SoC 50% (Cell 1 and Cell 2)
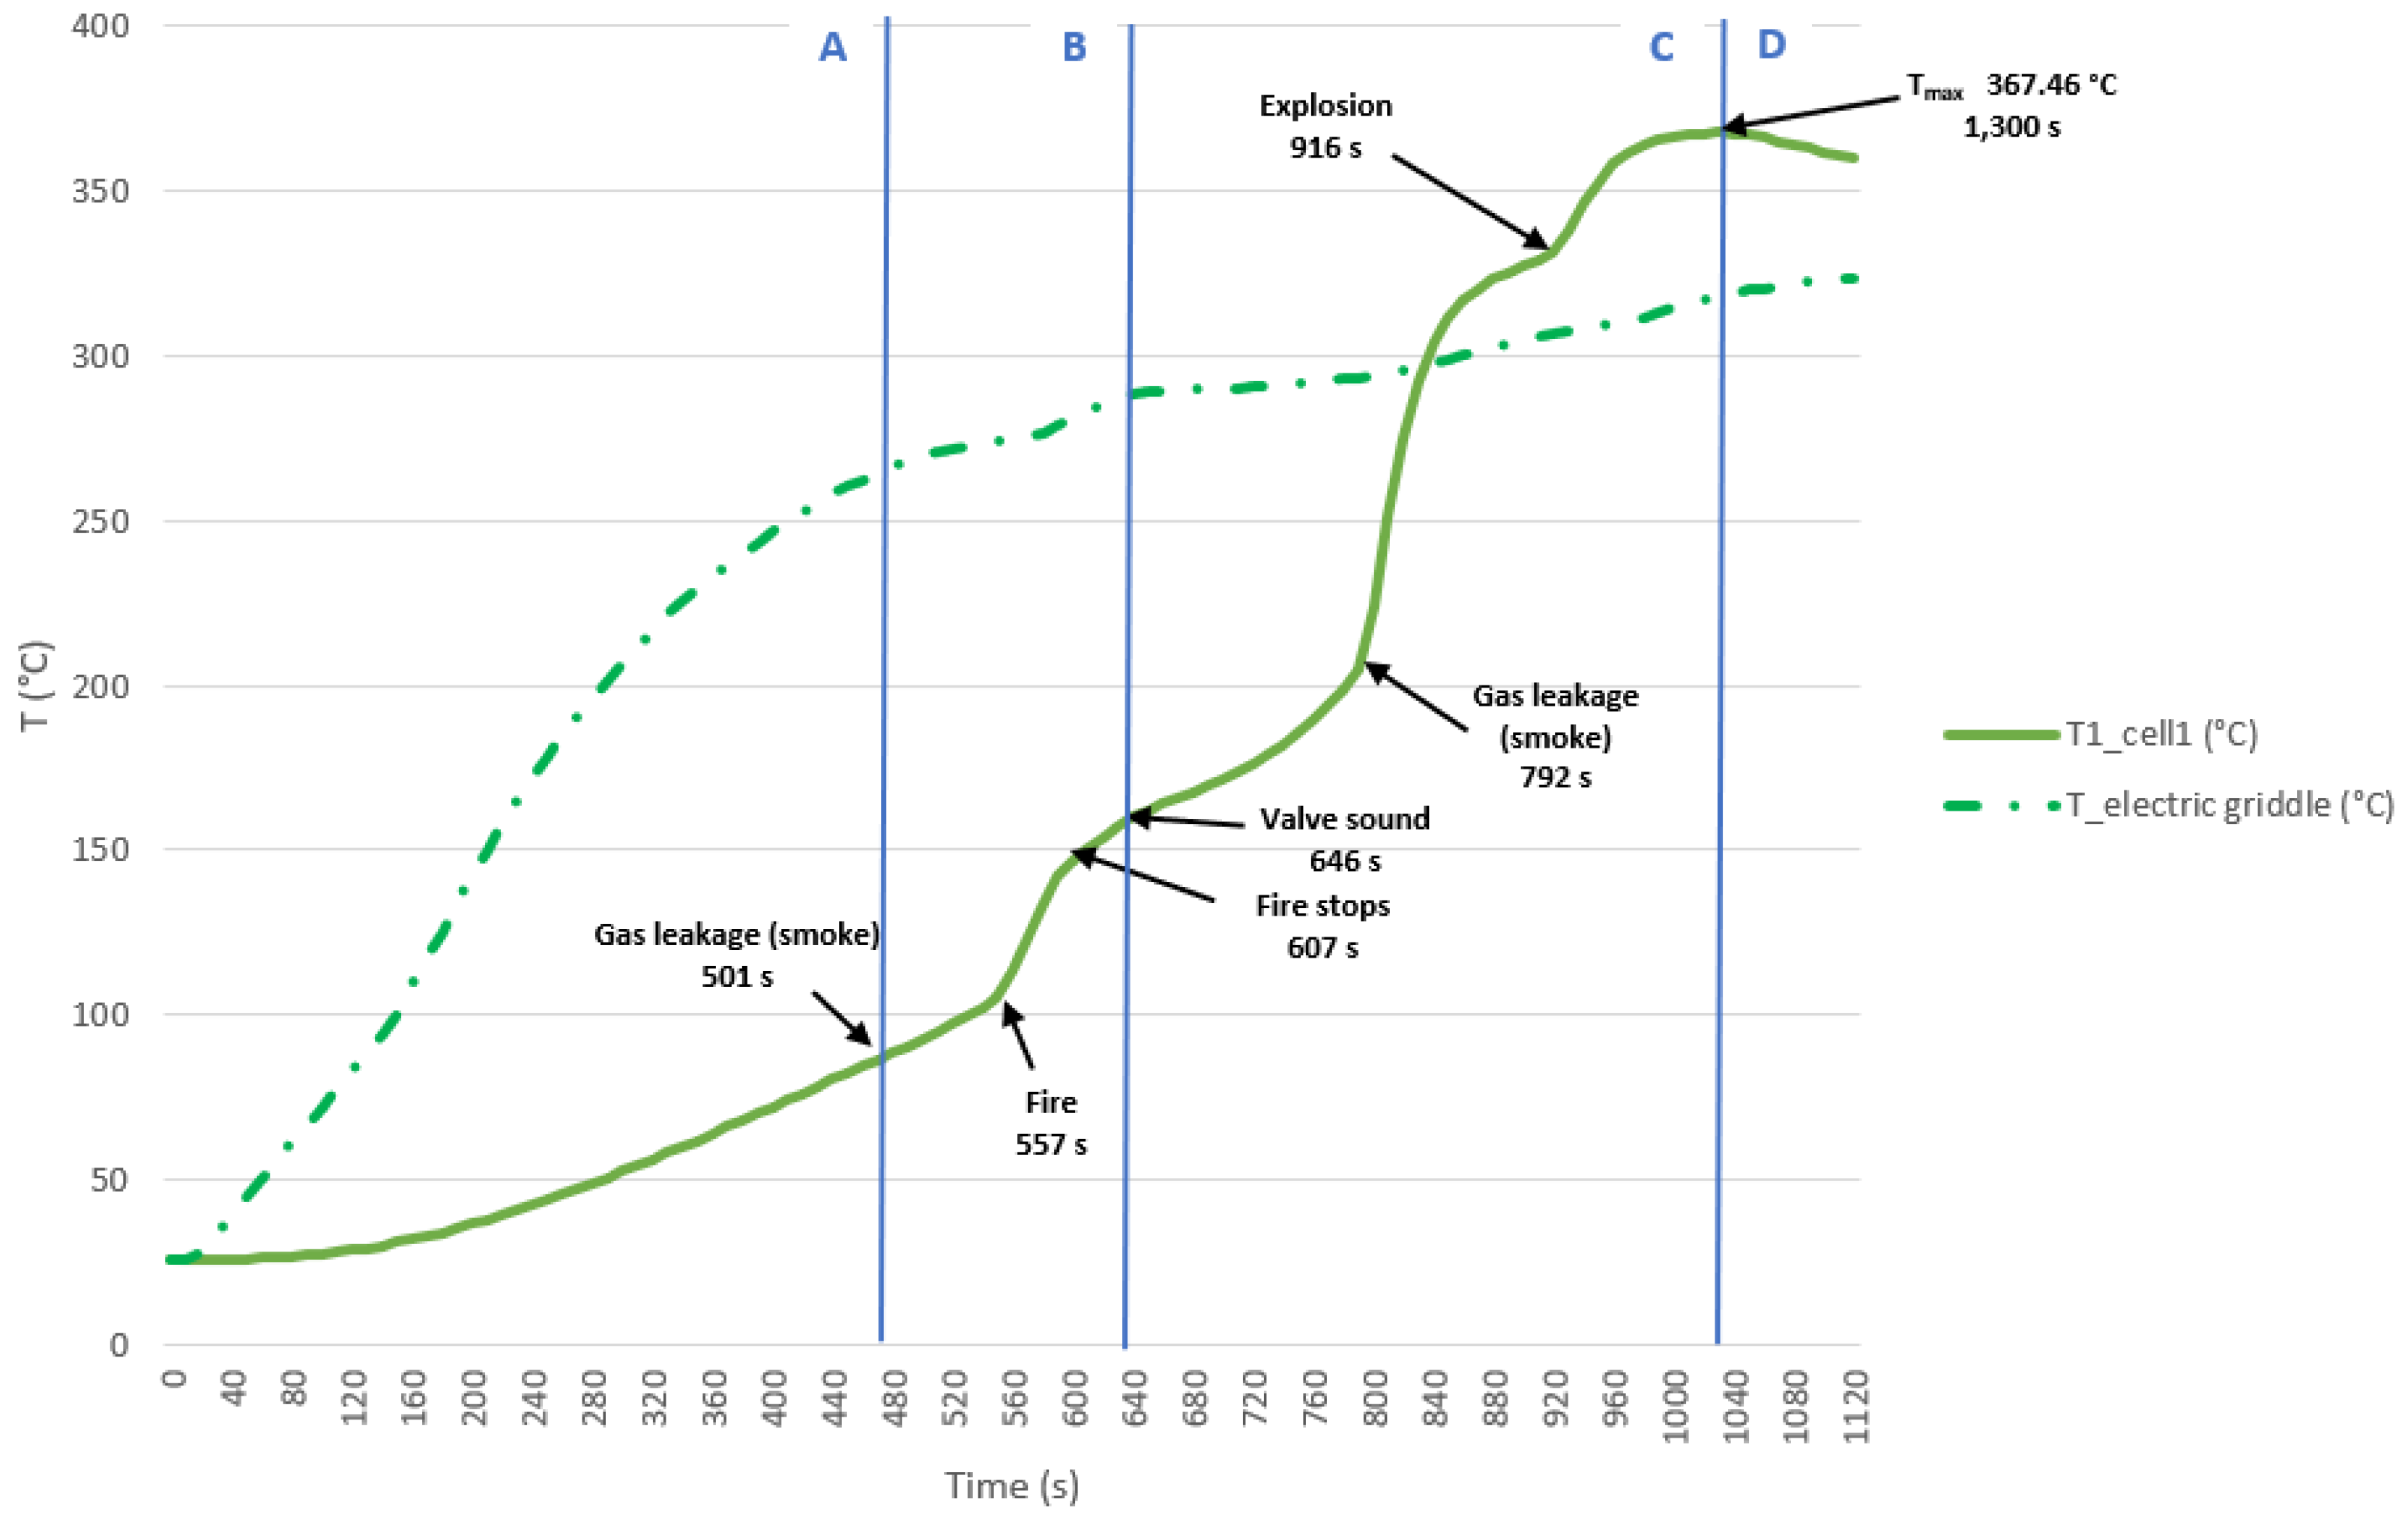
The test is carried out on two 32700 cylindrical cells in horizontal arrangement connected in parallel and each having a SoC of 50%. The type K thermocouple is placed on cell 1 to measure its temperature; this cell is the one placed underneath and in contact with the electric griddle. An image is shown below before the test is performed (
Figure 45).
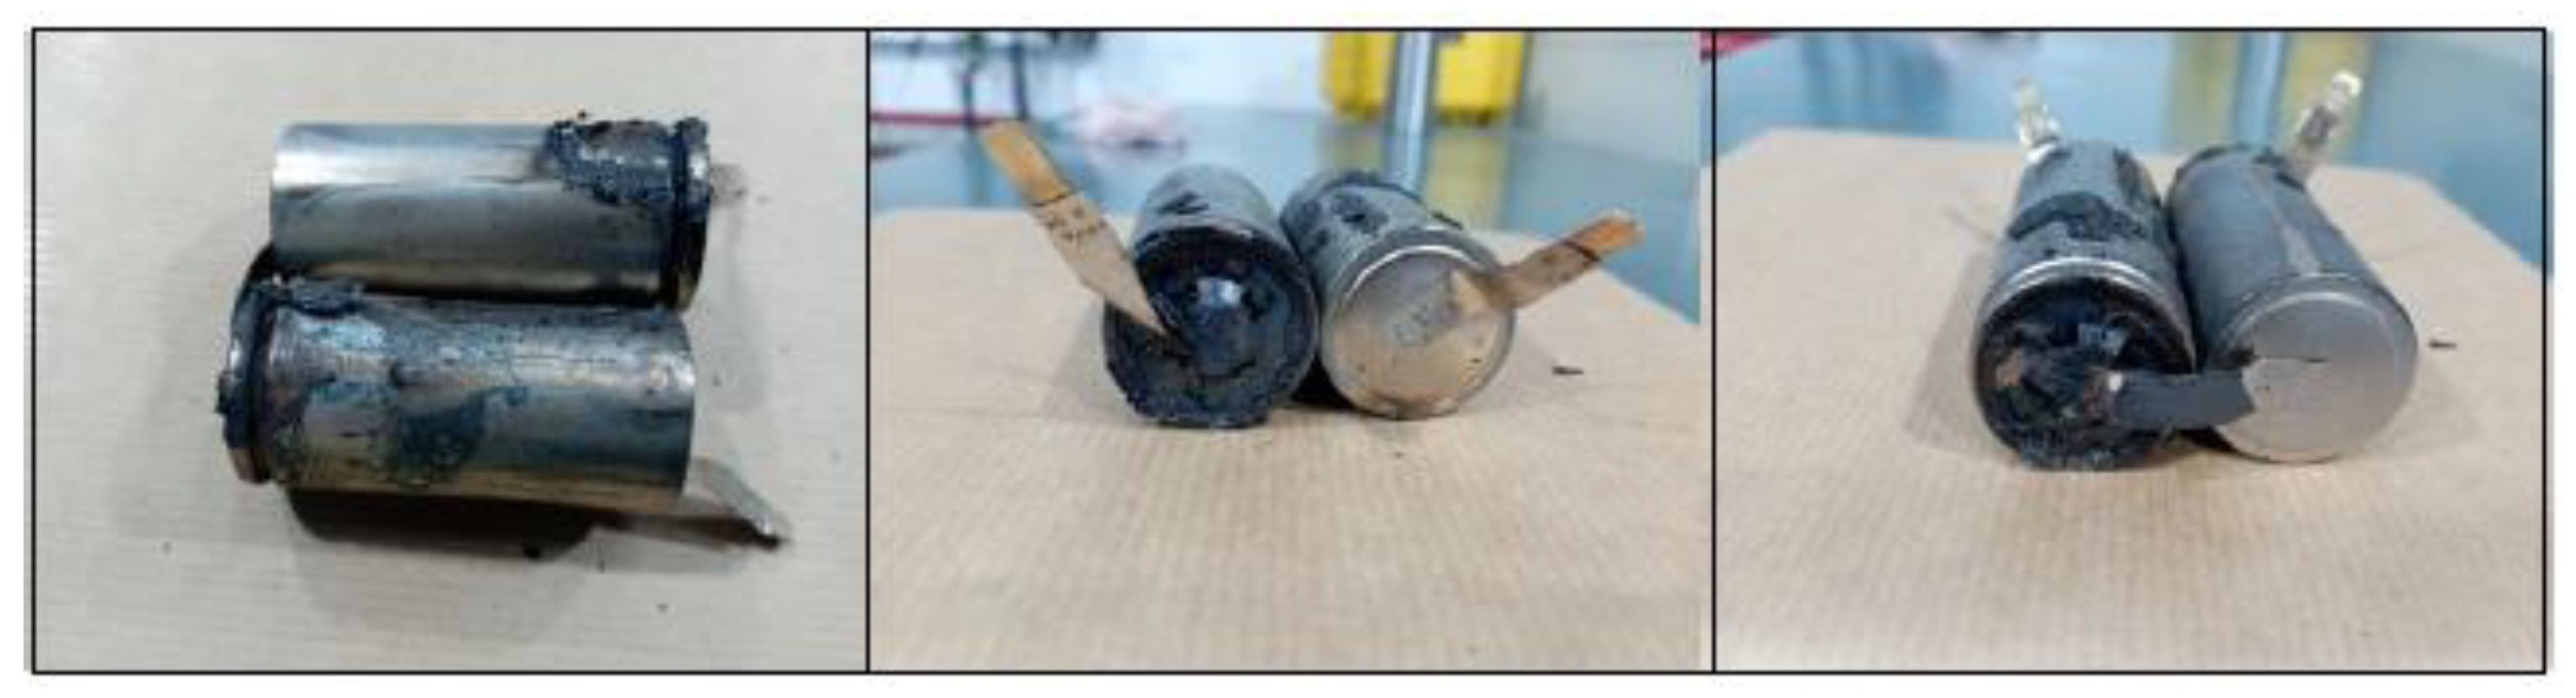
Below are images (
Figure 46) of the state of the cells after carrying out the heating test, the cells are more damaged in the upper part since the vent valve is activated and that is where the gases come out.
Next, it can be seen a graph (
Figure 47) with the temperature reached by the electric griddle and the temperature reached by the cell 1.
In this test, the maximum temperature value reached in the case of cell 1 is 367.46 °C, during the TR process. If it is compared with the horizontal arrangement test with parallel connection and 100% SoC, it is observed that in the case of 50% SoC the temperature is approximately the same, but as the SoC decreases it takes longer to reach the maximum temperature.
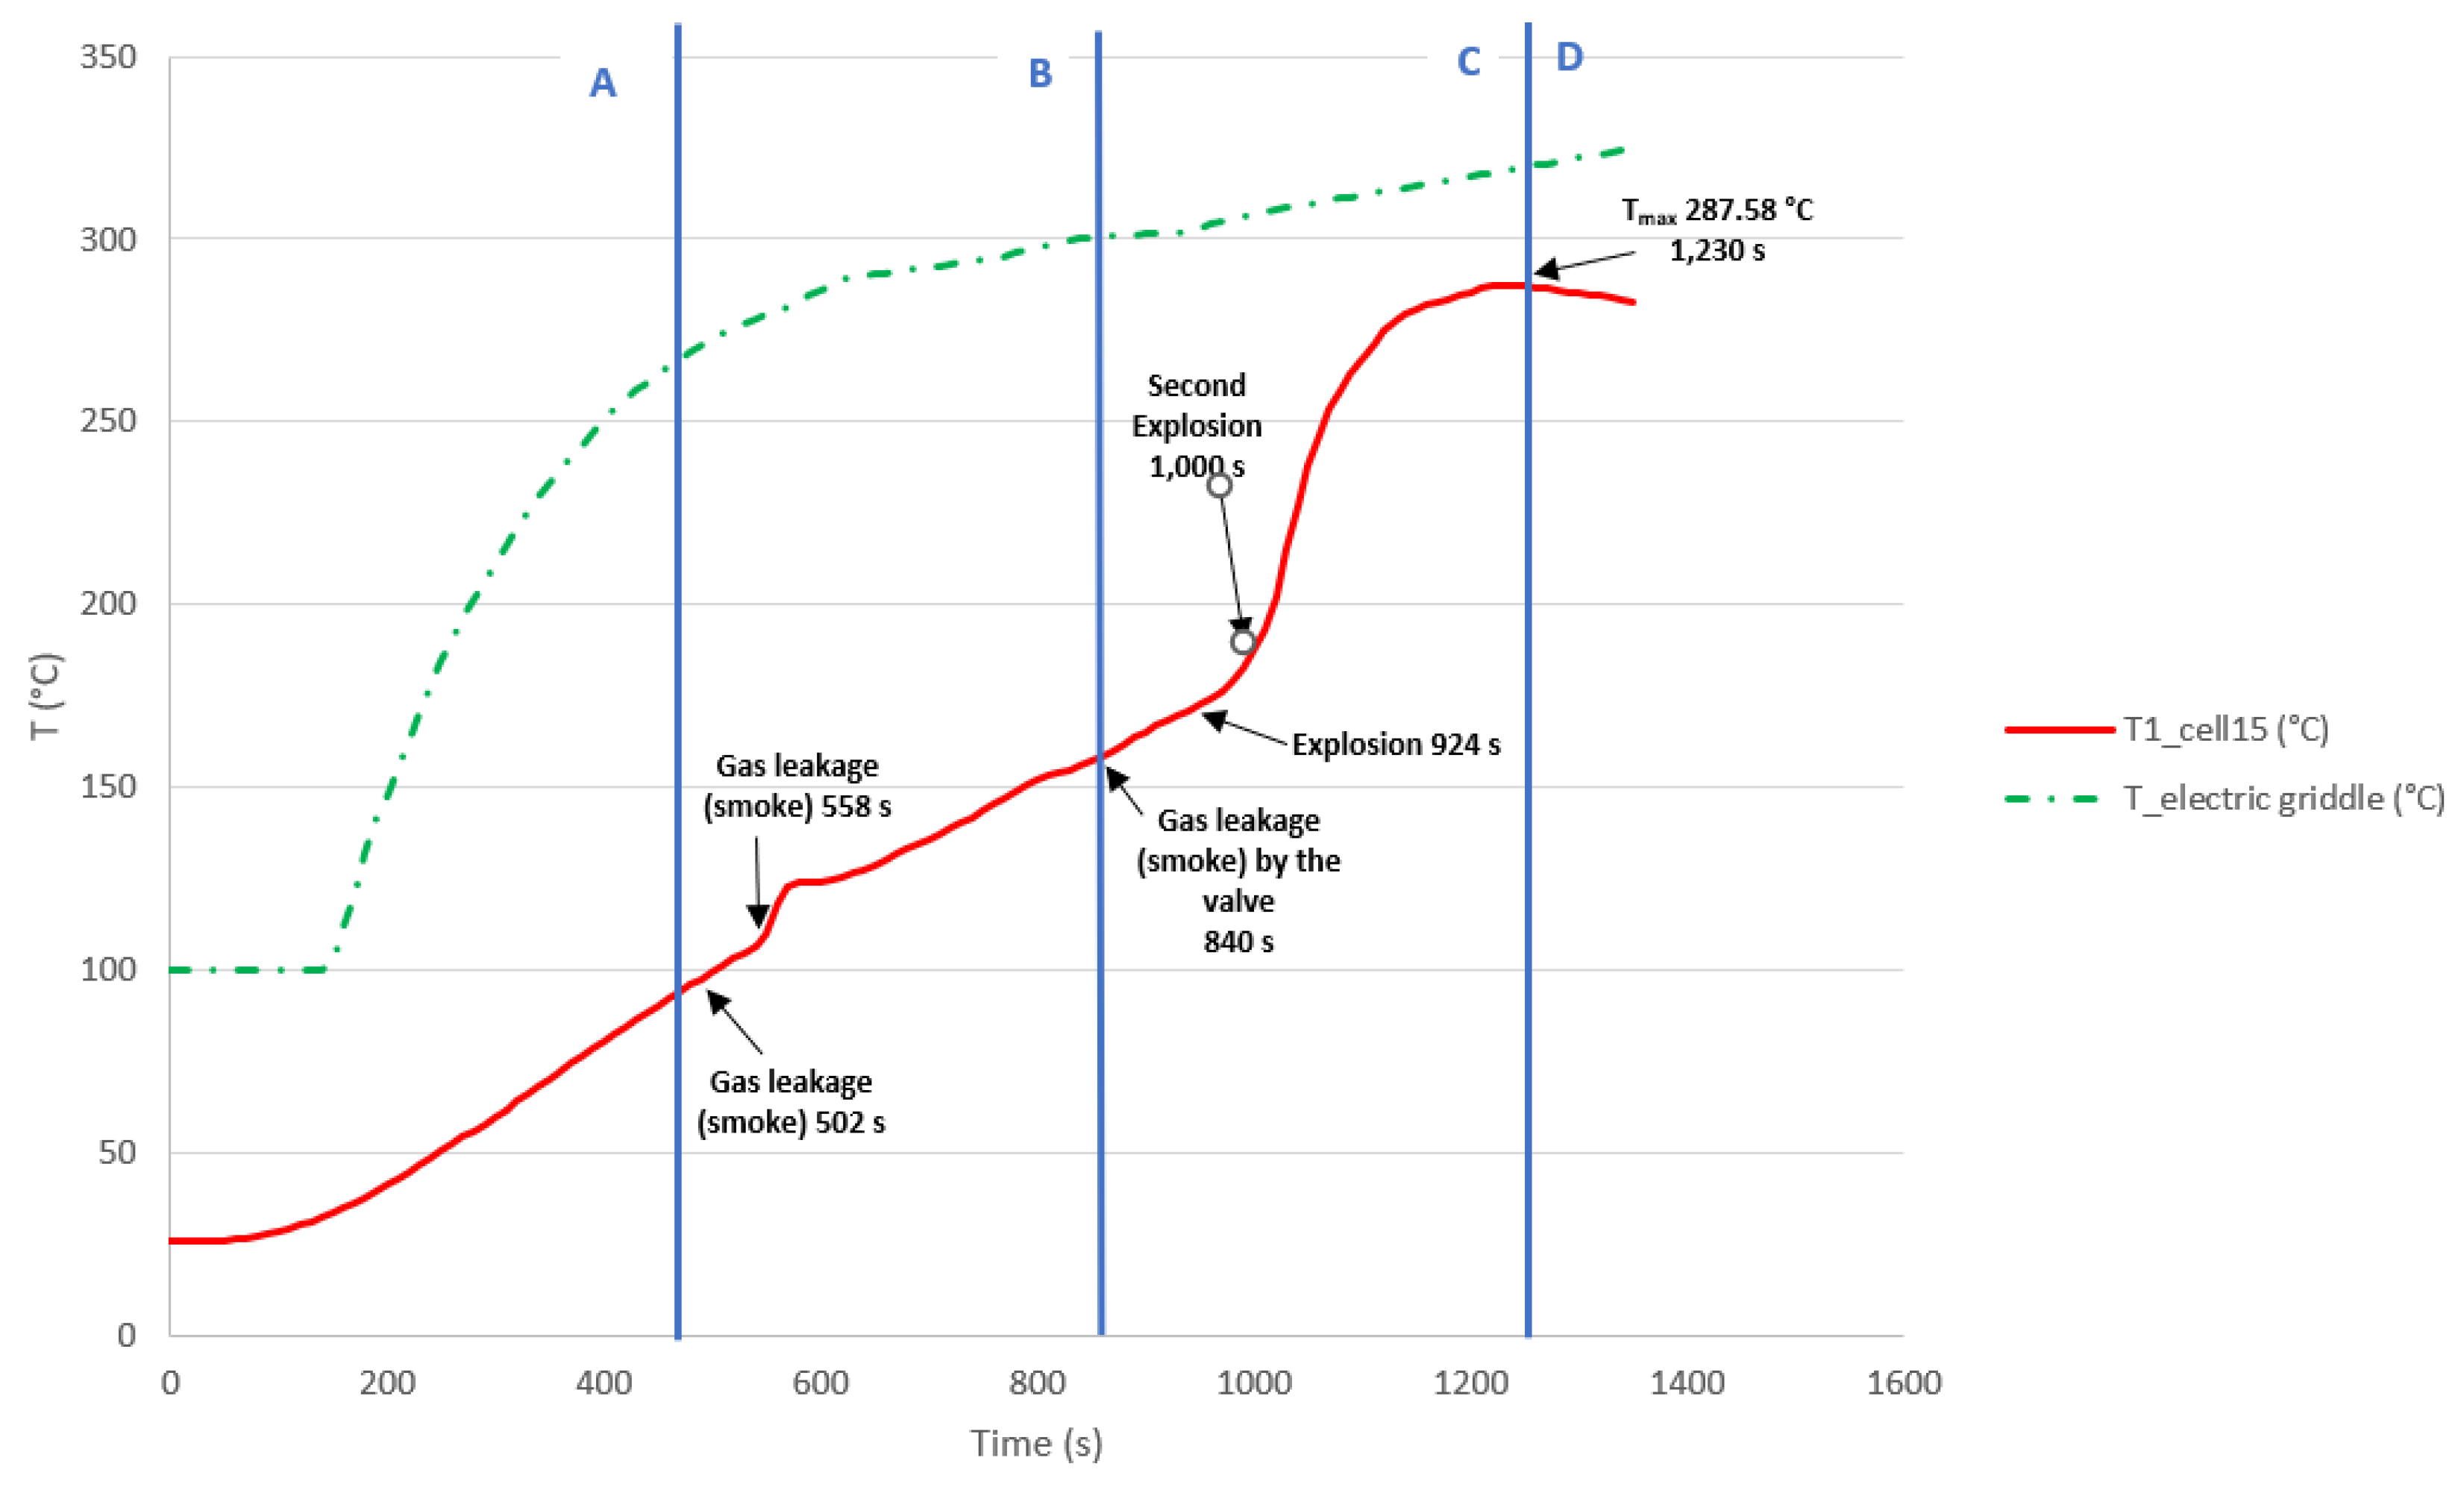
3.3.7. Test 7: Horizontal, Series Connection and SoC 50% (Cell 15 and Cell 14)
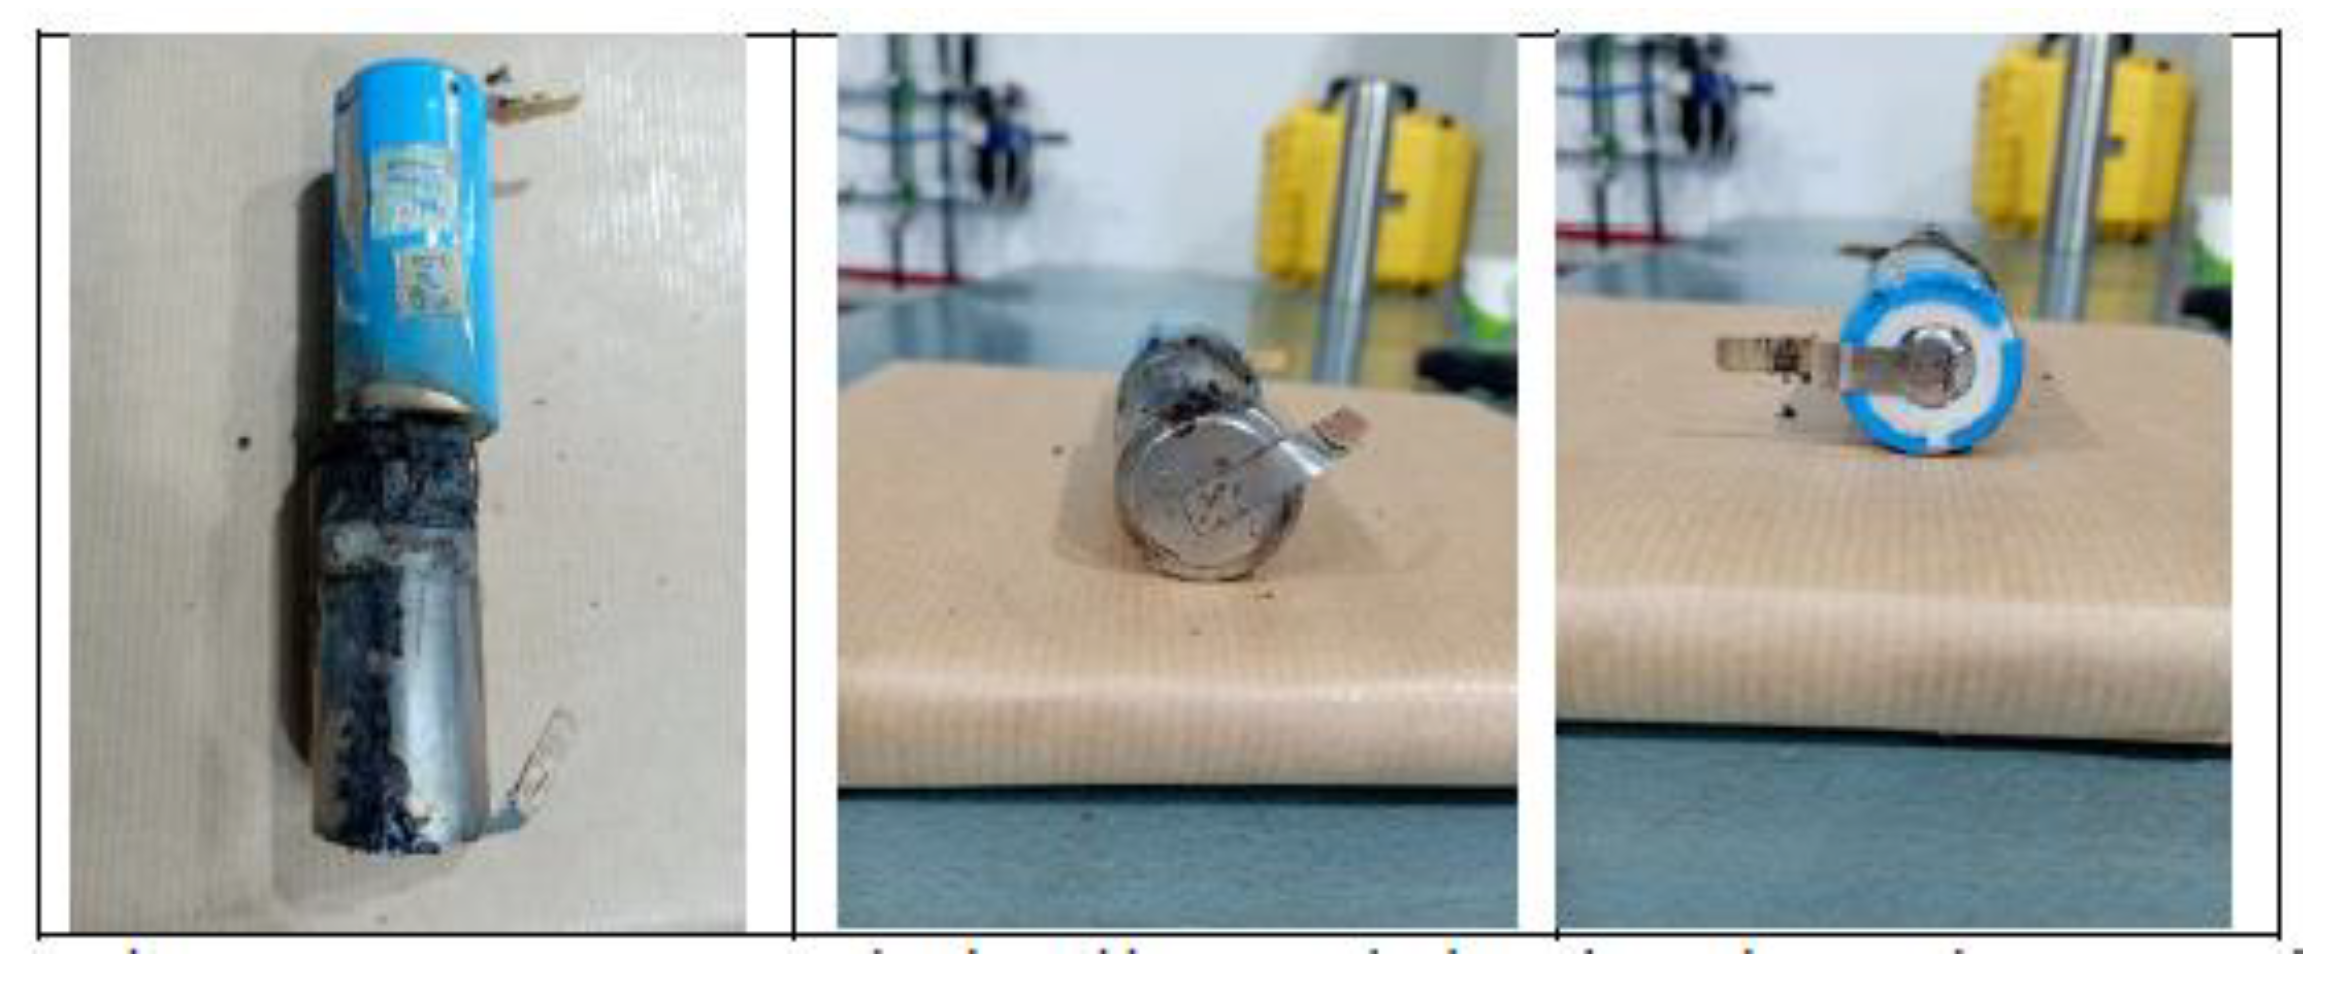
The test is carried out on two 32700 cylindrical cells in horizontal arrangement connected in series and each having a SoC of 50%. The type K thermocouple is placed on cell 15 to measure its temperature. Bellow are some images of the state the cells after carrying out the heating test (
Figure 48), the cells are more damaged in the upper part since that is where the valve is activated and that is where the gases come out.
Bellow, it can be seen a graph (
Figure 49) with the temperature reached by the electric griddle and the temperature reached by the cell 15. In this test, the maximum temperature value reached in the case of cell 15 is 287.58 °C, during the TR process. If it is compared with the test carried out with the cells connected in series and horizontal arrangement, but with an SoC of 100% , it is observed that in this arrangement, as the SoC decreases, the maximum temperature reached decreases and the moment at which the reaching the maximum temperature occurs sooner int the case of the SoC of 50%, but it must be considered that the tests are not carried out in a climatic chamber and that the ambient temperature has an influence. In the case of the 50% SoC test, the ambient temperature was higher, so this may be the reason why the maximum TR temperature was reached earlier than in the case of the 100% SoC test, in which the ambient temperature was lower.
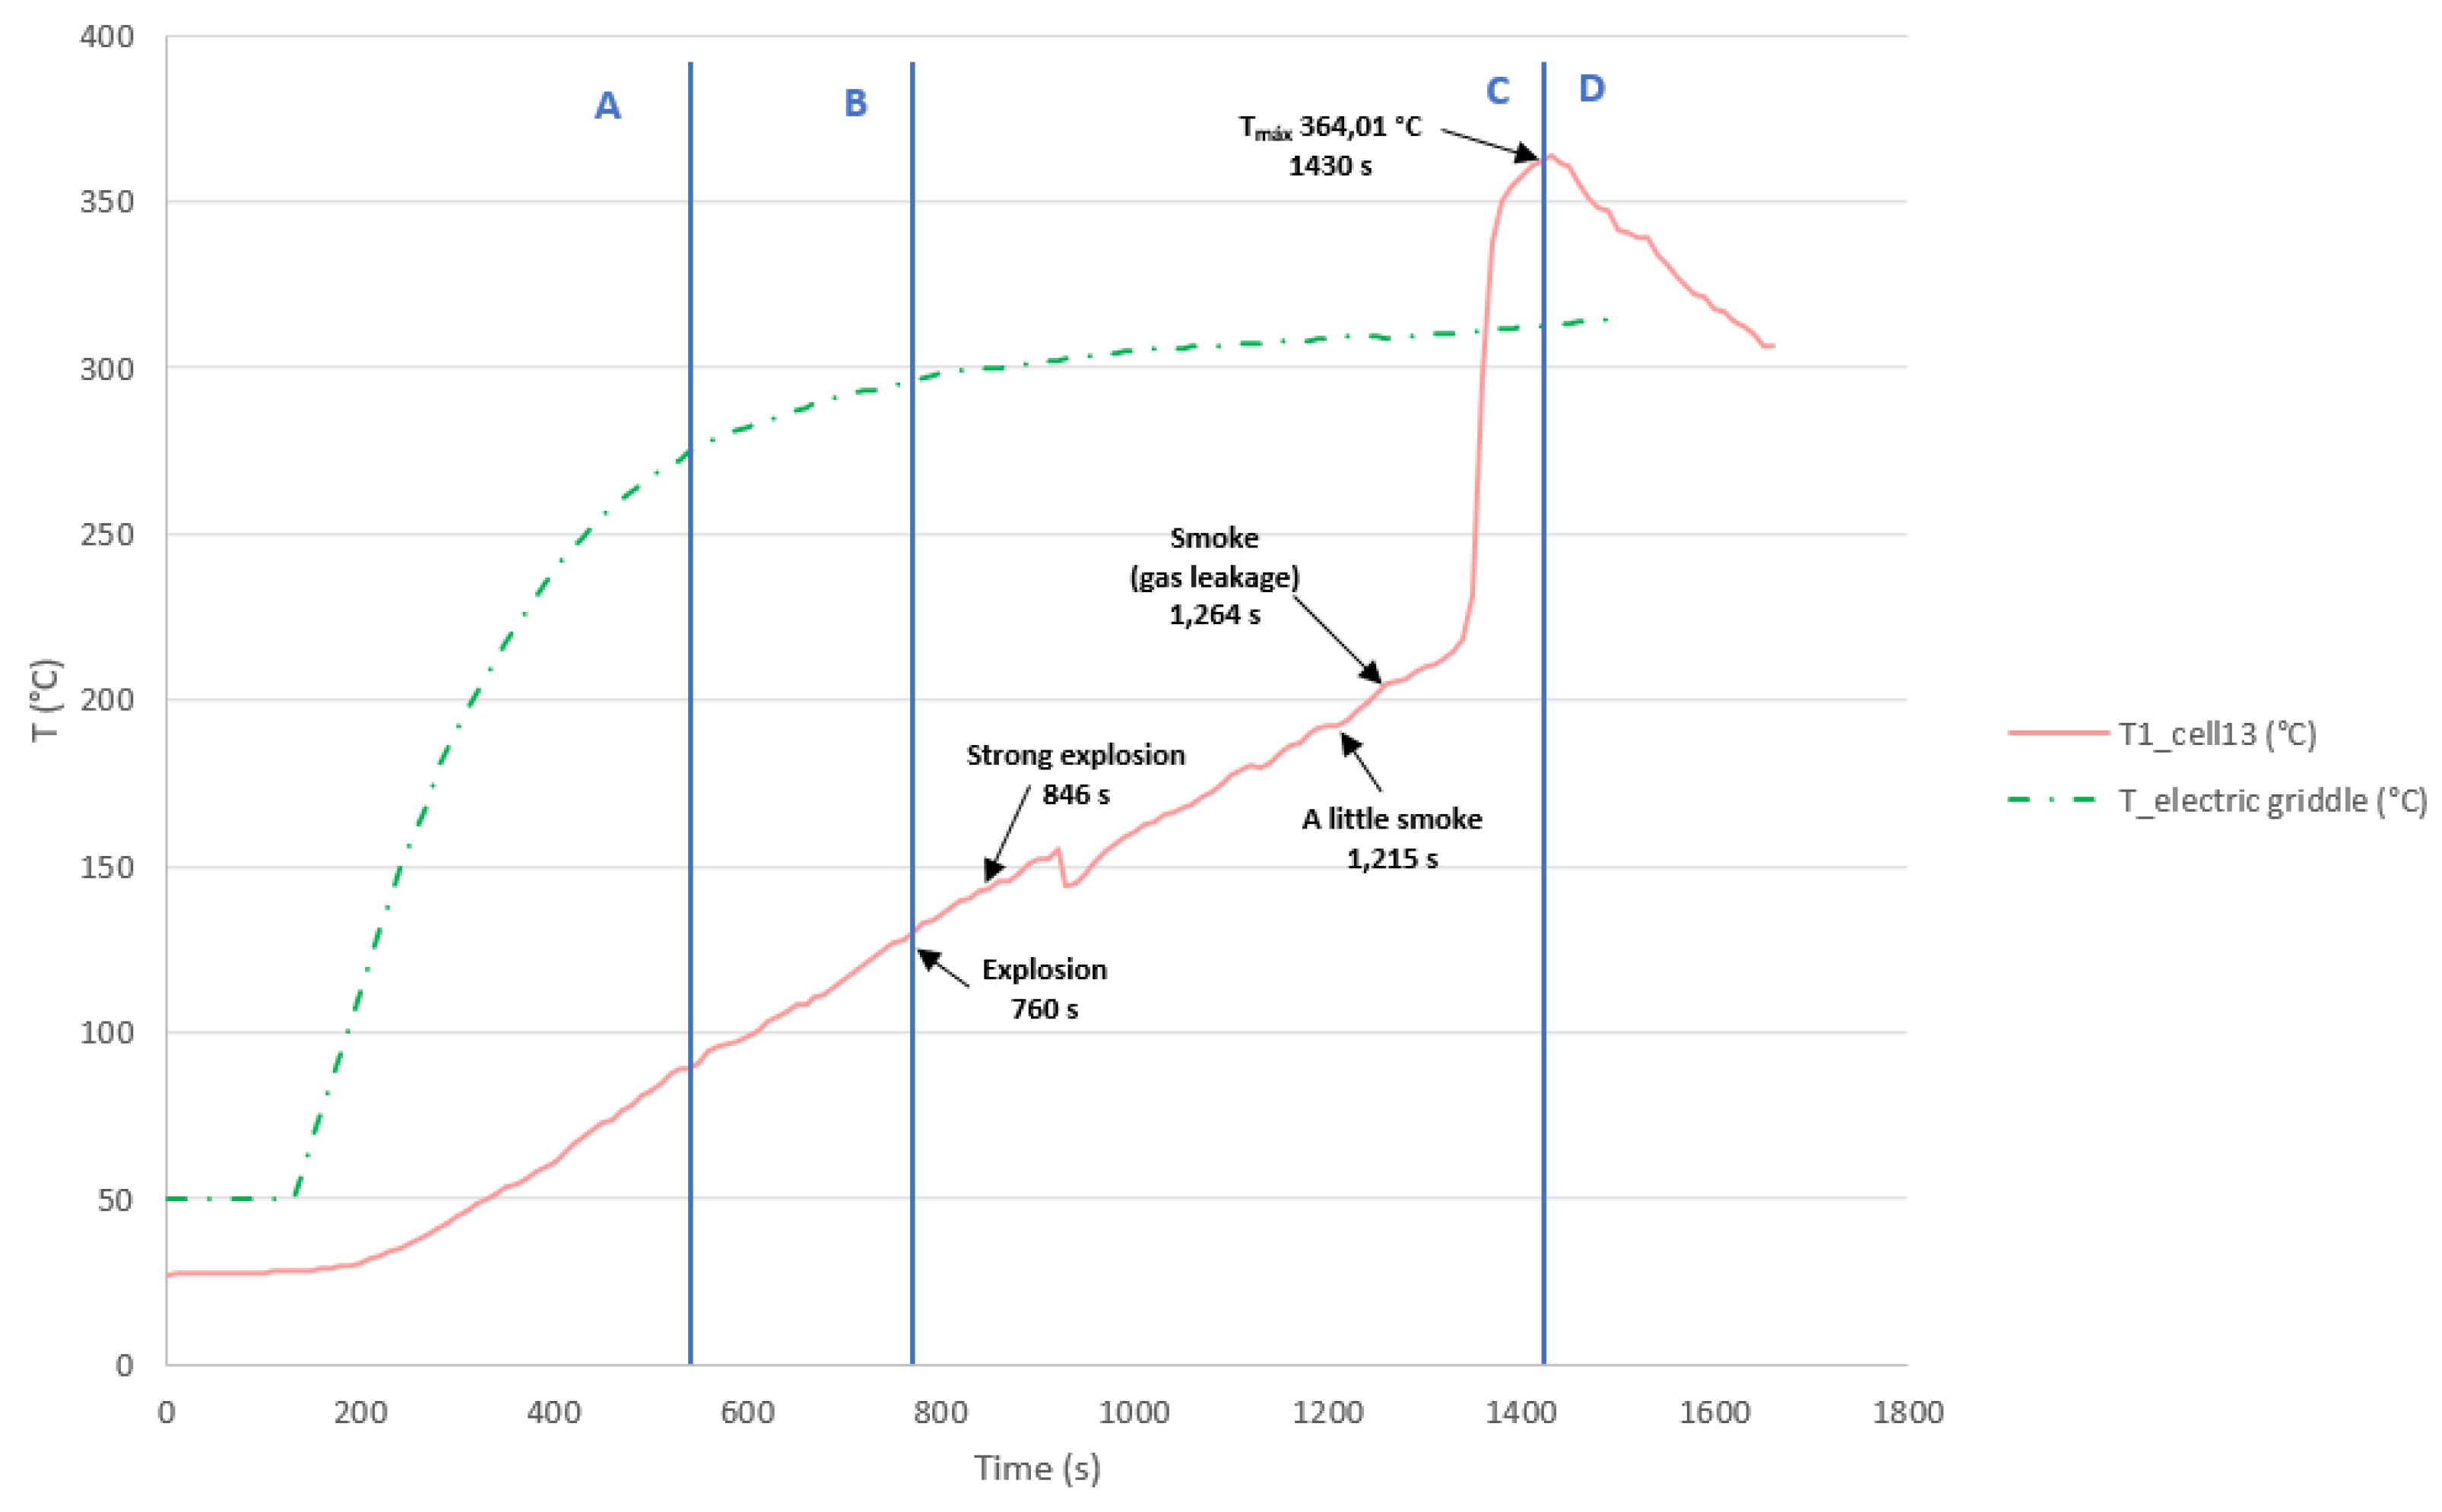
3.3.8. Test 8: Vertical, Series Connection and SoC 50% (Cell 13 (Below) and Cell 17)
The test is carried out on two 32700 cylindrical cells in vertical arrangement connected in series and each having a SoC of 50%. The type K thermocouple is placed on cell 17 to measure its temperature. Below are some images of the state the cells after carrying out the heating test (
Figure 50), the cell 13 is mor damaged than cell 17. Since it is the one that is most exposed to heat and is the one that experiences TR.
Bellow, it can be seen a graph (
Figure 51) with the temperature reached by the electric griddle and the temperature reached by the cell 13. In this test, the maximum temperature value reached in the case of cell 13 is 364.01 °C, during the TR process. If it is compared with the test in which the cells in a vertical arrangement connected in series have an SoC 100%, it is observed that in the case of SoC 100%, the maximum temperature reached is higher than in the case of SoC 50%.
A comparison of the temperature experienced by each of the cells tested shows that the cell with the highest temperature is cell 7 (test 4), therefore, the worst situation is that of test 4, vertical arrangement connected in parallel and with a SoC of 100%. On the other hand, the cell that reaches the lowest temperature during the test is cell 5 (test 7), so the best situation is that of test 7, horizontal arrangement, connected in series and with a SoC of 50%. As for the start of the TR, the first cell to start the TR is cell 11 (test 6) which is in horizontal arrangement, in parallel connection and with a SoC of 50%. As for the cell that takes the longest to start the TR, not considering the case of cell 4 of test 1, because it is not carried out in the same conditions, because it is not sheltered from the wind, the first cell to start the TR is cell 11 (test 6).because it is not sheltered from the wind, is cell 11 of test 5, with vertical arrangement and parallel connection, with a SoC of 50%. Conclusions can be drawn regarding the maximum temperature reached in the TR, but not regarding the time in which it is reached, since, as the tests are carried out at ambient temperature, this will influence the time in which the TR is reached.
The same specific instants corresponding to the most significant events will be identified for each of the cells tested. it can be concluded that in the same vertical arrangement and with the same SoC, the most dangerous connection is in parallel (the voltage is maintained, but the capacity is added), since in the case of parallel connection the cell placed on the thermal plate catches fire, while in the case of series connection it does not catch fire. On the other hand, regarding the influence of the state of charge, it can be deduced that in the same arrangement and with parallel connection, it is more dangerous for the cells to be at 100% SoC since, as has been observed in the tests analyzed, the fire is more intense in the case of 100% SoC than in the 50% state of charge.
On the other hand, it can be concluded that in the same horizontal arrangement and with the same SoC, the most dangerous connection is in parallel (the voltage is maintained, but the capacity is added), since in the case of parallel connection one of the cells catches fire, while in series connection it only catches fire in the case of a 100% SoC. On the other hand, regarding the influence of the state of charge, a conclusion cannot be drawn for the horizontal arrangement as clearly as for the vertical arrangement.
The transition from an initial internal short-circuit prior to thermal runaway can be observed visually through the appearance of sparks and open-circuit voltage fluctuations. This internal progression provides valuable information on the failure mechanism of an individual cell after a short circuit, which facilitates the development of new approaches to mitigate thermal propagation.
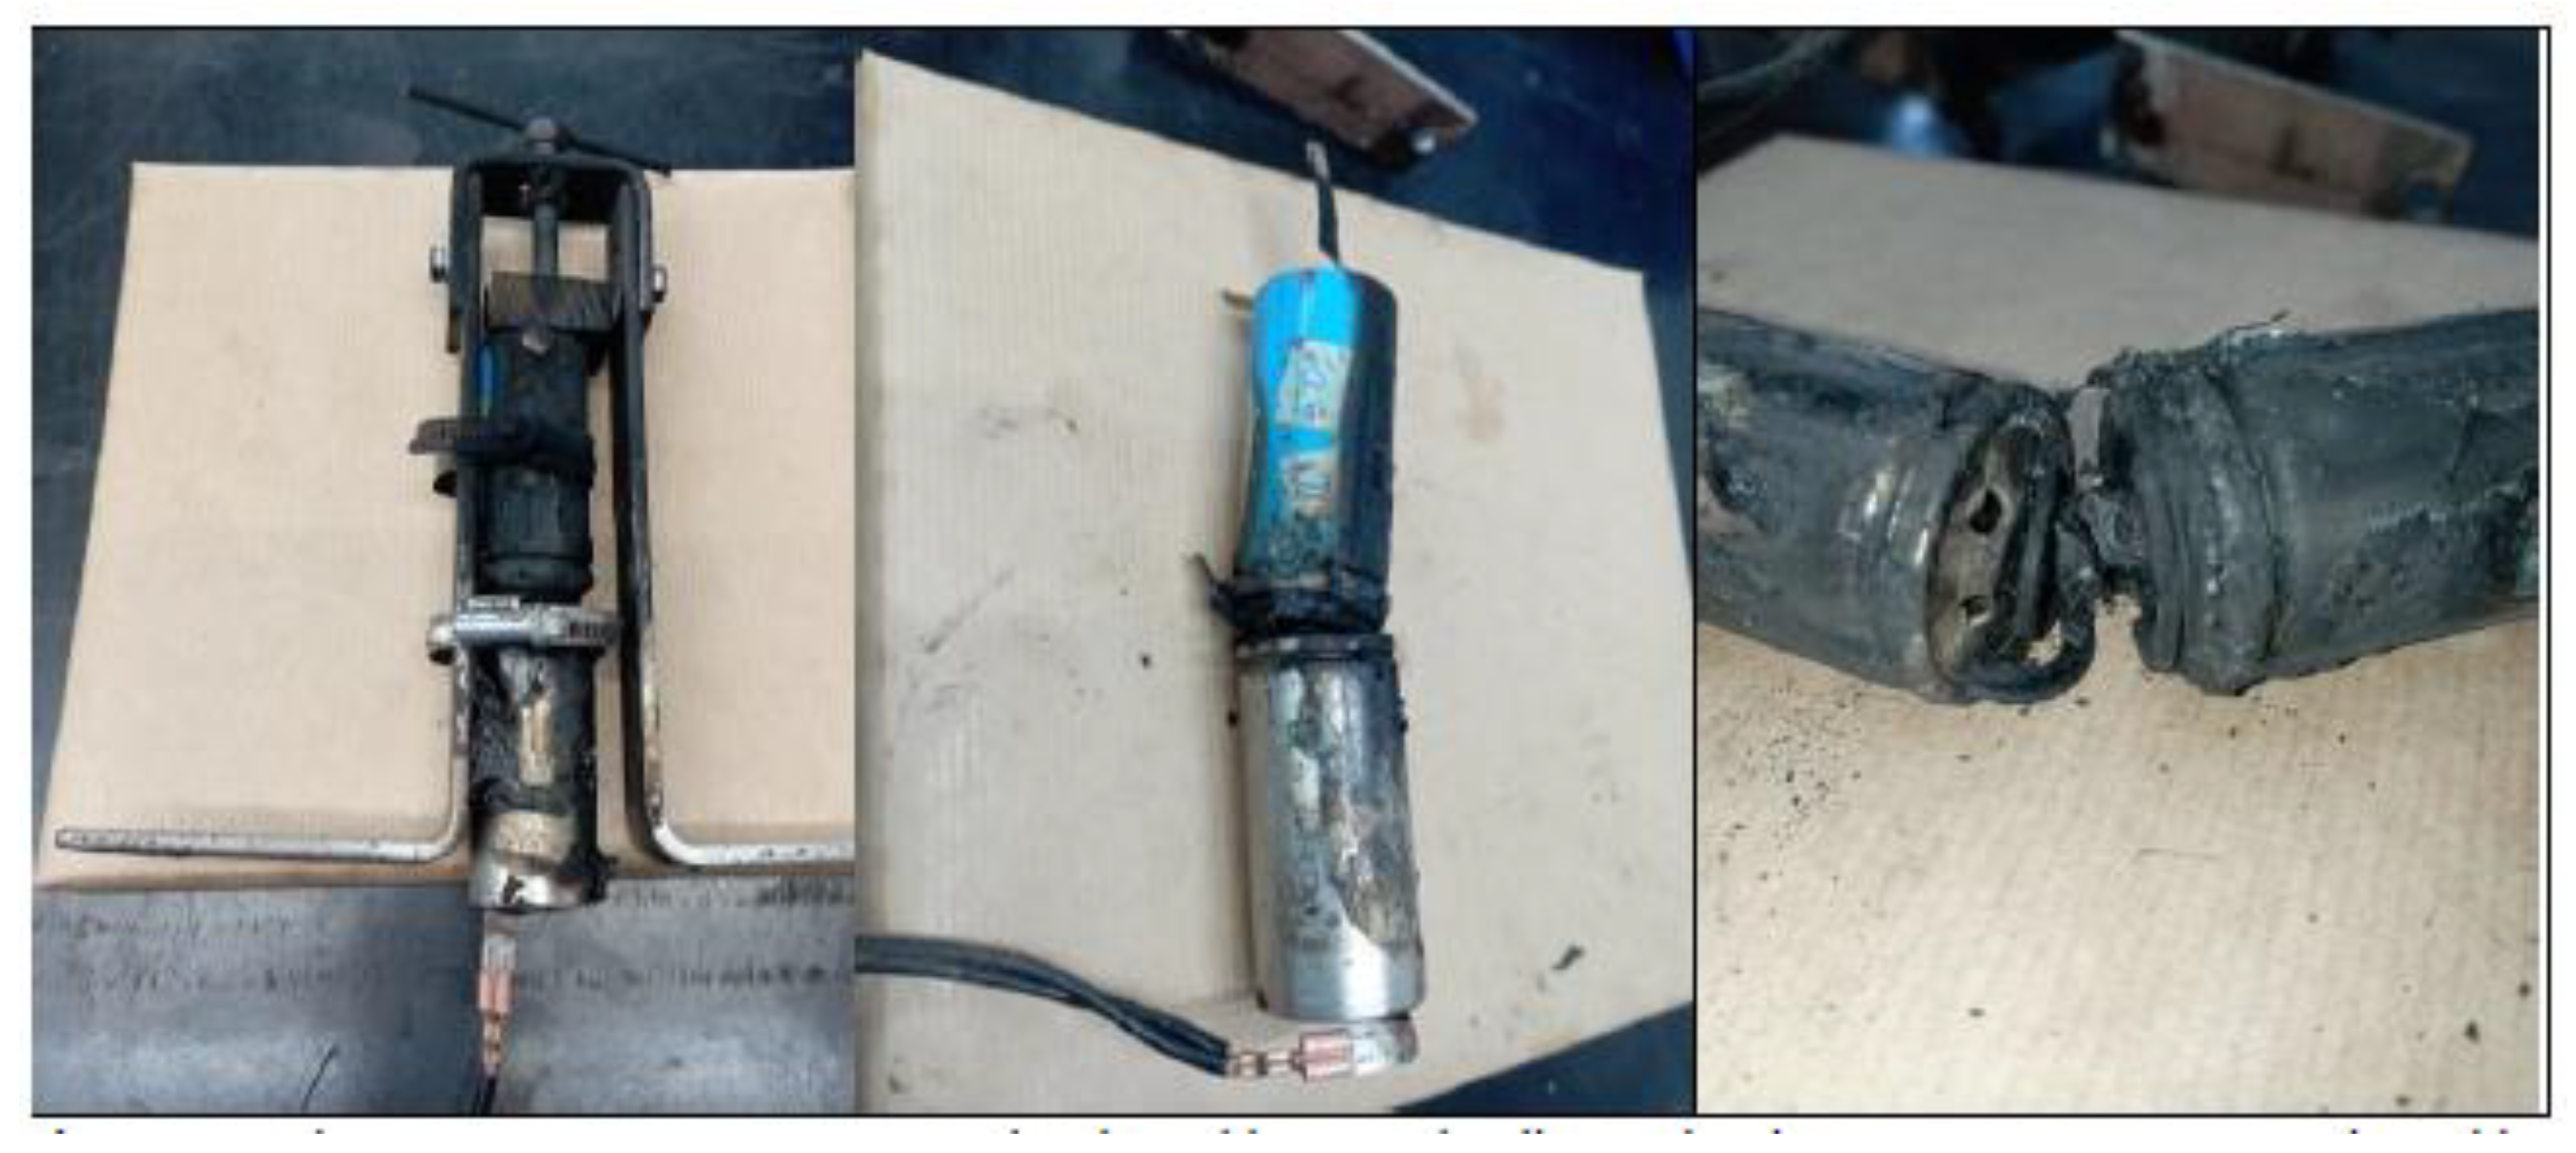
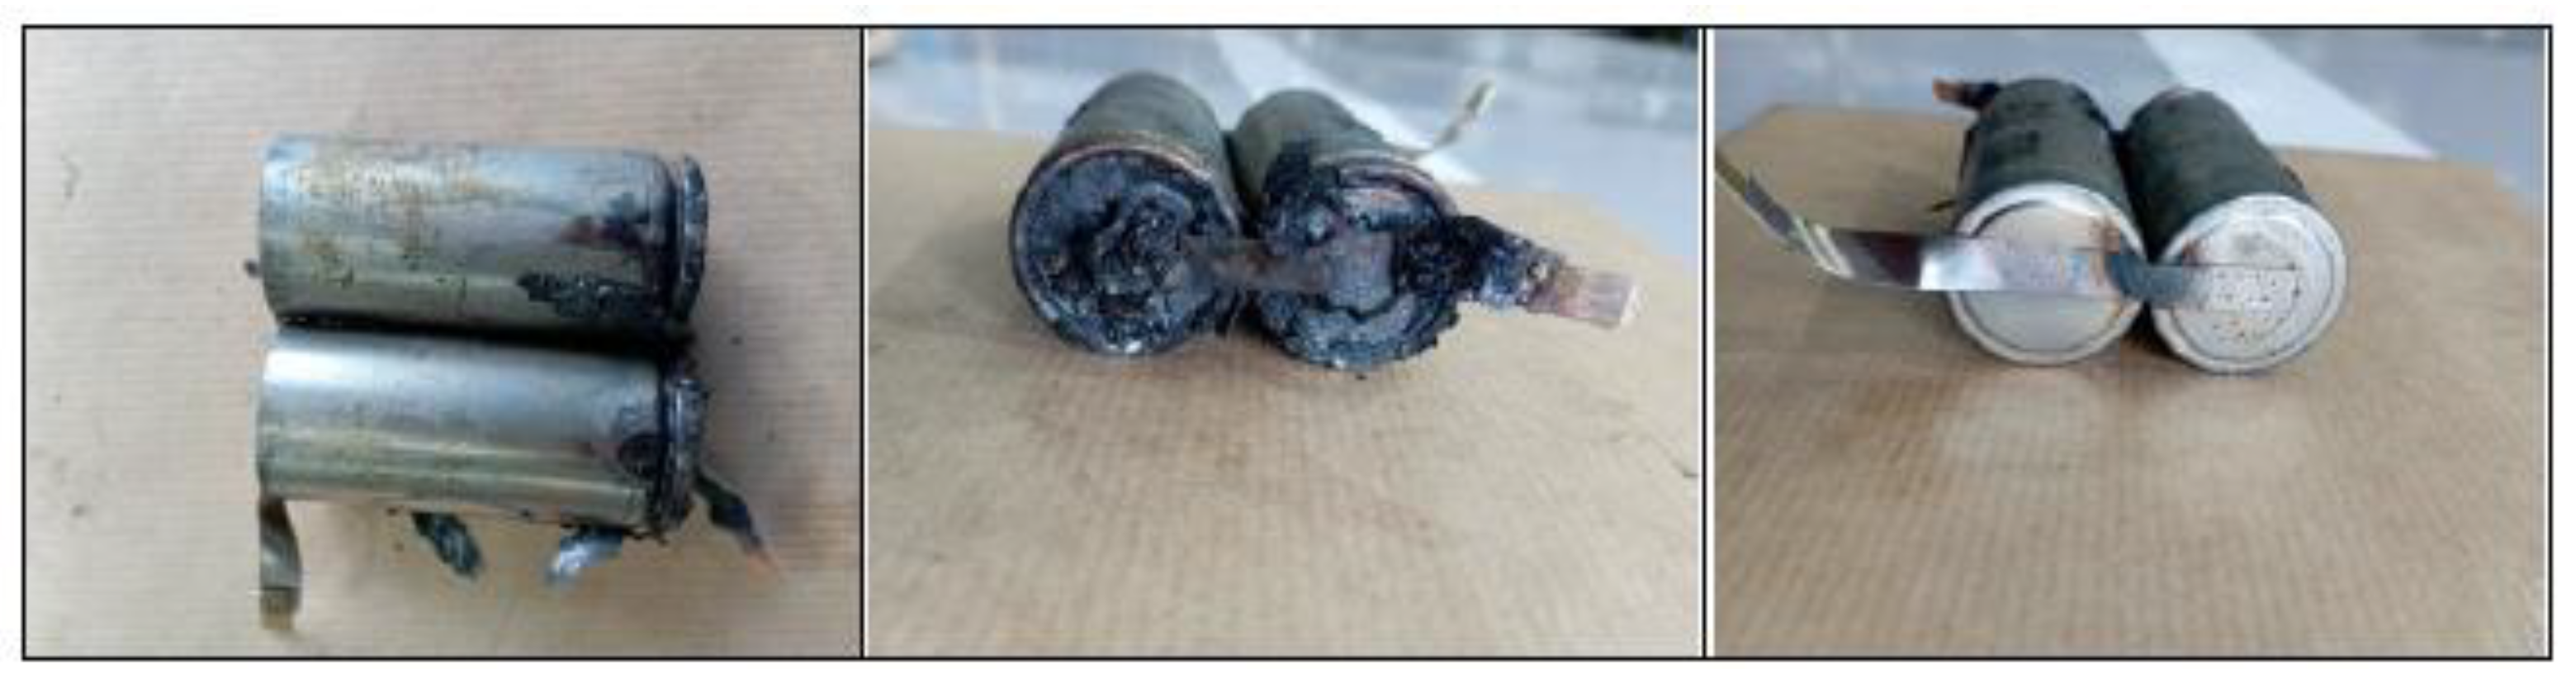
The heating tests resulted in venting of the cells and release of hot electrolyte. It should be noted that of all the cells tested, cell 11 (test 5, vertical arrangement, parallel connection SoC 50%) and cell 7 (test 4, vertical arrangement, parallel connection SoC 100%) caught fire, the fire in cell 7 being more intense, as the SoC is greater and therefore the energy stored is greater. The cells with horizontal arrangement also caught fire, but the fire was not as intense as in the vertical arrangement. Of the cells tested in horizontal arrangement, the one that experienced the most intense fire was cell 1 (test 6, horizontal arrangement, parallel connection SoC 50%).
The interior of a cylindrical cell consists of electrodes rolled up on themselves, thus making maximum use of space. In addition, they have a separator impregnated with electrolyte. When a lithium battery deteriorates internally, the chemical system inside it starts to form bubbles of oxygen, carbon dioxide and other gases. The condition of the cells after the thermal abuse test is shown below (
Figure 52).
It should be noted that, in the case of cylindrical cells, the temperature in the core of the battery is higher than on the surface. Whereas in the case of pouch cells or prismatic cells, the temperature is higher in the regions close to the flanges, at the positive terminal because this terminal has a higher conductivity due to aluminum instead of copper, then the heating spreads over a large part of the battery [
71].
The bottom one is selected vertically and the one which is apparently more damaged on the outside is selected horizontally, but it is found to be the most damaged on the inside.
The figure above (
Figure 52) shows that the loss of internal material in the cells due to the tests varies according to different experimental conditions. It is observed that there is more internal material melted in the case of cells with 100% SoC than in the case of cells with 50% SoC. In the case of 100% SoC, material ejection occurs with complete detachment of solid internal material, whereas in the case of 50% SoC, the amount of molten aluminum is very small.
Results from several studies [
72] show that gas venting and subsequent cell explosion occurs earlier for cells with higher SoC, while the energy released is slightly lower in cells with higher SoC. The earlier thermal runaway in the case of higher SoC may be due to the higher energy content in the cell and the higher amount of intercalated lithium available at the anode of the cell, where the first reactions take place. On the other hand, the lower energy release is due to incomplete reactions of the cell components.
Another study [
73] shows that the SoC influences the combustion behavior of a lithium-ion cell, as the energy stored in the cell plays an important role in the combustion process. Therefore, fully charged lithium-ion cells are more dangerous than not fully charged lithium-ion cells. The study also concludes that the cell surface temperature and peak HRR (Heat Release Rate) increase as the incident heat flux increases, while the time to ignition and time to explosion decrease. This study proposes future work to focus on the thermal behavior of a set of cells in a module where TR is triggered by thermal abuse.
Of all the elements that make up the lithium-ion cell, the elements most sensitive to temperature rise are the separator and the electrolyte. As the temperature rises to 130-150 °C, these materials become unstable and can produce more heat. In the case of a lithium-ion cell, if subjected to more than 150 °C, the separator melts and additional heating occurs due to the short-circuit between the electrodes and TR will start within minutes.
The severity of the TR depends on several factors such as cell SoC, ambient temperature, cell chemistry and cell design (size, electrolyte volume, etc.). Therefore, the most severe thermal reaction will occur when the cell has a SoC of 100% as it will have the highest electrical energy content [
72].
In the TR process, when there is a sharp drop in cell voltage, delamination of the electrodes occurs, followed by a sharp rise in the internal temperature of the cell, with the rate of heat production being greater than the rate of release. Charged lithium-ion cells can reach 600°C. The temperature of LFP cells is typically lower [
74]. This temperature increase is due to the reactions of the electrodes with the electrolyte and the release of stored energy. Some cathode materials decompose and may change structure resulting in the release of small amounts of oxygen which may be involved in internal cell reactions (leading for example to oxidation of the aluminum current collector). Any internal oxygen production will affect the internal reaction of the cell and the temperature of the cell housing but does not play a role in the flammability of the vent gases. The temperature increases lead to melting and decomposition of the separator and usually to melting of the aluminum current collector, which occurs at 660 °C. The liquid aluminum can be alloyed with the exposed copper inside the cell. Some copper-aluminum alloys have melting points as low as 548 °C, so damage to the internal copper collectors is possible. The TR temperatures do not reach values that cause melting of pure copper (1,080°C) or nickel or steel. The following
Figure 53 shows pictures of some of the cells tested which have undergone TR.
In the case of the vertical arrangement the copper collector remains intact and is covered with active materials, the aluminum collector disappears. In the case of the horizontal cell arrangement, the copper collector does not disappear, but it cannot be unwound in its entirety as in the vertical arrangement.
The onset temperature of the reactions for different chemistries and different cell charge states is the temperature at which the decomposition of the SEI begins and the cascade of reactions leading to TR takes place. It is observed that the higher the SoC, the earlier the SEI decomposition reactions start and the lower the starting temperature. For SoC values between 80 and 100 it is less clear, and the standard deviation is higher. In NMC cells the decomposition starts earlier than in NCA. The LFP cells, the subject of the tests, do not have a clear trend of SoC influence, generally the start of the decomposition reactions is at a higher temperature than in the rest of the chemistries, this is one of the reasons why they are safer. For all SoCs tested and all cell chemistries tested, the average onset temperature of the decomposition reactions was 113 °C and ranged from 81 °C to 151 °C [
75].
LFP cells react more slowly and at significantly higher temperatures to thermal abuse than other chemistries, making this cell chemistry considerably safer. LFP cells are less common but have recently gained prominence due to their increased safety [
76], which is why these cells have been tested in this thesis for their behavior under thermal abuse.
LFP cells have a reaction rate 3 orders of magnitude lower than other chemistries due to limited oxygen production [
77]. However, when an LFP cell is overcharged, the cathode does not have an overcharge reserve like NMC and NCA cells and is therefore irreversibly damaged earlier [
76].
It is concluded that as the SoC increases, the TR gravity increases, and the stability of the cell decreases. The SoC of the cell influences the heat released in kW, so depending on the SoC of the cells the behavior of the cells in case of failure is different. The main problem for first responders is that the SoC of the battery cannot be known.
4. Conclusions
In this article, it has been analyzed how the arrangement of the cells influences the evolution of the fire and the temperature gradient experienced by the cells. To this end, several controlled fire tests have been carried out at cell scale, which have enabled us to obtain the following conclusions depending on the type of test carried out.
The conclusions drawn from the tests carried out by mechanical abuse (perforation) are as follows:
- -
The tests for mechanical evaluation of a cell do not faithfully reproduce the conditions of failure but show the behavior of the cell under abusive conditions. It should be noted that cells are manufactured to be resistant or safe to some mechanical abuse, but it should be noted that a battery installed in a vehicle can suffer significant mechanical deformation during a traffic accident. The increasing number of electric vehicles on our roads may give more weight to the consideration of different modes of abusive mechanical failure.
- -
Therefore, it is important to understand the behavior of cells subjected to various mechanical abuse tests. Mechanical abuse techniques remain a widely accepted method for safety and evaluation of the response of lithium-ion cells to abuse. However, it should be noted that changes in test conditions and even changes in cell construction can result in significantly different responses. It is proposed as future lines of research to analyze the interdependence between test conditions and cell construction. Controlled and programmed mechanical abuse tests will be proposed to be able to control certain test parameters.
- -
The aim is to analyze how the cell structure influences the mechanical test and how the loading state of the cell influences the mechanical test.
- -
In the case of mechanical abuse by perforation tests, it is concluded that a certain level of damage to the internal components of the cell (electrodes) is necessary for the short-circuit to occur.
- -
It can be stated that, under the same mechanical abuse by perforation in a direction perpendicular to the longitudinal axis of the cell, the behavior of cells with higher SoC is more dangerous.
- -
Both from the final state of the cell and from the analysis of the ΔDCIR (mΩ), it can be stated that the cell that suffers greater damage and is more degraded and deteriorated is the cell with a SoC of 100% subjected to a perforation test in the direction of the longitudinal axis of the cell, in the negative pole. And the cell that suffers less damage and is less degraded is the cell subjected to a perforation test in the direction perpendicular to the longitudinal axis of the cell, with a SoC of 50%.
- -
It is concluded that the loading condition is one of the most influential factors in the occurrence of Thermal Runaway after mechanical abuse by perforation.
- -
It is therefore concluded that the worst case scenario for a failure due to mechanical abuse by perforation is that the cell/battery is 100% charged and that the perforation occurs in the direction of the longitudinal axis.
- -
After comparing the NMC cell and the LFP cell subjected to the same mechanical abuse by perforation, it is concluded that the NMC cell catches fire while the LFP cell does not, however the maximum temperature reached by the LFP cell is higher than that reached by the NMC cell, this may be due on the one hand to the fact that the tests were carried out at room temperature and on the day the LFP cell was tested, the ambient temperature was higher than that of the NMC cell. On the other hand, the fact that the maximum temperature reached is lower in the case of the LFP cell than in the case of the NMC cell could be since the cells tested by mechanical abuse by perforation have different diameters and there are studies that indicate that the size of the cells influences their behavior in the event of a thermal release. Therefore, a comparison should be made between NMC and LFP cells of the same diameter, subjected to the same perforation mechanical abuse test to analyze the temperature profile reached.
The conclusions drawn from the electrical abuse (overcharge) tests are as follows:
- -
It is deduced and verified that overcharging a battery results in an increase of its battery temperature. On the other hand, it is concluded that the higher the ambient temperature, the more dangerous the effects on the overcharged cell as the cell temperature is higher. Therefore, the environmental conditions in which a cell operates can affect the severity of a failure. From these tests it is concluded that overcharging an electric vehicle with a pouch cell battery pack (tested cells) at high temperatures, for example on a summer day at midday, is critical and dangerous. The same overcharge tests should be repeated at different ambient temperatures and with different cell types.
- -
After analyzing the two tests it is concluded that when the maximum voltage is reached due to the overcharge is when the maximum temperature is reached and when the maximum swelling of the two cells is reached.
- -
The results of the analysis of the overcharge tests with pouch cells give very important information from a safety point of view and can be useful to generate safe charging procedures for electric vehicle batteries to prevent possible dangerous misuse conditions.
The conclusions drawn from the tests carried out by thermal abuse (heating) are as follows:
- -
It is concluded that the loss of internal material of the cells due to thermal tests by heating is variable according to different experimental conditions. It is observed that more internal material is melted in the case of cells with 100% SoC than in the case of cells with 50% SoC. In the case of 100% SoC, material ejection occurs with complete detachment of solid internal material, whereas in the case of 50% SoC, the amount of molten aluminum is very small.
- -
The most dangerous situation for TR propagation due to thermal failure by heating is the vertical arrangement with the cells connected in parallel and with a 100% SoC. The safest situation is the horizontal arrangement with the cells connected in series and with a SoC of 50%.
- -
With the tests carried out, conclusions can be drawn regarding the maximum temperature reached in the TR but not regarding the time in which it is reached, as the tests are carried out at room temperature, which will influence the time in which the TR is reached. It is concluded that the ambient temperature will influence the propagation of the TR due to thermal failure by heating.
- -
LFP cells react more slowly and at significantly higher temperatures to thermal abuse than other chemistries, making this cell chemistry considerably safer.
Therefore, it is concluded that temperature is a crucial parameter, as overheating the battery can cause an exothermic reaction and destroy it completely. Also, overcharging the cell can compromise its internal structure, which highlights the importance of a properly functioning battery management system (BMS).
The state of charge (SoC) of a cell directly influences the heat emitted during a reaction: the higher the SoC, the greater the heat generated. Some lines of research are focusing on improving cell safety by developing new types of electrolytes that, in the event of overheating or overcharging, do not emit toxic compounds.
It is essential to design batteries for electric vehicles that can withstand extreme temperatures, overheating, high charge and discharge currents, low voltage due to high discharge (DoD, Depth of Discharge), overvoltage caused by overcharging, as well as shocks and impacts during collisions.
Following proper charging and discharging procedures (within the temperature and voltage ranges recommended by the manufacturer) will prolong the life of the battery and help to avoid potential hazards.
Figure 1.
Schematic of the Thermal Runaway processes in a Lithium Cobalt Oxide (LCO)/graphite cell [
4].
Figure 1.
Schematic of the Thermal Runaway processes in a Lithium Cobalt Oxide (LCO)/graphite cell [
4].
Figure 2.
Images of various deformed electric vehicles in a crash test. Source: Renault Zoe (at the top) [
44] and NIO EL6 (at the bottom) [
45].
Figure 2.
Images of various deformed electric vehicles in a crash test. Source: Renault Zoe (at the top) [
44] and NIO EL6 (at the bottom) [
45].
Figure 3.
Images of the overcharge test set-up (left) and image of the charger used to supply 10 A (DC) (right).
Figure 3.
Images of the overcharge test set-up (left) and image of the charger used to supply 10 A (DC) (right).
Figure 4.
Images of the electric griddle instrumented with a PID-controlled thermostat, used for the heating tests.
Figure 4.
Images of the electric griddle instrumented with a PID-controlled thermostat, used for the heating tests.
Figure 5.
Image of the set-up of the perforation test with sharp element on the side of a cell with 100% SoC.
Figure 5.
Image of the set-up of the perforation test with sharp element on the side of a cell with 100% SoC.
Figure 6.
Images of the state of cell A after the test are shown, where the perforation it has undergone can be clearly seen.
Figure 6.
Images of the state of cell A after the test are shown, where the perforation it has undergone can be clearly seen.
Figure 7.
Temperature and voltage of cell A (SoC 100%) as a function of time, during the mechanical abuse test, in which it is subjected to a perforation in a direction perpendicular to the longitudinal axis of the cell until a short circuit.
Figure 7.
Temperature and voltage of cell A (SoC 100%) as a function of time, during the mechanical abuse test, in which it is subjected to a perforation in a direction perpendicular to the longitudinal axis of the cell until a short circuit.
Figure 8.
Image of damage to A cell tested for mechanical abuse by perforation in the direction perpendicular to the longitudinal axis of the cell.
Figure 8.
Image of damage to A cell tested for mechanical abuse by perforation in the direction perpendicular to the longitudinal axis of the cell.
Figure 9.
Images of the main events experienced by cell A (SoC 100%) during the mechanical abuse test (perforation in a direction perpendicular to the longitudinal axis of the cell).
Figure 9.
Images of the main events experienced by cell A (SoC 100%) during the mechanical abuse test (perforation in a direction perpendicular to the longitudinal axis of the cell).
Figure 10.
Images of the main events experienced by cell A (SoC 100%) during the mechanical abuse test (perforation in a direction perpendicular to the longitudinal axis of the cell).
Figure 10.
Images of the main events experienced by cell A (SoC 100%) during the mechanical abuse test (perforation in a direction perpendicular to the longitudinal axis of the cell).
Figure 11.
Temperature and voltage of cell D (SoC 50%) as a function of time, during the mechanical abuse test, in which it is subjected to a perforation in a direction perpendicular to the longitudinal axis of the cell until a short circuit.
Figure 11.
Temperature and voltage of cell D (SoC 50%) as a function of time, during the mechanical abuse test, in which it is subjected to a perforation in a direction perpendicular to the longitudinal axis of the cell until a short circuit.
Figure 12.
Image of damage to cell D (SoC 50%) tested for mechanical abuse by perforation in the direction perpendicular to the longitudinal axis of the cell.
Figure 12.
Image of damage to cell D (SoC 50%) tested for mechanical abuse by perforation in the direction perpendicular to the longitudinal axis of the cell.
Figure 13.
Images of the main events experienced by cell D (SoC 50%) during the mechanical abuse test (perforation in a direction perpendicular to the longitudinal axis of the cell).
Figure 13.
Images of the main events experienced by cell D (SoC 50%) during the mechanical abuse test (perforation in a direction perpendicular to the longitudinal axis of the cell).
Figure 14.
Image of the set-up of the perforation test with sharp element on the negative pole are of a cell with a SoC of 100 %.
Figure 14.
Image of the set-up of the perforation test with sharp element on the negative pole are of a cell with a SoC of 100 %.
Figure 15.
Images are shown of the state of cell C after the test, where the perforation it has undergone can be clearly seen.
Figure 15.
Images are shown of the state of cell C after the test, where the perforation it has undergone can be clearly seen.
Figure 16.
Temperature and voltage of cell C (SoC 0%) as a function of time, during the mechanical abuse test, in which it is subjected to a perforation in a direction of the longitudinal axis of the cell until a short circuit.
Figure 16.
Temperature and voltage of cell C (SoC 0%) as a function of time, during the mechanical abuse test, in which it is subjected to a perforation in a direction of the longitudinal axis of the cell until a short circuit.
Figure 17.
Image of the damage in cell C tested for mechanical abuse by perforation in the direction of the longitudinal axis of the cell.
Figure 17.
Image of the damage in cell C tested for mechanical abuse by perforation in the direction of the longitudinal axis of the cell.
Figure 18.
Images of the main events experienced by cell C (SoC 100%) during the mechanical abuse test (perforation in the direction of the longitudinal axis of the cell).
Figure 18.
Images of the main events experienced by cell C (SoC 100%) during the mechanical abuse test (perforation in the direction of the longitudinal axis of the cell).
Figure 20.
Images of the main events experienced by cell B (SoC 50%) during the mechanical abuse test (perforation in the direction of the longitudinal axis of the cell).
Figure 20.
Images of the main events experienced by cell B (SoC 50%) during the mechanical abuse test (perforation in the direction of the longitudinal axis of the cell).
Figure 21.
Qualitative comparison of the final state of the tested cells (analyzing their exterior).
Figure 21.
Qualitative comparison of the final state of the tested cells (analyzing their exterior).
Figure 22.
Qualitative comparison of the final state of the tested cells (analyzing their interior).
Figure 22.
Qualitative comparison of the final state of the tested cells (analyzing their interior).
Figure 23.
Comparison of the temperature reached by the cells during the tests to which they have been subjected.
Figure 23.
Comparison of the temperature reached by the cells during the tests to which they have been subjected.
Figure 24.
Comparison of the voltage behavior of the cells during the tests to which they have been subjected.
Figure 24.
Comparison of the voltage behavior of the cells during the tests to which they have been subjected.
Figure 25.
Image of the set-up of the perforation test with sharp element on the negative pole are of a cell NMC with a SoC of 100 %.
Figure 25.
Image of the set-up of the perforation test with sharp element on the negative pole are of a cell NMC with a SoC of 100 %.
Figure 26.
Qualitative comparison of the damage in the NMC cell (left) with the damage in the LFP cell (cell C) (right), tested by mechanical abuse by perforation in the direction of the longitudinal axis of the cell.
Figure 26.
Qualitative comparison of the damage in the NMC cell (left) with the damage in the LFP cell (cell C) (right), tested by mechanical abuse by perforation in the direction of the longitudinal axis of the cell.
Figure 27.
Images of the main events experienced by the NMC cell (SoC 100%) during the mechanical abuse test (perforation in the direction of the cell longitudinal axis).
Figure 27.
Images of the main events experienced by the NMC cell (SoC 100%) during the mechanical abuse test (perforation in the direction of the cell longitudinal axis).
Figure 28.
Temperature of NMC cell (SoC 100%) and cell C (LFP, SoC 100%) perforated in the direction of the longitudinal axis of the cell to the short-circuit.
Figure 28.
Temperature of NMC cell (SoC 100%) and cell C (LFP, SoC 100%) perforated in the direction of the longitudinal axis of the cell to the short-circuit.
Figure 29.
Temperature profile reached by the pouch cells subjected to the overcharge test, for ambient temperature of 40 °C and 25 °C.
Figure 29.
Temperature profile reached by the pouch cells subjected to the overcharge test, for ambient temperature of 40 °C and 25 °C.
Figure 30.
Image of the pouch cell in its original state to be used in the overcharge tests.
Figure 30.
Image of the pouch cell in its original state to be used in the overcharge tests.
Figure 31.
State of pouch cell 1 (left) and pouch cell 2 (right) at the instant of maximum swelling, when the power supply is switched off.
Figure 31.
State of pouch cell 1 (left) and pouch cell 2 (right) at the instant of maximum swelling, when the power supply is switched off.
Figure 32.
State of pouch cell 1 (left) and pouch cell 2 (right) at the instant of maximum swelling, after switching off the power supply.
Figure 32.
State of pouch cell 1 (left) and pouch cell 2 (right) at the instant of maximum swelling, after switching off the power supply.
Figure 33.
Final steady state of the pouch 1 and pouch 2 cell one day after the overcharge test.
Figure 33.
Final steady state of the pouch 1 and pouch 2 cell one day after the overcharge test.
Figure 34.
The first image shows the two cells with the tooling used to prevent them from moving during the test. The second and third images show the condition of the cells after test 1.
Figure 34.
The first image shows the two cells with the tooling used to prevent them from moving during the test. The second and third images show the condition of the cells after test 1.
Figure 35.
Cell 4 temperature (solid line) because of heating when placed on the electric griddle.
Figure 35.
Cell 4 temperature (solid line) because of heating when placed on the electric griddle.
Figure 36.
Images of the state of the cells after the test 2, positioned with a fixture so that it does not move during test.
Figure 36.
Images of the state of the cells after the test 2, positioned with a fixture so that it does not move during test.
Figure 37.
Temperature of cell 5 and cell 6 (solid lines) because of heating when placed on the electric griddle (Test 2).
Figure 37.
Temperature of cell 5 and cell 6 (solid lines) because of heating when placed on the electric griddle (Test 2).
Figure 38.
The first image shows the two cells before the test with the tooling used to prevent the cells from moving during the test. The second and third images show the condition of the cells after the test 3.
Figure 38.
The first image shows the two cells before the test with the tooling used to prevent the cells from moving during the test. The second and third images show the condition of the cells after the test 3.
Figure 39.
Temperature of cell 9 (solid line) because of heating when placed on the electric griddle (Test 3).
Figure 39.
Temperature of cell 9 (solid line) because of heating when placed on the electric griddle (Test 3).
Figure 40.
The first image shows the two cells on the electric griddle with the tooling used to prevent the cells from moving during the test. The second and third images show the condition of the cells after the test 4.
Figure 40.
The first image shows the two cells on the electric griddle with the tooling used to prevent the cells from moving during the test. The second and third images show the condition of the cells after the test 4.
Figure 41.
Temperature of cell 7 (solid line) because of heating when placed on the electric griddle (Test 4).
Figure 41.
Temperature of cell 7 (solid line) because of heating when placed on the electric griddle (Test 4).
Figure 42.
Image of the cells with an SoC of 50%, placed with a tool in a vertical arrangement and connected in parallel on the electric griddle, before the starting the heating test.
Figure 42.
Image of the cells with an SoC of 50%, placed with a tool in a vertical arrangement and connected in parallel on the electric griddle, before the starting the heating test.
Figure 43.
The first image shows the two cells with the tooling used to prevent the cells from moving during the test. The second and third images show the state of the cells after the test 5.
Figure 43.
The first image shows the two cells with the tooling used to prevent the cells from moving during the test. The second and third images show the state of the cells after the test 5.
Figure 44.
Temperature of cell 11 (solid line) because of heating when placed on the electric griddle (Test 5).
Figure 44.
Temperature of cell 11 (solid line) because of heating when placed on the electric griddle (Test 5).
Figure 45.
Image of the cells with an SoC of 50%, placed with a tool in a horizontal arrangement and connected in parallel on the electric griddle, before the starting the heating test.
Figure 45.
Image of the cells with an SoC of 50%, placed with a tool in a horizontal arrangement and connected in parallel on the electric griddle, before the starting the heating test.
Figure 46.
The first image shows the two cells seen from above, the second image shows the upper part of the cells (where the vent valve is located) and the third image shows the lower part of the cells.
Figure 46.
The first image shows the two cells seen from above, the second image shows the upper part of the cells (where the vent valve is located) and the third image shows the lower part of the cells.
Figure 47.
Temperature of cell 1 (solid line) because of heating when placed on the electric griddle (Test 6).
Figure 47.
Temperature of cell 1 (solid line) because of heating when placed on the electric griddle (Test 6).
Figure 48.
The first image shows the two cells seen from above, the second image shows the upper part of one of the cells (where the vent valve is located) and the third image shows the upper part of other of the cells.
Figure 48.
The first image shows the two cells seen from above, the second image shows the upper part of one of the cells (where the vent valve is located) and the third image shows the upper part of other of the cells.
Figure 49.
Temperature of cell 15 (solid line) because of heating when placed on the electric griddle (Test 7).
Figure 49.
Temperature of cell 15 (solid line) because of heating when placed on the electric griddle (Test 7).
Figure 50.
The first image shows the two cells seen from above, the second image shows the lower part of the cell 13 and the third image shows the upper part of other of the cell 17 (where the vent valve is located).
Figure 50.
The first image shows the two cells seen from above, the second image shows the lower part of the cell 13 and the third image shows the upper part of other of the cell 17 (where the vent valve is located).
Figure 51.
Temperature of cell 13 (solid line) because of heating when placed on the electric griddle (Test 8).
Figure 51.
Temperature of cell 13 (solid line) because of heating when placed on the electric griddle (Test 8).
Figure 52.
Final state of the cells after thermal abuse tests by heating, after removal of the top cover.
Figure 52.
Final state of the cells after thermal abuse tests by heating, after removal of the top cover.
Figure 53.
Final state of tested cell 7 (Test 4: vertical arrangement parallel connection SoC 100%) (left) and final estate of tested cell 10 (Test 3: horizontal arrangement parallel connection SoC 100%) (right).
Figure 53.
Final state of tested cell 7 (Test 4: vertical arrangement parallel connection SoC 100%) (left) and final estate of tested cell 10 (Test 3: horizontal arrangement parallel connection SoC 100%) (right).
Table 2.
Specifications of mechanical tests carried out on cylindrical cells with different load states and at different test points.
Table 2.
Specifications of mechanical tests carried out on cylindrical cells with different load states and at different test points.
| Cell tested |
Location of perforation |
State of Charge, SoC (%) |
| 32700 Cylindrical |
Lateral zone |
100 |
| 32700 Cylindrical |
Lateral zone |
50 |
| 32700 Cylindrical |
Upper zone |
100 |
| 32700 Cylindrical |
Upper zone |
50 |
Table 3.
Specifications overcharge tests carried out on pouch cells with different ambient temperatures.
Table 3.
Specifications overcharge tests carried out on pouch cells with different ambient temperatures.
| Cell tested |
Crate
|
SoC (%) |
Tamb (°C) |
| Pouch cell |
1/5.6 C |
100 |
Aprox 40 °C |
| Pouch cell |
1/5.6 C |
100 |
Aprox 25 °C |
Table 4.
Specifications heating tests carried out on cylindrical cells at different states of charge with different types of connection.
Table 4.
Specifications heating tests carried out on cylindrical cells at different states of charge with different types of connection.
| Cell tested |
Layout |
Type of connection |
State of Charge (SoC %) |
| 32700 Cylindrical |
Horizontal |
2 connected in parallel |
100 % |
| 32700 Cylindrical |
Horizontal |
2 connected in parallel |
50 % |
| 32700 Cylindrical |
Horizontal |
2 connected in series |
100 % |
| 32700 Cylindrical |
Horizontal |
2 connected in series |
50 % |
| 32700 Cylindrical |
Vertical |
2 connected in parallel |
100 % |
| 32700 Cylindrical |
Vertical |
2 connected in parallel |
50 % |
| 32700 Cylindrical |
Vertical |
2 connected in series |
100 % |
| 32700 Cylindrical |
Vertical |
2 connected in series |
50 % |
Table 5.
Results of mechanical tests carried out on cylindrical cells with different charge states and at different test points.
Table 5.
Results of mechanical tests carried out on cylindrical cells with different charge states and at different test points.
| Cell tested |
Place where the perforation takes place |
State of Charge (SoC %) |
Time in which the TR takes place |
Temperature at which the test is carried out (Tamb) |
32700 Cylindrical
Cell A |
Side area |
100 |
210 s |
39 °C |
32700 Cylindrical
Cell A |
Side area |
50 |
80 s |
45 °C |
32700 Cylindrical
Cell C |
Upper area |
100 |
75 s |
44 °C |
32700 Cylindrical
Cell B |
Upper area |
50 |
140 s |
28 °C |
Table 6.
Comparison of measured direct current internal resistance (DCIR) for cells subjected to mechanical abuse test.
Table 6.
Comparison of measured direct current internal resistance (DCIR) for cells subjected to mechanical abuse test.
| Test |
Start of the test (mΩ) |
End of the test (mΩ) |
∆DCIR (mΩ) |
| Test 1_cell A Horizontal SoC 100% |
7.199 |
1,145 |
1,137.80 |
| Test 2_cell D Horizontal SoC 50% |
7.280 |
953.3 |
946.02 |
| Test 3_cell C Vertical SoC 100% |
6.986 |
2,320 |
2,313.014 |
| Test 4_cell B Vertical SoC 50% |
7.500 |
1,505 |
1,497.500 |
Table 7.
Technical specification of the NMC cell used in the longitudinal direction perforation test of such a cell.
Table 7.
Technical specification of the NMC cell used in the longitudinal direction perforation test of such a cell.
Table 8.
Specifications overcharge tests carried out on pouch cells at different ambient temperatures.
Table 8.
Specifications overcharge tests carried out on pouch cells at different ambient temperatures.
| Cell tested |
Crate
|
State of Charge (SoC %) |
Tamb
|
Maximum cell temperature Tmax
|
| Pouch Cell |
1/5.6 C |
100 |
40 °C |
62.30 °C |
| Pouch Cell |
1/5.6 C |
100 |
25 °C |
43.92 °C |
Table 9.
Comparison of the measured direct current internal resistance (DCIR) for pouch cells subjected to overcharge test.
Table 9.
Comparison of the measured direct current internal resistance (DCIR) for pouch cells subjected to overcharge test.
| Test |
Start of the test (mΩ) |
End of the test (mΩ) |
∆DCIR (mΩ) |
| Test 1_pouch cell 1 Tamb= 40 °C |
1.61 |
191.4 |
189.79 |
| Test 2_pouch cell 2 Tamb= 25 °C |
1.52 |
50.62 |
49.10 |