
Submitted:
20 June 2023
Posted:
21 June 2023
You are already at the latest version
Abstract
Thermal safety of lithium-ion traction batteries is a highly concerned issue in the field of electric transportation. The large amount of gas emission during the thermal runaway process of batteries has highly safety hazards such as fire and explosion. Quantitative analysis of emission is one of the important challenges for testing and evaluating battery safety. Focus on quantifying the gas emission through large-scale thermal propagation in battery modules and packs, based on the idea of cell result multiplication, this article conducts thermal runaway emission analysis on single cell and modules, and compares the behavior of thermal runaway and gas emission of the cell and module from the aspects of temperature, pressure, gas composition and battery morphology. The feasibility of the cell result multiplication method was verified from the perspective of experimental data.
Keywords:
Lithium-ion battery
; thermal runaway
; gas emission
; cell result multiplication
1. Introduction
The global inventory of new energy vehicles has exceeded 20 million, with lithium-ion traction batteries as the predominant energy storage system for electric vehicles (EVs) [1,2,3]. Despite rapid technological advancements, traction battery technologies still face many challenges to meet the requirements of the next generation of electric transportation. Some of these challenges include enhancing energy density, cycle life, and recyclability [4,5]. Safety stands as one of the most significant factors affecting consumers' choice of electric vehicles, considering that fire accidents caused by traction batteries in EVs occur occasionally [6,7,8]. To overcome these challenges, researchers must continue prioritizing safety, while aiming to improve battery performance and sustainability [9,10].
Despite the current electrochemical system of lithium-ion batteries, there is still a risk of thermal runaway. Limiting safety risks within a controllable range is an urgent problem to solve. Thermal runaway and thermal propagation represent typical failure behaviors of lithium-ion batteries that create a barrier to the widespread application of EVs [11,12,13]. When there is an internal short circuit or another situation that causes heat accumulation, a series of chain reactions can occur, including the decomposition of the solid electrolyte interface (SEI), separator breakage, electrolyte combustion, cathode and anode material thermal decomposition, and more [14,15,16]. These heat generation reactions also involve the emission of gases such as CO, CO2, H2, and CH4, as well as the release of a large amount of smoke [17,18]. It is crucial to identify and address these risks to enhance the safety of lithium-ion batteries and increase their accessibility for various applications.
From an electric vehicle driver safety perspective, developing traction batteries that do not experience thermal runaway or can suppress thermal propagation through active/passive strategies is critical for safety technologies [19,20]. Achieving this goal requires extensive research on the thermal runaway and thermal propagation behavior of batteries. As the group that first proposed the concept of thermal runaway propagation, we have conducted numerous investigations on the impact of SOC, abuse, damage, and other factors on the thermal safety of batteries [21,22,23]. Our studies have included mechanism analyses of thermal runaway processes based on simulation methods, such as those conducted by Ouyang et al [24]. In addition, other researchers, like Al-Hallaj et al., have investigated the use of phase change materials to block thermal propagation [25]. These studies have highlighted the importance of analyzing battery emissions after thermal runaway, as it is integral to quantitatively assessing disaster hazards after battery failure and establishing corresponding safety testing methods [26,27,28]. Through a collaborative effort by researchers and organizations, we can enhance the safety of lithium-ion batteries used in electric vehicles, ultimately supporting the sustainable development of transportation systems worldwide.
The accurate quantification of battery thermal runaway emissions poses a significant challenge due to the intense reaction during the process and the complex underlying mechanism Galushkin et al. undertook a detailed analysis of the gas generated by lithium-ion batteries of different chemistries under a range of aging or abuse conditions (including cycling, overcharging, and heating), employing GC-MS and FTIR [29,30,31]. Baird et al. focused on the potential explosion hazards associated with battery gas generation, and Wang et al. investigated the dynamic changes in gas generation combustibility [32,33]. However, it is worth noting that these research topics concentrate primarily on the cell level, leaving the task of quantifying emissions for batteries beyond the module level yet to be satisfactorily resolved [34,35,36]. When thermal runaway and thermal propagation occur at the module level, the gases emitted from different battery cells in series or parallel bring composition and content factors into play, and larger-scale thermal propagation escalates the risk of fire and explosion. This presents significant challenges to conducting emission research at the module and pack levels, which call for continued research efforts and close collaborative engagement between researchers and other stakeholders to enhance the safety of lithium-ion batteries used in electric vehicles.
Currently, the establishment of larger sealed test chambers is the most popular direction for research on quantifying thermal runaway emissions. This method is highly feasible for expanding emission testing from the monomer level to the module level. Nonetheless, due to the current utilization of traction batteries without modular structures, such as Cell to Pack or Cell to Chassis, it is challenging to quantify emissions at a higher level. This is because conducting emission tests at the system level using sealed test chambers requires significant investment costs and poses greater safety risks, for instance, the risk of gas explosions. Therefore, further research and development of safer and cheaper methods for assessing the gas emissions of these batteries at a higher level are needed in the near future.
The cell result multiplication method can be used to estimate the total emission of a module or pack based on the consistency of battery cells in the module or pack. This method observes the number of failed cells and thermal propagation tests to determine the emission level at the cell level, which is then converted to estimate the total emission of the module or pack. However, there is currently no research report on the validity of this method.
To verify the Cell Result Multiplication (CRM) method theoretically, we conducted an analysis of the thermal runaway emission pressure, composition, and battery failure morphology between a cell and three series modules of a nickel cobalt manganese lithium battery. The research results indicate that this method is highly feasible for cells with sufficient thermal runaway. The difference between individual gas production and average gas production between modules only has a small percentage difference, and the main components of gas production also have a high degree of consistency. Overall, the CRM method has potential to be an effective way to estimate the total emission of a module or pack, but further research is needed to validate its use for other battery types and configurations.
2. Experimental Section
Battery information: A square shell lithium-ion battery with a rated capacity of 42 Ah was selected for this experiment. The chemistry of the battery sample is LiNi1/3Co1/3Mn1/3O2-based cathode and graphite-based anode, with a working voltage range of 2.75-4.2 V.
Thermal failure test chamber: We developed a battery thermal failure test chamber to conduct gas emission analysis of the heating thermal runaway of cells and modules. The chamber has a maximum working pressure of 2 MPa and a content volume of 80 L, with an inner diameter of 600 mm. The chamber body features 8 external testing channels, 2 copper terminals, exhaust ports, and sampling ports. To monitor the heating, temperature, and pressure of the battery during the experiment, we equipped the thermal runaway test chamber with gas pressure sensors and battery temperature and voltage sensors. The heating strip is positioned in the center of the battery surface, and its heating, temperature, and pressure are monitored through the device's reserved port. The test device also features a dedicated port for gas discharge, allowing us to extract gas samples through a gas sampling bag after the thermal runaway reaction is complete.
Gas composition analysis: For gas emission quantification of batteries after thermal runaway, we used high-temperature gas collection bags to sample the gas and used gas chromatography with thermal conductivity detector (TCD) and flame ionization detector (FID) for the quantitative analysis of gas composition.
CT information: X-ray computed tomography (X-ray CT) was conducted using a Nano Voxel 5000 instrument (Sanying Precision, China) with an operating voltage of 300 kV.
3. Result and Discussion
This experiment utilized a batch of lithium-ion traction batteries with a rated capacity of 42 Ah. The cathode's active material is LiNi1/3Co1/3Mn1/3O2, while the anode's active material is graphite. Figure 1a displays the battery sample's image. The experiment used batteries from the same batch, ensuring battery performance consistency and equivalent test results for all samples. Each battery cell underwent three 1C charge-discharge cycles before the test to maintain consistency in battery status. Figure 1b represents the capacity-voltage curve of the battery sample for both charging and discharging processes. The battery undergoes two charging stages: constant current and constant voltage. The charging capacity during the constant current stage is 40.26 Ah, while that in the constant voltage stage is 1.09 Ah. The discharge process utilizes a constant current mode, with a discharge capacity of 41.33 Ah. The battery efficiency surpasses 99.95% in this cycle, indicating satisfactory charge and discharge states.
To gain a better understanding of the test sample's internal structure, computer tomography was performed on the battery sample, as exhibited in Figure 2. The battery's internal structure is visible, and we used an YZ-axis cross-section of the fresh battery as an example to explain the findings. Typically, X-ray CT imaging is more responsive to high-density materials, like the anode's Cu current collector and the cathode's active materials. These materials show high contrast in the image and appear brighter than others. Conversely, the active materials of the anode and the cathode's aluminum current collector have lower density and display a darker colored region with lower contrast in the image. As a result of its lower density, the separator is barely visible in the X-CT images.
Upon analyzing the CT image of a single battery cell, we observed that the battery's interior comprises two parallel coiled cells. The internal coil core features a regular layered structure, with no safety risks such as wrinkles or fractures that could trigger thermal runaway of the battery. Figure 2b depicts the overall structural diagrams of the battery cell's front side. The battery cell's internal electrode structure is flat, without any anomalies such as metal objects or misalignment of electrode.
The battery thermal failure test chamber, as presented in Figure 3, was utilized to observe the battery's thermal runaway and emission process. The equipment comprises main components, including the chamber, flow meter, chamber temperature sensor, pressure sensor, battery temperature sensor, battery voltage sensor, data acquisition system, and computer. The test was conducted in a sealed mode, whereby all valves, such as the pressure inside the chamber, average temperature within the chamber, and temperature and voltage of the tested battery shell, were directly measured during the test. According to the ideal gas state equation, the gas mass flow can be calculated, thus estimating the battery gas emission based on the provided data.
Concerning the testing process details, we placed a heating element at the battery's center, and the required sensors were extended to the outside via the chamber's pre-set port, with data collection done by a data collector. The battery was heated at a constant power of 300 W to trigger thermal runaway. Figure 3c,d illustrate the temperature and pressure alterations during the thermal runaway process.
As illustrated in Figure 3c, the black curve displays the temperature change during the thermal runaway process of the battery, while the blue curve shows the rate at which temperature changes. From the figure, we can discern two stages of temperature rise in the battery. The first stage lasts approximately 415s with a slow temperature increase. During this stage, the fluctuation in temperature change rate may be attributed to the internal reactions within the battery, causing interior temperature differences. The second stage follows after 415s, characterized by a rapid increase in the battery's temperature, hitting a maximum value of 643 ℃ in 587s. Notably, the highest temperature change rate occurs at the 416s, indicating a severe state of thermal runaway, with a maximum temperature rise rate of 63 ℃ s-1.
Figure 3d displays the pressure change in the test chamber during the battery's thermal runaway process. From the graph, there is a clear observation that before the 415s second, the pressure within the chamber was stable, gradually increasing at a rate of about 0.1 kPa s-1. However, we can determine based on the temperature change in the battery during this period that there was no emission. Rather, the increase in pressure was due to heating and the consequent rise in ambient gas temperature. After 415s, the pressure significantly rose within 14 seconds, measuring a maximum value of 98.6 kPa. It is noteworthy that the highest pressure increase rate occurred in the 422s (13.7 kPa s-1), serving as an indication of the severe thermal runaway of the battery. Thereafter, the pressure gradually decreased, with minimal emission after the first 14 seconds of the process. Concurrently, the gas pressure in the chamber averaged, leading to a drop in pressure at the measured point. By combining the temperature and pressure changes of the battery cell samples during the thermal runaway process, we can comprehend the entire evolutionary process of thermal runaway.
To gain insight into the battery thermal runaway process and emission, we performed simulations. We constructed a 3D geometric model of cell thermal runaway and gas emission within a test chamber, as depicted in Figure 4. The chamber and battery cell parameters were consistent with those in our experiment, with the supporting structure of the cell being simplified. We divided the above geometric model into a pure polyhedral unstructured mesh that has higher generation efficiency than pure hexahedral structured mesh and pure tetrahedral unstructured mesh. This mesh has fewer meshes and higher mesh quality under the same unit scale. To ensure accurate calculations of flow and heat transfer during the simulation, we arranged six boundary layers on the chamber wall, and the thickness of the first layer of the boundary layer was determined using the smooth transition offset method, with a growth rate of 1.2. Figure 4a,b shows the grid of the boundary layer around the cell. We defined a volume mesh size to obtain a high-quality unstructured mesh of 754000 mesh elements, 3.075 million nodes, a minimum orthogonal mass of 0.18, and a maximum aspect ratio of 2.
Concerning physical models, the simulation model is governed by the continuity equation, N-S equation, and energy equation, with the turbulence model being SST k-ω model. The average gas emission rate and transient temperature are computed based on the ideal gas state equation and test results. We utilized a pressure-based solver and a Coupled algorithm, resulting in a second-order implicit discretization of the time term of the control equation and second-order upwind discretization of the spatial term. The simulation physical time was set to 20 seconds, with the first 14.1 seconds representing the thermal runaway gas emission process, using a time step of 0.01 seconds, and a maximum of 20 iteration steps for each time step. We defined the temperature monitoring points as shown in the following figure and monitored the volume weighted average gas pressure within the sealed chamber.
Having established the aforementioned simulation model, we conducted simulations of the battery sample's thermal runaway process. Simulation results of gas emission velocity, temperature, and pressure during the thermal runaway process at 1, 5, 10, and 15 seconds are presented in Figure 5, Figure 6 and Figure 7. During the first three-time points, gas was emitting, while in the 15th second, it was in a state where the emission had just ended.
From Figure 5, it can be seen that the different colors in the figure represent the velocity at different positions inside the thermal runaway test chamber during the emission process. The center serves as the cross-section, and the small black arrows indicate the velocity direction. At 1 second, the image reveals the highest gas velocity located at the pressure relief valve, with a speed of 22.45 m s-1, which gradually decreases vertically. Due to the chamber's cylindrical structure and vertical upward ejection process, a turbulent flow of velocity circulation forms around the chamber. This process persists until 14 seconds of the eruption, at which point the gas flow rate in the chamber abruptly declines, with the maximum speed reducing to 0.62 m s-1, situated above the chamber. This marks the process whereby the gas in the test chamber progressively returns to uniformity following the cessation of the emission source.
Figure 6 demonstrates the simulation results of pressure inside the thermal runaway test chamber. From a pressure distribution perspective, the gas emission barely impacts the pressure difference in the test chamber. Apart from the slightly higher relief valve nozzle and chamber top, other parts remain stable. However, the average pressure continually increases during the gas emission process. This outcome is consistent with the actual test pressure transformation pattern throughout the thermal runaway process. Additionally, no local pressure accumulation point is formed in the test chamber. As the gas eruption process terminates at approximately 15 seconds, the pressure steadily approaches equilibrium.
Figure 7 depicts the temperature simulation outcomes in the thermal runaway test chamber. The emission of high-temperature gas causes significant temperature changes inside the chamber. The initial temperature was 25 ℃, which gradually increased to approximately 170 ℃ during the eruption process. The temperature distribution clearly shows the gas diffusion process. To indicate temperature changes within the tank effectively, we chose five points from which to output temperature curves over time, as illustrated in Figure 8. T1 represents the temperature at the eruption point, which shows a rapid rise from 113 ℃ to 225 ℃ within 2 seconds and then increased gradually to 309 ℃ within the following 12 seconds. T2 and T4 are temperature points along the gas emission path, exhibiting temperature trends similar to T1, with temperatures of 213 ℃ and 182 ℃, respectively. T3, located nearer to the chamber's inner wall and at the same height as T2 showed more pronounced temperature fluctuations, owing to the continuous exchange of high and low temperature gases during gas emission. Unlike T3, T5 showed a more stable temperature increase trend, with temperature fluctuation occurring mainly from 10 seconds to 14 seconds, the end of the emission process. At the 14th second, the temperatures of T3 and T5 were 145 ℃ and 157 ℃, respectively, indicating similar temperatures. Simulating the velocity, pressure, and temperature data during the thermal runaway gas emission process enables us to attain a comprehensive understanding of the dynamic changes during this process.
In addition to single cells, we conducted thermal runaway testing on a module consisting of three identical cells. The initial state of each battery cell was adjusted to be the same as that of the single cell test, with a SOC of 100%. We numbered the cells 1#-3# from left to right. For the thermal propagation test, we placed the same heating plate in the center of the surface of cell 1# and heated it with 300 W of heating power. We conducted temperature monitoring on each battery cell, as shown in Figure 9a. The red, black, and blue curves correspond to the temperatures of cells 1#-3# respectively. According to the red curve, the time for thermal runaway of cell 1# was approximately 400 seconds, and the maximum temperature for thermal runaway was 676 ℃, which was very close to the thermal runaway result of the single cell test. The time for thermal runaway of cells 2# and 3# was 421 seconds and 463 seconds, respectively, with the highest temperature of thermal runaway being 586 ℃ and 428℃, respectively. The heat generated by the thermal runaway of the first cell initiated the thermal propagation of cells 2# and continued to trigger the thermal propagation of cell 3#. The pressure in the test chamber during the thermal runaway and thermal propagation process is shown in Figure 9b. The graph clearly depicts the three stages of pressure rise and fall, corresponding to the thermal runaway and thermal propagation processes of the three cells over time. The pressure inside the environmental chamber increased by 171.7 kPa (calculated based on the stabilized pressure) during the entire thermal failure process. From the curve, we observe that these pressure increases can be distinctly identified and attributed to the thermal runaway process of the three battery cells, being 60.7 kPa, 57.6 kPa, and 53.4 kPa, respectively. According to the ideal gas equation, the gas production pressure is proportional to the gas emission. Based on this understanding, we conclude that the gas produced by the three electric cores during the thermal runaway process was relatively similar.
The presented study employed computed tomography (CT) to observe the internal structure of a module that underwent thermal runaway testing, shown in Figure 10. Figure 10b illustrates the cross-sectional image of cell 1#, where the electrode's structure exhibits a mottled shape due to high-temperature baking. Remarkably, the middle part of the battery cell presents a black area, marked by red in the figure, which is the primary zone for thermal runaway emission. Notably, the emission of high-temperature gas near the pressure relief valve can almost entirely destroy this area. Thus, this area is also marked on the lateral view (see Figure 10c) and the bottom view (see Figure 10d) for proper positioning. Inspection of the right-side structure in cell 1# reveals an inward concave shape, whereas cell 2# displays a concave structure on the right and convex on the left. Both sides of cell 3# exhibit a convex state, as illustrated in Figure 10c. Based on morphology, we can analyze the thermal runaway process. The convex morphology on both sides of cell 1# is the result of the thermal runaway generated in that cell. During the thermal runaway of cell 2#, it squeezed the right side of cell 1#, causing it to concave. Similarly, cell 3#'s thermal runaway formed compression on the right side of cell 2#. This progression of morphology is clearly observed in Figure 9d.
To determine whether the gas emission during the thermal runaway process of the battery cell and module is consistent, we performed an analysis of its primary components. The gas emitted by the battery cell and module underwent GC testing for component analysis, using TCD and FID detectors. Results (Table 1) indicate that CO, CO2, and H2 are the primary components generating gas, consistent with previous studies. The gas composition of both the cell and module shows high consistency. To better understand the other components, we conducted mass spectrometry (MS) analysis of the gas produced by the module (Table 2), as sample shortages prevented their analysis in the cell. MS testing of the gas samples revealed the presence of organic compounds with a carbon count of five and more. These results suggest that these compounds result from an incomplete electrolyte combustion, which exist primarily in a liquid state at room temperature, and only become detectable when mixed into the gas during high-temperature conditions.
4. Conclusion
In summary, we assessed the gas emission of a single cell and module of the same battery type during thermal runaway, considering temperature, gas pressure, and gas composition. Our findings suggest that the cell result multiplication method is generally workable when thermal runaway triggering conditions are consistent. Nevertheless, due to differences in temperature, environment, and other factors, gas production content and rate among the cells may exhibit some deviation during thermal runaway and thermal propagation. Notably, our analysis indicates that particularly in the initial emission process of thermal runaway - which accounts for a significant portion of gas emission - cell consistency is relatively high. Hence, this method is practical for evaluating gas production throughout the entire process, particularly in the face of several thermal runaway modules involving battery cells or battery systems.
6. Patents
This section is not mandatory but may be added if there are patents resulting from the work reported in this manuscript.
Funding
The authors appreciate financial supports from National Key R&D Program of China (2021YFB2501500), Young Elite Scientists Sponsorship Program by CAST (2021QNRC001), Key R&D Program of Tianjin (20JCZDJC00520).
References
- Li, M.; Lu, J.; Chen, Z.; Amine, K. 30 Years of Lithium-Ion Batteries. Adv Mater 2018, 30, e1800561. [Google Scholar] [CrossRef]
- Axsen, J.; Kurani, K.S. Developing sustainability-oriented values: Insights from households in a trial of plug-in hybrid electric vehicles. Global Environmental Change 2013, 23, 70–80. [Google Scholar] [CrossRef]
- Wu, Y.; Zhang, L. Can the development of electric vehicles reduce the emission of air pollutants and greenhouse gases in developing countries? Transportation Research Part D: Transport and Environment 2017, 51, 129–145. [Google Scholar] [CrossRef]
- Sureth, A.; Moll, V.; Nachtwei, J.; Franke, T. The golden rules of ecodriving? The effect of providing hybrid electric vehicle (HEV) drivers with a newly developed set of ecodriving-tips. Transportation Research Part F: Traffic Psychology and Behaviour 2019, 64, 565–581. [Google Scholar] [CrossRef]
- Zubi, G.; Dufo-López, R.; Carvalho, M.; Pasaoglu, G. The lithium-ion battery: State of the art and future perspectives. Renewable and Sustainable Energy Reviews 2018, 89, 292–308. [Google Scholar] [CrossRef]
- Yan, X.; Zhang, L.; Lu, J. Improve safety of high energy density LiNi1/3Co1/3Mn1/3O2/graphite battery using organosilicon electrolyte. Electrochimica Acta 2019, 296, 149–154. [Google Scholar] [CrossRef]
- Wang, Q.; Jiang, L.; Yu, Y.; Sun, J. Progress of enhancing the safety of lithium ion battery from the electrolyte aspect. Nano Energy 2019, 55, 93–114. [Google Scholar] [CrossRef]
- Jiang, L.; Wang, Q.; Sun, J. Electrochemical performance and thermal stability analysis of LiNi(x)Co(y)Mn(z)O(2) cathode based on a composite safety electrolyte. J Hazard Mater 2018, 351, 260–269. [Google Scholar] [CrossRef]
- Mathieu, O.; Grégoire, C.M.; Turner, M.A.; Mohr, D.J.; Alturaifi, S.A.; Thomas, J.C.; Petersen, E.L. Experimental investigation of the combustion properties of an average thermal runaway gas mixture from li-ion batteries. Energy & Fuels 2022, 36, 3247–3258. [Google Scholar] [CrossRef]
- Liu, B.; Jia, Y.; Li, J.; Yin, S.; Yuan, C.; Hu, Z.; Wang, L.; Li, Y.; Xu, J. Safety issues caused by internal short circuits in lithium-ion batteries. Journal of Materials Chemistry A 2018, 6, 21475–21484. [Google Scholar] [CrossRef]
- Borenstein, A.; Strauss, V.; Yoonessi, M.; Kaner, R.B. Silicon expansion at the service of safety–A reversible potential-dependent switch for safer batteries. Materials today energy 2018, 10, 89–97. [Google Scholar] [CrossRef]
- Gerelt-Od, B.; Kim, J.; Shin, E.; Kang, H.; Kim, N.; Jo, C.; Son, H.; Yoon, S. In situ Raman investigation of resting thermal effects on gas emission in charged commercial 18650 lithium ion batteries. Journal of Industrial and Engineering Chemistry 2021, 96, 339–344. [Google Scholar] [CrossRef]
- Chen, S.; Wang, Z.; Wang, J.; Tong, X.; Yan, W. Lower explosion limit of the vented gases from Li-ion batteries thermal runaway in high temperature condition. Journal of Loss Prevention in the Process Industries 2020, 63, 103992. [Google Scholar] [CrossRef]
- Golubkov, A.W.; Fuchs, D.; Wagner, J.; Wiltsche, H.; Stangl, C.; Fauler, G.; Voitic, G.; Thaler, A.; Hacker, V. Thermal-runaway experiments on consumer Li-ion batteries with metal-oxide and olivin-type cathodes. Rsc Advances 2014, 4, 3633–3642. [Google Scholar] [CrossRef]
- Yang, H.; Bang, H.; Amine, K.; Prakash, J. Investigations of the exothermic reactions of natural graphite anode for Li-ion batteries during thermal runaway. J Electrochem Soc 2004, 152, A73. [Google Scholar] [CrossRef]
- Liu, H.; Wei, Z.; He, W.; Zhao, J. Thermal issues about Li-ion batteries and recent progress in battery thermal management systems: A review. Energy conversion and management 2017, 150, 304–330. [Google Scholar] [CrossRef]
- Chen, Y.; Liu, N.; Jie, Y.; Hu, F.; Li, Y.; Wilson, B.P.; Xi, Y.; Lai, Y.; Yang, S. Toxicity identification and evolution mechanism of thermolysis-driven gas emissions from cathodes of spent lithium-ion batteries. ACS Sustainable Chemistry & Engineering 2019, 7, 18228–18235. [Google Scholar] [CrossRef]
- Zhang, J.; Zhang, L.; Sun, F.; Wang, Z. An overview on thermal safety issues of lithium-ion batteries for electric vehicle application. Ieee Access 2018, 6, 23848–23863. [Google Scholar] [CrossRef]
- Wu, T.; Chen, H.; Wang, Q.; Sun, J. Comparison analysis on the thermal runaway of lithium-ion battery under two heating modes. J Hazard Mater 2018, 344, 733–741. [Google Scholar] [CrossRef]
- Finegan, D.P.; Darcy, E.; Keyser, M.; Tjaden, B.; Heenan, T.M.M.; Jervis, R.; Bailey, J.J.; Vo, N.T.; Magdysyuk, O.V.; Drakopoulos, M.; et al. Identifying the Cause of Rupture of Li-Ion Batteries during Thermal Runaway. Adv Sci (Weinh) 2018, 5, 1700369. [Google Scholar] [CrossRef]
- Introduction on thermal propagation Study in China. Available online: https://wiki.unece.org/display/trans/EVS+6th+session.
- Ma, T.; Chen, L.; Liu, S.; Zhang, Z.; Xiao, S.; Fan, B.; Liu, L.; Lin, C.; Ren, S.; Wang, F. Mechanics-morphologic coupling studies of commercialized lithium-ion batteries under nail penetration test. Journal of Power Sources 2019, 437, 226928. [Google Scholar] [CrossRef]
- Liu, S.; Xu, D.; Ma, T.; Wei, Z.; Lin, C.; Bai, G.; Gao, X.; Shen, J.; Huang, W.; Wang, F. Thermal safety studies of high energy density lithium-ion batteries under different states of charge. International journal of Energy research 2020, 44, 1535–1545. [Google Scholar] [CrossRef]
- Li, W.; Wang, H.; Zhang, Y.; Ouyang, M. Flammability characteristics of the battery vent gas: A case of NCA and LFP lithium-ion batteries during external heating abuse. J Energy Storage 2019, 24, 100775. [Google Scholar] [CrossRef]
- Wilke, S.; Schweitzer, B.; Khateeb, S.; Al-Hallaj, S. Preventing thermal runaway propagation in lithium ion battery packs using a phase change composite material: An experimental study. Journal of Power Sources 2017, 340, 51–59. [Google Scholar] [CrossRef]
- Larsson, F.; Bertilsson, S.; Furlani, M.; Albinsson, I.; Mellander, B.-E. Gas explosions and thermal runaways during external heating abuse of commercial lithium-ion graphite-LiCoO2 cells at different levels of ageing. Journal of power sources 2018, 373, 220–231. [Google Scholar] [CrossRef]
- Milien, M.S.; Hoffmann, J.; Payne, M.; Lucht, B.L. Effect of electrolyte additives on Li4Ti5O12 cycling performance and gas evolution. J Electrochem Soc 2018, 165, A3925. [Google Scholar] [CrossRef]
- Jusys, Z.; Binder, M.; Schnaidt, J.; Behm, R.J. A novel DEMS approach for studying gas evolution at battery-type electrode| electrolyte interfaces: High-voltage LiNi0. 5Mn1. 5O4 cathode in ethylene and dimethyl carbonate electrolytes. Electrochimica Acta 2019, 314, 188–201. [Google Scholar] [CrossRef]
- Rowden, B.; Garcia-Araez, N. A review of gas evolution in lithium ion batteries. Energy Reports 2020, 6, 10–18. [Google Scholar] [CrossRef]
- Wang, S.; Rafiz, K.; Liu, J.; Jin, Y.; Lin, J.Y. Effects of lithium dendrites on thermal runaway and gassing of LiFePO 4 batteries. Sustainable Energy & Fuels 2020, 4, 2342–2351. [Google Scholar] [CrossRef]
- Galushkin, N.; Yazvinskaya, N.; Galushkin, D. Mechanism of gases generation during lithium-ion batteries cycling. J Electrochem Soc 2019, 166, A897. [Google Scholar] [CrossRef]
- Baird, A.R.; Archibald, E.J.; Marr, K.C.; Ezekoye, O.A. Explosion hazards from lithium-ion battery vent gas. Journal of Power Sources 2020, 446, 227257. [Google Scholar] [CrossRef]
- Wang, Q.; Mao, B.; Stoliarov, S.I.; Sun, J. A review of lithium ion battery failure mechanisms and fire prevention strategies. Progress in Energy and Combustion Science 2019, 73, 95–131. [Google Scholar] [CrossRef]
- Strauss, F.; Teo, J.H.; Schiele, A.; Bartsch, T.; Hatsukade, T.; Hartmann, P.; Janek, J.; Brezesinski, T. Gas Evolution in Lithium-Ion Batteries: Solid versus Liquid Electrolyte. ACS Appl Mater Interfaces 2020, 12, 20462–20468. [Google Scholar] [CrossRef]
- Xiaoyan, S.; Leilei, M.; Jiantao, W. Effects of pre-charge temperatures on gas production and electrochemical performances of lithium-ion batteries. In Proceedings of the E3S Web of Conferences; 2021; p. 01040. [Google Scholar] [CrossRef]
- Geng, L.; Wood III, D.L.; Lewis Sr, S.A.; Connatser, R.M.; Li, M.; Jafta, C.J.; Belharouak, I. High accuracy in-situ direct gas analysis of Li-ion batteries. Journal of Power Sources 2020, 466, 228211. [Google Scholar] [CrossRef]
Figure 1.
(a) Photograph to battery sample; (b) capacity-voltage curve of the battery.
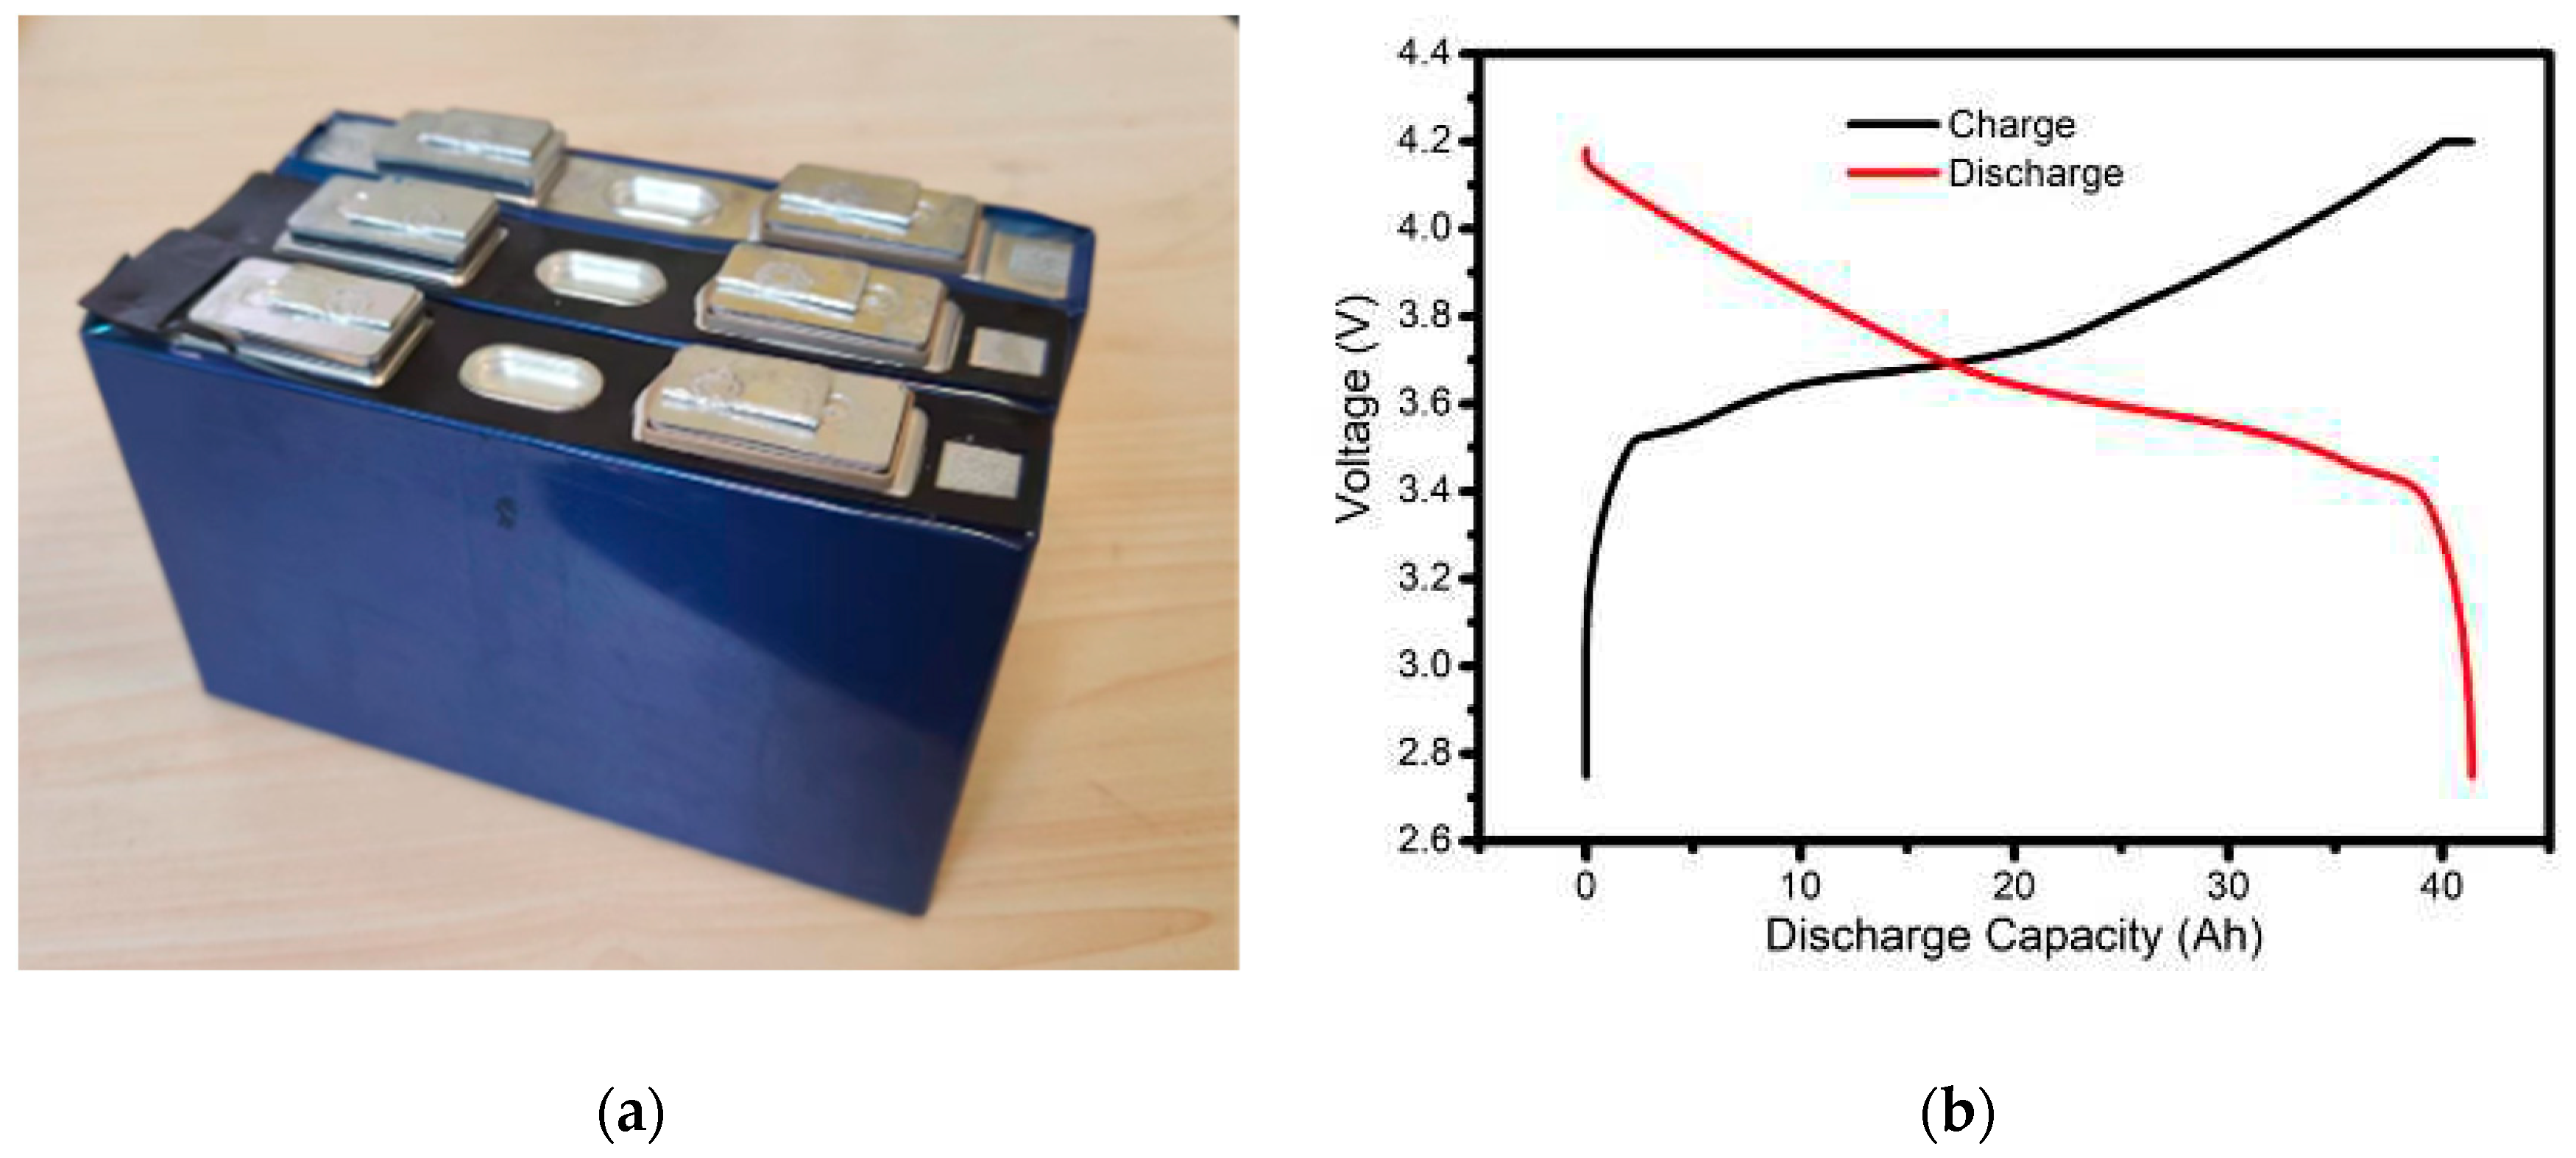
Figure 2.
X-CT images of battery internal structure. (a) YZ-axis cross-section; (b) XZ-axis cross-section.
Figure 2.
X-CT images of battery internal structure. (a) YZ-axis cross-section; (b) XZ-axis cross-section.
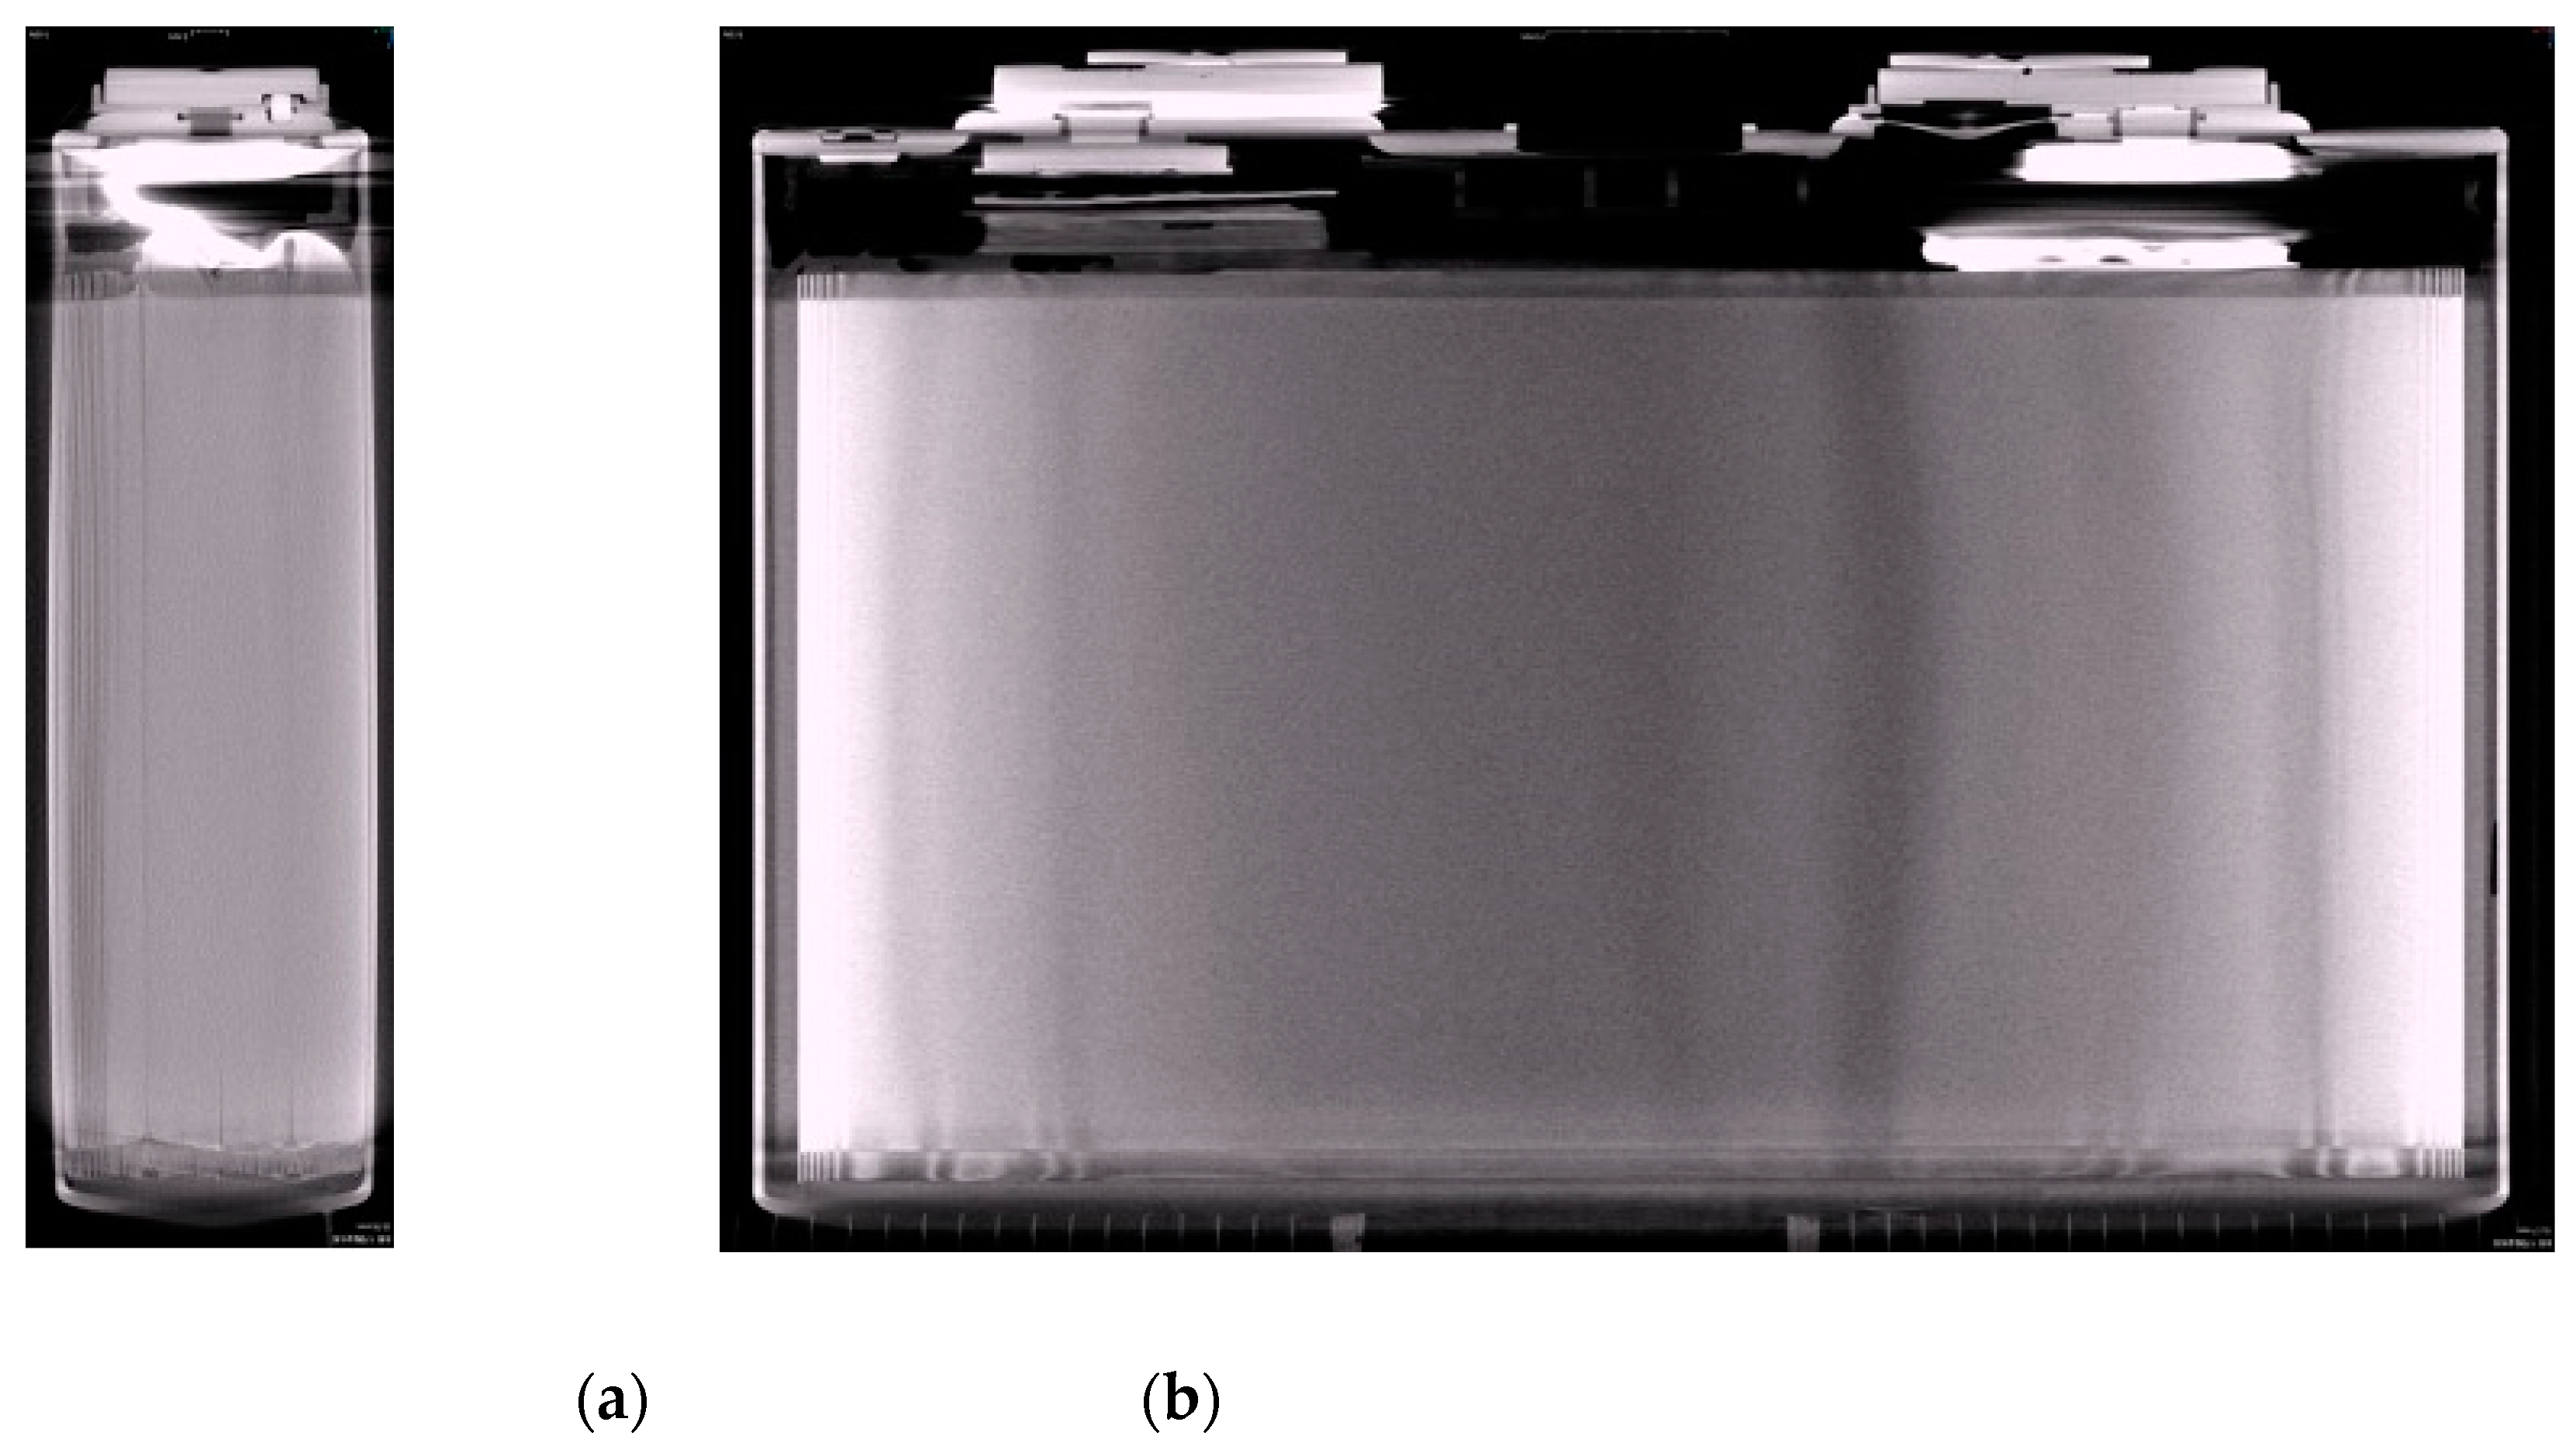
Figure 3.
(a) Schematic diagram of battery thermal failure test chamber; (b) Photograph of battery thermal failure test chamber; (c) Temperature and (d) pressure alterations during the thermal runaway process.
Figure 3.
(a) Schematic diagram of battery thermal failure test chamber; (b) Photograph of battery thermal failure test chamber; (c) Temperature and (d) pressure alterations during the thermal runaway process.
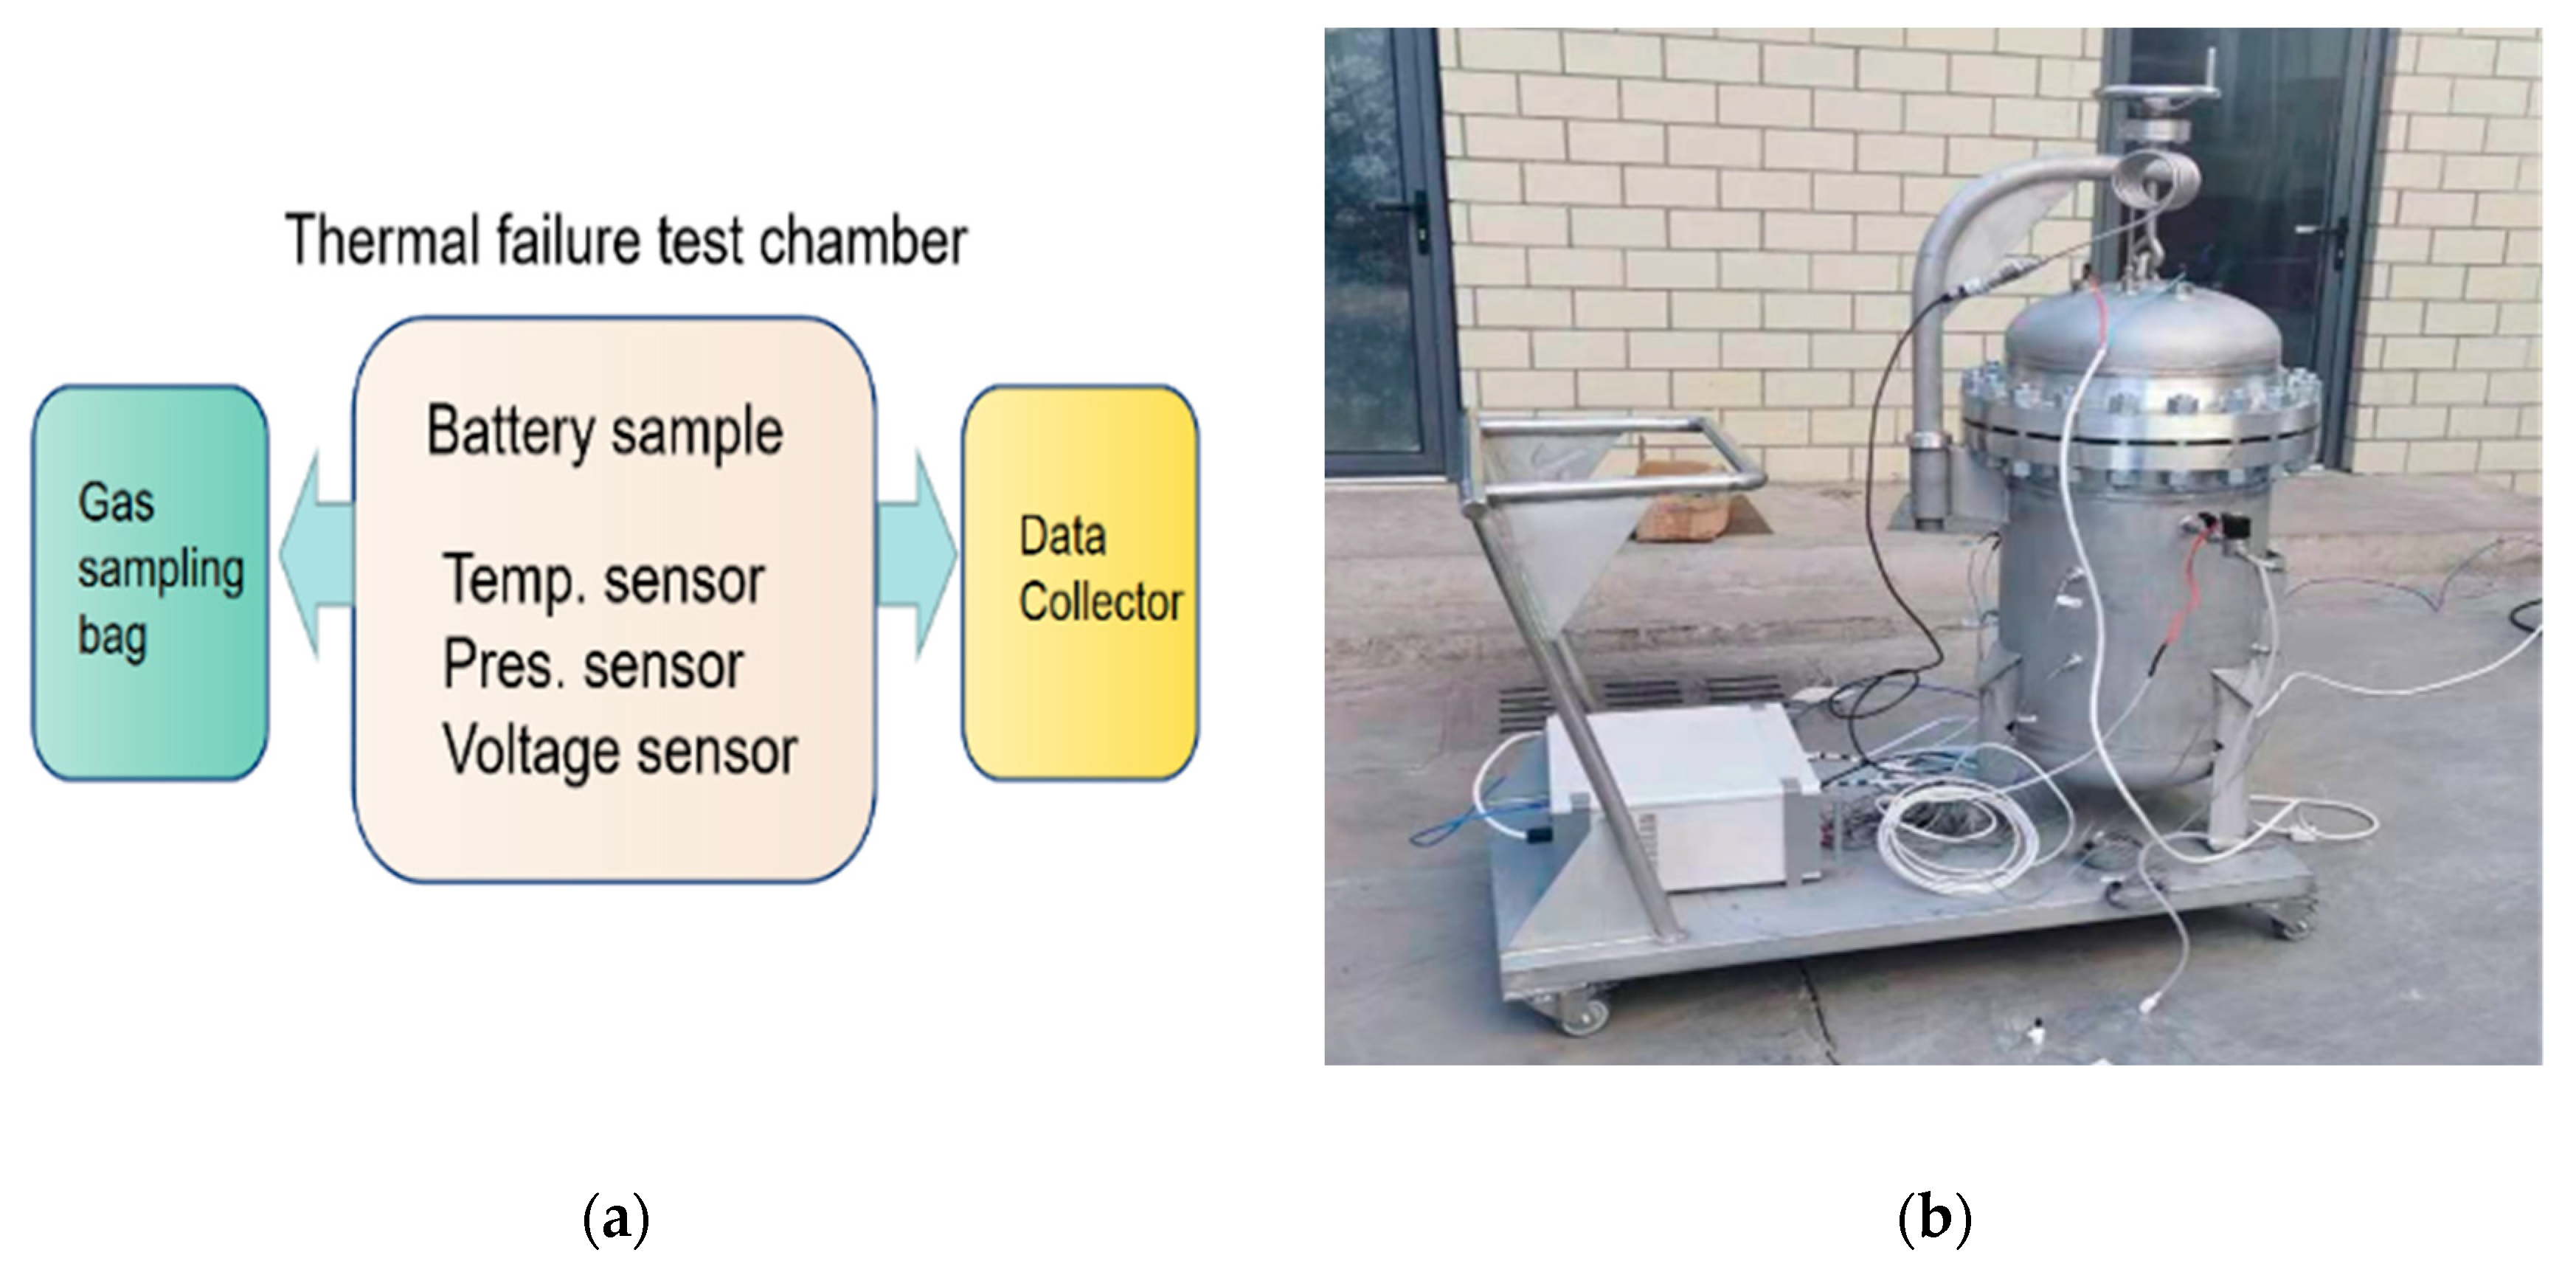
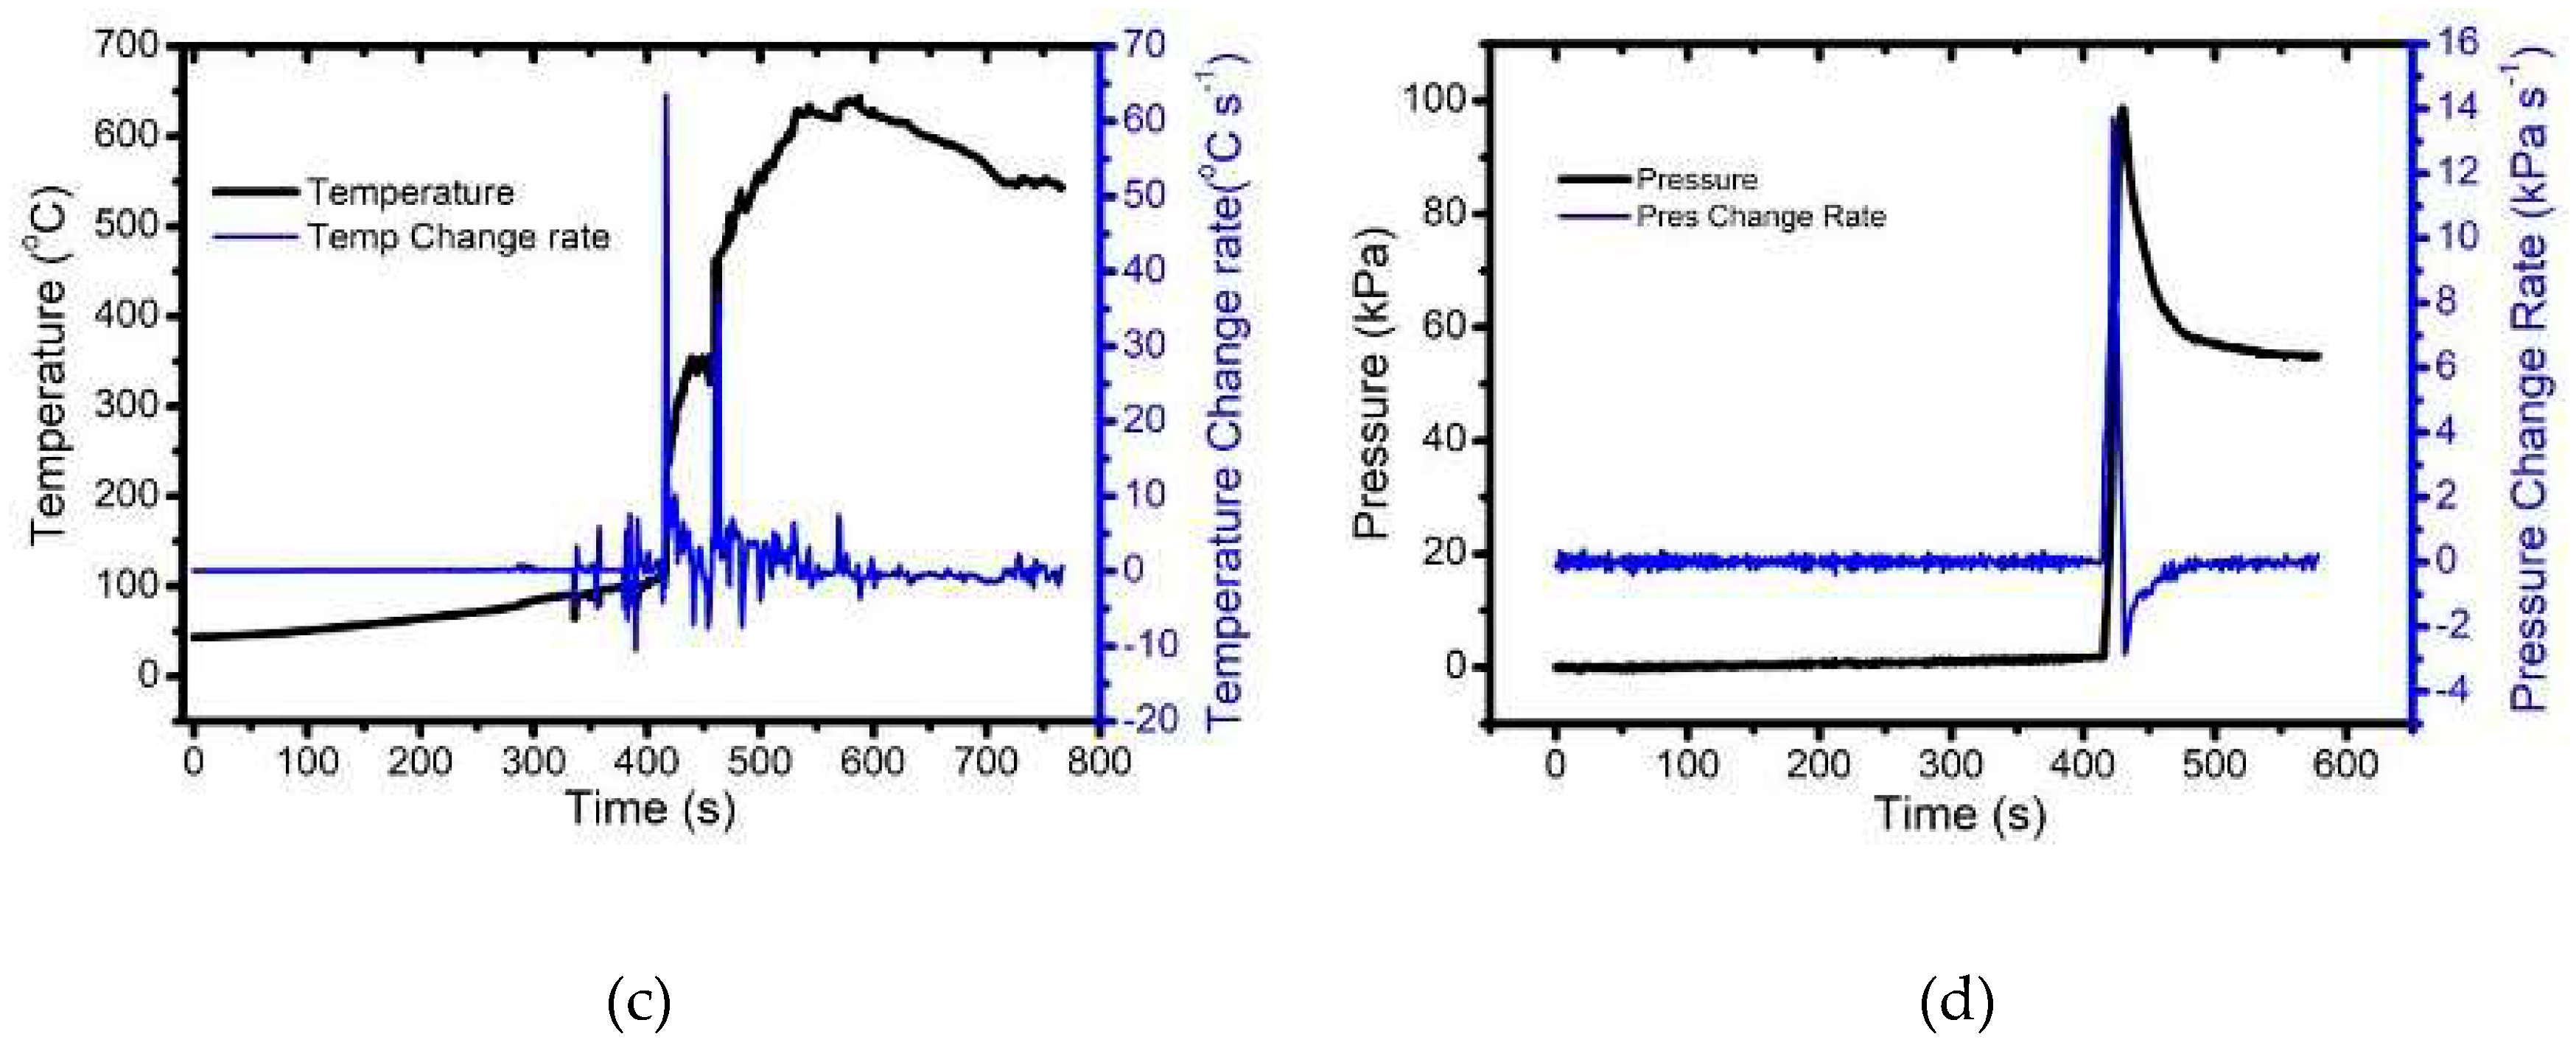
Figure 4.
3D geometric model and boundary layer of simulation.
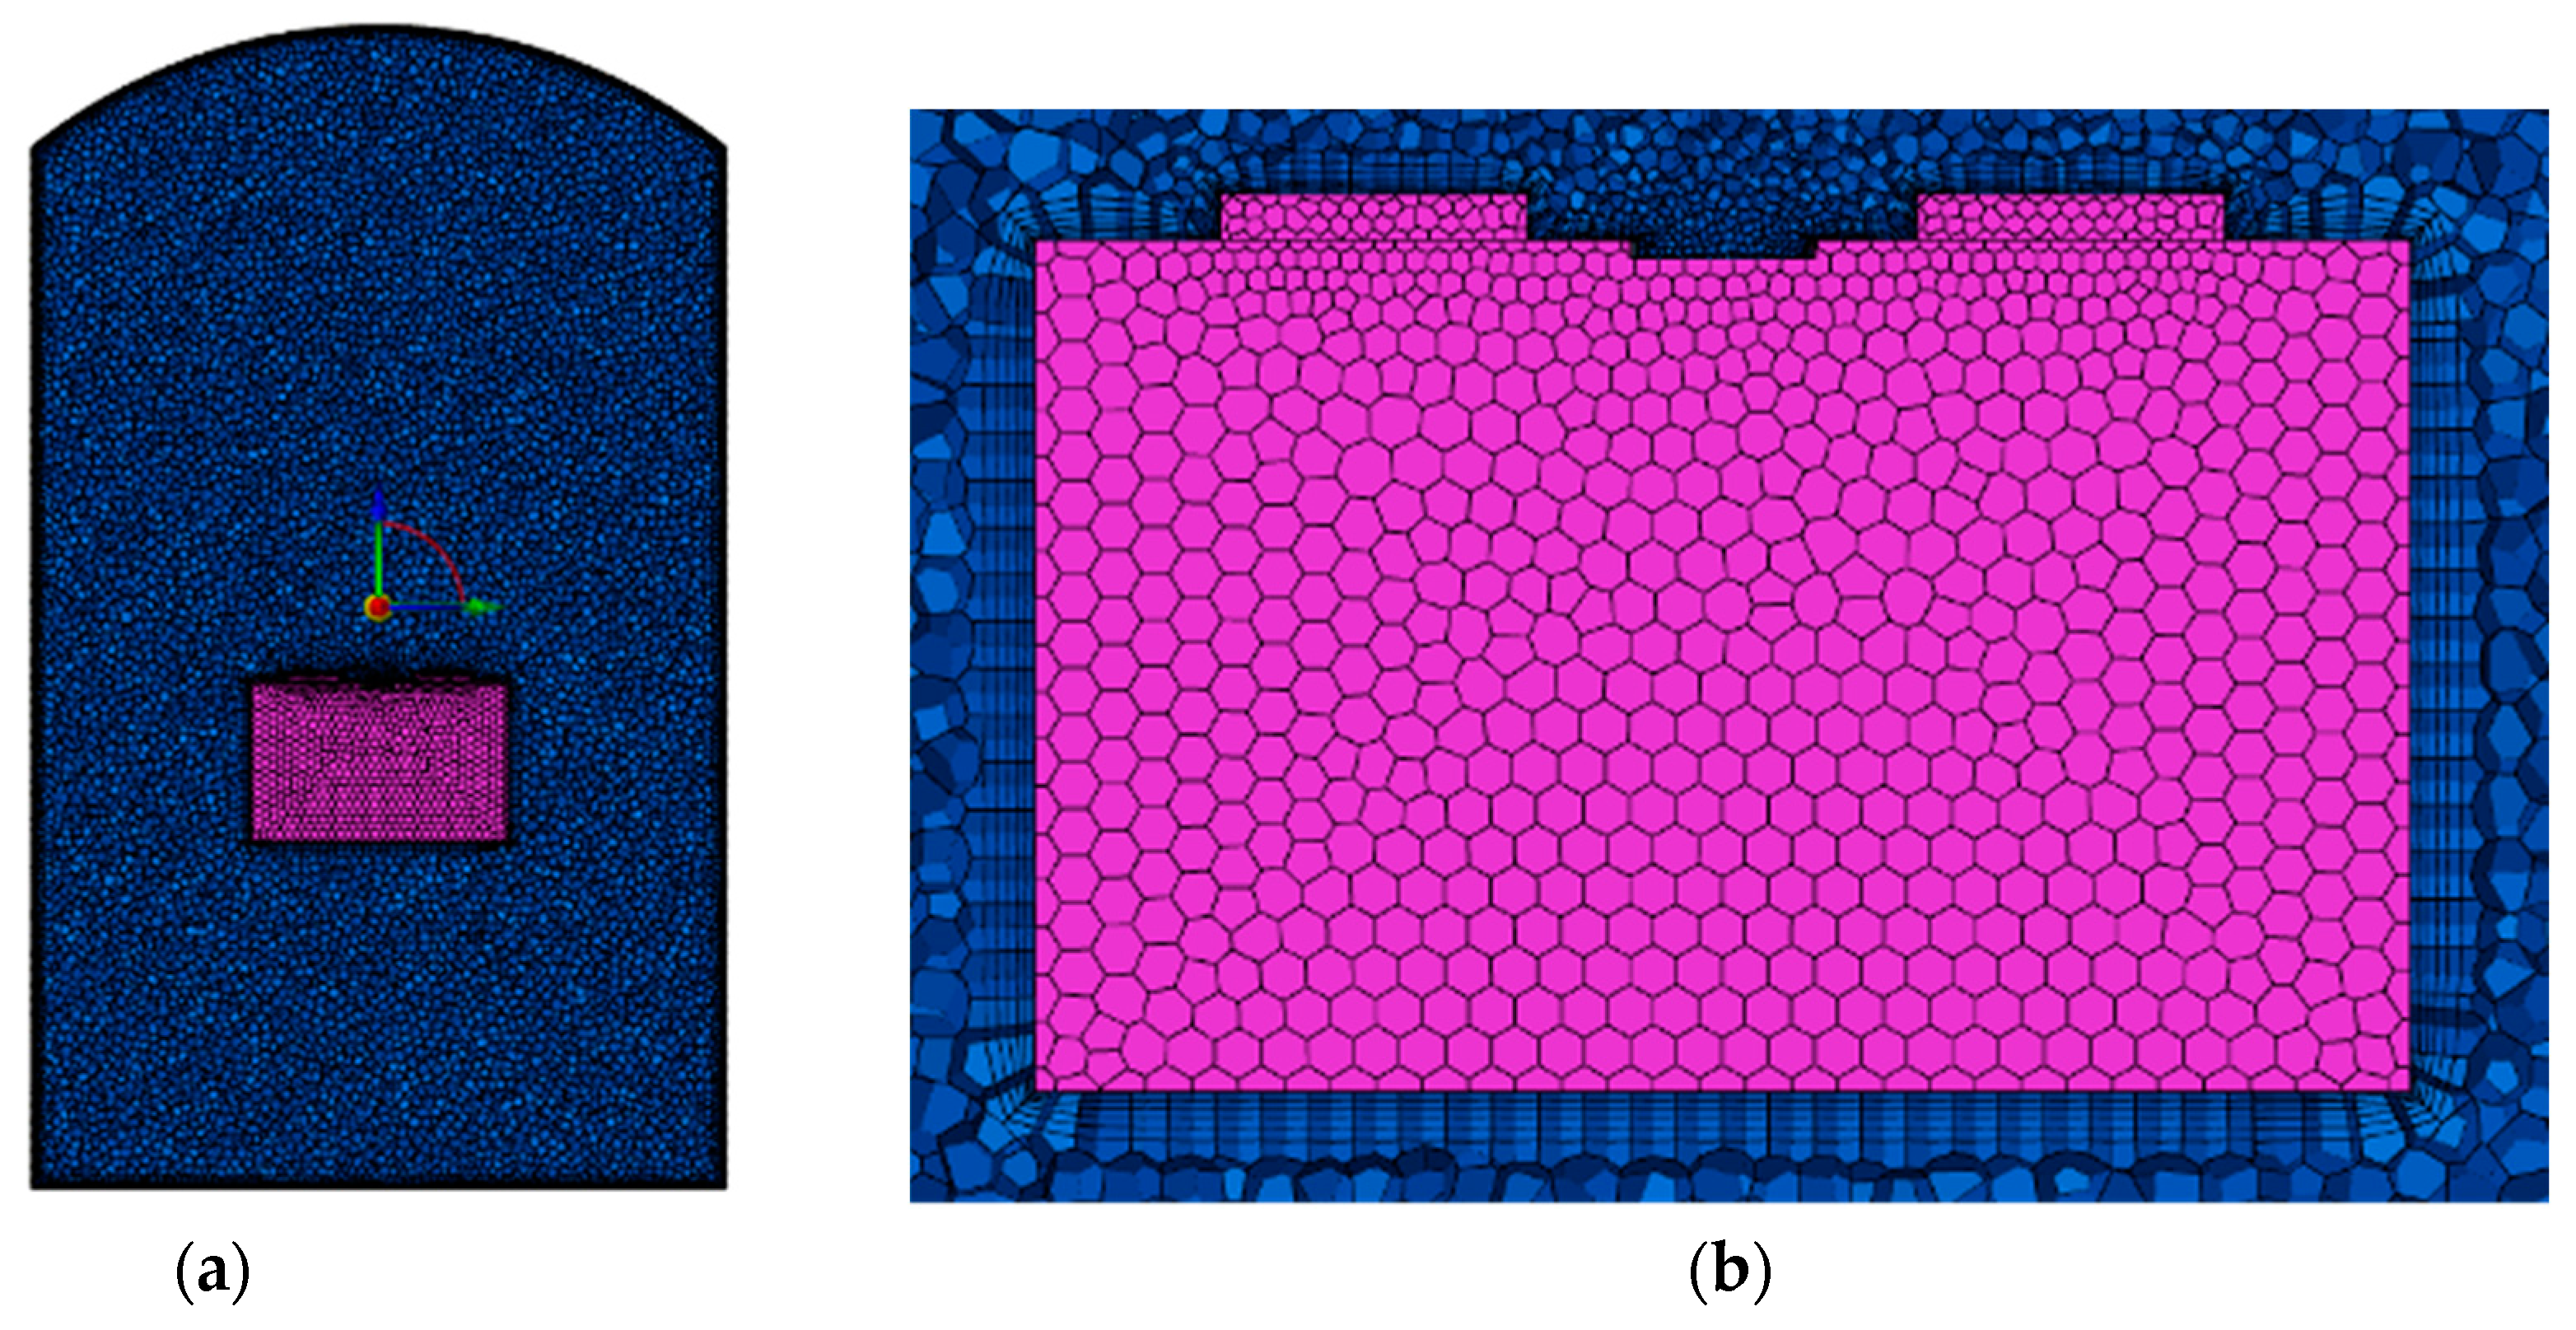
Figure 5.
Simulation results of gas emission velocity during the thermal runaway process.
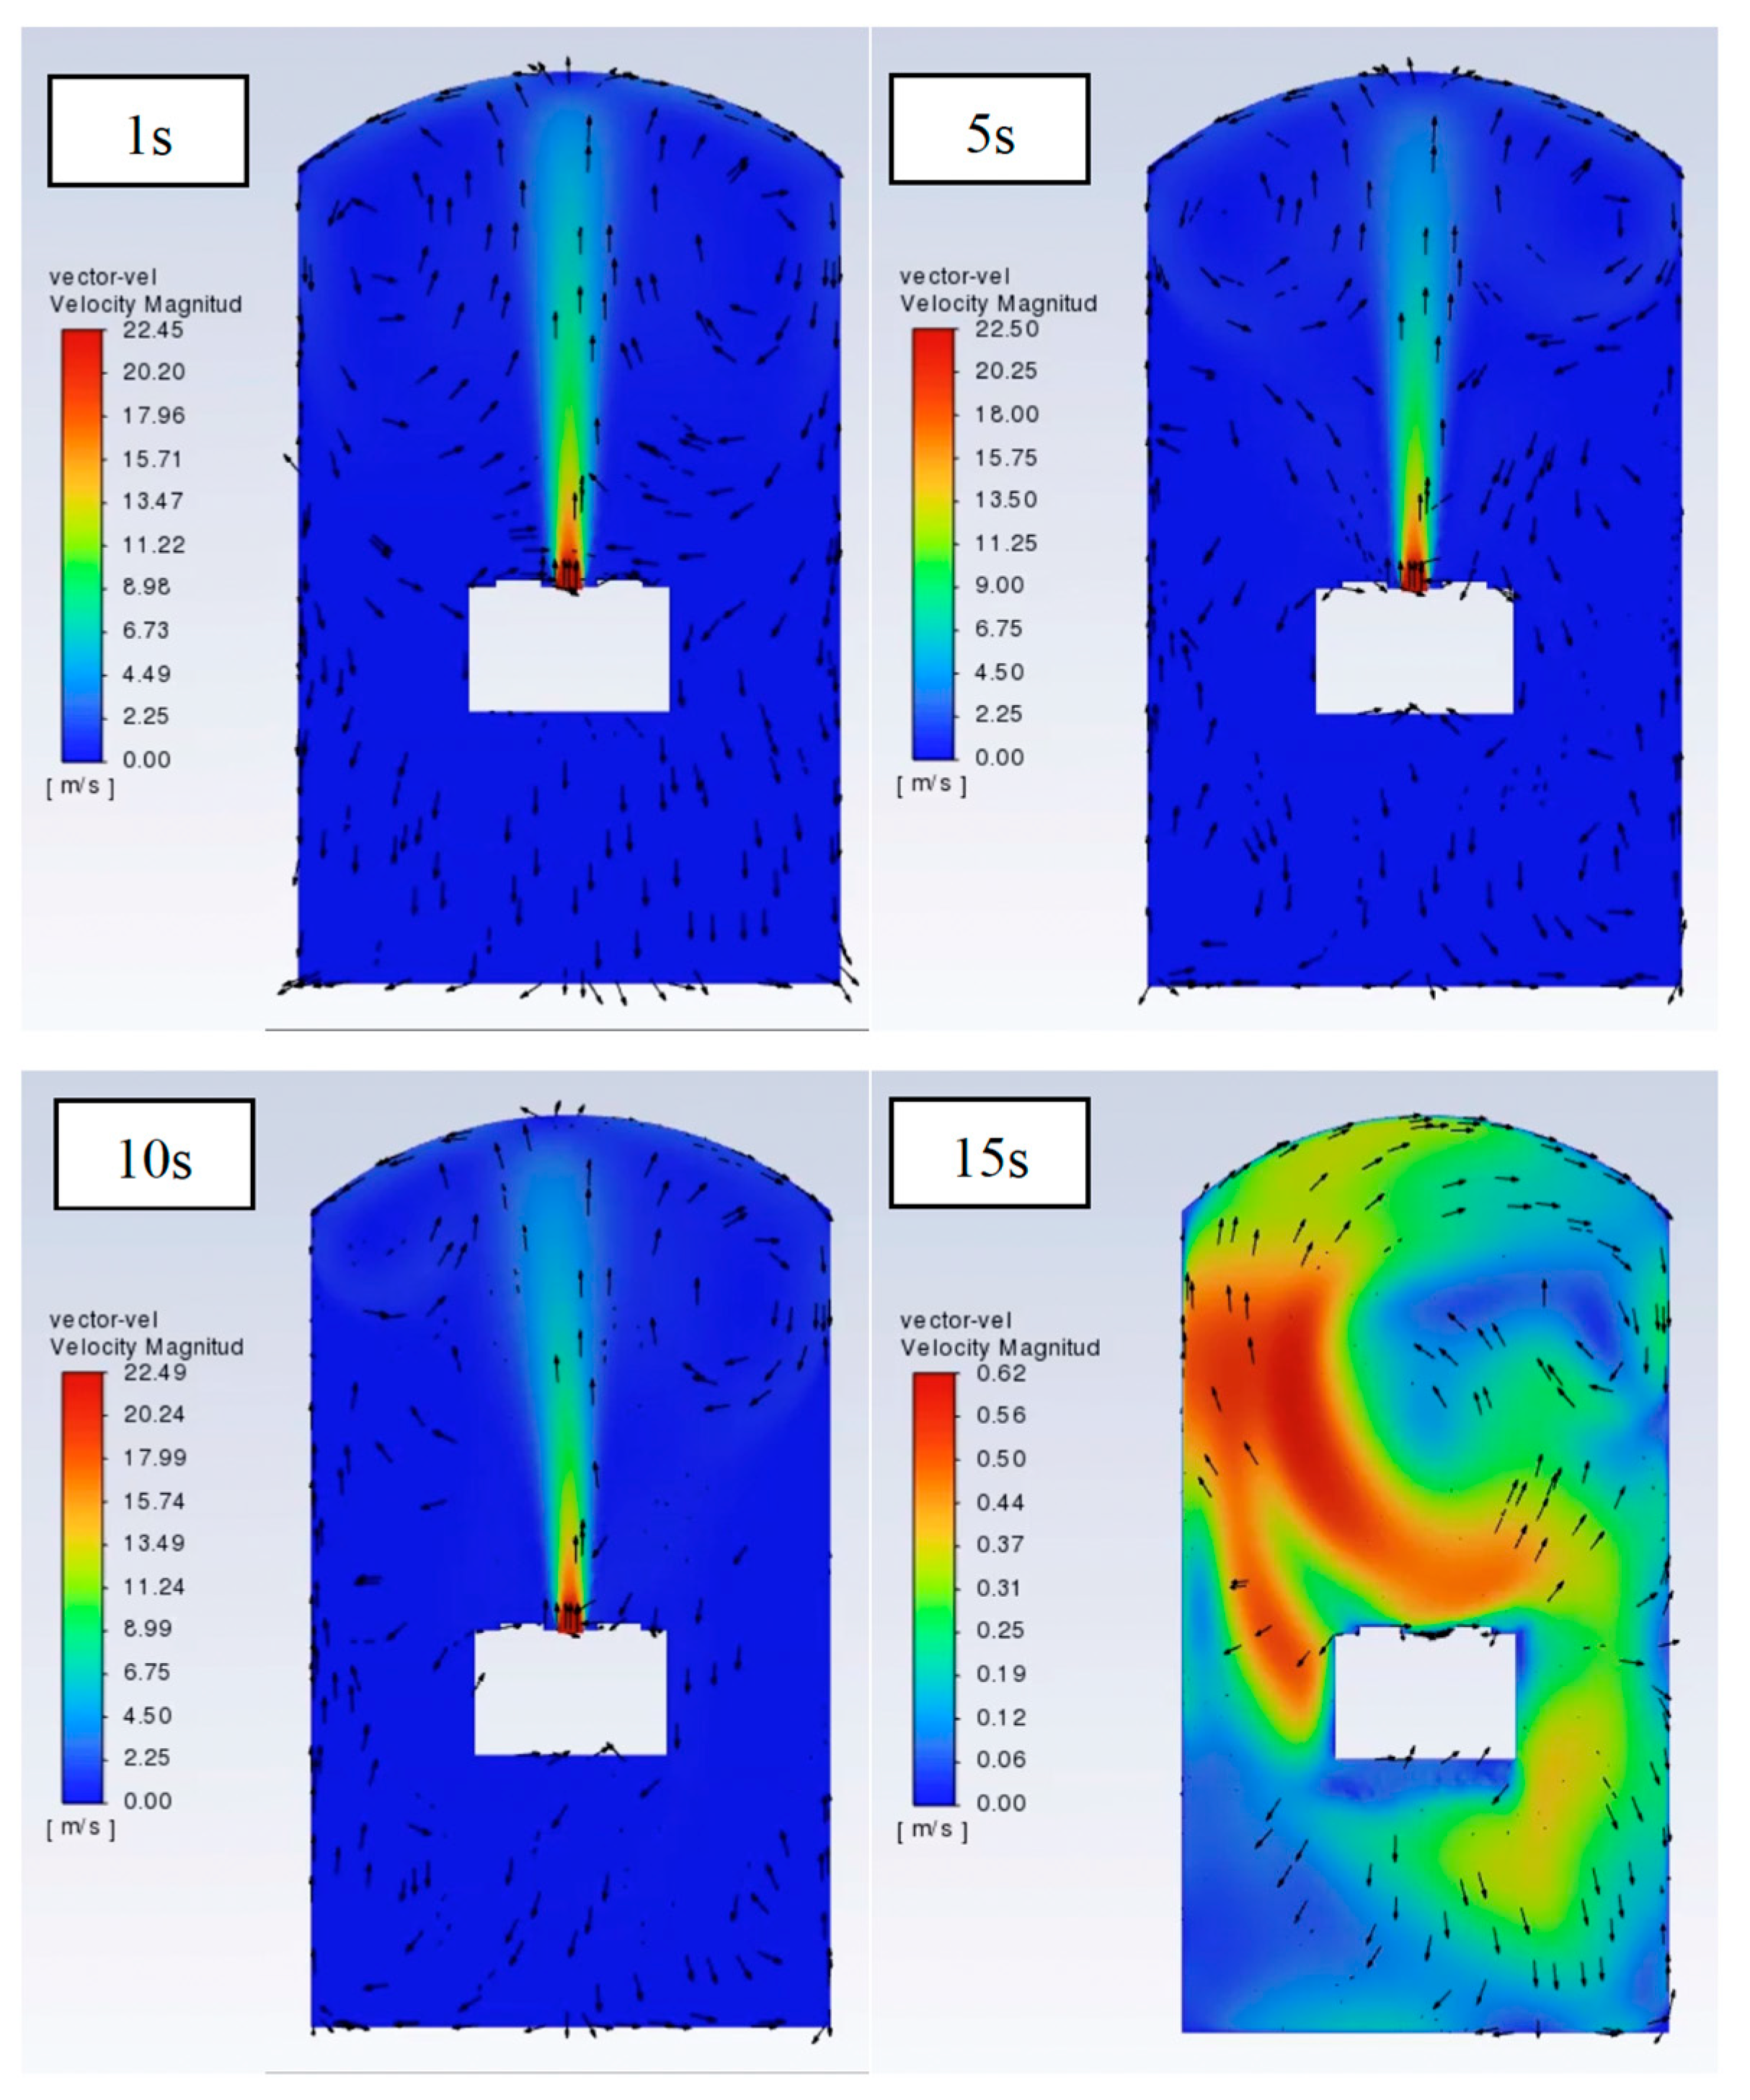
Figure 6.
Simulation results of gas emission pressure during the thermal runaway process.
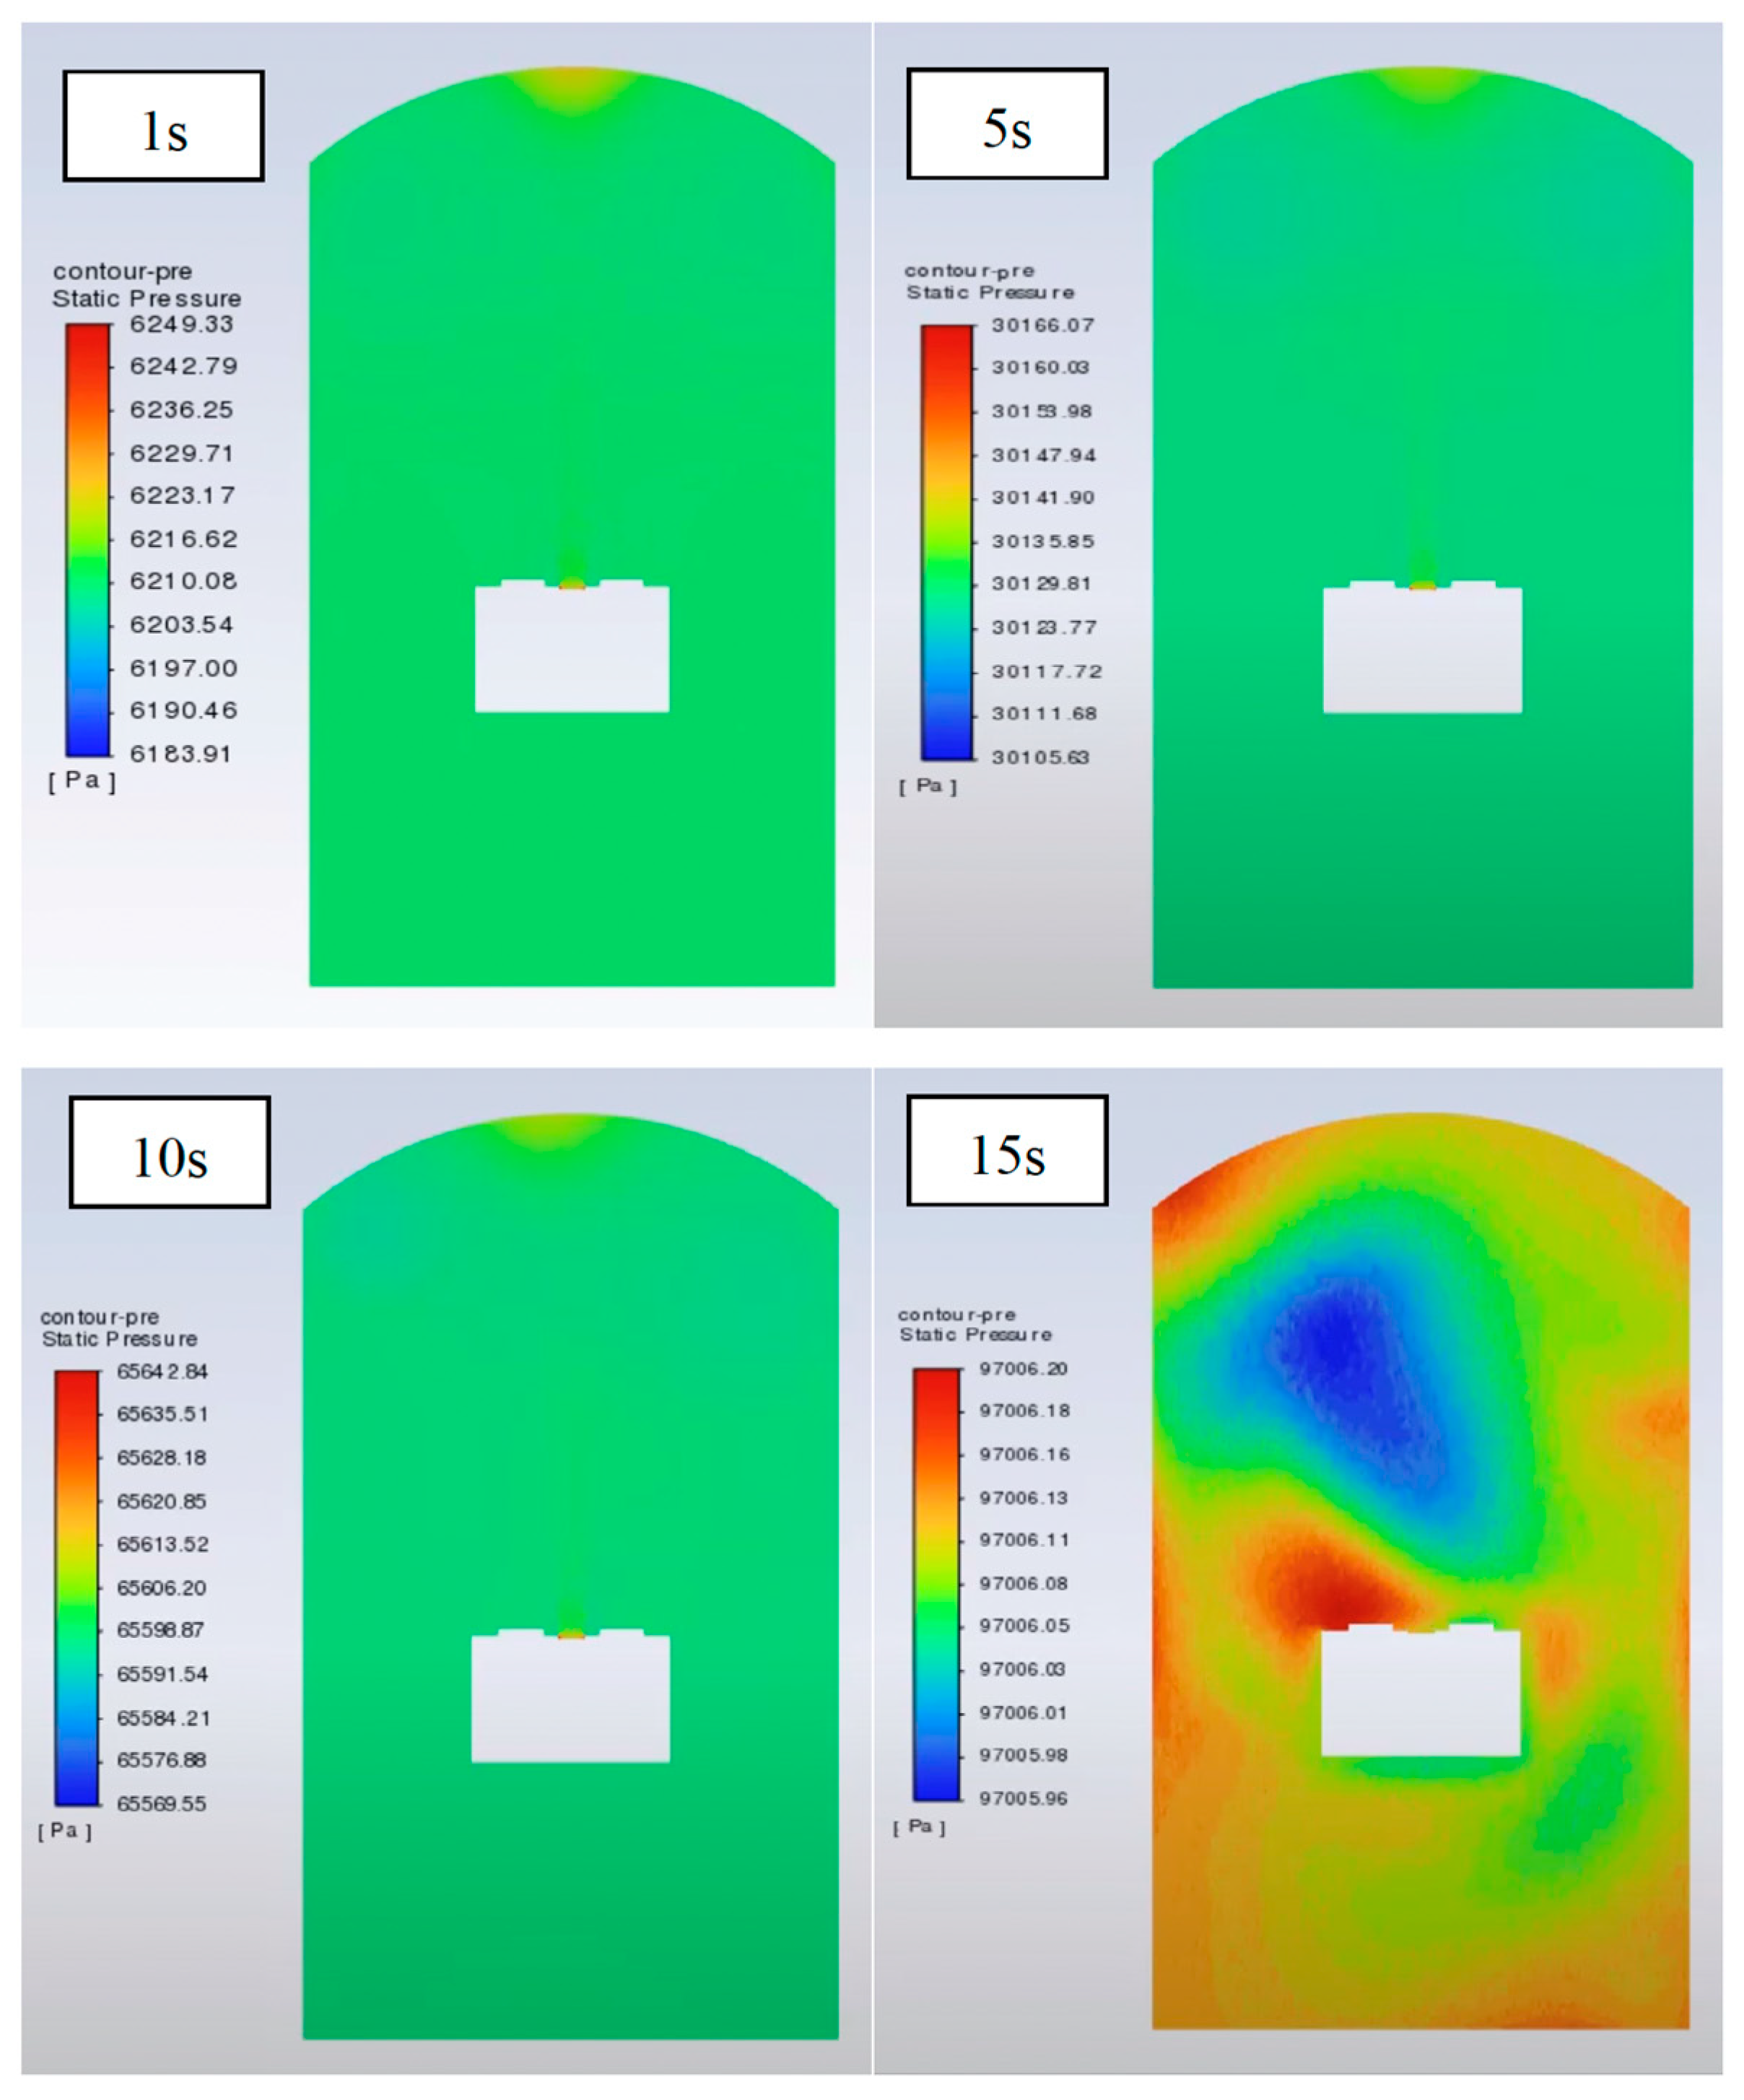
Figure 7.
Simulation results of gas emission temperature during the thermal runaway process.
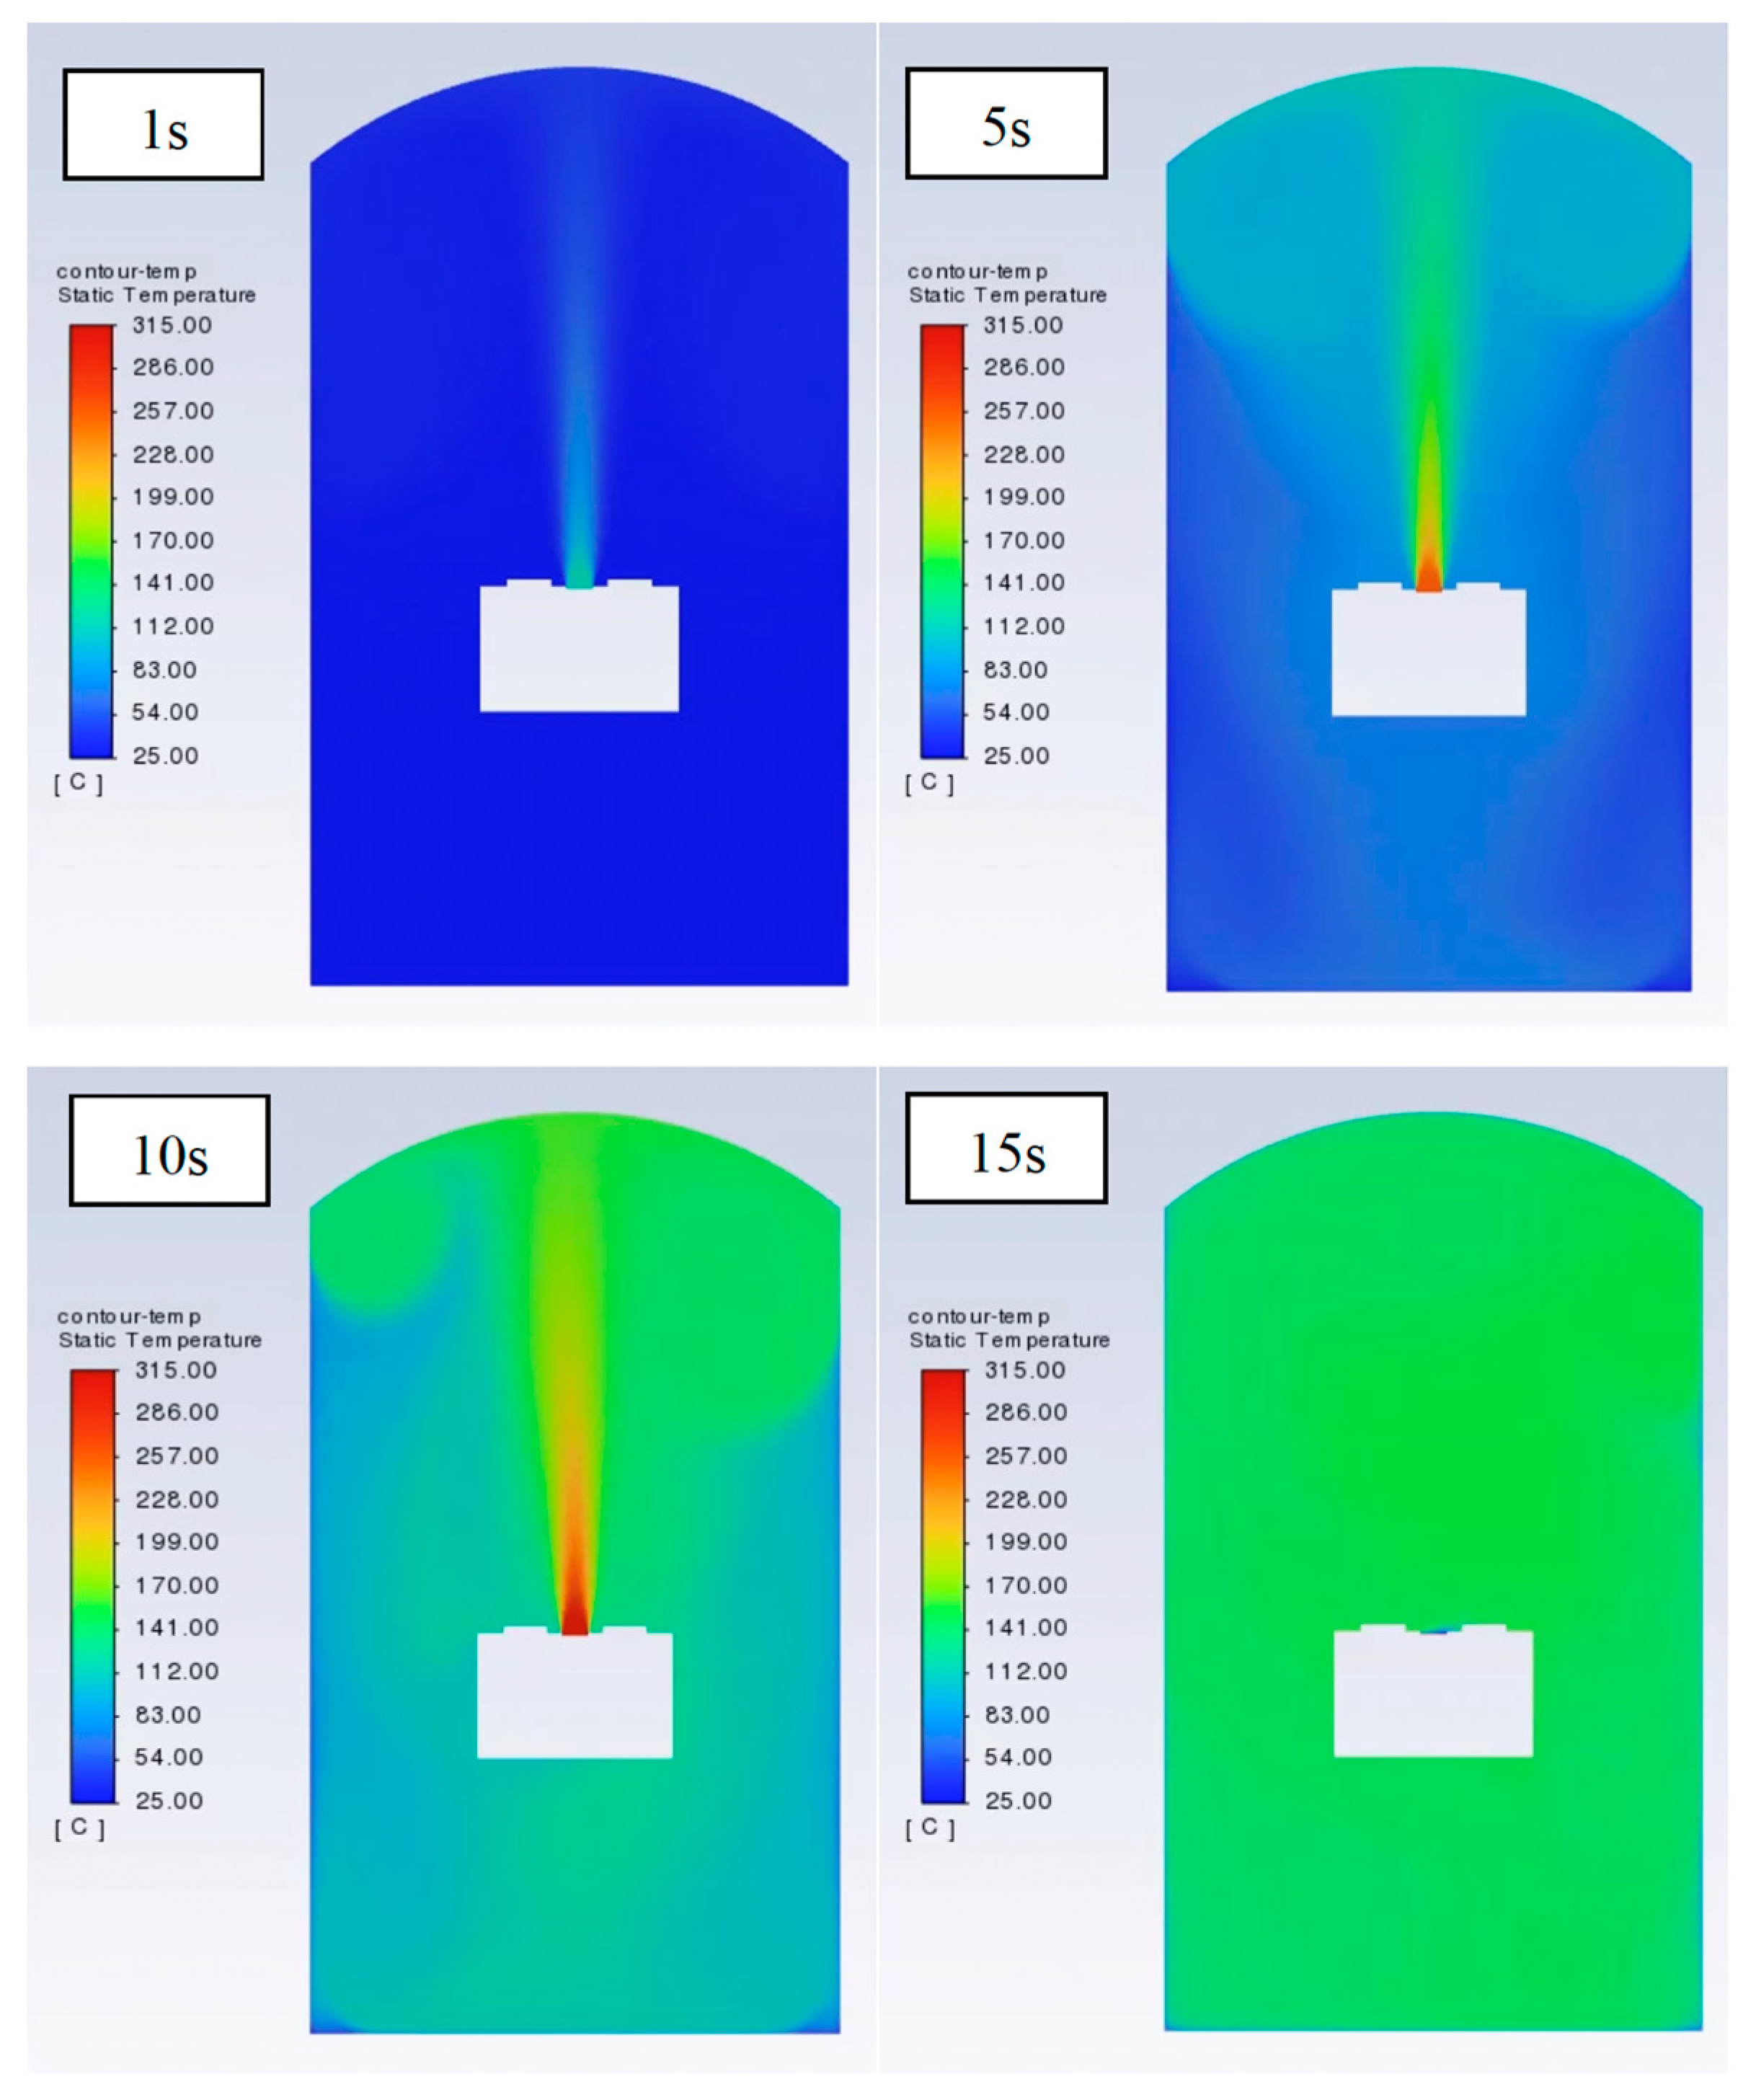
Figure 8.
Simulation results of temperature curves over time.
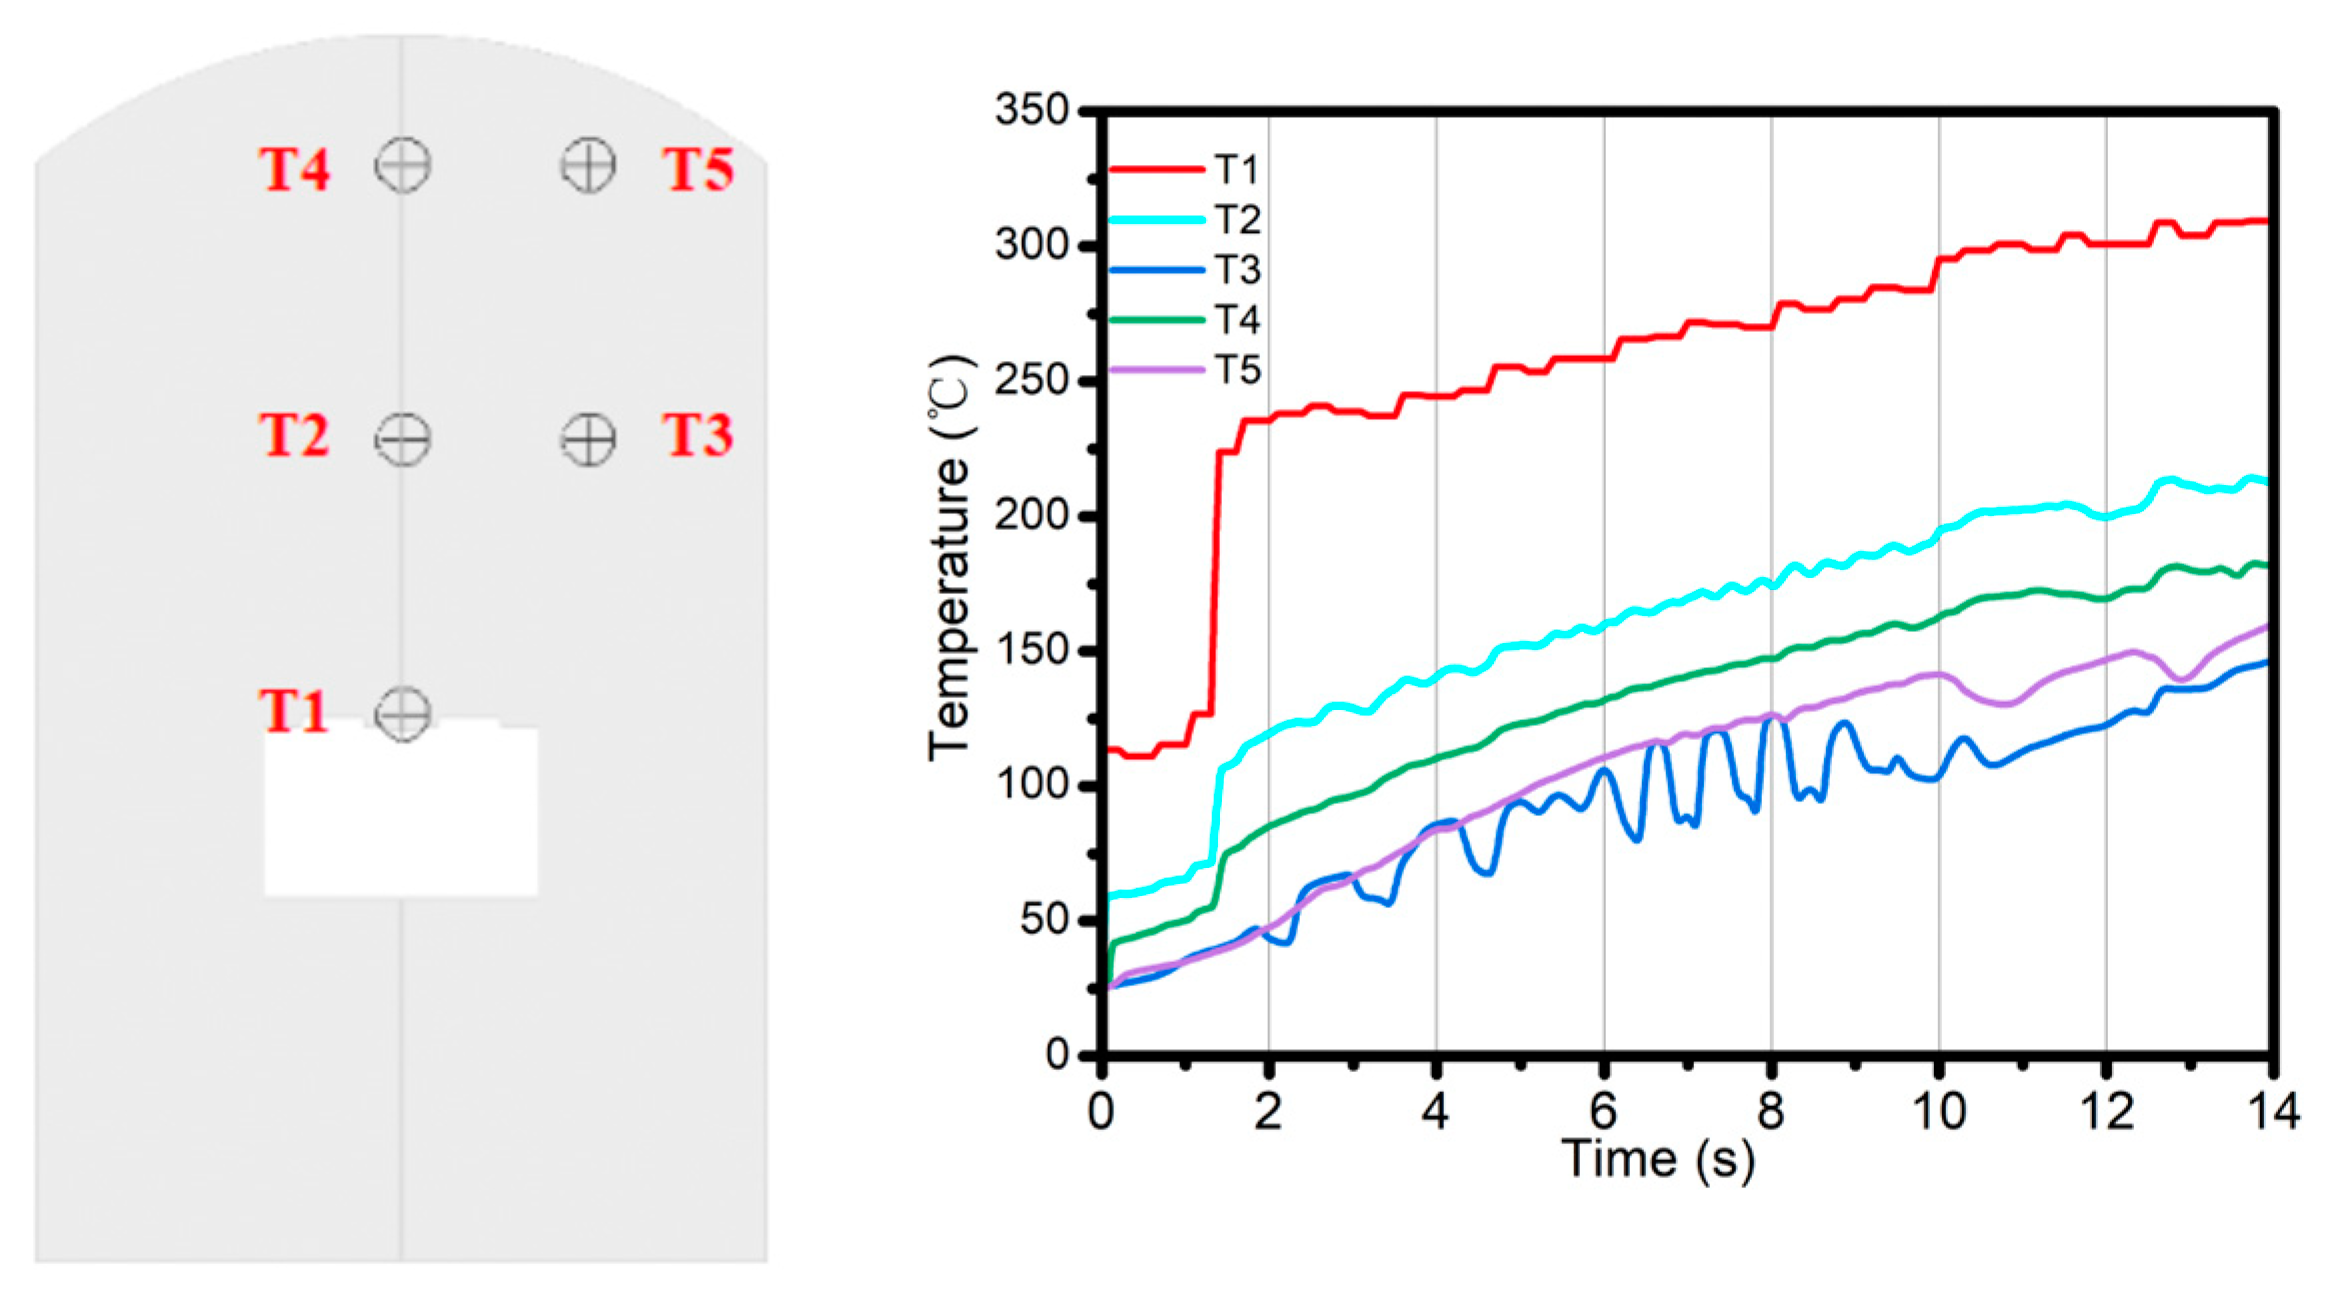
Figure 9.
(a) Temperature alterations during the thermal runaway process of cell 1#-3#; (b) Pressure alterations during the thermal runaway process of chamber.
Figure 9.
(a) Temperature alterations during the thermal runaway process of cell 1#-3#; (b) Pressure alterations during the thermal runaway process of chamber.
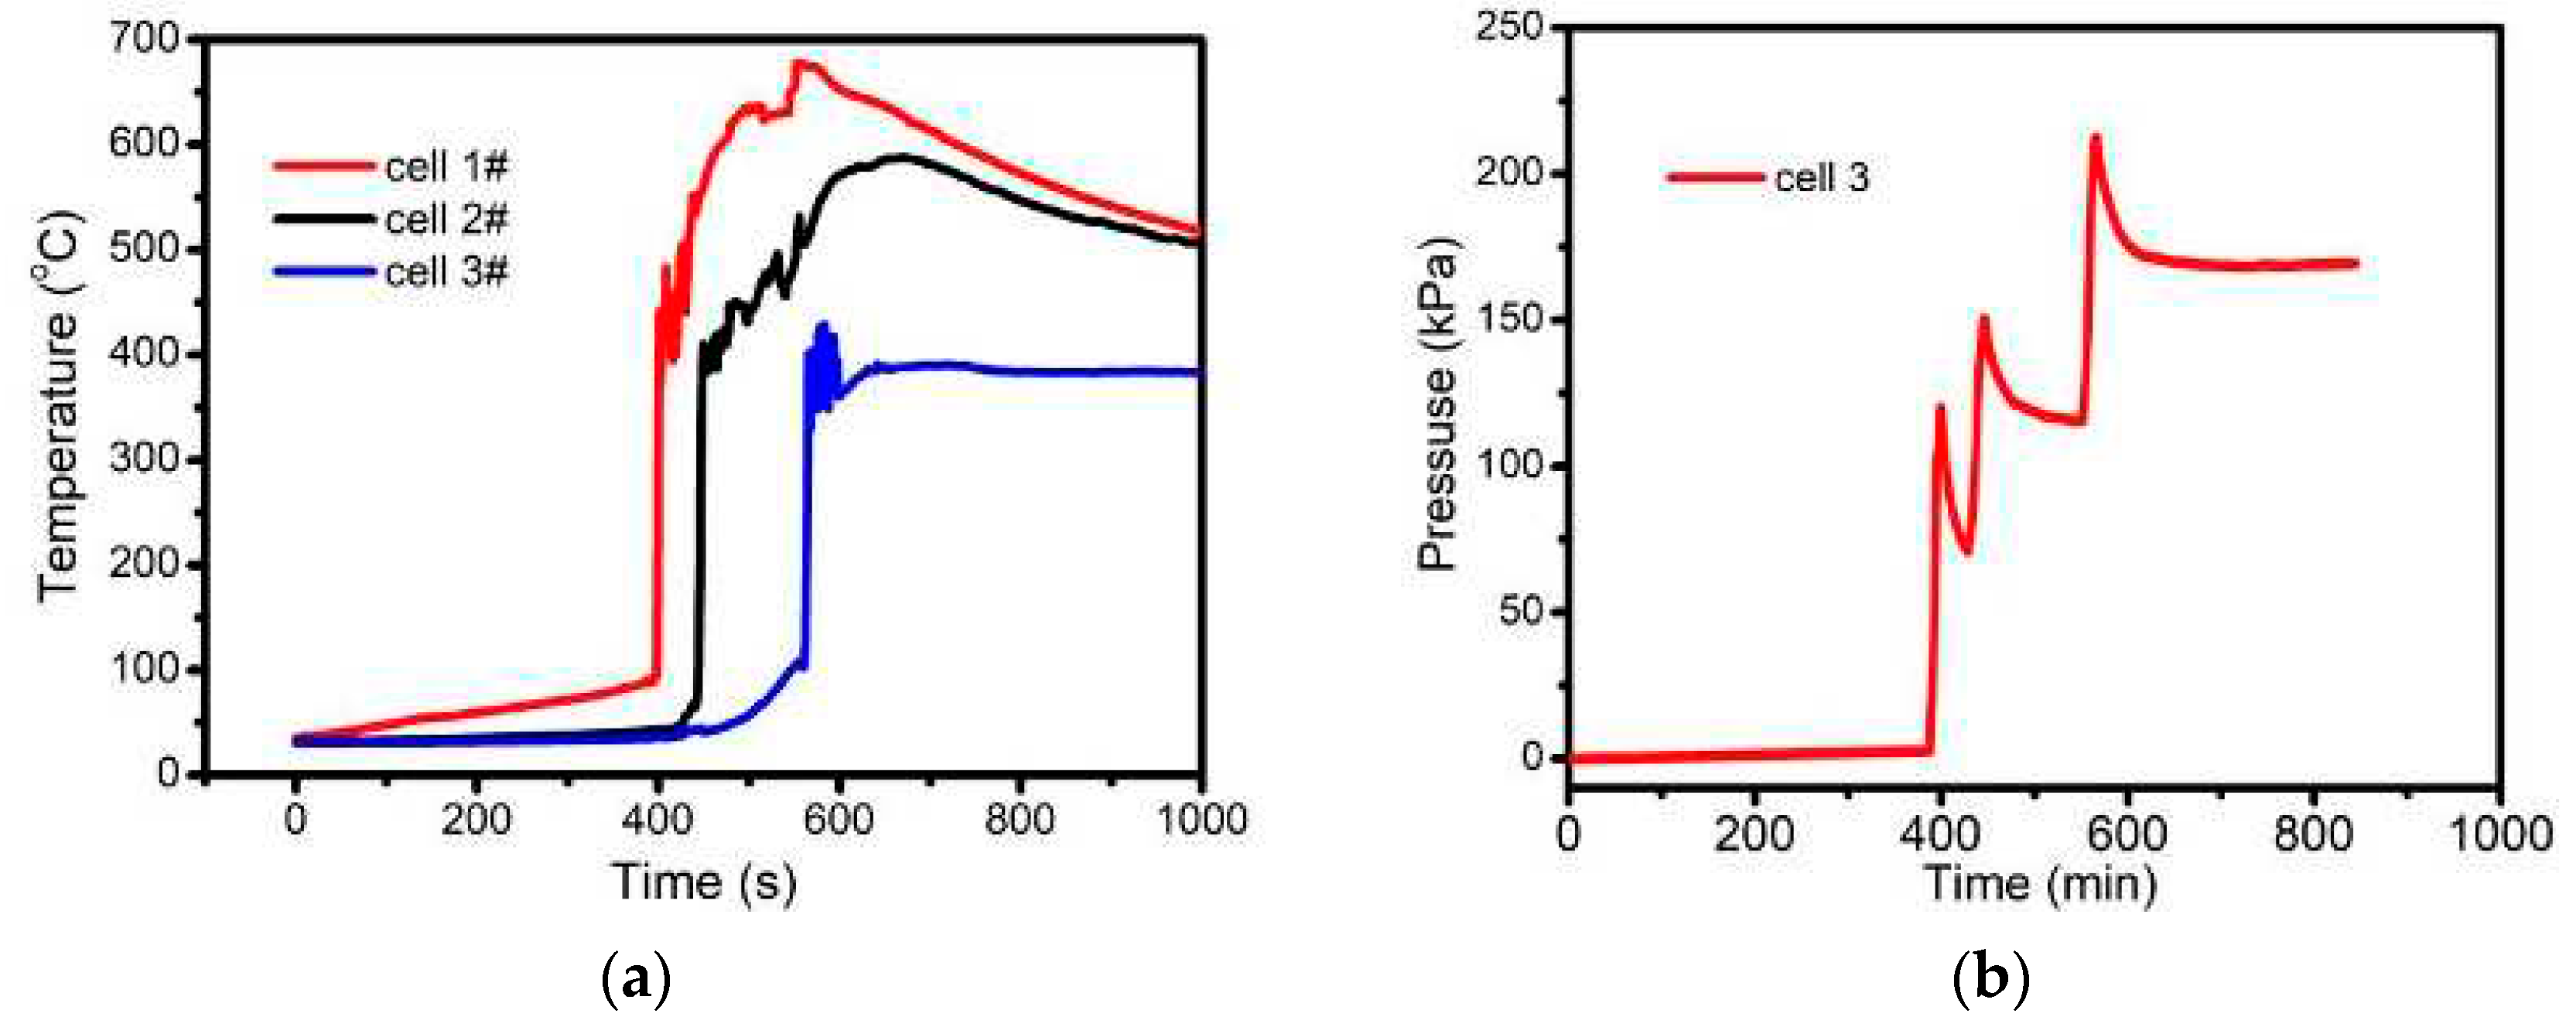
Figure 10.
Photograph and X-CT images of module after thermal runaway propagation test.
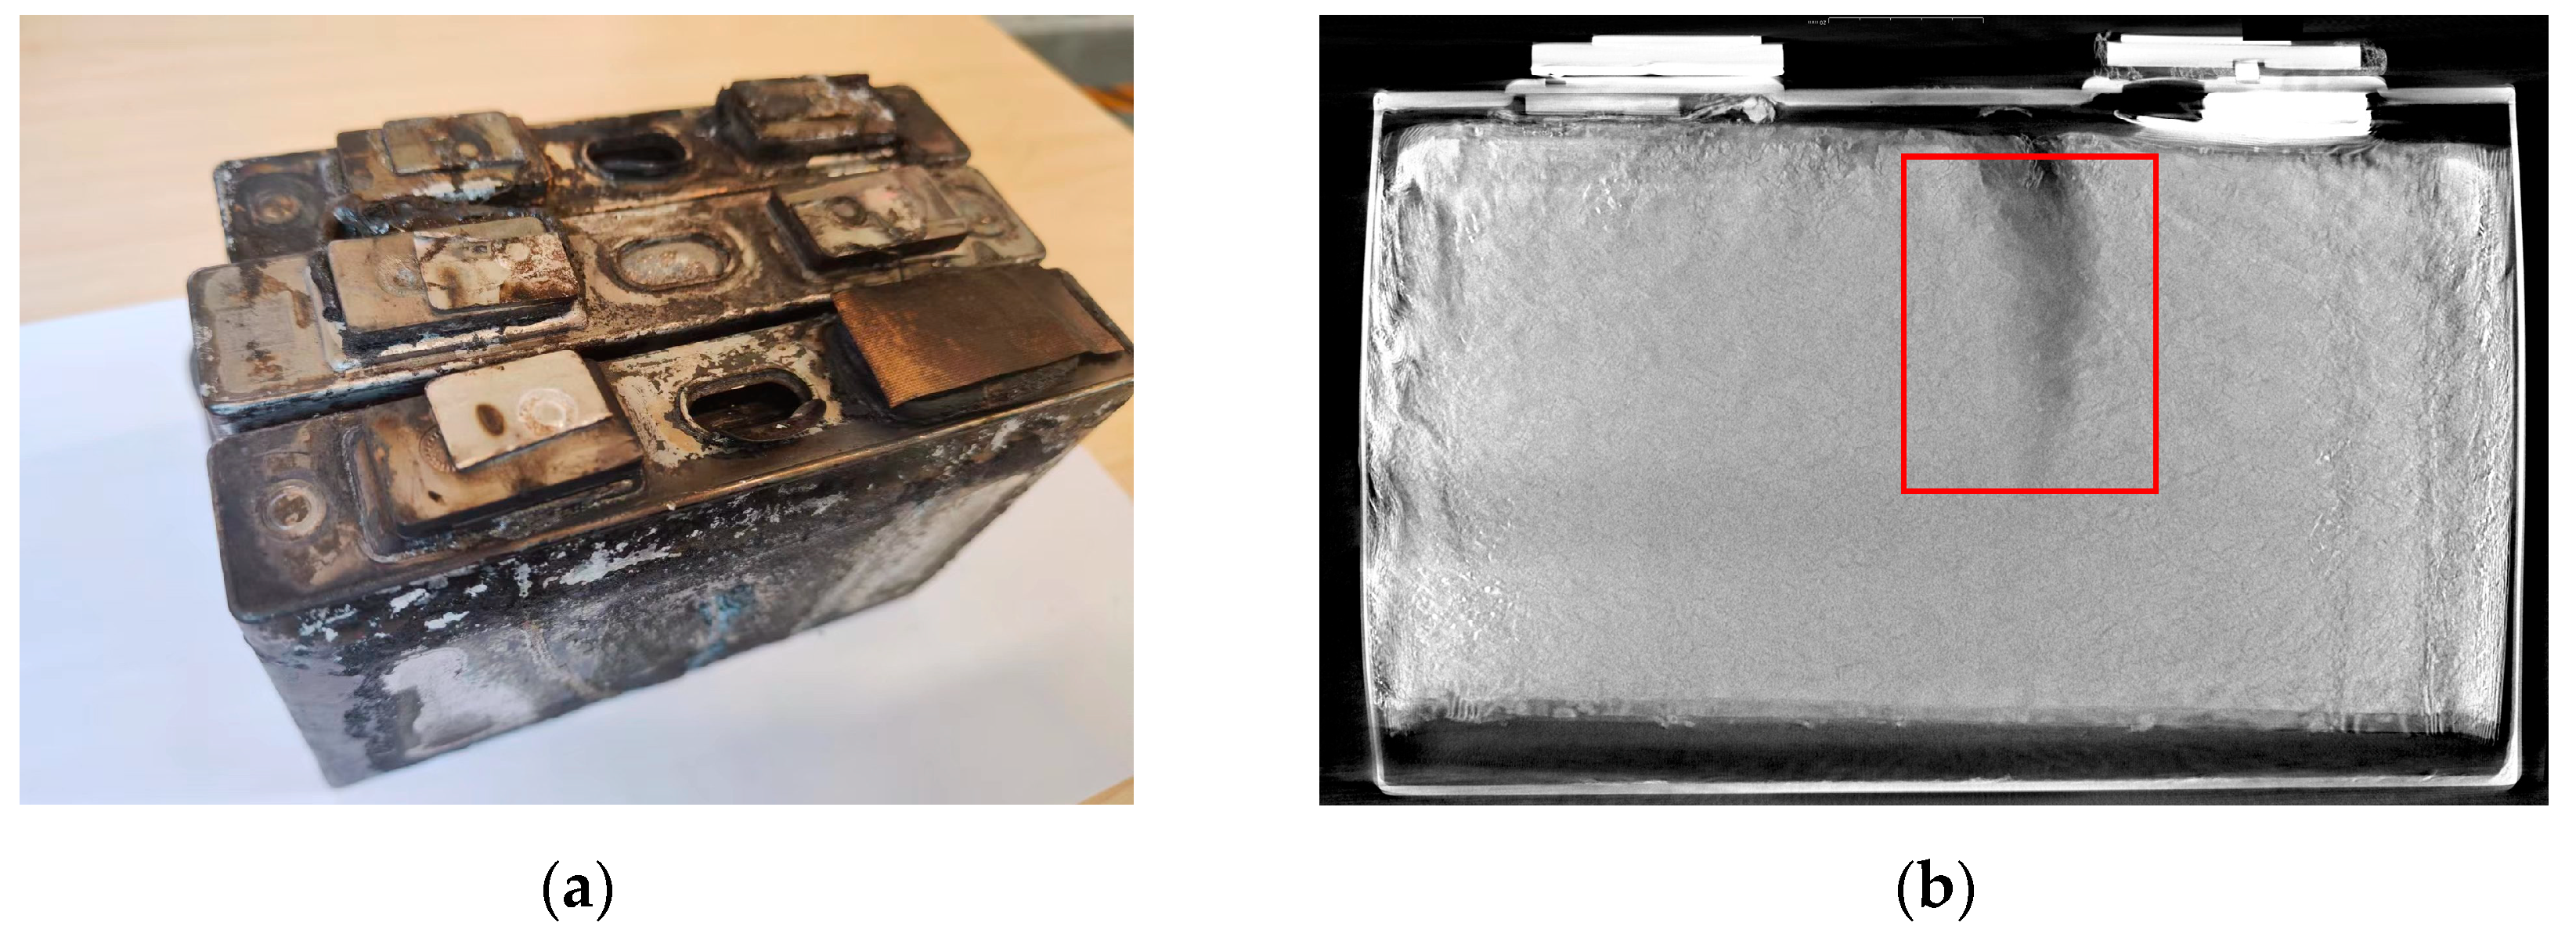
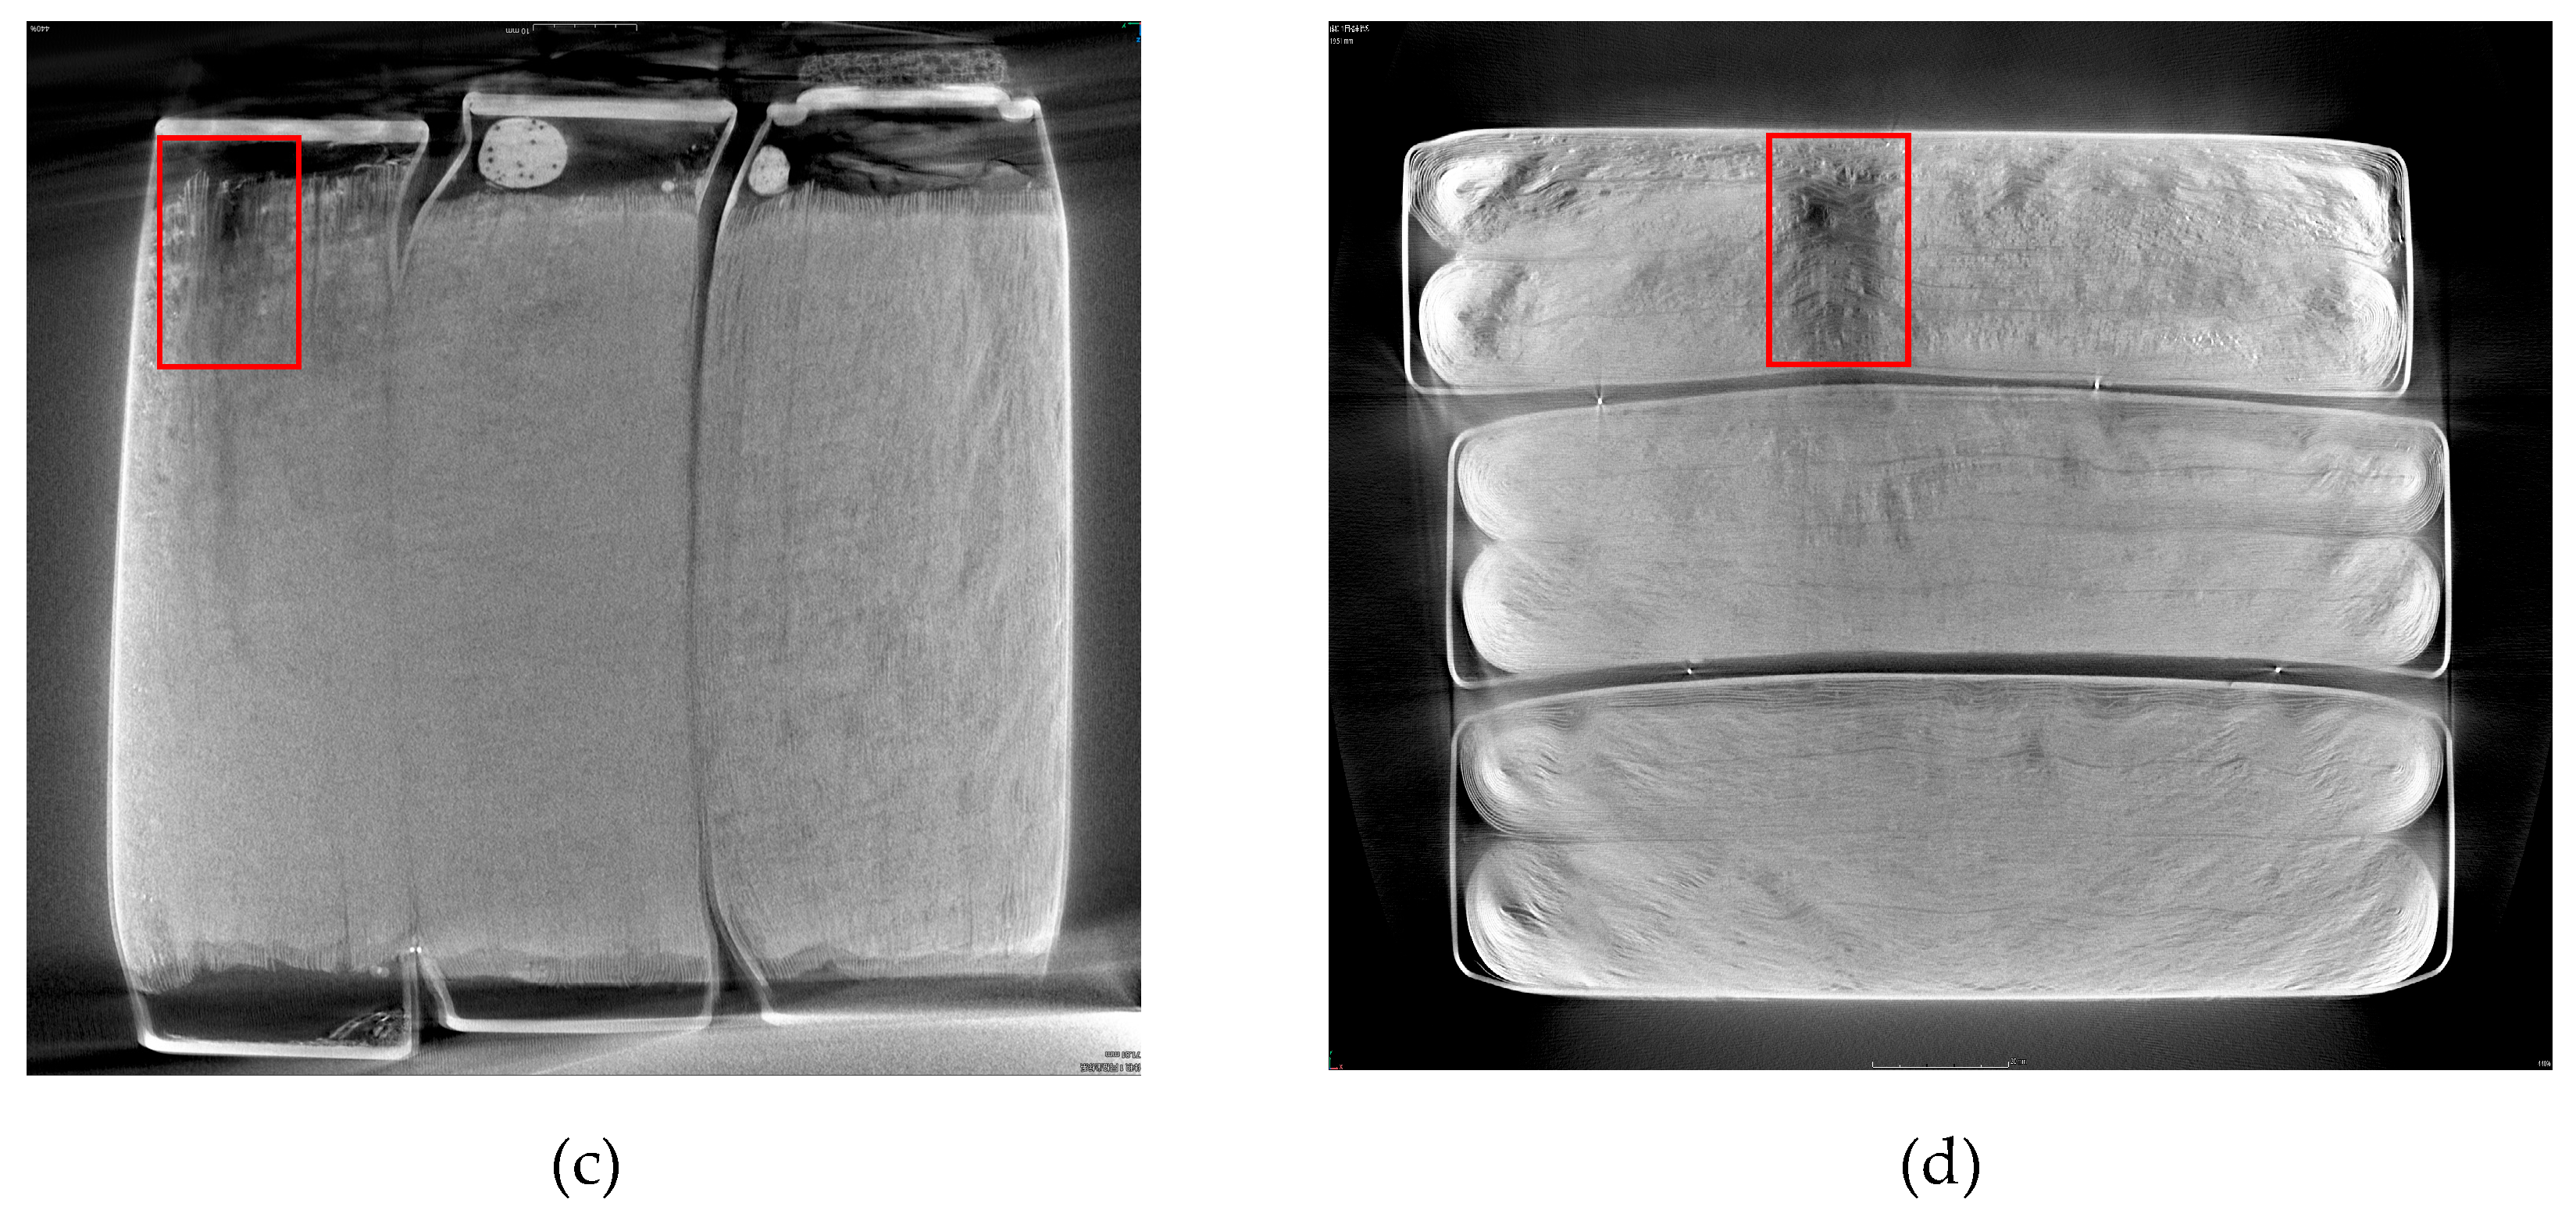

Table 1.
Results of GC-TCD-FID test.
| Gas | Contents (%) | |
|---|---|---|
| Cell | Module | |
| CO | 15.85 | 14.76 |
| CO2 | 15.52 | 15.11 |
| H2 | 10.51 | 10.3 |
| CH4 | 2.62 | 2.86 |
| C2H6 | 0.34 | 0.39 |
| C2H4 | 3.45 | 3.54 |
| C3H8 | 0.08 | 0.09 |
| Others | 51.63 | 52.95 |
Table 2.
Results of MS test.
| Compound | CAS |
|---|---|
| Cyclopropane | 75-19-4 |
| Trans-2-pentene | 646-04-8 |
| 3,4-epoxy-1-butene | 930-22-3 |
| 2-methyl-1-pentene | 763-29-1 |
| Methyl peroxide | 690-02-8 |
| 1-heptyne | 628-71-7 |
| benzene | 71-43-2 |
| 1-heptene | 592-76-7 |
| Ethyl Methyl Carbonate | 623-53-0 |
| toluene | 108-88-3 |
| 1,1-dimethylcyclopropane | 1630-94-0 |
| 2,3-dimethyl-1-pentene | 3404-72-6 |
| Bromocyclohexane | 108-85-0 |
| 1,1-dimethylcyclopropane | 1630-94-0 |
Disclaimer/Publisher’s Note: The statements, opinions and data contained in all publications are solely those of the individual author(s) and contributor(s) and not of MDPI and/or the editor(s). MDPI and/or the editor(s) disclaim responsibility for any injury to people or property resulting from any ideas, methods, instructions or products referred to in the content. |
© 2023 by the authors. Licensee MDPI, Basel, Switzerland. This article is an open access article distributed under the terms and conditions of the Creative Commons Attribution (CC BY) license (http://creativecommons.org/licenses/by/4.0/).
Copyright: This open access article is published under a Creative Commons CC BY 4.0 license, which permit the free download, distribution, and reuse, provided that the author and preprint are cited in any reuse.


