
Submitted:
02 February 2025
Posted:
04 February 2025
You are already at the latest version
Abstract
Diagnostic Reference Levels (DRL) in digital mammography were determined from 31,040 digital mammography images acquired from diagnostic and screening examination data from eight state-managed mammography centres/units in the Republic of North Macedonia (RM). The main objective is to establish a Diagnostic Reference Level for mammography examinations at different ranges of breast thickness. Materials and methods: ~30,000 mammography images were used to evaluate Mean Glandular Dose (MGD), and Compressed Breast Thickness (CBT)for each projection, craniocaudal (CC) and mediolateral oblique (MLO). The stratified DRL was derived by calculating the 75th percentile of the MGD across all the samples at various CBT ranges for both projections. Results and Discussion: The overall median MGDs, minimum, and maximum were calculated to be 1.15 mGy, 0.1 mGy, and 9.93 mGy, respectively. As the CBT increased from 7 to 120 mm, the 75th percentile of the MGD increased from 0.94 mGy to 3.67 mGy for CC, and from 0.44 mGy to 4.91 mGy for MLO projections. Conclusion: The study established local DRLs for the digital mammography systems at the 75th percentile, which compared well with the values reported by other countries/regions. The DRL defined per CC and MLO image view for a specific CBT indicated that at least one mammography facility needs optimization.
Keywords:
Digital Mammography
; Mean Glandular Dose (MGD)
; Compressed Breast Thickness
; Diagnostic Reference Level (DRL)
; Radiation Exposure
1. Introduction
The mammography diagnostics and screening examinations are very important procedures for early breast cancer detection, which was proven to minimize mortality rate by 25-40% [1]. Estimating the absorbed dose delivered to the breast is a crucial aspect of quality control in mammography examinations, as there exists a small but significant stochastic risk of radiation-induced breast cancer associated with the X-ray exposure from this procedure [2,3,4]. One of the crucial parameters for measuring the X-ray exposure is the Mean Glandular Dose (MGD), defined as the average energy deposited in all breast glandular tissues per unit mass of the glandular tissue. Furthermore, the International Commission on Radiological Protection (ICRP) suggested that MGD within the breast is the most convenient quantity [5]. It is important to emphasize that the MGD calculations are made under the assumption that the breast tissue is homogeneous [6]. The radiation dose delivered to the breast can be calculated in different ways through the screening, and it depends on the breast granularity, breast thickness, tube voltage (kVp), energy spectrum depending on the target-filter combination, and the compression force (CF). The estimation of MGD can be achieved by utilizing either a standard patient or a standard phantom [7].
The increase of the compression force (CF) is aimed at decreasing the breast thickness and reducing radiation dose thereby [8], allowing a mammography examination to give accurate diagnostic information at the same time delivering an acceptable dose to the breast, without increasing the potential risk of causing radiation-induced cancer [9].
To improve dose optimization in radiological examinations the International Commission on Radiological Protection( ICRP) set recommendations on the use of Diagnostic Reference Levels (DRLs) [10], defined as a dose level for a typical X-ray examination of a group of patients of standard body size, using broadly defined types of digital mammography equipment. These levels are expected not to be higher for standard procedures when good and normal practice is applied, depending on the diagnostic and technical performance [11,12]. The introduction of the DRLs parameter provides a measurement of quality monitoring to limit variation in the dose among different imaging centres/units [10]. Again, the DRLs are the most common parameter used for quality control, comparison of dose levels, optimization and limitation differentials in dose among the mammography imaging centres (units in the preset work).
In this work, we scrutinized the mean and the 75th percentile of MGDs from the studied eight mammography units and compared our results with the Diagnostic Reference Levels [13]. Also, we have compared our calculated mean MGD values of all the examined eight mammography units with those of several countries globally (Belgium, Australia, Ghana, Malaysia, Sudan, Palestine, Morocco, and Dubai). In our work, the DRL dependence as a function of the compression thickness (CBT) was presented for a wide CBT range (7 mm – 119 mm) from CC and MLO projections, in a similar manner as done by other authors.
So far North Macedonia does not have a national/regional registry of DLRs in mammography. The typical values in mammography units were established with the present study, as a first step towards raising the need for optimization. Diagnostic Reference Levels (DRLs) were introduced for quality control, optimization and protection, to help limit variations in dose delivered among and within imaging centres and these levels are expected not to be exceeded for a standard diagnostic procedure when good and normal practice is applied [14]
2. Materials and Methods
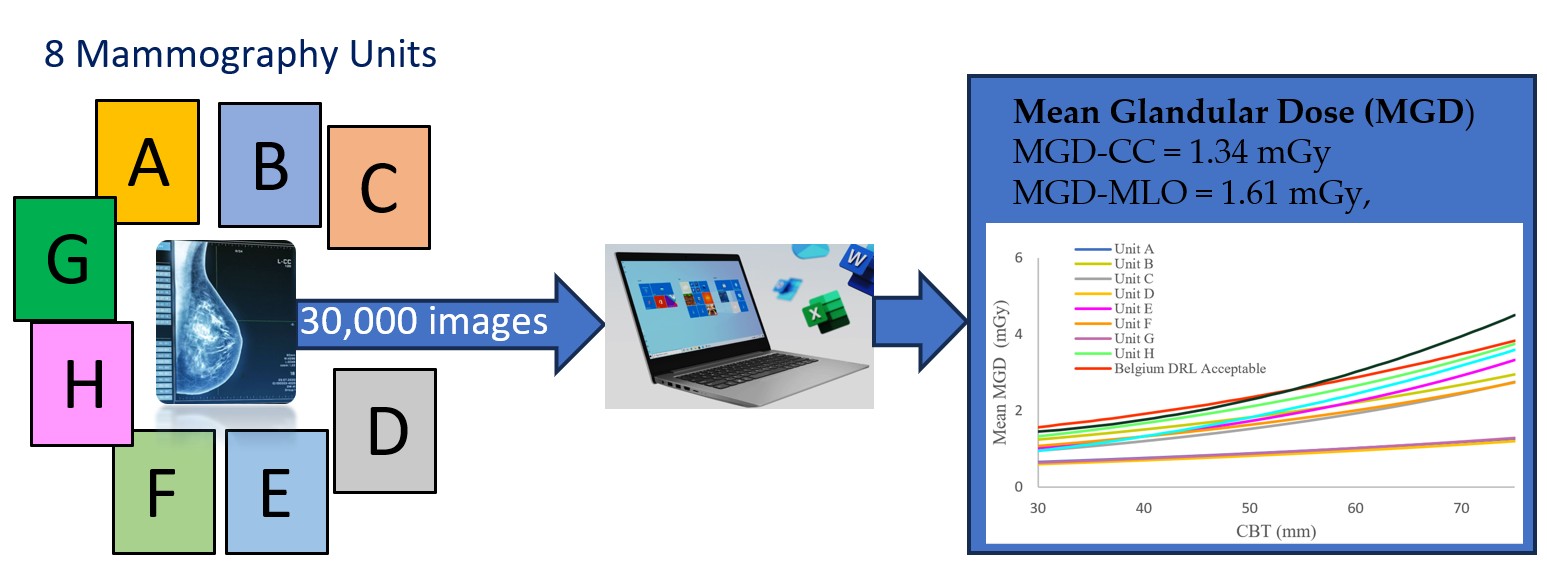
The data for the present study were taken from eight mammography units in North Macedonia (NM) of the total 25, representing 32% of all the digital mammography units in the country [15] with even geographical representation. For seven mammography units (marked as Unite A, B, C, D, E, F, G) the data were harvested using dose monitoring software (DOSE, v.17.11, Qaelum NV, Belgium). In the remaining 8th mammography Unit (H), the patient dose values were extracted from the Digital Imaging and Communication in Medicine (DICOM) headers. All the full digital mammography images were taken on cases (only women) aged between 10 and 89 years from both the breast screening and diagnostic cases. Each examination consisted of taking a total of 4 projections: right and left breast craniocaudally (CC) view and right and left breast mediolateral oblique (MLO) view. A total of 31,040 mammographic projections (7,760 x 4 positions = 31,040). The manufacturer and the relevant technology details of the digital mammography devices in each Unit are listed in Table 1.
The data acquired from the DOSE and DICOM were then extracted and transferred to Microsoft Office Excel for further numerical analysis. The data for each mammography Unit were categorized according to their compressed breast thickness in intervals of 10 mm thicknesses. The mean glandular dose values (MGDs) per mammography unit were calculated for each thickness interval. Main statistical data were calculated: minimum dose (mGy), maximum dose (mGy), median dose (mGy), standard deviation, mean thickness (mm).
The compression force applied to the breast during mammography was nominally sufficiently high to ensure the thickness is no longer a limiting factor for visualizing details, such as microcalcifications in the breast, but sufficiently low to only induce tolerable pain for most women. Also, the the optimal force should adequately thin the breast, while not causing excessive distortion of the anatomic features.
From all the MGDs calculated for all projections we have: (a) evaluated the 75th percentile from all the mammography units in RM and compared them to the results reported for other countries and applied the same methodology (i.e. patient survey); (b) compared the mean MGD value to the European dose levels for screening and diagnostic mammography procedures for compressed thicknesses CBT ranging from 7 to 119 mm; (c) compared the mean MGD for each of the eight mammography units for each CBT (range between 30 mm and 75 mm with European achievable dose levels, European Acceptable dose levels, and Belgian diagnostic reference levels. Herein, the acceptable dose level (ACC) is the maximum mean value of MGD, while the achievable dose level (ACH) is the recommended level [16,17].
According to the European Guidelines [18], the Acceptable dose level (ACC) represents the highest Mean Glandular Dose (MGD) for the equivalent breast, while the Achievable dose level (ACH) indicates the recommended operating standard for the mammography systems. According to European guidelines, both the acceptable and achievable levels are established through calculations based on European formalism, utilizing conversion coefficients developed by Dance et al. [19,20].
All the transferred data were then analyzed using SPSS version 25. Correlations between CBT, and patient age compression force, tube voltage, tube current, and entrance dose for both MLO and CC were analyzed using the Pearson correlation coefficient test. For a non-normal distribution dataset, the parametric one-way ANOVA test was used. Descriptive statistics were used to acquire MGD mean, median, standard deviation, percentiles, and range. The differences among MGDs across different CBT groups were tested using the Kruskal–Wallis test.
Finally, the research was conducted under strict ethical considerations the information and identity of the contributors with their mammograms were confidential and used only for the present study by restricting access to the study information which was in hard copy as well as password protection of the soft copy documents. Anonymity was maintained for all eight participating state hospitals/units and study participants by using alphabetical letters (A, B, C, D, E, F, G, and H) and serial numbers for hospitals and patients rather than their names respectively.
3. Results and Discussion
The study included 7760 women who underwent mammography examination, ranging between 10 and 89 years with a mean age of 54.12 ± 11.5 years presented in Figure 1. The cases were organized into age groups (step 10 years) from 10-19, 20-29, 30-39 …… and 80-89 years.
The normal age distribution of the cases for diagnostic and screening examinations is presented in Figure 1. Herein, according to the Gaussian fit (red line), the age group 50-59 years occurs with the highest frequency, representing about 33% of cases while the age group of 10-19 years recorded the lowest number of patients representing 0.04 % of reported cases.
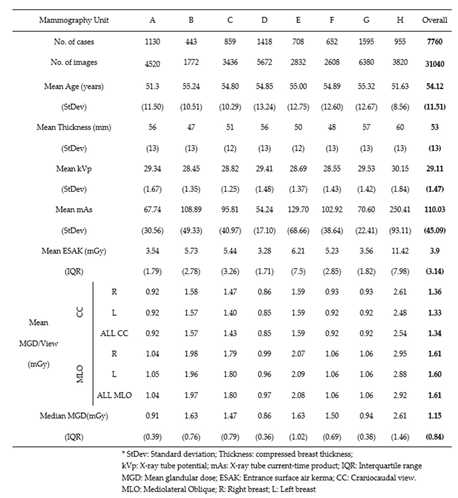
In Table 2 we present the overall summary of the background data taken from each unit: Number of images taken from each mammography unit, number of cases examined, mean age per unit, Median MGD per image, view (MLO, CC), compressed breast thickness, kVp, and mAs. The table also includes the mean patient age, compressed breast thickness, and exposure factors (kVp, mA, exposure time). The evaluated mean MGD/View for all patients for each MLO and CC image were calculated to be 1.34 mGy and 1.61 mGy, respectively. Examination of the data in Table 2 demonstrated minimal differences in the calculated mean doses between the CC and MLO projections.
Table 2. Number of images/examinations per mammography Unit (a, B, C, D, E, F, G, H), exposure parameters mean, median Entrance surface air kerma, and median mean glandular dose per view, image, and case, for 31040 mammograms across 8 Units.
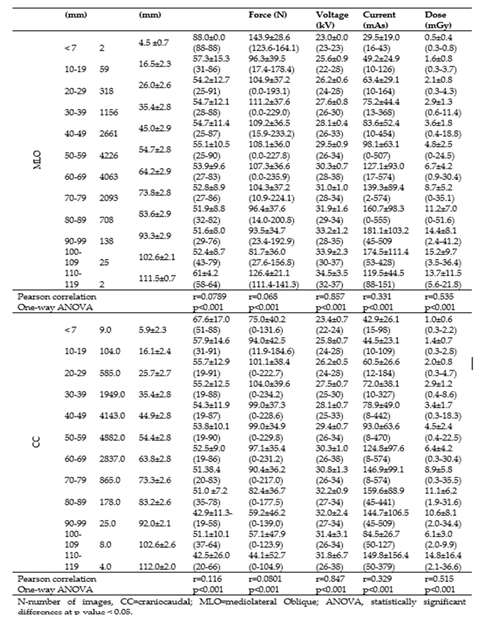
In Table 3 we present the relevant patient characteristics and scanning parameters across ranges of breast thicknesses, for both MLO and CC projections. From the data in Table 3, notably, with the increase of the compression force (CF), X-ray tube voltage, and tube current, the entrance dose also increased for both MLO and CC projections.
Table 3. Patient characteristics and scanning parameters across breast thicknesses for MLO and CC projections (total number of images is n = 31040).
The dependence of the mean MGD on CBT is represented by curves fitted using an exponential function based on the least squares method applied to the empirical data points. For comparison purposes, we also present the mean MGD versus CBT curves alongside the Acceptable European, Achievable European, and Belgian diagnostic reference levels, as described in the European guidelines for screening and diagnostic mammograms [16,17,18,19].
The results of the MLO projections reveal the following Pearson correlation findings: there is an insignificant negative relationship between thickness (mm) and patient age (r = -0.0789), as well as an expected insignificant negative relationship between thickness (mm) and compression force (N) (r = -0.068). Additionally, a significant large positive relationship is observed between thickness (mm) and tube voltage (kV) (r = 0.857), a significant medium positive relationship between thickness (mm) and tube current (mAs) (r = 0.331), and a significant large positive relationship between thickness (mm) and entrance dose (mGy) (r = 0.535). Similarly, for the CC projections, comparable trends are observed. The Pearson correlation indicates an insignificant negative relationship between thickness (mm) and patient age (r = -0.116), as well as an insignificant negative relationship between thickness (mm) and compression force (N) (r = -0.0801). However, there is a significant large positive relationship between thickness (mm) and tube voltage (kV) (r = 0.847), a significant medium positive relationship between thickness (mm) and tube current (mAs) (r = 0.329), and a significant large positive relationship between thickness (mm) and entrance dose (mGy) (r = 0.515) (Table 3).
The results of the one-way ANOVA revealed significant differences among the imaging parameters across all CBTs. As the CBT increased, the compression force applied showed a significant increment (p < 0.001), suggesting that greater force is required to achieve optimal image quality in thicker breasts. Similarly, we observed statistically significant increments in the tube voltage (p < 0.001) and tube current (p < 0.001) with the increase of the CBT. Additionally, the entrance dose demonstrated a significant rise (p < 0.001) with the increase in breast thickness (Table 3).
The distributions of the compression breast thickness (CBT), with a mean compression force (CF) for the eight mammography units are depicted in Figure 2. Herein, red data labels represent lower compression force than the recommended (< 75 N), while the green ones present those above the recommended values. All eight charts in Figure 2 clearly show that a significant number of patients (red dots) experienced compression forces much lower than the recommended value. The cases represented by the green dots experienced compression that exceeded the recommended value. It is evident that the radiographers in unit C with a mean CF of 119.13N ± 34.35N, unit E with 140.90N ± 41.02N, and unit F with 112.45N ± 37.90N applied significantly higher compression forces in comparison with the remaining units, unit A with mean CF 84.40N ± 20.19N, Unit B with 94.17N ± 23.88N, unit D with 90.22N ± 29.31N, Unit G with 86.53N ± 24.416 N, and Unit H with CF with 123.54N ± 44.58N.
The error bars from Figure 3, stretch between the minimum and maximum MGD range, the line within each rectangular box represents the median MGD value (i.e., DRL value), while the rectangular box upper and lower borders demonstrate the interquartile range (IQR: 25th to 75th percentile). The median MGD for both CC and MLO projections ranges between 0.56 mGy and 1.78 mGy for CC and between 0.36 mGy and 4.28 mGy for MLO. Also, it appeared that the maximum dose of the MGD values for each 10 mm CBT interval ranges between 1.41 mGy and 8.94 mGy for CC, and between 0.53 mGy and 9.93 mGy for MLO.
Furthermore, the Kruskal – Wallis test showed a statistically significant difference between the groups (p < 0.001). At the 75th percentile, the measured parameter values are 0.94, 1.08, 1.11, 1.3, 1.61, 2.11, 2.81, 3.2, 2.54, 1.63 and 3.67 mGy for CC and 0.44, 1.17, 1.32, 1.38, 1.75, 2.25, 2.80, 3.38, 4.02, 4.40, 4.91 mGy for MLO projections the respective CBT ranges of < 9 mm, 10 -19 mm, 20 – 29 mm, 30 – 39 mm, 40 – 49 mm, 50 – 59 mm, 60 – 69 mm, 70 – 79 mm, 80 – 89 mm, 90 – 99 mm, 100 – 109 mm, and 110 – 119 mm. The 75th percentile values, which are considered to be local diagnostic reference levels, exhibit an increasing trend for the higher CBT ranges, indicating a potential correlation between the measured parameter and breast thickness. For the higher CBT ranges, the 75th percentile values show an increasing trend, suggesting a positive relationship between MGD and breast thickness. (Figure 3).
The extracted MGDs for the reported national levels are listed in Table 4, showing variations across the nation’s DRLs. In our study, the 75th percentile of the MGD increases from 0.94 mGy and 3.67 mGy for CC, and from 0.44 mGy to 4.91 mGy for MLO, depending on the increase of the breast thickness. A New South Wales study also presents results for digital radiography (DR) and computed radiography (CR), for CBT intervals of 20 mm to 110 mm. The latter study shows similar results for CBT to those of our present study, although they have considered different detector technologies. However, in the present study, for comparison we consider only results from DR systems (9). The comparison showed that the respective MGD (9) spreads within the range from 0.97 to 3.31 mGy, which is generally higher than ours, except for those of CBT lower than 30 mm. Furthermore, the results from Ghana by Dzidzornu et al. [21], present the 75th percentile of MGD for CC projections to be 1.6 mGy (CBT:36 mm) and 2.4 (CBT:45 mm) for MLO projections, which appear to be higher than those of our present study. Also, as evident from a local report for Malaysia, the DRLs for CC and MLO are 1.68 mGy (CBT: 50.9 mm) and 2.25 mGy 2.25 (CBT: 58.9 mm), respectively, showing values generally higher than ours [22]. In Sudan, the local DRLs for DR were 3.48 mGy (CBT:36 mm) for CC and 2.03 mGy (CBT:44 mm) for MLO [23], figures show that the calculated DRLs are lower than those registered in Gaza (2.5 mGy, 50–60 mm for CC projections [24]. Furthermore, the mean CBT value recorded in Morocco is 55 mm. The DRLs reported for all the three diagnostic centers are 1.6 mGy, 1.7 mGy and 1.8 mGy [25]. Notably, the values are close to those evaluated in our study. Finally, in our study, we recorded higher DRL values compared to the two studies done in Dubai [26,27]. The higher DRLs could be due to the different procedures and techniques employed in their studies.
Table 4. The present study’s MGD DRLs in line with local/regional and national reported DRLs.
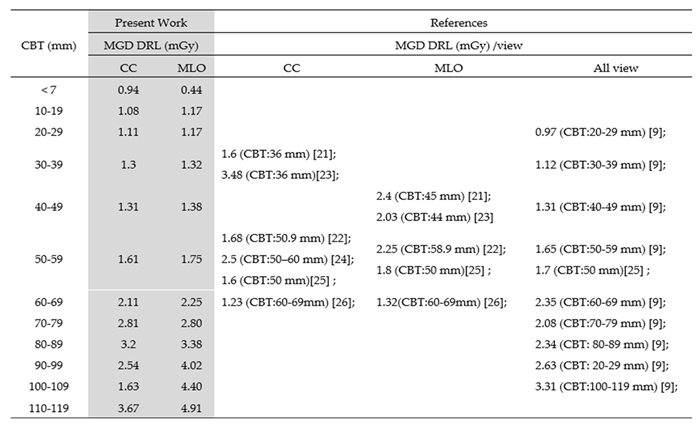
Table 5 presents typical MGD (mGy) values for diagnostic and screening mammography for CC and MLO projections along with European DRLs [17]. Our typical values were found to be lower than the acceptable European values but also than the achievable European values.
In Figure 4 we present the dependence of the average Mean Glandular Dose (MGD) values obtained from Cranio-caudal (CC) and Medio-lateral oblique (MLO) values of the Compression Breast Thickness (CBT) within the range between 30 mm and 75 mm for eight Units (A, B, C, D, E, F, G, H) in North Macedonia. As evident from Figure 4, the Mean Glandular Dose (MGD) values for North Macedonia for seven of the eight examined (out of a total of 25) mammography units were lower than the European Achievable Dose Level (ACH), the European Acceptable Dose Level (ACC), and Belgian diagnostic reference levels. However, the results from Unit H appeared to be slightly higher than the European ACC. These differences may be attributed to variations in technology. Additionally, slight differences in compressed breast thickness may account for the higher doses observed. These findings highlight opportunities for optimizing practices in each unit.
4. Conclusion
Dose reference values were evaluated from approximately 30,000 digital mammography images from over 8,000 diagnostic and screening cases. The data were collected between 2020 and 2024 from eight mammography units in North Macedonia.
Our analysis showed that the Mean Glandular Dose (MGD) from all examinations included in this study, obtained from both the CC and MLO projections of both breasts, were evaluated to be 1.34 mGy and 1.61 mGy, respectively. The median MGD was calculated to be 1.15 mGy, with minimum and maximum values of 0.1 mGy and 9.93 mGy, respectively. The 75th percentile of the MGD for CC acquisitions increased from 0.94 mGy to 3.67 mGy with the rise in Compressed Breast Thickness (CBT) within the range of 0–120 mm. Similarly, the 75th percentile of MGD for MLO acquisitions increased from 0.44 mGy to 4.91 mGy with the increase in CBT.
The MGD values for North Macedonia for seven of the eight examined (out of a total of 25) mammography units were found to be lower than the European Achievable Dose Level (ACH), the European Acceptable Dose Level (ACC), and Belgian diagnostic reference levels. However, the results from Unit H appeared to be slightly higher than the European ACC. Variations in technology and slight differences in compressed breast thickness may account for the higher doses observed in this unit. These findings highlight opportunities for optimizing practices across all units.
A comparative analysis of diagnostic reference levels (DRLs) in mammography of North Macedonia and other countries/regions reveals distinct variations in radiation dose practices and protocols. Our study demonstrates that DRLs in North Macedonia may differ from international benchmarks due to factors such as patient demographics, screening and diagnostic practices, but also from the variations in technology and equipment. We have also shown that differences in mammography imaging parameters, including compression force and exposure settings, contribute to the observed dose variations in DRLs.
In summary, this study introduces patient-specific diagnostic reference levels (DRLs) for different ranges of compressed breast thickness (CBT) in North Macedonia. The establishment of these values provides valuable insights into the radiation dose associated with screening and diagnostic mammography, supporting efforts for benchmarking and optimization for patient safety and imaging quality in the country.
Author Contributions
methodology, M.M.A., and M.R.; validation, M.M.A., and M.R.; formal analysis, M.M.A., and M.R.; investigation, M.M.A., and M.R.; data curation, M.M.A., and M.R.; writing—original draft preparation, M.M.A.; writing—review and editing, M.R.; All authors have read and agreed to the published version of the manuscript.
Acknowledgments
We would like to acknowledge Dr Vesna Gersan from IAEA for providing us with a great deal of clinical data from the Mammography units in North Macedonia, subject to this study.
Conflicts of Interest
The authors declare no conflicts of interest.
Abbreviations
| The following abbreviations are used in this manuscript | kVp Peak kilovoltage mAs Current. |
| MGD | Mean glandular dose |
| DRL | Diagnostic Reference Level |
| CC | Craniocaudal |
| MLO | Mediolateral oblique |
| CBT | Compressed breast thickness |
| kVp | Peak kilovoltage |
| mAs | Tube Current |
| IQR | Interquartile range |
References
- Jayadevan, R. Armada, M. J., Shaheen, R., Mulcahy, C., Slanetz, P. J., ‘Optimizing digital mammographic image quality for full-field digital detectors: artifacts encountered during the QC process’, Radiographics, vol. 37, no. 7, pp. 2080–2089, 2015. [CrossRef]
- D. R. Dance, ‘Monte Carlo calculation of conversion factors for the estimation of mean glandular breast dose’, Phys. Med. Biol., vol. 35, no. 9, pp. 1211–1219, Sep. 1990. [CrossRef]
- ICRP (International Commission on Radiological)., ‘1990 Recommendations of the International Commission on Radiological Protection’, in Annals of the ICRP, 60th ed., vol. 21, ICRP Publication 60, 1991, pp. 1–3. [Online]. Available: https://www.icrp.org/.
- S. D. Maria, T. J. A. van Nijnatten, C. R. L. P. N. Jeukens, S. Vedantham, M. Dietzel, and P. Vaz, ‘Understanding the risk of ionizing radiation in breast imaging: Concepts and quantities, clinical importance, and future directions’, Eur. J. Radiol., vol. 181, Dec. 2024. [CrossRef]
- K. W. Ma, D. G. Darambara, A. Stewart, S. Gunn, and E. Bullard, ‘Mean glandular dose estimation using MCNPX for a digital breast tomosynthesis system with tungsten/aluminum and tungsten/aluminum+silver x-ray anode-filter combinations’, Med. Phys., vol. 35, no. 12, pp. 5278–5289, Dec. 2008. [CrossRef]
- R. Klein et al., ‘Determination of average glandular dose with modern mammography units for two large groups of patients’, Phys. Med. Biol., vol. 42, no. 4, pp. 651–671, Apr. 1997. [CrossRef]
- M. E. Suleiman, P. C. Brennan, and M. F. McEntee, ‘Diagnostic reference levels in digital mammography: a systematic review’, Radiat. Prot. Dosimetry, vol. 167, no. 4, pp. 608–619, Dec. 2015. [CrossRef]
- M. A. Helvie, H. P. Chan, D. D. Adler, and P. G. Boyd, ‘Breast thickness in routine mammograms: effect on image quality and radiation dose’, AJR Am. J. Roentgenol., vol. 163, no. 6, pp. 1371–1374, Dec. 1994. [CrossRef]
- M. E. Suleiman, M. F. McEntee, L. Cartwright, J. Diffey, and P. C. Brennan, ‘Diagnostic reference levels for digital mammography in New South Wales’, J. Med. Imaging Radiat. Oncol., vol. 61, no. 1, pp. 48–57, Feb. 2017. [CrossRef]
- ICRP iICRP Publication 73 (International Commission on Radiological)., Radiological Protection and Safety in Medicine. ICRP. 2, 1996, ICRP Publication 73, Vol. ICRP, pp. 1-47., 2nd ed., vol. 26. 1996. [Online]. Available: https://www.icrp.org/publication.asp?id=ICRP%20Publication%2073.
- K. Smans, H. Bosmans, M. Xiao, A. K. Carton, and G. Marchal, ‘Towards a proposition of a diagnostic (dose) reference level for mammographic acquisitions in breast screening measurements in Belgium’, Radiat. Prot. Dosimetry, vol. 117, no. 1–3, pp. 2005. [CrossRef]
- P. Baldelli, J. McCullagh, N. Phelan, and F. Flanagan, ‘Comprehensive dose survey of breast screening in Ireland’, Radiat. Prot. Dosimetry, vol. 145, no. 1, pp. 52–60, Apr. 2011. [CrossRef]
- ‘E. Vaño, D.L. Miller, C.J. Martin, M.M. Rehani, K. Kang, M. Rosenstein, P. Ortiz-Lopez, S. Mattsson, R. Padovani, A. Rogers’, in Diagnostic Reference Levels in Medical Imaging, 1st ed., vol. 46, ICRP Publication 135, 2017, pp. 1–144. [Online]. Available: https://www.icrp.org/publication.asp?id=icrp%20publication%20135.
- E. Agency, ‘Quality Assurance Programme for Digital Mammography’, International Atomic Energy Agency, Text, 2011. Accessed: Jan. 03, 2025. [Online]. Available online: https://www.iaea.org/publications/8560/quality-assurance-programme-for-digital-mammography.
- M. Dosanjh et al., ‘Availability of technology for managing cancer patients in the Southeast European (SEE) region’, Clin. Transl. Radiat. Oncol., vol. 34, pp. 57–66, May 2022. [CrossRef]
- N. Perry, M. Broeders, C. de Wolf, S. Törnberg, R. Holland, and L. von Karsa, ‘European guidelines for quality assurance in breast cancer screening and diagnosis. Fourth edition--summary document’, Ann. Oncol. Off. J. Eur. Soc. Med. Oncol., vol. 19, no. 4, pp. 614–622, Apr. 2008. [CrossRef]
- Directorate-General for Health and, Consumers; et al. , ‘European guidelines for quality assurance in breast cancer screening and diagnosis.4th edition, supplements’, Publications Office of the European Union, 2013. Accessed: Jan. 03, 2025. [Online]. Available: https://data.europa.eu/doi/10.2772/13196.
- N. Perry, M. Broeders, C. de Wolf, and European Commission, Eds., European guidelines for quality assurance in breast cancer screening and diagnosis, Fourth edition. Luxembourg: Publications Office, 2006.
- van Engen R, van Woudenberg S, Bosmans H, Young K, Thijssen M., ‘European Protocol for the Quality Control of the Physical and Technical Aspects of mammography Screening’, in EUREF office, 4th ed., 2003. [Online]. Available: EUREF office.
- D. R. Dance, C. L. Skinner, K. C. Young, J. R. Beckett, and C. J. Kotre, ‘Additional factors for the estimation of mean glandular breast dose using the UK mammography dosimetry protocol’, Phys. Med. Biol., vol. 45, no. 11, pp. 3225–3240, Nov. 2000. [CrossRef]
- E. Dzidzornu, S. K. Angmorterh, B. B. Ofori-Manteaw, S. Aboagye, K. Dzefi-Tettey, and E. K. Ofori, ‘Mammography Diagnostic Reference Levels (DRLs) in Ghana’, Radiogr. Lond. Engl. 1995, vol. 27, no. 2, pp. 611–616, May 2021. [CrossRef]
- N. Mohd Norsuddin, S. Segar, R. Ravintaran, N. Mohd Zain, and M. K. Abdul Karim, ‘Local Diagnostic Reference Levels for Full-Field Digital Mammography and Digital Breast Tomosynthesis in a Tertiary Hospital in Malaysia’, Healthc. Basel Switz., vol. 10, no. 10, p. 1917, Sep. 2022. [CrossRef]
- Suliman et al., Analysis of Average Glandular Dose (AGD) and Associated Parameters for Conventional and Digital X-Ray Mammography. 2021. [CrossRef]
- R. Karsh, ‘Baseline Assessment of Diagnostic Reference Level for Full Digital Mammography in Al Remal Martyrs Clinic. Al-Azhar University: Gaza, Palestine’, 2020.
- M. Talbi, M. E. Mansouri, O. Nhila, Z. Tahiri, K. Eddaoui, and M. Khalis, ‘Local diagnostic reference levels (LDRLs) for full-field digital mammography (FFDM) and digital breast tomosynthesis (DBT) procedures in Morocco’, J. Med. Imaging Radiat. Sci., vol. 53, no. 2, pp. 242–247, Jun. 2022. [CrossRef]
- E. Z. Dalah, M. K. Alkaabi, H. M. Al-Awadhi, and N. A. Antony, ‘Screening Mammography Diagnostic Reference Level System According to Compressed Breast Thickness: Dubai Health’, J. Imaging, vol. 10, no. 8, p. 188, Aug. 2024. [CrossRef]
- Noor, K.A.; Norsuddin, N.M.; Karim, M.K.; Isa, I.N.; Alshamsi, W. Estimating local diagnostic reference levels for mammography in Dubai. Diagnostic 2024, 14, 8. [Google Scholar] [CrossRef]
Figure 1.
Normal age distribution of the mammography cases (total number 7760), subject to this study.
Figure 1.
Normal age distribution of the mammography cases (total number 7760), subject to this study.
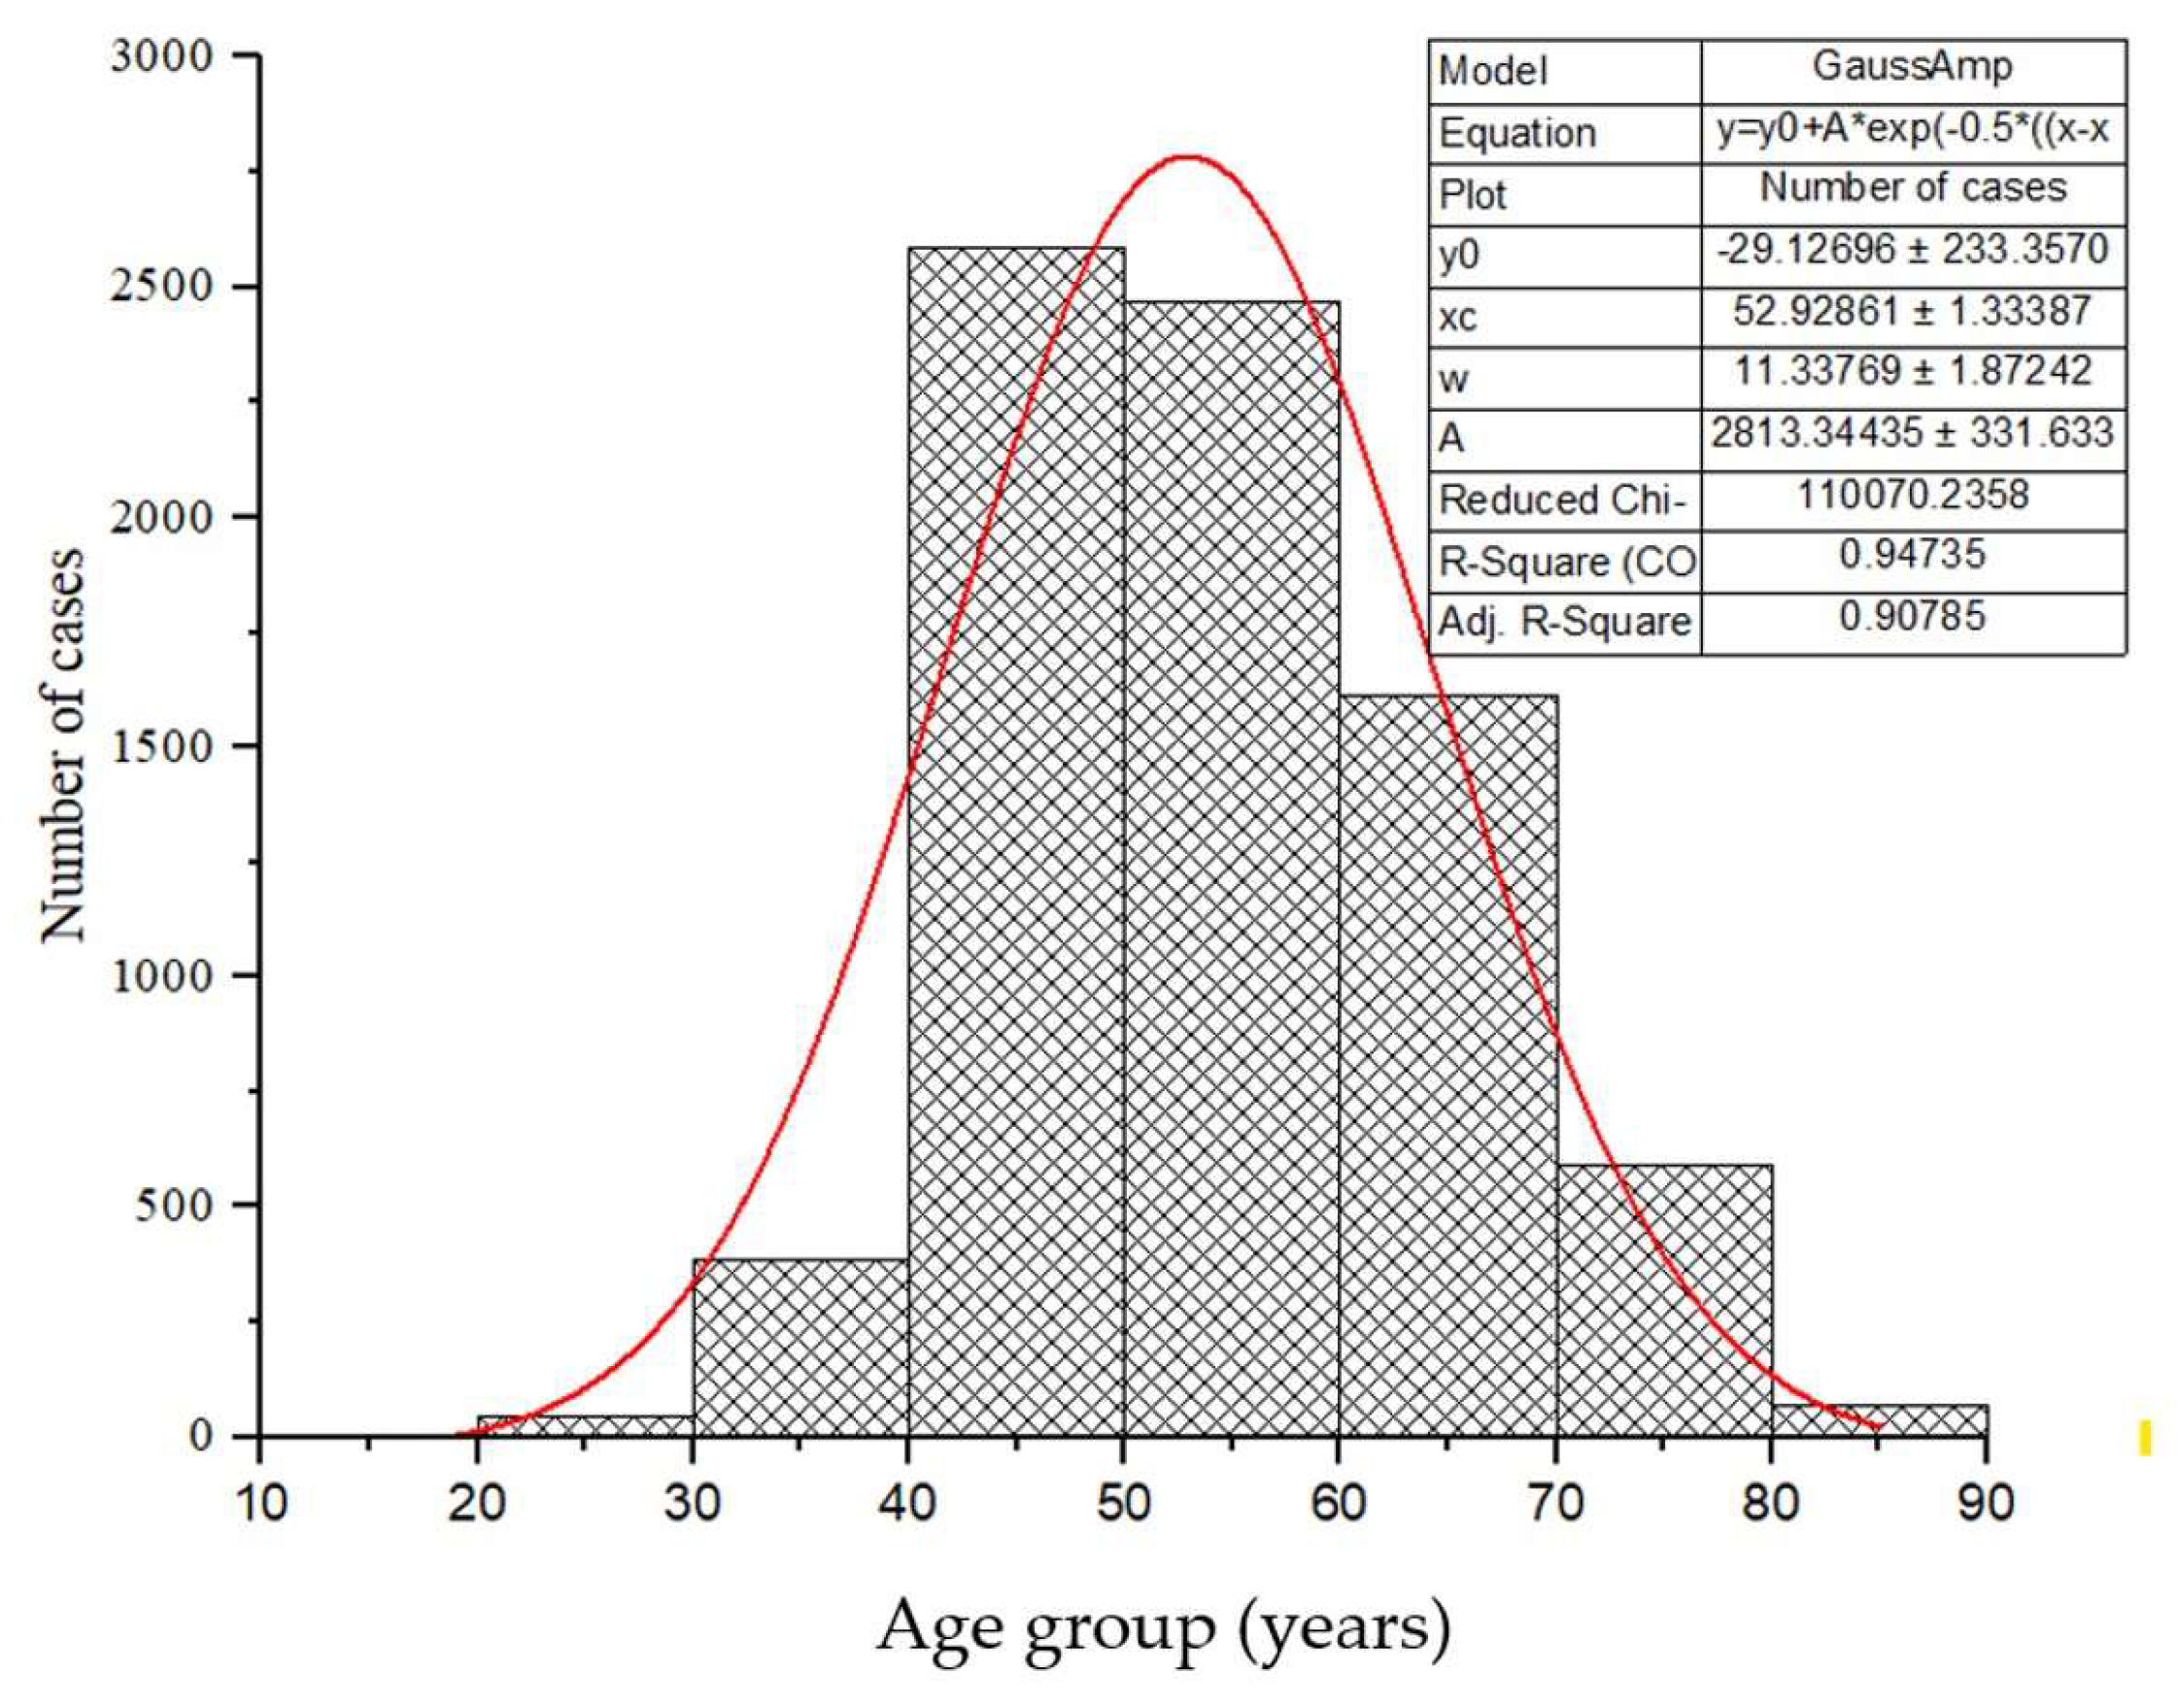
Figure 2.
Compression Breast Thickness (CBT in mm) as a function of the compression force (CF in N) for all projections across the eight examined Mammography Units A, B, C, D, E, F, G and H in North Macedonia.
Figure 2.
Compression Breast Thickness (CBT in mm) as a function of the compression force (CF in N) for all projections across the eight examined Mammography Units A, B, C, D, E, F, G and H in North Macedonia.
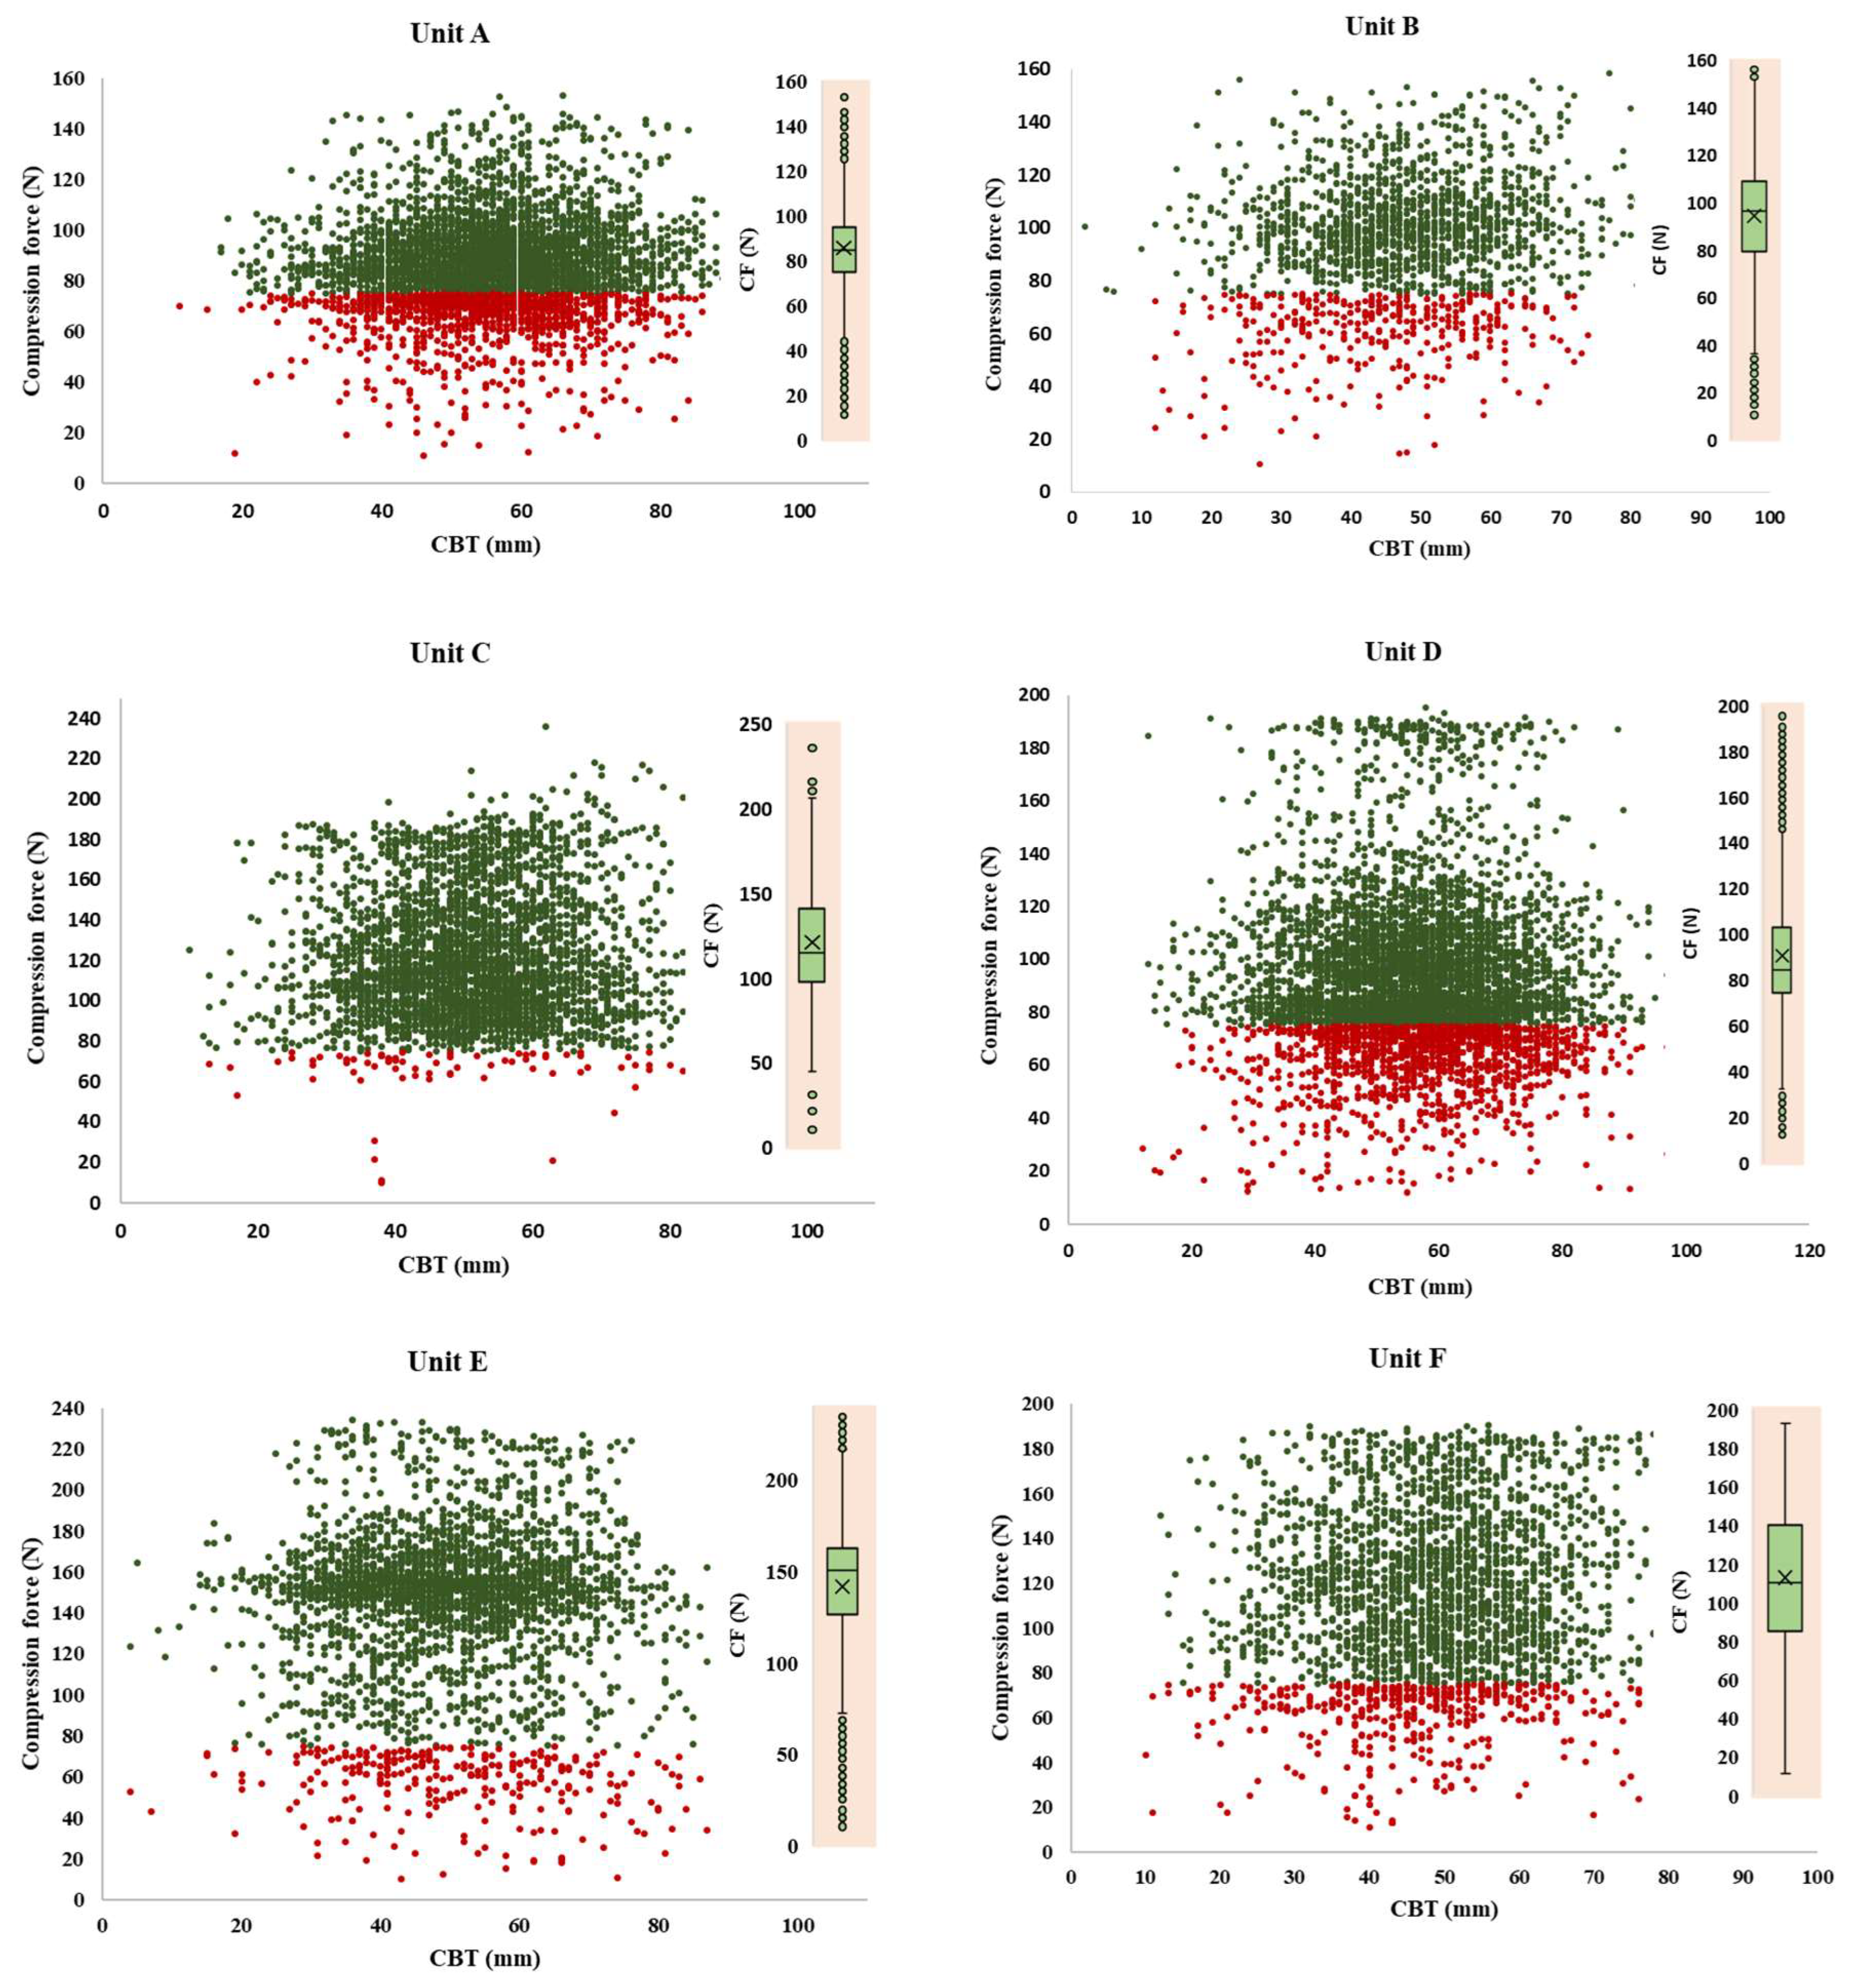
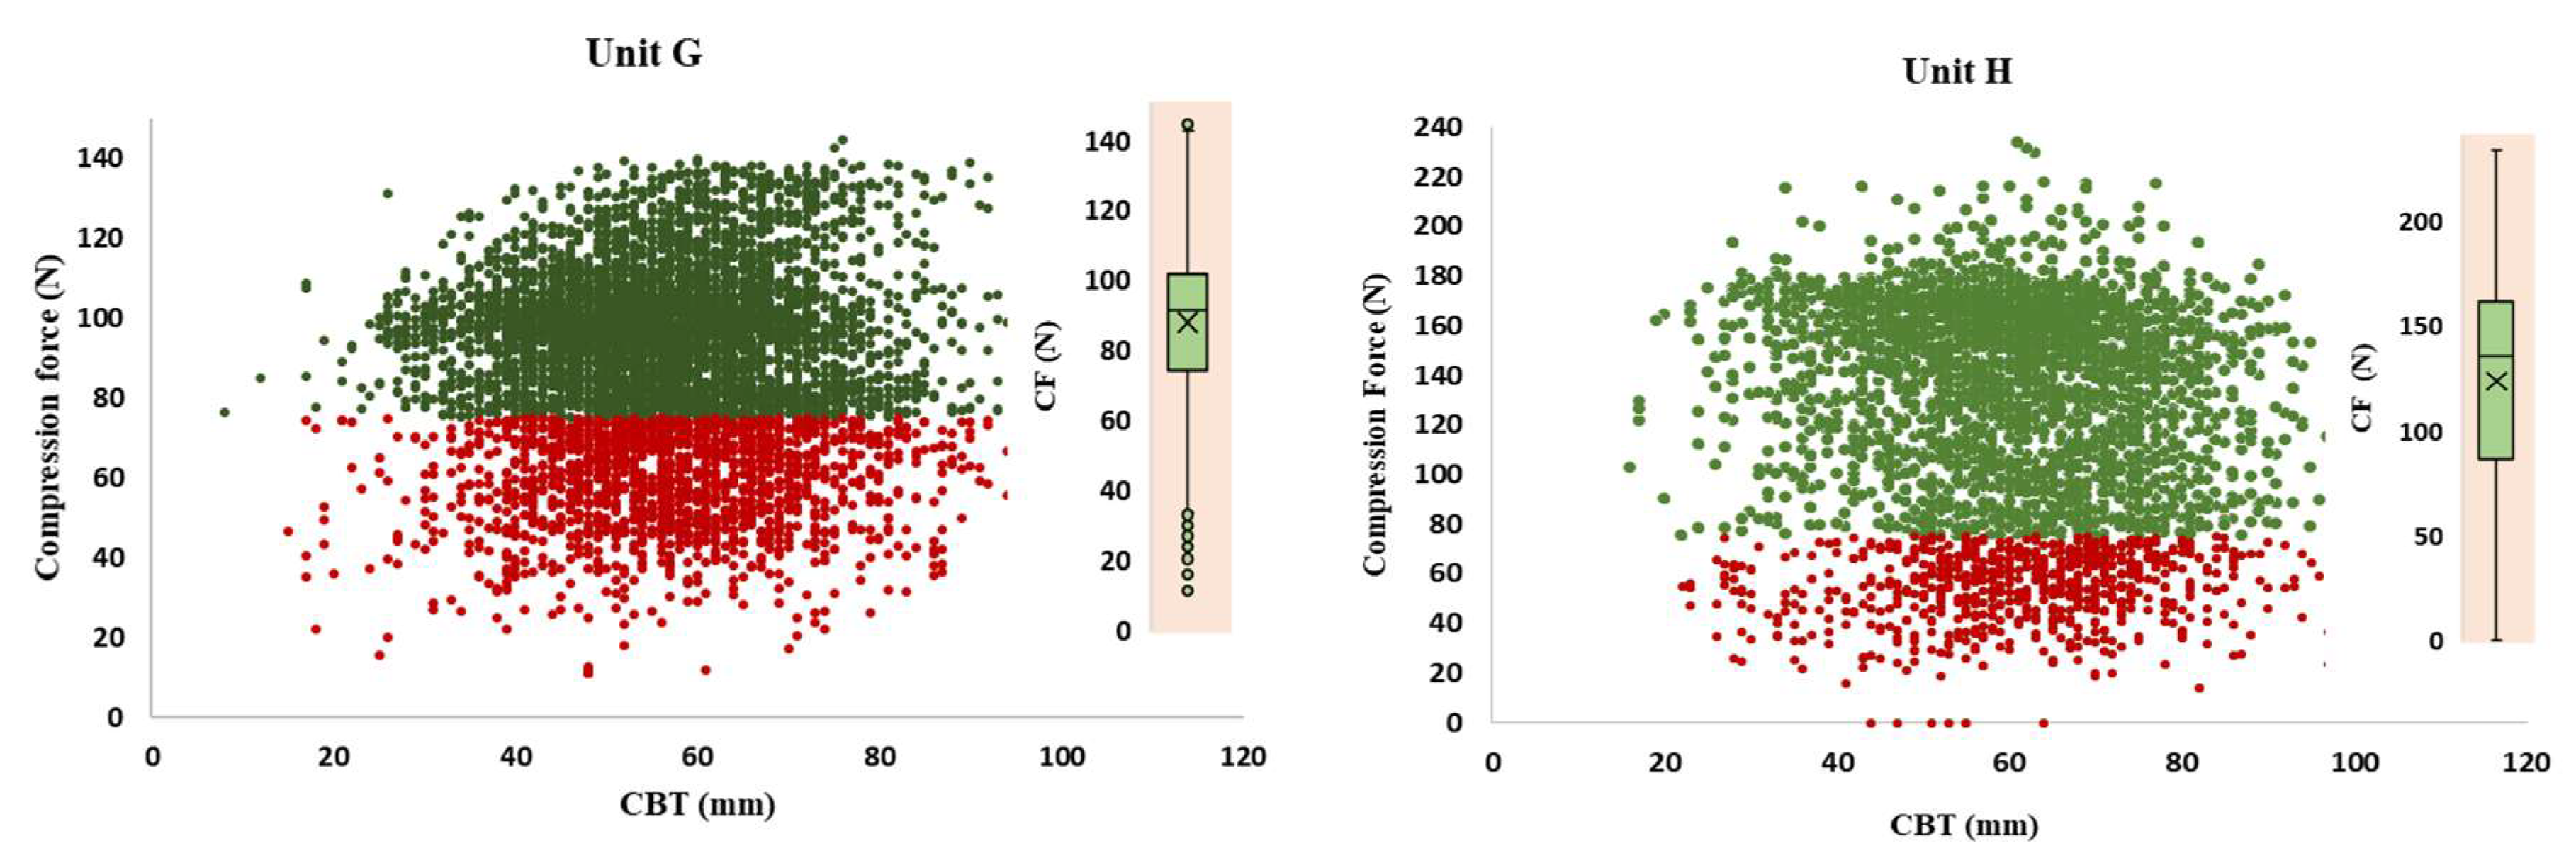
Figure 3.
Boxplots presenting the minimum dose (mGy), maximum dose (mGy), median dose (mGy), 25th percentile and 75th percentile of MGD for: (left) MLO and (right) CC projections in different CBT groups, evaluated from all the data of the eight mammography units in North Macedonia.
Figure 3.
Boxplots presenting the minimum dose (mGy), maximum dose (mGy), median dose (mGy), 25th percentile and 75th percentile of MGD for: (left) MLO and (right) CC projections in different CBT groups, evaluated from all the data of the eight mammography units in North Macedonia.
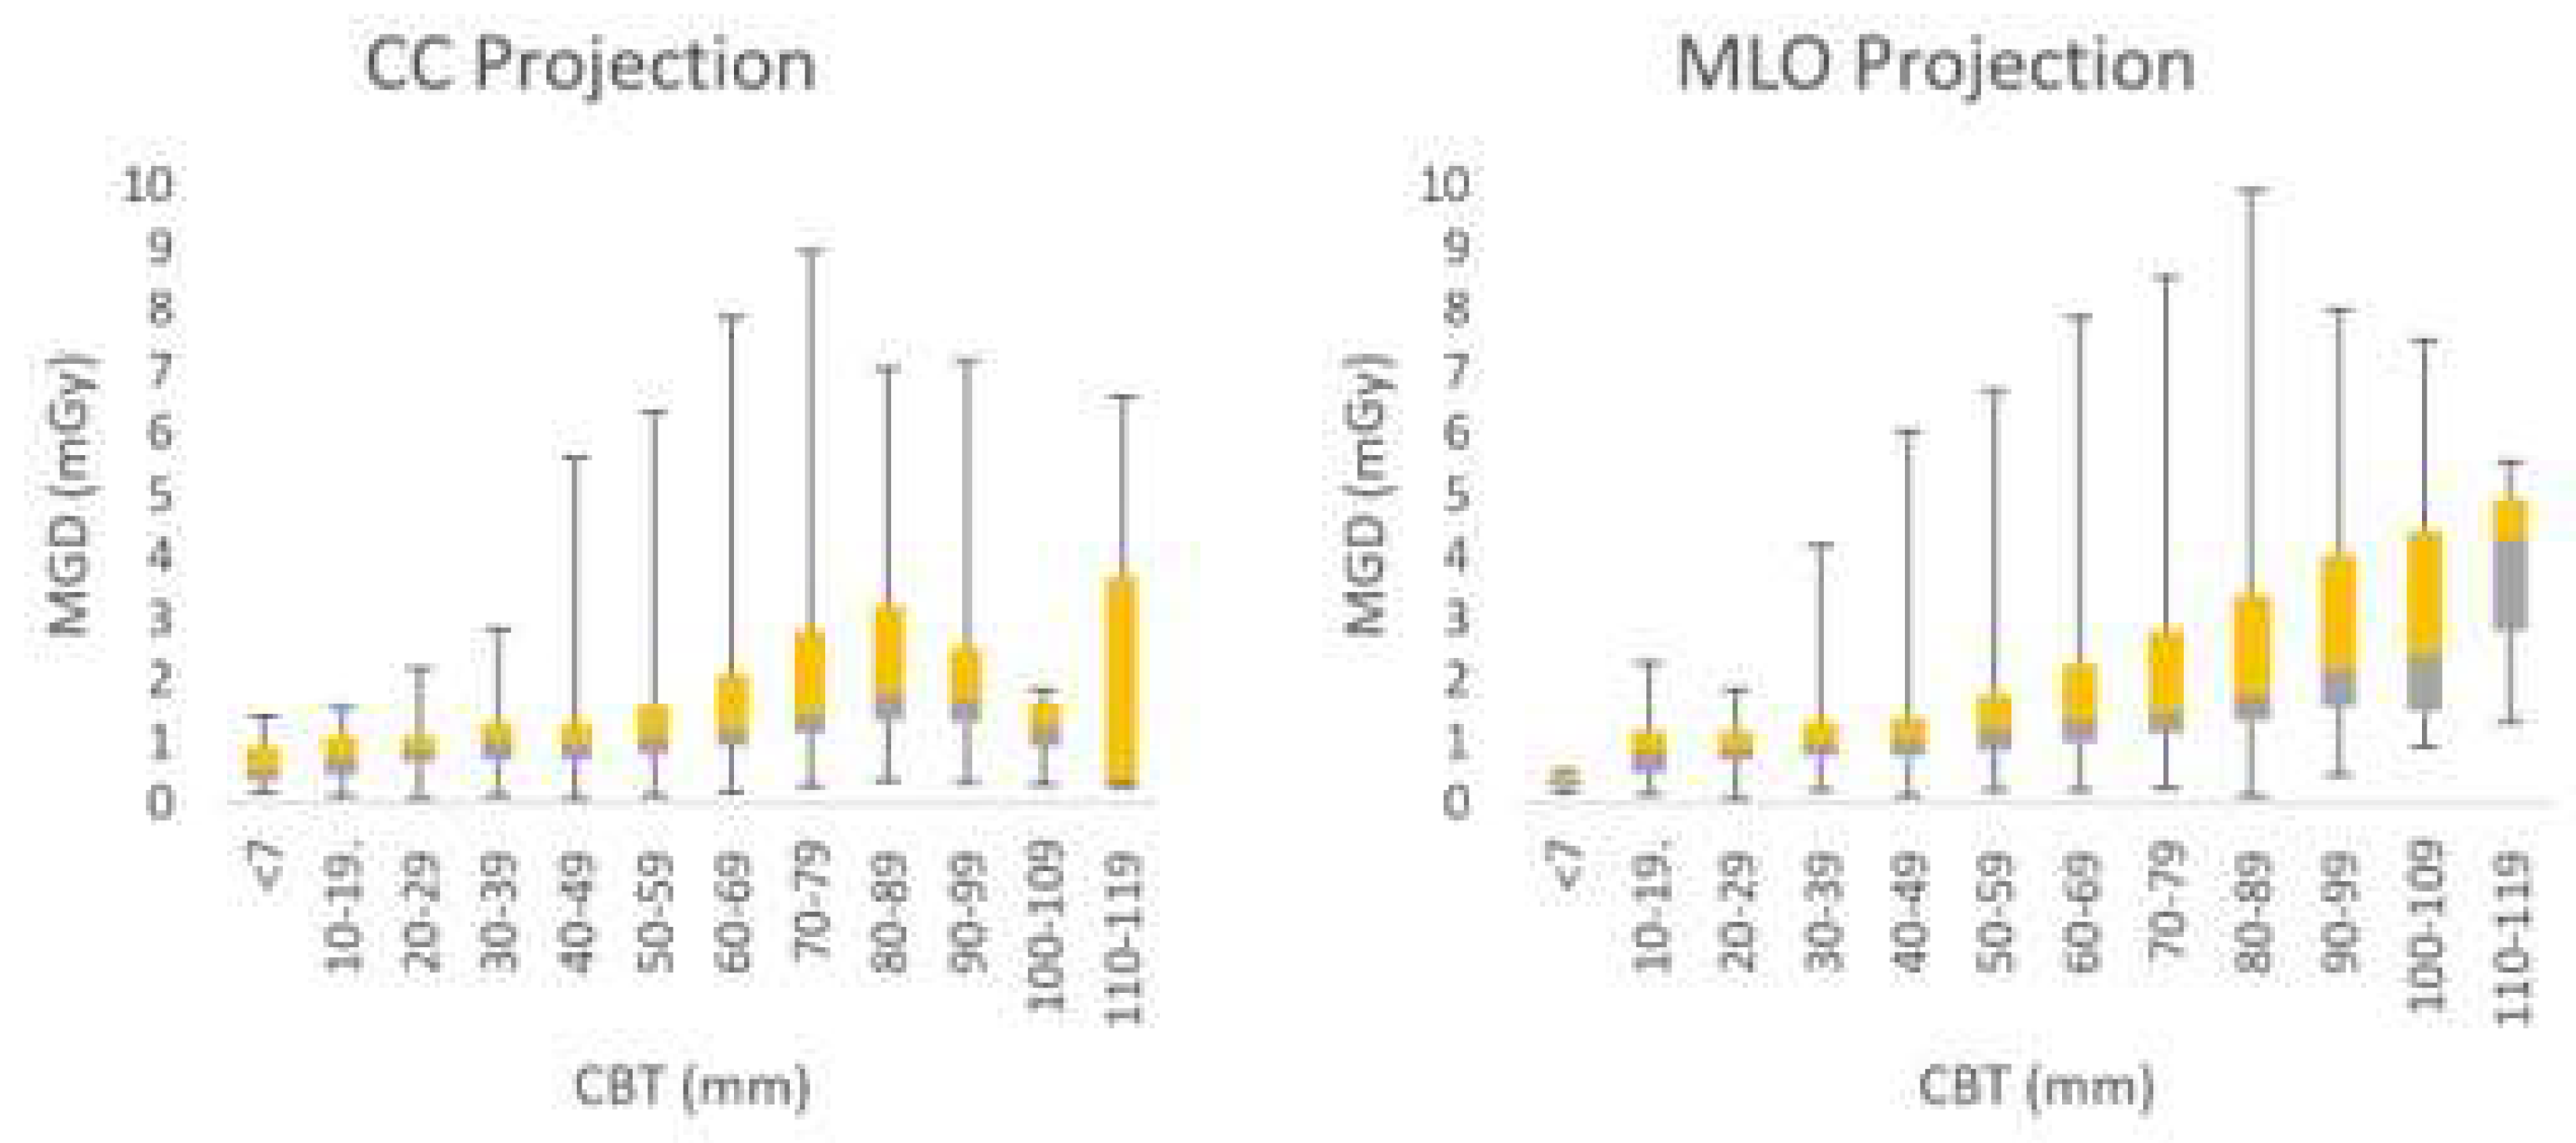
Figure 4.
Mean MGD (mGy) against the CBT (mm). The curves of units A, B, C, D, E, F, G, and H are flattened by fitting with exponential functions with least square roots. European reference curves (Belgian and EU) are added for comparison.
Figure 4.
Mean MGD (mGy) against the CBT (mm). The curves of units A, B, C, D, E, F, G, and H are flattened by fitting with exponential functions with least square roots. European reference curves (Belgian and EU) are added for comparison.
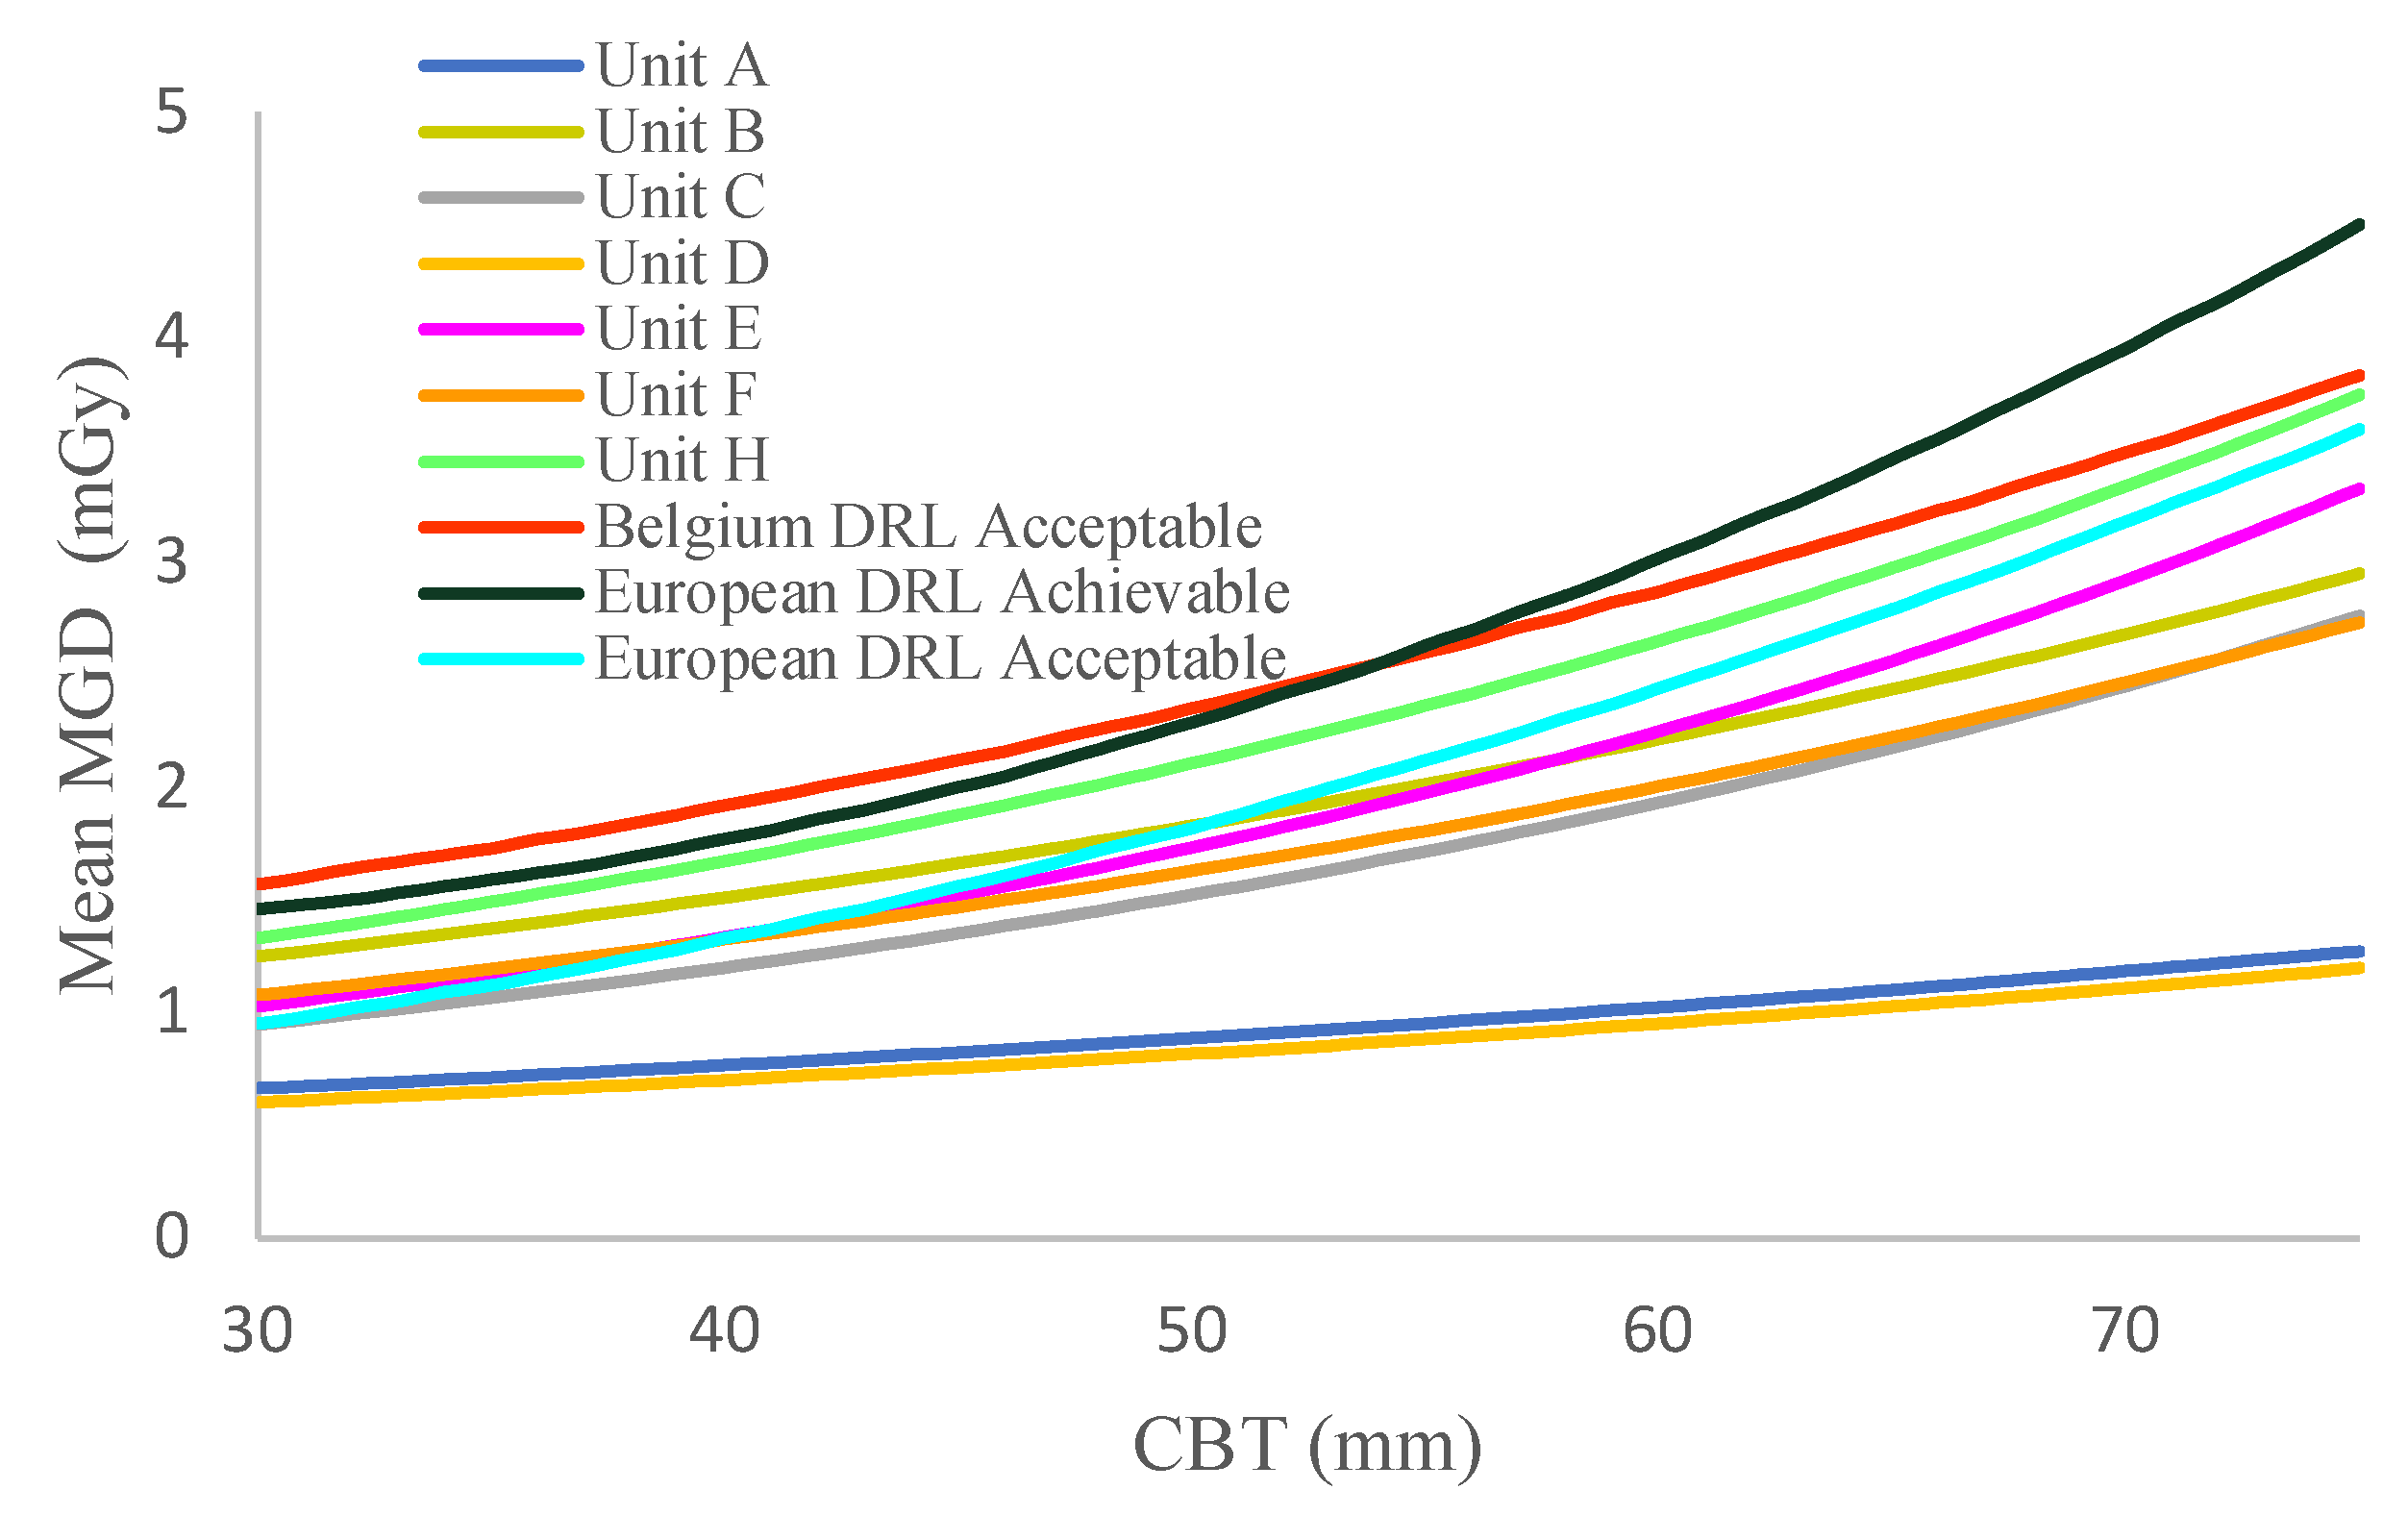

Table 1.
Mammograph manufacturer, technology, anode/filter combinations, number of projections, and patients included in the dose audit from mammography Units in NRM.
Table 1.
Mammograph manufacturer, technology, anode/filter combinations, number of projections, and patients included in the dose audit from mammography Units in NRM.
| Unit | Manufacturer | Technology | Anode/Filter | Projections | Cases |
|---|---|---|---|---|---|
| A | Fuji Innovality | DR | W/Rh | 4520 | 1130 |
| B | Fuji Amulet s | DR | W/Rh | 1772 | 443 |
| C | Fuji Amulet s | DR | W/Rh | 3436 | 859 |
| D | Fuji Amulet s | DR | W/Rh | 5672 | 1418 |
| E | Fuji Amulet s | DR | W/Rh | 2832 | 708 |
| F | Fuji Amulet s | DR | W/Rh | 2608 | 652 |
| G | Fuji Innovality | DR | W/Rh | 6380 | 1595 |
| H | Hologic Selenia | DR | W/Ag, W/Rh | 3820 | 955 |
DR: Digital radiography, W: Tungsten, Rh: Rhodium, Ag: Silver.
Table 5.
MGD values for various CBT ranges, comparison with European DRLs.
| CBT range (mm) | MGD Typical value (mGy) | MGD uropean DLR (mGy) | ||
|---|---|---|---|---|
| CC | MLO | Acceptable | Achievable | |
| 20-29 | 0.92 | 0.94 | < 1.0 | < 0.6 |
| 30-39 | 1.07 | 1.09 | < 1.5 | < 1.0 |
| 40-49 | 1.09 | 1.15 | < 2.0 | < 1.6 |
| 50-59 | 1.30 | 1.40 | < 2.5 | < 2.0 |
| 60-69 | 1.63 | 1.74 | < 3.0 | < 2.4 |
| 70-79 | 2.05 | 2.04 | < 4.5 | < 3.6 |
| 80-89 | 2.34 | 2.40 | / | / |
| 90-99 | 2.15 | 2.87 | < 6.5 | < 5.1 |
Disclaimer/Publisher’s Note: The statements, opinions and data contained in all publications are solely those of the individual author(s) and contributor(s) and not of MDPI and/or the editor(s). MDPI and/or the editor(s) disclaim responsibility for any injury to people or property resulting from any ideas, methods, instructions or products referred to in the content. |
© 2025 by the authors. Licensee MDPI, Basel, Switzerland. This article is an open access article distributed under the terms and conditions of the Creative Commons Attribution (CC BY) license (http://creativecommons.org/licenses/by/4.0/).
Copyright: This open access article is published under a Creative Commons CC BY 4.0 license, which permit the free download, distribution, and reuse, provided that the author and preprint are cited in any reuse.


