
Submitted:
03 February 2025
Posted:
04 February 2025
You are already at the latest version
Abstract
The Global Navigation Satellite System (GNSS) provides high spatiotemporal resolution data for monitoring precipitable water vapor (PWV), a critical parameter for weather forecasting, climate research, and astronomical site selection. This study evaluates the accuracy of ERA5 and NASA reanalysis datasets by comparing them with GNSS-derived PWV data at the NSRT site. Statistical methods, including root mean square error (RMSE), mean absolute error (MAE), and mean bias error (MBE), were employed to assess their performance across seasonal and monthly scales. The results show that ERA5 and NASA datasets exhibit high consistency with GNSS-derived PWV data, effectively capturing seasonal variations. ERA5 demonstrates superior accuracy during winter with lower RMSE values (e.g., 0.56 mm in January), while NASA performs better in summer months under high water vapor conditions. Systematic biases are observed in both datasets, emphasizing the need for localized bias correction to enhance their reliability.This study highlights the complementary strengths of ERA5 and NASA datasets and underscores the importance of GNSS data in validating and improving reanalysis models. The findings provide valuable insights for water vapor monitoring, atmospheric studies, and the optimization of astronomical site selection.
Keywords:
Reanalysis Data
; PWV
; Correlation Coefficient
1. Introduction
Water vapor is a crucial component of the atmosphere, playing a significant role in weather forecasting, climate change studies, radiative transfer, and other atmospheric research fields [1,2]. It is also a key performance indicator for the site selection of radio observatories. Particularly in infrared, submillimeter, and millimeter wave astronomical studies, the level of precipitable water vapor (PWV) directly determines the openness of observational windows and signal quality. Lower atmospheric water vapor content effectively reduces radio signal delays and improves signal transmittance. The small-scale spatial inhomogeneity and variations in water vapor distribution can cause changes in the radio wave path length reaching the antenna aperture, leading to pointing errors and reduced antenna gain. Low water vapor conditions not only significantly enhance telescope observation efficiency but also reduce the noise level of astronomical signals. Therefore, accurately obtaining the PWV characteristics of a target area is essential for the site selection and subsequent observation planning of observatories [3,4]. Researching and exploring variations in site-specific water vapor is of great practical value to radio astronomical observations.
Traditional water vapor measurement methods, such as radiosondes, microwave radiometers, infrared sounders, and surface techniques, have limitations in resolution and timeliness. Radiosondes provide high-altitude data [5], while microwave radiometers and infrared sounders are used for ground and satellite-based monitoring [6,7]. Surface methods rely on empirical formulas [8], and GPS/GNSS enhances detection [9]. Satellite sensors like MODIS and AIRS enable large-scale monitoring [10]. Exploring emerging technologies to improve the accuracy and reliability of water vapor monitoring is thus particularly important. Reanalysis data, generated by combining numerical weather prediction models and observational data, is a high-quality meteorological dataset. ERA5, the latest reanalysis product from the European Centre for Medium-Range Weather Forecasts (ECMWF), provides global meteorological information with frequent updates and is widely used in climate studies and weather forecasting. Additionally, NASA’s reanalysis datasets also play a vital role in meteorology. While these datasets provide researchers with extensive resources, their accuracy and reliability still require validation through observational data.
In recent years, site selection studies for observatories around the world have adopted PWV as a core reference indicator. For instance, the European Southern Observatory (ESO) conducted long-term atmospheric water vapor monitoring at the Paranal and Chajnantor sites in Chile, ultimately selecting them as the locations for the VLT and ALMA telescopes. This process included long-term evaluations of water vapor conditions using reanalysis datasets such as ERA-Interim [11,12]. Similarly, in China, GNSS technology has been widely applied to fine-scale water vapor monitoring for site selection studies of LAMOST, FAST, and the Large High Altitude Air Shower Observatory (LHAASO), demonstrating high reliability in high-altitude regions such as the Tibetan Plateau [13,14]. Moreover, GNSS-derived water vapor studies have provided critical support for upcoming observatory sites in China, such as the Ali Observatory in Tibet [15].
Recent advances in GNSS technology, such as multi-frequency observations and real-time data processing improvements, have significantly enhanced the accuracy and timeliness of water vapor monitoring [16,18]. These developments enable precise tracking of atmospheric changes, even during extreme weather events [19]. Similarly, reanalysis datasets like ERA5 and MERRA-2 have incorporated higher spatial resolutions and advanced physical parameterizations, making them invaluable for climate studies and site selection for observatories [17,20]. However, biases in local conditions still exist, necessitating validation through high-resolution observational data like GNSS-derived PWV. On the other hand, reanalysis data (e.g., ECMWF and MERRA) has been extensively used for studying the spatiotemporal distribution of atmospheric water vapor due to its long temporal coverage, global scale, and consistency. However, limitations such as numerical model parameterization and sparse observational input can result in systematic biases in PWV estimates under local conditions [21,22]. Therefore, validating the accuracy of reanalysis PWV data using high-resolution GNSS observations is an essential method for enhancing the reliability of site selection data for observatories.
This study focuses on the Nanshan Radio Telescope (NSRT) site (43°28’ N, 87°10’ E) which is mainly used for VLBI observations and astrophysical research, using GNSS-derived PWV data to evaluate the accuracy of ECMWF and MERRA reanalysis datasets. It compares the correlation and biases between GNSS-derived PWV and reanalysis data, assesses the applicability and reliability of reanalysis datasets in this region in the context of astronomical site selection, and provides scientific evidence and data support for the construction and operation of future telescopes.
2. Materials and Methods
2.1. Data Sources
The data used in this study are derived from the ERA-Interim (European Centre for Medium-Range Weather Forecasts Interim Reanalysis) by the European Centre for Medium-Range Weather Forecasts (ECMWF) [23], and the MERRA (Modern Era Retrospective-Analysis) provided by the National Aeronautics and Space Administration (NASA) [24]. which are required validation in this context. The specific humidity data from ECMWF and MERRA reanalysis have spatial resolutions of 0.25° × 0.25° and 0.625° × 0.5°, respectively. In the vertical direction, the data cover 37 levels from 1000 hPa to 1 hPa for ECMWF and 26 levels from 1000 hPa to 0.1 hPa for MERRA. Detailed information about the data is provided in Table 1.
The formula for calculating water vapor from the reanalysis data is as follows [25]:
Where g is the acceleration due to gravity, is the atmospheric top pressure, is the surface pressure, and q is the specific humidity.
The reference data used comes from the high-precision water vapor content (GPS/PWV) of the GNSS network stations of the Continental Environmental Monitoring Network Project in Mainland China (referred to as the "Lutai Network"). One of the reference stations is located within the NSRT station, and its high-precision PWV provides an important reference for the evaluation of this reanalysis data, further enhancing the reliability and accuracy of the data.
2.2. Research Methodology
2.2.1. Bilinear Interpolation
For the NSRT station, hourly PWV data corresponding to the site are obtained from the ECMWF and MERRA reanalysis datasets using bilinear interpolation based on the site’s latitude and longitude information [26] to improve their accuracy. Bilinear interpolation, also known as bilinear intrapolation, is an extension of linear interpolation for functions of two variables. The core idea is to perform linear interpolation in two directions.
To estimate the value of an unknown function f at a point , assume that we know the values of f at the four points , , , and around the point P. The steps are as follows:
1. Perform linear interpolation in the x-direction to obtain:
where:
- , , , and are grid points,
- x, y are the coordinates of the station to be evaluated,
- , , , and are the coordinates of the grid points,
- and are the points obtained after linear interpolation in the x-direction.
2. Perform linear interpolation in the y-direction to obtain:
where:
- y is the vertical coordinate of the station to be evaluated,
- , are the vertical coordinates of the grid points,
- and are the points obtained after linear interpolation in the x-direction.
The result of linear interpolation is independent of the order in which the interpolation is performed.
2.2.2. Seasonal Trend Model for PWV Data
To analyze the seasonal variations in the PWV values derived from GNSS, ERA5, and NASA datasets, we adopted a seasonal trend model based on sinusoidal functions. The model is defined as:
where:
- : The PWV value at time t,
- : The baseline constant representing the long-term mean value of PWV,
- : The amplitude of the sine component, capturing seasonal variation,
- : The amplitude of the cosine component, capturing seasonal variation,
- w: The period of the seasonal cycle (fixed to 365 days to represent annual cycles).
This model incorporates and terms to account for annual periodicity, where and are optimized to fit the observed PWV variations. The parameter w is fixed to 365 days, corresponding to the annual cycle.
The observed time t was converted to numeric form (e.g., days since the first observation), denoted as . For each dataset (e.g., GNSS, ERA5, NASA), missing values were excluded before fitting the model.
Subsequently, by performing graphical analysis of PWV data from GNSS, ERA5, and NASA, the periodic variation trends and consistency among these datasets are obtained.The results of the graphical analysis serve as a foundation for subsequent quantitative accuracy assessments.
- Graphical Analysis: Visualizations are generated to highlight the periodic variation trends of precipitable water vapor (PWV) as observed in GNSS-derived data and reanalysis datasets (ERA5 and NASA). These trends allow for the detection of seasonal and inter-annual cycles.
-
Consistency Check: The consistency between GNSS and reanalysis datasets is checked through overlaid plots and statistical comparisons, focusing on:
- −
- Seasonal patterns,
- −
- Amplitude of variations,
- −
- Temporal alignment.
2.2.3. Error Evaluation
Then, correlation analysis, t-tests, and the least squares method are used to compare the reanalysis data with the station observations (GPS/PWV). Statistical indicators such as Root Mean Square Error (RMSE), Mean Absolute Error (MAE), Mean Bias Error (MBE), Maximum Error (MaxErr), and Correlation Coefficient (R) (For the error metrics used in this analysis, please refer to Appendix A.)are used to assess and analyze the accuracy.
We further analyzed the data accuracy of the reanalysis datasets under different months and meteorological conditions.
3. Results and Discussion
3.1. Seasonal Variation of PWV
The seasonal variation of precipitable water vapor (PWV) at the NSRT site exhibits a distinct annual cycle, reflecting the dynamic changes in atmospheric moisture content. As shown in Figure 1, the PWV reaches its peak during the summer months, with maximum values recorded in July (16.92 mm) and August (16.62 mm), corresponding to the period of highest atmospheric moisture. Conversely, the lowest values are observed in the dry winter months, with January (2.42 mm) and December (2.81 mm) marking the seasonal minimum.
This seasonal pattern is characterized by a gradual increase in PWV from January to August, driven by enhanced atmospheric convection and moisture accumulation during the warmer months. Following this peak, a steady decline is observed from September to December, reflecting the transition into cooler and drier conditions.These findings highlight the dynamic hydrological cycle and provide essential context for understanding the subsequent error analysis.
3.2. Comparison of Reanalysis Data with GNSS
Figure 2 compares PWV derived from GNSS, ERA5, and NASA datasets in 2013. It demonstrates the time series of PWV from GNSS, ERA5, and NASA datasets, along with their seasonal trends. The trend lines for the three datasets, represented by red, black, and blue dashed lines respectively, are derived from the seasonal models. The model parameters for each dataset are as follows:
- GNSS Model Parameters:
- ERA5 Model Parameters:
- NASA Model Parameters:
The parameters indicate that the GNSS, ERA5, and NASA datasets exhibit highly consistent seasonal trends. The first parameter represents the overall baseline value, while the second and third parameters correspond to the annual and semi-annual periodic components. The fourth parameter reflects the phase adjustment. The slight differences in phase values may be attributed to the time alignment methods used for each dataset.
It seems that all datasets show high consistency in capturing the overall seasonal patterns, indicating good agreement with GNSS observations. Discrepancies are observed during rapid changes in PWV, likely due to differences in temporal or spatial resolution. This comparison underscores the general reliability of ERA5 and NASA datasets as substitutes for GNSS data, while also highlighting the need for further quantitative accuracy assessment.
3.3. Error Metrics Analysis
Table 2 presents monthly error metrics (RMSE, MAE, MBE, and MaxErr) for ERA5 and NASA datasets compared to GNSS-derived PWV. Insights include:
- ERA5 Performance: ERA5 exhibits lower RMSE and MAE in most months, particularly during the dry winter season, making it more stable under low-PWV conditions.
- NASA Performance: NASA demonstrates better performance in high-PWV months (July and August), suggesting its robustness in humid conditions.
These results, combined with Figure 1, show that both datasets capture seasonal variations effectively, with ERA5 excelling under dry conditions and NASA under humid conditions.
3.4. Fitting Performance and Error Distribution
Figure 3 compares the fitting performance of ERA5 and NASA datasets against GNSS-derived PWV. Both datasets exhibit strong linear correlations with GNSS data, with slopes close to 1, indicating good agreement with observed trends.
For ERA5 (Figure 3a), the intercept is slightly positive (0.15), reflecting a minor overestimation in low water vapor conditions. The data points are tightly clustered around the regression line for PWV values below 10 mm, indicating stable performance. However, as PWV increases (above 15 mm), the scatter of data points becomes more pronounced, leading to larger errors.
For NASA (Figure 3b), the intercept is slightly smaller (0.12), suggesting reduced bias overall. While NASA exhibits greater variability in low PWV ranges, it performs better at higher PWV values (above 15 mm), where the data points align more closely with the regression line.
These results confirm that ERA5 demonstrates superior performance under low water vapor conditions, while NASA shows better adaptability to high water vapor environments.
Figure 4 shows the error distributions of ERA5 and NASA datasets relative to GNSS-derived PWV. ERA5 errors are primarily concentrated within −2 to 2 mm, with a slightly positive mean, reflecting a minor overestimation in low water vapor conditions. In contrast, NASA errors are more dispersed, ranging from −3 to 3 mm, with a slight negative mean, indicating a tendency to underestimate PWV in drier conditions and achieve better accuracy in humid environments. Overall, ERA5 provides more stable results under low water vapor conditions, while NASA demonstrates greater adaptability to high water vapor scenarios.
The results demonstrate that ERA5 and NASA datasets capture seasonal PWV variations effectively, with complementary strengths: ERA5 performs better under dry conditions, while NASA is more robust in humid conditions. These findings underscore the importance of localized bias corrections to enhance the applicability of reanalysis datasets in atmospheric studies and astronomical site selection.
4. Conclusions
This study analyzes GNSS-derived water vapor data at the NSRT site by comparing it with ERA5 and NASA reanalysis datasets. The results demonstrate that the GNSS-derived water vapor data and the reanalysis datasets exhibit a high degree of consistency in capturing seasonal and monthly variations. Both datasets effectively reflect the water vapor characteristics at the NSRT site, showcasing their reliability for atmospheric studies and applications.
ERA5 data surpass NASA data in terms of accuracy and correlation metrics, particularly under low water vapor conditions such as in winter months. For instance, ERA5 achieves lower RMSE values in January (0.56 mm) and December (0.61 mm) compared to NASA (0.62 mm and 0.66 mm, respectively). In contrast, NASA performs better under high water vapor conditions, with smaller biases observed during the summer months of July and August. These findings highlight the complementary strengths of the two datasets for different seasonal conditions.
Seasonal meteorological variations significantly impact the accuracy of reanalysis datasets. Higher water vapor content in summer increases RMSE and maximum error due to enhanced convective activities, whereas these errors decrease notably in winter. This underscores the importance of accounting for seasonal variations when applying reanalysis datasets to regional studies.
Systematic biases are evident in both datasets under local conditions. NASA data tend to underestimate PWV under high water vapor scenarios, while ERA5 occasionally shows positive biases in similar conditions.
In conclusion, this study emphasizes the importance of GNSS-derived water vapor data as a high-resolution reference for validating and refining reanalysis datasets. The ERA5 and NASA datasets each show complementary strengths, with ERA5 performing better in dry conditions and NASA excelling in more humid environments. Correcting these biases using GNSS-derived observations is crucial for enhancing the reliability of reanalysis datasets in specific applications, such as astronomical site selection and meteorological research. This work lays the foundation for future efforts aimed at improving the accuracy of reanalysis models through bias correction and adaptation to specific meteorological conditions, thereby increasing their value in weather forecasting, climate research, and astronomical studies.
Funding
This research was funded by The Chinese Academy of Sciences (CAS) “ Light of West China” Program (No. 2021-XBQNXZ-030) and Xinjiang Key Laboratory of Radio Astrophysics (No.2023D04064).
Appendix A Error Metrics
The following error metrics were used in the analysis:
Root Mean Squared Error (RMSE):
where:
- −
- n: Total number of data points.
- −
- : PWV value derived from GNSS observations at the i-th data point.
- −
- : PWV value extracted from reanalysis data at the i-th data point.
Mean Absolute Error (MAE):
where:
- −
- n: Total number of data points.
- −
- : PWV value derived from GNSS observations at the i-th data point.
- −
- : PWV value extracted from reanalysis data at the i-th data point.
Mean Bias Error (MBE):
where:
- −
- n: Total number of data points.
- −
- : PWV value derived from GNSS observations at the i-th data point.
- −
- : PWV value extracted from reanalysis data at the i-th data point.
Maximum Error (MaxErr):
where:
- −
- : PWV value derived from GNSS observations at the i-th data point.
- −
- : PWV value extracted from reanalysis data at the i-th data point.
Correlation Coefficient (R):
where:
- −
- n: Total number of data points.
- −
- : PWV value derived from GNSS observations at the i-th data point.
- −
- : PWV value extracted from reanalysis data at the i-th data point.
- −
- : Mean of GNSS-derived PWV values, .
- −
- : Mean of reanalysis PWV values, .
References
- Held, I.M.; Soden, B.J. The title of the cited article. Annu. Rev. Energy Environ. 2000, 25, 441. [Google Scholar] [CrossRef]
- Song, S.L.; Zhu, W.Y.; Ding, J.C. , et al. The title of the cited article. ChSBu 2006, 51, 607. [Google Scholar]
- Solomon, S. , et al. Climate Change 2007: The Physical Science Basis. Contribution of Working Group I to the Fourth Assessment Report of the IPCC; Cambridge University Press, 2007.
- Kerber, F. , et al. Atmospheric Water Vapour at Paranal Observatory and Chajnantor. Astron. Astrophys. 2014, 566, A31. [Google Scholar]
- Wang, J. , & Zhang, L. Systematic errors in global radiosonde precipitable water data from comparisons with ground-based GPS measurements. J. Clim. 2008, 21, 2218–2238. [Google Scholar] [CrossRef]
- Cimini, D. , Campos, E., Ware, R. H., Albers, S., Graziani, A., Oreamuno, R., et al. Thermodynamic atmospheric profiling during the 2010 Winter Olympics using ground-based microwave radiometry. IEEE Trans. Geosci. Remote Sens. 2011, 49, 4959–4969. [Google Scholar] [CrossRef]
- Chahine, M. T. The hydrological cycle and its influence on climate. Nature 1992, 359, 373–380. [Google Scholar] [CrossRef]
- Dai, A. Recent climatology, variability, and trends in global surface humidity. J. Clim. 2006, 19, 3589–3606. [Google Scholar] [CrossRef]
- Bevis, M. , Businger, S., Herring, T. A., Rocken, C., Anthes, R. A., & Ware, R. H. GPS meteorology: Remote sensing of atmospheric water vapor using the global positioning system. J. Geophys. Res. Atmos. 1992, 97, 15787–15801. [Google Scholar] [CrossRef]
- Gao, B. C. , & Kaufman, Y. J. Water vapor retrievals using Moderate Resolution Imaging Spectroradiometer (MODIS) near-infrared channels. J. Geophys. Res. Atmos. 2003, 108. [Google Scholar] [CrossRef]
- Radovan, M.V. , et al. ALMA Observatory: Atmospheric Characterization for Sub-Millimeter Astronomy. Publ. Astron. Soc. Pac. 2018, 130, 085001. [Google Scholar]
- Hersbach, H. , et al. The ERA5 Global Reanalysis. Q. J. R. Meteorol. Soc. 2020, 146, 1999–2049. [Google Scholar] [CrossRef]
- Li, Z.; Zhang, L. GNSS-Derived Water Vapor for LHAASO Site Evaluation in High-Altitude Areas. Chin. J. Astron. Astrophys. 2019, 19, 125–135. [Google Scholar]
- Gong, S. , et al. Analyzing the PWV at LAMOST Site Using Ground-Based GNSS Observations. Adv. Space Res. 2018, 61, 2451–2461. [Google Scholar]
- Shang, Z. , et al. Site Testing for the Ali Observatory: PWV and Infrared Transparency. Mon. Not. R. Astron. Soc. 2020, 498, 3012–3025. [Google Scholar]
- Smith, J.; Zhang, H.; Lee, T. Recent Advances in GNSS Meteorology for Atmospheric Studies. In Proceedings of the International Conference on Atmospheric Research, London, UK, 15–18 July 2023; Abstract 105123; pp. 12–18. [Google Scholar]
- Brown, A.; Chen, X.; Kumar, R. The Role of ERA5 and MERRA-2 in Modern Climate Monitoring and Prediction. In Proceedings of the Climate Data and Modeling Conference, Geneva, Switzerland, 20–22 June 2023; Abstract C23-0015; pp. 34–42. [Google Scholar]
- Li, Z.; Wang, M.; Huang, Y. Utilization of GNSS-Derived Water Vapor in Extreme Weather Events. In Proceedings of the Advances in Space Research Symposium, Beijing, China, 10–12 October 2022; Abstract ASR-104781; pp. 55–62. [Google Scholar]
- Garcia, R.; Nguyen, P.; Novak, M. High Temporal and Spatial Resolution GNSS Observations for Climate Studies. In Proceedings of the Geophysical Research Annual Meeting, San Francisco, CA, USA, 5–9 December 2023; Abstract GRL-098765; pp. 78–85. [Google Scholar]
- Zhao, J.; Li, X.; Qiao, F. Bias Correction of Reanalysis Data Using GNSS Observations. In Proceedings of the Remote Sensing and Data Accuracy Workshop, Tokyo, Japan, 18–21 April 2022; Abstract RS-14020456; pp. 101–108. [Google Scholar]
- Kobayashi, S. , et al. The JRA-55 Reanalysis: General Specifications and Basic Characteristics. J. Meteorol. Soc. Jpn. 2015, 93, 5–48. [Google Scholar] [CrossRef]
- Bock, O.; Parracho, A.C. Consistency and Representativity of Integrated Water Vapor from Ground-Based GPS Observations and ERA-Interim Reanalysis. Atmos. Chem. Phys. 2019, 19, 945–969. [Google Scholar] [CrossRef]
- Dee, D.P.; Uppala, S.M.; Simmons, A.J. , et al. The ERA-Interim re-analysis: Configuration and performance of the data assimilation system. QJR Meteorol Soc 2011, 137, 553–597. [Google Scholar] [CrossRef]
- Rienecker, M.M.; Suarez, M.J.; Celaro, R. , et al. MERRA-NASA’s Modern-Era Retrospective Analysis for Research and Applications. Climate 2011, 24, 3624–3648. [Google Scholar] [CrossRef]
- Li, M.-S.; Li, R.; Wang, N.; Zheng, X.-W. Research and application of reanalysis data for radio astronomical site testing. Res. Astron. Astrophys. 2020, 20, 200. [Google Scholar] [CrossRef]
- Zhao, J.; Li, T.; Shi, K.; Qiao, Z.; Xia, Z. Evaluation of ERA-5 Precipitable Water Vapor Data in Plateau Areas: A Case Study of the Northern Qinghai-Tibet Plateau. Atmosphere 2021, 12, 1367. [Google Scholar] [CrossRef]
Figure 1.
Monthly Variation of PWV (mm). The x-axis represents the months of the year, while the y-axis indicates the PWV values.
Figure 1.
Monthly Variation of PWV (mm). The x-axis represents the months of the year, while the y-axis indicates the PWV values.
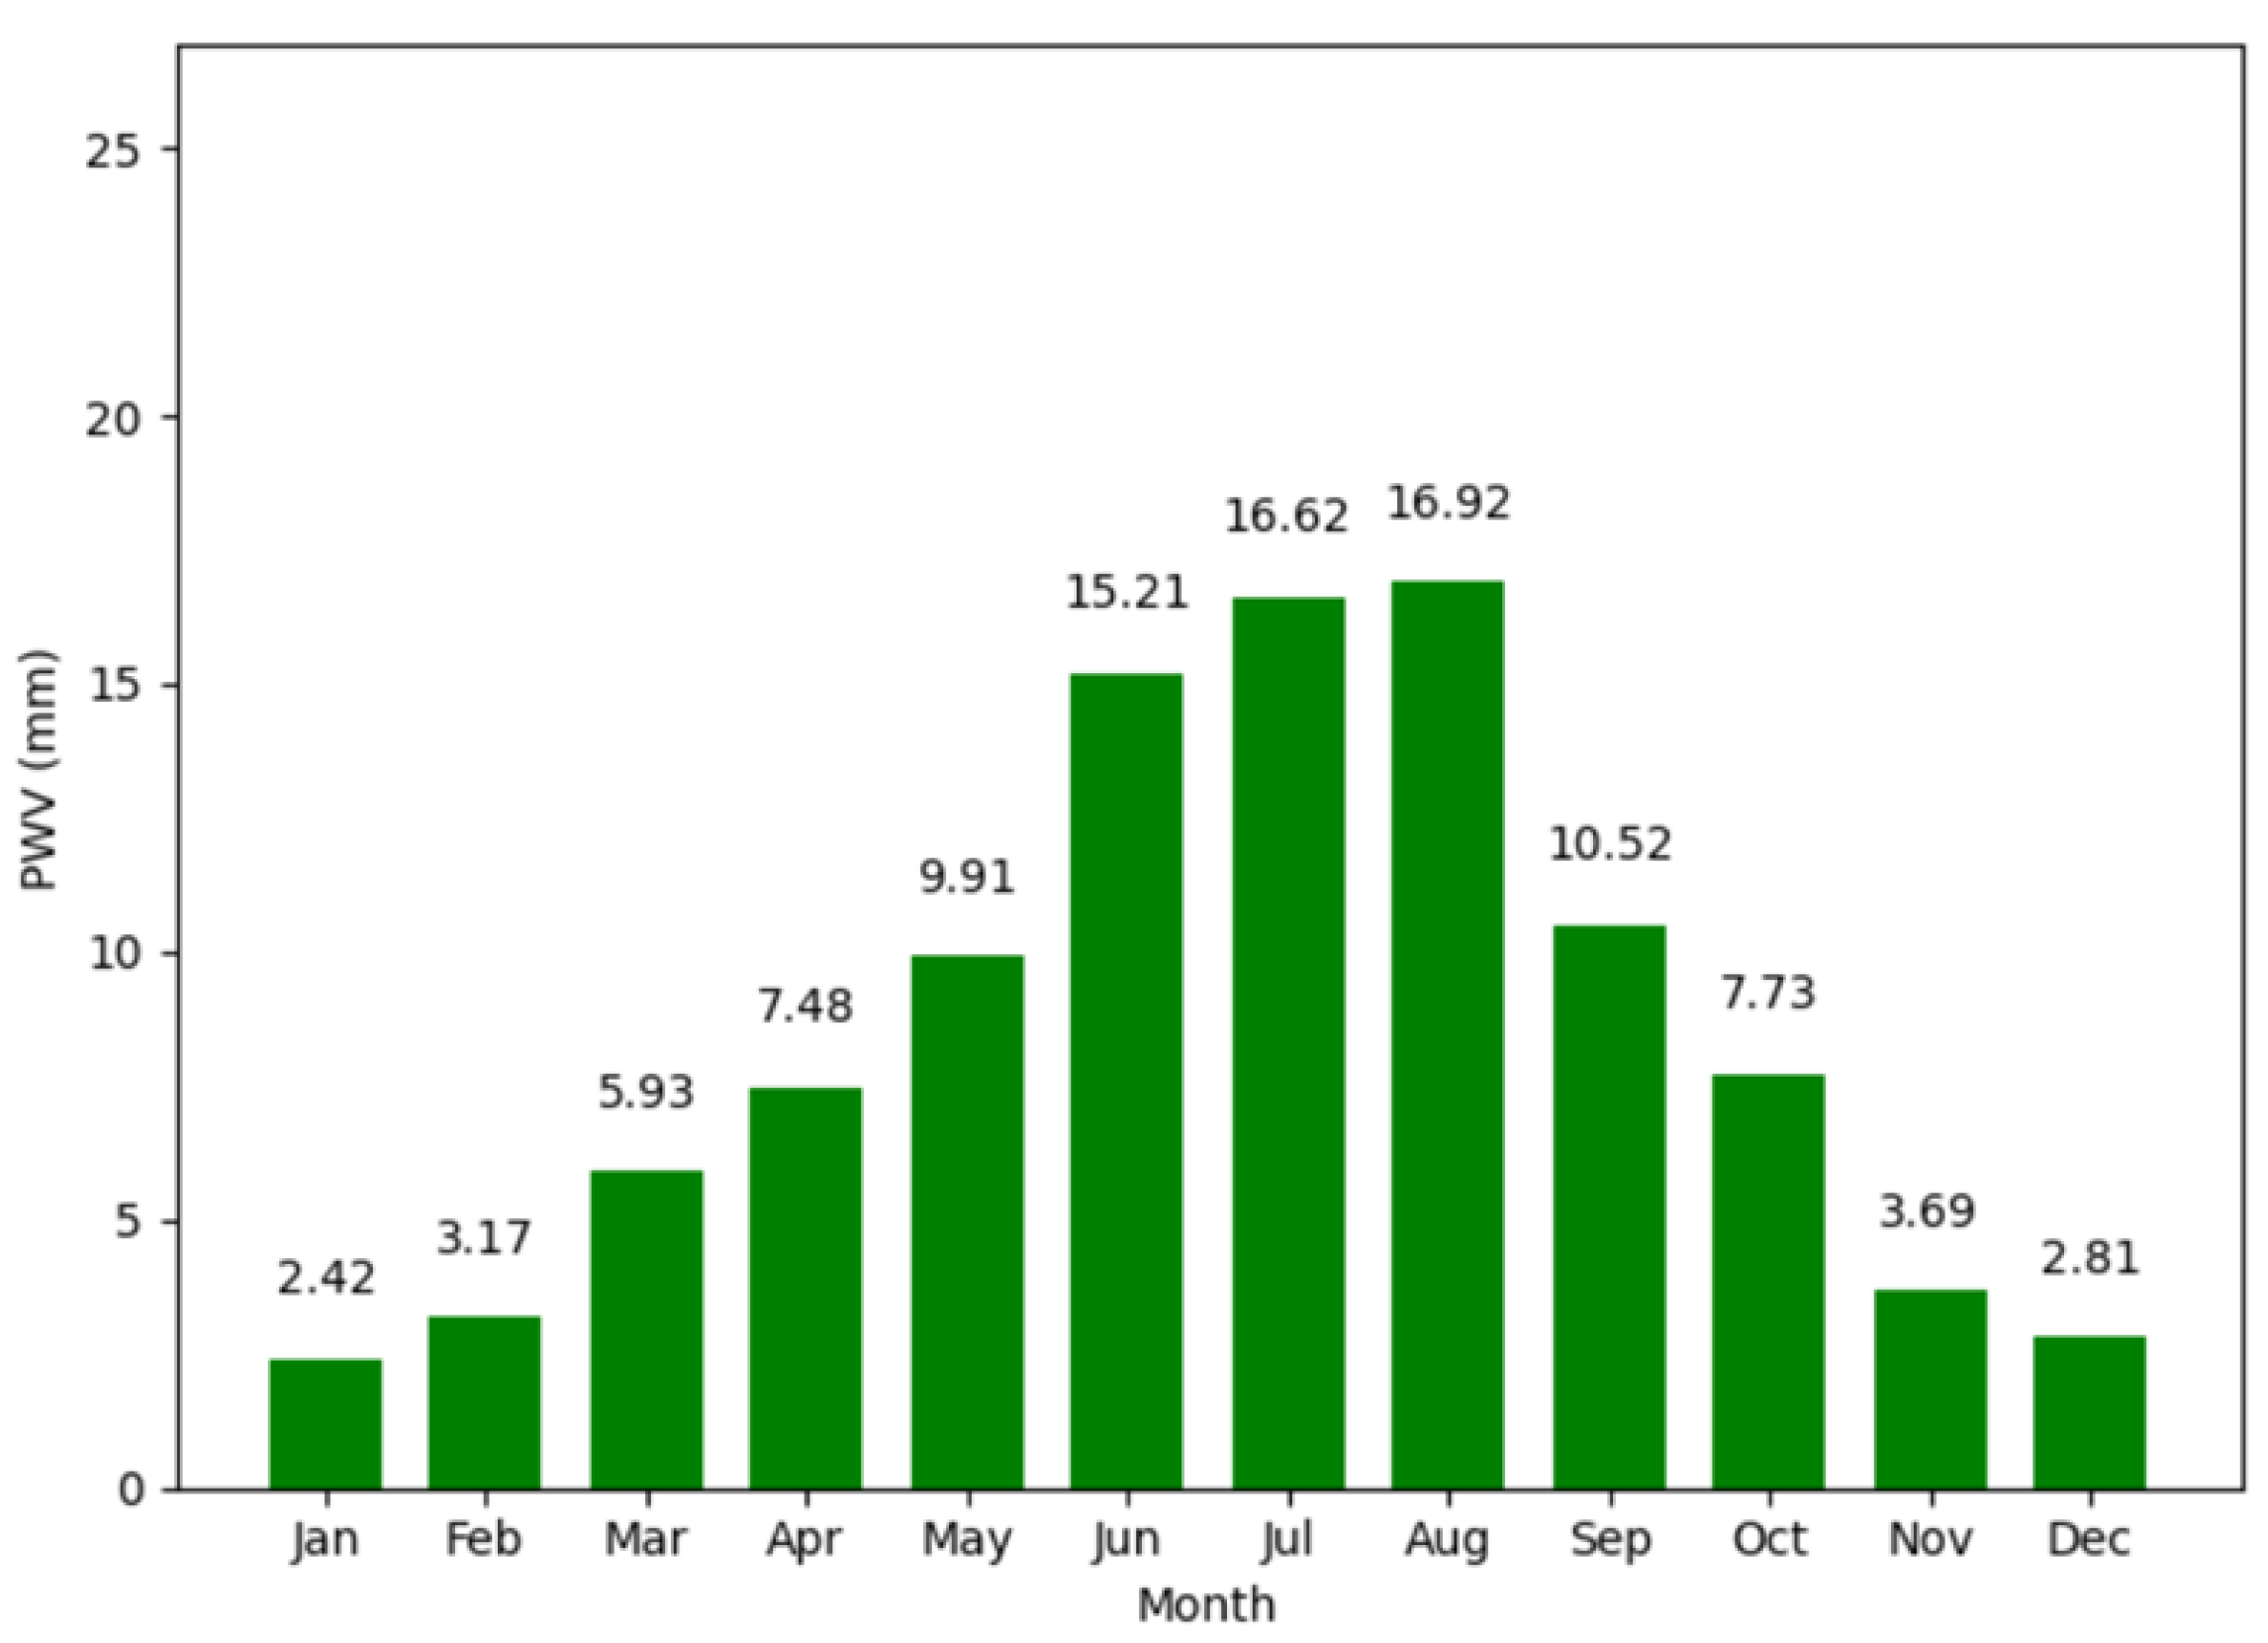
Figure 2.
PWV Comparison (GNSS, ERA5, NASA) at NSRT site. The x-axis represents the time period from January 2013 to December 2013, while the y-axis indicates the PWV values in millimeters (mm).
Figure 2.
PWV Comparison (GNSS, ERA5, NASA) at NSRT site. The x-axis represents the time period from January 2013 to December 2013, while the y-axis indicates the PWV values in millimeters (mm).
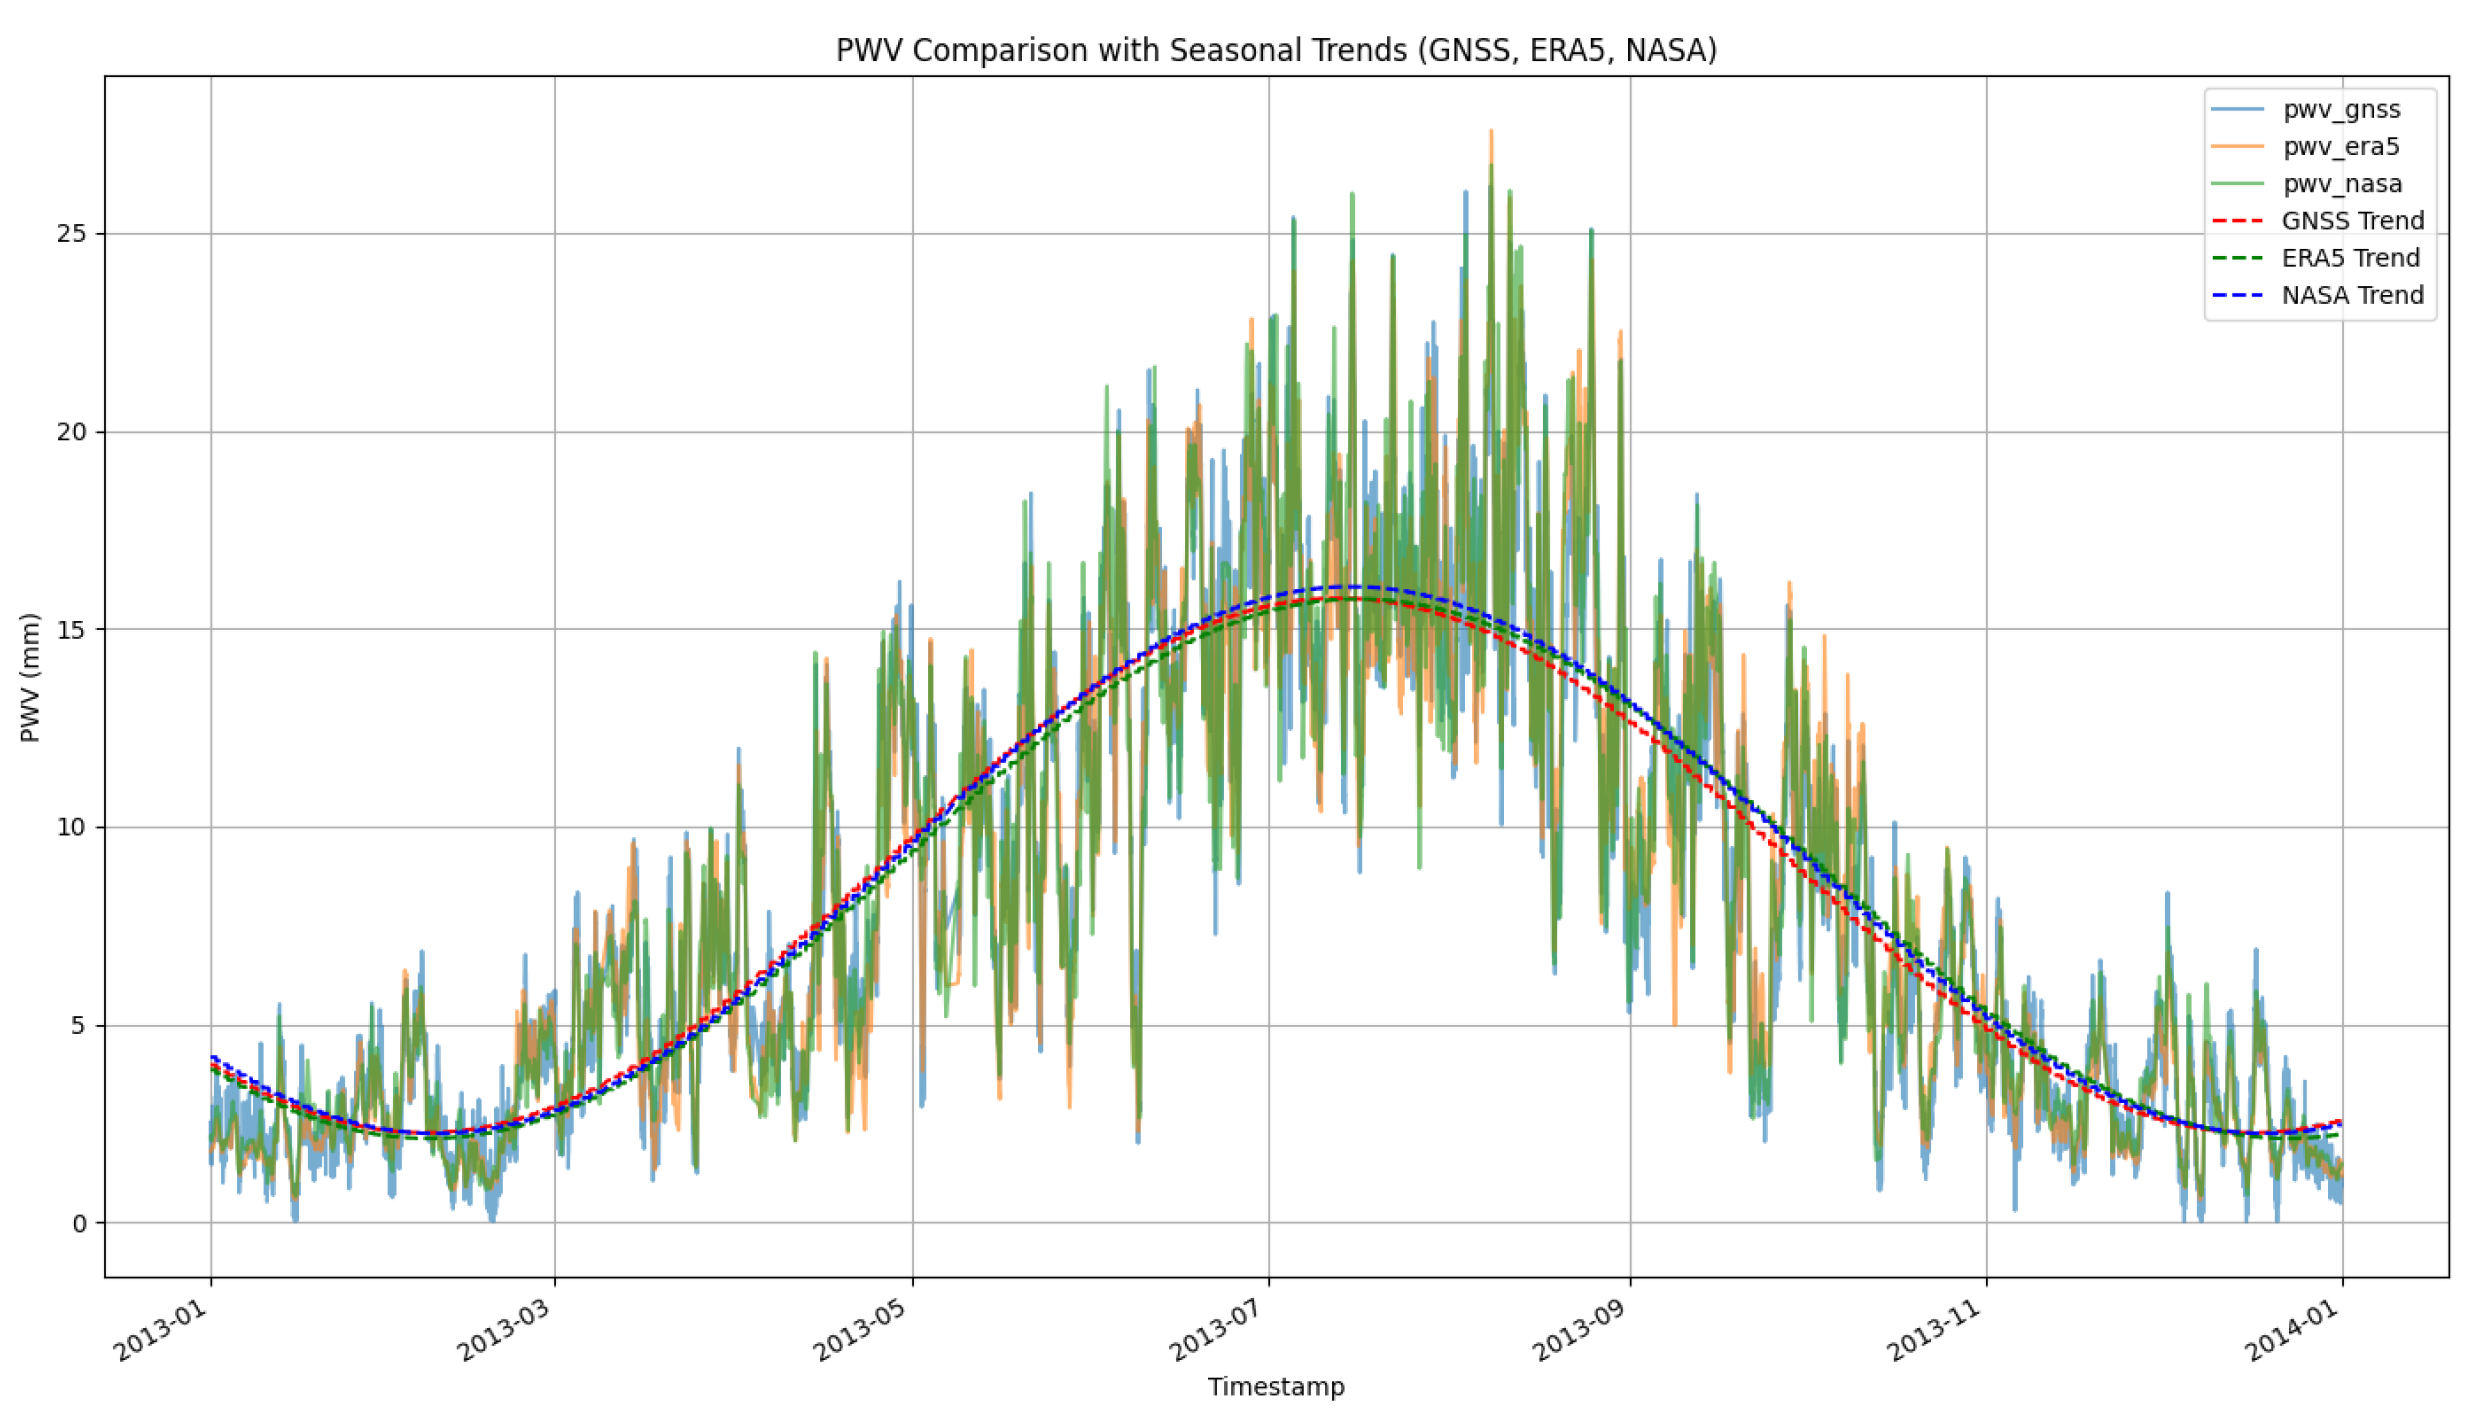
Figure 3.
The fitting results of PWV from different reanalysis data.
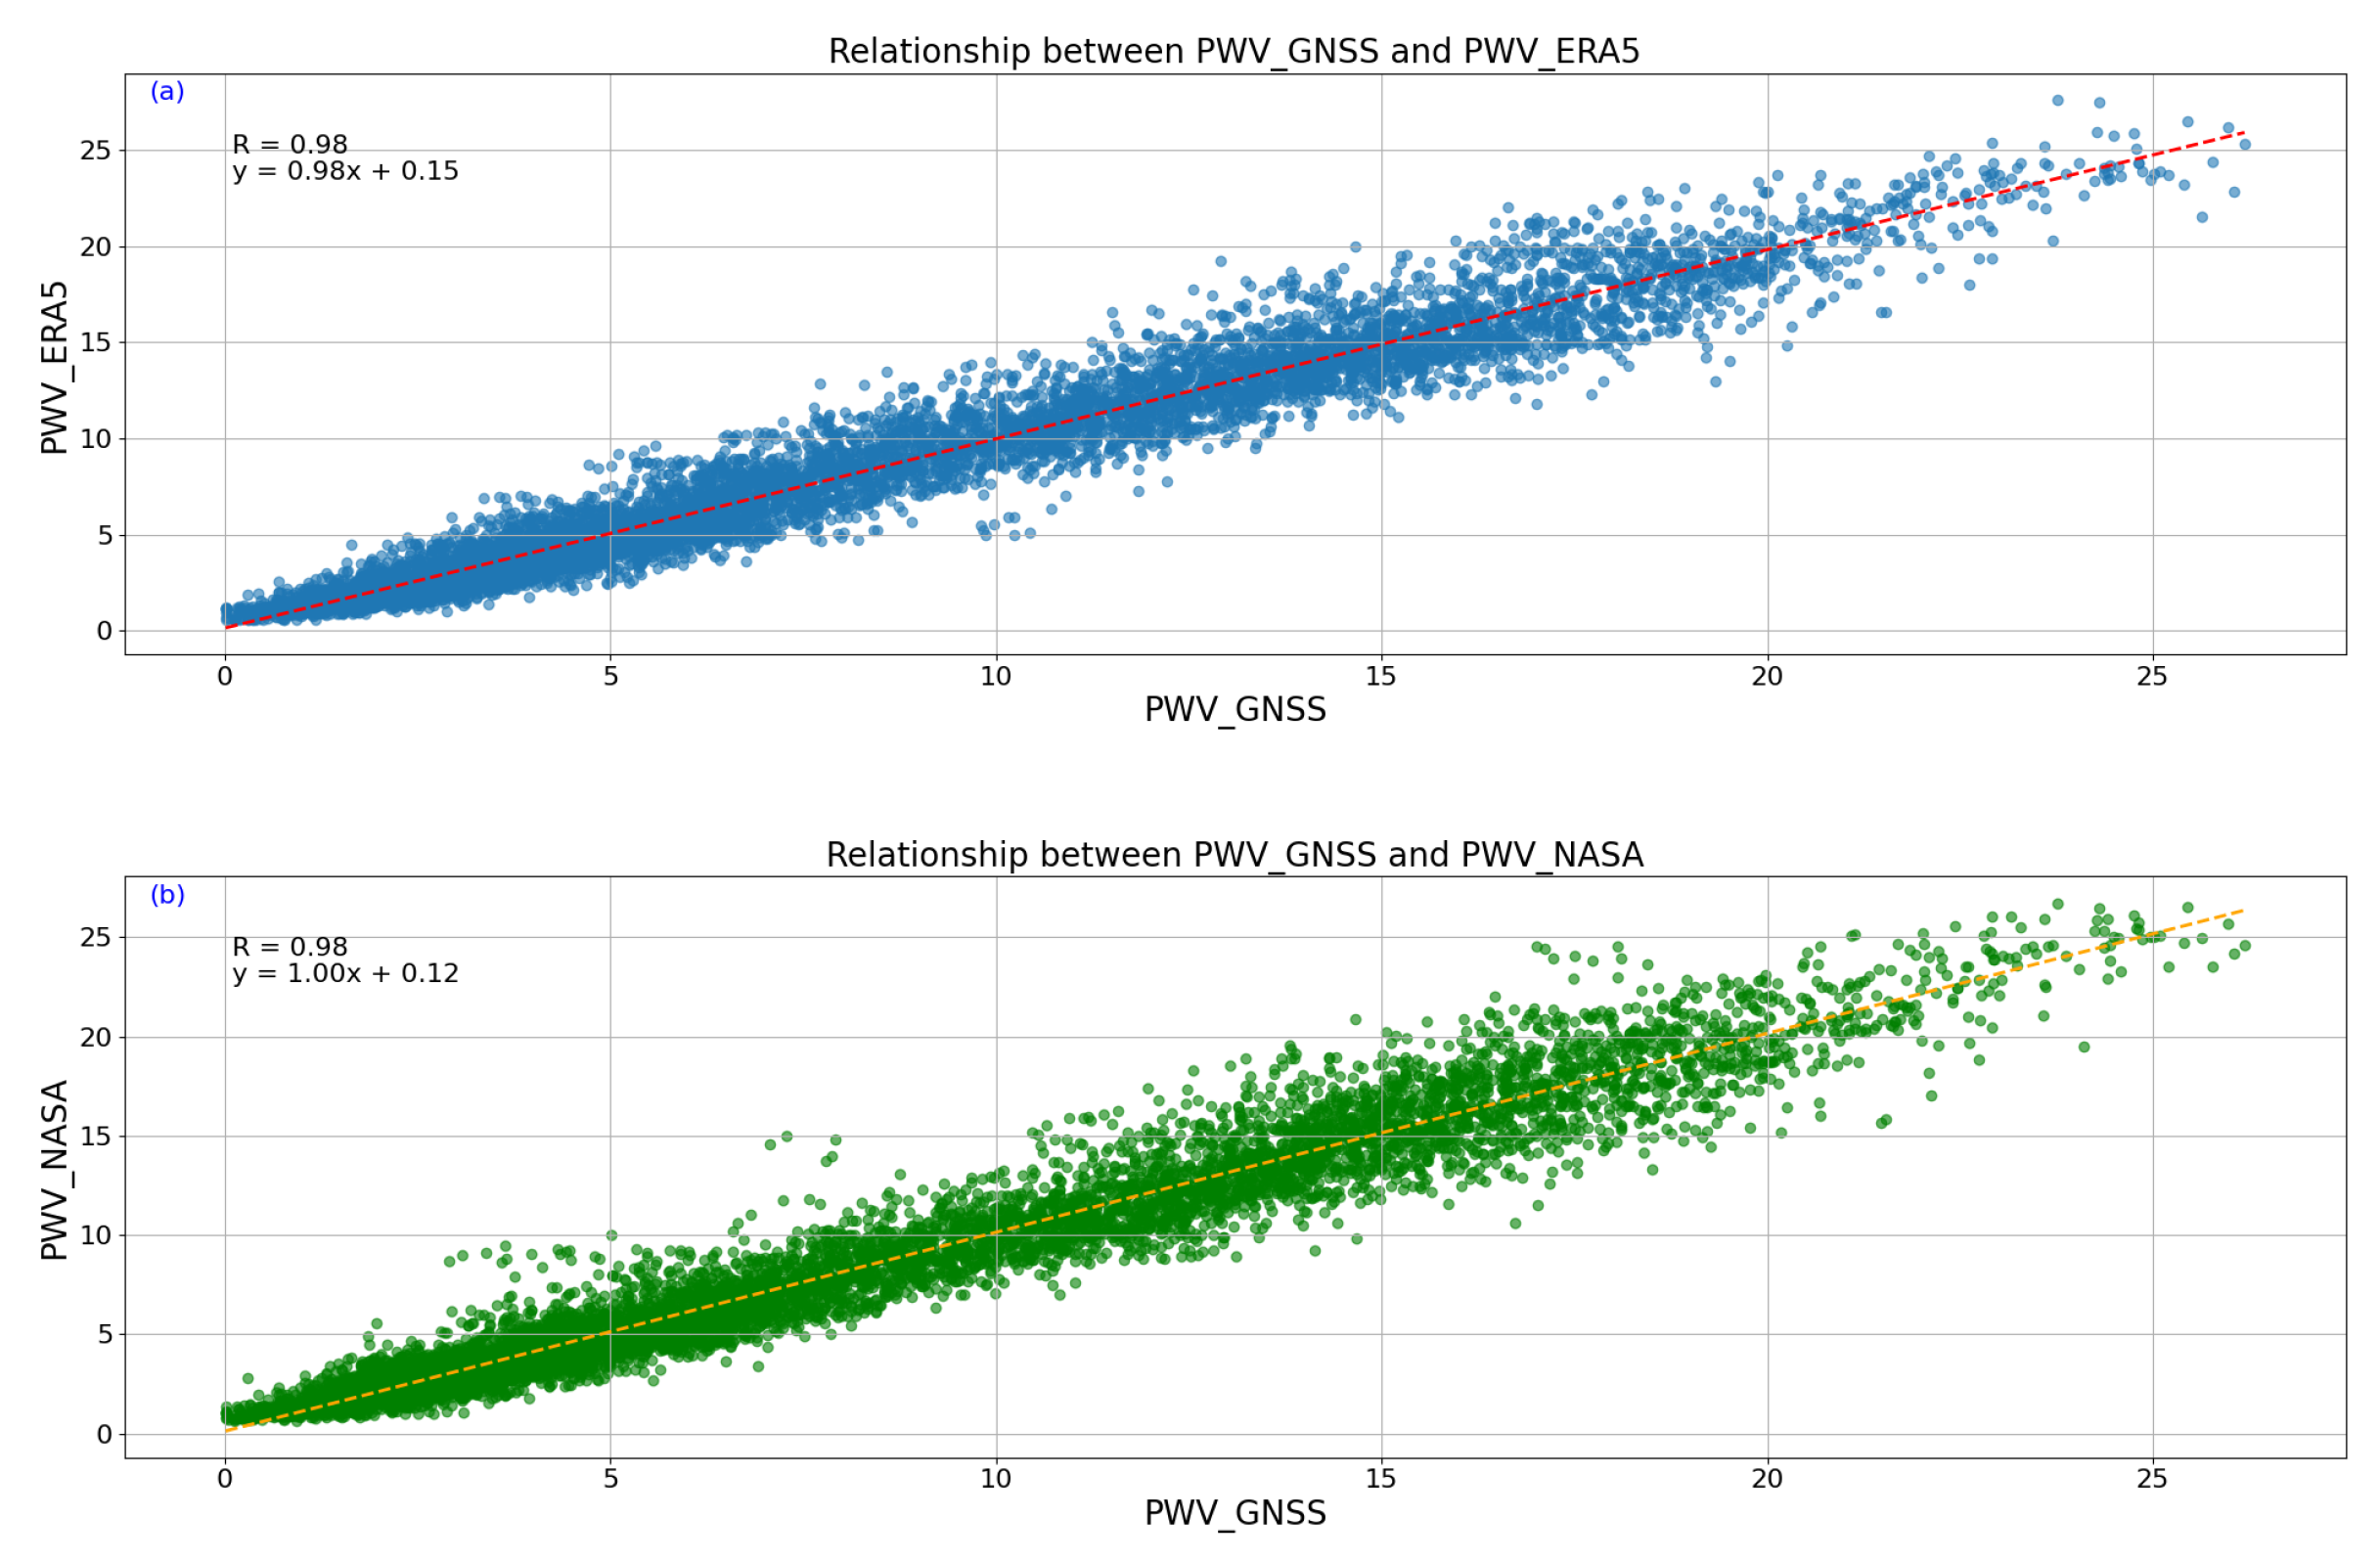
Figure 4.
Error distribution of ERA5 and NASA reanalysis data compared to GNSS-derived PWV.
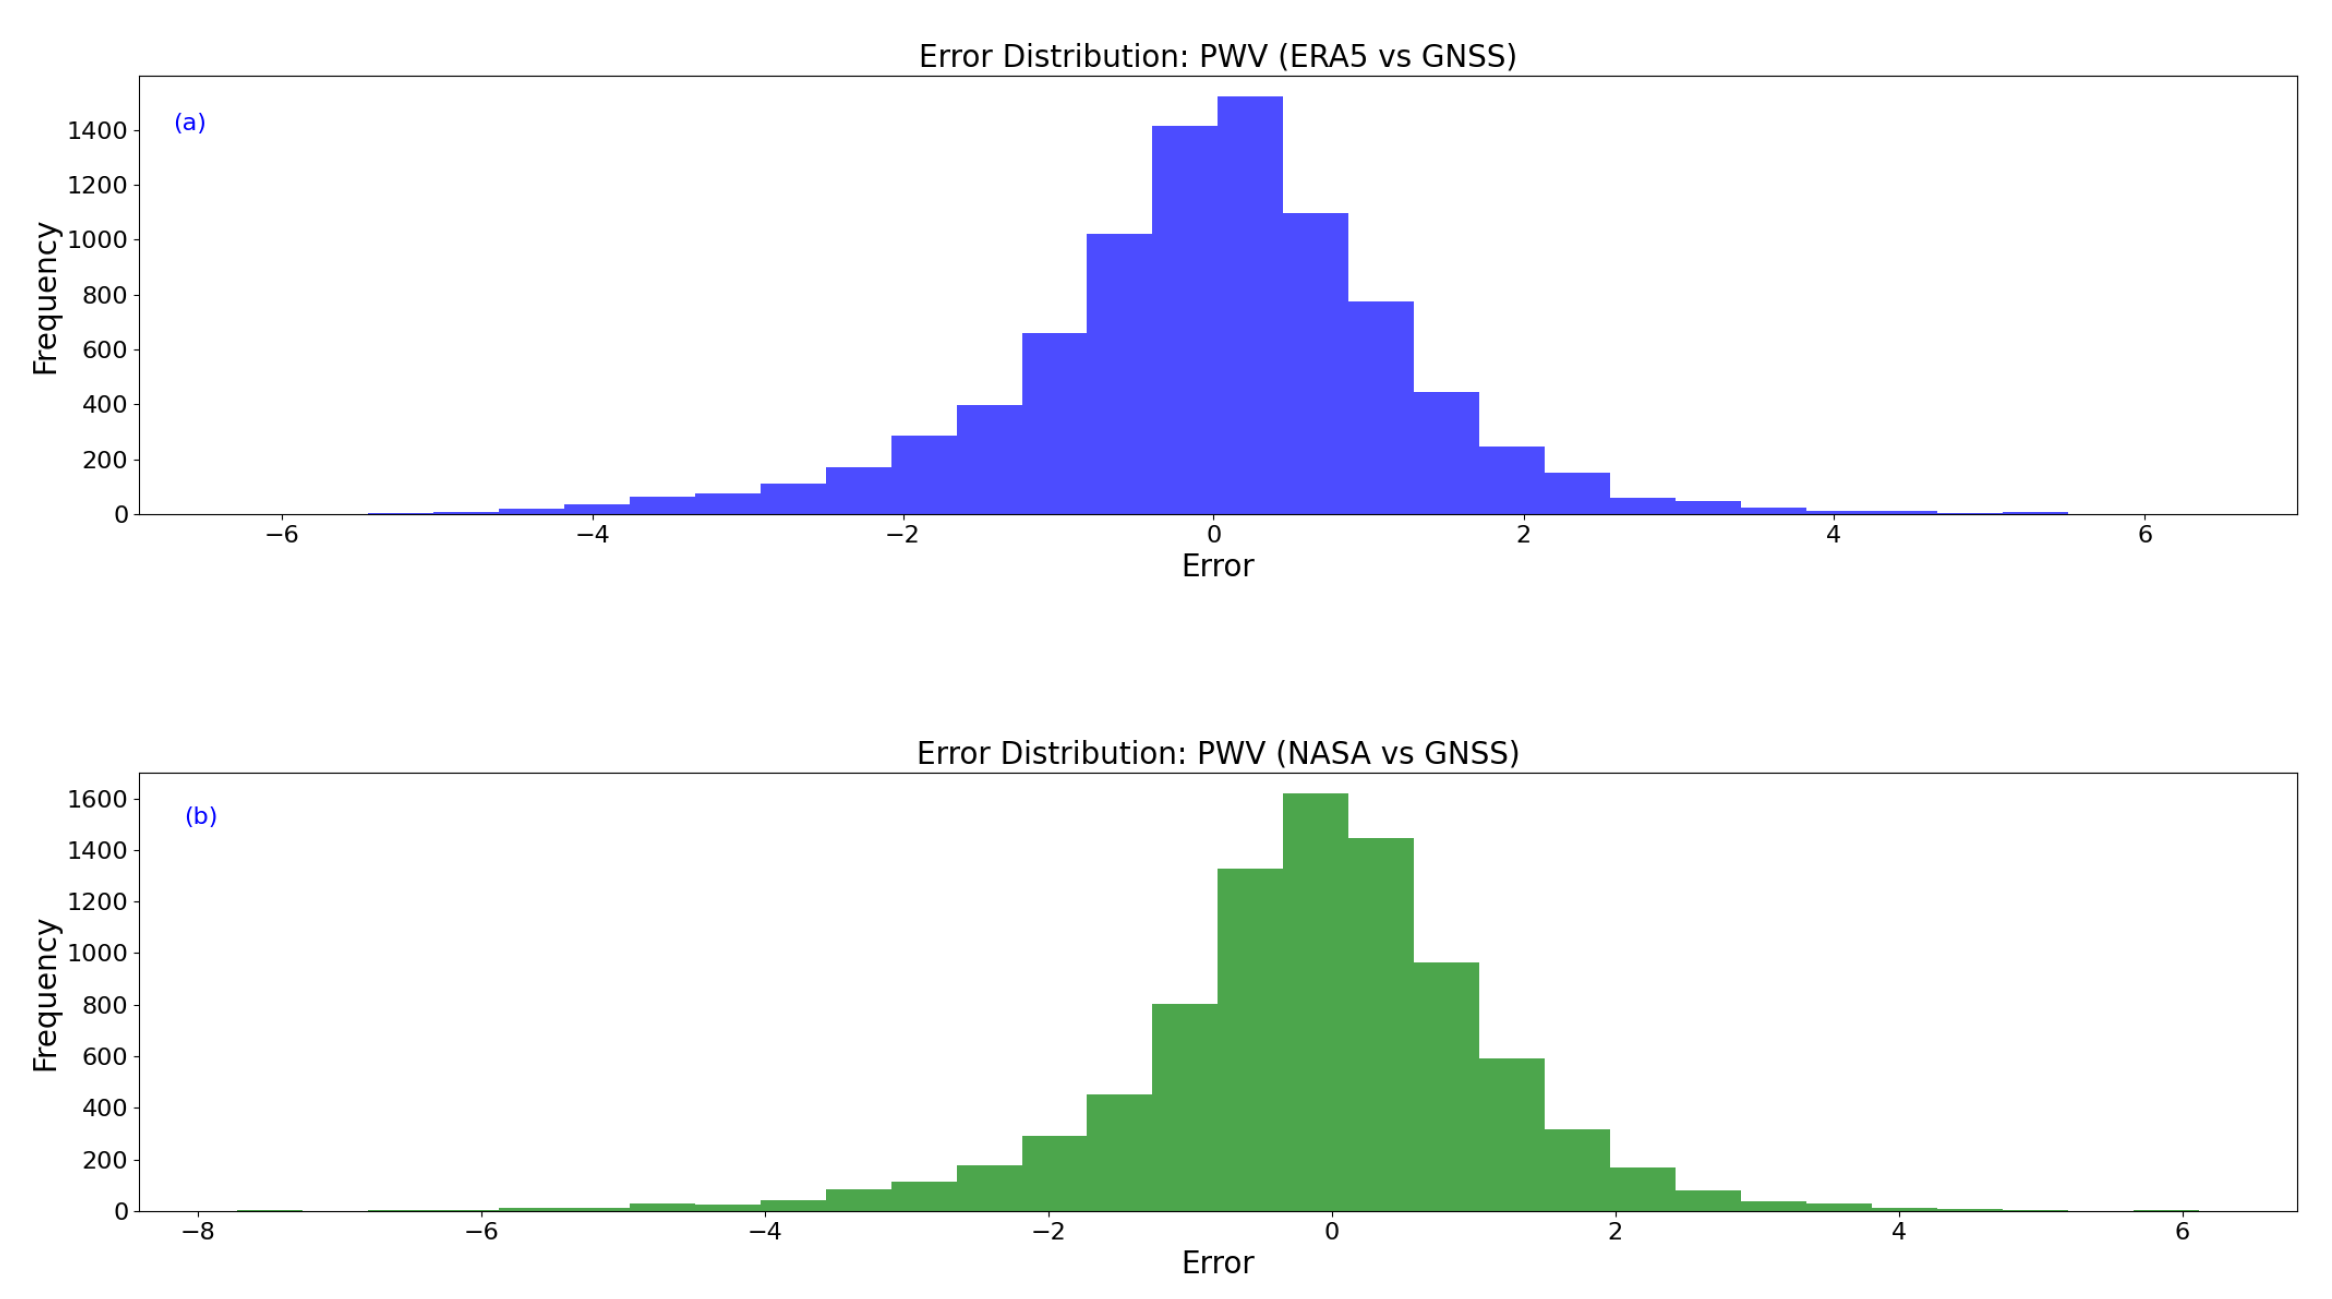

Table 1.
Main parameters of two reanalysis datasets.
| Name | Source | Style | Period | Resolution | Level |
|---|---|---|---|---|---|
| ERA-interim | ECMWF | 4D-var | 1940-present | 0.25×0.25° | 37 |
| MERRA | NASA | 3D-var 1 | 1980-present | 0.5°×0.625° | 42 |
Table 2.
Comparison of Metrics for ERA5 & GNSS and NASA & GNSS by Month.
| Source | Metric | Jan | Feb | Mar | Apr | May | Jun | Jul | Aug | Sep | Oct | Nov | Dec |
|---|---|---|---|---|---|---|---|---|---|---|---|---|---|
| ERA5 | RMSE | 0.56 | 0.74 | 0.93 | 1.12 | 1.17 | 1.47 | 1.63 | 2.02 | 1.69 | 1.34 | 0.63 | 0.61 |
| MAE | 0.43 | 0.59 | 0.75 | 0.89 | 0.94 | 1.12 | 1.30 | 1.60 | 1.37 | 1.06 | 0.50 | 0.48 | |
| MBE | 0.18 | -0.06 | 0.05 | 0.53 | 0.31 | 0.23 | 0.36 | -0.80 | -0.42 | -0.73 | 0.16 | 0.10 | |
| MaxErr | 2.36 | 2.85 | 2.50 | 3.45 | 3.87 | 4.56 | 4.35 | 6.35 | 5.31 | 3.94 | 2.25 | 1.84 | |
| NASA | RMSE | 0.62 | 0.73 | 0.96 | 1.16 | 1.57 | 1.67 | 1.81 | 2.15 | 1.34 | 1.10 | 0.72 | 0.66 |
| MAE | 0.49 | 0.58 | 0.78 | 0.88 | 1.19 | 1.28 | 1.46 | 1.63 | 1.03 | 0.87 | 0.57 | 0.49 | |
| MBE | -0.05 | 0.05 | -0.10 | 0.26 | 0.11 | 0.25 | -0.44 | -0.82 | -0.41 | -0.25 | -0.08 | -0.06 | |
| MaxErr | 1.92 | 2.18 | 3.58 | 4.29 | 5.90 | 6.12 | 5.47 | 7.72 | 4.93 | 3.96 | 2.50 | 2.59 |
Disclaimer/Publisher’s Note: The statements, opinions and data contained in all publications are solely those of the individual author(s) and contributor(s) and not of MDPI and/or the editor(s). MDPI and/or the editor(s) disclaim responsibility for any injury to people or property resulting from any ideas, methods, instructions or products referred to in the content. |
© 2025 by the authors. Licensee MDPI, Basel, Switzerland. This article is an open access article distributed under the terms and conditions of the Creative Commons Attribution (CC BY) license (http://creativecommons.org/licenses/by/4.0/).
Copyright: This open access article is published under a Creative Commons CC BY 4.0 license, which permit the free download, distribution, and reuse, provided that the author and preprint are cited in any reuse.


