Submitted:
03 February 2025
Posted:
04 February 2025
You are already at the latest version
Abstract
Procedures for the easy preparation of a series of phytyl phenolipids were developed, yielding phytyl esters of caffeic, protocatechuic, homoprotocatechuic and dihydrocaffeic acids in high yields (70-95%). Preliminary characterization showed that these new compounds have a similar lipo-solubility and comparable radical scavenging capacity to that of the natural membrane antioxidant -tocopherol. Cyclic voltammetry analysis showed lower anodic peak potentials for the phytyl esters when compared with the parental phenolic acids and the electron transfer followed an ad-sorption-controlled mechanism. Despite having strong anti-radical capacity and of being able to penetrate the membrane, the antioxidant efficiency of phytyl esters in liposomal systems was deeply dependent on the structure of the phenolipid polyphenolic moiety. In the phosphatidyl-choline LUVs system tested, phytyl esters showed remarkable efficiency in preventing liposome autoxidation when compared to -tocopherol, excepted for the caffeic acid ester that did not show any improvement in the oxidative stability of liposomes. Nevertheless, as all the phytyl esters showed at least a similar activity when compared with -tocopherol, all these molecules can still be considered strong candidates for future interventions against oxidative stress in cells and lipo-proteins, deserving a proper evaluation of their antioxidant and anti-inflammatory capacity in cell models and in vivo.
Keywords:
phenolic acids
; phenolipids.
; phytyl esters
; liposomes
; biomembrane
; caffeic acid
; protocatechuic acid
; homoprotocatechuic acid
; dihydrocaffeic acid
1. Introduction
Cardiovascular diseases (CVD), hepatic steatosis, diabetes, and neurodegenerative diseases continue to affect large portions of the population, despite the many therapeutic treatments already developed [1,2,3,4,5]. The causes of these disorders are diverse and complex but scientific evidence point to two common factors for these conditions as being inflammation and oxidative stress [6,7,8,9]. Many well-known risk factors such as hypertriglyceridemia, hyperglycemia, high levels of glycated hemoglobin, and decreased high-density lipoprotein cholesterol (HDL-C) promote mitochondrial dysfunction, resulting in increased production of reactive oxygen species (ROS). On the other hand, associated with this increase in ROS, inhibition of antioxidant defence systems, with emphasis on the reduction in the activity of antioxidant enzymes such as catalase (CAT), superoxide dismutase (SOD), and enzymes involved in glutathione metabolism (GSH) can also occur [6,7,8]. This oxidative stress, not only activates several inflammatory factors, including C-reactive protein, tumor necrosis factor alpha (TNFα), inflammasome protein 3 (NLRP3), and nuclear factor kappa B (NF-kB) [6], but also increases low-density lipoproteins (LDL) and HDL oxidation together with endothelial dysfunction, favouring the formation of atheroma [9]. Given that metabolic diseases and aging are strongly related to oxidative stress [10], membrane-targeted antioxidants may help reduce oxidative damage to organelles, cells, and lipoproteins.
Plants are dynamic and aggressive living organisms focused on survival and reproduction, having the ability to recognize and respond to their own needs and external threats such as parasites and to changes in weather conditions. In order to fight oxidative stress caused by low water availability and sun exposure, plants are required to produce antioxidant defences, namely to produce antioxidant molecules (AOs) [11]. Animals, on the other hand, are unable of such biosynthesis and need to consume these molecules that will protect their cells. α-Tocopherol produced by plants is been used by animal cells as the most important AOs against membrane oxidative injury. Several classes of other phenolic antioxidant molecules such as flavonoids and phenolic acids have also shown to play an important role in maintaining health and preventing chronic diseases by preserving the structural integrity of biomembranes and mitigating the effects of oxidative stress. However, most of these phenolic molecules have been “designed” by plants for their own needs, being their use by animals limited by possible toxicity or by low bioavailability, mostly due to their hydrophilic nature [11,12].
The liposolubility of phenolic acids can be increased and thus, improve their bioavailability, through esterification with an alkyl chain. These new molecules, named phenolipids, have the capacity to interact with, and cross membranes, leading to a good pharmacological efficacy [3]. Gallic, caffeic, and ferulic acid phenolipids, depending on the length of the alkyl chain, have shown to protect LDL from oxidative damage [13,14]. Some studies have also been conducted for caffeic acid phenolipids using red blood cells (RBCs) and a strong protective activity against 2,2'-azobis(2-amidinopropane) dihydrochloride (AAPH)-induced oxidative was observed at a concentration as low as 2.5 μM [15,16]. However, some studies using phenolipids have shown some toxic effects in cell models, in some cases in a very low concentration [17]. Either the phenolipid itself or their metabolization products can be responsible for this toxicity. Preliminary toxicological studies with some classes of phenolipids have shown that lipophilization using linear fatty alcohols are more likely to produce toxicity than using phytosterols, a more common kind of phenolic esters found in foods [17]. Therefore, in the search for more efficient AOs, able to fight oxidative stress, in particular in the case of degenerative conditions, the design of molecules inspired on natural compounds already found in foods, may be considered a safer approach.
Phytol [(E)-3,7,11,15-tetramethylhexadec-2-en-1-ol], an acyclic monounsaturated diterpene alcohol, is an example of a potential natural compound to be used in pharmacological applications [18,19]. This compound is an integral part of chlorophyll molecules and is used by plants to provide the phytane chain moiety of α-tocopherol during its biosynthesis [11,18,19]. In both cases, nature has used the phytane chain to anchor these important molecules in the place where they are needed, namely in biomembranes. Therefore, the aim of this work was to synthetise α-tocopherol analogues by grafting the phytol chain to efficient radical scavenging polyphenolic acids, namely caffeic acid (CA), dihydrocaffeic acid (DHCA), homoprotocatechuic acid (DOPAC) and protocatechuic acid (PCA). The new phenolipids obtained could function as lipophilic antioxidant molecules with potentially better efficiency in the treatment of degenerative disorders caused by oxidative stress (Figure 1).
2. Results and Discussion
2.1. Synthesis of Phytyl Phenolipids
The esterification of polyphenolic acids often requires the previous protection of aromatic hydroxyl groups due to their particular chemical reactivity in base catalyst conditions, leading to time and material-intensive processes leading to low overall yields [12,20,21,22]. In this work we used acidic conditions to avoid, on the one hand, the need of this protective step and, on the other hand, the easier oxidation of polyphenolic acids in basic media as already described in our previous work concerning, caffeic acid esters and cholesterol-derived phenolipids [12,23]. However, under the same reaction conditions, the yields obtained were quite different depending on the phenolic acid structure and solvent. In toluene, no reaction was observed but in THF, a moderate yield for DOPAC and a low yield for DHCA were obtained. In agreement with what had been observed for the synthesis of cholesteryl protocatechuate in our previous work [12], PCA showed not to be reactive under acidic conditions in the presence of phytol (Table 1).
Since phytol is a primary alcohol, the esterification reaction under enzymatic catalysis was also attempted in several solvents. Good yields were obtained for phytyl dihydrocaffeate (DHCA-P) and phytyl homoprotocatechuate (DOPAC-P) (Table 1). The solvent was an important factor for success of the esterification, with toluene and dioxane favoring the reaction. The reaction also showed an important dependence on the structure of the polyphenol as the yields of DHCA-P and DOPAC-P were the highest in different solvents, namely toluene and dioxane, respectively. In contrast, the phytyl protocatechuate (PCA-P) was obtained in a modest yield and only when THF was used as solvent (Table 1).
Since the PCA-P was not obtained in good yields with the above synthetic approaches, PCA was made to react as a chloride with phytol. Thus, PCA ester synthesis was achieved in good yields (70%) by reacting first PCA with thionyl chloride in dichloromethane followed by the addition of phytol, in a one-pot synthesis [12].
Phytyl caffeate (CA-P) was obtained in good yield (95%) by a well-known procedure, with a two-step synthetic route in a one-pot synthesis, based in a Knoevenagel condensation [12,23].
In general, the reaction times were long, however, this drawback was surpassed by a reduction in synthetic steps and easier purification procedures.
2.2. Evaluation of Free Radical Scavenging Capacity of Phytyl Phenolipids
The 2,2-diphenyl-1-picrylhydrazyl (DPPH) radical assay was used to evaluate the free radical scavenging capacity of AOs in solution [12,23,24]. According to the EC50 values obtained (Table 2), the introduction of the phytyl moiety decreased the radical scavenging capacity of phytyl esters when compared to the parental compounds, except for the PCA ester which showed an improvement in its capacity. The introduction of a bulky group as an ester, such the phytyl moiety, probably induces a steric hinderance that interferes with the reaction between the aromatic hydroxyl group and the also bulky DPPH radical. In the case of PCA-P, the decrease in reactivity due to steric hinderance is probably compensated by the increase in reactivity of the aromatic hydroxyl group caused by esterification of the carboxylic group directly linked to the ring, in accordance with what was already observed for cholesteryl protocatechuate [12]. Nevertheless, in these conditions, phytol esters showed better radical scavenging capacity than α-tocopherol.
Since AOs react with free radicals by donating electrons or hydrogens, oxidation potential is a fundamental indicator of their possible effectiveness as AOs. Thus, cyclic voltammetry was used to determine the oxidation peak potential of each AO, providing valuable information about their susceptibility to oxidation (Table 3).
The anodic peak potential of the AOs was used to characterize their potential antioxidant capacity and to determine the nature of the process controlling the oxidation reaction. Comparative analysis of the voltammograms for the phenolic acids and their corresponding phytyl esters offers insights into their redox behavior and stability (Figure 2).
Among the phenolic acids studied (Figure 2, Table 3), CA exhibits the lowest anodic peak potential (223 ± 4 mV), highlighting its superior propensity to oxidize and thus to have a potentially greater antioxidant activity. Although all AOs display low anodic peak potential values, α-Toc displayed the lowest (219 ± 2 mV).
In the case of phenolic acids, their electrochemical behavior is characterized by relatively low oxidation potentials, indicating high reactivity (Table 3). The presence of a cathodic peak in the reverse scan shows that the behavior of these compounds is reversible.
When these phenolic acids were esterified with phytol, notable changes were observed in their electrochemical behavior. All esters exhibit a lower oxidation peak potential compared to their respective parental compound, except for CA, which shows no significant variation when considering the standard deviation (235 ± 11 mV for CA-P and 223 ± 4 mV for CA). A lower anodic potential is beneficial and corresponds to an increased ability to donate electrons to free radicals. Esterification also leads to lower peak currents for all compounds, which can be attributed to a decrease in the diffusion coefficient of the species due to the higher molecular weight of these molecules. Except for DOPAC-P, all esters display cathodic peaks in the reverse scan, which indicates for these compounds that the processes are reversible (Figure 2). A lack of cathodic peak was also found for α-Toc in the same conditions.
Further studies were conducted to investigate the effect of the scan rate on peak current of phenolic acids and their corresponding esters. An increase in peak current intensity is observed with increasing scan rate, and the data was adjusted to linear regression analysis for both anodic and cathodic processes to elucidate the control mechanism (Figure 3, Table 4).
The Randles–Ševčík equation, which describes the relationship between peak current and scan rate for electrochemically reversible electron transfer processes involving freely diffusing redox species was applied to evaluate the results [25]. This equation predicts a linear relationship between the peak current (Ip) and the square root of the scan rate (v1/2) for a diffusion-controlled process (Figure 3A). The results confirmed that all phenolic acids followed the expected diffusion-controlled behavior. In contrast, the phytyl esters exhibited a direct correlation between Ip and v (Figure 3B), indicating that their electrochemical process is predominantly controlled by an adsorption mechanism. The linear regressions obtained demonstrated a strong correlation between Ip and either v1/2 or v, with a high correlation coefficient (Table 4). Visual analysis of the overlay of cyclic voltammograms at different scan rates also complements the conclusions made (Figure 3). The shape and symmetry of the anodic peak provided additional evidence to distinguish between diffusion and adsorption-controlled processes.
The effect of concentration variation on Ipa and Epa was studied over a range of 0.1 mM to 5 mM for CA and 0.01 mM to 1 mM for its ester (CA-P), with the upper limit for the ester being reached by its solubility. In diffusion-controlled processes, the anodic peak current increases proportionally with concentration, as the analyte is freely diffusing in solution. The linearity of the Ip vs concentration plot up to 5 mM, was more pronounced for CA than for its ester. This behavior was not observed in the adsorption-controlled process for CA-P, where the response is primarily limited by the available electrode surface area. For CA, a diffusion-controlled compound, a proportional relationship was established between peak current and concentration, as well as between anodic peak potential and the logarithm of the concentration.
In the case of CA-P, which follows an adsorption-controlled mechanism, the proportionality between peak current and concentration was only observed up to 0.055 mM. Beyond this concentration, oxidation is limited by electrode surface saturation. This behavior arises from the fact that the molecules first adsorb onto the electrode surface before undergoing oxidation. Once the available surface sites are saturated, no further increase in peak current is observed, regardless of higher analyte concentrations in solution. In relation to the variation of potential with concentration, it was observed that the potential required for oxidation remained constant for the phytyl ester (Epa = 216 ± 1 mV). Since the molecules are pre-adsorbed onto the electrode surface, oxidation potential remains largely unaffected by increasing analyte concentration.
The electrochemical characterization of molecules provides valuable insights for optimizing their application across different fields. Oxidation mechanisms could significantly influence the antioxidant efficiency depending on the system in which they are applied. Therefore, compounds that undergo diffusion-controlled oxidation could be suitable for use in homogeneous liquid systems, whereas those that easily adsorb can be particularly effective in lipid-based systems where surface interactions are crucial for protection against oxidative stress.
2.3. Interaction of Compounds with Liposomal Membranes
The esterification of phenolic acids with phytol increases their liposolubility, as shown by miLog P, leading to values similar to that of α-Toc (Table 2). This increase is expected to improve the interaction of these compounds with biomembranes. Therefore, in order to understand how these compounds interact with membrane lipids, two simplified models of lipidic membranes were used. Liposomes of 1,2-dimyristoyl-sn-glycero-3-phosphocholine (DMPC) were prepared with the incorporation of three different fluorescent membrane probes — 2-hydroxyacid-(9-anthroyloxy)stearic acid (2-AS), 1,6-diphenyl-1,3,5-hexatriene-4′-trimethylammonium tosylate (TMA-DPH) and 1,6-diphenyl-1,3,5- hexatriene (DPH) — which reside at various depths from the center of the bilayer (at 16, 10.9 and 7.8 Å, respectively) [26].
The quenching of the fluorescence emission of probes in the presence of AOs (Figure 4) reveled that parental phenolic acids have low effect over the three probes, proving their more external location in the membrane. The exception was CA, that showed similar capacity to phytol to penetrate the membrane, probably due to its lower water solubility.
In contrast, the fluorescence intensity of the three probes decreased sharply within a few seconds after the addition of phytyl esters or α-tocopherol into the DMPC liposome suspension, showing interactions of the compounds along the membrane monolayer (Figure 4). These interactions indicate that these molecules are found in a parallel position to the phospholipid molecules (Figure 5).
However, the interaction of compounds with the probes did not show the same intensity, with CA-P showing the highest interaction. The quenching observed in the TMA-DPH fluorescence intensity is higher for the phytyl esters than with α-tocopherol showing a strong interaction of the compounds with the area located below the polar head of the phospholipids. However, in the case of the DPH probe, only CA-P showed a higher quenching capacity when compared to α-Toc and to the other esters, which may indicate for this ester, a deeper location in the monolayer.
The influence of phytyl compounds in the fluidity of DMPC LUVs model membrane were also evaluated at 37 ± 0.1°C and compared with that of α-Toc. Figure 6 shows changes in the steady-state fluorescence anisotropy of the TMA-DPH and DPH probes in the presence of compounds. The results showed that, at the concentration tested, phytyl esters increase the anisotropy values of the probes located either in the intermediate and deeper regions of the monolayer, meaning that all compounds were able to decrease the fluidity of the membrane in both areas. Besides the higher quenching capacity observed in the TMA-DPH fluorescence intensity for the phytyl esters, the decrease in the anisotropy values of both probes was similar to that obtained for α-Toc except for CA-P, indicating a low probability of these compounds to present toxicity caused by interference in membrane fluidity. In contrast, CA-P when compared to α-tocopherol, was able to significantly change the steady-state anisotropy parameter for the DPH probe, resulting in a lower fluidity of the membrane in this region [15] and confirming its deeper location in the monolayer.
2.4. Antioxidant Capacity of Phytyl Phenolipids in Liposomal Systems
In this study, AAPH, a water-soluble free radical initiator widely used in biological studies was used. This azo compound reacts with oxygen, producing peroxyl radicals at a constant rate and it is intend to mimic the attack of free radicals such as hydroperoxyl radicals and other possible peroxyl radicals on biomembranes [27]. In the presence of AOs, the oxidative stability of liposomal suspensions of lecithin from soybean (PC soy) containing AAPH increased (Figure 7) when compared with the control for all parental compounds and phytyl esters. Nevertheless, the antioxidant capacity of parental phenolic acids was better than that of phytyl esters or α-Toc. The order of antioxidant activity was CA > DHCA ~ DOPAC~PCA > α-Toc ~ CA-P ~ DHCA-P ~ DOPAC-P ~ PCA-P > Control (Figure 7).
Despite the lower anodic potential and the higher interaction with the bilayer found for these compounds, a better antioxidant capacity was not observed for the phytyl esters, when compared to the parental compounds. Still, phytyl esters showed similar antioxidant protection to that of α-Toc. Similar results were already obtained for cholesteryl phenolipids [12] and other more lipophilic phenolipids [15]. Due to their high liposolubility (Table 1), these compounds when in contact with PBS may form aggregates and hinder their penetration into the membrane and the actual concentration of esters in the bilayer can be much lower than the stochiometric concentration, leading to relatively low antioxidant capacity. Another reason can be the fact that a hydrosoluble free radical initiator is being used and the scavenging of radicals formed in the aqueous media are probably more efficiently scavenged by hydrophilic compounds before the attack to the membrane.
A further oxidative stability assay was performed, now without the use of a radical initiator (Figure 8). Liposomes were incubated in the presence of compounds and stored in the dark at 37 °C and its content in conjugated dienes were followed by UV spectrophotometry.
With this procedure, free radicals are formed inside the membrane and will migrate to the polar head zone of the membrane [28]. In the presence of AOs, the oxidative stability against autoxidation increased for most suspensions (Figure 8) except for the ones containing CA-P and PCA, being now the order of antioxidant activity different to that obtained in the previous stability study: DOPAC-P > DHCA-P > PCA-P ~ DOPAC > DHCA > CA ~ α-Toc > Control ~ CA-P > PCA. Under the conditions of this study, the liposomal suspensions containing PCA-P, DHCA-P or DOPAC-P showed more than double the stability of the suspension containing α-Toc. On the other hand, the stability of liposomes containing CA-P, although similar to those containing α-Toc, were lower than that of the corresponding parental phenolic acid. According to these results, the lipophilization of DHCA, DOPAC and PCA with the phytyl moiety did increase their capacity in protecting the liposomal membrane from oxidative injury. In the case of PCA, this increase was very significant as the parental compound showed pro-oxidant effects. This pro-oxidant activity is common in lipidic systems for the more hydrophilic antioxidants and is related with the interactions of these reducing molecules with metal traces present in the system [29,30]. The increase in the efficiency of this compound may also be related to the increase in its radical scavenging capacity and the lowering of its anodic potential. In the case of CA-P, since this compound was one of the phytyl ester with the highest potential to act as radical scavenging antioxidant (low Epa and low EC50), the results can only be explained by the lower availability of its aromatic hydroxy groups to act as radical scavengers near the polar phospholipid heads. The higher interaction of the CA-P with the DPH probe indicate this molecule is probably deeper in the membrane, which explains the lower capacity in protecting the membrane.
3. Materials and Methods
3.1. Materials
Commercially available phytol (97%) containing a mixture of E and Z diastereoisomers, in the proportion of 3:1 respectively (checked by NMR, and in accordance with the NMR spectra given by the supplier), was obtained from Sigma-Aldrich and was used without any previous purification. CA, 3,4-dihydroxybenzaldeyde, β-Alanine (99%), DPPH• (95%) and DPH were acquired also from Sigma-Aldrich. α-Toc (95%), PCA (97%) and thionyl chloride (99.7%) were purchased from Thermo Fisher Scientific. DOPAC (>98%) and Meldrum’s acid (> 98%) were obtained from TCI. Pyridine (99.5%) was bought from Merck. Sodium sulfate anhydrous (99,9%) and PC Soy (90%) were obtained from Panreac AppliChem. TMA-DPH and hydrochloric acid (37%) were purchased from Fluka. DHCA (>98%), 2-AS and DMPC were from Alfa Aesar, Molecular Probes and Avanti Polar Lipids, respectively. Enzyme 435 was obtained from Novozymes. All organic solvents used were analytical or HPLC grade and were obtained from Fisher Scientific.
3.2. Synthesis of Phytyl Esters of Polyphenolic Acids
All syntheses and purifications were monitored using Thin-Layer Chromatography (TLC) on silica gel plates (FluoroChem 60 F254 aluminum support) and petroleum ether/ethyl acetate (3:1, v/v) as eluent, with development in an iodine chamber. The retention factor (Rf) values of the synthesized compounds were also determined.
Syntheses were also followed by High-Performance Liquid Chromatography (HPLC), using a Vanquish equipment from Thermoscientific, with a Diode-array detector and the Chromeleon 7 software. A LiChrospher® 100 RP-18 (5 μm) LiChroCART® 250-4 reverse-phase column (Merck) and a LiChrospher® 100 RP-18 (5 μm) LiChroCART® 4-4 precolumn (Merck) were used. Column and sample compartment temperatures were set to 30 °C. 10 μL of each sample were analyzed for 30 min, using ACN/MeOH (1:1, v/v) as eluent at a flow rate of 1.0 mL/min, with UV detection at 280 nm. Before analyzing, samples were filtered using polyvinylidene fluoride (PVDF) syringe filters with a porosity of 0.22 μm (Branchia). The retention time (RT) and the maximum absorption wavelength (λmax) of each compound were determined using HPLC. A mixture of diastereoisomers were obtained in all synthesis in the same proportion found in the commercially available phytol (3E:1Z).
The synthetized compounds were identified and characterized by Proton and Carbon Nuclear Magnetic Resonance (1H-NMR and 13C-NMR, respectively), using deuterated chloroform (VWR) as solvent. NMR spectra were acquired on a Bruker Advance III NMR spectrometer, in the Centre for Materials of the University of Porto (CEMUP) and were processed with MestReNova v14.2.3-29241 software. Chemical shifts (δ) and coupling constants (J) were given as parts per million (ppm) and Hertz (Hz), respectively.
High-Resolution Mass Spectroscopy (HRMS) was used to confirm the exact mass of the phytyl esters. Analyses were performed on an Orbitrap Exploris 120 mass spectrometer (Thermo Fischer Scientific) controlled by Orbitrap Exploris Tune Application 2.0.185.35 and Xcalibur 4.4.16.14 software. The resolution of SIM MS scan was 60,000.
3.2.1. Synthesis of CA-P
CA-P was synthesized following a two-step protocol as previously described [12]. In the first step, phytyl monomalonate was synthesized using Meldrum’s acid. Then, the monomalonate underwent a Knoevenagel condensation with 3,4-dihydroxybenzaldehyde to produce phytyl caffeate.
Briefly, equimolar quantities (3.4 mmol) of Meldrum’s acid and phytol were refluxed in 6 mL of toluene for 4 hours. Then, the solvent was evaporated, and phytyl monomalonate was obtained as a yellow oil (~96%, Rf = 0.68; UV-Vis (MeOH) λmax 203, 215, 245, 325 nm) and was used in the synthesis of the caffeate, without further purification. 1H-NMR (400 MHz, CDCl3): δ 5.34 (m, 1H, H-2); 4.70 (d, J1(E),2 = 8.0 Hz, 1H, H-1, E); 4.66 (d, J1(Z),2 = 8.8 Hz, 1H, H-1, Z); 3.44 (s, 2H, H-22, E); 3.43 (s, 2H, H-22, Z); 2.04 (m, 2H, H-5); 1.76 (d, J4(Z),2 = 1.3 Hz, 3H, H-4, Z); 1.70 (d, J4(E),2 = 1.3 Hz, 3H, H-4, E); 1.52 (m, 1H, H-18); 1.24 (m, 18H, H-6 - H-8, H-10 - H-13, H-15 - H-17); 0.85 (m, 12H, H-9, H-14, H-19, H-20) ppm. 13C-NMR (100 MHz, CDCl3): δ 169.90 (C-21); 167.90 (C-23); 144.71 (C-3, Z); 144.41 (C-3, E); 117.89 (C-2, Z); 117.08 (C-2, E); 63.15 (C-1, E); 62.84 (C-1, Z); 40.31 (C-5); 40.00 (C-17); 39.51 (C-22); 37.57 (C-7, E); 37.53 (C-10, E); 37.49 (C-12, E); 37.44 (C-15, E); 37.06 (C-7, Z); 36.96 (C-10, Z); 36.88 (C-12, Z); 36.78 (C-15, Z); 32.93 (C-8, E); 32.80 (C-8, Z); 32.51 (C-13); 28.13 (C-18); 25.75 (C-6, Z); 25.16 (C-11, Z); 24.94 (C-6, E); 24.61 (C-11, E); 23.64 (C-16); 22.86 (C-19); 22.77 (C-20); 19.89 (C-9, E); 19.83 (C-14, E); 19.78 (C-9, Z); 19.73 (C-14, Z); 16.57 (C-4).
CA-P was then obtained by reacting the synthesized monomalonate with 3,4-dihydroxybenzaldehyde by a Knoevenagel condensation. Equimolar quantities (4.6 mmol) of monomalonate and 3,4-dihydroxybenzaldehyde were reacted in 10.0 mL of pyridine with 50 mg of β-alanine at 50 °C for 5 days. The reaction mixture was quickly cooled, and 15 mL of concentrated HCl was added. Afterwards, 80 mL of deionized water was added and the aqueous phase extracted three times with 50 mL each of diethyl ether. The organic phase was dried over anhydrous Na2SO4, followed by evaporation of the solvent. The final compound was purified using flash column chromatography over silica gel with petroleum ether/ethyl acetate (3:1, v/v) as eluent. The CA-P was obtained as a cream-colored solid (~99%; Rf = 0.50; UV-Vis (MeOH) λmax 205, 215, 245, 300, 325 nm). 1H-NMR (400 MHz, CDCl3): δ 7.59 (d, J28(E),29 = 15.9 Hz, 1H, H-28, E); 7.58 (d, J28(Z),29 = 15.9 Hz, 1H, H-28, Z); 7.09 (d, J22,26 = 2.1 Hz, 1H, H-22); 7.00 (dd, J26,25 = 8.2 Hz, J26,22 = 2.1 Hz, 1H, H-26); 6.87 (d, J25,26 = 8.2 Hz, 1H, H-25); 6.28 (d, J29(E),28 = 15.9 Hz, 1H, H-29, E); 6.27 (d, J29(Z),28 = 15.9 Hz, 1H, H-29, Z); 6.12 (s, 1H, -OH); 5.95 (s, 1H, -OH); 5.40 (tq, J2(E),1 = 7.1 Hz, J2(E),4 = 1.4 Hz, 1H, H-2, E); 4.73 (d, J1(E),2 = 7.1 Hz, 1H, H-1, E); 4.70 (d, J1(Z),2 = 7.2 Hz, 1H, H-1, Z); 2.11 (t, J5(Z),6 = 8.2 Hz, 2H, H-5, Z); 2.02 (t, J5(E),6 = 7.5 Hz, 2H, H-5, E); 1.77 (d, J4(Z),2 = 1.4 Hz, 3H, H-4, Z); 1.73 (d, J4(E),2 = 1.4 Hz, 3H, H-4, E); 1.52 (m, 1H, H-18); 1.22 (m, 18H, H-6 - H-8, H-10 - H-13, H-15 - H-17); 0.85 (m, 12H, H-9, H-14, H-19, H-20) ppm. 13C-NMR (100 MHz, CDCl3): δ 168.08 (C-21, E); 168.02 (C-21, Z); 146.52 (C-23); 145.11 (C-28); 143.98 (C-3, E); 143.70 (C-3, Z); 143.21 (C-24); 127.72 (C-27); 122.54 (C-26); 118.90 (C-2, Z); 118.10 (C-2, E); 115.81 (C-29); 115.64 (C-25); 114.57 (C-22); 61.84 (C-1, E); 61.47 (C-1, Z); 40.06 (C-5); 39.53 (C-17); 37.59 (C-7, E); 37.54 (C-10, E); 37.48 (C-12, E); 37.45 (C-15, E); 37.10 (C-7, Z); 37.01 (C-10, Z); 36.92 (C-12, Z); 36.83 (C-15, Z); 32.93 (C-8, E); 32.88 (C-8, Z); 32.83 (C-13, E); 32.56 (C-13, Z); 28.13 (C-18); 25.80 (C-6, Z); 25.22 (C-11, Z); 24.95 (C-6, E); 24.62 (C-11, E); 23.67 (C-16); 22.87 (C-19); 22.77 (C-20); 19.90 (C-9, E); 19.87 (C-9, Z); 19.81 (C-14, E); 19.75 (C-14, Z); 16.60 (C-4). HRMS (ESI): m/z calculated for C29H46O4 = 458.3396; found = 458.3299.
3.2.2. Synthesis of DHCA-P and DOPAC-P
DHCA-P and DOPAC-P were obtained through an esterification reaction using enzymatic catalysis, according to a previously described procedure [24]. 2,8 mmol of DHCA or DOPAC and 8.4 mmol of phytol were dissolved in 30 mL of toluene or dioxane, respectively, containing 1 g of Novozym 435 and stirred for 14 days at 55 °C. Then, the organic solvent was evaporated and the final compound purified using flash column chromatography over silica gel with petroleum ether/ethyl acetate (3:1, v/v) as eluent.
DHCA-P was obtained as a cream-colored oil (~95%); Rf = 0.50; UV-Vis (MeOH) λmax 202, 282 nm. 1H-NMR (400 MHz, CDCl3): δ 6.76 (d, J25,26 = 8.1 Hz, 1H, H-25); 6.71 (d, J22,26 = 2.0 Hz, 1H, H-22); 6.62 (dd, J26,25 = 8.1 Hz, J26,22 = 2.0 Hz, 1H, H-26); 5.49 (s, 1H, -OH); 5.34 (s, 1H, -OH); 5.31 (tq, J2(E),1 = 7.1 Hz, J2(E),4 = 1.4 Hz, 1H, H-2, E); 4.59 (d, J1(E),2 = 7.1 Hz, 1H, H-1, E); 4.57 (d, J1(Z),2 = 7.0 Hz, 1H, H-1, Z); 2.83 (t, J28,29 = 7.7 Hz, 2H, H-28); 2.58 (t, J29(E),28 = 7.7 Hz, 2H, H-29, E); 2.57 (t, J29(Z),28 = 7.7 Hz, 2H, H-29, Z); 2.05 (t, J5(Z),6 = 7.9 Hz, 2H, H-5, Z); 2.00 (t, J5(E),6 = 8.0 Hz, 2H, H-5, E); 1.75 (d, J4(Z),2 = 1.3 Hz, 3H, H-4, Z); 1.68 (d, J4(E),2 = 1.4 Hz, 3H, H-4, E); 1.53 (m, 1H, H-18); 1.22 (m, 18H, H-6 - H-8, H-10 - H-13, H-15 - H-17); 0.85 (m, 12H, H-9, H-14, H-19, H-20) ppm. 13C-NMR (100 MHz, CDCl3): δ 173.44 (C-21, E); 173.44 (C-21, Z); 143.71 (C-23); 143.50 (C-3, Z); 143.09 (C-3, E); 142.12 (C-24); 133.70 (C-27); 120.78 (C-26); 118.86 (C-2, Z); 118.04 (C-2, E); 115.57 (C-25); 115.49 (C-22); 61.70 (C-1, E); 61.37 (C-1, Z); 40.02 (C-5); 39.52 (C-17); 37.59 (C-7, E); 37.54 (C-10, E); 37.48 (C-12, E); 37.45 (C-15, E); 37.08 (C-7, Z); 36.99 (C-10, Z); 36.92 (C-12, Z); 36.82 (C-15, Z); 36.33 (C-28); 32.94 (C-8, E); 32.87 (C-8, Z); 32.82 (C-13, E); 32.49 (C-13, Z); 31.08 (C-29, Z); 30.49 (C-29, E); 28.13 (C-18); 25.77 (C-6, Z); 25.21 (C-11, Z); 24.95 (C-6, E); 24.62 (C-11, E); 23.62 (C-16); 22.86 (C-19); 22.77 (C-20); 19.90 (C-9, E); 19.86 (C-9, Z); 19.83 (C-14, E); 19.80 (C-14, Z); 16.52 (C-4). HRMS (ESI): m/z calculated for C29H48O4 = 460.3553; found = 460.3458.
DOPAC-P was obtained as a cream-colored oil (~83%); Rf = 0.53; UV-Vis (MeOH) λmax 203, 283 nm. 1H-NMR (400 MHz, CDCl3): δ 6.78 (d, J22,26 = 2.0 Hz, 1H, H-22); 6.76 (d, J25,26 = 8.1 Hz, 1H, H-25); 6.67 (dd, J26,25 = 8.1 Hz, J26,22 = 2.0 Hz, 1H, H-26); 5.73 (s, 2H, -OH); 5.33 (tq, J2(E),1 = 7.2 Hz, J2(E),4 = 1.4 Hz, 1H, H-2, E); 4.62 (d, J1(E),2 = 7.2 Hz, 1H, H-1, E); 4.60 (d, J1(Z),2 = 8.0 Hz, 1H, H-1, Z); 3.50 (s, 2H, H-28); 2.06 (t, J5(Z),6 = 6.9 Hz, 2H, H-5, Z); 2.00 (t, J5(E),6 = 7.5 Hz, 2H, H-5, E); 1.75 (d, J4(Z),2 = 1.4 Hz, 3H, H-4, Z); 1.68 (d, J4(E),2 = 1.4 Hz, 3H, H-4, E); 1.52 (m, 1H, H-18); 1.22 (m, 18H, H-6 - H-8, H-10 - H-13, H-15 - H-17); 0.85 (m, 12H, H-9, H-14, H-19, H-20) ppm. 13C-NMR (100 MHz, CDCl3): δ 172.65 (C-21, E); 172.61 (C-21, Z); 143.72 (C-23); 143.57 (C-3, Z); 143.20 (C-3, E); 142.99 (C-24); 126.53 (C-27); 121.78 (C-26); 118.56 (C-2, Z); 117.75 (C-2, E); 116.34 (C-25); 115.37 (C-22); 62.09 (C-1, E); 61.78 (C-1, Z); 40.67 (C-28); 39.89 (C-5); 39.38 (C-17); 37.45 (C-7, E); 37.41 (C-10, E); 37.34 (C-12, E); 37.30 (C-15, E); 36.94 (C-7, Z); 36.85 (C-10, Z); 36.77 (C-12, Z); 36.67 (C-15, Z); 32.83 (C-8, E); 32.78 (C-8, Z); 32.68 (C-13, E); 32.38 (C-13, Z); 27.99 (C-18); 25.62 (C-6, Z); 25.07 (C-11, Z); 24.81 (C-6, E); 24.49 (C-11, E); 22.72 (C-16); 22.63 (C-19); 22.77 (C-20); 19.75 (C-9, E); 19.71 (C-9, Z); 19.70 (C-14, E); 19.65 (C-14, Z); 16.41 (C-4). HRMS (ESI): m/z calculated for C28H46O4 = 446.3396; found = 446.3309.
3.2.3. Synthesis of PCA-P
PCA-P was synthesized using a one-pot procedure, as previously described [12]. PCA was converted into its corresponding acid chloride by reaction with thionyl chloride. The resulting protocatechuate acid chloride was then esterified with phytol to form the final product. Briefly, PCA (6.5 mmol) was dissolved in 30 mL of dichloromethane containing 13 mmol of pyridine, and the resulting solution was stirred with cooling in an ice bath. Thionyl chloride (13 mmol) was added dropwise to the mixture, and the reaction was allowed to proceed for 24 hours. Then, 13 mmol of phytol was added, and the reaction was maintained at 4 °C for 5 days. Finally, the solvent was evaporated, and the final compound was purified by flash column chromatography on silica gel using petroleum ether/ethyl acetate (3:1, v/v) as eluent.
The product was obtained as a cream-colored oil (~70%); Rf = 0.59; UV-Vis (MeOH) λmax 204, 260, 295 nm; 1H-NMR (400 MHz, CDCl3): δ 7.65 (d, J22(E),26 = 2.0 Hz, 1H, H-22, E); 7.65 (d, J22(Z),26 = 2.0 Hz, 1H, H-22, Z); 7.60 (dd, J26(E),25 = 8.3 Hz, J26(E),22 = 2.0 Hz, 1H, H-26, E); 7.60 (dd, J26(Z),25 = 8.3 Hz, J26(Z),22 = 2.0 Hz, 1H, H-26, Z); 6.92 (d, J25,26 = 8.3 Hz, 1H, H-25, E); 6.92 (d, J25(Z),26 = 8.3 Hz, 1H, H-25, Z); 5.98 (s, 1H, -OH); 5.95 (s, 1H, -OH); 5.46 (tq, J2(E),1 = 7.0 Hz, J2(E),4 = 1.3 Hz, 1H, H-2, E); 4.83 (d, J1(E),2 = 7.0 Hz, 1H, H-1, E); 4.80 (d, J1(Z),2 = 7.2 Hz, 1H, H-1, Z); 2.15 (t, J5(Z),6 = 7.6 Hz, 2H, H-5, Z); 2.05 (t, J5(E),6 = 7.5 Hz, 2H, H-5, E); 1.80 (d, J4(Z),2 = 1.2 Hz, 3H, H-4, Z); 1.77 (d, J4(E),2 = 1.3 Hz, 3H, H-4, E); 1.54 (m, 1H, H-18); 1.25 (m, 18H, H-6 - H-8, H-10 - H-13, H-15 - H-17); 0.88 (m, 12H, H-9, H-14, H-19, H-20) ppm. 13C-NMR (100 MHz, CDCl3): δ 166.80 (C-21); 148.67 (C-23); 143.57 (C-24); 143.04 (C-3); 124.04 (C-26); 123.23 (C-27); 119.03 (C-2, Z); 118.25 (C-2, E); 116.81 (C-25); 114.97 (C-22); 62.08 (C-1, E); 61.71 (C-1, Z); 40.05 (C-5); 39.53 (C-17); 37.59 (C-7, E); 37.54 (C-10, E); 37.48 (C-12, E); 37.45 (C-15, E); 37.10 (C-7, Z); 37.03 (C-10, Z); 36.92 (C-12, Z); 36.82 (C-15, Z); 32.94 (C-8, E); 32.90 (C-8, Z); 32.82 (C-13, E); 32.59 (C-13, Z); 28.13 (C-18); 25.82 (C-6, Z); 25.23 (C-11, Z); 24.95 (C-6, E); 24.62 (C-11, E); 23.65 (C-16); 22.87 (C-19); 22.77 (C-20); 19.89 (C-9, E); 19.85 (C-9, Z); 19.81 (C-14, E); 19.75 (C-14, Z); 16.63 (C-4). HRMS (ESI): m/z calculated for C27H44O4 = 432.3240; found = 432.2504.
3.3. Determination of milogP Values
The lipophilicity of the compounds was estimated using the miLogP values, calculated with the Molinspiration property engine v2022.08 (Molinspiration Cheminformatics, accessed on January 4, 2025).
3.4. DPPH Radical Scavenging Capacity
The DPPH• scavenging capacity assay was used to evaluate the radical scavenging capacity of compounds, following previously described methods [12,23]. In brief, 50 μL of AO stock solutions in EtOH at increasing final concentrations (3 – 25 μM) were added to each well of a 96-well microplate. The reaction was initiated by adding 250 μL of DPPH• solution (final concentration, 112 μM) to each well, and absorbance was measured at 5-minute intervals over a 60-minute period at 25 °C. The relative free antiradical activity was expressed as the EC50 value, defined as the concentration of AO required to reduce the initial DPPH• concentration by 50%. Absorbance measurements at four time points (5, 15, 30 and 60 min) were used to calculate EC50 values. Each compound was tested twice across five independent experiments.
3.5. Cyclic Voltammetry
Voltammetric experiments were carried out with an Autolab PGSTAT 30 potentiostat (Eco-Chemie) with the GPES 4.9 software package (General Purpose Electrochemical Experiments). A three-electrode cell set-up was employed, comprising of a glassy carbon electrode (GCE) as the working electrode, a platinum wire as the counter electrode and an Ag/AgCl (KCl 1M) electrode as the reference. Prior to each measurement the working electrode was polished with 0.05 µm alumina powder on a polishing cloth and rinsed with water. The scan rates used were 5, 10, 20, 50, 100, 200, 400, 600 and 800 mV/s.
To prepare solutions for the evaluation of peak potential, 100 µL of 0.10 M antioxidant solution prepared in ethanol was transferred to a 10 mL volumetric flask and the volume was made up with phosphate buffer (pH 7.4). The solutions prepared for the voltammetric characterization were all nominally 1 mM. However, their actual concentrations showed slight variations: 0.94 mM for CA, 1.00 mM for DHCA, 1.04 mM for DOPAC, 1.04 mM for PCA, 1.10 mM for CA-P, 0.86 mM for DHCA-P, 0.95 mM for DOPAC-P, 0.60 mM for PCA-P and 1.34 mM for α-Toc. The effect of the concentration was studied for CA at 0.1, 0.5, 1, 2, 4 and 5 mM, and for its phytyl ester CA-P at 0.01, 0.02, 0.05, 0.1, 0.3, 0.5 and 1 mM.
All mean values and statistical parameters of the regression line are reported with their standard deviations calculated from a set of three consistent replicates.
3.6. Preparation of Large Unilamellar Vesicles
Liposomes were used as membrane mimetic systems, enabling the evaluation of the antioxidant activity of the AOs and their incorporation into the membrane. The compounds were incubated with pre-formed liposomes or incorporated during liposome preparation (also known as phytosomes).
Liposome suspensions were prepared using the hydration-extrusion method as previously described [15]. Briefly, PC soy or DMPC lipids were dissolved in chloroform in a round-bottom flask, and the solvent was evaporated to form a lipidic film. The lipidic films were then placed under vacuum for 3 hours. To hydrate the lipidic films, PBS (0.01 M, pH 7.4) was added, forming large multilamellar vesicles (MLVs). MLVs were then subject to 5 freezing/thaw cycles and were extruded through a 100 nm pore size polycarbonate filter (Whatman), using a LIPEX Biomembrane extruder at 37 °C for 10 cycles to obtain large unilamellar vesicles (LUVs) with 100 nm of diameter. The final suspension was kept at 4 °C until use.
For quenching assays, florescence probes were incorporated into the liposomes by adding each probe, with a probe-lipid ratio of 1:300 for DPH or TMA-DPH and 1:100 for 2-AS, in the initial DMPC chloroform solution.
For anisotropy assays, the incorporation of AOs and fluorescence probes (DPH or TMA-DPH) in the liposomes was performed by adding each probe, in a probe-lipid ratio of 1:300, and each AO as an ethanolic solution (final concentration, 200 μM), in the initial DMPC chloroform solution.
3.7. Dynamic Light Scattering Measurements
Dynamic light scattering (DLS) was used to measure the average size and polydispersity index (P.I.) of liposome suspensions [12], with a Zetasizer Nano-ZS instrument (Malvern Instruments, version 7.12). Samples were back scattered by a helium-neon laser (633 nm) at an angle of 173°, refractive indices of 1.330 for PBS (water) and 1.400 for lipids, and viscosity of the dispersant of 0.6913 cP (water), at 37 °C. The inter-day variability in liposome preparations was lower than 5%, and the P.I. of all prepared liposome suspensions was lower than 0.1.
3.8. Fluorescence Quenching Measurements
Fluorescence quenching assay was used to evaluate the insertion of the parental and synthesized compounds into the LUVs membrane, using three fluorescence probes (DPH, TMA-DPH and 2-AS [15,16,31]. α-Tocopherol was used as reference compound. The assays were performed on a Varian Cary Eclipse spectrofluorometer using a 1 cm quartz cuvette. Excitation and emission wavelengths of 360/427 nm, 365/426 nm and 363/458 for DPH, TMA-DPH and 2-AS, respectively, were used, with a slit width of 5 nm for excitation and 5 nm for emission, at the speed of 120 nm/min with data intervals of 1 nm. Initially, the DMPC LUVs suspension at 1 mM, containing each probe, was kept at 37 °C for thermal equilibrium. The fluorescence quenching studies were started at time 0 min and after 4 min, 20 μL of AO solution (final concentration of 200 μM) were added and the fluorescence intensity was measured over further 26 min. Three independent measurements were obtained for each compound and each tested probe.
3.9. Effect of Compounds on the Fluorescence Polarization of Probes
Fluorescence anisotropy was determined using two fluorescence probes (DPH and TMA-DPH) and AOs incorporated in the liposomes at 200 μM, as previously described [12]. Fluorescence anisotropy measurements were also performed with a Varian Cary Eclipse spectrofluorometer using a 1 cm quartz cuvette. Excitation and emission wavelengths of 360/427 nm and 365/426 nm for DPH and TMA-DPH, respectively, were used, with a slit width of 5 nm for excitation and 5 nm for emission. The steady-state anisotropy values were calculated according to [32]:
where and represent the emission intensities when the emission polarizer was oriented vertical (parallel) and horizontal (perpendicular) to the polarization of the excitation light. is a correction factor and is given by the ratio of vertical to horizontal components when the excitation light is polarized in the horizontal direction, . The anisotropy values are then expressed as the mean of the values of two independent assays.
3.10. Evaluation of the Antioxidant Activity of Compounds in PC Liposomes
The antioxidant activity of phytyl esters and their parental phenolic acids was evaluated in PC soy liposomes LUVs [12], without and with the addition of the free radical initiator AAPH in PBS (final concentration of 0.40 μM). 250 μL of PC soy LUVs (final concentration of 175 μM) was added to UV-Star® 96-well microplate (Greiner Bio-one). Then, 20 μL of DMSO solutions of each phenol (final concentration 0.75 μM) were added to the LUVs, and the resulting mixture was incubated at 37 °C. The increase in conjugated diene concentration was determined by measuring the absorbance of each sample at 234 nm in 5-minute intervals over a 10-hour period, when the radical initiator was added, and every day over a period of 10 days when the radical initiator was not added, using a Powerwave XS Microplate Reader (Bio-Tek Instruments) [15,16]. Microplates were sealed during storage to prevent water evaporation.
α-Tocopherol, a known natural biomembrane AO, was tested as a reference. Results are shown as the time (min or hours) needed for a 0.4% increase in the conjugated diene concentration of each sample. Each compound was tested in triplicate in four independent experiments, with the presence of AAPH, and in triplicate in two independent experiments, without the presence of AAPH.
3.11. Statistical Analysis
Statistical analysis was performed using SPSS 29.0 software. One-way analysis of variance (ANOVA) with Tukey’s test was used, with the level of significance set at p < 0.05.
5. Conclusions
In this study, procedures for the easy preparation of a novel series of phenolipids were developed, yielding phytyl esters of polyphenolic acids in high yields (70-95%). Preliminary characterization of the new compounds showed that these compounds have a similar liposolubility and comparable radical scavenging capacity to that of the natural membrane antioxidant α-tocopherol. Cyclic voltammetry confirmed lower anodic peak potentials for the phytyl esters when compared with the parental phenolic acids and indicate that all phenolic acids exert their activity through an electron transfer mechanism controlled by diffusion, whereas their corresponding esters follow an adsorption-controlled mechanism, of particular interest in lipid-based systems where surface interactions are crucial for protection against oxidative stress. Despite having strong antiradical capacity and of being able to penetrate membranes, the antioxidant efficiency of phytyl esters in liposomal systems was deeply dependent on the structure of the phenolipid polyphenolic moiety. In the PC soy LUVs system tested, PCA-P, DOPAC-P and DHCA-P showed remarkable efficiency in preventing liposome autoxidation when compared to α-tocopherol, while CA-P did not show any improvement in the oxidative stability of LUVs when compared to the control or even with α-tocopherol. Nevertheless, as all the phytyl esters showed at least a similar activity to α-tocopherol, all these molecules can be considered strong candidates for future interventions against oxidative stress in cells and lipoproteins, deserving a proper evaluation of their antioxidant and anti-inflammatory capacity in cell models and in vivo. Furthermore, phytol has itself demonstrated a broad spectrum of bioactivities, including antimicrobial activity, antianxiety, immune-modulating effects and reduces oxidative stress in cell models [18,33,34,35,36] and, therefore, its derivatives are of particular interest in developing treatments for chronic diseases [37,38,39] and antiaging formulations [40]. In conclusion, phytyl phenolipids are promising candidates for antioxidant protection of biomembranes, conferring higher efficiency than the natural antioxidant α-tocopherol.
Author Contributions
Conceptualization, FPM, PG, LSM; methodology, FPM, MC, MF, DG, LSM; validation, FPM, MC and VC.; formal analysis, FPM, RR, VC and DG.; investigation, VC, FA, MC, TB, RR and DG.; resources, FPM, LSM and PG.; data curation, FPM and VC.; writing—FPM, VC, LSM and DG.; writing—review and editing, all authors.; supervision, FPM, PG, MF, DG and LSM; project administration, FPM; funding acquisition, FPM and LSM. All authors have read and agreed to the published version of the manuscript.
Funding
This work received financial support from the PT national funds (FCT/MECI, Fundação para a Ciência e Tecnologia and Ministério da Educação, Ciência e Inovação) through the project UID/50006 -Laboratório Associado para a Química Verde - Tecnologias e Processos Limpos and FEDER (European Fund for Regional Development)-COMPETE-QRENEU through the Chemistry Centre of the University of Minho (Ref. CQ/UM(UID/QUI/00686/2020). MC thanks FCT for the CEEC contract (2023.06595.CEECIND). VC thanks FCT for the doctoral grant (2022.12302.BD). MF thanks FCT and LAQV/REQUIMTE for a post-doc fellowship (REQUIMTE 2019-34).
Conflicts of Interest
The authors declare no conflicts of interest.
References
- Tomlinson, B.; Wu, Q. Y.; Zhong, Y. M.; Li, Y. H. Advances in Dyslipidaemia Treatments: Focusing on ApoC3 and ANGPTL3 Inhibitors. J Lipid Atheroscler 2024, 13(1), 2–20. [Google Scholar] [CrossRef]
- Bilson, J.; Mantovani, A.; Byrne, C. D.; Targher, G. Steatotic liver disease, MASLD and risk of chronic kidney disease. Diabetes Metab 2024, 50(1), 101506. [Google Scholar] [CrossRef] [PubMed]
- Habibullah, M.; Jemmieh, K.; Ouda, A.; Haider, M. Z.; Malki, M. I.; Elzouki, A.-N. Metabolic-associated fatty liver disease: a selective review of pathogenesis, diagnostic approaches, and therapeutic strategies. Frontiers in Medicine 2024, 11. [Google Scholar] [CrossRef] [PubMed]
- Wang, Y.; Fleishman, J. S.; Li, T.; Li, Y.; Ren, Z.; Chen, J.; Ding, M. Pharmacological therapy of metabolic dysfunction-associated steatotic liver disease-driven hepatocellular carcinoma. Frontiers in Pharmacology 2024, 14. [Google Scholar] [CrossRef] [PubMed]
- Filipovic, B.; Marjanovic-Haljilji, M.; Mijac, D.; Lukic, S.; Kapor, S.; Kapor, S.; Starcevic, A.; Popovic, D.; Djokovic, A. Molecular Aspects of MAFLD—New Insights on Pathogenesis and Treatment. Current Issues in Molecular Biology 2023, 45(11), 9132–9148. [Google Scholar] [CrossRef]
- Kasper, P.; Martin, A.; Lang, S.; Kütting, F.; Goeser, T.; Demir, M.; Steffen, H.-M. NAFLD and cardiovascular diseases: a clinical review. Clinical Research in Cardiology 2021, 110(7), 921–937. [Google Scholar] [CrossRef]
- Jia, G.; Bai, H.; Mather, B.; Hill, M. A.; Jia, G.; Sowers, J. R. Diabetic Vasculopathy: Molecular Mechanisms and Clinical Insights. International Journal of Molecular Sciences 2024, 25(2), 804. [Google Scholar] [CrossRef] [PubMed]
- Powell-Wiley, T. M.; Poirier, P.; Burke, L. E.; Després, J.-P.; Gordon-Larsen, P.; Lavie, C. J.; Lear, S. A.; Ndumele, C. E.; Neeland, I. J.; Sanders, P.; St-Onge, M.-P.; On behalf of the American Heart Association Council on, L.; Cardiometabolic, H.; Council on, C.; Stroke, N.; Council on Clinical, C.; Council on, E.; Prevention; Stroke, C. Obesity and Cardiovascular Disease: A Scientific Statement From the American Heart Association. Circulation 2021, 143(21), e984–e1010. [Google Scholar] [CrossRef] [PubMed]
- Toma, L.; Stancu, C. S.; Sima, A. V. Endothelial Dysfunction in Diabetes Is Aggravated by Glycated Lipoproteins; Novel Molecular Therapies. Biomedicines 2021, 9(1), 18. [Google Scholar] [CrossRef]
- Steptoe, A.; Zaninotto, P. Lower socioeconomic status and the acceleration of aging: An outcome-wide analysis. Proc Natl Acad Sci U S A 2020, 117(26), 14911–14917. [Google Scholar] [CrossRef] [PubMed]
- Brewer, M. S. Natural Antioxidants: Sources, Compounds, Mechanisms of Action, and Potential Applications. Comprehensive Reviews in Food Science and Food Safety 2011, 10(4), 221–247. [Google Scholar] [CrossRef]
- Costa, V.; Costa, M.; Arques, F.; Ferreira, M.; Gameiro, P.; Geraldo, D.; Monteiro, L. S.; Paiva-Martins, F. Cholesteryl Phenolipids as Potential Biomembrane Antioxidants. Molecules 2024, 29(20), 4959. [Google Scholar] [CrossRef] [PubMed]
- Chalas, J.; Claise, C.; Edeas, M.; Messaoudi, C.; Vergnes, L.; Abella, A.; Lindenbaum, A. Effect of ethyl esterification of phenolic acids on low-density lipoprotein oxidation. Biomedicine & Pharmacotherapy 2001, 55(1), 54–60. [Google Scholar]
- Katsoura, M. H.; Polydera, A. C.; Tsironis, L. D.; Petraki, M. P.; Rajacić, S. K.; Tselepis, A. D.; Stamatis, H. Efficient enzymatic preparation of hydroxycinnamates in ionic liquids enhances their antioxidant effect on lipoproteins oxidative modification. N Biotechnol 2009, 26(1-2), 83–91. [Google Scholar] [CrossRef]
- Lopes, R.; Costa, M.; Ferreira, M.; Gameiro, P.; Fernandes, S.; Catarino, C.; Santos-Silva, A.; Paiva-Martins, F. Caffeic acid phenolipids in the protection of cell membranes from oxidative injuries. Interaction with the membrane phospholipid bilayer. Biochimica et Biophysica Acta (BBA) - Biomembranes 2021, 1863(12), 183727. [Google Scholar] [CrossRef] [PubMed]
- Lopes, R.; Costa, M.; Ferreira, M.; Gameiro, P.; Paiva-Martins, F. A new family of hydroxytyrosol phenolipids for the antioxidant protection of liposomal systems. Biochim Biophys Acta Biomembr 2021, 1863(2), 183505. [Google Scholar] [CrossRef] [PubMed]
- Rabiej-Kozioł, D.; Roszek, K.; Krzemiński, M. P.; Szydłowska-Czerniak, A. Phenolipids as new food additives: from synthesis to cell-based biological activities. Food Addit Contam Part A Chem Anal Control Expo Risk Assess 2022, 39(8), 1365–1379. [Google Scholar] [CrossRef] [PubMed]
- Islam, M. T.; Ali, E. S.; Uddin, S. J.; Shaw, S.; Islam, M. A.; Ahmed, M. I.; Chandra Shill, M.; Karmakar, U. K.; Yarla, N. S.; Khan, I. N.; Billah, M. M.; Pieczynska, M. D.; Zengin, G.; Malainer, C.; Nicoletti, F.; Gulei, D.; Berindan-Neagoe, I.; Apostolov, A.; Banach, M.; Yeung, A. W. K.; El-Demerdash, A.; Xiao, J.; Dey, P.; Yele, S.; Jóźwik, A.; Strzałkowska, N.; Marchewka, J.; Rengasamy, K. R. R.; Horbańczuk, J.; Kamal, M. A.; Mubarak, M. S.; Mishra, S. K.; Shilpi, J. A.; Atanasov, A. G. Phytol: A review of biomedical activities. Food and Chemical Toxicology 2018, 121, 82–94. [Google Scholar] [CrossRef] [PubMed]
- Singh, S. P.; Sashidhara, K. V. Lipid lowering agents of natural origin: An account of some promising chemotypes. European Journal of Medicinal Chemistry 2017, 140, 331–348. [Google Scholar] [CrossRef] [PubMed]
- Condo, A. M.; Baker, D. C.; Moreau, R. A.; Hicks, K. B. Improved Method for the Synthesis of trans-Feruloyl-β-sitostanol. Journal of Agricultural and Food Chemistry 2001, 49(10), 4961–4964. [Google Scholar] [CrossRef] [PubMed]
- Winkler-Moser, J. K.; Hwang, H.-S.; Bakota, E. L.; Palmquist, D. A. Synthesis of steryl ferulates with various sterol structures and comparison of their antioxidant activity. Food Chemistry 2015, 169, 92–101. [Google Scholar] [CrossRef] [PubMed]
- Tan, Z.; Shahidi, F. Chemoenzymatic Synthesis of Phytosteryl Ferulates and Evaluation of Their Antioxidant Activity. Journal of Agricultural and Food Chemistry 2011, 59(23), 12375–12383. [Google Scholar] [CrossRef]
- Costa, M.; Losada-Barreiro, S.; Paiva-Martins, F.; Bravo-Díaz, C.; Romsted, L. S. A direct correlation between the antioxidant efficiencies of caffeic acid and its alkyl esters and their concentrations in the interfacial region of olive oil emulsions. The pseudophase model interpretation of the "cut-off" effect. Food Chem 2015, 175, 233-42.
- Almeida, J.; Losada-Barreiro, S.; Costa, M.; Paiva-Martins, F.; Bravo-Díaz, C.; Romsted, L. S. Interfacial Concentrations of Hydroxytyrosol and Its Lipophilic Esters in Intact Olive Oil-in-Water Emulsions: Effects of Antioxidant Hydrophobicity, Surfactant Concentration, and the Oil-to-Water Ratio on the Oxidative Stability of the Emulsions. J Agric Food Chem 2016, 64(25), 5274–83. [Google Scholar] [CrossRef] [PubMed]
- Pletcher, D.; Greff, R.; Peat, R.; Peter, L. M.; Robinson, J. In Instrumental Methods in Electrochemistry, Pletcher, D.; Greff, R.; Peat, R.; Peter, L. M.; Robinson, J., Eds. Woodhead Publishing: 2010; pp 15-41.
- Kaiser, R. D.; London, E. Determination of the depth of BODIPY probes in model membranes by parallax analysis of fluorescence quenching. Biochimica et Biophysica Acta (BBA) - Biomembranes 1998, 1375 (1), 13-22.
- Terao, J.; Piskula, M.; Yao, Q. Protective Effect of Epicatechin, Epicatechin Gallate, and Quercetin on Lipid Peroxidation in Phospholipid Bilayers. Archives of Biochemistry and Biophysics 1994, 308(1), 278–284. [Google Scholar] [CrossRef]
- Losada-Barreiro, S.; Paiva-Martins, F.; Bravo-Díaz, C. Analysis of the Efficiency of Antioxidants in Inhibiting Lipid Oxidation in Terms of Characteristic Kinetic Parameters. Antioxidants 2024, 13(5), 593. [Google Scholar] [CrossRef] [PubMed]
- Paiva-Martins, F.; Gordon, M. Effects of pH and ferric ions on the antioxidant activity of olive polyphenols in oil-in-water emulsions. JAOCS, Journal of the American Oil Chemists' Society 2002, 79, 571-576.
- Paiva-Martins, F.; Gordon, M. H. Interactions of ferric ions with olive oil phenolic compounds. J Agric Food Chem 2005, 53(7), 2704–9. [Google Scholar] [CrossRef] [PubMed]
- Rodrigues, C.; Gameiro, P.; Prieto, M.; de Castro, B. Interaction of rifampicin and isoniazid with large unilamellar liposomes: spectroscopic location studies. Biochimica et Biophysica Acta (BBA) - General Subjects 2003, 1620 (1), 151-159.
- Lakowicz, J. R. Fluorescence Anisotropy. In Principles of Fluorescence Spectroscopy Springer, Ed. Boston, MA, USA, 2006; pp 353-382.
- Silva, R. O.; Sousa, F. B.; Damasceno, S. R.; Carvalho, N. S.; Silva, V. G.; Oliveira, F. R.; Sousa, D. P.; Aragão, K. S.; Barbosa, A. L.; Freitas, R. M.; Medeiros, J. V. Phytol, a diterpene alcohol, inhibits the inflammatory response by reducing cytokine production and oxidative stress. Fundam Clin Pharmacol 2014, 28(4), 455–64. [Google Scholar] [CrossRef] [PubMed]
- Santos, C. C.; Salvadori, M. S.; Mota, V. G.; Costa, L. M.; de Almeida, A. A.; de Oliveira, G. A.; Costa, J. P.; de Sousa, D. P.; de Freitas, R. M.; de Almeida, R. N. Antinociceptive and Antioxidant Activities of Phytol In Vivo and In Vitro Models. Neurosci J 2013, 2013, 949452. [Google Scholar] [CrossRef] [PubMed]
- Jéssica, P. C.; Md, T. I.; Pauline, S. S.; Paula, B. F.; George, L. S. O.; Marcus, V. O. B. A.; Marcia, F. C. J. P.; Éverton, L. F. F.; Chistiane, M. F.; Antonia, M. G. L. C.; Damião, P. S.; Ana Amelia, C. M.-C. Evaluation of Antioxidant Activity of Phytol Using Non- and Pre-Clinical Models. Current Pharmaceutical Biotechnology 2016, 17(14), 1278–1284. [Google Scholar]
- Islam, M. T.; Ayatollahi, S. A.; Zihad, S.; Sifat, N.; Khan, M. R.; Paul, A.; Salehi, B.; Islam, T.; Mubarak, M. S.; Martins, N.; Sharifi-Rad, J. Phytol anti-inflammatory activity: Pre-clinical assessment and possible mechanism of action elucidation. Cell Mol Biol (Noisy-le-grand) 2020, 66 (4), 264-269.
- de Alencar, M. V. O. B.; Islam, M. T.; da Mata, A. M. O. F.; dos Reis, A. C.; de Lima, R. M. T.; de Oliveira Ferreira, J. R.; de Castro e Sousa, J. M.; Ferreira, P. M. P.; de Carvalho Melo-Cavalcante, A. A.; Rauf, A.; Hemeg, H. A.; Alsharif, K. F.; Khan, H. Anticancer effects of phytol against Sarcoma (S-180) and Human Leukemic (HL-60) cancer cells. Environmental Science and Pollution Research 2023, 30(33), 80996–81007. [Google Scholar] [CrossRef]
- Bobe, G.; Zhang, Z.; Kopp, R.; Garzotto, M.; Shannon, J.; Takata, Y. Phytol and its metabolites phytanic and pristanic acids for risk of cancer: current evidence and future directions. Eur J Cancer Prev 2020, 29(2), 191–200. [Google Scholar] [CrossRef]
- Wang, J.; Hu, X.; Ai, W.; Zhang, F.; Yang, K.; Wang, L.; Zhu, X.; Gao, P.; Shu, G.; Jiang, Q.; Wang, S. Phytol increases adipocyte number and glucose tolerance through activation of PI3K/Akt signaling pathway in mice fed high-fat and high-fructose diet. Biochemical and Biophysical Research Communications 2017, 489(4), 432–438. [Google Scholar] [CrossRef]
- Papaccio, F.; D′Arino, A.; Caputo, S.; Bellei, B. Focus on the Contribution of Oxidative Stress in Skin Aging. Antioxidants 2022, 11(6), 1121. [Google Scholar] [CrossRef] [PubMed]
Figure 1.
Synthetised phytol-derived phenolipids.
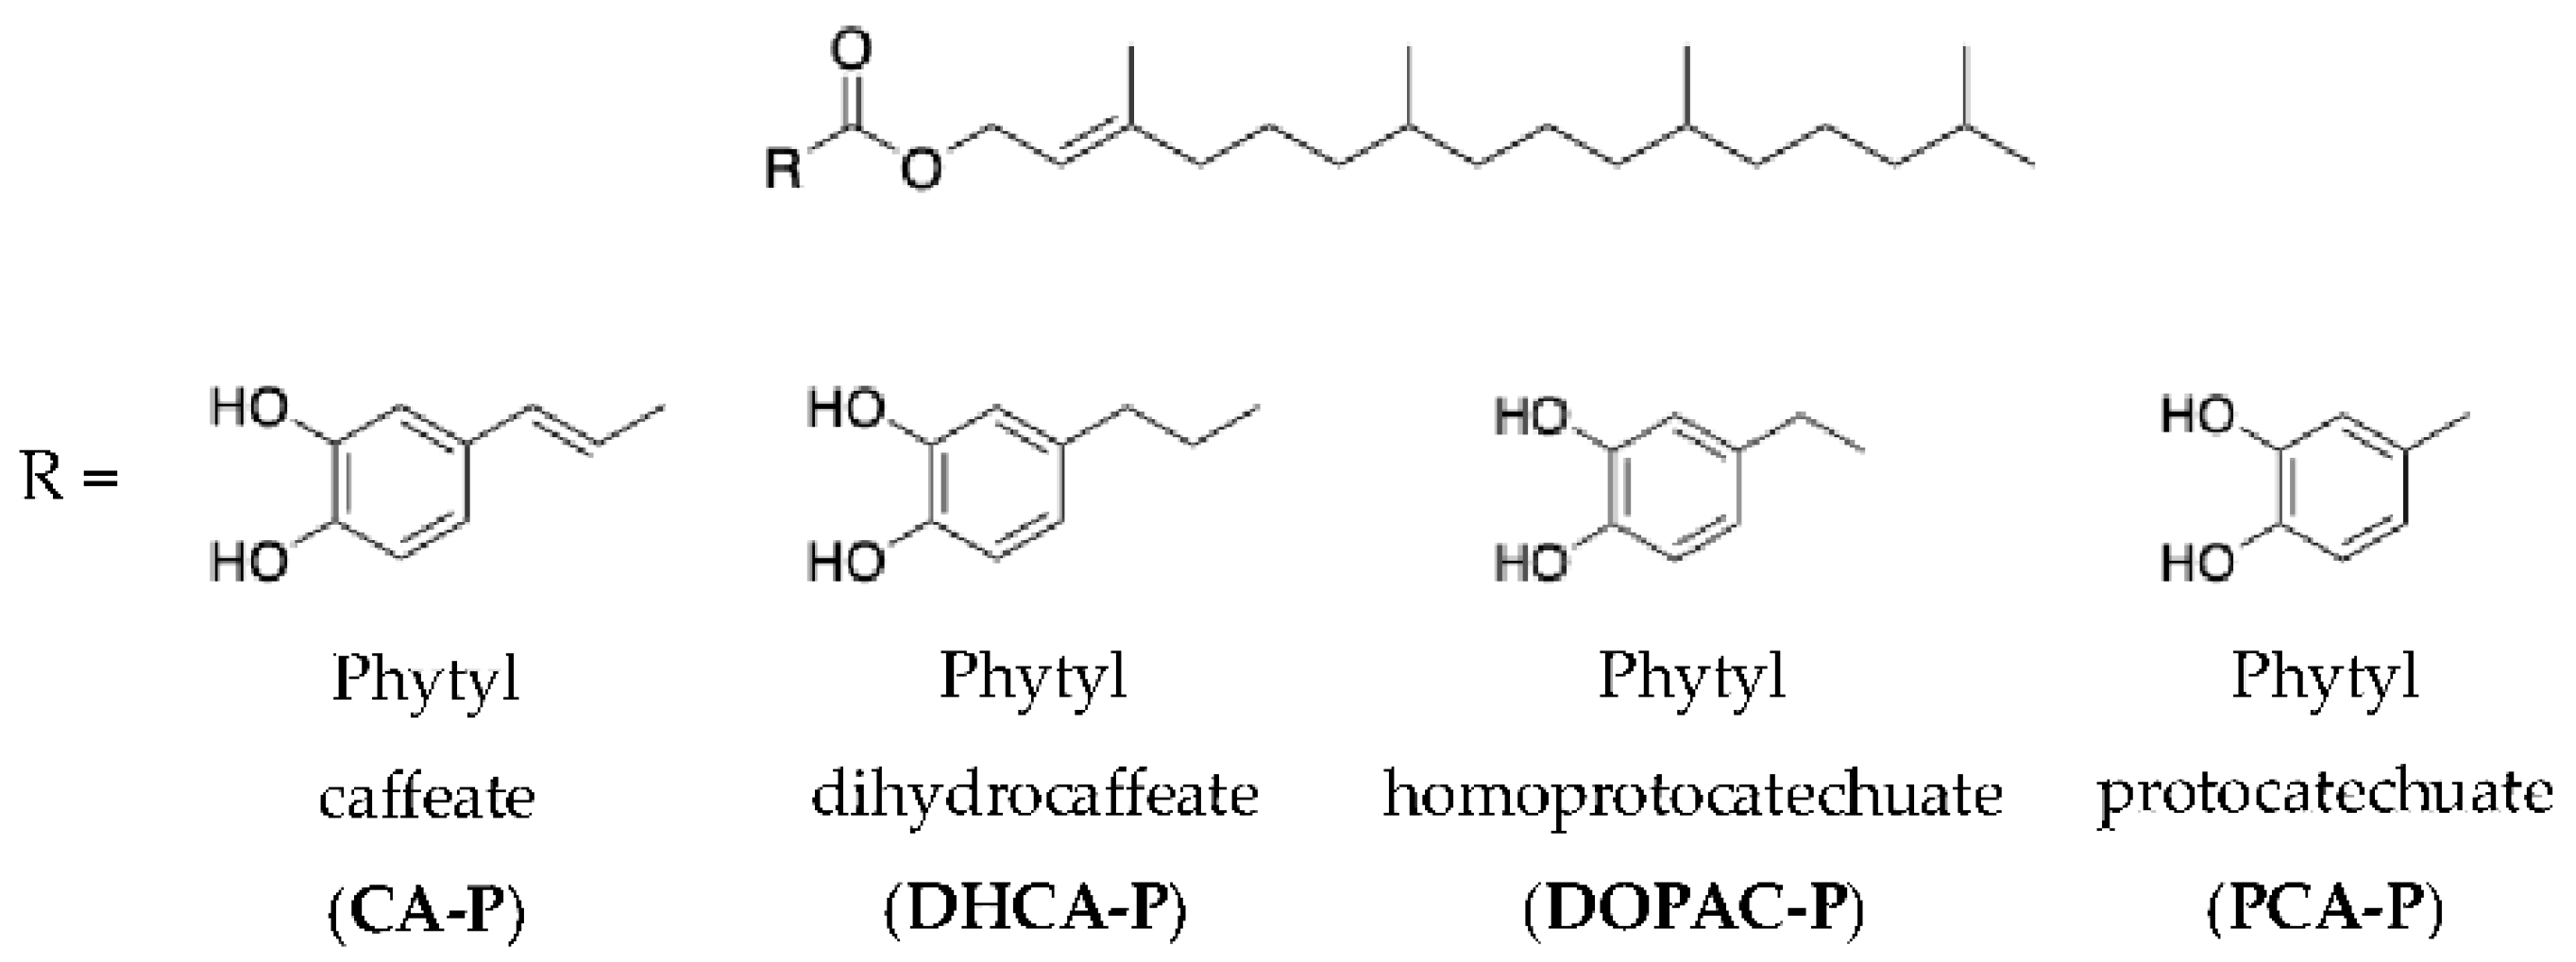
Figure 2.
Comparison of the voltammetric response of phenolic acids (solid lines) and their corresponding phytyl esters (dashed line). Cyclic voltammograms obtained in phosphate buffer (pH 7.4) using a glassy carbon electrode (GCE) at 100 mV/s for 1 mM of compound. .
Figure 2.
Comparison of the voltammetric response of phenolic acids (solid lines) and their corresponding phytyl esters (dashed line). Cyclic voltammograms obtained in phosphate buffer (pH 7.4) using a glassy carbon electrode (GCE) at 100 mV/s for 1 mM of compound. .
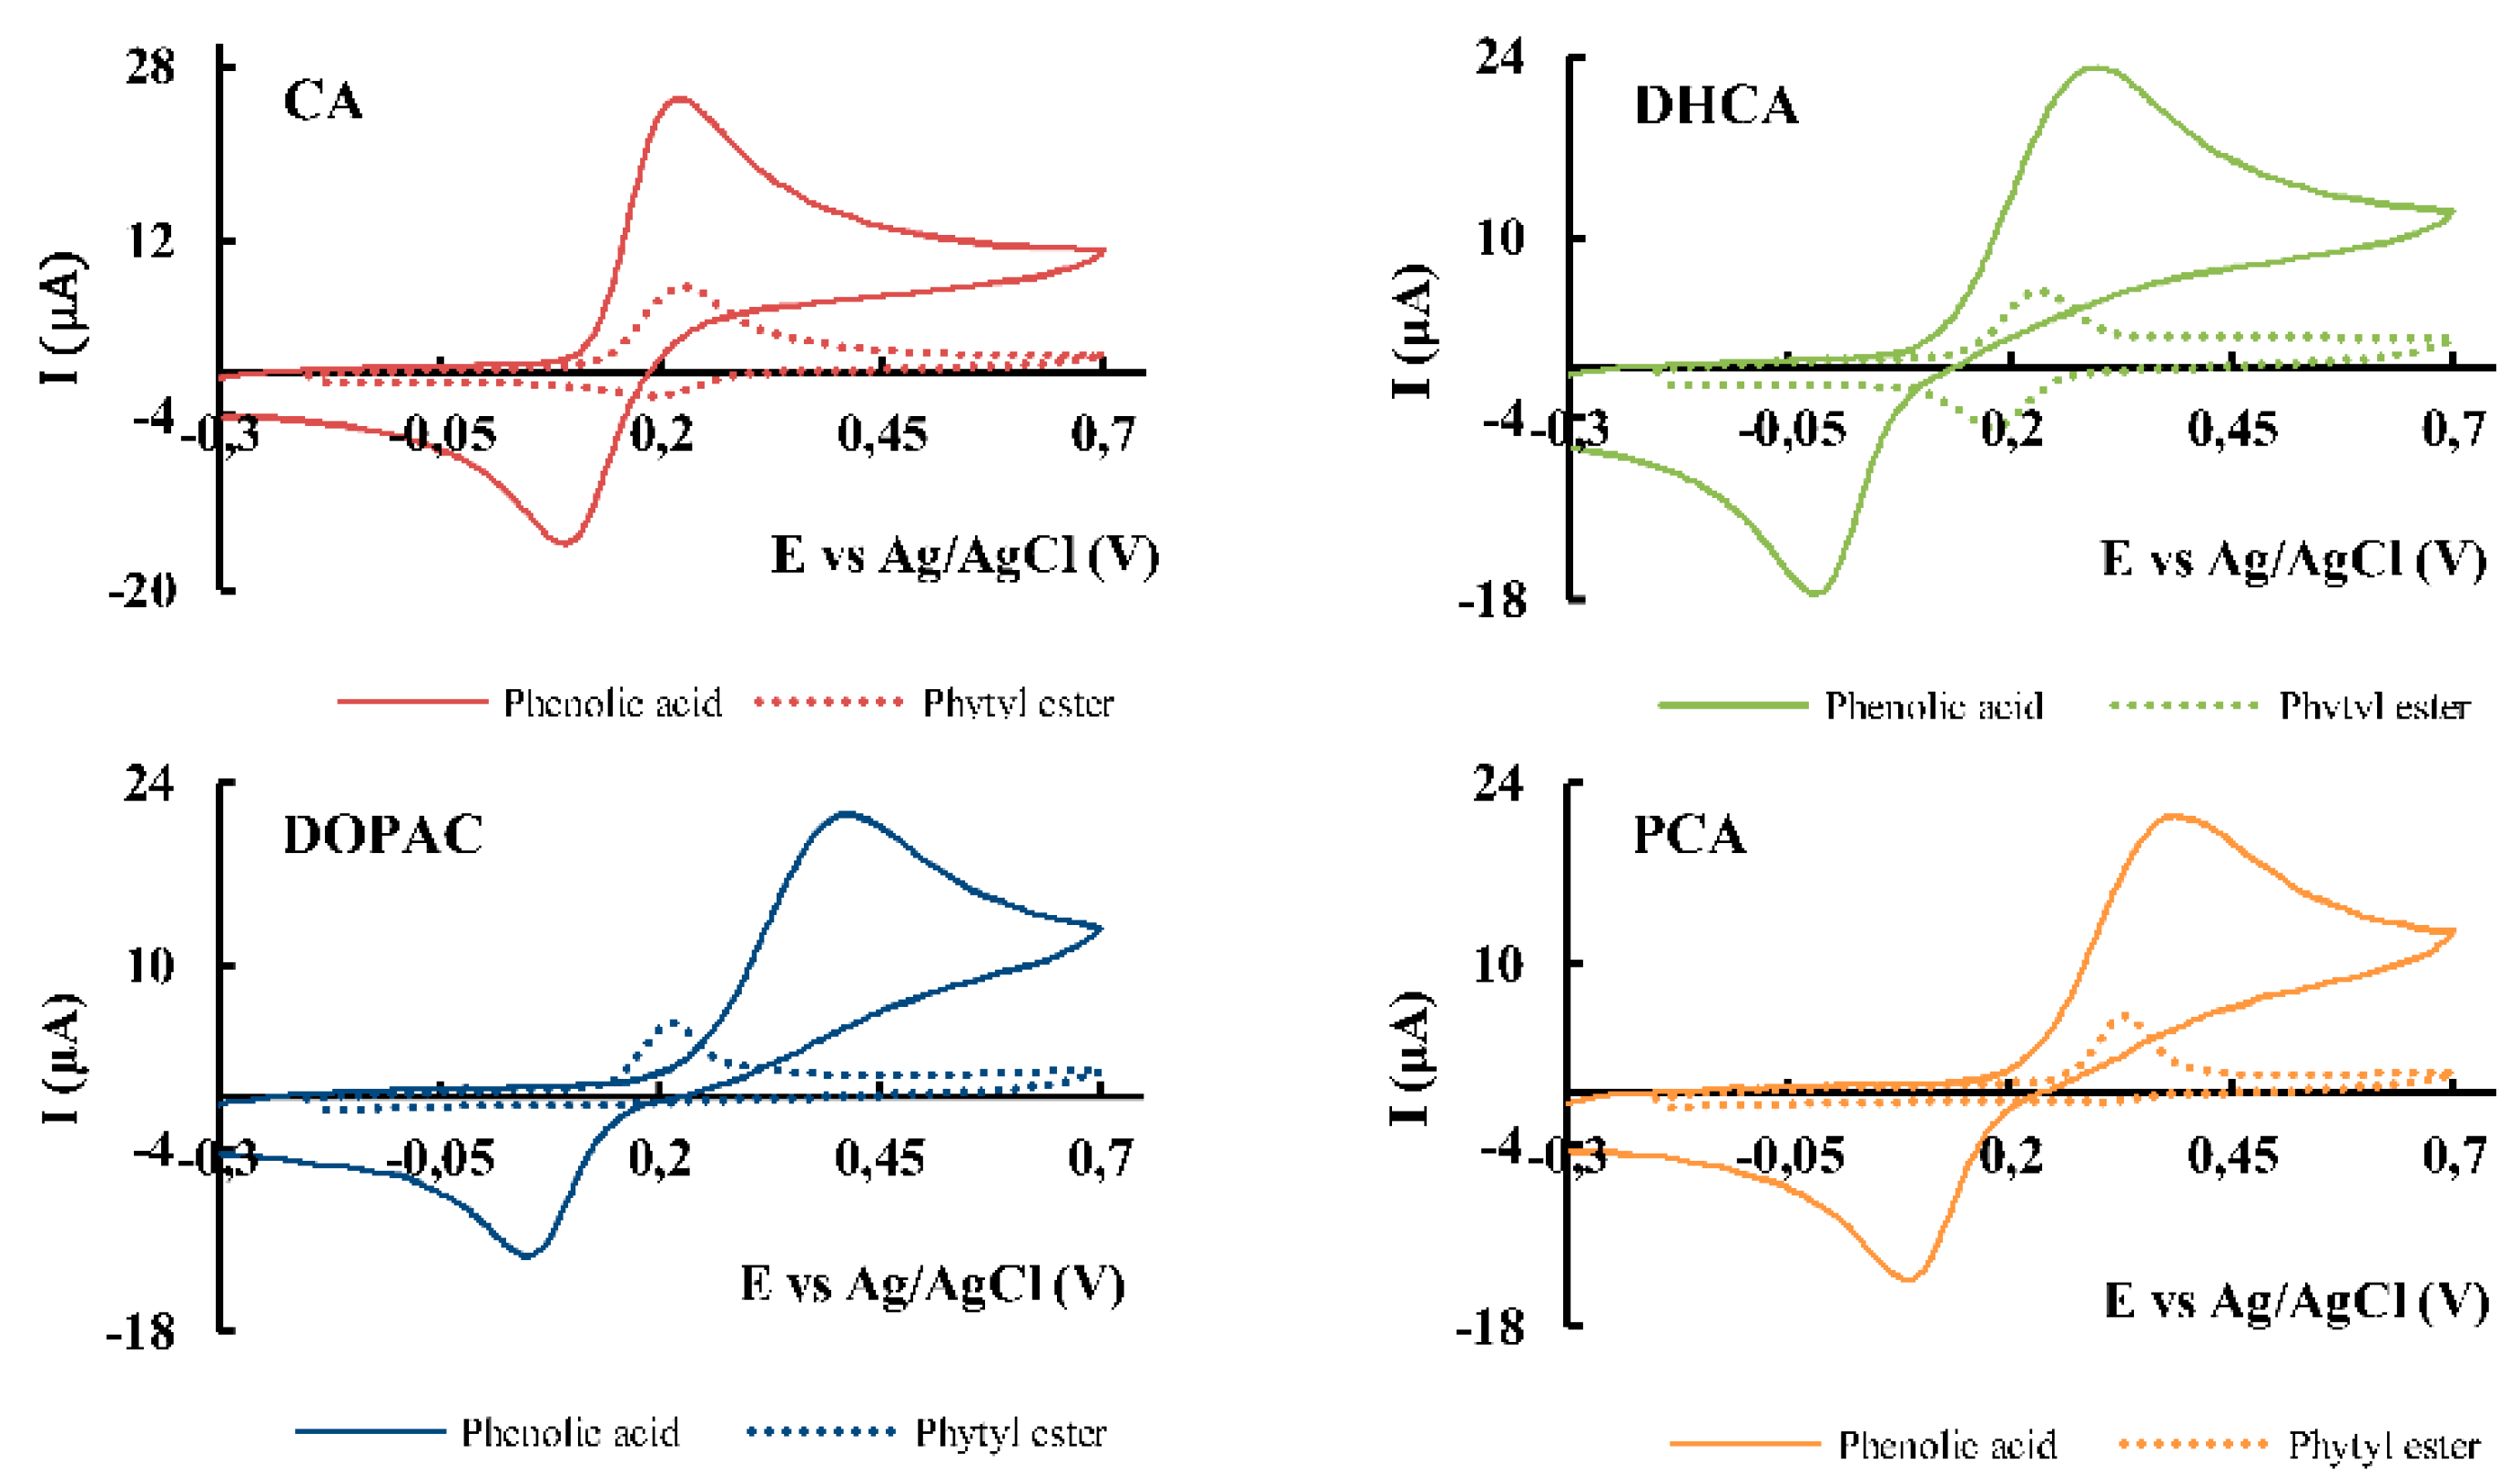
Figure 3.
Overlay of cyclic voltammograms at different scan rates: 5, 10, 20, 50, 100, 200, 400, 600 and 800 mV/s obtained in a phosphate buffer (pH 7.4) using a GCE for: (A) 1 mM of CA; inset: Ipa vs v1/2. (B) 1 mM of CA-P; inset: Ipa vs v.
Figure 3.
Overlay of cyclic voltammograms at different scan rates: 5, 10, 20, 50, 100, 200, 400, 600 and 800 mV/s obtained in a phosphate buffer (pH 7.4) using a GCE for: (A) 1 mM of CA; inset: Ipa vs v1/2. (B) 1 mM of CA-P; inset: Ipa vs v.
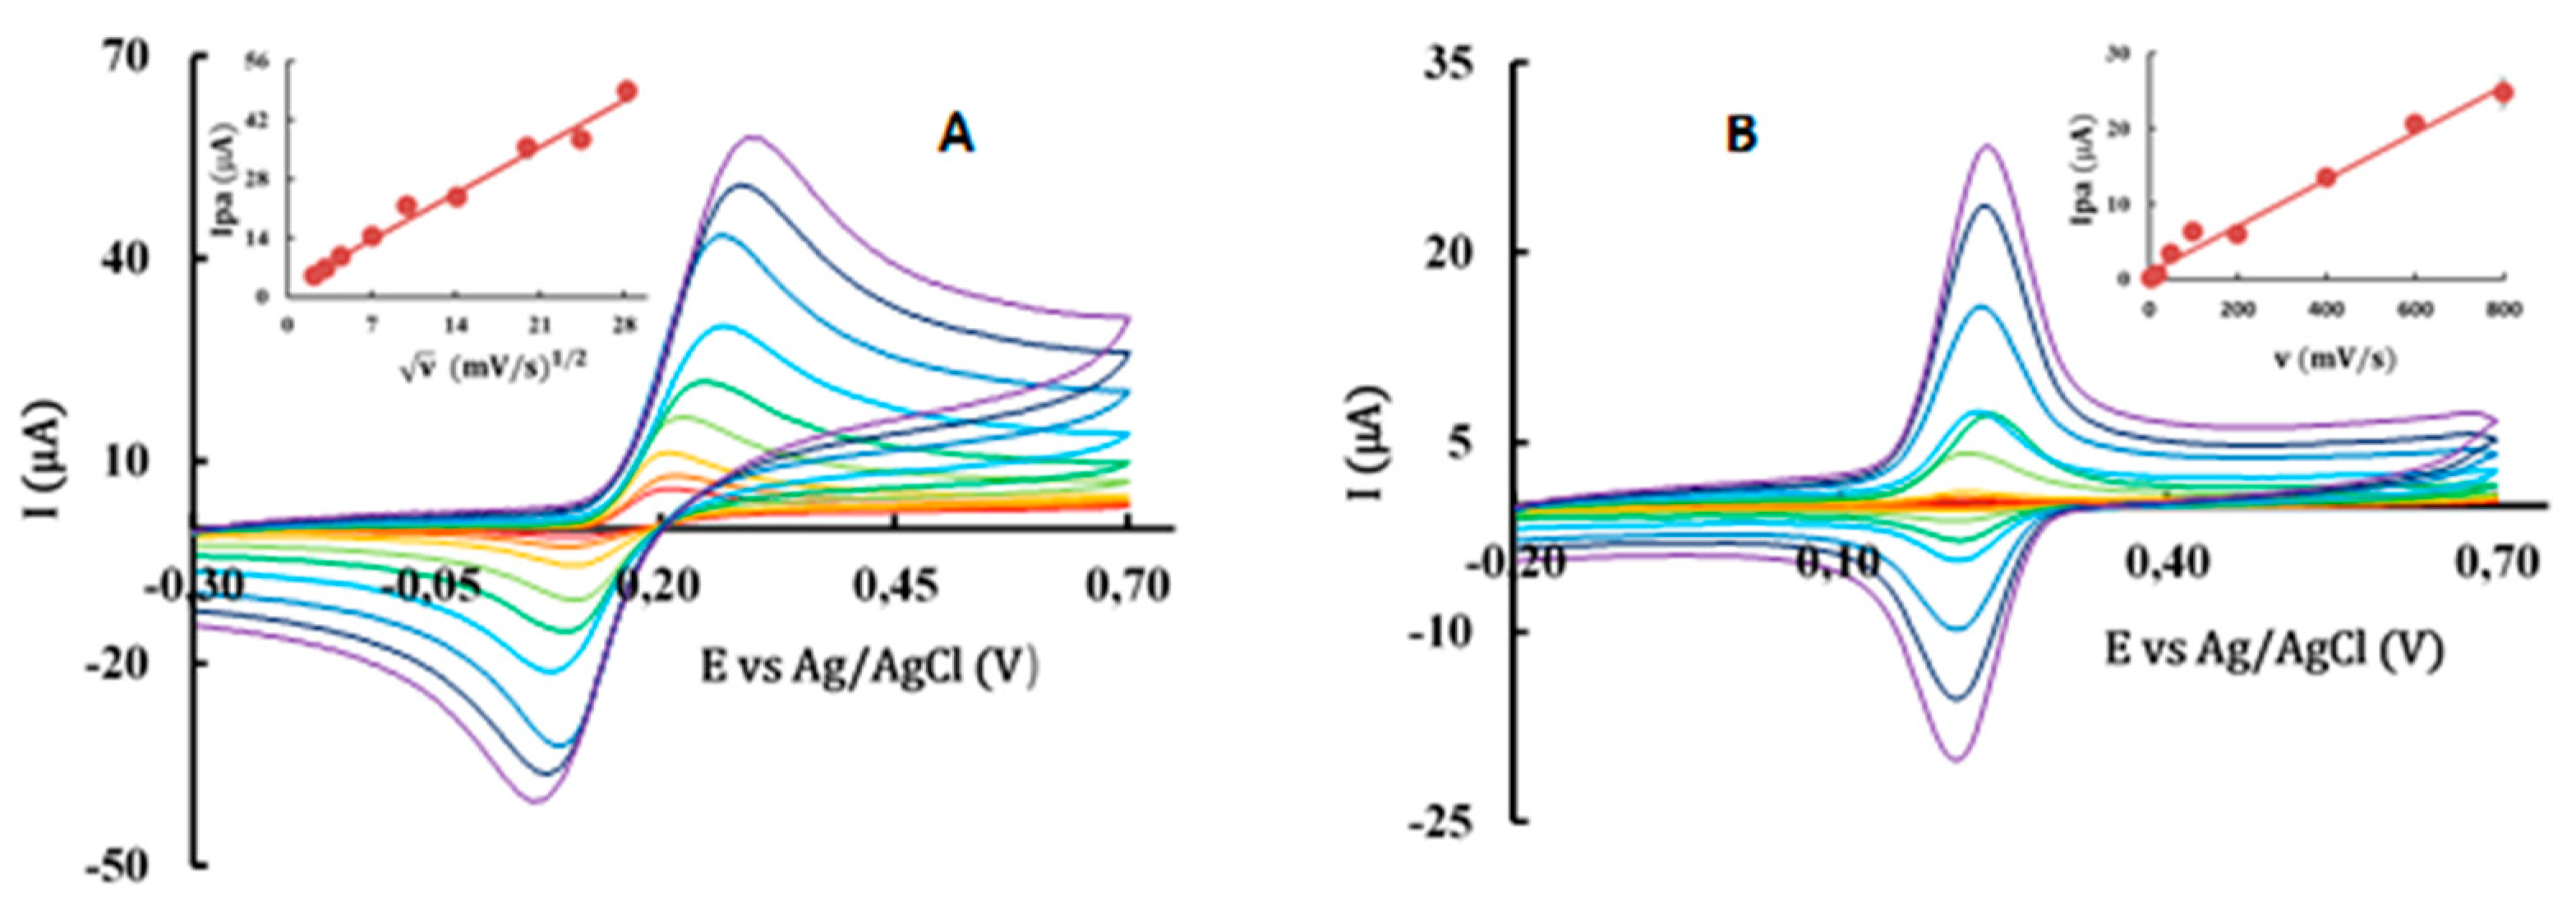
Figure 4.
Quenching effect of AOs on 2-AS, TMA-DPH and DPH probe emission intensity, using DMPC liposomes. Error bars represent standard deviation. Different letters for each probe represent statistically different means, p < 0.05.
Figure 4.
Quenching effect of AOs on 2-AS, TMA-DPH and DPH probe emission intensity, using DMPC liposomes. Error bars represent standard deviation. Different letters for each probe represent statistically different means, p < 0.05.
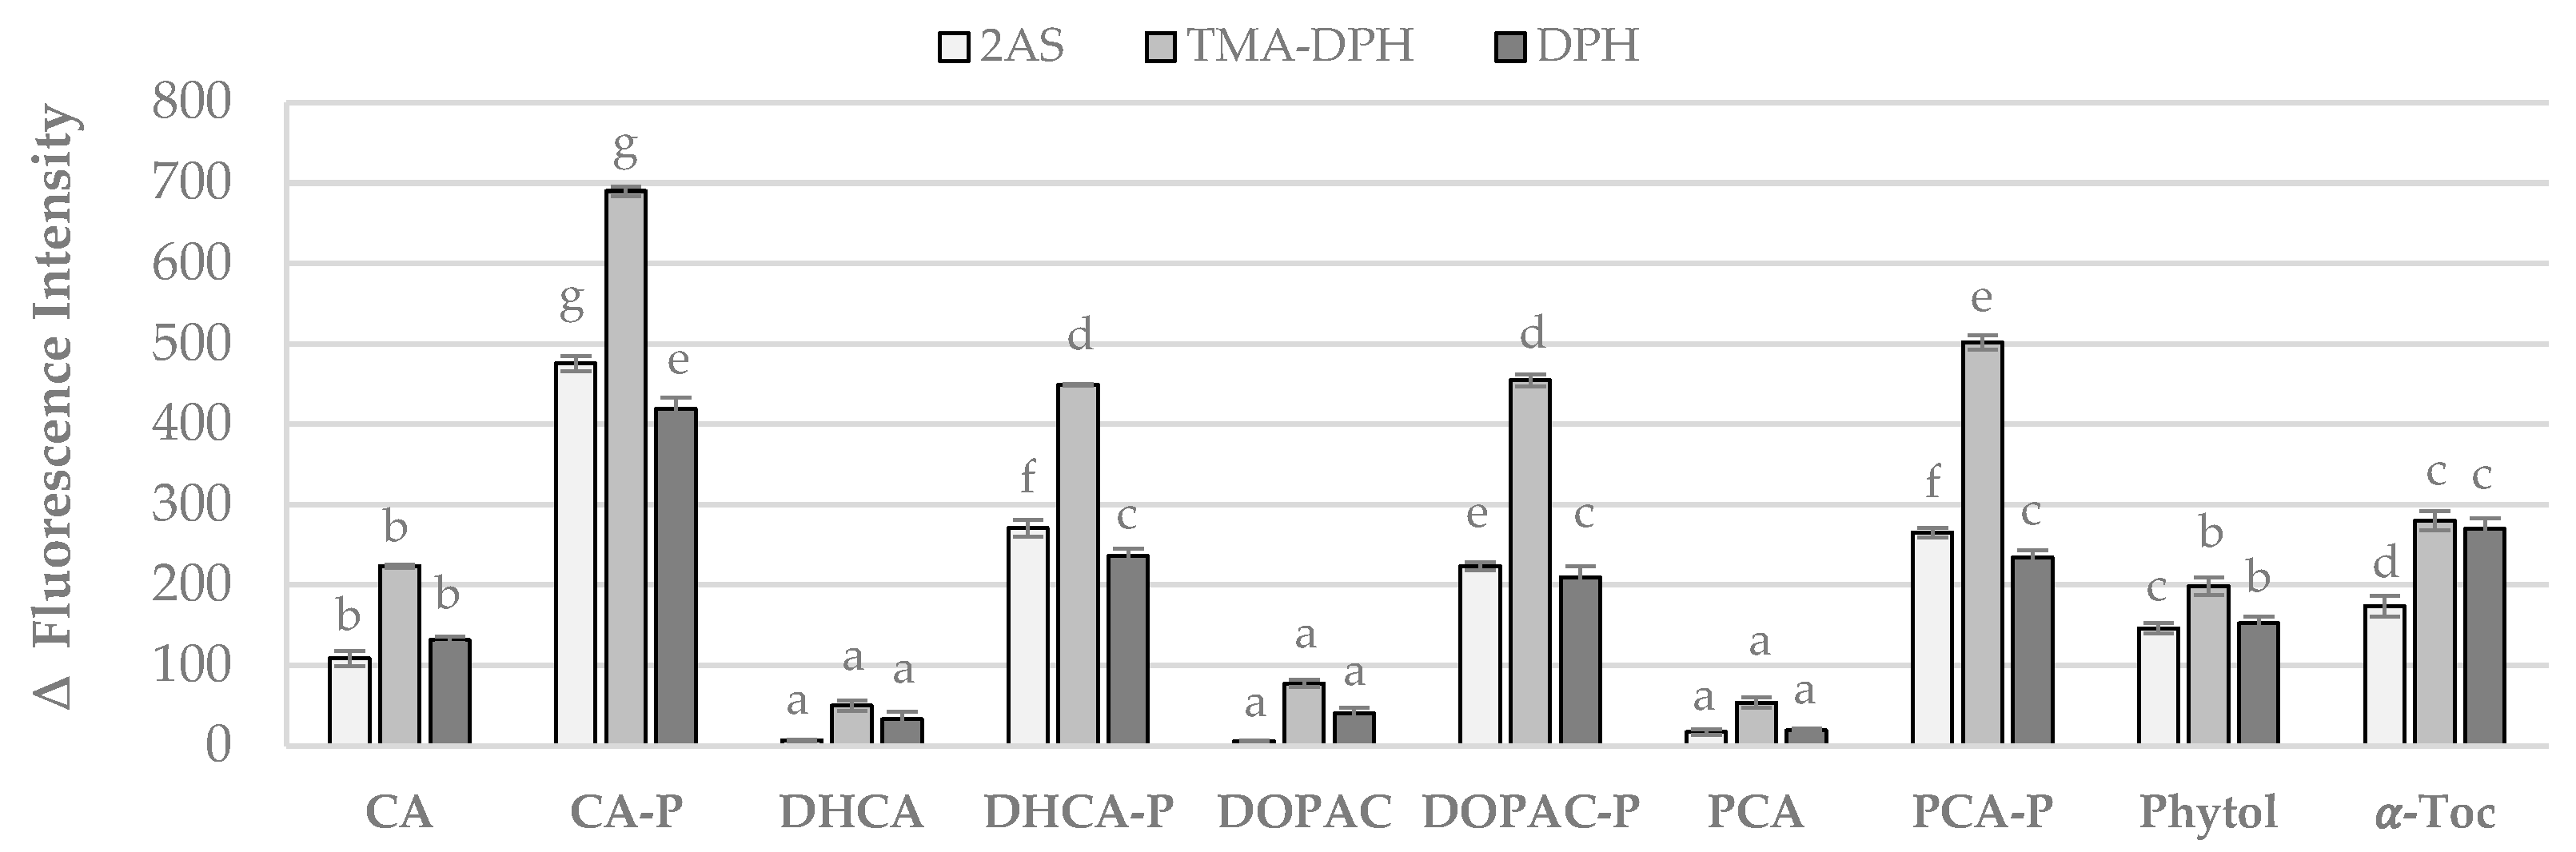
Figure 5.
Representative arrangement of phytyl esters embedded in the phosphatidylcholine membrane monolayer.
Figure 5.
Representative arrangement of phytyl esters embedded in the phosphatidylcholine membrane monolayer.
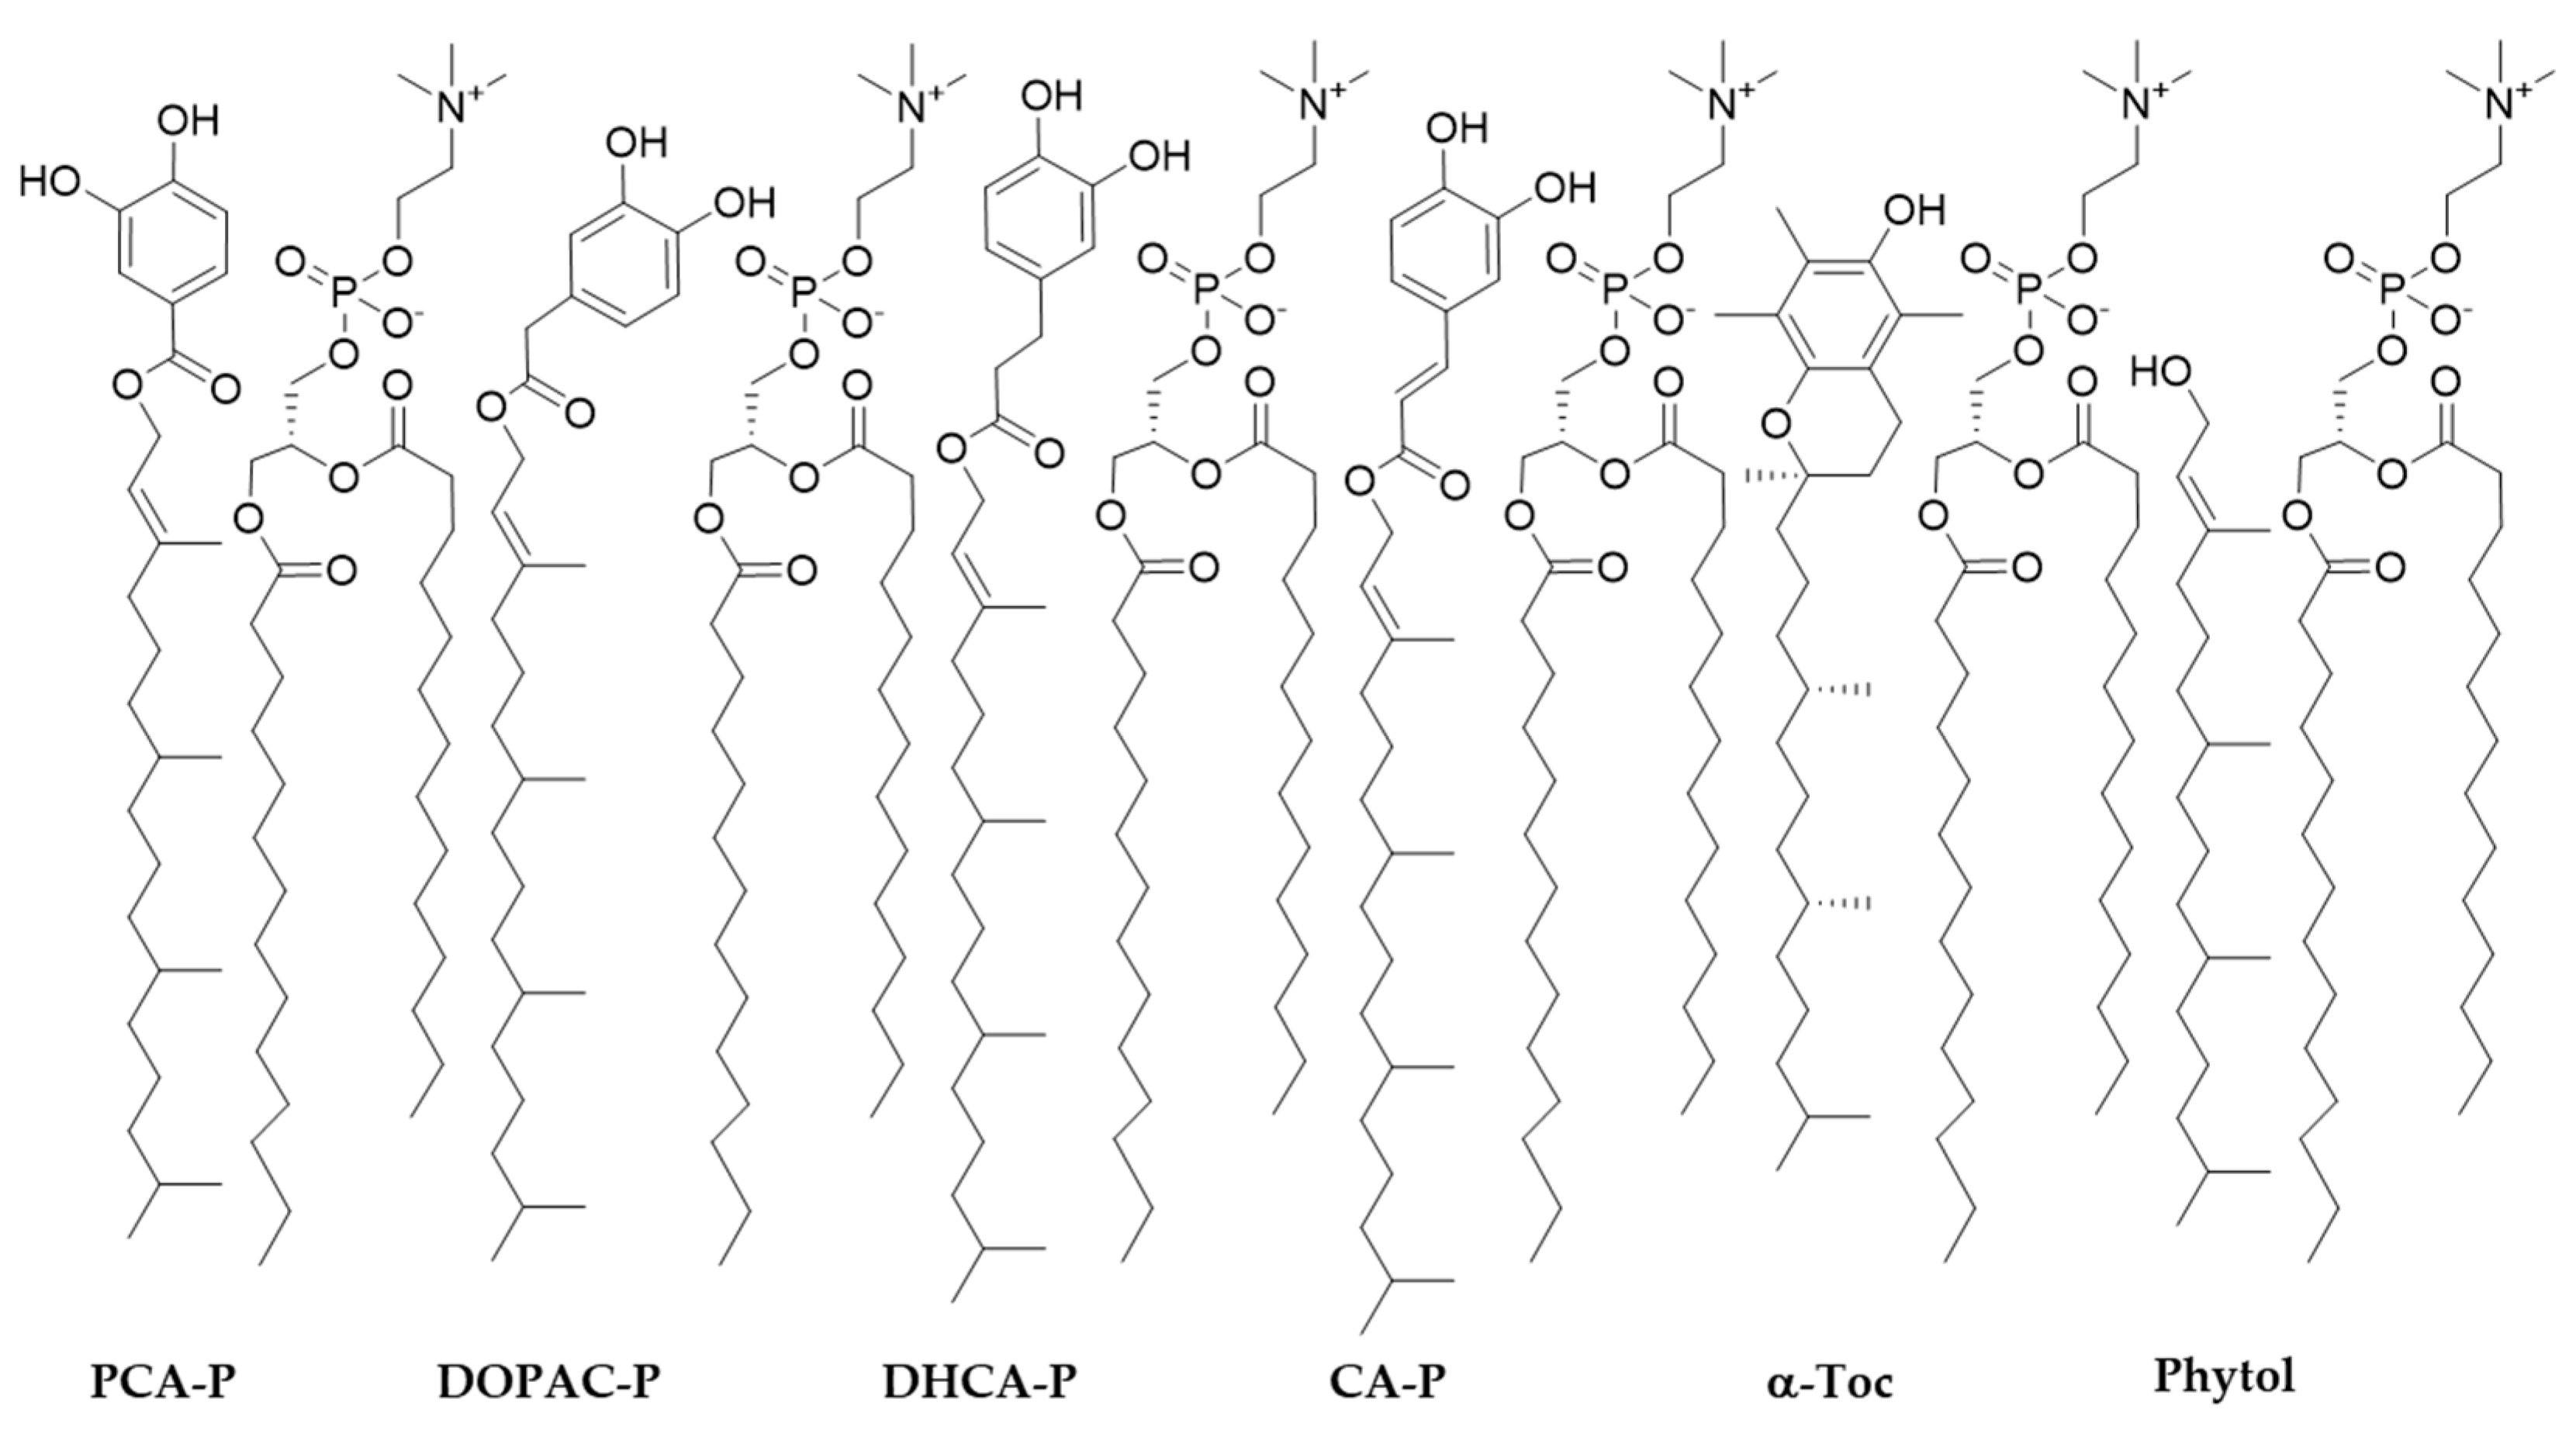
Figure 6.
Increase in the steady-state anisotropy of probes TMA-DPH and DPH in DMPC liposomes. Error bars represent standard deviation. Different letters for each probe represent statistically different means, p < 0.05.
Figure 6.
Increase in the steady-state anisotropy of probes TMA-DPH and DPH in DMPC liposomes. Error bars represent standard deviation. Different letters for each probe represent statistically different means, p < 0.05.

Figure 7.
Time in minutes required for liposomes incubated at 37ºC with AOs at 0.75 μM in the presence of AAPH to reach a conjugated diene (CD) content of 0.4%. Error bars represent standard deviation. Different letters represent statistically different means, p < 0.05.
Figure 7.
Time in minutes required for liposomes incubated at 37ºC with AOs at 0.75 μM in the presence of AAPH to reach a conjugated diene (CD) content of 0.4%. Error bars represent standard deviation. Different letters represent statistically different means, p < 0.05.
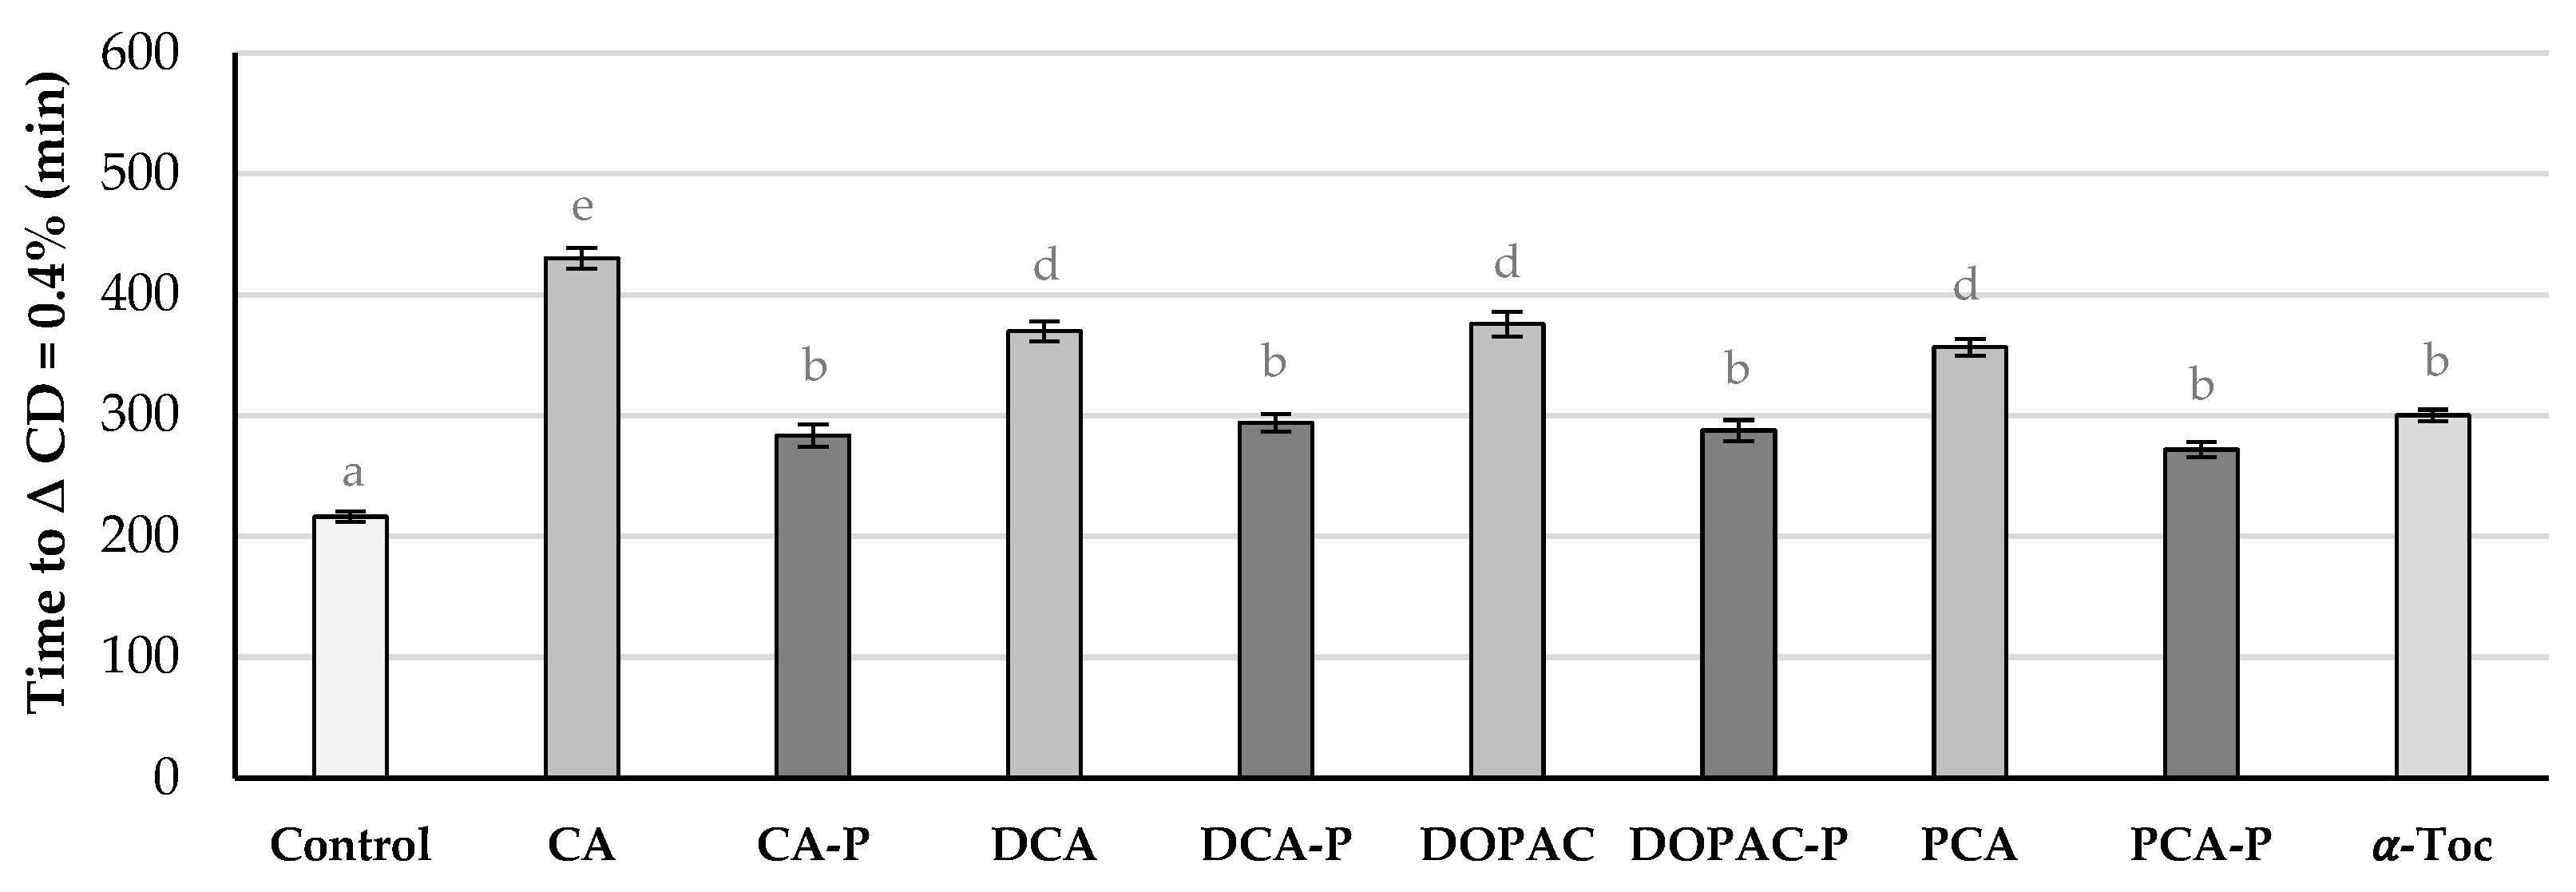
Figure 8.
Time in days required for liposomes incubated at 37 ºC with AOs at 0.75 μM to reach a conjugated diene (CD) content of 0.4%. Error bars represent standard deviation. Different letters represent statistically different means, p < 0.05.
Figure 8.
Time in days required for liposomes incubated at 37 ºC with AOs at 0.75 μM to reach a conjugated diene (CD) content of 0.4%. Error bars represent standard deviation. Different letters represent statistically different means, p < 0.05.
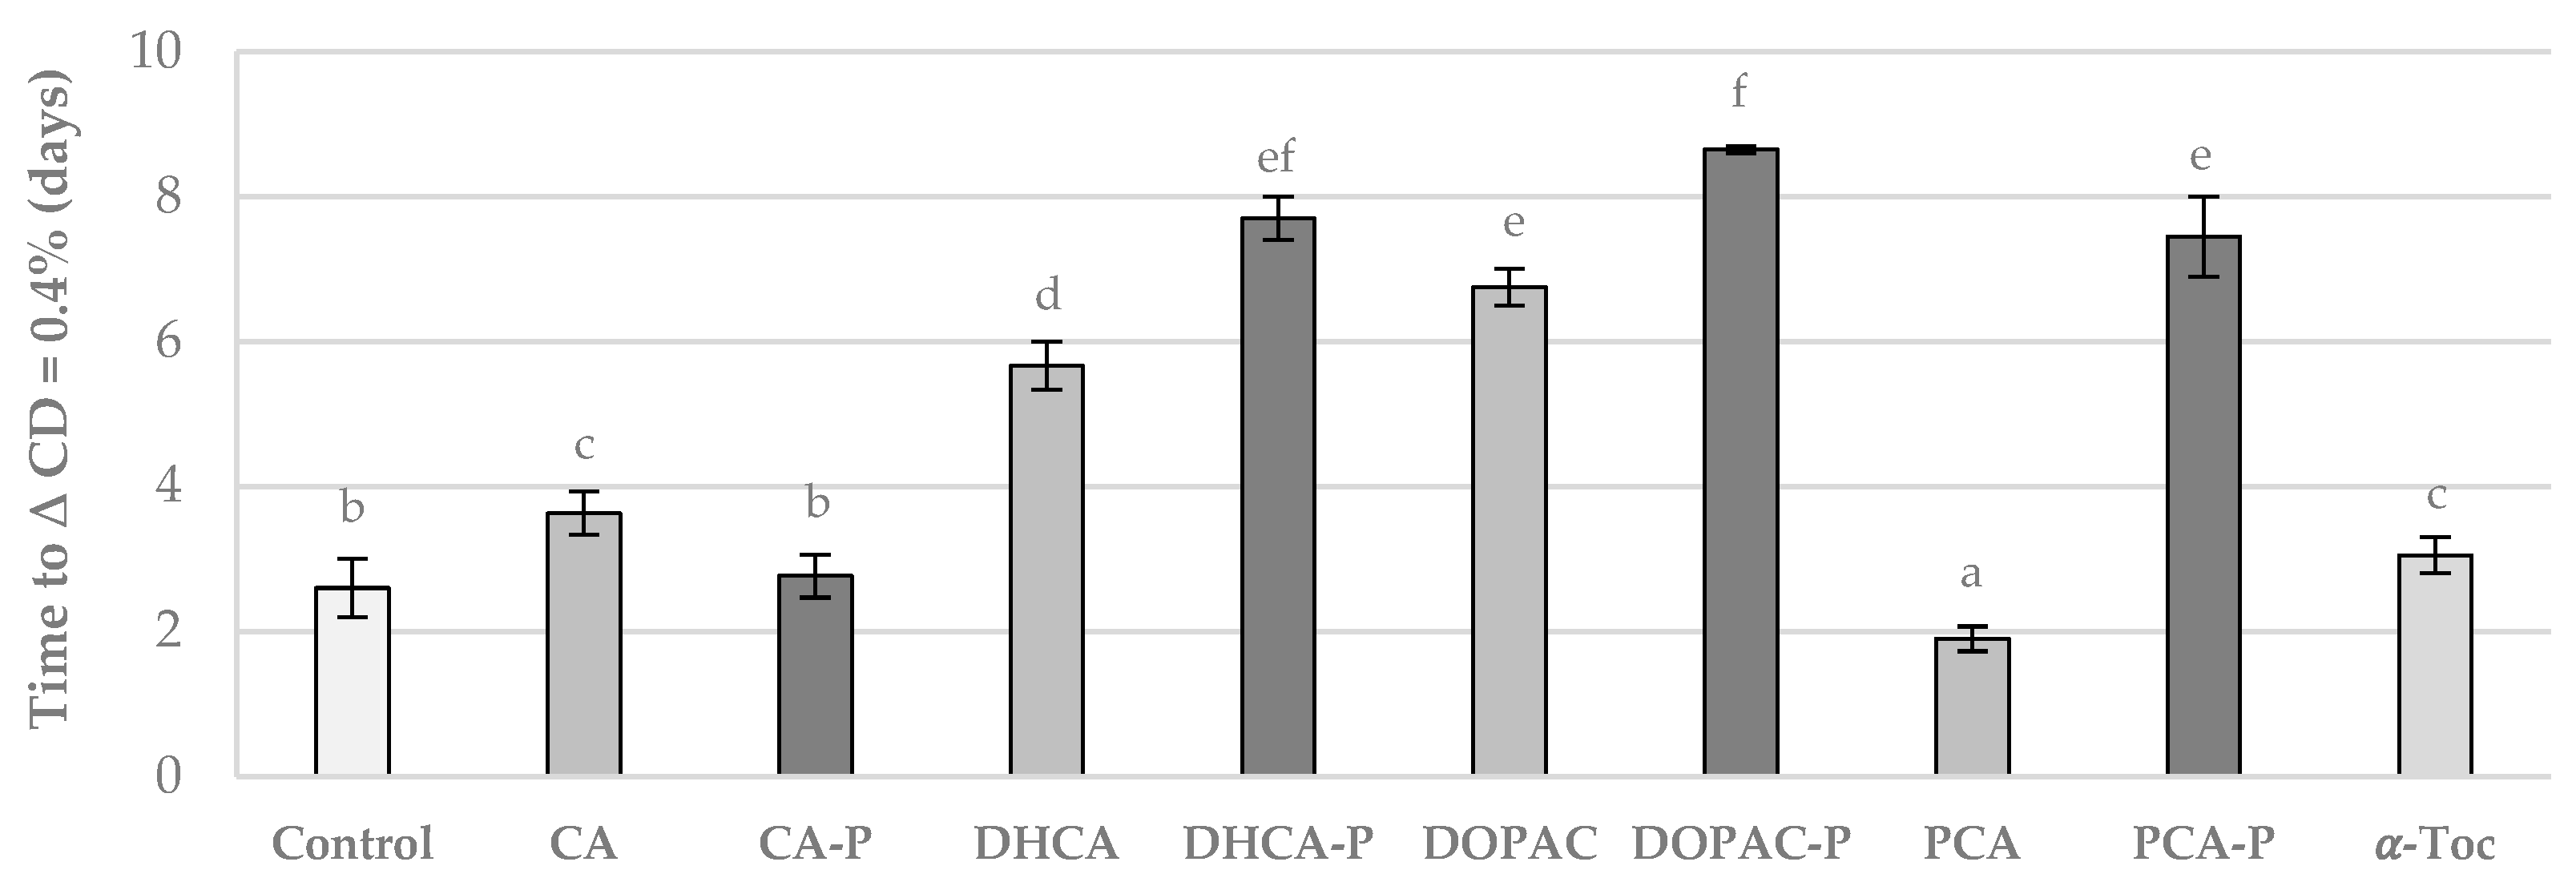

Table 1.
Yields obtained for the synthesis of phytol esters through acid and enzymatic catalysis using different organic solvents. The values were obtained through HPLC analysis (NR – no reaction).
Table 1.
Yields obtained for the synthesis of phytol esters through acid and enzymatic catalysis using different organic solvents. The values were obtained through HPLC analysis (NR – no reaction).
| Compound | Acid Catalysis | Enzymatic Catalysis | |||||
| Toluene | THF | Toluene | Dioxane | DCM | THF | ||
| DCA-P | NR | 17% | 95% | 50% | NR | NR | |
| DOPAC-P | NR | 56% | 46% | 83% | NR | NR | |
| PCA-P | NR | NR | 18% | 0% | NR | NR | |
Table 2.
EC50 (mol compound/mol DPPH●) and miLog P values*.
| Compound | miLog P | EC50** | Compound | miLog P | EC50** | ||
| 5 min | 30 min | 5 min | 30 min | ||||
| Phytol | 6.76 | - | - | α-Toc | 9.04 | 0.33 | 0.29 |
| PCA | 0.86 | 0.22 | 0.19 | PCA-P | 8.20 | 0.19 | 0.14 |
| DOPAC | 0.39 | 0.13 | 0.13 | DOPAC-P | 8.09 | 0.21 | 0.18 |
| DHCA | 0.91 | 0.19 | 0.13 | DHCA-P | 8.26 | 0.29 | 0.29 |
| CA | 0.94 | 0.23 | 0.21 | CA-P | 8.49 | 0.23 | 0.22 |
* Data obtained from Molinspiration Cheminformatics ** Standard deviations were lower than 5% .
Table 3.
Anodic peak potential (Epa), cathodic peak potential (Epc), anodic peak current (Ipa) and cathodic peak current (Ipc) of phenolic acids and their corresponding phytyl esters.
Table 3.
Anodic peak potential (Epa), cathodic peak potential (Epc), anodic peak current (Ipa) and cathodic peak current (Ipc) of phenolic acids and their corresponding phytyl esters.
| Compound | Epa (V)* | Epc (V)* | Ipa (µA)* | - Ipc (µA)* | Compound | Epa (V)* | Epc (V)* | Ipa (µA)* | - Ipc (µA)* |
| CA | 0.223 | 0.091 | 21.67 | 17.79 | CA-P | 0.235 | 0.198 | 6.71 | 2.25 |
| DHCA | 0.297 | -0.026 | 17.31 | 14.63 | DHCA-P | 0.250 | 0.171 | 4.49 | 4.22 |
| DOPAC | 0.403 | 0.053 | 14.67 | 12.72 | DOPAC-P | 0.219 | - | 4.56 | - |
| PCA | 0.387 | 0.082 | 15.18 | 10.35 | PCA-P | 0.327 | 0.303 | 4.55 | 0.35 |
| α-Toc | 0.219 | - | 4.10 | - |
*Standard deviations were lower than 5%.
Table 4.
- Linear regression equation and correlation coefficient, r, used to analyze the process controlling the electrochemical reaction, where Ip is in µA and v in mV/s.
Table 4.
- Linear regression equation and correlation coefficient, r, used to analyze the process controlling the electrochemical reaction, where Ip is in µA and v in mV/s.
| Compound | Anodic process | Cathodic process | Controlled by | |||
| Linear regression equation | r | Linear regression equation | r | |||
| CA | Ip = (1.57 ± 0.08) v1/2 + (2.6 ± 1.2) | 0.991 | -Ip = (1.63 ± 0.07) v1/2 + (-0.6 ± 1.2) | 0.993 | Diffusion | |
| DHCA | Ip = (1.54 ± 0.04) v1/2 + (2.0 ± 0.6) | 0.998 | -Ip = (1.23 ± 0.09) v1/2 + (1.0 ± 1.4) | 0.98 | Diffusion | |
| PCA | Ip = (1.43 ± 0.01) v1/2 + (1.0 ± 0.2) | 0.9996 | -Ip = (1.25 ± 0.03) v1/2 + (-0.9 ± 0.5) | 0.998 | Diffusion | |
| DOPAC | Ip = (1.30 ± 0.02) v1/2 + (2.1 ± 0.3) | 0.9993 | -Ip = (1.20 ± 0.04) v1/2 + (-1.5 ± 0.7) | 0.995 | Diffusion | |
| CA-P | Ip = (0.031 ± 0.002) v + (0.9 ± 0.6) | 0.991 | -Ip = (0.0231 ± 0.0004) v + (-0.2 ± 0.1) | 0.9992 | Adsorption | |
| DHCA-P | Ip = (0.0388 ± 0.0006) v + (0.8 ± 0.1) | 0.9993 | -Ip = (0.054 ± 0.001) v + (-0.8 ± 0.4) | 0.997 | Adsorption | |
| PCA-P | Ip = (0.030 ± 0.001) v + (0.7 ± 0.4) | 0.994 | -Ip = (0.0125 ± 0.0006) v + (-0.5 ± 0.2) | 0.993 | Adsorption | |
| DOPAC-P | Ip = (0.0251 ± 0.0009) v + (1.0 ± 0.3) | 0.996 | - | - | Adsorption | |
Disclaimer/Publisher’s Note: The statements, opinions and data contained in all publications are solely those of the individual author(s) and contributor(s) and not of MDPI and/or the editor(s). MDPI and/or the editor(s) disclaim responsibility for any injury to people or property resulting from any ideas, methods, instructions or products referred to in the content. |
© 2025 by the authors. Licensee MDPI, Basel, Switzerland. This article is an open access article distributed under the terms and conditions of the Creative Commons Attribution (CC BY) license (http://creativecommons.org/licenses/by/4.0/).
Copyright: This open access article is published under a Creative Commons CC BY 4.0 license, which permit the free download, distribution, and reuse, provided that the author and preprint are cited in any reuse.


