Submitted:
02 February 2025
Posted:
03 February 2025
You are already at the latest version
Abstract
For the first time, the adsorption of hydrogen on the (110) surface of the A15 Ti3Sb compound with a cubic structure (Cr3Si type; space group Pm3 ̅n) for the accumulation of hydrogen H was calculated using the density functional theory methods (DFT SGGA-PBE). Taking into account the relaxation of the Ti3Sb–H system, the equilibrium positions of hydrogen on the Ti3Sb (110) surface were determined depending on the supercell size. Hydrogen adsorption on the Ti3Sb (110) surface of supercells is preferable in pit sites. The effects of relaxation and an increase in the supercell size (3 × 3 × 3 and 5 × 5 × 5) reduce the adsorption energy compared to the unrelaxed 2 × 1 × 1 supercell. The calculated band structure, curves of local and partial densities of states of Ti3Sb–H are used to explain the interaction of hydrogen with the Ti3Sb (110) surface. The activation energy of H diffusion along the coordinates tetrahedral interstitial site → tetrahedral interstitial site (TIS–TIS) and tetrahedral interstitial site → octahedral interstitial site (TIS–OIS), as well as the diffusion coefficient of H in the cubic lattice of Ti3Sb, were calculated.
Keywords:
intermetallic compounds
; A15 Ti3Sb
; hydrogen
; hydrides
; supercells
; DFT
; adsorption
; Ti3-хSbHх
; diffusion
; electronic structure
1. Introduction
The Intermetallic alloys and compounds of metal (metalloid) – hydrogen (H) systems are used in various fields, including hydrogen energy for storing and transporting hydrogen [1,2,3,4]. Hydrogen absorption in intermetallic compounds can change the crystal structure [5] and physical properties [6]. These issues are of great importance for the practical use of hydrogen-absorbing materials such as H storage [7]. Intermetallic alloys and compounds based on titanium are also used for hydrogen storage. In such alloys, the hydrogen capacity is not high, for example, TiFe - 1.50, TiMn1.5 – 1.86 TiCr1.8 – 2.43 wt.% [8]. Various methods (e.g. machine learning methods, addition or substitution of components [9,10], surface and heat treatment, microstructure improvement) are used to optimize the material properties, in particular to improve hydrogen storage performance. In addition, improving the properties requires obtaining information on the relationship between the composition, structure and activity of the efficient hydrogen storage material, in particular, based on Ti.
Thus, intermetallic hydride compounds (IHC) are formed by introducing hydrogen atoms H into the voids of the metal crystal lattice, which expands the lattice (for different materials from 10 to 30%) [11,12,13]. IHC are suitable for creating hydrogen storage systems due to their hydrogen capacity (1.5-3 wt.%), kinetic and thermodynamic properties (high rates of hydrogen adsorption/desorption at moderate pressures and temperatures).
A class of intermetallics with stoichiometric composition A3B is known, which can crystallize in cubic, tetragonal and hexagonal structures [13,14]. In recent years, the properties of such compounds as Ti3Sb [14,15,16,17,18], Ti3Ir [19], Ta3Sb, Ta3Pb and Ta3Sn [20] with cubic syngony (phase A15, prototype Cr3Si) have been intensively studied. The absorption and diffusion of hydrogen in intermetallic compounds of the A15 Ti3Sb type has been poorly studied. Therefore, the study of the features of the interaction of hydrogen with compounds based on Ti3Sb is relevant, in particular, for the creation of new hydrogen storage systems [21,22,23,24].
However, experimental determination of the characteristics and coefficients of hydrogen adsorption and diffusion in a solid is difficult. Calculations based on density functional theory are used to study hydrogen adsorption and various adsorption sites on the surface of the material [25]. Reliable diffusion coefficients of atoms are determined both theoretically, for example, using Monte Carlo methods and diffusion rate calculations [26,27], and by experimental methods [28].
However, reliable interpretation of experimental data on the adsorption and diffusion of atoms in a solid is difficult. This is due to the need to take into account the features of the calculation method, the dependence of the material properties and the determined coefficients on various factors, such as the structure, composition, chemical bond and shape of the sample [6,7].
The analysis shows that adsorption and subsequent diffusion of introduced elements into metallic and intermetallic systems are complex processes for experimental study. Taking this into account, in recent years ab initio methods for calculating the migration coefficients of gases and light atoms in solids have been developed [29,30,31,32,33], in particular, in Ti3Sb [14]. The mechanisms of diffusion of implanted hydrogen atoms in metallic systems are also known [28]. In these works, in particular, it is shown that interstitial atoms in fcc systems are not necessarily located in the usual interstitial sites. The diffusion of interstitial hydrogen atoms in metals is modeled taking into account phonon properties. In addition, it is proposed to also correct the formulas used for the diffusion coefficient.
The task we set in this article, the study of the mechanism of hydrogen transfer in intermetallic structures of Al5 for storing H, has apparently not been studied to date. Such studies are needed, in particular, for the development of adsorption and chemical methods of dissolving and storing hydrogen, taking into account the properties and capacity characteristics of the hydrogen absorbent material [34].
It should be noted that the preparation of the methodology, including clean surfaces for experiments, in particular, in H-intermetallic systems is complex and time-consuming. From the analysis of the above literature, it follows that theoretical calculations related to the behavior of H on the surfaces of intermetallic compounds. are limited. While the interaction between H atoms or molecules and the surface of solids is of interest for a number of industries, for example, for the accumulation and storage of H2. Therefore, in order to provide further understanding of the mechanism of interaction of H with intermetallic surfaces, the processes of H penetration into the crystal lattice, we studied supercells based on Ti3Sb–H systems.
Taking into account the above and for the development of solutions to the problems of hydrogen storage and the use of hydrides by accumulating hydrogen, the task considered in this article is relevant. Since the processes of H adsorption and diffusion in Al5 Ti3Sb occur at the atomic scale, the exact mechanisms leading to the change in properties and accumulation of H are not easy to determine experimentally.
Modeling the interaction of particles at the atomic level can yield practically important results for describing adsorption and diffusion. Taking this into account, the task was set to calculate the parameters of adsorption and diffusion of H on the surface and in the crystal lattice of the previously unstudied Ti3Sb–H system. This paper does not consider issues related to the evaluation of the interaction of H with defects in the Al5 Ti3Sb compound with a cubic lattice.
The aim of this work is DFT GGA-PBE modeling of the processes of adsorption and diffusion of H atoms on the surface and in the bulk of the lattice of cubic supercells based on the A15 Ti3Sb–H system.
2. Methodology and Calculation Models
Possible stable positions, diffusion barriers and electronic properties of H atoms adsorbed on the surface of the compound A15 Ti3Sb (110) were calculated, as well as the binding energy and diffusion barrier of H in the bulk of Ti3Sb. We also considered the results of calculations of the adsorption properties from low (Θ = 0.25 ML – monolayer) to high (1 ML) hydrogen coverage of the surface Θ.
The calculations of the electronic structure and structural properties of Ti3Sb–H were performed from first principles based on the density functional theory (DFT) [35,36,37,38,39]. The interaction between valence electrons and core electrons was considered within the pseudopotential approximation and the plane wave approach. The exchange-correlation energy was estimated using the Perdew–Burke–Ernzerhof (PBE) generalized gradient approximation (GGA) [36] for solids and surfaces. To construct molecular orbitals, a plane wave basis set with an energy cutoff of 325 eV was used for supercells with different sizes (2 × 2 × 1, 2 × 2 × 2, 3 × 3 × 3 and 5 × 5 × 5) of k-points [14,17,20]. Convergence tests of the k-point set showed that this energy cutoff was sufficient to determine the total energy to an accuracy of better than 0.1 meV/atom. Integration over the Brillouin zone was carried out in accordance with the Monkhorst-Pack scheme using a k-point grid separation of 0.03 Å-1. The following valence states of orbitals were used for the atomic configurations: Ti – [Ar] 3d24s2, Sb – [Kr] 4d105s25p3 and H – 1s1. The geometry optimization of the crystal structures based on A15 was carried out within the framework of the BFGS minimization scheme [40]. To determine the convergence of the geometric parameters of the crystal, a force limitation of 0.02 eV/Å was applied. The following threshold values were used for convergent Ti3Sb–H supercells: energy change per atom, maximum residual force, maximum atomic displacement and maximum stress less than 1×10⁻⁷ eV, 1×10⁻⁴ eV/Å, 1×10⁻⁴ Å and 0.001 GPa, respectively. For comparison, experimental lattice constant (a = 5.2228 Å) [14,41] with the A15 Ti3Sb structure, which have cubic symmetry with the space group , No 223, were used (Figure 1). The optimized lattice constant of Ti3Sb is a = 5.215 Å by DFT GGA is in good agreement with the experimental value [41].
To optimize and improve the accuracy of DFT calculations, we constructed a model of a layer plate [42] of the Ti3Sb (110) surface with a vacuum region of 15 Å in supercells. In other words, the surface properties of the cubic structure of A15 Ti3Sb (110) (Figure 1) were simulated using a plate model from one layer to three layers.
The atoms in the upper two layers of Ti3Sb were allowed to relax. And the atoms in the lower three layers of the cell were fixed in their bulk positions. For the adsorption calculation, the H atoms were placed in the top site (TS), bridge site (BS) and hollow site (HS) on the Ti3Sb surface. Tetrahedral (TIS), octahedral (OIS) and diagonal (DIS) interstitial sites were considered for the diffusion of H atoms in the subsurface layer and bulk in the constructed Ti3Sb (100) supercells.
The interlayer distance between the plate surface and the volume models was determined as , where and are the interlayer distances between the i-th and j-th layers of the plate model before and after relaxation, respectively.
Thus, in the H adsorption calculations, the surface unit cell was doubled along the lateral directions of the cubic crystal. Such a cell was laid by identical neutral planes corresponding to the Ti3Sb stoichiometry. The vacuum gap between the layers was 15 Å. In the calculations, the atoms of the upper one and two layers of the crystal together with the H adsorbate were allowed to relax. In this case, the atoms in the other layers were frozen and were in optimized bulk positions in the Ti3Sb crystal.
The adsorption energy of H () was calculated as the difference between the total energy of the supercell with one adsorbed H and the clean Ti3Sb (110) surface and the H atom in vacuum:
where E(slab Ti3Sb + N(H)) is the total energy of the Ti3Sb–H system with an adsorbed H atom, E(slab Ti3Sb) is the total energy of the Ti3Sb slab, N is the number of adsorbed H atoms, E(H) is the total energy of free H atoms, respectively. Lower adsorption energies of H atoms correspond to more stable adsorption positions. The spontaneous and exothermic process of H adsorption on the Ti3Sb (110) surface corresponded to the calculated negative value of . The effects of relaxation and increasing the supercell size to 5 × 5 k-points reduce the adsorption energy. Compared to the unrelaxed 2 × 1 × 1 supercell, the value of decreases by ∼ 0.15 eV on average.
Probable diffusion paths of hydrogen atoms on the Ti3Sb surface were studied using the molecular dynamics (MD) method. Hydrogen atom was introduced into supercells with Ti3Sb cubic structure in tetrahedral interstitial sites. The calculations were performed on both 2 × 2 × 2 (96 atoms) and 3 × 3 × 3 (324 atoms) supercells. The results of data convergence for these supercells differ slightly from each other. The formation energy of interstitial H0 (charge states of hydrogen q = 0) was 1.82 eV (2 × 2 × 2 supercell) 1.85 eV (3 × 3 × 3 supercell), respectively, in calculations with the GGA-PBE functional. The sample of the k-point of the supercell was limited to the Γ point in the calculations. The positions of hydrogen in the Ti3Sb crystal lattice were considered in a grid of regularly located possible sites for H introduction. The distance between positions of two nearest hydrogen atoms was chosen to be on average 0.2 Å. The calculations were performed at nonequivalent possible insertion sites for hydrogen in the Ti3Sb cubic cell. One hydrogen atom was introduced into each of these sites in a weakened atomic structure. By limiting the hopping distances to a maximum of up to 4 Å, a saddle point in the DFT GGA calculations for 3-dimensional H migration in Ti3Sb was obtained.
In principle, one could consider all atomic hops between any pair of stable H species positions (q = –1, 0, +1 charge states) in Ti3Sb. However, taking into account the charge state of H was not part of the task and was not considered by us in this article. The possible charge states of hydrogen (hydride ion, H–, atomic hydrogen, H0, and proton, H+) for all sites can be considered by appropriately changing the number of electrons in the cell. The corresponding migration energies of the different hydrogen species (q = –1, 0, +1) can be estimated by calculating the two positive vibrational frequencies at each saddle point of the associated hopping frequencies of these hydrogen species.
MD simulation of the hydrogen atom diffusion coefficient () in the Ti3Sb crystal was performed using the LAMMPS (https://docs.lammps.org/Manual) software package. The calculation used the grand canonical ensemble (NVT) from 1110 to 1375 K (melting point of Ti3Sb) for 50–100 ps with a time step of 1 fs [43].
The diffusion coefficient H was calculated using the Arrhenius equation:
where is the pre-exponential factor, is the activation energy of atomic diffusion of H; is the Boltzmann constant, T is the temperature.
The value of was calculated using classical transition state theory. Then equation (2) can be rewritten as
where l is the jumping distance between two nearest sites, ν is the frequency of jumping attempts, is the diffusion energy barrier (or activation energy of atomic diffusion of H).
The distance of the H atom from one stable position to another stable position in the Ti3Sb–H supercell varied from 0 to 3 Å. And the frequency of jumps of the interstitial hydrogen atom per unit time was = 1012–1014 s-1.
The activation energy of H diffusion in Ti3Sb was calculated using the DFT method. When H migrates along the diffusion path from one site to another site, the H atom must overcome the corresponding potential barrier . The maximum point of the potential barrier is defined as the saddle point, which is located in the middle of the migration path or reaction paths (coordinate, Å) of the H atom in the Ti3Sb supercell. The activation energy of diffusion in Ti3Sb was calculated as the energy difference:
where and are the total energies of the supercells for the saddle point and for the equilibrium region, respectively for the dependence of energy (eV) on the reaction coordinate (Å). Comparison of the results of calculations of the activation energy of diffusion of supercells 2 × 2 × 2 and 5 × 5 × 5 showed that they do not differ much from each other. The convergence of these values corresponds to an accuracy of 0.001 eV.
Magnetic configurations of Ti3Sb, with a spin magnetic moment of Ti, were set taking into account two eigenvectors of the spin state (spin up and spin down) along the z-axis, providing a magnetic moment equal to zero [14].
The H coverage (Θ) of the surface was defined as the ratio of the number of adsorbed H atoms to the number of metal atoms in each surface layer, taking into account different configurations of the Ti3Sb–H supercells. The calculated average adsorption energies of H atoms on different sites at 0.25 ≤ Θ ≤ 1 showed that with the same coverage of H atoms, the adsorption energy on the same adsorption sites does not differ significantly. The value of for identical sites depends on the size of the supercell.
Our calculations of the spin-polarized band structure of Ti3Sb–H (Θ = 0.25 ML) show that increasing the supercell size from 3 × 3 × 3 to 5 × 5 × 5 does not lead to a significant change in the minimum value of the total energy of Ti3Sb–H. The 3 × 3 × 3 and 5 × 5 × 5 Ti3Sb–H supercells with hydrogen coverage Θ = 0.25 ML have almost the same minimum total energy as the 2 × 2 × 2 supercell, when one Ti atom in the supercell is substituted by one H atom. With this in mind, as an illustrative material, in particular for the density of states (DOS), the DOS of the 2 × 2 × 2 supercells with Θ = 0.25 ML will be presented below.
3. Results and Discussion
3.1. Structural features of Ti3Sb–H
The interaction of hydrogen with metals (M), as is known from physical chemistry surfaces [28,34], can be accompanied by the following processes: on the metal surface – physical adsorption, chemical adsorption (activated adsorption or chemisorption); in the volume of the metal – diffusion, migration, absorption and formation of hydrides.
Physical adsorption caused by intermolecular, mainly van der Waals forces, when the energy of interaction of the gas with the adsorbate has a value of about 10–30 kJ/mol. In this case, the molecules of the adsorbed gas do not dissociate into atoms. This is the first stage of sorption processes during the interaction of metals with hydrogen at low temperatures.
An increase in temperature facilitates the transition of physical adsorption to chemisorption, when the H2 molecule dissociates into atoms that chemically interact with the surface atoms of the metal. In this case, hydrogen atoms saturate the uncompensated bonds of the metal surface. The interaction energy during chemical adsorption ≥ 30 kJ/mol.
Correct description of the results of interaction of H with crystals (metals, intermetals, alloys, complex compounds, etc.) is a complex task. In the first approximation, we will consider a simple mechanism of adsorption of H atoms on the metal surface. i.e., we will consider the M–H system.
The electron gas model describes the behavior of electrons in bodies with electron conductivity. In this model, the Coulomb interaction between electrons in metals is neglected, and the electrons themselves are weakly bound to the ions of the crystal lattice. In this case, the adsorbed H atoms on the metal surface will be outside the "electron surface" of the metal. We assume that the temperature of the M–H system is high and contact of the metal surface with hydrogen is possible. Then, due to the H2→2H process, the transition of hydrogen atoms into the metal crystal lattice will be possible. The flow of hydrogen atoms in the surface layer of the metal will create a concentration gradient, and then the hydrogen atoms will diffuse into the metal lattice.
Analysis of the results of studies of metal–hydrogen systems (in particular, DFT of H adsorption [44,45,46,47,48,49,50,51,52,53,54,55,56] and H diffusion [57,58,59]) shows that the interaction of metals with hydrogen can be divided into three classes (A, B, C). Class A metals (Li, Na, K, Ca, etc.) form salt-like hydrides with hydrogen. Class B metals (Mg, Al, Zn, Cd, Hg, etc.) form hydrides with a covalent bond when interacting with hydrogen. Class C metals can interact with hydrogen via both endothermic (Fe, Ni, Cu, Ag, Pt, etc.) and exothermic (Ti, Zr, Ru, Rd, etc.) reactions.
If the adsorption of H is purely physical, diffusion in the metal does not occur. The necessary preliminary stage of H diffusion in metals is activated adsorption, caused by chemical interaction. Diffusion of hydrogen into the lattice of an intermetallic compound precedes the formation of interstitial or substitutional solid solutions. It is known from experimental and calculation data that the dissolution and diffusion of H is enhanced in those metals whose crystal lattice has defects. In this case, the captured H can be in the form of a proton in the lattice defects [60,61,62].
Intermetallics occupy an intermediate position between metals and ceramics both in the type of chemical bond and in properties. They have chemical bonds of metallic and covalent types, and intermediate bond types are also possible. The range of problems to be solved related to atoms adsorption and diffusion in intermetals has expanded over the last decade [14,17,28,34]. However, there are few new observations, methods and theoretical models in this area that simultaneously relate surface properties and diffusion based on intermetallic compound A15 A3B–H systems.
The A15 structure of A3B compounds has a cubic edge with an average length of 5.22–5.29 Å (lattice parameter "") (Figure 1). In A3B, the atoms of component B are located at the vertices of the cube and form a body-centered cube. The A atoms form one-dimensional chains in the orthogonal directions x, y, z. The interatomic distances along the chains are 1/2. The interatomic distance A–A in A3B is smaller than the interatomic distance in pure metal A. This structure of A3B affects its physical properties.
Some intermetallic compounds of the A3B type demonstrate a phase transformation from a cubic structure to a tetragonal one [17]. In such a structure (space group ) A3B, in particular Ti3-хSbHх (Ti3Sb1-хHх) the H atoms can be located in the following crystallographic sites: 6(d), 16(i) and 24(k) [14,17] (Figure 2).
Sites 6(d) correspond to the nodes of the metallic sublattice Ti and the non-metallic sublattice Sb, the centers of tetrahedral interstices (sites 16(i)) and tetrahedral interstices 24(k) formed by four nodes of the metallic sublattice Ti (or four nodes of the Sb sublattice) (Figure 2).
Hydrogen atoms can be located in vacant site of the Ti3Sb lattice at different sites, for example, in the 6(d) sublattices of Ti and/or Sb. It is also possible that some of the H atoms can occupy vacant sites 16(i) of the Ti and Sb sublattices, and the remaining H atoms are statistically located in the tetrahedral positions 24(k) (Figure 2). Thus, position of hydrogen on the surface and its location in the volume can change the properties of the Ti3Sb–H system, for example, increase the hydrogen capacity of Ti3Sb.
In accordance with the stated objective of the work, the calculated reference state of the binding energy between the components and/or objects of the Ti3Sb–H system corresponded to the energy of a supercell without defects. That is, the properties of an ideal system based on a Ti3Sb crystal were calculated. All ab initio calculated quasi-binary Ti3Sb–H supercells in our case contained the same number of intermetallic sites and had the same size. In such a binary system, the binding energy between two components is calculated by the formula
where is the energy of the supercell based on only, is the energy of the supercell based on both and , which interact with each other, Eref is the energy of the supercell without and .
If the system contains more than two objects (components, particles, sites, defects etc.), equations (4) must be extended and the influence of defects on the change in the total energy of the system must be taken into account. It is necessary to additionally calculate the energy of the most stable configurations, the energy of vacancy formation, and the energy of migration of intrinsic point defects, divacancies, and vacancy clusters in A15 Ti3Sb–H. The solution of the listed issues related to point defects was not included in the objectives of this article. Let us consider the adsorption of hydrogen on the surface of A15 Ti3Sb, where the interaction of hydrogen occurs both in the Ti and Sb sites of the Ti3Sb lattice.
3.2. DFT SGGA-PBE Calculation of the Ti3Sb–H Structure
In the cubic unit cell of A15 A3B, space group , the A atoms occupy the 6c sites (¼, 0, ½) with point symmetry D2d. The B atoms occupy the 2a sites (0, 0, 0) with point symmetry Th. The structure of A15 A3B is characterized by a sequence of internuclear separations of atoms: A−A (2×; 0.5), A−B (12×; 0.559), A−A (8×; 0.612), B–B (8×; 0.866, where = cubic lattice parameter) [14,17].
Figure 3a–d show the atomic structures of Ti3Sb–H cells, where the hydrogen atom is adsorbed on the Ti–Ti and Ti–Sb sites in the crystal lattice. The calculated lattice parameter both in the primitive unit cell and in different configurations of Ti3Sb–H supercells coincide with each other and on average is = 5.22 Å.
3.3. Adsorption Energy of H on Metal
Let us first take a brief look at the adsorption of hydrogen on a metal surface. The bond energy M–H depends on the degree of overlap of the electron orbitals of hydrogen and metal. It is known that the relation between the M–H bond energy and the energy of the metal crystal lattice is almost linear [44,45,46,47,48,49,50]. In this case, it is important to determine the contribution of hydrogen to the M–H bond energy. The M–H bond energy affects the mechanisms of hydrogen adsorption, diffusion, and emission. Materials and the mechanism of H-adsorption () for M–H systems, taking into account experimental data [50,51,52,53,54,55,56], can be divided into three groups: low, medium, and high adsorption energy of atomic hydrogen:
1. With increasing energy (), the rate of hydrogen emission in M–H systems increases. This mechanism is typical for metals with low energy (Ag, Au, Zn, Cd, In, Hg, Pb, Tl). A similar mechanism of H-adsorption also takes place in some binary refractory compounds (e.g., borides, carbides, nitrides, silicides). In such compounds the contribution of the covalent chemical bond is significant.
2. With an increase in the density of the layer of adsorbed H atoms, increases and the process of surface recombination begins. With a further increase in the adsorption energy, the recombination rate remains constant in the case of a defect-free metal surface. The rate of gradually slows down if adsorption takes place mainly on the defects of the crystal lattice and the boundaries of crystal grains. For metals such as Pt, Pd, Ru, Rh, Os, Fe, Co and Ni, the adsorbed hydrogen atoms are still far from the metal surface. Therefore, they cannot tear an electron from the metal and chemical desorption does not occur.
3. At high energy , a relatively dense layer of is formed on the metal surface. Hydrogen release from the surface can occur by different mechanisms, for example, electrochemical desorption. The electrochemical desorption mechanism is typical for metals with high adsorption energy, for example: Ti, Zr, Hf, V, Nb, Ta, Cr, Mo, W, Mn, Re. Similar data on for binary and complex alloys intermetallics have not yet been generalized.
3.4. DFT Calculation of the H Adsorption Energy
Below we consider the results of our DFT SGGA calculations adsorption for the Ti3Sb–H system. The adsorption energy of the hydrogen atom on the Ti3Sb (110) (Figure 1c) surface was calculated using this formula:
where is the total energy of the surface layer with an adsorbed H atom, is the total energy of the surface layer , is the total energy of the H atom, respectively.
The adsorption energy between an H adatom and a Ti3Sb surface depends on various factors, in particular, the bond length between the component atoms and the adatom position. When the bond length between the H adatom and the Ti3Sb surface component atoms, in particular, the titanium atoms, is shorter, the adsorption energy of H is relatively greater. When the bond length between the adatom and the surface component atoms is long, physical adsorption may take place. Conversely, when the bond length is short, the adsorption energy increases due to chemical adsorption.
The following possible adsorption sites on the Ti3Sb (110) surface were included in the scheme for calculating the adsorption energy of the H atom (Figure 4).
We considered hydrogen atom site on top of Ti or Sb (TS), H bridging site of the Ti–Ti or Ti–Sb bond (BS), H site in the lattice voids (H hollow site – HS). The adsorption energy of H was calculated for the first subsurface of Ti3Sb, which contains tetrahedral (TIS) and octahedral interstices (OIS). Thus, the most probable adsorption sites of one H atom on the first and second subsurface regions of TS, BS and HS were estimated by us by DFT calculation of the adsorption energy of H. The adsorption sites of H with the minimum energy were taken as stable adsorption sites of H adatoms on the Ti3Sb (110) surface.
The study of the effect of coverage on showed that the adsorption of H atoms is stronger with vertical adsorption on the hollow sites HS of the Ti3Sb surface. Comparison of the calculated on different regions of the Ti3Sb (110) surface shows that with the same coverage (0.25 < < 1), the adsorption energies are close to each other on the same regions and equivalent configurations of the supercells.
The calculated absorption energies of H atoms on these regions for different supercells and similar structures with different sizes differed slightly from each other (Table 1, Table 2 and Table 3).
The adsorption energies of H atoms in three regions, taking into account the distance between the H atom and the Ti3Sb atom () and the height of the adsorbate () are presented in Table 1.
Increasing the degree of surface coverage from 0.25 to 0.5 H on ML Ti3Sb, for example, in 2 × 1 × 1 supercell, where = 1.88 Å and = 1.35 Å, increases the absolute value of the adsorption energy. This may be due to an increase in the degree of overlap of the orbital states of the H, Ti and Sb atoms and an increase in the attractive energy between the atoms Ti3Sb. The calculated adsorption energy of H was lower at the hydrogen position on the HS sites of the Ti3Sb lattice surface with Ti–Ti bonds than with Ti–Sb bonds regardless of the supercell size.
Thus, the adsorption energies calculated by the DFT GGA method after relaxation of the Ti3Sb–H system showed the following. H atoms are adsorbed predominantly over the Ti and Sb positions in the first atomic layer of Ti3Sb 2 × 1 × 1 configurations. The strongest adsorption energy ( = –0.55 eV) is observed for the 2 × 1 × 1 (H–Ti) configuration.
The H atom tends to move to the nearest Ti atom. The Ti–H distance is on average 1.86 Å, which is typical for titanium hydrides (>1.80) [66]. The adsorption energies of H atom on other regions of Ti3Sb (110) surface vary significantly, indicating that the adsorption of H atom on Ti3Sb (110) surface with corresponding relaxed configuration belongs to chemical adsorption (Table 1, Table 2 and Table 3). Therefore, relatively strong forces act on the H atom at these positions on the Ti3Sb (110) surface.
The most stable adsorption site for H atoms adsorbed on the surface is the initial site of the 5 × 1 × 1 (H–Ti) configuration after relaxation with an adsorption energy of –1.23 eV. The (H–Ti) distance is 1.87 Å with the H atom in the first atomic layer. A chemical bond is formed between the H atom and the nearest Ti and Sb atoms, similar to 2 × 1 × 1 (H–Ti) configuration. The adsorption energy for 5 × 1 × 1 (H–Sb) is –1.17 eV, which is less energetically favorable than the 5 × 1 × 1 (H–Ti) configuration.
3.5. Electronic properties of H adatoms on the Ti3Sb (110) surface
It is known from physical chemistry that chemically bonded non-polar H2 molecules can interact with the adsorbent surface via Van der Waals potential forces.
3.5.1. DOS
The physicochemical interaction of the adatom with the surface was estimated by calculating the band electron structure of . Similarly, to the above, it can be assumed that the potential function of the Van der Waals interaction of the hydrogen atom with the surface includes three non-valent forces: repulsion of electron shells, dispersion forces of Van der Waals attraction, and electrostatic interactions.
In DFT SGGA calculations of , these three non-bonded forces were combined into one van der Waals potential function. The model of electrostatic interaction in the calculations was simplified. It was assumed that the contacts of atoms in are formed only between the nearest neighbors of atoms, and the electrostatic interactions of atoms were averaged. It was assumed that the resulting contribution to the electrostatic interaction of atoms depends on the position of the adatom and the distance between the contacting atoms. The effective charges of the contacting atoms were not taken into account in the calculations.
The results of DFT SGGA calculations show the following. In the band structure of there is a metallic type of bond near the Fermi energy, strengthened by electrons of the Ti d-orbital. From the analysis of the band structure (Figure 5) and density of electron states (DOS), it can be assumed that the Fermi energy is located in a narrow pseudogap on the electron density of states in Ti3SbHx. The pseudogap occurs in Ti3SbHx containing hydrogen due to some shift of the energy bands in the energy spectrum. Within the framework of the p-d-s orbitals interaction model, it can be assumed that in Ti3SbHx, the interaction of the 5p states of antimony, the 3d states of titanium, and the 1s states of hydrogen leads to a change in the number of states at the Fermi level and its position in the pseudogap.
The partial density of states (PDOS) of hydrogen is noticeably smaller than that of Ti (Figure 6a,b). The PDOS of the final state of Ti–H indicates that the valence states of H (1s orbital) and Ti (3d orbital) are shifted to a lower level (by about 0.5 and 8 eV, respectively). Compared with the DOS curve of pure Ti3Sb (110) surface, the change for Ti 3d states in the PDOS of Ti–H can be observed from 5 to –2.5 eV. The peak heights indicate that several electrons of Ti 3d are shifted to lower levels when H is adsorbed on the Ti3Sb (110) surface, which shows the strength of the interactions. In Figure 6b, the s-electrons of H and the s and p-electrons of Ti are shown with a clear peak at around –15 eV. A clear peak is also found in the interaction of the s-electrons of H and the s, p and d-electrons of Ti at around 8 eV. These peaks indicate that a chemical bond is formed between the H and Ti atoms. The PDOS results are consistent with the calculated adsorption energies (Table 1 and Table 2).
It follows from Fig. 6(b) that the PDOS of 1s orbitals of H adatoms interacting with s-p-d orbitals of Ti atoms on the Ti3Sb(110) surface is close to zero. This shows that the charge localization between the orbitals of H adatoms and the orbitals of Ti atoms on the surface is very weak. As a consequence, there is no covalent bond in this region of the configuration. There is a slight charge polarization in the H atom and in the neighboring atoms of the Ti3Sb compound due to the electrostatic repulsion. The left and right regions of the PDOS show that there is electron localization between the H atom and the nearest metal atoms. These features of the electronic structures suggest that the H–M bonds formed in the right region are much stronger than that of the left region of the surface. Therefore, such a stronger chemical bond will result in a lower adsorption energy of H, for example, in 2 × 1 × 1 Ti3Sb–H with Ti–Ti bond (Table 2). In general, for the adsorption configurations of H atoms on the Ti3Sb (110) surface, there are both strong chemisorption and weak physical adsorption depending on the adsorption energies and electronic structure.
3.5.2. PDOS in 2 × 1 × 1 Supercells Ti3Sb–H
The DOS of Ti3Sb–H supercells is shown in Figure 7. It follows from the DOS spectra that the s- and p-orbitals in Ti3Sb–H make an insignificant contribution to the electron density of the valence band. That is, the electrons in Ti3Sb–H are strongly localized in the s- and p-orbitals. The low-energy bands in the valence band are generated by the s-orbitals, and the high-energy bands arise from the 3d orbitals of Ti. The interaction between the 3d orbitals of Ti and the 3p orbitals of Sb is observed near the Fermi level. The energy gap of Ti3Sb–H is ≤ 0.05 eV/atom. DOS indicates the presence of small peaks of Ti–Sb bond in the valence band of Ti3Sb–H and weak electron interaction.
The calculated density of states of Ti3Sb (Figure 7a,d; from –6 to 4 eV) enables to evaluate the nature of chemical bonds in which the 3d and 4s orbitals of Ti atoms participate. As can be seen, the overlap region of the Ti density of states with the Sb density of states is small. This is due to the highly localized profile of the Ti density of states. Based on this, it can be assumed that Ti atoms participate in the formation of ionic bonds with Sb atoms and, to a lesser extent, in the formation of covalent bonds.
The above states for Ti3Sb–H are consistent with the PDOS of the components of pure Ti3Sb in energy [14]. However, the PDOS of Ti3Sb–H (Figure 7) show different regions in the distributions of the electron density of states of Ti and Sb compared to pure Ti3Sb. From the comparison of the PDOS spectra it follows that the density of states of Sb is small near the Fermi energy EF. Therefore, it can be assumed that the main part of the metallic properties of Ti3Sb–H is due to the presence of d- orbitals of Ti near the Fermi level.
3.5.3. DOS in Ti3Sb1-xHx and Ti3-xSbHx
The atomic structure of Ti3Sb1-xHx and PDOS of Ti3Sb1-xHx and Ti3-xSbHx solid solutions are in the Figure 8 and Figure 9, respectively. An increase in the number of H adatoms on the surface does not significantly complicate the DOS in the Ti3Sb–H system. More precisely, the presence of a larger number of H atoms per unit cell does not significantly activate the participation of Ti 3d orbitals in determining the electronic properties.
3.6. Magnetic Moment in Ti3Sb–H
DFT SGGA calculations of optimized Ti3Sb–H structures indicate a uniform spatial distribution of Ti and Sb component atoms in the lattice. As for pure A15 Ti3Sb, in solid solutions Ti3Sb1-xHx and Ti3-xSbHx the titanium and antimony atoms are stoichiometrically located at different sites of the crystal lattice. Partial substitution of Ti and/or Sb atoms by hydrogen atoms does not lead to relaxation of the Ti3Sb–H structure. Therefore, the nonequivalent positions of the component atoms and the symmetry of the Ti and Sb sites form a partial magnetic moment. The atomic magnetic moment consists of spin and orbital moment contributions. Spin-orbit coupling (SOC) influences the formation of the magnetic moment in Ti3Sb–H. The size of the SOC splitting is of the order of the Ti 3d sublevel bandwidth.
From the DOS spectra of Ti3Sb–H supercells it follows that the contribution of titanium 3d electrons to the magnetic interaction between the crystal atoms is noticeable. Since the 3d states of Ti are only partially occupied by electrons, the empty levels of the components will be filled due to the hybridization of the s- and p-electrons of Ti and Sb. In the case of Ti3Sb1-xHx and Ti3-xSbHx we observed a very small magnetic moment. For the partial magnetic moment of Ti in Ti3Sb0.98H0.02 the following values were obtained: 0.23 (Ti) at the Ti–Ti sites and 0.28 (Ti) at the Ti–Sb sites of the lattice.
3.7. Diffusion of H Atoms on the Ti3Sb (110) Surface
We have shown that the most stable configuration of the H atom on the Ti3Sb (110) surface corresponds to adsorption on the 2 × 2 × 1 supercell (Ti–Ti bond). Therefore, we further considered the diffusion of atomic hydrogen on the Ti3Sb (110) surface of between two sections of the 2 × 2 × 2 supercell. This allows to characterize the surface diffusion. The minimum energy path for H diffusion from the terminal interstitial site of Ti to the nearest terminal interstitial site of Ti on the Ti3Sb (110) surface ranged from 0 to 7 Å (reaction coordinates). The activation energy of the transition state is determined for the saddle points and the path of the minimum reaction energy between two sites of the Ti3Sb lattice. (zero-point energy) [67] correction due to the motion of hydrogen at the zero point was not taken into account. The (negative) value of can decrease according to: . Thus, the energy of migration and diffusion paths of atomic hydrogen on the Ti3Sb (110) surface between two sites of the supercell are determined. In other words, the energies of hydrogen migration () along interstitial paths in the Ti3Sb lattice were calculated.
The contact of the components of the Ti3Sb–H system requires a certain amount of energy to activate the interphase surface. This energy can be communicated to the system in the form of heat, elastic-plastic deformation energy, electron and ion irradiation. The interphase energy of interaction of two condensed phases usually decreases exponentially: The driving force of diffusion is the difference in thermodynamic potentials at the interface between the components. In the absence of the appearance of new phases in the diffusion zone, equilibrium of thermodynamic potentials is established. Accordingly, a certain energy balance is established in the system.
The activation energy of hydrogen diffusion in Ti3Sb was determined using equation (2) for the transition states of the H atom. It was assumed that the initial H atom occupies the TIS interstitial site, which is the most stable. The diffusion path of H in the Ti3Sb lattice mainly goes from one TIS interstitial site to another identical TIS (TIS–TIS) and from a TIS interstitial site to the second nearest neighboring non-identical OIS interstitial site (TIS–OIS). From the dependence of the energy barrier of H diffusion on the reaction coordinate between two neighboring identical TIS interstitials (i.e., TIS–TIS), it was found that = 1.57 eV. This energy is lower than for diffusion between two neighboring non-identical interstitials from TIS to OIS. That is, = 2.33 eV for the TIS–OIS interstitials. It can therefore be concluded that the diffusion of H in Ti3Sb takes place predominantly along the identical TIS–TIS interstitials.
Let us consider the results of calculating the diffusion of H in a 2 × 2 × 2 supercell and a 5 × 5 × 3 grid of Ti3Sb k-point mesh. We assume that H migrates only between relatively stable interstitials from A1 (initial position) to A2 (final position for diffusion paths) through selected transition sites E1 and E2 in Ti3Sb. Interstitials A in the Ti3Sb–H supercell can be located on the surface, in the body, and at the edge sites of the lattice (Figure 10). Calculations show that migration paths of H through transition sites (e.g. E1 and E2 in Figure 10) have higher energy barriers compared to for surface diffusion.
Thus, the activation energy of H atom diffusion into the Ti3Sb lattice depth, determined within the framework of the transition state model (A1→E1→E2→A2 in Figure 10), showed the following. for identical tetrahedral Ti–Ti interstitials (TIS–TIS) and for non-identical Ti–Sb interstitials (TIS–OIS) differ greatly from each other. The maximum value of at the saddle point on the dependence of the energy on the migration path of H for identical tetrahedral Ti–Ti interstitials (TIS–TIS) is almost 2 times smaller than for interstitial jumps of H atoms between two adjacent non-identical positions (TIS–OIS).
The stability of the H pair in the Ti3Sb matrix is estimated by calculating the binding energy Eb of the H pair. In this case, Eb characterizes the decrease in the total free energy of the Ti3Sb–H system when two H atoms approach each other from afar.
where total free energy of the supercell containing interstitial-interstitial H pairs, total free energy of the supercell containing substituted-substituted H pairs, total free energy of the supercell containing substituted-interstitial H pairs. Similar equations for the binding energy Eb of an H pair can be written for Ti3Sb1-xHx.
For the substituted-interstitial H pair, the binding energy (attraction) is = –0.11 eV in Ti3SbН1. Increasing the hydrogen concentration (number of H atoms from 1 to 4) in the Ti3Sb lattice reduces the binding energy to = –0.14 eV between these non-identical sites.
The binding strength for the interstitial-interstitial and substituted-substituted H pairs is negligible in the Ti3Sb lattice. This indicates that it is more difficult for H atoms to move in these identical positions of the Ti3Sb lattice. That is, the driving force of attraction of H is weak between like sites (TIS–TIS) for the formation of H clusters in the Ti3Sb matrix.
3.8. Calculation of the Diffusion Coefficient
The diffusion coefficient H was calculated for an ideal Ti3Sb supercell without taking point defects into account. Surface effects, hydrogen capture by impurities, dislocations, grain boundaries or precipitates, and the formation of molecular hydrogen in Ti3Sb micropores were not taken into account in the calculations. The interstitial diffusion mechanism was considered. It was assumed that the hydrogen atom diffused in the cubic Ti3Sb crystal by migrating from a tetrahedral site to its nearest tetrahedral site.
Using the molecular dynamics MD and Monte Carlo (MC) methods [43], taking into account the activation energy of the migration barrier = 1.57 eV along the interstices of the Ti–Ti lattice of Ti3Sb (110), the diffusion coefficient was calculated. Table 4 shows the calculated activation energies of the hydrogen atom of Ti3Sb–H in comparison with similar compounds.
4. Conclusions
In this study, first-principles calculations of the surface hydrogen H atom adsorption and diffusion behavior of H in the cubic crystal lattice of Ti3Sb (110) were performed (2 × 1 × 1, 2 × 2 × 2, 5 × 5 × 5 supercells). We performed first-principles calculation of the Ti3Sb–H electronic structure using the DFT SGGA-PBE method. Calculated relaxed lattice constant of Ti3Sb–H (hydrogen coverage (Θ) of the monolayer (ML) of the surface Θ = 0.25 ML; a = 5.217 Å) turned out to be in agreement with the known experimental data (a = 5.223 Å) of Ti3-хSbHх.
On the Ti3Sb (110) surface, three possible sites for hydrogen adsorption are considered: the H site on top (TS), site in the bridge bond between metal atoms (BS) of the surface, and the H site in the hollow site (HS) of the lattice (or in the HS hole position). For the first time, the adsorption energy of H on the surface of the crystal lattice of the Ti3Sb (110) compound was calculated. A more stable configuration of adsorption of H atoms with their coverage of = 0.25–1 ML is the hollow sites HS on the surface of the Ti3Sb lattice. The energetic stability of the hollow site for H adsorption is determined by the high coordination number of the hollow site containing H with the nearest neighboring atoms and the minimal repulsion between the electron orbitals of the metal and the hydrogen atoms. The adsorption energy of H at a coverage of = 0.25–1 ML of HS sites on the Ti3Sb (110) surface of the 2 × 1 × 1 Ti3Sb–Hads supercell is practically constant (= –0.55 eV) and increases with increasing supercell size.
From the DOS spectra of Ti3Sb–H it follows that the adsorption of H on the HS surface corresponds to chemical adsorption. With an increase in ML coverage from = 0.25 to 1, the adsorption energy of H first increases, which corresponds to a very weak state of physical adsorption, and then decreases. The adsorption energy of H on the top sites TS and bridge sites BS of the surface, as well as on hollow sites HS, remains constant in the Ti3Sb–Hads supercells. When H adatoms are located on the Ti–Ti regions, the value of is smaller than on the Ti–Sb regions of the supercells. This pattern is violated when the supercell size is reduced to the size of the primitive Ti3Sb–Hads cell.
Increasing the H coverage of the Ti3Sb (110) surface forms Ti3Sb1-xHx and Ti3-xSbHx solid solutions, in which the density of states changes, which increases stability and reduces the conductive properties. This is due to the interactions of Ti 3d–3d, Ti 3d–Sb 5p and Ti 3d (Sb 5p)–H 1s electrons. In the band structures of Ti3Sb1-xHx and Ti3-xSbHx, a narrow conductive band is localized near the Fermi level. Hydrogen absorption leads to increased localization of 3d states in Ti3Sb1-xHx and Ti3-xSbHx due to a decrease in the d–d overlap of Ti.
The calculated partial magnetic moment in Ti3Sb1-xHx solid solutions is small, 0.23 (Ti) at Ti–Ti sites and 0.28 (Ti) at Ti–Sb sites of the Ti3Sb0.98H0.02 lattice.
The calculated energy of the migration barrier for H along the tetrahedral site → tetrahedral site route in the Ti3Sb lattice is 1.57 eV. This energy, estimated by us taking into account the transition state model, corresponds to a saddle point on the dependence of the migration energy on the migration path for interstitial jumps of H atoms between two adjacent tetrahedral sites Ti.
The binding energy of a pair of substituted–interstitial Ti–Ti H sites is = –0.11 eV in Ti3Sb1-xHx. Increasing the H surface coverage from 0.25 to 1 ML reduces the Ti–Ti binding energy between these non-identical sites to = –0.14 eV.
The diffusion coefficient of H atoms in the ideal Ti3Sb (110) lattice, calculated by the MD method taking into account the transition state model, is = 1.4×10⁻⁸ exp(–0.17/) m2/s. This value is consistent with the values of in cubic structures of metals and alloys.
Thus, the results of this work are important for understanding the mechanism of interaction of H atoms with intermetallic surfaces. It provides a theoretical basis for further studies of intermetallic and/or hydride alloys, in particular, based on Ti3Sb for storing H2. The obtained data can be used to control the adsorption, diffusion, accumulation and storage of hydrogen in Ti-based intermetallic materials, taking into account the control and stabilization of the crystal structure.
Author Contributions
Conceptualization, methodology, writing-review and editing, analysis, investigation, S.M.A., S.N.M. and S.O.M. All authors have read and agreed to the published version of the manuscript.
Funding
funding publication in the journal "Surfaces", S.M.A.
Data Availability Statement
Not applicable.
Conflicts of Interest
The authors declare no conflicts of interest.
References
- Skripov, A.V.; Podlesnyak, A.A.; Fischer, P. Neutron diffraction study of the structure of the A15-type deuteride Ti3SbD2.6. J. Alloys Compd. 1994, 210, 27–29. [Google Scholar] [CrossRef]
- Chen, P.; Xiong, Z.T.; Luo, J.Z.; Lin, J.Y.; Tan, K.L. Interaction of hydrogen with metal nitrides and imides. Nature. 2002, 420, 302–304. [Google Scholar] [CrossRef] [PubMed]
- Zuttel, A.; Wenger, P.; Rentsch, S.; Sudan, P.; Mauron, P.; Emmenegger, C. LiBH4 a new hydrogen storage material. J. Power Sources. 2003, 118, 1–7. [Google Scholar] [CrossRef]
- Ichikawa, T.; Fujii, H.; Isobe, S.; Nabeta, K. Rechargeable hydrogen storage in nanostructured mixtures of hydrogenated carbon and lithium hydride. Appl. Phys. Lett. 2005, 86, 241914–241921. [Google Scholar] [CrossRef]
- Yvon, K.; Fischer, P. Crystal and magnetic structures of ternary metal hydrides: a comprehensive review. In Hydrogen in Intermetallic Compounds I; Schlapbach L., Ed. Springer-Verlag: Berlin, 1988; pp. 87–138.
- Buschow, K.H.J. Hydrogen absorption in intermetallic compounds. In Handbook on the Physics and Chemistry of Rare Earths; Gschneidner Jr. K. A., Eyring L., Eds. North Holland: Amsterdam; Volume 6, 1984; pp. 1–111.
- Principi, G.; Agresti, F.; Maddalena, A.; Lo Russo, S. The problem of solid state hydrogen storage. Energy. 2009, 34, 2087–2091. [Google Scholar] [CrossRef]
- Xu, R.; Cheng, T.; Li, C.; Yang, X.; Rong, J. Properties of Ti-Based Hydrogen Storage Alloy. J. Energy Power Eng. 2024, 12, 99–114. [Google Scholar] [CrossRef]
- Schlapbach, L.; Züttel, A. Hydrogen-storage materials for mobile applications. Nature. 2001, 414, 353–358. [Google Scholar] [CrossRef] [PubMed]
- Züttel, A. Materials for hydrogen storage. Materials Today. 2003, 6, 24–33. [Google Scholar] [CrossRef]
- Bowman, R.C.; Fultz, B. Metallic hydrides: hydrogen storage and other gas-phase applications. MRS Bull. 2002, 27, 688–698. [Google Scholar] [CrossRef]
- Huot, J.; Tremblay, M-L.; Schulz, R. Synthesis of nanocrystalline hydrogen storage materials. J. Alloys Compd. 2003, 356, 357–603.
- Steurer, W.; Dshemuchadse, J. Intermetallics: Structures, Properties, and Statistics. Oxford University Press 2016; 592 р. ISBN-13: 9780198714552.
- Asadov, M.M; Mammadova, S.O.; Guseinova, S.S.; Mustafaeva, S.N.; Lukichev, V.F. Ab initio calculation of the band structure and properties of modifications of the Ti3Sb compound doped with lithium. Phys. Solid State. 2022, 64, 1650–1665. [Google Scholar] [CrossRef]
- Wu, H.; Skripov, A.V.; Udovic, T.J.; Rush, J.J.; Derakhshan, S.; Kleinke, H. Hydrogen in Ti3Sb and Ti2Sb: Neutron vibrational spectroscopy and neutron diffraction studies. J. Alloys Compd. 2010, 496, 1–6. [Google Scholar] [CrossRef]
- Yvon, K.; Fischer, P. Crystal and magnetic structures of ternary metal hydrides: a comprehensive review. In Hydrogen in Intermetallic Compounds I; Schlapbach L., Ed. Springer-Verlag: Berlin, 1988; pp. 87–138.
- Miller, G.J.; Dissanayaka Mudiyanselage, R.S.; Xie, W. Theoretical investigations of hydrogen absorption in the A15 intermetallics Ti3Sb and Ti3IrZ. Naturforsch. 2021, 76, 819–826. [Google Scholar] [CrossRef]
- Chapai, R.; Smylie, M.P.; Hebbeker, H.; Chung, D.Y.; Kwok, W.-K.; Mitchell, J.F.; Welp, U. Superconducting properties and gap structure of the topological superconductor candidate Ti3Sb. Phys. Rev. B. 2023, 107, 104504. [Google Scholar] [CrossRef]
- Mandal, M.; Sajilesh, K.P.; Chowdhury, R.R.; Singh, D.; Biswas, P.K.; Hillier, A.D.; Singh, R.P. Superconducting ground state of the topological superconducting candidates Ti3X (X = Ir, Sb). Phy. Rev. B 2021, 103, 054501. [Google Scholar] [CrossRef]
- Kim, M.; Wang, C-Z.; Ho. K-M. Topological states in A15 superconductors. Phys. Rev. B 2019, 99, 224506–5. [CrossRef]
- Sasaki, K.; Li, H.W.; Hayashi, A.; Yamabe, J.; Ogura, T.; Lyth, S.M. Hydrogen Energy Engineering. Solid Hydrogen Storage Materials: Interstitial Hydrides. 2016, ch. 14, pp. 191–205. [CrossRef]
- Zhang, C. Hydrogen storage: Improving reversibility. Nat. Energy 2017, 2, 17064–17074. [Google Scholar] [CrossRef]
- Srinivasan, S.S.; Demirocak, D.E. Metal Hydrides used for Hydrogen Storage In: Chen, Y.P.; Bashir, S.; Liu, J.L. (eds) Nanostructured Materials for Next-Generation Energy Storage and Conversion. Springer, Berlin, Heidelberg. 2017, 225–255. [CrossRef]
- Belyakova, V.A.; Polukhin; Rigmant, L.K. Effect of Hydrogen on the Interatomic Interactions of Elements in Metal Alloys and the Physicochemical Properties of the Related Articles. Russ. Metall. (Met.). 2020, 20, 859–869. [CrossRef]
- Balmeo, M.M.; Dizon, J.S.C.; Empizo, M.J.F.; Solibet, E.J.C.D.; Agulto, V.C.; Salvador, A.A.; Sarukura, N.; Nakanishi, H.; Kasai, H.; Padama, A.A.B. Density functional theory-based investigation of hydrogen adsorption on zinc oxide (100)surface: Revisited. Surf. Sci. 2021, 703, 121726. [Google Scholar] [CrossRef]
- Marian, J.; Wirth, B.D.; Odette, G.R.; Perlado, J.M. Cu diffusion in α-Fe: determination of solute diffusivities using atomic-scale simulations. Comput. Mater. Sci. 2004, 31, 347–367. [Google Scholar] [CrossRef]
- Yang, K.J.; Liu, Y.-L.; Liu, N.; Shao, P.; Zhang, X.; Ma, Y. Hydrogen Transport in Tungsten for Nuclear Energy Application: Temperature Dependence and Compensation Effect. Fusion Sci. Technol. 2020, 1–16. [Google Scholar] [CrossRef]
- Mehrer, H. Diffusion in Solids. Springer Science & Business Media, 2007. 654 p. Springer-Verlag Berlin Heidelberg. 2007. ISBN: 978-3-540-71486-6.
- Connétable, D.; David, M. Diffusion of interstitial species (H and O atoms) in fcc systems (Al, Cu, Co, Ni and Pd): Contribution of first and second order transition states. J. Alloys Compd. 2018, S0925838818332717. [Google Scholar] [CrossRef]
- David, M.; Prillieux, A.; Monceau, D.; Connétable, D. First-principles study of the insertion and diffusion of interstitial atoms (H, C, N and O) in nickel. J. Alloys Compd. 2020, 822, 153555. [Google Scholar] [CrossRef]
- Wei, Y.X.; Gao, N.; Wang, D.; Chen, C.; Guo, L.P. Effect of hydrogen atom concentration on hydrogen migration and bubble evolution in bcc iron. Nucl. Instrum. Methods Phys. Res. B.: Beam Interactions with Materials and Atoms. 2019, 461, 83–87. [Google Scholar] [CrossRef]
- Li, Liuliu; Shi, Jingyi; Peng, Lei; Jiang, Wei; Qian, Guian. Formation and migration of helium pair in bcc Fe from first principle calculations. Comput. Mater. Sci. 2019, 170, 109192–09198. [CrossRef]
- Riot, A.; Virot, F.; Connétable, D. Solubility and diffusivity of hydrogen and its isotopes in the BeO system. J. Am. Ceram. Soc. 2023, 106, 5005–5021. [Google Scholar] [CrossRef]
- Kasai, H., Padama, A.A.B., Chantaramolee, B., Arevalo, R.L. Behavior of Hydrogen and Hydrogen-Containing Molecules on Metal Surfaces. In: Hydrogen and Hydrogen-Containing Molecules on Metal Surfaces. Springer Series in Surface Sciences, Springer, Singapore. 2020; Volume l 71. pp. 31–72. [CrossRef]
- Monkhorst, H.J.; Pack, J.D. Special points for the brilluoin zone integrations. Phys. Rev. B. 1976, 13, 5188–5192. [Google Scholar] [CrossRef]
- Perdew, J.; Burke, K.; Ernzerhof, M. Generalized gradient approximation made simple. Phys. Rev. Lett. 1997, 78, 1396–1403. [Google Scholar] [CrossRef]
- Kresse, G.; Joubert, D. From ultrasoft pseudopotentials to the projector augmented-wave method, Phys. Rev. B. 1999, 59, 1758–1766. [Google Scholar] [CrossRef]
- Kresse, G.; Furthmüller, J. Efficient iterative schemes for ab initio total-energy calculations using a plane-wave basis set. Phys. Rev. B. 1996, 54, 11169–11186. [Google Scholar] [CrossRef]
- Perdew, J.P.; Ruzsinszky, A.; Csonka, G.I.; Vydrov, O.A.; Scuseria, G.E.; Constantin, L.A.; Zhou, X.; Burke, K. Restoring the density-gradient expansion for exchange in solids and surfaces. Phys. Rev. Lett. 2008, 100, 136406–136410. [Google Scholar] [CrossRef] [PubMed]
- Pfrommer, B.G.; Cote, M.; Louie, S.G.; Cohen, M.L. Relaxation of crystals with the quasi-newton methodJ. Comput. Phys. 1997, 131, 233–240. [Google Scholar] [CrossRef]
- Ramakrishnan, S.; Chandra, G. Normal state resistivity and Tc studies of superconducting Ti1−xSbx system. Phys. Lett. 1984, 100, 441–444. [Google Scholar] [CrossRef]
- Papadimitriou, I.; Utton, C.; Scott, A.; Tsakiropoulos, P. Ab Initio study of binary and ternary Nb3(X,Y) A15 ıntermetallic phases (X,Y = Al, Ge, Si, Sn). Metall. Mater. A. 2015, 46, 566–576. [Google Scholar] [CrossRef]
- Asadov, S.M. Molecular dynamics modeling of a ternary semiconductor compound in a liquid state. CSK Sci. J. Phys. Chem. 2023, 1, 01–08. [Google Scholar]
- Nordlander, P.; Holloway, S.; Norskov, J.K. Hydrogen adsorption on metal surfaces. Surf. Sci. 1984, 136, 59–81. [Google Scholar] [CrossRef]
- Pisarev, A.A. Hydrogen adsorption on the surface of metals. In Gaseous Hydrogen Embrittlement of Materials in Energy Technologies. Edited by R.P. Gangloff and B.P. Somerday. Woodhead Publishing Series in Metals and Surface Engineering. 2012; Volume 1. 3–26. [CrossRef]
- Ferrin, P; Kandoi, S.; Nilekar, A.U.; Mavrikakis M. Hydrogen adsorption, absorption and diffusion on and in transition metal surfaces: A DFT study. Surf. Sci. 2012, 606, 679–689. [CrossRef]
- Padama, A.A.B.; Nakanishi, H.; Kasai, H. Quantum states of hydrogen atom on Pd(110) surface. Appl. Surf. Sci. 2015, 359, 687–691. [Google Scholar] [CrossRef]
- Alvarez-Falcon, L.; Vines, F.; Notario-Estevez, A.; Illas, F. On the hydrogen adsorption and dissociation on Cu surfaces and nanorows. Surf. Sci. 2015, S0039602815002253. [Google Scholar] [CrossRef]
- Kolasinski, K.W. Surface Science: Foundations of Catalysis and Nanoscience. Third Edition. Published 2012 by John Wiley & Sons, Ltd. Surface and Adsorbate Structure. 2012, 9–49. [CrossRef]
- Fernández, C.; Bion, N.; Gaigneaux, E.M.; Duprez, D.; Ruiz, P. Kinetics of hydrogen adsorption and mobility on Ru nanoparticles supported on alumina: Effects on the catalytic mechanism of ammonia synthesis. J. Catal. 2016, 344, 16–28. [Google Scholar] [CrossRef]
- Li, J.; Liu, Y.; Zhang, J.; Liang, X.; Duan, H. Density functional theory study of the adsorption of hydrogen atoms on Cu2X (X=3d) clusters. Chem. Phys. Lett. 2016, 651, 137–143. [Google Scholar] [CrossRef]
- Fellah, M.F. A DFT study of hydrogen adsorption on Be, Mg and Ca frameworks in erionite zeolite. Appl. Surf. Sci. 2017, 394, 9–15. [Google Scholar] [CrossRef]
- Yu, H.L.; Tang, T.; Zheng, S.T.; Shi, Y.; Qiu, R.Z.; Luo, W.H.; Meng, D.Q. A theoretical study of hydrogen atoms adsorption and diffusion on PuO2 (110) surface. J. Alloys Compd. 2016, 666, 287–291. [Google Scholar] [CrossRef]
- Maeyama, Y.; Kadota, K.; Kitayama, A.; Tozuka, Y.; Yoshida, M.; Shimosaka, A.; Shirakawa, Y. Theoretical study of the temperature dependent hydrogen storage capacity of Pd and Ti nanoparticles. Int. J. Hydrog. Energy. 2017, S0360319917306420. [Google Scholar] [CrossRef]
- Zhang, L.; Qiao, L.; Bligaard, T.; Su, Y. A first-principle study of H adsorption and absorption under the influence of coverage. Appl. Surf. Sci. 2018, 457, 280–286. [Google Scholar] [CrossRef]
- Lousada, C.M.; Kotasthane, A.M. Hydrogen adsorption on fcc metal surfaces towards the rational design of electrode materials. Sci Rep. 2024, 14, 20972. [Google Scholar] [CrossRef]
- Shelyapina, M.G.; Vyvodtceva, A.V.; Klyukin, K.A.; Bavrina, O.O.; Chernyshev, Yu.S.; Privalov, A.F.; Fruchart, D. Hydrogen diffusion in metal-hydrogen systems via NMR and DFT. Int. J. Hydrog. Energy. 2015, S0360319915014172. [Google Scholar] [CrossRef]
- Alvaro, A.; Thue, J.I.; Kheradmand, N.; Lovvik, O.M.; Olden, V. Hydrogen embrittlement in nickel, visited by first principles modeling, cohesive zone simulation and nanomechanical testing. Int. J. Hydrog. Energy. 2015, S0360319915015542. [Google Scholar] [CrossRef]
- Merlino, A. R.; Luna, C.R.; Juan, A.; Pronsato, M.E. A DFT study of hydrogen storage in Zr(Cr0.5Ni0.5)2 Laves phase. Int. J. Hydrog. Energy. 2015, S036031991530968X. [Google Scholar] [CrossRef]
- Domain, C. Ab initio modelling of defect properties with substitutional and interstitials elements in steels and Zr alloys. J. Nucl. Mater. 2006, 351, 1–19. [Google Scholar] [CrossRef]
- Becquart, C.S.; Domain, C. Ab initio calculations about intrinsic point defects and He in W. Nucl. Instrum. Methods Phys. Res. B. 2007, 255, 23–26. [Google Scholar] [CrossRef]
- Nazarov, R.; Hickel, T.; Neugebauer, J. Ab initio study of H-vacancy interactions in fcc metals: Implications for the formation of superabundant vacancies. Phys. Rev. B. 2014, 89, 144108. [Google Scholar] [CrossRef]
- Johnson, D.F.; Carter, E.A. First-principles assessment of hydrogen absorption into FeAl and Fe3Si: Towards prevention of steel embrittlement. Acta Mater. 2010, 58, 638–648. [Google Scholar] [CrossRef]
- Hao, M.; Fu, Y.; Hu, Q.; Lu, X.; Zhang, H.; Ba, Y.; Xie, Y.; Liu, K.; Li, D. Investigation of the hydrogen adsorption properties on titanium metal under vacuum conditions. J. Ind. Eng. Chem. 29 Oct. 2024. [Google Scholar] [CrossRef]
- Kulkov, S.S.; Eremeev, S.V.; Kulkova, S.E. Hydrogen Adsorption on Low-Index Surfaces of B2 Titanium Alloys. Phys. Solid State, 2009, 51, 1281–1289. [Google Scholar] [CrossRef]
- Salvadori, E.; Chiesa, M.; Buonerba, A.; Grassi, A. Structure and dynamics of catalytically competent but labile paramagnetic metal-hydrides: the Ti(III)-H in homogeneous olefin polymerization. Chem. Sci., 2020, 11, 12436–12445. [Google Scholar] [CrossRef]
- Henkelman, G.; Uberuaga, B.P.; Jonsson, H. A climbing image nudged elastic band method for finding saddle points and minimum energy paths. J. Chem. Phys. 2000, 113, 9901–9904. [Google Scholar] [CrossRef]
- Dolan, M.D. Non-Pd BCC alloy membranes for industrial hydrogen separation. Membr Sci. 2010, 362, 12–28. [Google Scholar] [CrossRef]
Figure 1.
The unit cell of the cubic structure A15 of the compound A3B (a), three types of orthogonal linear chains (b) of atoms of type A and plane (110) of the surface of a cubic crystal (с).
Figure 1.
The unit cell of the cubic structure A15 of the compound A3B (a), three types of orthogonal linear chains (b) of atoms of type A and plane (110) of the surface of a cubic crystal (с).

Figure 2.
Structural environment for the 6(d) site of H (black sphere) in the A15 Ti3Sb–H structure. The sites of the Ti (blue), Sb (green), and 24(k) (red and gray) atoms. The four red atoms at the 24(k) sites occupy (Ti3Sb) tetrahedra, which share faces with (Ti4) tetrahedra surrounding each 6(d) site.
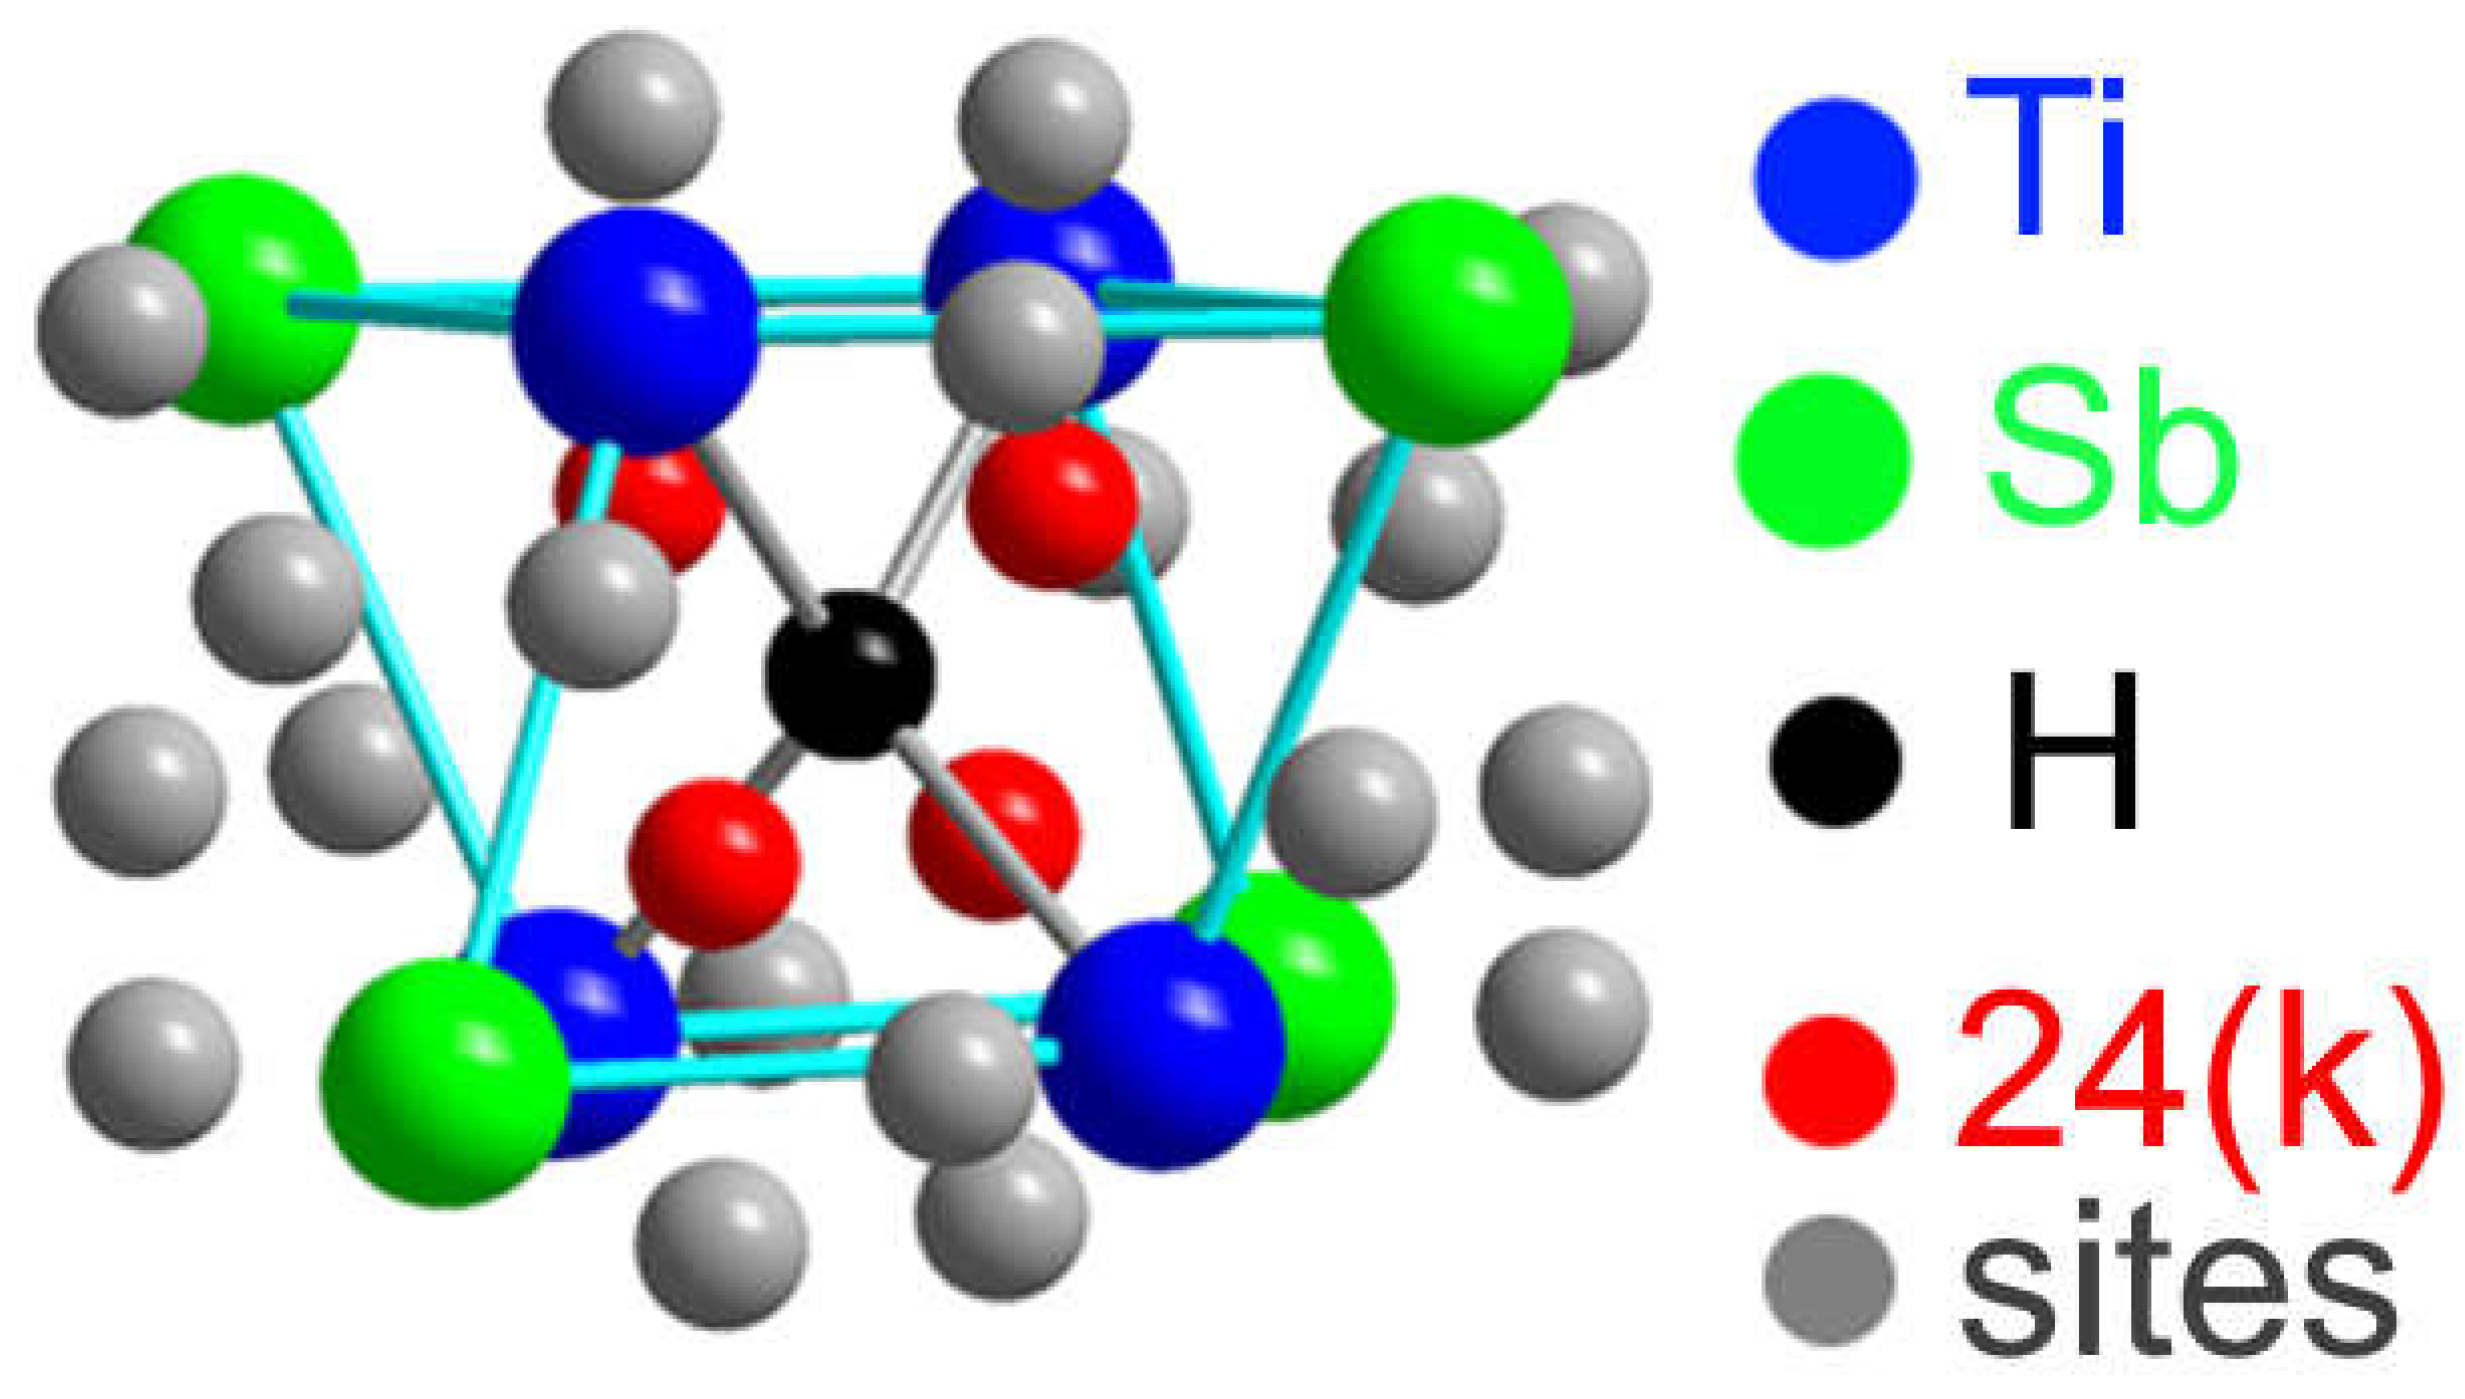
Figure 3.
DFT SGGA calculated atomic structure of A15 compound Ti3Sb containing hydrogen atom. (a) Arrangement of atoms in the A15 structure of Ti3Sb, (b) H atom is adsorbed on the surface in crystallographic site with Ti–Ti bond of primitive cell of Ti3Sb, (c) H atom is adsorbed on the surface in crystallographic site with Ti–Ti bond in 2 × 1 × 1 Ti3Sb supercell, (d) H atom is adsorbed on the surface in crystallographic site with Ti–Sb bond in 2 × 1 × 1 Ti3Sb supercell.
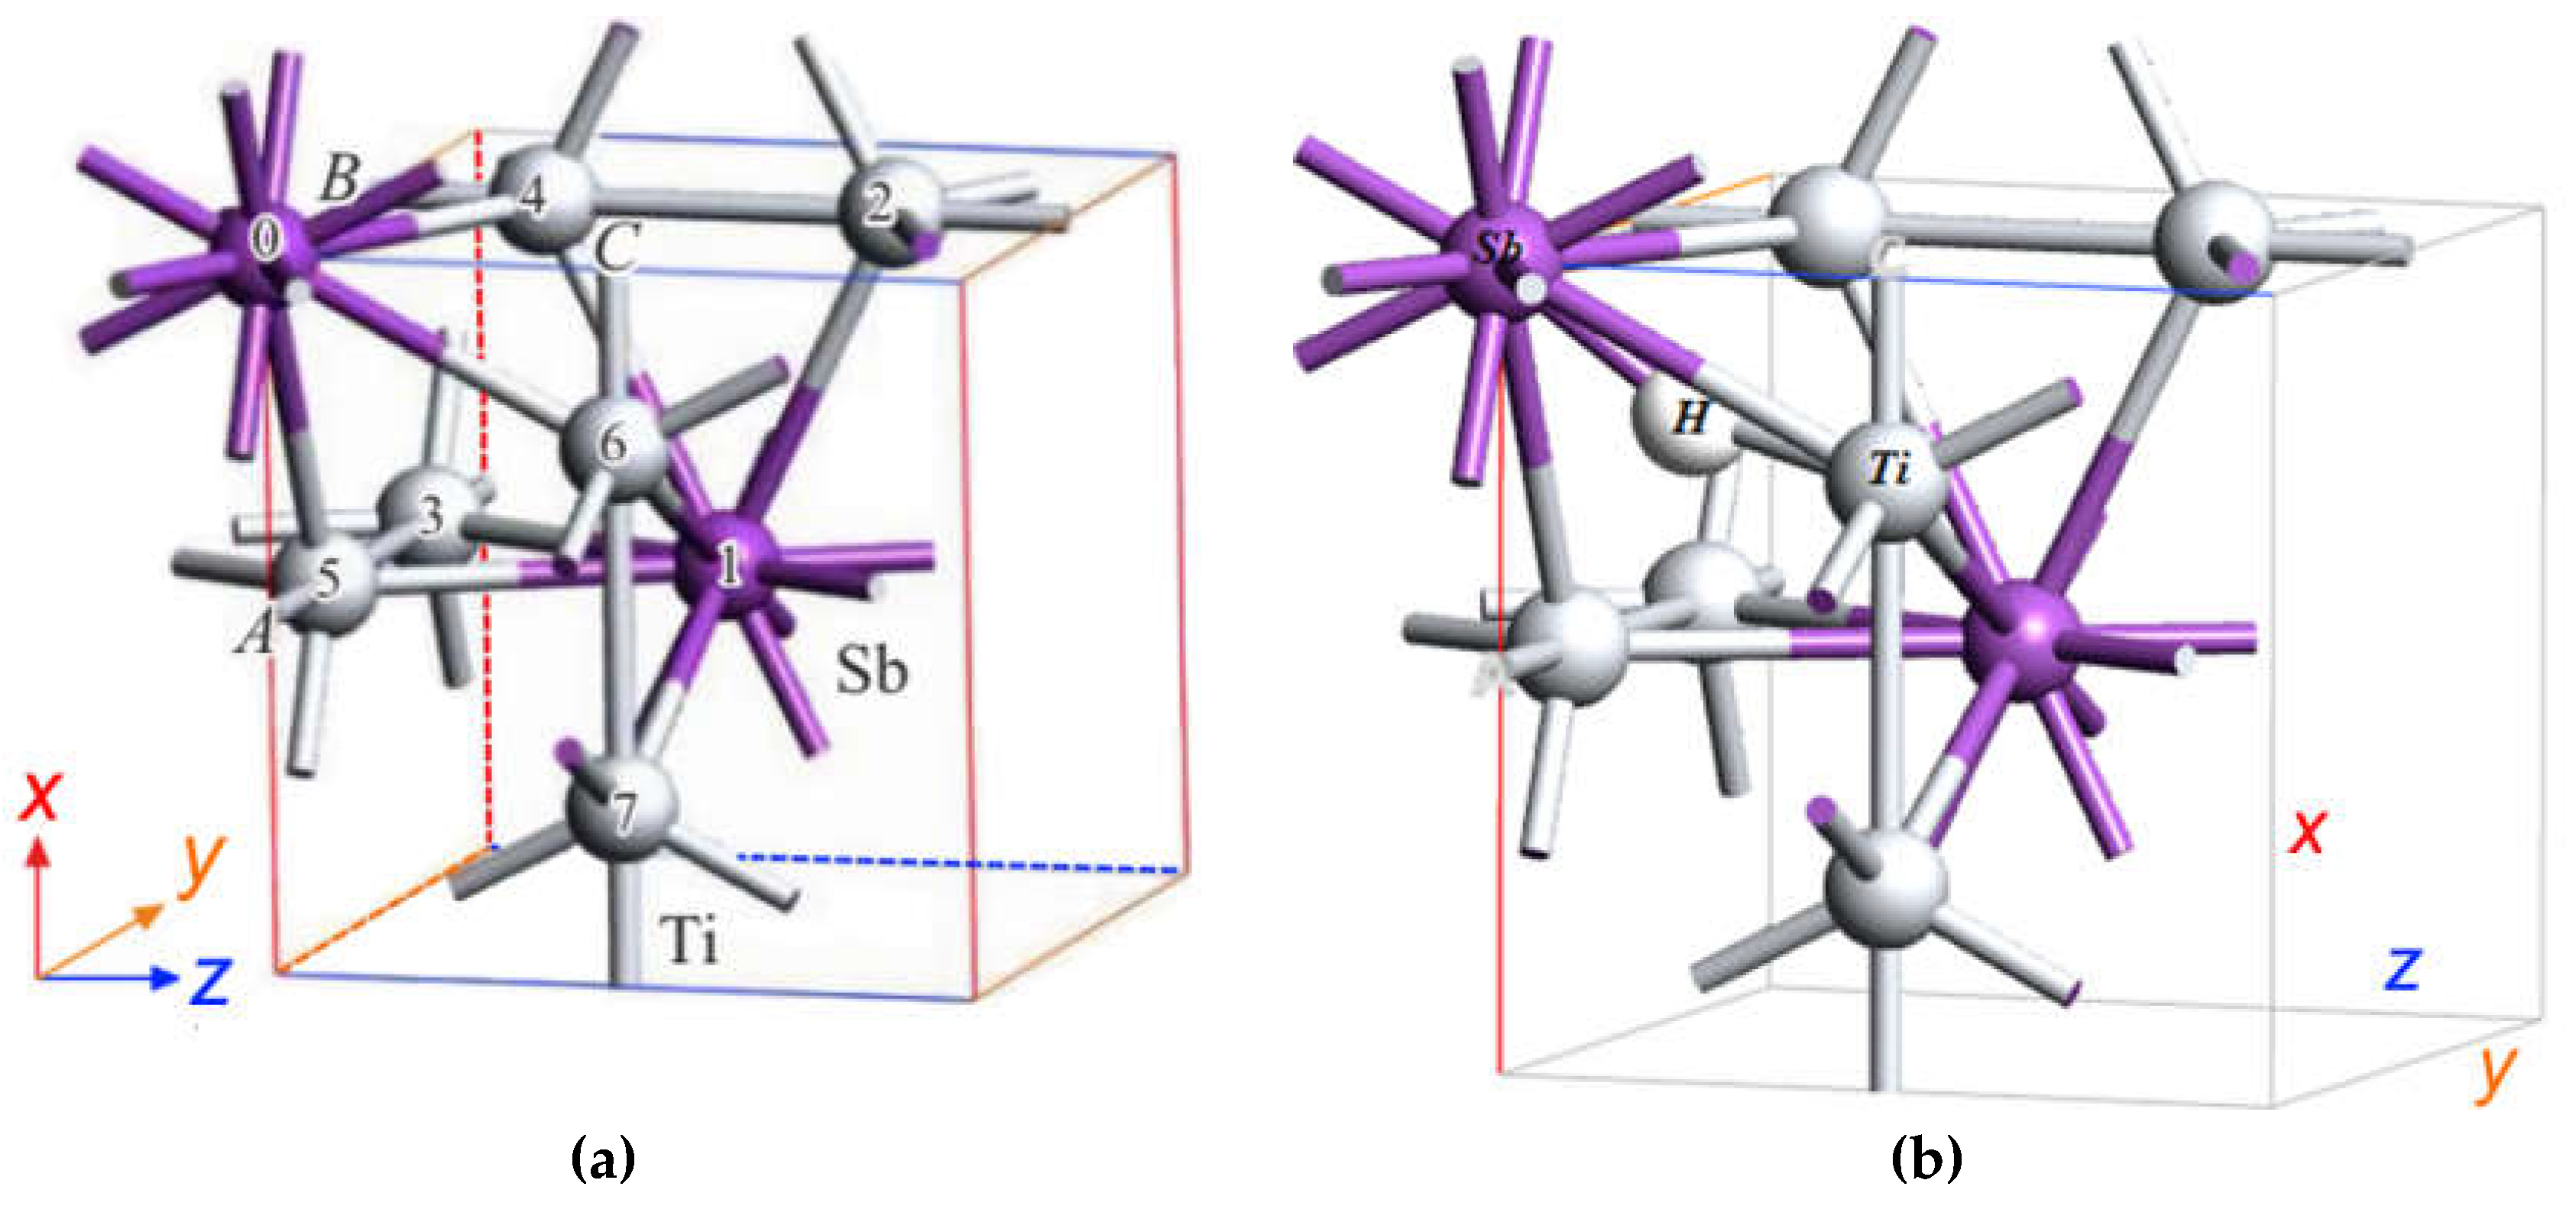
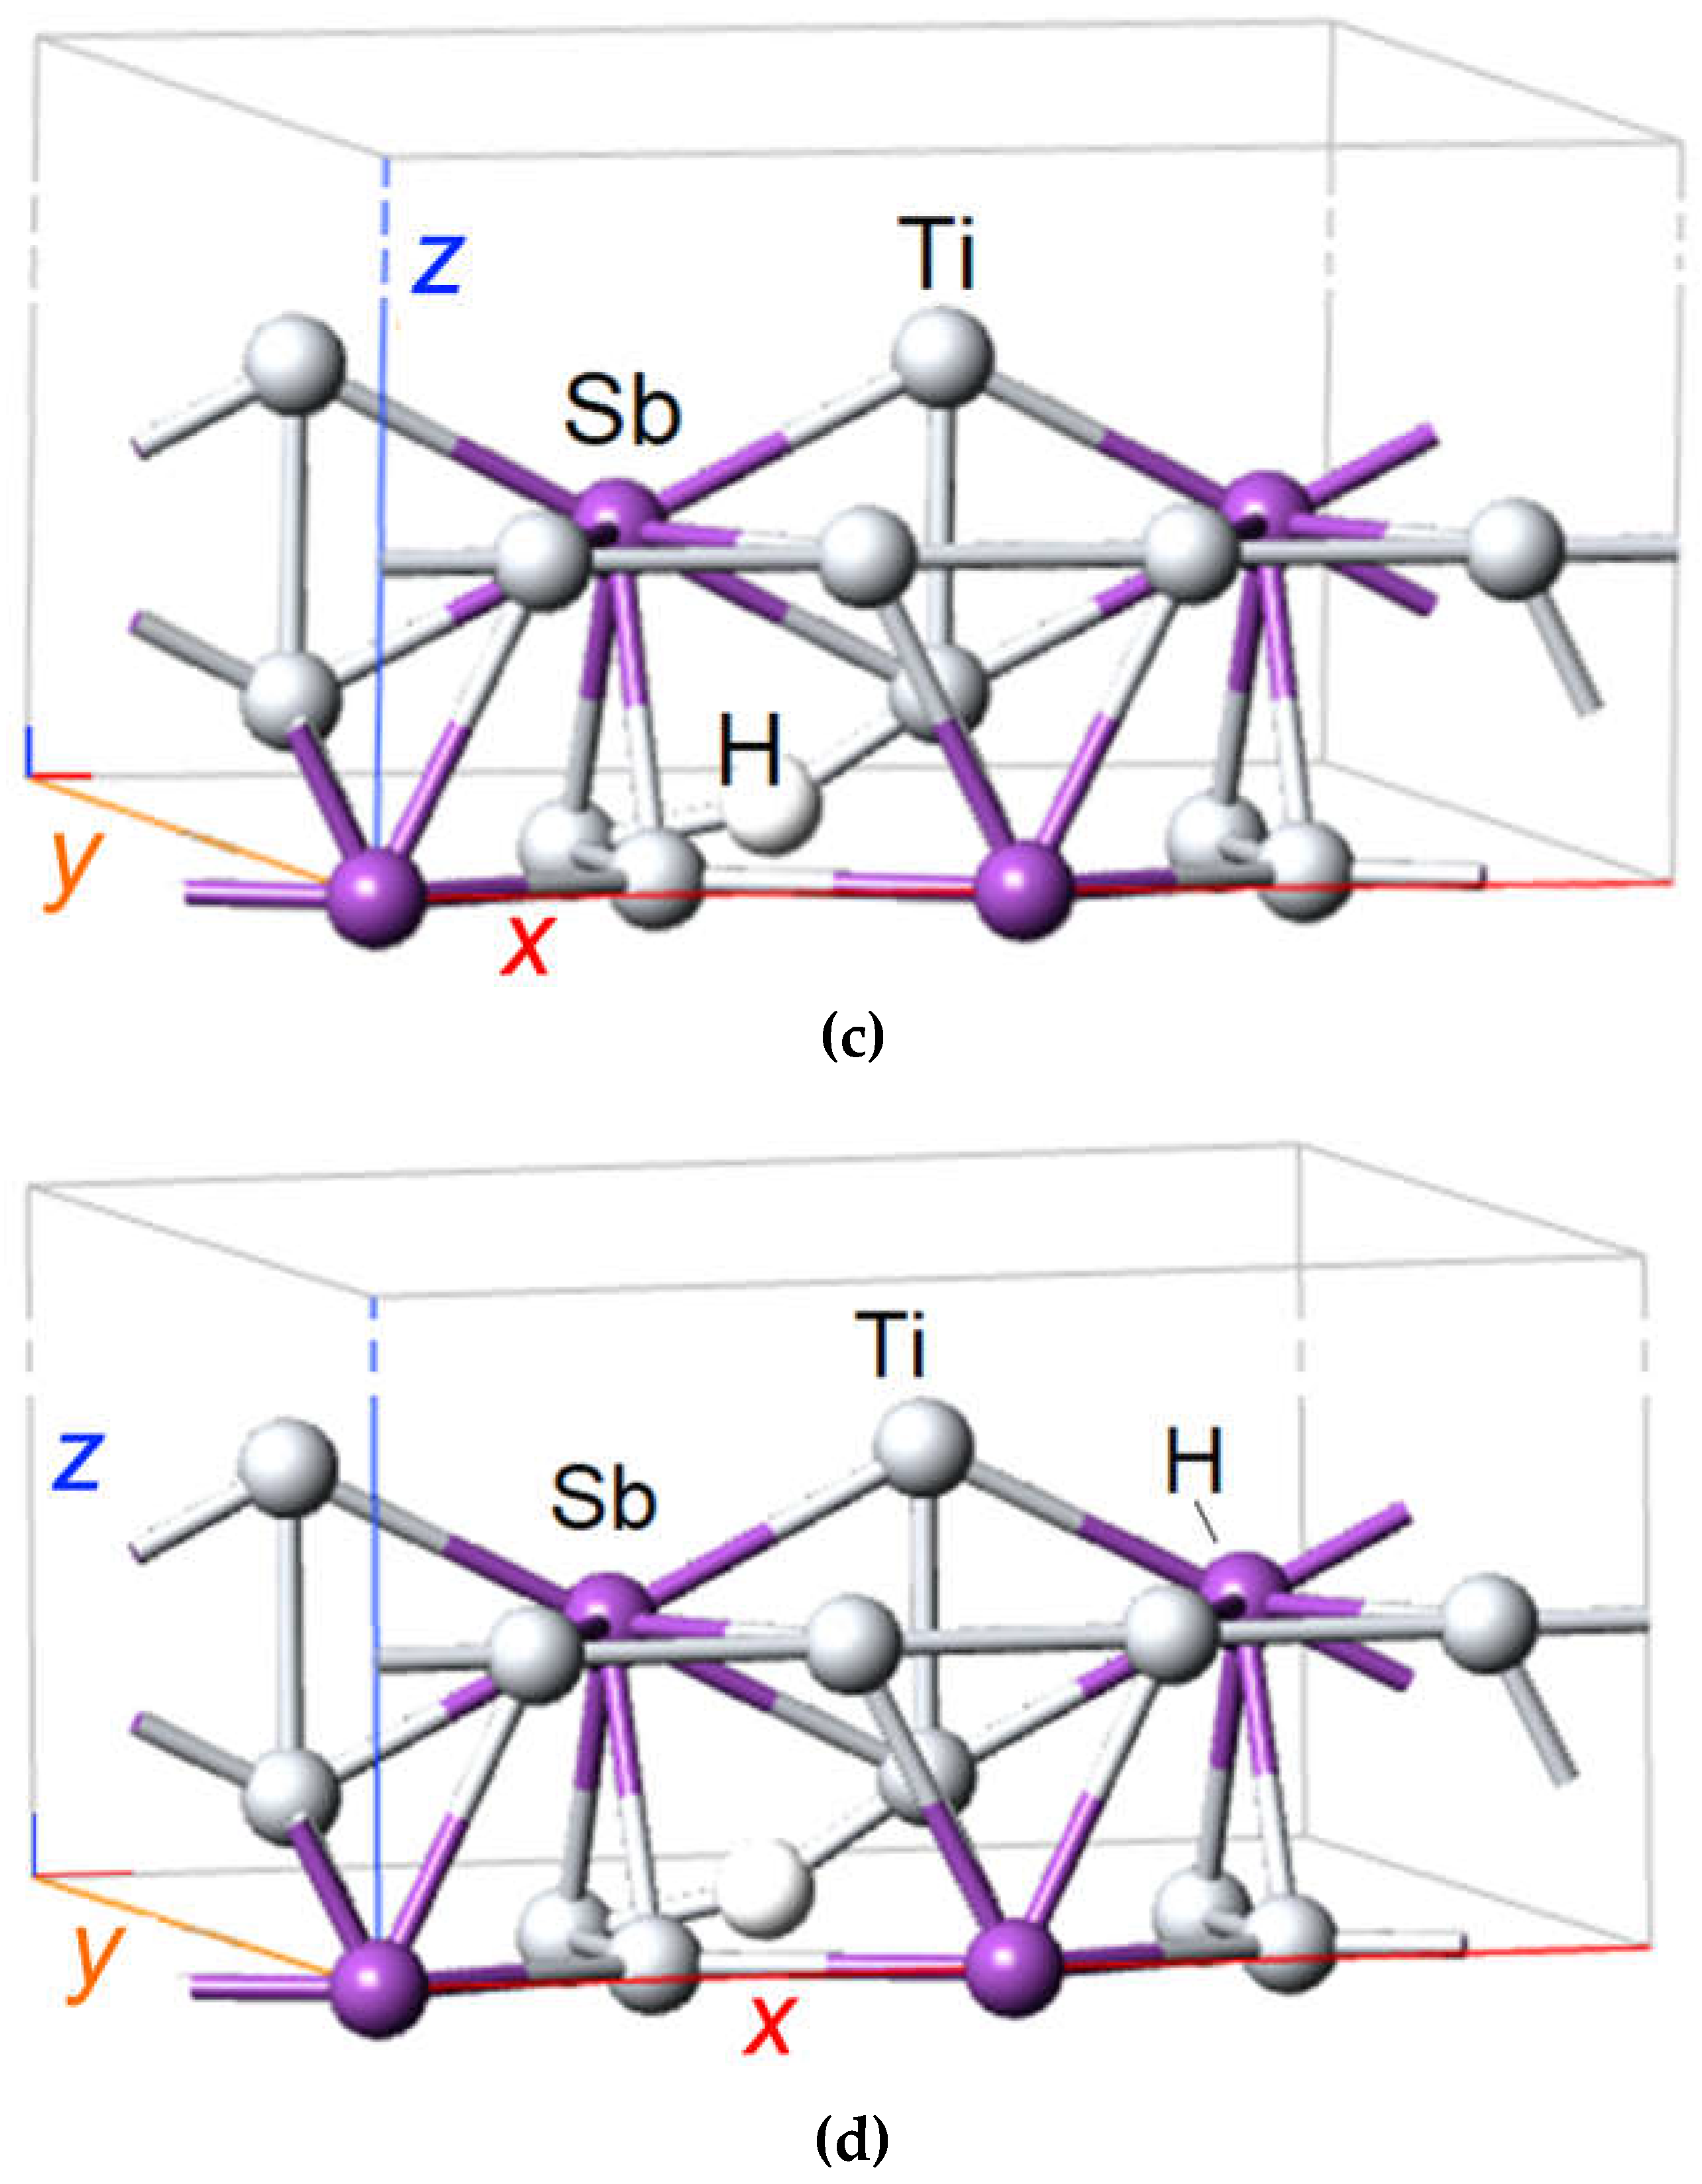
Figure 4.
Crystal plane (110) of a cubic crystal with Miller indices [49].
Figure 4.
Crystal plane (110) of a cubic crystal with Miller indices [49].

Figure 5.
DFT SGGA-PBE calculated band structure of 2 × 2 × 2 supercell of A15 Ti3Sb–Н (space group ; = 0.25 ML) along highly symmetric directions in the first Brillouin zone near the Fermi energy EF = 0 eV.
Figure 5.
DFT SGGA-PBE calculated band structure of 2 × 2 × 2 supercell of A15 Ti3Sb–Н (space group ; = 0.25 ML) along highly symmetric directions in the first Brillouin zone near the Fermi energy EF = 0 eV.
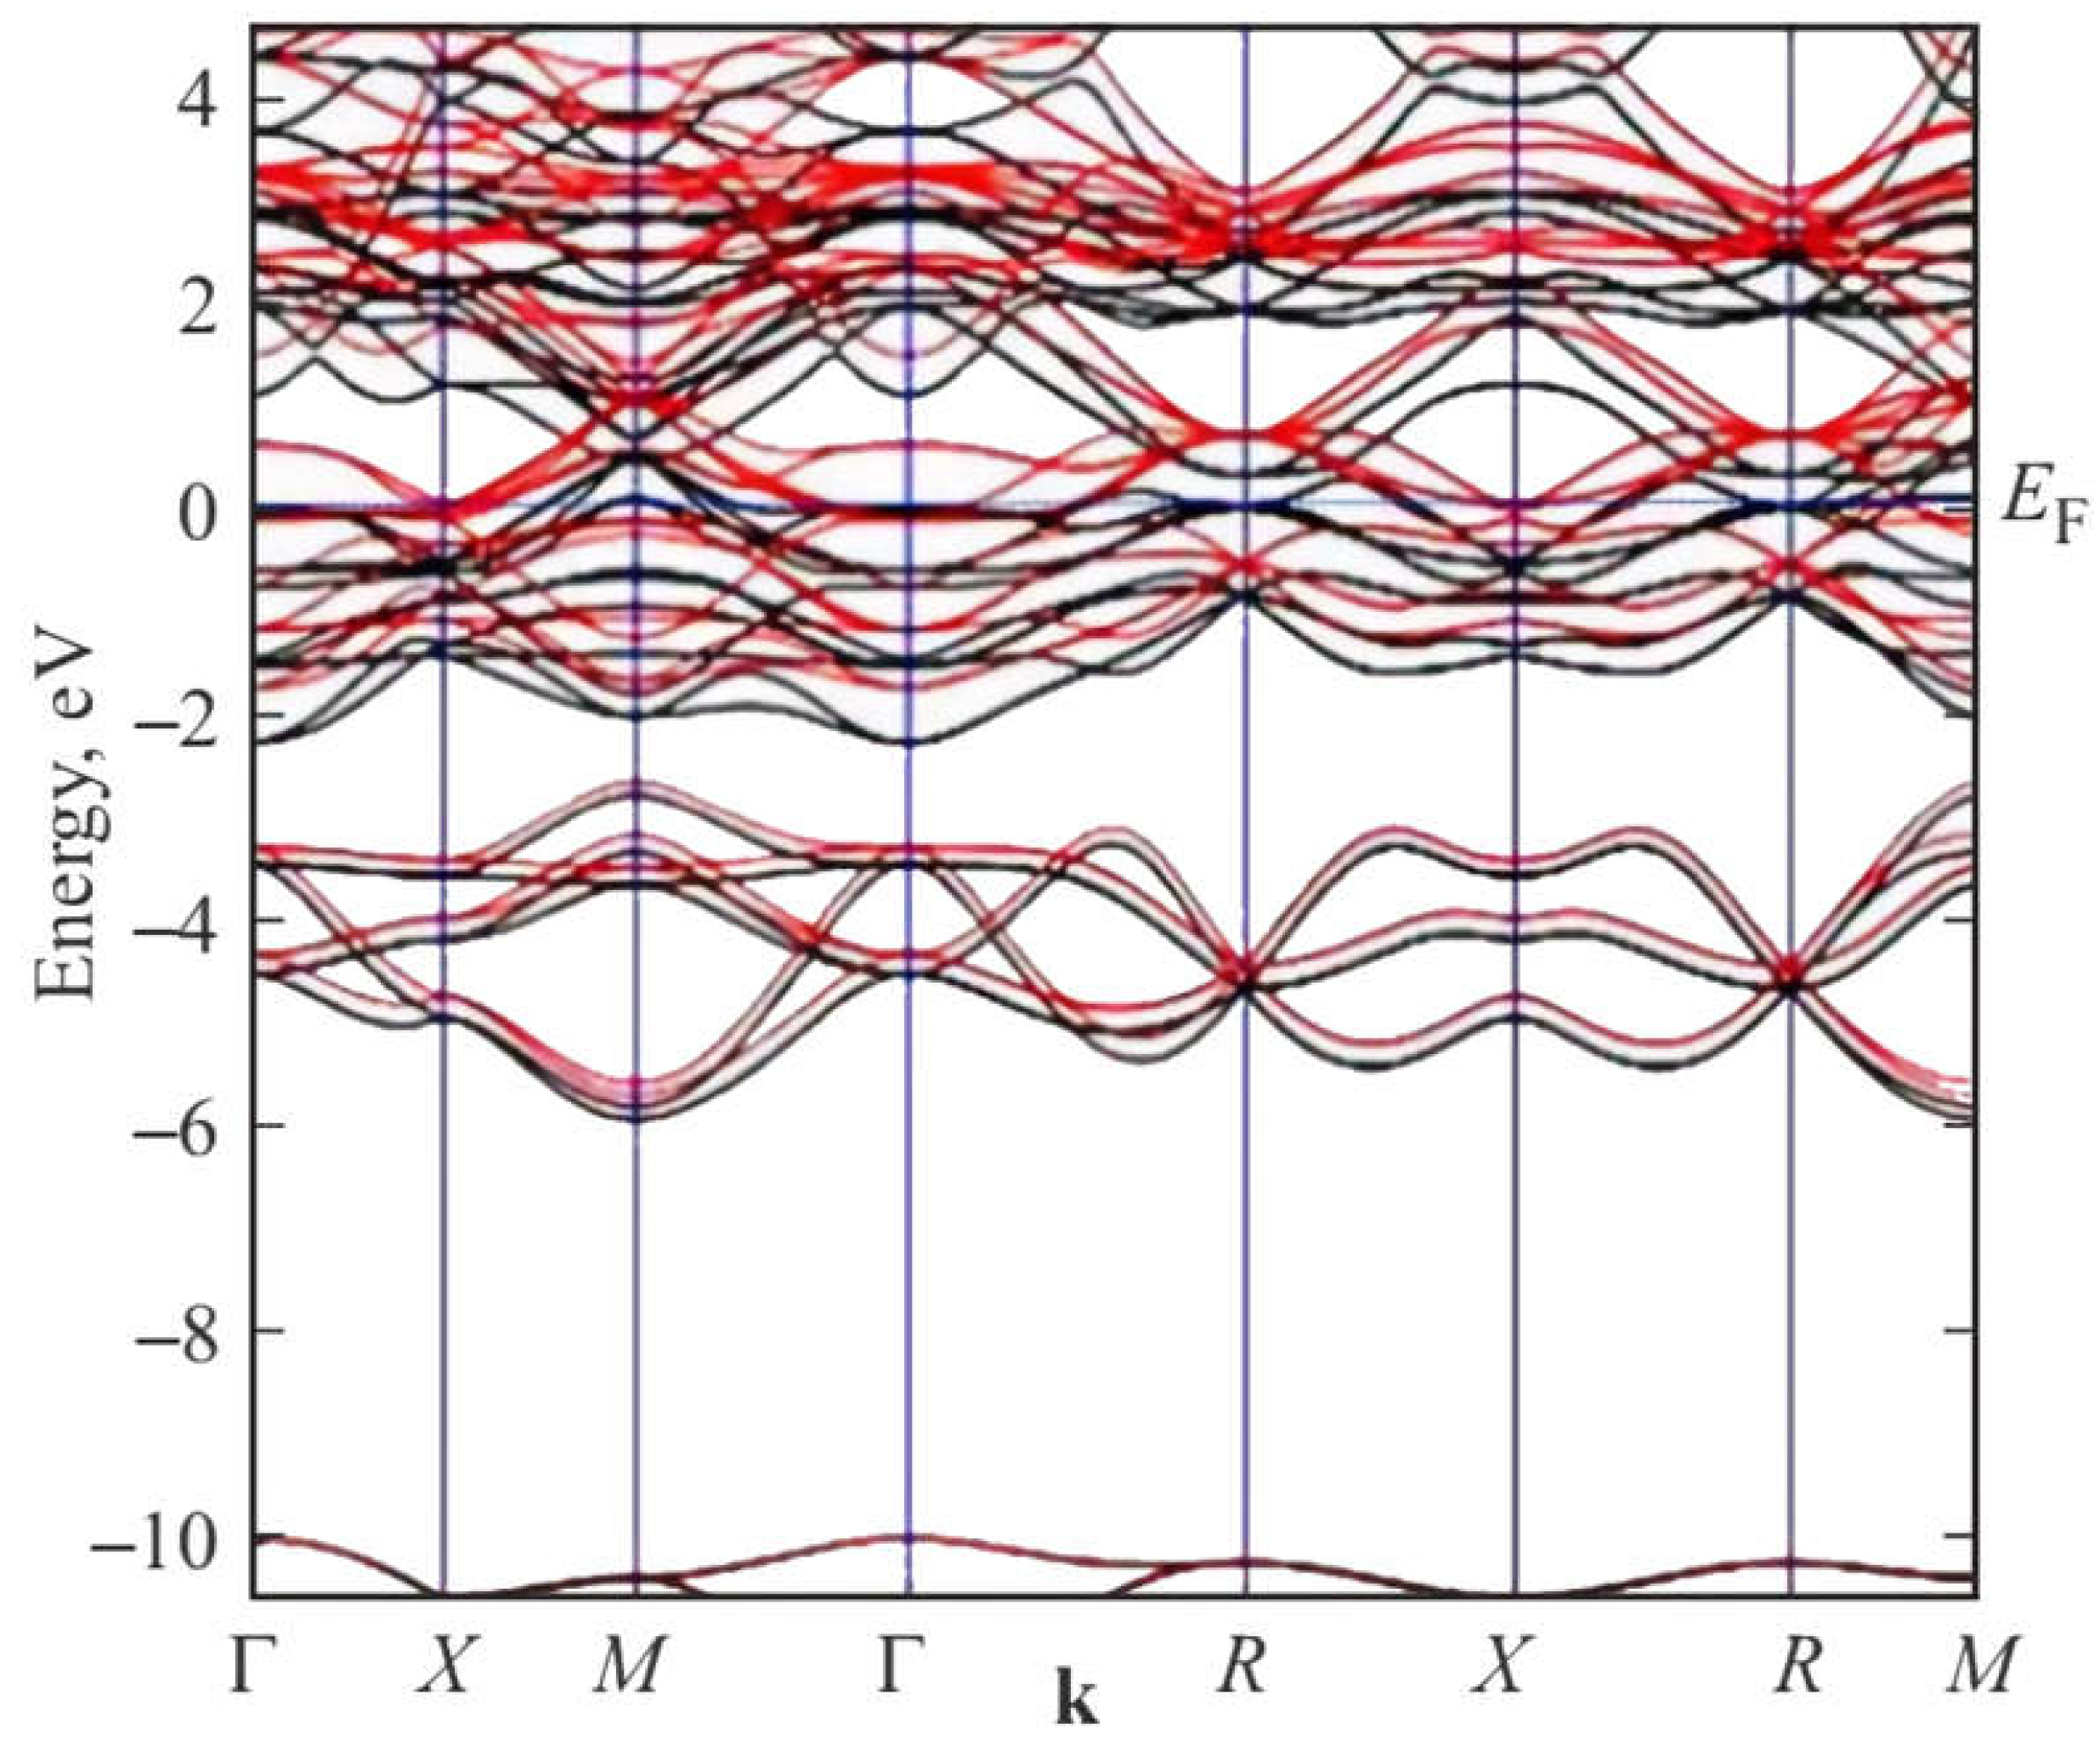
Figure 6.
Partial density of states (PDOS) for: (a) Ti atom of pure Ti3Sb (110) surface and (b) surfaces with H–Ti bond supercells 2 × 2 × 2 with Θ = 0.25 ML. Energy is given relative to the Fermi level (eV). Fermi level (EF) is indicated by the dashed vertical line at 0 eV.
Figure 6.
Partial density of states (PDOS) for: (a) Ti atom of pure Ti3Sb (110) surface and (b) surfaces with H–Ti bond supercells 2 × 2 × 2 with Θ = 0.25 ML. Energy is given relative to the Fermi level (eV). Fermi level (EF) is indicated by the dashed vertical line at 0 eV.
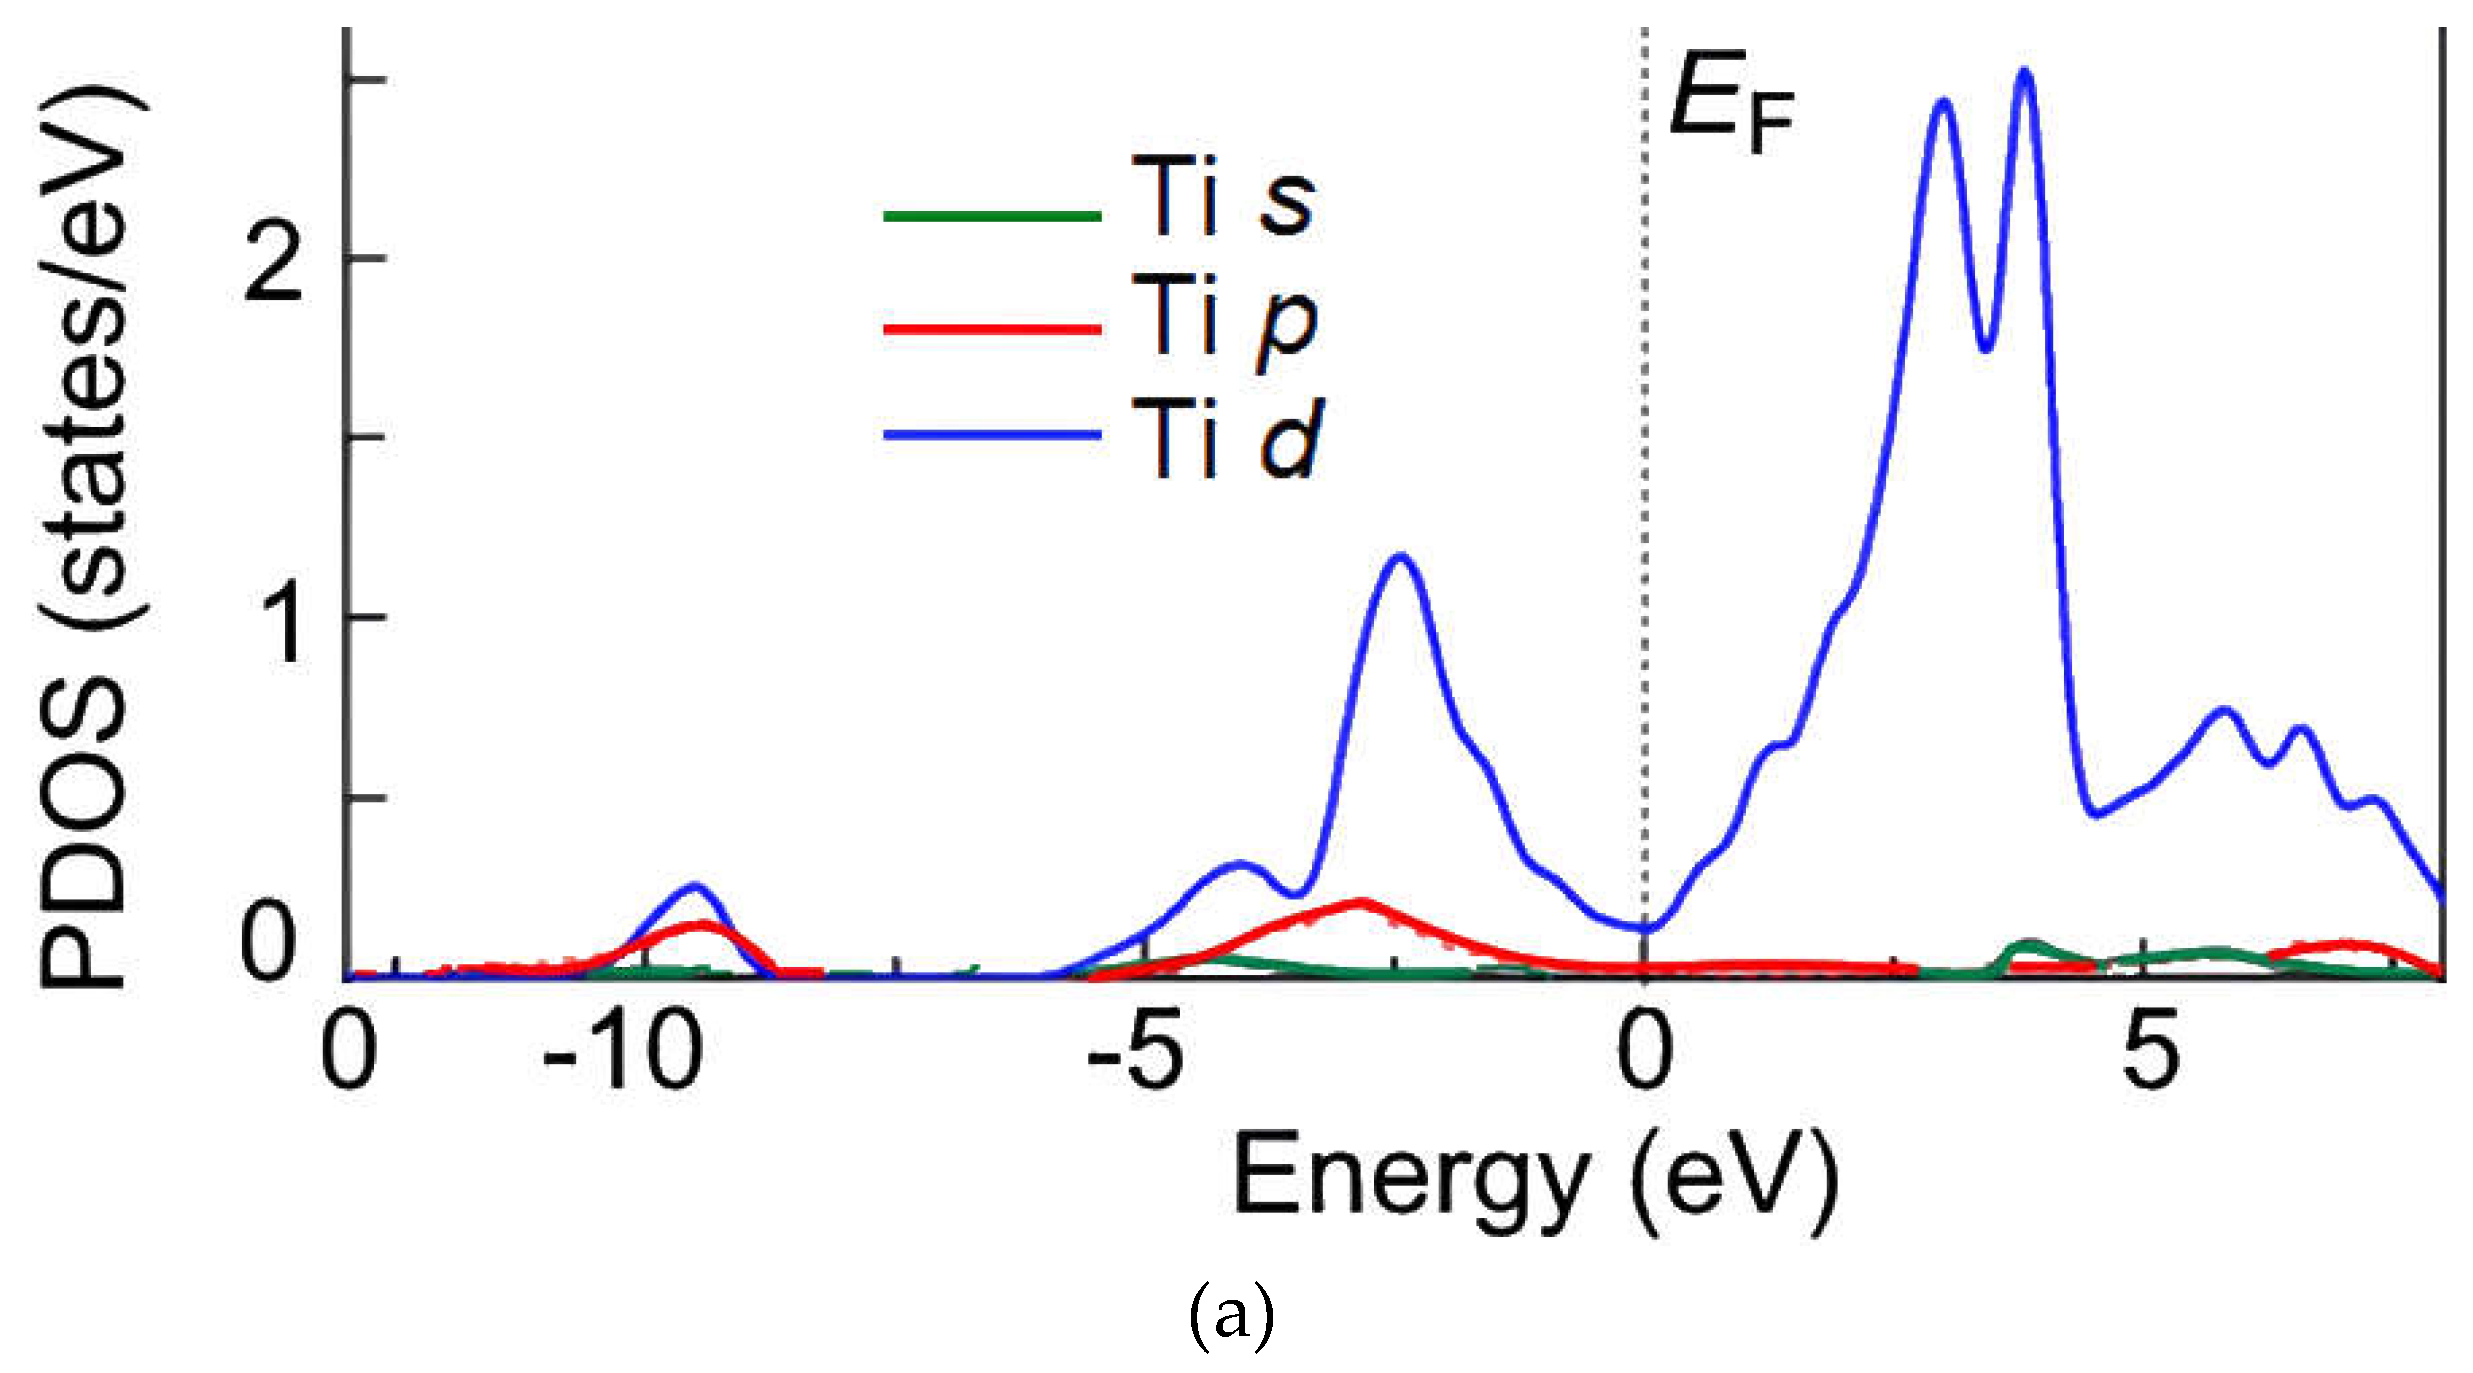
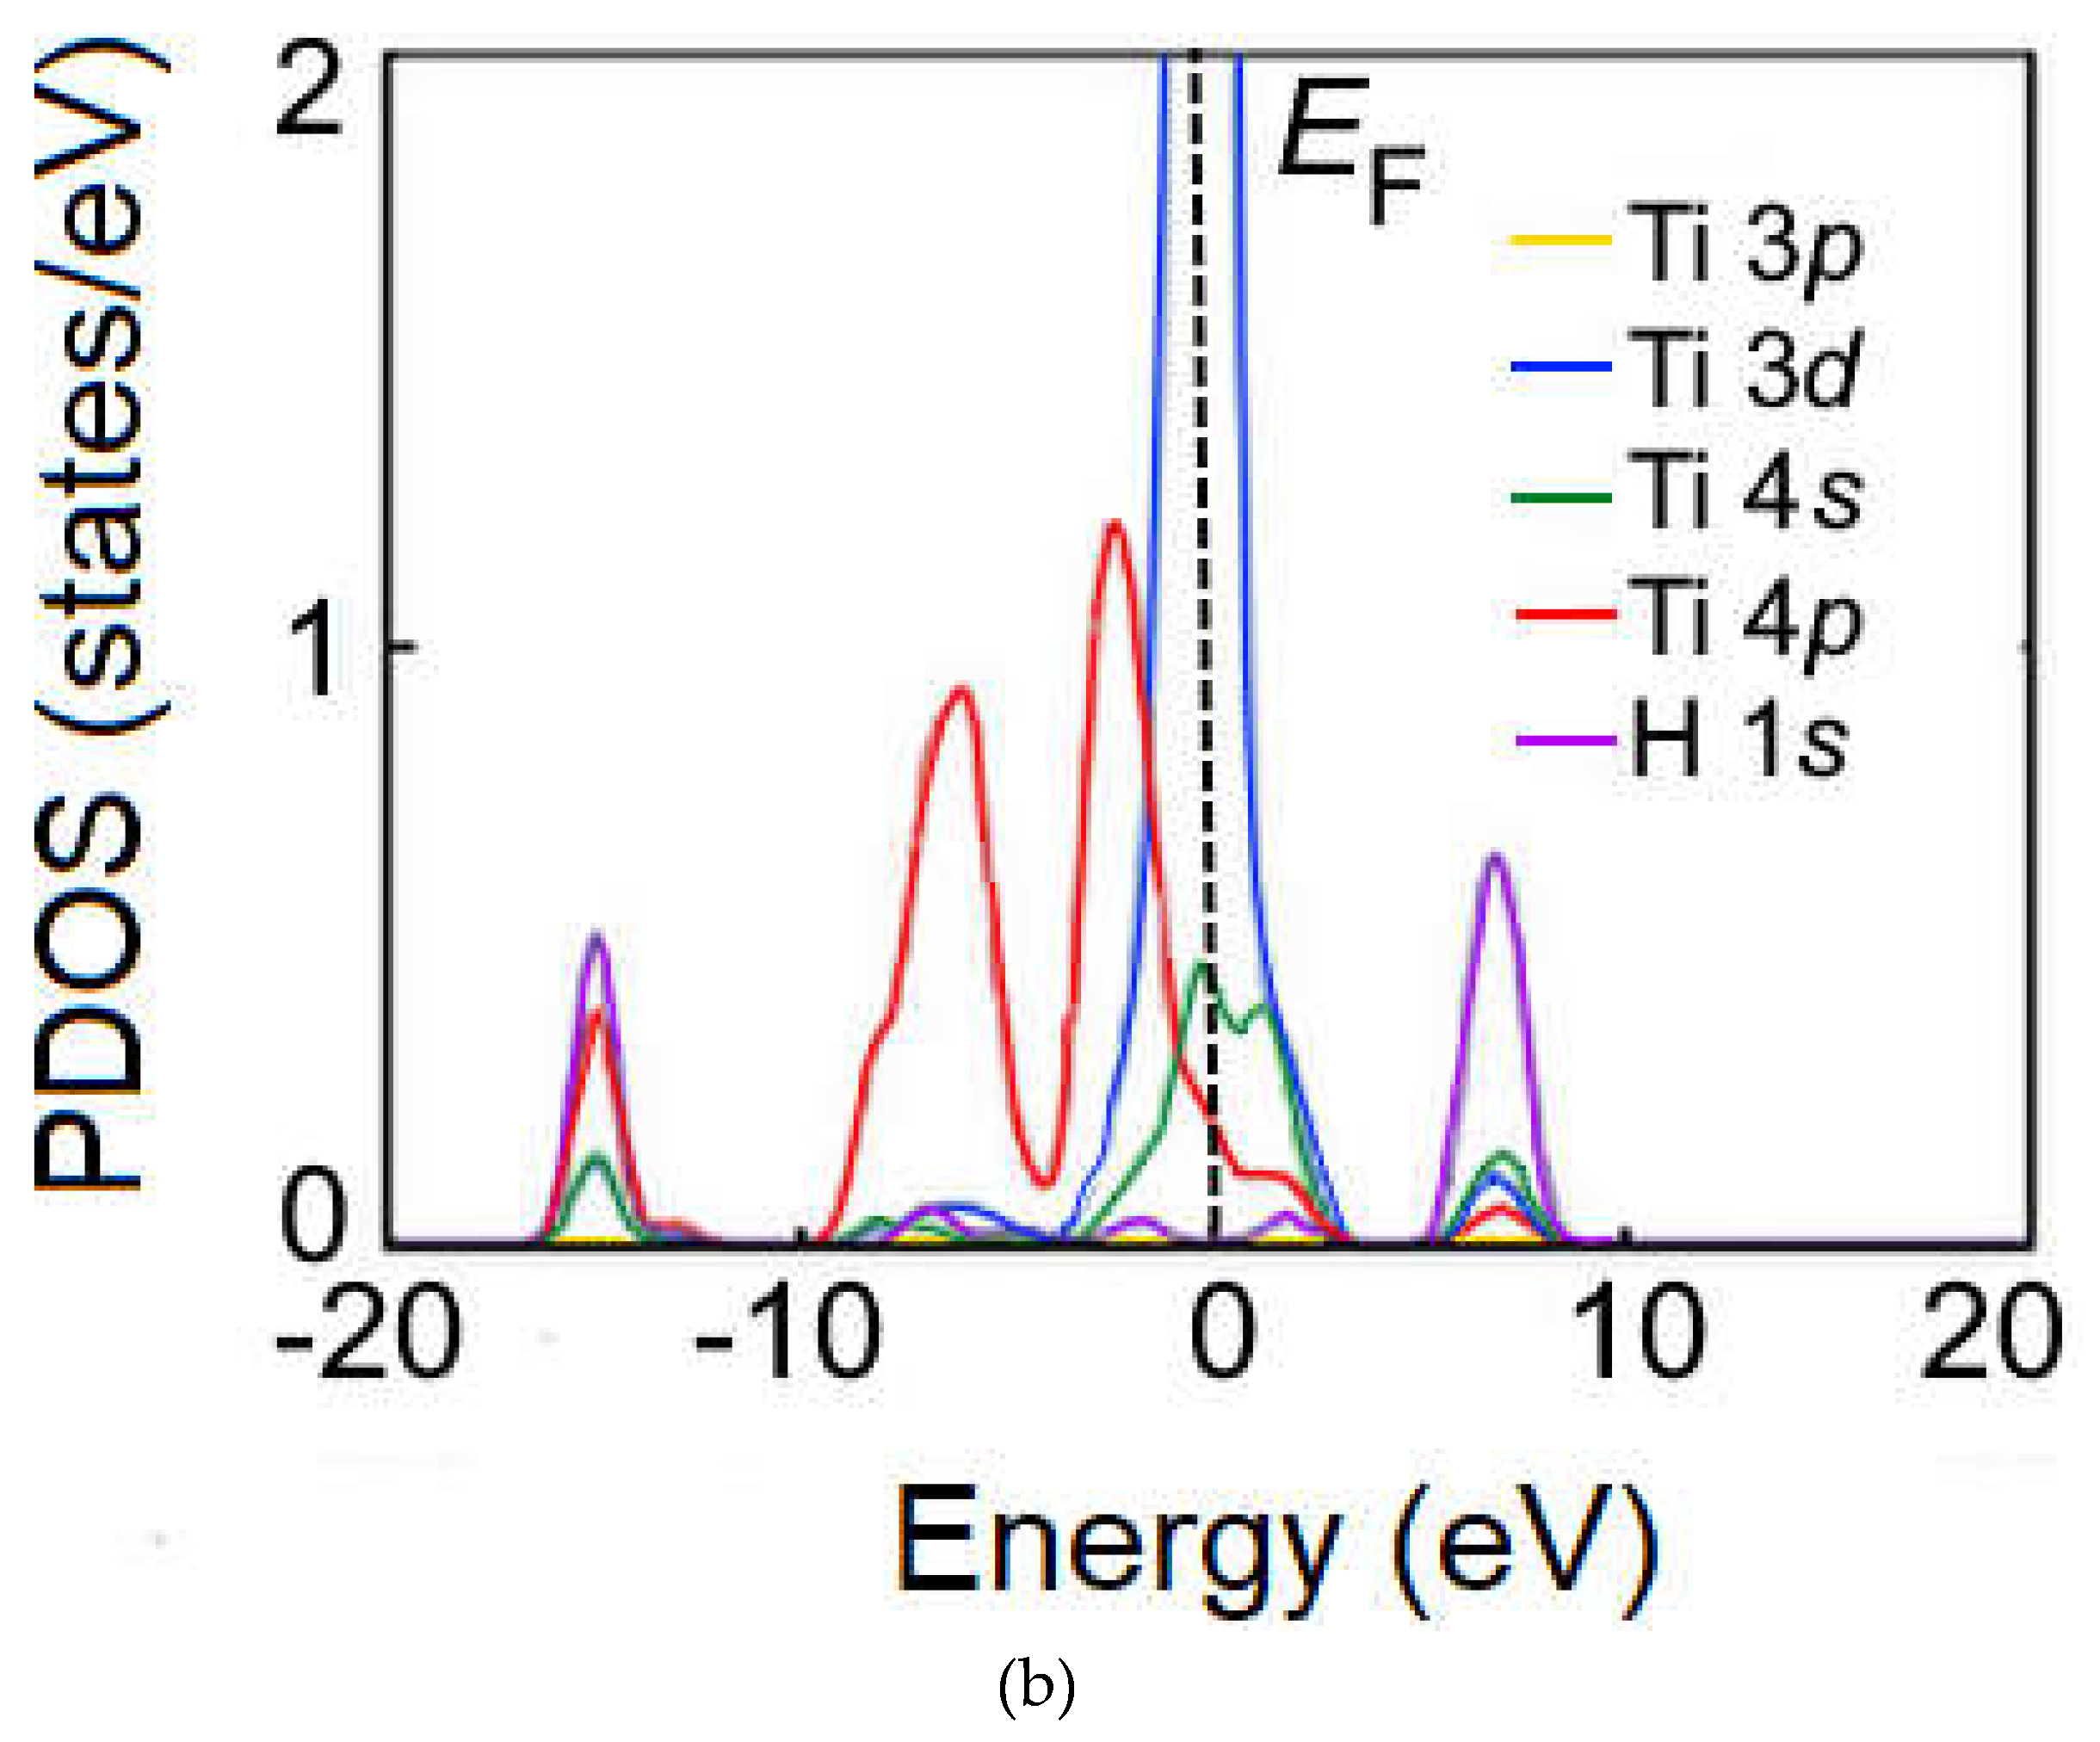
Figure 7.
Calculated DFT SGGA of spin-allowed partial density of states (PDOS) in supercells for the energy range from −10 to 10 eV (primitive cell; Ti–Ti; Ti 3d-orbital) (a), from −10 to 10 eV (primitive cell; Ti–Sb; Ti 3d-orbital) (b), from −6 to 10 eV (2×1×1 cell; Ti–Ti; Ti 3d- orbital) (c), from −6 to 10 eV (2 × 1 × 1 cell; Ti–Sb; Ti 3d-orbital) (d). Energies are given relative to the corresponding Fermi levels (EF = 0 eV).
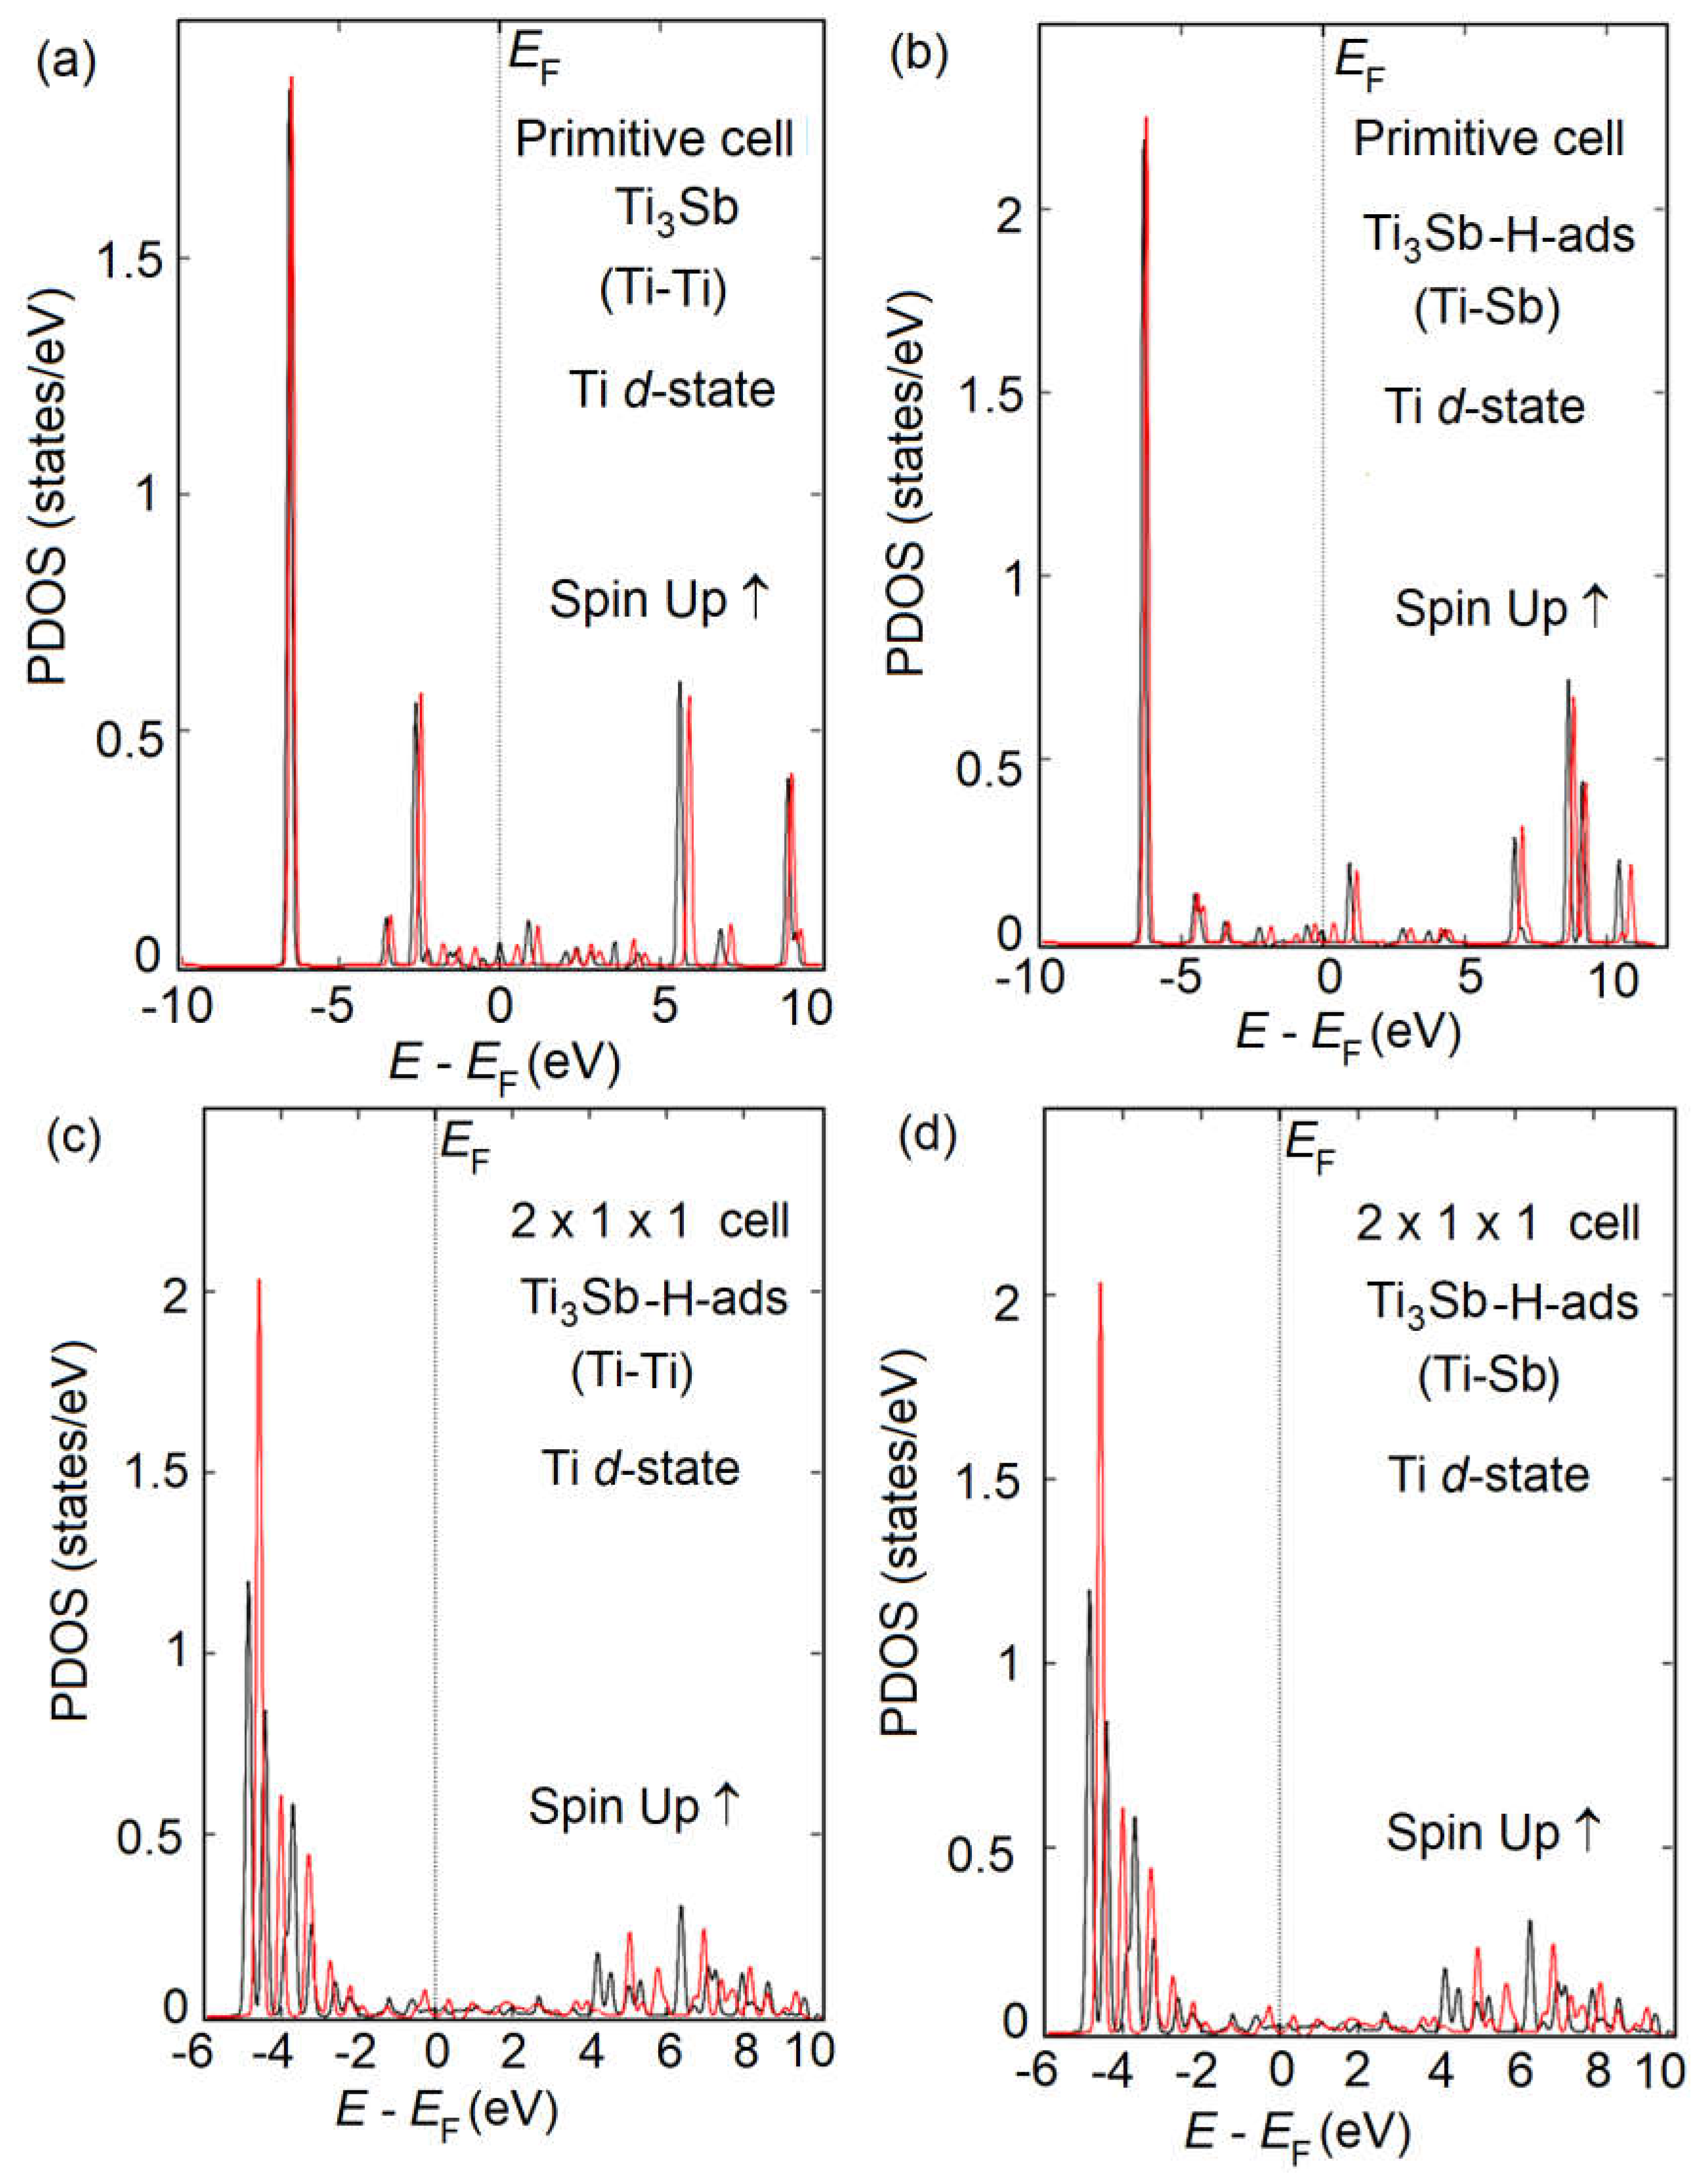
Figure 8.
DFT constructed of atomic structure of Ti3Sb1-xHx (x = 0.02) solid solutions.

Figure 9.
Calculated DFT SGGA of spin-allowed partial density of states (PDOS) in supercells for the energy range from −10 to 10 eV (Ti3Sb0.98H0.02; Ti 3d- orbital) (a), from −10 to 10 eV (Ti2.94SbH0.06; Ti 3d- orbital) (b). The energies are given relative to the corresponding Fermi levels (EF = 0 eV).
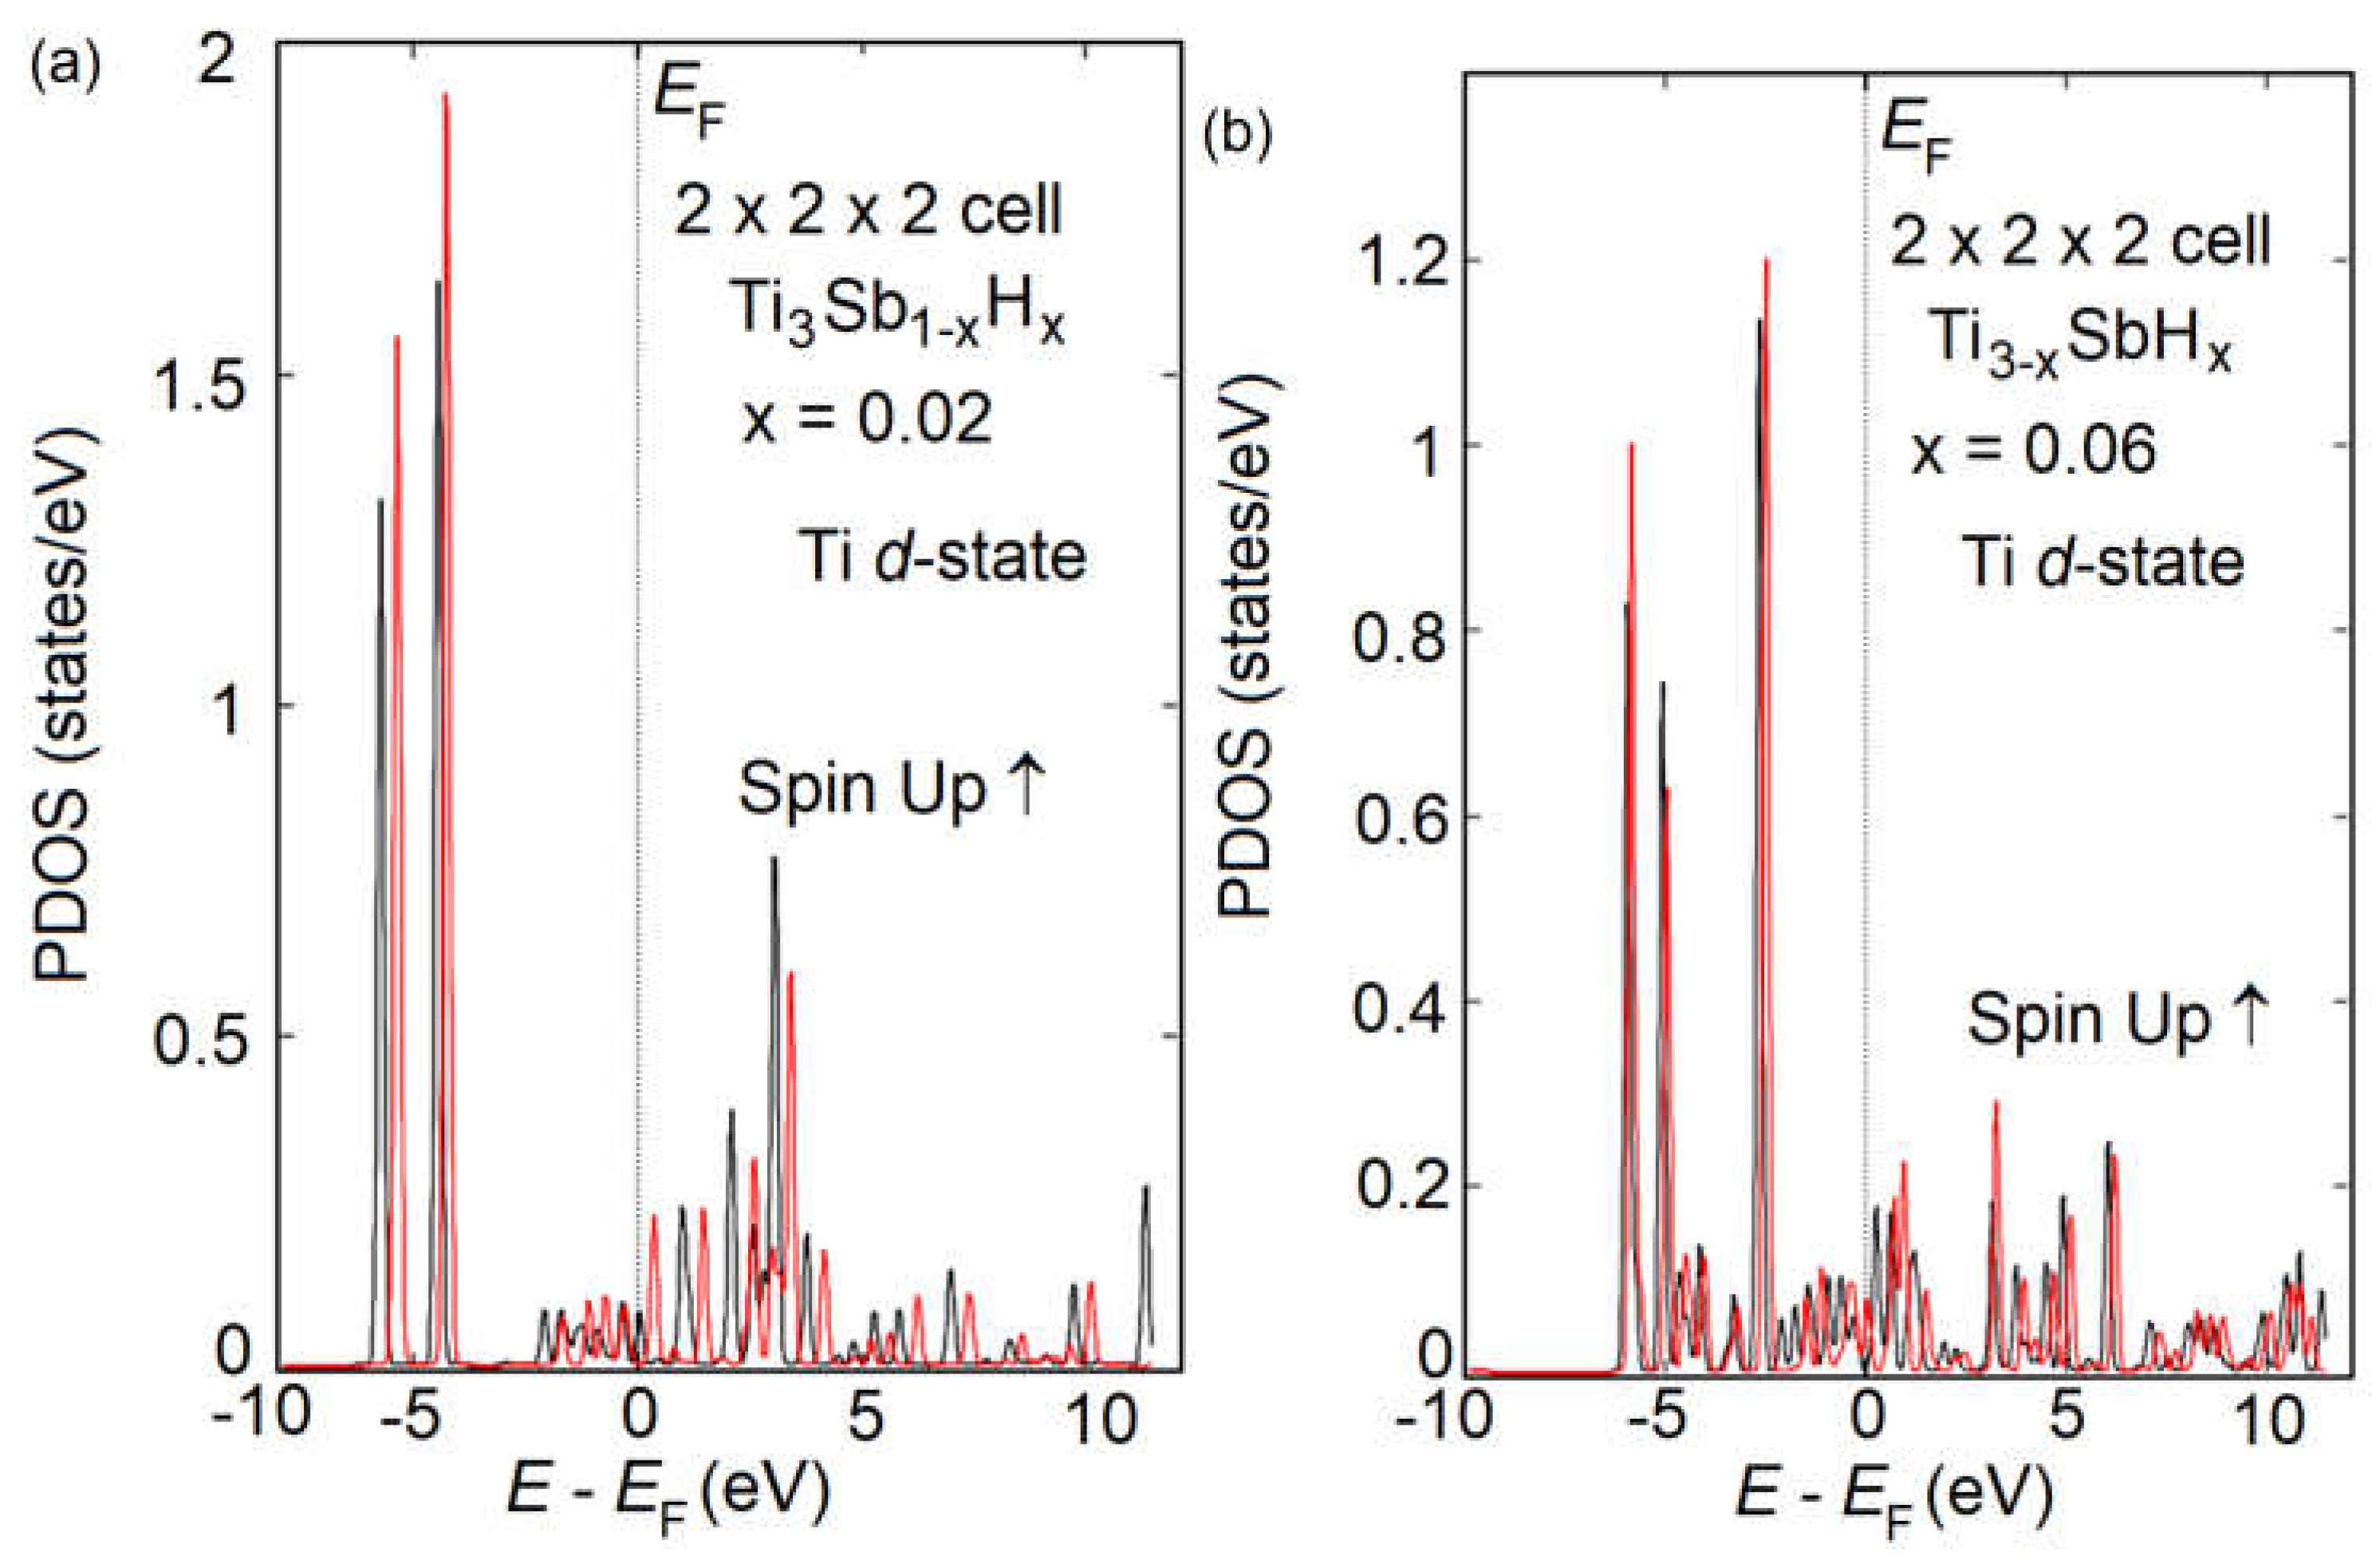
Figure 10.
Schematic paths of H migration through interstitial sites A1→E1→E2→A2 in Ti3Sb.
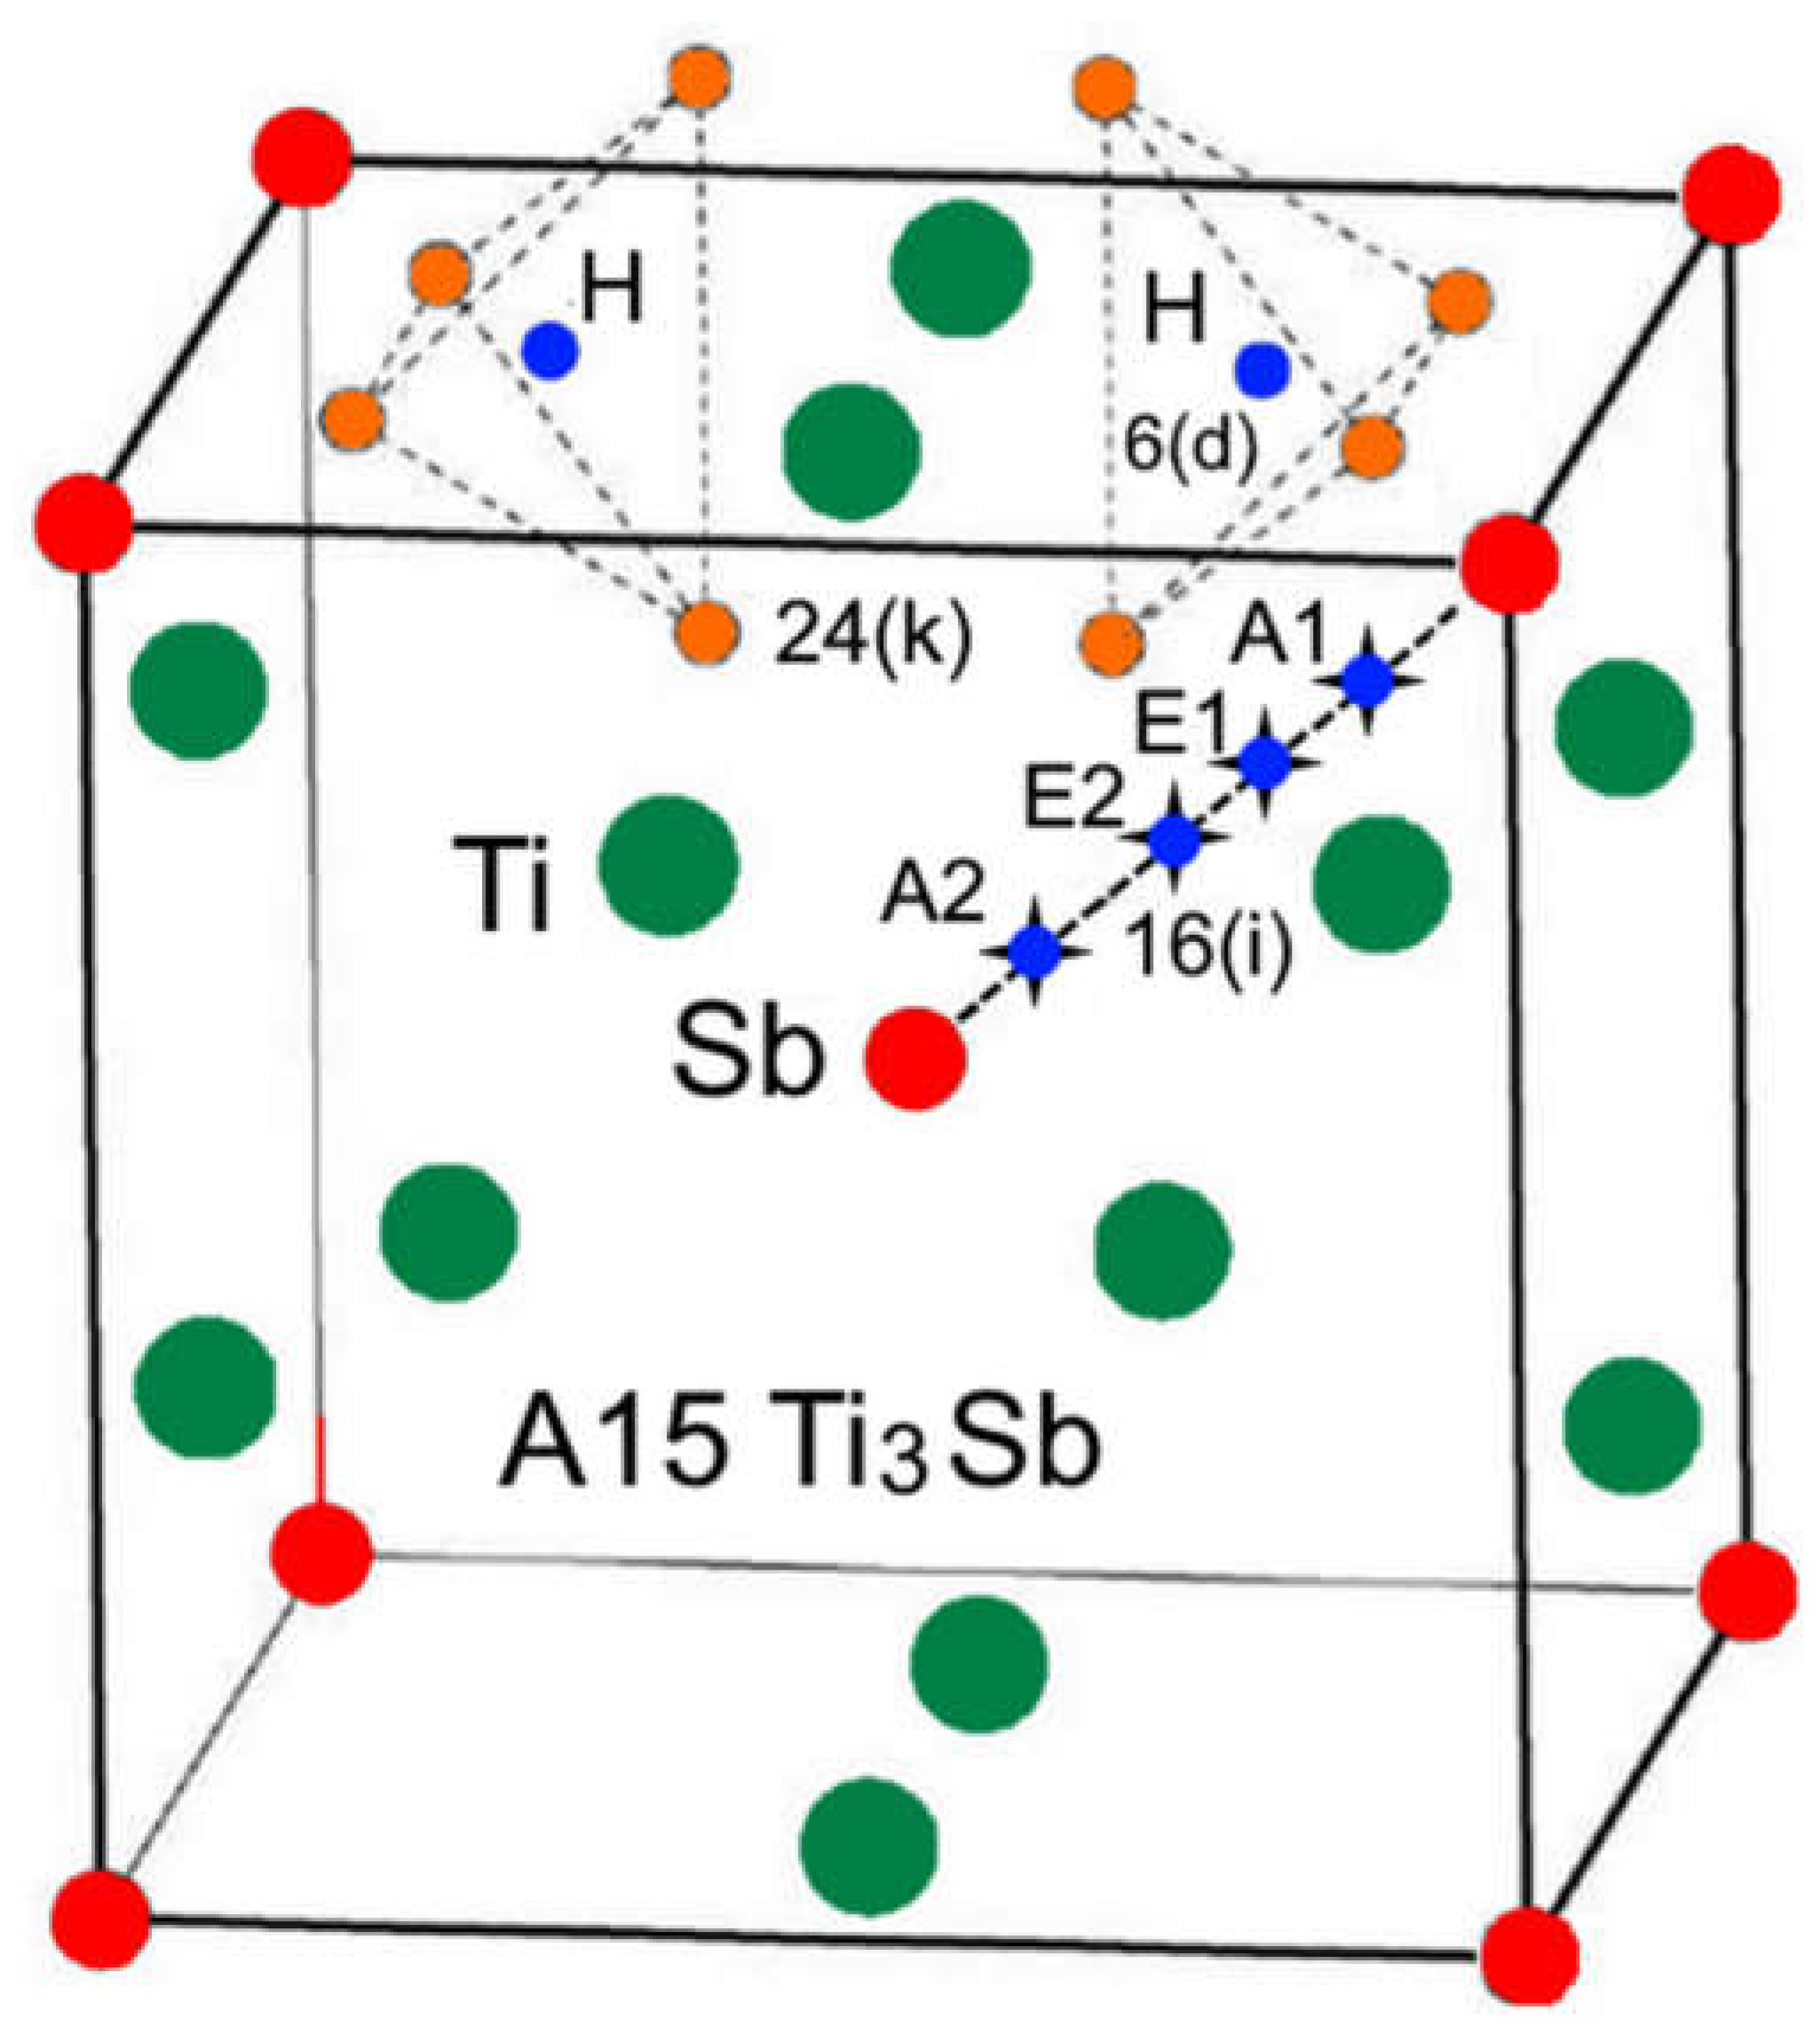

Table 1.
DFT GGA PBE calculated adsorption energies of H on the Ti3Sb (110) surface at a hydrogen atom coverage of the monolayer ML of the surface = 0.25 ML supercells 2 × 1 × 1.
Table 1.
DFT GGA PBE calculated adsorption energies of H on the Ti3Sb (110) surface at a hydrogen atom coverage of the monolayer ML of the surface = 0.25 ML supercells 2 × 1 × 1.
| (Å) |
|---|
| TS 0.55 1.77 1.72 BS 0.77 1.84 1.33 HS 0.92 1.85 0.57 |
Table 2.
Dependence of of hydrogen on HS site on the bond length and the height of the adsorbate from the Ti3Sb (110) surface ( = 0.25 ML) in different supercells.
Table 2.
Dependence of of hydrogen on HS site on the bond length and the height of the adsorbate from the Ti3Sb (110) surface ( = 0.25 ML) in different supercells.
|
Å) |
|---|
| Ti–Ti bond supercell 2 × 1 × 1 0.55 1.882 (H–Ti) 0.357 Ti–Sb bond supercell 2 × 1 × 1 0.47 1.844 (H–Sb) 0.273 Ti–Ti bond supercell 5 × 1 × 1 0.93 1.951 (H–Ti) 0.351 Ti–Sb bond supercell 5 × 1 × 1 0.97 1.975 (H–Sb) 0.272 |
Table 3.
Calculated adsorption energy of H in different compounds.
| H–Ti3Sb This work -0.55 H–Fe3Si [63] -0.87 H–TiO2 [64] -0.608 H–Ti/TiFe [65] -0.52 |
Table 4.
The calculated activation energy of diffusion of H in the Ti3Sb supercell in comparison with data for different compounds.
Disclaimer/Publisher’s Note: The statements, opinions and data contained in all publications are solely those of the individual author(s) and contributor(s) and not of MDPI and/or the editor(s). MDPI and/or the editor(s) disclaim responsibility for any injury to people or property resulting from any ideas, methods, instructions or products referred to in the content. |
© 2025 by the authors. Licensee MDPI, Basel, Switzerland. This article is an open access article distributed under the terms and conditions of the Creative Commons Attribution (CC BY) license (http://creativecommons.org/licenses/by/4.0/).
Copyright: This open access article is published under a Creative Commons CC BY 4.0 license, which permit the free download, distribution, and reuse, provided that the author and preprint are cited in any reuse.


