
Submitted:
02 February 2025
Posted:
04 February 2025
You are already at the latest version
Abstract
In management of mesopredators it is essential to understand their ecological roles and habitat use. However, studies of nocturnal species are challenging and conventional methods are limited in their applicability. This study presents a new method to study habitat preference and behaviour of red fox (Vulpes vulpes), European badger (Meles meles), and Eurasian otter (Lutra lutra). In this study the use of an Unmanned Aerial Vehicle (UAV) equipped with thermal camera is tested and evaluated in relation to conventional monitoring methods. Our results demonstrate that UAVs are highly effective for tracking predator movements across open landscapes, capturing real-time data on locations and behaviours such as foraging, resting, and hunting. This study revealed habitat separations as well as spatial overlap between fox, badger and otter in agricultural areas in Denmark. Foxes showed more versatility, both in behaviour and habitat choice than badger and otter. Otters were almost exclusively found close to water bodies as lakes, streams and coastlines, where they caught fish. Badgers preferred to forage under three covers and in meadows. This study highlights the potential for UAVs to provide novel insights into predator behaviour, habitat use, and interspecies interactions, contributing to a deeper understanding of mesopredator ecology.
Keywords:
Unmanned Aerial Vehicles
; drone
; Eurasian otter
; Lutra lutra
; European badger
; Meles meles
; red fox
; Vulpes vulpes
; foraging behaviour
1. Introduction
Understanding predators' behaviours and their preferred foraging and denning habitats are important in conservation and management of ecological systems. Predators may prefer to forage and resting different habitats. Hence, the varying resource needs of animals lead them to choose different habitats depending on their behavioural state at a given time [1,2]. By incorporating behaviour into studies of habitat use, a deeper understanding of how different species utilize various habitat types can be achieved and how mesopredators interact with other species and compete for resources. Data collection on animal behaviour across different habitats, has traditionally been conducted by direct observation by field researchers, using wildlife cameras or radio transmitters mounted animals. However, these methods are time-consuming, costly, and potentially disturb the target species, particularly when monitoring nocturnal and elusive species, as close proximity to the animal is often necessary for effective observation. Disturbance may alter the animals’ natural behaviour, thereby reducing the quality and reliability of the collected data [3,4,5,6,7].
Data collection through direct observation is limited to areas accessible to the observer, leaving certain habitats underrepresented and direct observations often lead to disturbance of the observed species. To mitigate observer-induced disturbances, alternative methods such as infrared camera traps and GPS tracking have been implemented. Pyšková et al. (2018) [8] investigated habitat preferences, diurnal and seasonal activity patterns of various carnivores, including species like the red fox (Vulpes vulpes), European badger (Meles meles), and Eurasian otter (Lutra lutra), hereafter fox, badger and otter, using camera traps. This approach has also been applied to a study on how red foxes and European badgers exploit urban environments and how anthropogenic disturbances influence their activity levels [9]. However, the use of wildlife cameras has limitations. Light and sound emitted by the camera may alter animal behaviour, leading to decreased detection probabilities [4]. Additionally, wildlife cameras cover limited spatial and temporal scales, necessitating the deployment of many units to survey extensive areas. This requirement significantly increases costs and maintenance efforts for equipment and batteries [10,11]. GPS tracking has been widely utilized in studies of carnivore habitat use, enabling the monitoring of animal movements across large landscapes [12]. Schwemmer et al. (2021) [13] employed GPS tracking to investigate how foxes and raccoon dogs (Nyctereutes procyonoides) exploit habitats along the coastline of the Wadden Sea, aiming to assess their potential role in the decline of ground-nesting waterbird populations. This approach provided valuable insights into predator movement patterns, temporal activity trends, and habitat use. While GPS tracking offers comprehensive data on large-scale movements, it does not inherently reveal specific behavioural patterns and interactions between individuals within habitats or details on how animals utilize specific resources, and the transmitter may affect the well-being of the animal [14,15].
To gather data that encompasses movement across landscapes, more detailed habitat use, species behaviour, the integration of UAVs (unmanned aerial vehicles) can offer significant advantages. UAVs have shown valuable in monitoring larger mammals and medium sized mammals as red deer (Cervus elaphus), roe deer (Capreolus capreolus), fallow deer (Dama dama) and European brown hare (Lepus europaeus) [16,17,18]. Furthermore, UAVs equipped with thermal imaging cameras have demonstrated the ability to reliably distinguish between various largely nocturnal mesopredator species, such as American badger (Taxidea taxus), coyote (Canis latrans), red fox (Vulpes vulpes), striped skunk (Mephitis mephitis), American mink (Neovison vison), raccoon (Procyon lotor), weasel (Mustela spp.), and feral cat (Felis catus) [19]. One of the advantages is that the use of UAVs enables field researchers to survey large areas efficiently (several square km) [17,20,21,22]. Furthermore, the exact location of an animal can be obtained and related to vegetation type [18]. Using UAVs also allow the operator to follow more mammals and study their interactions at the same time while data are secured on video. Another advantage is that the method is non-invasive if the UAV is kept in an appropriate flight height of at least 60 to 100 meters, depending on the species investigated. Badgers were found to be more tolerant to drones than stone martens (Martes foina), as badgers did not change behaviour when the drone 60 above ground level (agl), while martens became alert when the drone was lowered to 80 meters agl [16,17]. Additional and of great importance is that drones allow for monitoring mammals in areas inaccessible to observers on foot or in a vehicle Tomaštík et al. (2019) [23] found that it was possible to accurately use drones for various mapping purposes in forests which were hard to access and Old et al. (2019) [24] found drones to be effective to survey bare-nosed wombat burrows which were visible from the air, particularly when the areas are inaccessible to observers and vehicles [23,24]. Due to these advantages, there is an emerging interest in using UAVs to monitor animal movements, activity, and behaviour [25,26].
To the best of our knowledge this is the first study precenting data on habitat selection and niche overlap between mesopredators using UAV. This study aims to:
- Evaluate the usability of UAVs mounted with thermal camera to track the movements and to identify behaviour of mesopredators in an agricultural landscape.
- Present the preferred habitats of fox, badger and otter, their niche overlap and behaviour in agricultural areas in Denmark.
2. Materials and Methods
2.1. Study Areas
Denmark is characterized by flat arable terrain, low elevation and sandy coasts and a mild coastal temperate climate. More than 60% of the country comprises intensively human modified agricultural land and around 15% covered by forests [27].
To investigate the habitat use of fox, badger and otter, data were collected from three distinct localities in Denmark: Tjerrild Enge (56.36° N, 10.48° E), Egholm (57.07° N, 9.84° E) and Vokslev (56.97° N, 9.68° E). These three locations were primarily agricultural areas, with scattered natural habitats. However, detecting mesopredators such as otters and badgers often required targeted focus on specific habitat types where these species were expected to occur. For otters, the UAV was flown slowly over wetland areas, focusing on detecting individuals in or near the water surface. For badgers, flights were concentrated over regions with dense vegetation, with the thermal camera positioned at a near-vertical angle (~90 degrees). This approach accounted for the challenges associated with thermal detection in these habitats, as heat emissions from water surfaces and vegetation often obscure the thermal signals of animals in these environments. After detecting predators, the UAV approached the predator, and the zoom was used to gain the best possible image resolution for identification of behaviour. However, the UAV was never flown closer than 80 meters above the animals.
Location 1 (Tjerrild Enge) comprises agricultural fields, with scattered small woodlands, meadows, bogs, lakes, and a stream. In this area, fox, otter, and badger have previously been observed through direct observation, tracks and surveillance cameras. Data from this location was collected on March 26th from 19:00 to 00:00 and 27th from 22:43 to 01:32, 2024 (Table A1).
Location 2 (Egholm) is an island of approximately 6 km² in the Limfjord, that beside agricultural fields, includes a mosaic of meadows, grasslands, forests, salt marshes, agricultural fields, lakes, and bogs. Fox and otter were known to live at the island. Data from this location were collected on December 12th and 14th , 2023. On December 12th, the ambient temperature was 0°C with a wind speed of 5.0 m/s, and on December 14th, the ambient temperature was -1°C with a wind speed of 2.1 m/s (Table A1).
Location 3 (Vokslev) primarily consists of agricultural lands, including cultivated fields, fallow land, and hedgerows. A stream runs through the landscape, surrounded by bogs, meadows, grasslands, and small forest patches. Observations of the three mesopredators have been made through both tracks and direct observations. Here, data was collected between February 16th-28th, 2024 at times between 19:00 and 23:00. The ambient temperature ranged from 2.7°C to 6.3°C, while wind speeds varied from 2.4 m/s to 8.3 m/s. The total length of video recordings for the three predators was analysed across the three sites by adding the observed time per individual (Table A1).
2.2. Data Collection
The UAV used for data collection was a DJI Matrice 300 RTK (M300 UAS) equipped with a Zenmuse H20N thermal camera with up to 32x zoom. The camera features a thermal image resolution of 640×512. The drone was equipped with a pinpoint marker function integrated into Google Maps, allowing to find GPS coordinates of the predator’s location. The drone was piloted manually during the surveys. At take/off the UAV was flown at an altitude of 120 meters to provide an overview of predators in the region. After detecting predators, the drone was flown at a lower hight (80-100 meters above ground level (agl.) to be able to observe behavioural details.
2.3. Data Analysis
Maps of the study areas were created using ortophotos of the areas with layers representing the area's landscape features according to habitat and field data retrieved from Styrelsen for Dataforsyning og Infrastruktur (2024) [28]. Habitats not fitting these categories were characterized based on the vegetation types, such as grasslands, deciduous trees, and pine trees (Table A2). The map was further used to visualize possible overlaps of used habitats among the species. As many behaviours occurred near a stream or a lake, a distance of up to 3 meters of a waterbody was disclosed as “Near body of water”. The representation of species involved the use of video material from data collection as well as accompanying SRT files. The coordinates of the position from the UAV were retrieved by reviewing SRT files to estimate the positions of the animals during observation by recognizing and comparing areas with orthophotos. These estimates were then placed into QGIS in order to map out the areas of which each of the displayed behaviours were observed along with showcasing the different habitat types [29].
To be able to analyse the predator's behaviour in the different habitats, video recordings were analysed according to an ethogram with six main categories (travel, rest, foraging, sent mark, attentive) (Table A3). The ethogram was developed after Wooster et al. (2019) [30], which focuses on the behaviour of foxes, and adapted cover behaviours of otters and the badgers. The behaviour categories were illustrated in stacked barcharts.
To examine whether specific behaviours as traveling and foraging were more prevalent in particular habitat types, a X² test and Fisher’s exact-test was used. Habitat types were pooled into categories: ’open areas' (agricultural land, crop and grass fields, and paths between fields), 'wetland areas' (comprising bog and meadow), 'aquatic areas' (lakes, small islands in a lake, and streams), and 'woodland areas' (smaller and lager areas with trees and bushes). Contingency tables were made to assess potential associations between behaviour and habitat, including percentage deviations and standardized residuals (Table A4).
The habitat preferences of the three studied species were quantified as the percentage of time spent in various habitat types.
3. Results
3.1. Detection of Species and Behaviour with Drone
The zoom of the UAV showed to be powerful enough for identification of the three target species from 60-120 m above ground level (agl) (Figure 1). It enabled us, not just to monitor the three meso-predators in their habitats, but also to assess their behaviours and interactions over a longer time period.
Foxes were present in all three locations and the species was recorded in a total 3 hours, 28 minutes and 31 seconds (Table 2). Otters were found at location 1 and 2 and were video recorded for a total of 1 hour, 16 minutes and 5 seconds. Badgers were only found at location 1 and recorded for a total of 17 minutes and 48 seconds (Table 2).

Table 2.
The total duration of video recordings (hours: minutes: seconds) for the fox, badger, and otter captured across three locations. The data highlights differences in species presence and activity, with the highest recording durations generally observed at location 1.
Table 2.
The total duration of video recordings (hours: minutes: seconds) for the fox, badger, and otter captured across three locations. The data highlights differences in species presence and activity, with the highest recording durations generally observed at location 1.
| Species | Total length of video recordings | ||
|---|---|---|---|
| Location 1 | Location 2 | Location 3 | |
| Red fox | 01:55:06 | 00:04:24 | 01:29:01 |
| Eurasian otter | 01:14:34 | 00:02:05 | 00:00:00 |
| European badger | 00:17:48 | 00:00:00 | 00:00:00 |
3.1.1. Movements in the Three Locations by the Three Mesopredators were Observed
Foxes had the most varied movement pattern and were primarily observed in meadows and agricultural areas but also interacting with otters along streams (Figure 3A-C). Otters were almost exclusively found in moist areas, near the coast, in bogs, along and swimming in streams. (Figure 3A). Badgers were recorded in meadows, near or within tree cover, and along linear stretches such as field borders or paths (Figure 3A).
3.3.2. Time Spent in Different Habitats
Foxes used the broadest range of habitat, but was most often seen at agricultural land (~49%). There were also commonly seen at meadows (~25%), followed by trees (~11%) and areas near water, assumed to be attracted to otters with fish (~11%). Other habitats, including grass and roads, were utilized less frequently, accounting for 3.5% and 0.5% of time spent, respectively. Otters spend ~72% of their time in moist areas or close to water. In this study otters spend more time on a little lake island where they rested together and consumed trout (Table 3). Other habitats occupied by otters including agricultural land (~6%) and under trees (~5%). The badgers spent ~66% of its time under tree cover. It travelled along paths and foraged in meadows for ~22% and ~13% of its time, respectively (Table 3).
Table 3.
The percentage of observations for each mesopredator across habitat types. The data highlights distinct habitat preferences, with otters favouring aquatic environments, badgers utilizing forested areas and the foxes showing the widest habitat range.
Table 3.
The percentage of observations for each mesopredator across habitat types. The data highlights distinct habitat preferences, with otters favouring aquatic environments, badgers utilizing forested areas and the foxes showing the widest habitat range.
| Agricultural fields | Grassland | In water | Meadow | Path | Near body of water | Road | Trees | |
| Fox | 48.99% | 3.49% | - | 25.06% | - | 10.892% | 0.55% | 11.02% |
| Otter | 6.24% | - | 16.11% | 1.11% | - | 71.8% | - | 4.74% |
| Badger | - | - | - | 12.65% | 21.51% | - | - | 65.84% |
3.3.3. Main Behaviours Observed in Different Habitats
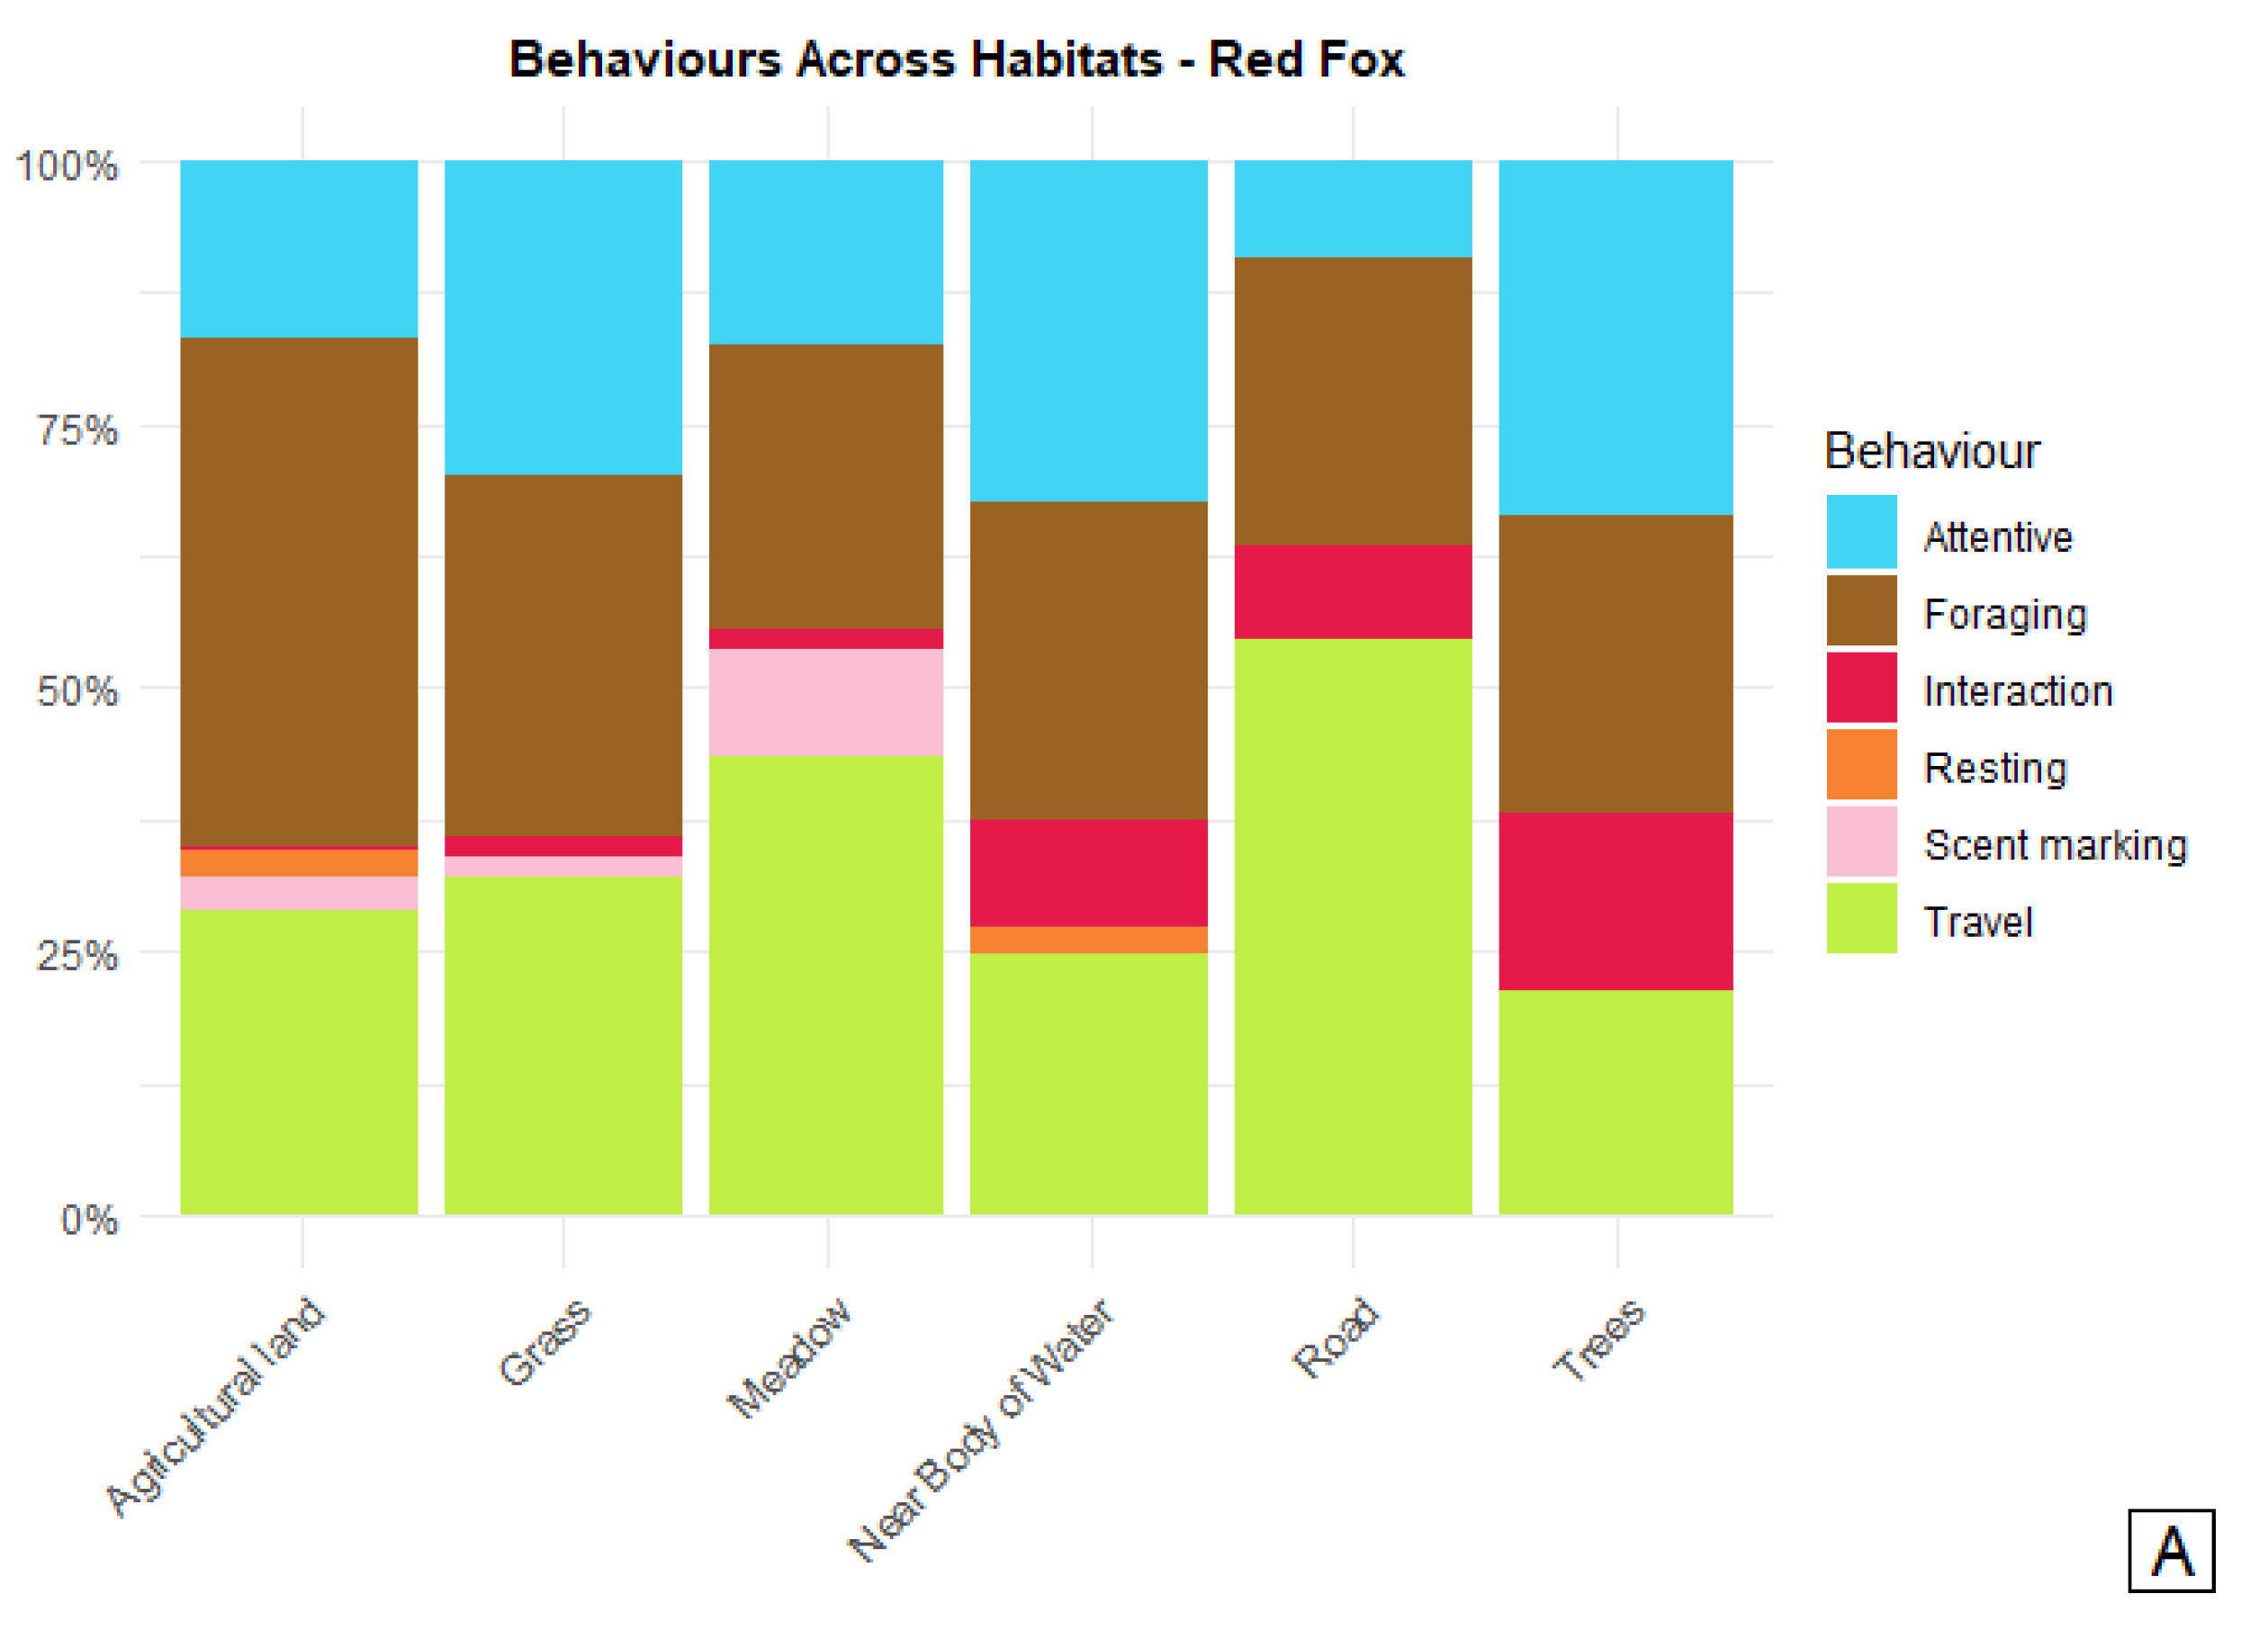
Foxes, comprising at least 20 individuals, used most of their time foraging, traveling and being attentive. These behaviours were observed in all the habitats that foxes were observed in (Figure 4A). Foxes were observed to forage in two ways either searching for mice and other small animals in fields or unsuccessfully trying to steal fish from otters, foxes were seen waiting for otters to move away from fish remains (4.A).
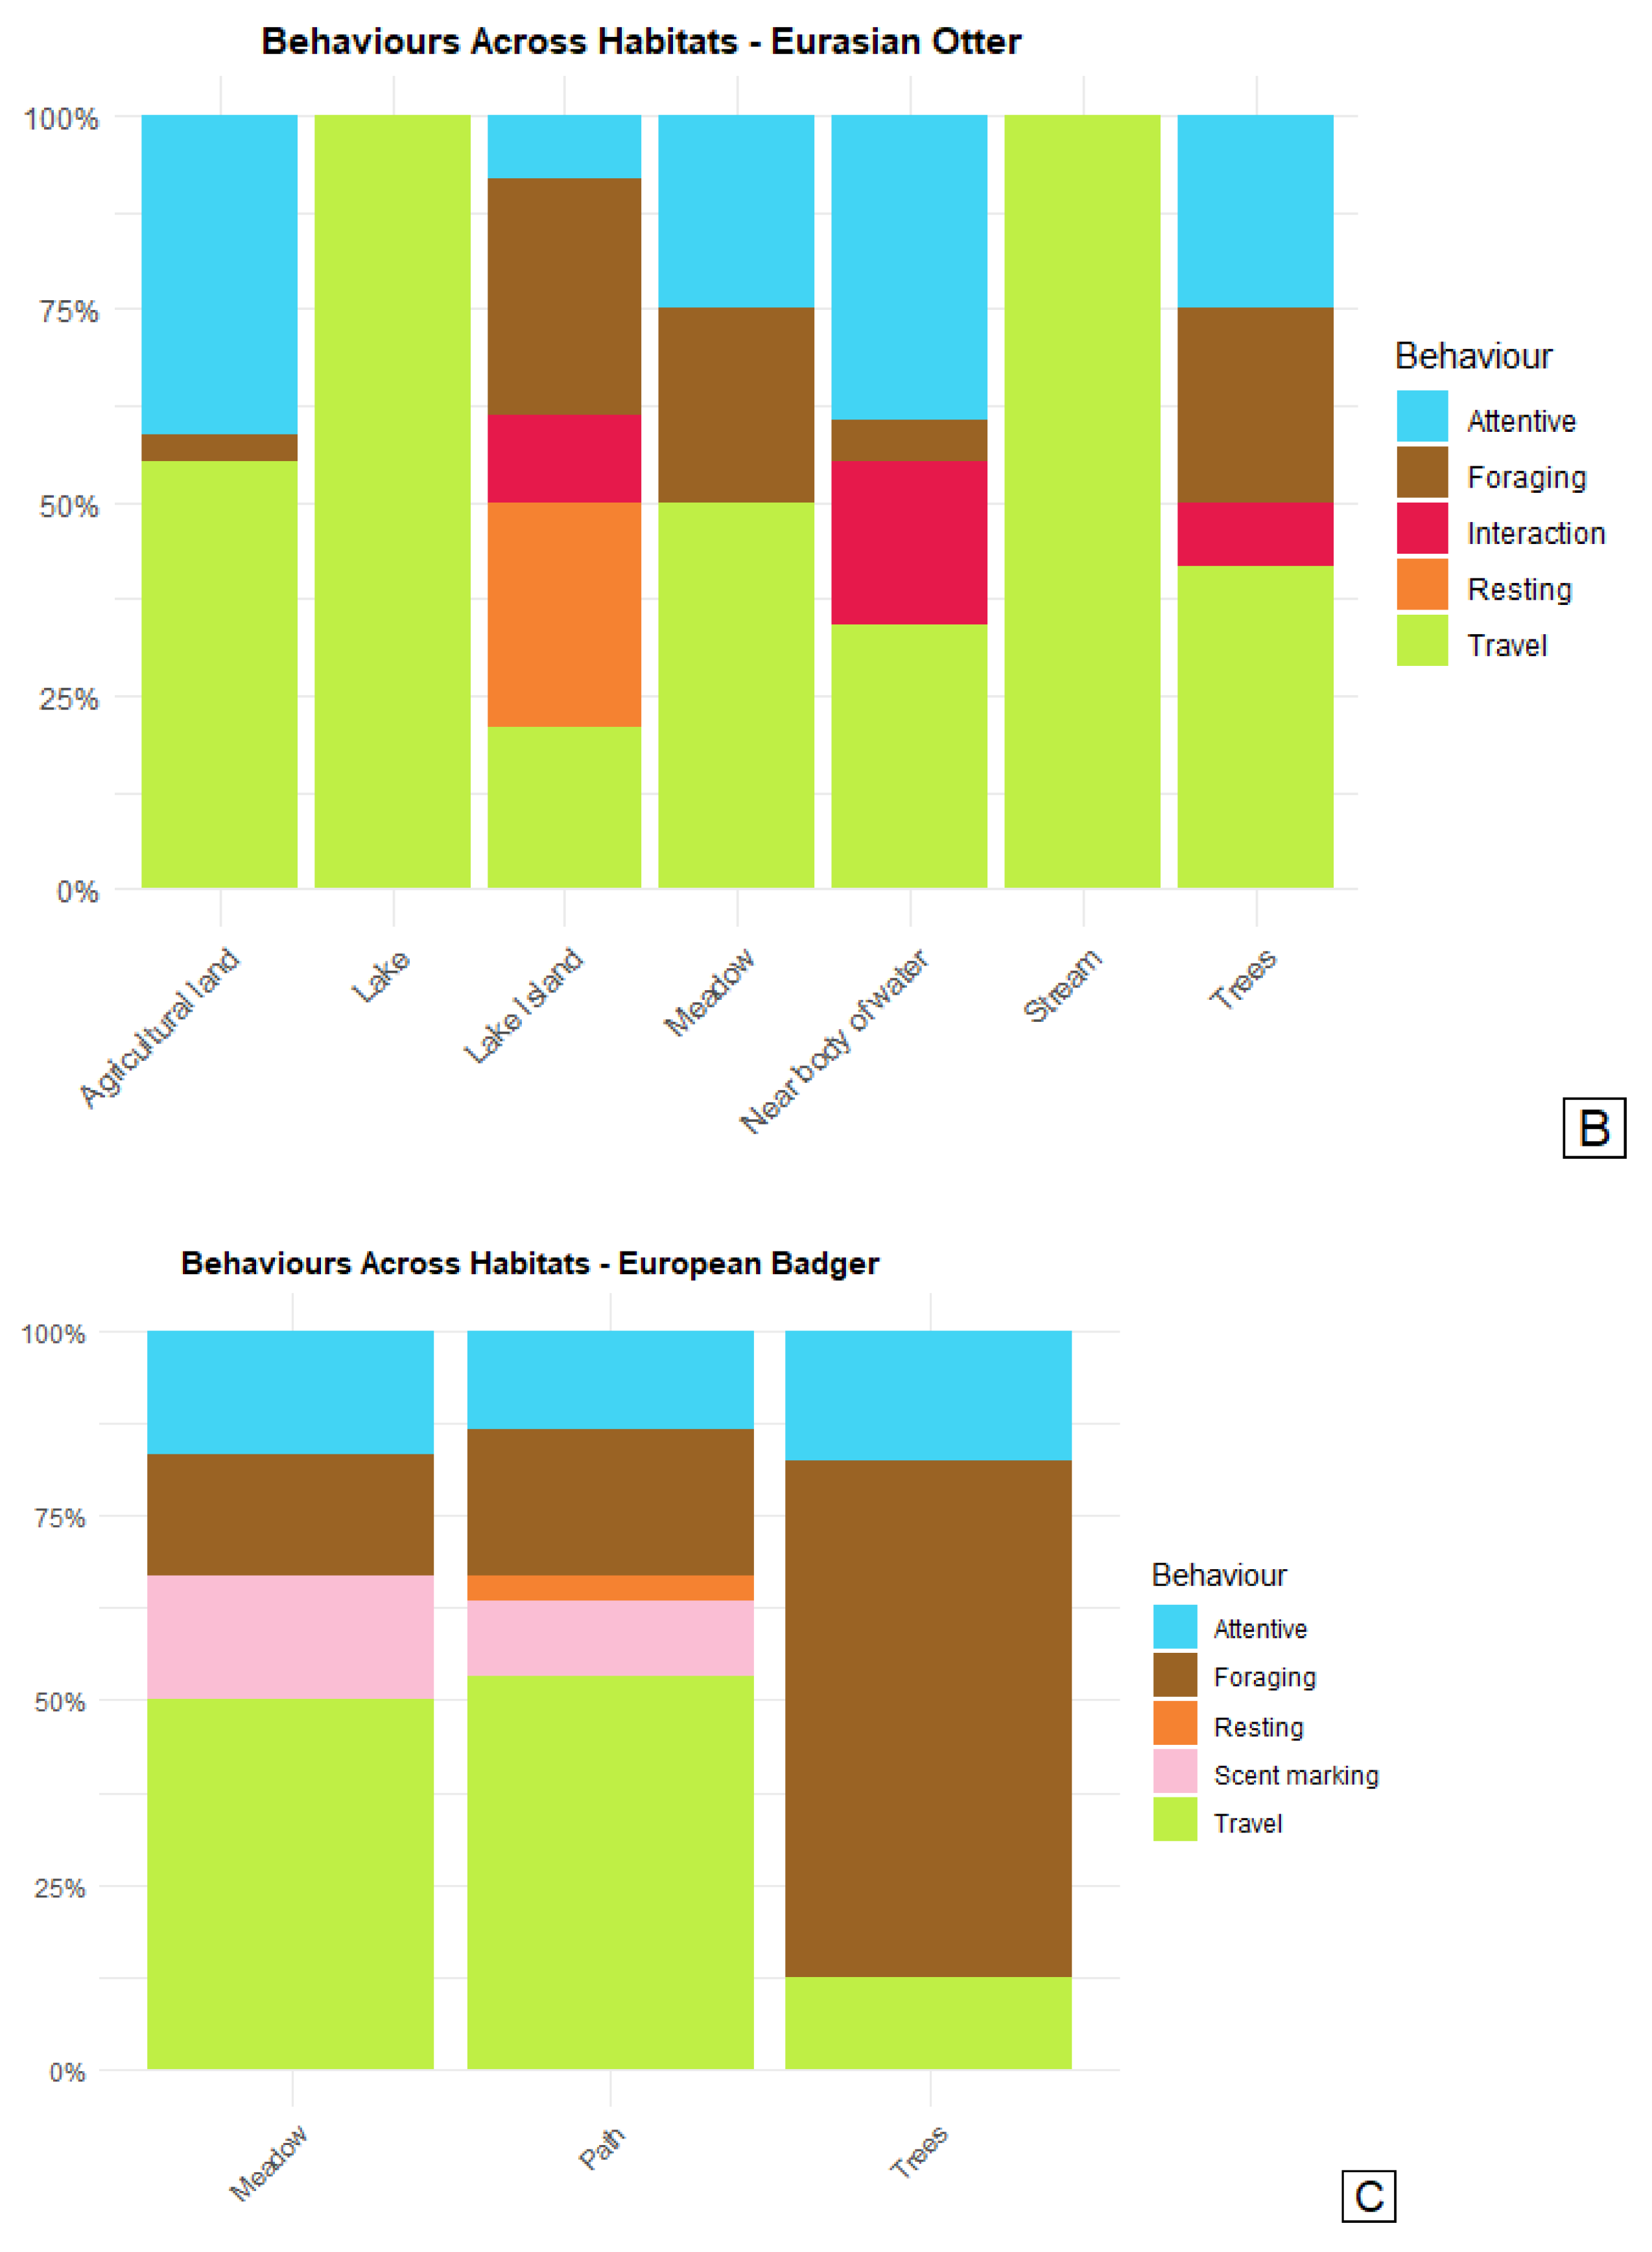
The data on otter behaviour was represented by at least four individuals. Open waters line lakes and streams were used for easy travel although some foraging is also, expected to occur in this habitat. Otters were seen dragging along lively, bouncing trout (foraging) along streams in agricultural areas and grasslands. A small island in a lake was used as refuge where otters were undisturbed by foxes. On this small island most social behaviours (interacting and scent marking) and resting was observed (Figure 4B).
The data of badger behaviour represents only one individual. Foraging behaviour was observed in the three habitats meadow, along path and under three cover. Most foraging of the individual observed in this study was under light tree cover suggesting that these areas provide an important foraging habitat for badgers. Traveling and attentive behaviour was also recorded in all habitats and most frequent in meadow and along paths. Resting behaviour was only observed along paths, “Scent Marking” was frequently observed along paths and in meadows (Figure 4C).
3.3.4. Behavioural Associations to Habitat
The observed behaviour for travel and foraging in foxes was significantly associated with habitat type (p< 0.01) and Cramer's V value of 0.15 suggests a moderate association between behaviour and habitat type. Foxes were observed to travel less frequently in open fields and grasslands (-15%) than expected, and more in wetlands (29%) and aquatic areas (29%) than expected, which indicate that they are stationary time in open areas. The standardized residuals confirm that travel in wetlands was significantly overrepresented (+2.25), suggesting that foxes primarily use wetlands for movement and seek out for otters with fish. In open areas (9.40%) foraging time was higher than expected, whereas both wetlands (-16.80%) and aquatic areas (-17.60%) showed significantly fewer foraging events than expected. These findings support that foxes prefer to hunt in open areas.
Fisher’s exact test for otters revealed no significant association between travel and foraging behaviours and habitat types (p = 0.159). However, this may be due to lack of data. Observations of travel exceeded expectations in open areas (+32.60%) and wetland areas (+44.70%), while it was less frequent than expected in aquatic areas (-5.80%) and woodland areas (-21.10%). For foraging (dragging and eating fish), observations were low in aquatic areas (+13.00%) and performed in woodland areas (+47.20%). Foraging was less than expected in open areas (-73.00%) and wetland areas (-100.00%). Despite these trends, the standardized residuals confirmed that none of these deviations were statistically significant (Table A4).
For badger, traveling and foraging was found to be significantly associated with habitat types (Fisher's exact test, p < 0.001). Badgers were observed traveling more frequent than expected in wetland areas (+55%) and in areas with dense vegetation (+34.30%), while traveling less in open areas (-36.30%). Badgers were observed foraging more frequently than expected in wetland areas (+113.90%). The standardized residuals further indicate that foraging in wetlands and dense vegetation was significantly more represented (+2.06 and +2.24), indicating the badgers' preference for these habitats (Table A4).
Table 4.
Results of χ² and Fisher's exact tests examining differences in travel and foraging behaviours across habitat types (Open areas, Wetland areas, Aquatic areas, and Woodland areas) The table presents the chi² values, degrees of freedom (df), p-values, Cramer's V, and critical value for fox, while Fisher's exact p-values are provided for badger and otter.
| Test | Species | X2 Value (X2) | Degrees of Freedom (df) | p-value | Cramer’s V | Critical value | Fisher’s Exact p-value |
| Fisher’s Exact | Eurasian otter | - | - | - | - | - | 0.15939 |
| Fisher’s Exact-test | European badger | - | - | - | - | - | 0.00006 |
| X2 Test | Red fox | 14.20 | 3 | 0.0027 | 0.1544 | 7.814 | - |
3.3.5. UAVs with Thermal Camera a Valuable Tool for Monitoring Mesopredators
Comparing the use of UAVs with other conventional methods for monitoring mammals reveals that UAVs equipped with thermal cameras provide a unique combination of possibilities (Table 7). UAVs with thermal cameras enable real-time tracking of individual animals across large and diverse landscapes, facilitating both behavioural observations and habitat use assessments. At the right flight height agl. the disturbance of the animals investigated will be low or not present. This mobility of the UAV is a significant advantage, particularly when studying species inhabiting large and inaccessible environments. UAVs are restricted by battery life, however they may be switched quickly and the pinpoint equipment on advanced drones makes it possible to redetect the species under investigation after the battery has been switched, although the rapid movement of predators might prove challenging. UAV´s can actively track animals as they move across different habitat types, and offers a dynamic approach that stationary methods, such as wildlife surveillance cameras, cannot match. While wildlife cameras provide valuable data, for stationary observations, their fixed field of view limits spatial coverage, allowing animals to quickly move out of frame. Wildlife cameras will also only catch animals with their home range within the camaras observation range [31,32].
Bioacoustics monitoring may cover areas often several kilometers and be able to detect certain species and even individuals e.g. wolves, but would leave out all visible queues, making it unable to detect interactions and habitat [33,34,35]. Direct observation by researchers in the field allows for direct observations, but many mammals fear humans and will even with experienced observers escape out of sight. Tracking footprints and droppings of species across landscapes may reveal both species presence and relative densities of the species [36]. However, tracking requires experienced trackers and will not access different behaviour of animals unless there are signs of eating and the presence of trackers may influence animal behaviour [7].
Tracking surveys offer a non-invasive approach to habitat studies, reducing the risk of altering animal behaviour [37]. However, since the animal is often not present during the survey, this method cannot be used for detailed behavioural studies. Tracking is time-consuming and is not possible in all terrain types. GPS collars offer a unique advantage by providing long-term movement data, allowing researchers to track individuals over extended periods and across large areas [13,38,39]. The researcher can follow an animal for months and the collar may also provide physiological information. This facilitates detailed habitat studies, but GPS collars are unable to capture fine-scale behavioural data and interactions between individuals [14,15]. Furthermore the process of capturing and fitting the collar can induce stress, alter natural behaviours and potentially influencing movement patterns of the animal, which may bias the results [40,41].
The use of UAVs equipped with thermal cameras offers the advantage of not only gaining insight into the behaviour of predators within landscapes but also understanding their interactions with prey and habitat choice. The detailed thermal imagery enables observations at a fine scale, such as identifying small prey species near a fox during its hunts, providing a better understanding of the predators hunting method and success. Additionally, the ability to use thermal camera enables the possibility to detect animals over a long distance. The thermal camera could even in some instances be more advantageous during daylight than the day camera, as the heat from animals hidden or camouflaged will be detected by the thermal camera, for example a badger under tree cover descending into its sett, allows for the identification of dens or burrows. The detection of otters near their resting sites shows how thermal cameras can pinpoint specific locations within complex habitats, offering a more comprehensive view of their behaviour and interactions. This capacity of UAV´s ability to follow and to monitor several predators' behaviour simultaneously and at the same time the surroundings advance our understanding of mesopredator habitat use and ecology and furthermore extend studies beyond in situ observations to include detailed insights into predator-prey interactions and inter and intra specific interactions and nicheoverlap.
Table 7.
Overview of various wildlife monitoring methods and their and their applicability. The presence of a " ✔ " indicates whether a given method can be used for specific purposes (e.g., behavioural studies or habitat use assessments) or possesses certain capabilities (e.g., covering large areas, causing low disturbance, or enabling remote detection). Monitoring methods evaluated include UAVs equipped with thermal camera, Wildlife surveillance camera, bioacoustics monitoring, tracks and signs counts, and observer on foot. The purposes include behaviour (Beh.), habitat (Hab.), interactions (Int.), large area cover (Area), time cost-effective (Cost) and low disturbance (low dist.).
| Behaviour | Interaction | Habitat use | Large Area | Cost- effective |
Low disturbance | Sources | |
|---|---|---|---|---|---|---|---|
| UAV | ✔ | ✔ | ✔ | ✔ | ✔ | ✔ | [22,26] |
| Wildlife camera | ✔ | ✔ | ✔ | ✔ | ✔ | [31,32] | |
| Bioacoustic | ✔ | ✔ | ✔ | ✔ | [33,34] | ||
| Observer on foot | ✔ | ✔ | ✔ | ||||
| GPS collar | ✔ | ✔ | ✔ | [13,42,43] | |||
| Tracking | ✔ | ✔ | ✔ | [7,37] |
4. Discussion
4.1. Identifying Species and Haitat Related Behaviour from Thermal Video Recordings
UAV's ability to carry a thermal camera makes it particularly effective for studying nocturnal species as mesopredators. However, UAVs face limitations in certain habitats due to the lower thermal inertia of vegetation and the thermal properties of water [44]. For instance, otters were more difficult to detect when diving in lakes and streams, and badgers were harder to spot in forested areas. Such habitat-related detection has to be accounted for in total video recording times of thee mesopredators. Foxes were easier to detect, likely due to their higher activity levels and preference for open areas, particularly harvested fields where field mice attracted them into exposed locations. In contrast, the relatively inactive badgers and aquatic otters were harder to detect in dense vegetation or water-rich environments. These findings highlight how both species-specific behaviours and habitat features influence detection success and the total observation time across different mesopredators.
Frequent landings for battery changes may disrupt tracking of fast-moving animals, complicating the ability to consistently identify and monitor individuals over time. These limitations make UAVs less suitable for long-term, individual-based studies. Further, continuous observation of the same predators may enable individual identification. With careful planning of UAV-based data collection, is necessary when the purpose is not only monitoring but also behavioural studies.
The UAV mounted with thermal drone is unique tool to identify detailed behaviours of the predator in their surroundings e.g. at hunting fox and its prey being present in a habitat. Also, otters could be resting, grooming and eating. A badger den could be spotted following the badger into a forested habitat. Other interesting behaviours, such as a collaboration between the otter to protect a freshly caught fish from foxes could be observed, offering new knowledge of animal interactions. This finding illustrates the possibility of seeing complex intra- and inter-specific interactions without outside influence in the form of disturbance, which is valuable as Ó Néill et al. (2009) [45] describes the information of the socio-biology of otters as being scarce.
A badger, could be observed rooting in areas with deciduous trees, a behaviour indicating foraging behaviour. Another interaction between two mesopredators was also observed, as a fox would be seen following along with a foraging badger, scavenging food from freshly rooted areas.
The videos showed that foxes often moved in sporadic directions, frequently being attentive and stopping to sniff and investigate their surroundings, indicating a hunting strategy for small mammals. Foxes can detect prey by adopting a "head and neck mousing position" or by lowering their head and sniffing to locate the prey. Other hunting strategies of foxes observed using UAV with thermal camera was facultative scavenging, where the fox benefits from prey caught and left by other predators. Foxes were observed following an otter family and one fox was scavenging fish remains after the otters have left the location. Foxes may therefor benefit from habitats with otters.
4.2. Niche Overlap Between Predators
Considering the diets and habitat preferences of the predators, some overlap in their movements within certain habitat types was expected, particularly in areas providing abundant resources or transitional zones. The fox, with its generalist diet and adaptability to fields, forests, and meadows, often exploits diverse habitats [46,47,48]. The badger, is primarily associated with forests and hedgerows, forages for earthworms and other immobile invertebrate prey, which may also be found in open or agricultural areas [49,50]. The Eurasian otter is semi-aquatic and was primarily recorded near water bodies in search of fish or alternative prey [51,52]. In a previous study by Mori et al. (2020) [53], spatial overlap was also found between fox and badger; however, no spatial overlap was observed between Eurasian otters and the fox and the badger. Terrestrial predators can adjust their behaviour to reduce negative interactions through niche partitioning [54]. However, since the predators in this study were active during the same periods and occupied some of the same areas in location 1 the results suggest that interference competition could potentially occur among them [55]. This study finds spatial overlap between the species, but with each species having their preferred habitat types.
By monitoring animals using UAVs, it is possible to obtain both movement data and behavioural observations within various habitats for an extended time, thereby providing a more concrete understanding of how different species move when hunting and foraging, escaping predators, and identifying potential resting spots. This approach could contribute to a better understanding of movement patterns, which should be considered during the data processing of GPS-tracked individuals. To reduce the time spent analysing collected video recordings of animal behaviour, future efforts should consider integrating AI into the process and utilizing machine learning tools or computational animal behaviour analysis (CABA) systems. These tools can perform behaviour analysis efficiently and, in the long run, significantly enhance time efficiency [56,57].
5. Conclusions
The drone (UAV) mounted with thermal camara showed to be a valuable tool for monitoring wild mesopredators behaviour and habitat use. With the UAV it was possible to track individual mesopredators over large distances within the landscape and to video record their movements and behaviour. Moreover, the SRT files made it possible to geocode the individuals and associate their behaviour with habitat types mapped from Danish Data Supply, Creative Commons Attribution 4.0 International (2024) [28]. Combining mapping of movements and behavioural categorization provided valuable insights into habitat use by mesopredators, including foraging and hunting activities, as well as the identification of resting sites and dens. Additionally, it was possible to fly over more individuals and species at the same time.
Author Contributions
For research articles with several authors, a short paragraph specifying their individual contributions must be provided. The following statements should be used “Conceptualization, K.M-L. and E.M.E.E., C.P. and S. P.; methodology, K.M-L. and E.M.E.E., C.P. and S. P.; software, K.M-L. and E.M.E.E.; formal analysis, K.M-L. and E.M.E.E.; investigation, K.M-L. and E.M.E.E. ; data curation, , K.M-L. and E.M.E.E. .; writing—original draft preparation, , K.M-L. and E.M.E.E .; writing—review and editing, S.P. and CP.; visualization, , K.M-L. and E.M.E.E ; supervision, C.P. and S.P. All authors have read and agreed to the published version of the manuscript.
Funding
This research received no external funding. The data were collected as part of a Master´s Degree study at the University of Aalborg, Denmark.
Data Availability Statement
As basic data are video recordings. In the Appendix we provide additional information about the data and we will share data information’s with others interested in behaviour of meso-predators.
Acknowledgments
The authors want to thank the landowners where the study was conducted. Special thanks go to Verner Frandsen and Jens Ove Jespersen for their hospitality and allowing us to fly at night.
Conflicts of Interest
The authors declare no conflicts of interest.
Abbreviations
The following abbreviations are used in this manuscript:
| UAV | Unmanned Aerial Vehicle |
| AGL | Above Ground Level |
Appendix
Table A1.
Environmental conditions recorded at the three study locations during data collection. The table presents the date and time of observations, average wind speed (m/s), and ambient temperature (°C) for each location.
Table A1.
Environmental conditions recorded at the three study locations during data collection. The table presents the date and time of observations, average wind speed (m/s), and ambient temperature (°C) for each location.
| Location | 1 | 2 | 3 |
| Date and time | March 26th, 2024- 19:00-00:00 March 27th, 2024- 22:43-01:32 |
December 12th , 2023– 15:00-18:00 December 14th , 2023 – 15:00-20:30 |
February 16th-28th, 2024 - 19:00-23:00. |
| Wind speed (average) | March 26th: 5.85 m/s March 27th: 1.6 m/s |
December 12: 5.0m/s December 14: 2.1m/s |
Ranged from 2.4-8.3 m/s |
| Ambient temperature (average) | March 26th: 5.8 °C March 27th: 6.5 °C |
December 12: 0°C December 14: -1°C |
Ranged from 2.7-6.3°C |
Table A2.
An overview of the different layers used in the examination of species behaviours across habitats. Each habitat type is described after the instruction of the nature protection act’s §-3 protected nature types (Miljøstyrelsen 2019).
Table A2.
An overview of the different layers used in the examination of species behaviours across habitats. Each habitat type is described after the instruction of the nature protection act’s §-3 protected nature types (Miljøstyrelsen 2019).
| Habitat types | ||
| Meadow | Created by human interaction such as grazing, mowing or cutting down trees. Often on low-lying and relatively moist areas. Seen near river valleys or close to streams, lakes or bogs. Dominated by plants which are low growing and highly light-dependent. | |
| Bog | Areas saturated with water due to high groundwater, however not permanently under water. Covered by herbs, bushes and trees related to high humidity. | |
| Grassland | Dominated by grass and herbs thriving on dry ground. Grazing or haying often a cultural influence but without agricultural operation. The ground is well-drained and permanently dry-bottomed. | |
| Lake | Natural and man-made lakes with a developed characteristic plant and animal life in connection with the lake. Non-temporary water areas. | |
| Salt meadow | Relatively flat areas found along protected coasts in fjords and shallow sea areas. Vegetation consists of grasses, semi-grasses and herbs which can tolerate the salt from floodings of seawater. | |
| Vegetation types | ||
| Grass | Areas not covered by habitat types dominated by grass | |
| Agricultural land | Agricultural areas divided into connected block noted from orthophotos and reports from landowners and authorities. | |
| Trees | Areas not covered by habitat types containing both individual deciduous and pine trees and forests | |
| Landscape elements | ||
| Path | Roads or natural paths visible from orthophotos. | |
| Stream | Bodies of water running through the habitats visible from orthophotos. |
Table A3.
An ethogram of behaviours showcased by the three mesopredators with inspiration from Wooster et al. (2019) [30].
Table A3.
An ethogram of behaviours showcased by the three mesopredators with inspiration from Wooster et al. (2019) [30].
| Behaviour | Categories | Descriptions |
| Travel | Walk, trot or gallop | Walk, trot or gallop with quadrupedal movement |
| Swim | Mostly submerged in water with streamlined movements | |
| Resting | ||
| Lie down | Legs are non-extended with torso touching the ground | |
| Groom | Grooming by licking fur | |
| Foraging | ||
| Sit and wait | Waiting in a seating position for a feeding opportunity | |
| Rooting | Moves slowly or remains stationary with its nose to the ground, often digging in search of food | |
| Eat | Snout in contact with food while jaw and/or head clearly moves vertically repeatedly | |
| Investigate | Exploring of the area by sight, smell, or sounds. The animal might sniff, poke, or prod an object of interest. Exploration does not have a specific focus | |
| Interaction | ||
| Agonistic | Displays of hostile behaviour towards another animal | |
| Friendly greeting | Sniffing of face, anus, genitals, or glands of another animal | |
| Denied greeting | An attempted greeting results in moving or jumping away from the other animal | |
| Play | Either leaps playfully and exaggeratedly toward or away from a conspecific or playfully runs/walks toward or away from a conspecific, with exaggerated movements in a non-aggressive manner | |
| Flight | Makes a quick, startled jump backwards or a startled flight, initiated by a sudden turn or movement in the opposite direction from where it was previously heading, often in response to an encounter with another individual. | |
| Scent marking | Spraying of urine or depositing faeces in the environment | |
| Attentive | Sudden stand still with pointed or moving ears and/or head movements. |
Table A4.
Summary of residuals of habitat use and behavioural habitat preferences for three mesopredators: fox, badger, and otter. The table presents percentage deviations from expected habitat use and corresponding standardized residuals across different habitat types for two behavioural categories. Positive residuals indicate a preference for a given habitat type, while negative residuals suggest avoidance. Residuals exceeding |2.0| are highlighted as statistically significant.
| Species | Behaviour | Habitat Type | Percentage Deviation | Standardized Residual |
|---|---|---|---|---|
| Eurasian otter | ||||
| Travel | Open areas | -32.60 % | +0.94 | |
| Wetland areas | +44.70 % | +0.53 | ||
| Aquatic areas | -8.80 % | -0.32 | ||
| Woodland areas | -21.20 % | -0.58 | ||
| Foraging | ||||
| Open areas | -73.00 % | -1.41 | ||
| Wetland areas | -100.00 % | -0.79 | ||
| Aquatic areas | +13.00 % | +0.47 | ||
| Woodland areas | +47.20 % | +0.97 | ||
| European badger | ||||
| Travel | ||||
| Open areas | -36.30% | -1.11 | ||
| Wetland areas | +55.00% | -1.44 | ||
| Aquatic areas | N/A | N/A | ||
| Woodland areas | 34.30% | 1.56 | ||
| Foraging | ||||
| Open areas | +74.60% | +1.60 | ||
| Wetland areas | +113.90% | +2.06 | ||
| Aquatic areas | N/A | N/A | ||
| Woodland areas | +70.40% | +2.24 | ||
| Red fox | ||||
| Travel | ||||
| Open areas | -15.20 % | -1.76 | ||
| Wetland areas | +29.00 % | +2.25 | ||
| Aquatic areas | +29.90 % | +0.87 | ||
| Woodland areas | 0.00 % | 0.00 | ||
| Foraging | ||||
| Open areas | +8.90 % | +1.34 | ||
| Wetland areas | -16.60 % | -1.72 | ||
| Aquatic areas | -17.40 % | -0.66 | ||
| Woodland areas | 0.00 % | 0.00 |
References
- Roever, C.; Beyer, H.; Chase, M.; van Aarde, R. The Pitfalls of Ignoring Behaviour When Quantifying Habitat Selection. Divers Distrib 2013, 19. [CrossRef]
- Pay, J. M.; Patterson, T. A.; Proft, K. M.; Cameron, E. Z.; Hawkins, C. E.; Koch, A. J.; Wiersma, J. M.; Katzner, T. E. Considering Behavioral State When Predicting Habitat Use: Behavior-Specific Spatial Models for the Endangered Tasmanian Wedge-Tailed Eagle. Biol Conserv 2022, 274, 109743. [CrossRef]
- Bateson, M.; Martin, P. Measuring Behaviour: An Introductory Guide; 2021. [CrossRef]
- Meek, P.; Ballard, G.; Fleming, P.; Falzon, G. Are We Getting the Full Picture? Animal Responses to Camera Traps and Implications for Predator Studies. Ecol Evol 2016, 6 (10), 3216–3225. [CrossRef]
- Valente, A.; Binantel, H.; Villanúa, D.; Acevedo, P. Evaluation of Methods to Monitor Wild Mammals on Mediterranean Farmland. Mammalian Biology 2018, 91. [CrossRef]
- Zwerts, J.; Stephenson, P. J.; Maisels, F.; Rowcliffe, M.; Astaras, C.; Jansen, P.; van der Waarde, J.; Sterck, L.; Verweij, P. A.; Bruce, T.; Brittain, S.; Kuijk, M. Methods for Wildlife Monitoring in Tropical Forests: Comparing Human Observations, Camera Traps, and Passive Acoustic Sensors. Conserv Sci Pract 2021, 3. [CrossRef]
- Hanscom, R.; Hill, J.; Patterson, C.; Marbach, T.; Sukumaran, J.; Higham, T.; Clark, R. Cryptic Behavior and Activity Cycles of a Small Mammal Keystone Species Revealed through Accelerometry: A Case Study of Merriam’s Kangaroo Rats (Dipodomys Merriami). Mov Ecol 2023, 11. [CrossRef]
- Pyšková, K.; Kauzál, O.; Storch, D.; Horacek, I.; Pergl, J.; Pyšek, P. Carnivore Distribution across Habitats in a Central-European Landscape: A Camera Trap Study. Zookeys 2018, 770. [CrossRef]
- Lovell, C.; Li, S.; Turner, J.; Carbone, C. The Effect of Habitat and Human Disturbance on the Spatiotemporal Activity of Two Urban Carnivores: The Results of an Intensive Camera Trap Study. Ecol Evol 2022, 12. [CrossRef]
- Wearn, O.; Glover-Kapfer, P. Camera-Trapping for Conservation: A Guide to Best-Practices. January 2017. [CrossRef]
- Walton, B. J.; Findlay, L. J.; Hill, R. A. Camera Traps and Guard Observations as an Alternative to Researcher Observation for Studying Anthropogenic Foraging. Ecol Evol 2022, 12 (4), e8808. [CrossRef]
- (12) Thorsen, N.; Hansen, J.; Støen, O.-G.; Kindberg, J.; Zedrosser, A.; Frank, S. Movement and Habitat Selection of a Large Carnivore in Response to Human Infrastructure Differs by Life Stage. Mov Ecol 2022, 10, 1–14. [CrossRef]
- (13) Schwemmer, P.; Weiel, S.; Garthe, S. Spatio-Temporal Movement Patterns and Habitat Choice of Red Foxes (Vulpes Vulpes) and Racoon Dogs (Nyctereutes Procyonoides) along the Wadden Sea Coast. Eur J Wildl Res 2021, 67. [CrossRef]
- (14) Hebblewhite, M.; Haydon, D. Distinguishing Technology from Biology: A Critical Review of the Use of GPS Telemetry Data in Ecology. Philos Trans R Soc Lond B Biol Sci 2010, 365, 2303–2312. [CrossRef]
- Hance, D.; Moriarty, K.; Hollen, B.; Perry, R. Identifying Resting Locations of a Small Elusive Forest Carnivore Using a Two-Stage Model Accounting for GPS Measurement Error and Hidden Behavioral States. Mov Ecol 2021, 9. [CrossRef]
- Larsen, H. L.; Møller-Lassesen, K.; Enevoldsen, E. M. E.; Madsen, S. B.; Obsen, M. T.; Povlsen, P.; Bruhn, D.; Pertoldi, C.; Pagh, S. Drone with Mounted Thermal Infrared Cameras for Monitoring Terrestrial Mammals. Drones 2023, 7 (11). [CrossRef]
- Povlsen, P.; Linder, A. C.; Larsen, H. L.; Durdevic, P.; Arroyo, D. O.; Bruhn, D.; Pertoldi, C.; Pagh, S. Using Drones with Thermal Imaging to Estimate Population Counts of European Hare (Lepus Europaeus) in Denmark. Drones 2023, 7 (1). [CrossRef]
- Fugl, A.; Jensen, L. L.; Korsgaard, A. H.; Pertoldi, C.; Pagh, S. Vegetation Type Preferences in Red Deer (Cervus Elaphus) Determined by Object Detection Models. Drones 2024, 8 (10). [CrossRef]
- Bushaw, J. D.; Ringelman, K. M.; Rohwer, F. C. Applications of Unmanned Aerial Vehicles to Survey Mesocarnivores. Drones 2019, 3 (1). [CrossRef]
- Gonzalez, L. F.; Montes, G. A.; Puig, E.; Johnson, S.; Mengersen, K.; Gaston, K. J. Unmanned Aerial Vehicles (UAVs) and Artificial Intelligence Revolutionizing Wildlife Monitoring and Conservation. Sensors 2016, 16 (1). [CrossRef]
- Corcoran, E.; Winsen, M.; Sudholz, A.; Hamilton, G. Automated Detection of Wildlife Using Drones: Synthesis, Opportunities and Constraints. Methods Ecol Evol 2021, 12 (6), 1103–1114. [CrossRef]
- Perz, R.; Wronowski, K.; Domanski, R.; Dąbrowski, I. Case Study of Detection and Monitoring of Wildlife by UAVs Equipped with RGB Camera and TIR Camera. Aircraft Engineering and Aerospace Technology 2023, 95. [CrossRef]
- Tomaštík, J.; Mokros, M.; Surovy, P.; Grznárová, A.; Merganič, J. UAV RTK/PPK Method - An Optimal Solution for Mapping Inaccessible Forested Areas? Remote Sens (Basel) 2019, 11, 721. [CrossRef]
- Old, J.; Lin, S.; Franklin, M. Mapping out Bare-Nosed Wombat (Vombatus Ursinus) Burrows with the Use of a Drone. BMC Ecol 2019, 19. [CrossRef]
- Torney, C.; Lamont, M.; DeBell, L.; Angohiatok, R.; Leclerc, L.-M.; Berdahl, A. Inferring the Rules of Social Interaction in Migrating Caribou. Philosophical Transactions of the Royal Society B: Biological Sciences 2018, 373, 20170385. [CrossRef]
- Iwamoto, M.; Nogami, S.; Ichinose, T.; Takeda, K. Unmanned Aerial Vehicles as a Useful Tool for Investigating Animal Movements. Methods Ecol Evol 2022, 13 (5), 969–975. [CrossRef]
- World Bank Group. Agricultural land (% of land area). Agricultural land (% of land area) - Denmark.
- Styrelsen for Dataforsyning og infrastruktur. Dataforsyningen. https://dataforsyningen.dk/.
- QGIS. QGIS Geographic Information System. QGIS.org June 2, 2024.
- Wooster, E.; Wallach, A. D.; Ramp, D. The Wily and Courageous Red Fox: Behavioural Analysis of a Mesopredator at Resource Points Shared by an Apex Predator. Animals 2019, 9 (11). [CrossRef]
- Grignolio, S.; Apollonio, M.; Brivio, F.; Vicente, J.; Acevedo, P.; Palencia, P.; Petrovic, K.; Keuling, O. Guidance on Estimation of Abundance and Density Data of Wild Ruminant Population: Methods, Challenges, Possibilities. EFSA Supporting Publications 2020, 17. [CrossRef]
- Caravaggi, A.; Banks, P.; Burton, C.; Finlay, C.; Haswell, P.; Hayward, M.; Rowcliffe, M.; Wood, M. A Review of Camera Trapping for Conservation Behaviour Research. Remote Sens Ecol Conserv 2017, 3. [CrossRef]
- Larsen, H. L.; Pertoldi, C.; Madsen, N.; Randi, E.; Stronen, A. V.; Root-Gutteridge, H.; Pagh, S. Bioacoustic Detection of Wolves: Identifying Subspecies and Individuals by Howls. Animals 2022, 12 (5). [CrossRef]
- Teixeira, D.; Maron, M.; van Rensburg, B. J. Bioacoustic Monitoring of Animal Vocal Behavior for Conservation. Conserv Sci Pract 2019, 1 (8), e72. [CrossRef]
- Brinkløv, S. M. M.; Baagøe, H. J.; Fjederholt, E. T.; Dahl Møller, J.; Johansen, T. W.; Christensen, M.; Elmeros, M. NOVANA-overvågning af flagermus i 2021. Aarhus University, DCE - Danish Centre for Environment and Energy November 2021.
- SADLIER, L. M. J.; WEBBON, C. C.; BAKER, P. J.; HARRIS, S. Methods of Monitoring Red Foxes Vulpes Vulpes and Badgers Meles Meles: Are Field Signs the Answer? Mamm Rev 2004, 34 (1–2), 75–98. [CrossRef]
- Sulkava, R.; Liukko, U.-M. Use of Snow-Tracking Methods to Estimate the Abundance of Otter (Lutra Lutra) in Finland with Evaluation of One-Visit Census for Monitoring Purposes. Ann Zool Fennici 2007, 44, 179–188.
- Kobryn, H.; Swinhoe, E.; Bateman, P.; Adams, P.; Shephard, J.; Fleming, P. Foxes at Your Front Door? Habitat Selection and Home Range Estimation of Suburban Red Foxes (Vulpes Vulpes). Urban Ecosyst 2022, 26. [CrossRef]
- Rosenbaum, B.; Poyarkov, A. D.; Munkhtsog, B.; Munkhtogtokh, О.; Hernandez-Blanco, J. A.; Alexandrov, D. Y.; Chimeddorj, B.; Galtulga, B.; Munkhnast, D.; Bayaraa, M.; Rozhnov, V. V; Comte, S. Seasonal Space Use and Habitat Selection of GPS Collared Snow Leopards (Panthera Uncia) in the Mongolian Altai Range. PLoS ONE 2023, 18 (1), e0280011-.
- Dennis, T.; Shah, S. Assessing Acute Effects of Trapping, Handling, and Tagging on the Behavior of Wildlife Using GPS Telemetry: A Case Study of the Common Brushtail Possum. J Appl Anim Welf Sci 2012, 15, 189–207. [CrossRef]
- Stabach, J.; Cunningham, S.; Connette, G.; Mota, J.; Reed, D.; Byron, M.; Songer, M.; Wacher, T.; Mertes, K.; Brown, J.; Comizzoli, P.; Newby, J.; Monfort, S.; Leimgruber, P. Short-Term Effects of GPS Collars on the Activity, Behavior, and Adrenal Response of Scimitar-Horned Oryx (Oryx Dammah). PLoS ONE 2020, 15, e0221843. [CrossRef]
- Riber, A. Habitat Use and Behaviour of European Hedgehog Erinaceus Europaeus in a Danish Rural Area. Acta Theriologica - ACTA THERIOL 2006, 51, 363–371. [CrossRef]
- Silva-Opps, M.; Opps, S. Use of Telemetry Data to Investigate Home Range and Habitat Selection in Mammalian Carnivores; 2011. [CrossRef]
- Havens, K.; Sharp, E. Thermal Imaging Techniques to Survey and Monitor Animals in the Wild: A Methodology; 2016.
- Néill, L.; Veldhuizen, T.; Jongh, A.; Rochford, J. Ranging Behaviour and Socio-Biology of Eurasian Otters (Lutra Lutra) on Lowland Mesotrophic River Systems. Eur J Wildl Res 2009, 55, 363–370. [CrossRef]
- Jensen, B. Nordens Pattedyr; Gad: København, 1993.
- Pagh, S.; Tjørnløv, R. S.; Illemann, J.; Søren, T.; Chriél, M. Habitatrelateret føde hos ræv (Vulpes vulpes) i land¬brugsområder. Flora og Fauna 2015, 121, 1–12.
- Elmeros, M.; Mikkelsen, D.; Nørgaard, L.; Pertoldi, C.; Jensen, T.; Chriél, M. The Diet of Feral Raccoon Dog (Nyctereutes Procyonoides) and Native Badger (Meles Meles) and Red Fox (Vulpes Vulpes) in Denmark. Mamm Res 2018, 63. [CrossRef]
- Roper, T. J. Badger, 1st ed.; Roper, T. J., Ed.; Collins: London, 2010.
- Márton, M.; Markolt, F.; Szabo, L.; Kozák, L.; Lanszki, J.; László, P.; Heltai, M. Den Site Selection of the European Badger, Meles Meles and the Red Fox, Vulpes Vulpes in Hungary. Folia Zoologica -Praha- 2016, 65. [CrossRef]
- Kruuk, H. Otters: Ecology, Behaviour and Conservation. Otters: Ecology, behaviour and conservation 2010, 1–280. [CrossRef]
- Taastrøm, H. -M; Jacobsen, L. The Diet of Otters (Lutra Lutra L.) in Danish Freshwater Habitats: Comparisons of Prey Fish Populations. J Zool 2006, 248, 1–13. [CrossRef]
- Mori, E.; Bagnato, S.; Serroni, P.; Sangiuliano, A.; Rotondaro, F.; Marchianò, V.; Cascini, V.; Poerio, L.; Ferretti, F. Spatiotemporal Mechanisms of Coexistence in an European Mammal Community in a Protected Area of Southern Italy. J Zool 2020, 310 (3), 232–245. [CrossRef]
- Linnell, J.; Strand, O. Interference Interactions, Co-Existence and Conservation of Mammalian Carnivores. Diversity and Distributions - DIVERS DISTRIB 2000, 6, 169–176. [CrossRef]
- Vilella, M.; Ferrandiz-Rovira, M.; Sayol, F. Coexistence of Predators in Time: Effects of Season and Prey Availability on Species Activity within a Mediterranean Carnivore Guild. Ecol Evol 2020, 10. [CrossRef]
- Zamansky, A.; Sinitca, A.; Linden, D.; Kaplun, D. Automatic Animal Behavior Analysis: Opportunities for Combining Knowledge Representation with Machine Learning. Procedia Comput Sci 2021, 186, 661–668. [CrossRef]
- Kleanthous, N.; Hussain, A.; Khan, W.; Sneddon, J.; Al-Shamma’a, A.; Liatsis, P. A Survey of Machine Learning Approaches in Animal Behaviour. Neurocomputing 2022. [CrossRef]
Figure 1.
Thermal images from video recordings of the observed species: A) Two Eurasian otters carrying a trout recorded at 110 meters agl 16x digital zoom, and a 60-degree angle. B) A European badger at 89 meters height with 8x digital zoom, and a 64-degree angle. C) A badger observed in a forest. After a few minuts observtion the badger disapears into its den. The video was recorded at an altitude of 88 meters, using an 16x digital zoom and a camera angle of 84 degrees. D) A fox actively hunting in a meadow. Mice can be observed as small, illuminated objects around the fox pointed out by arrows. The video was recorded at 67 meters agl, using an 8x digital zoom and a camera angle of 54 degrees.
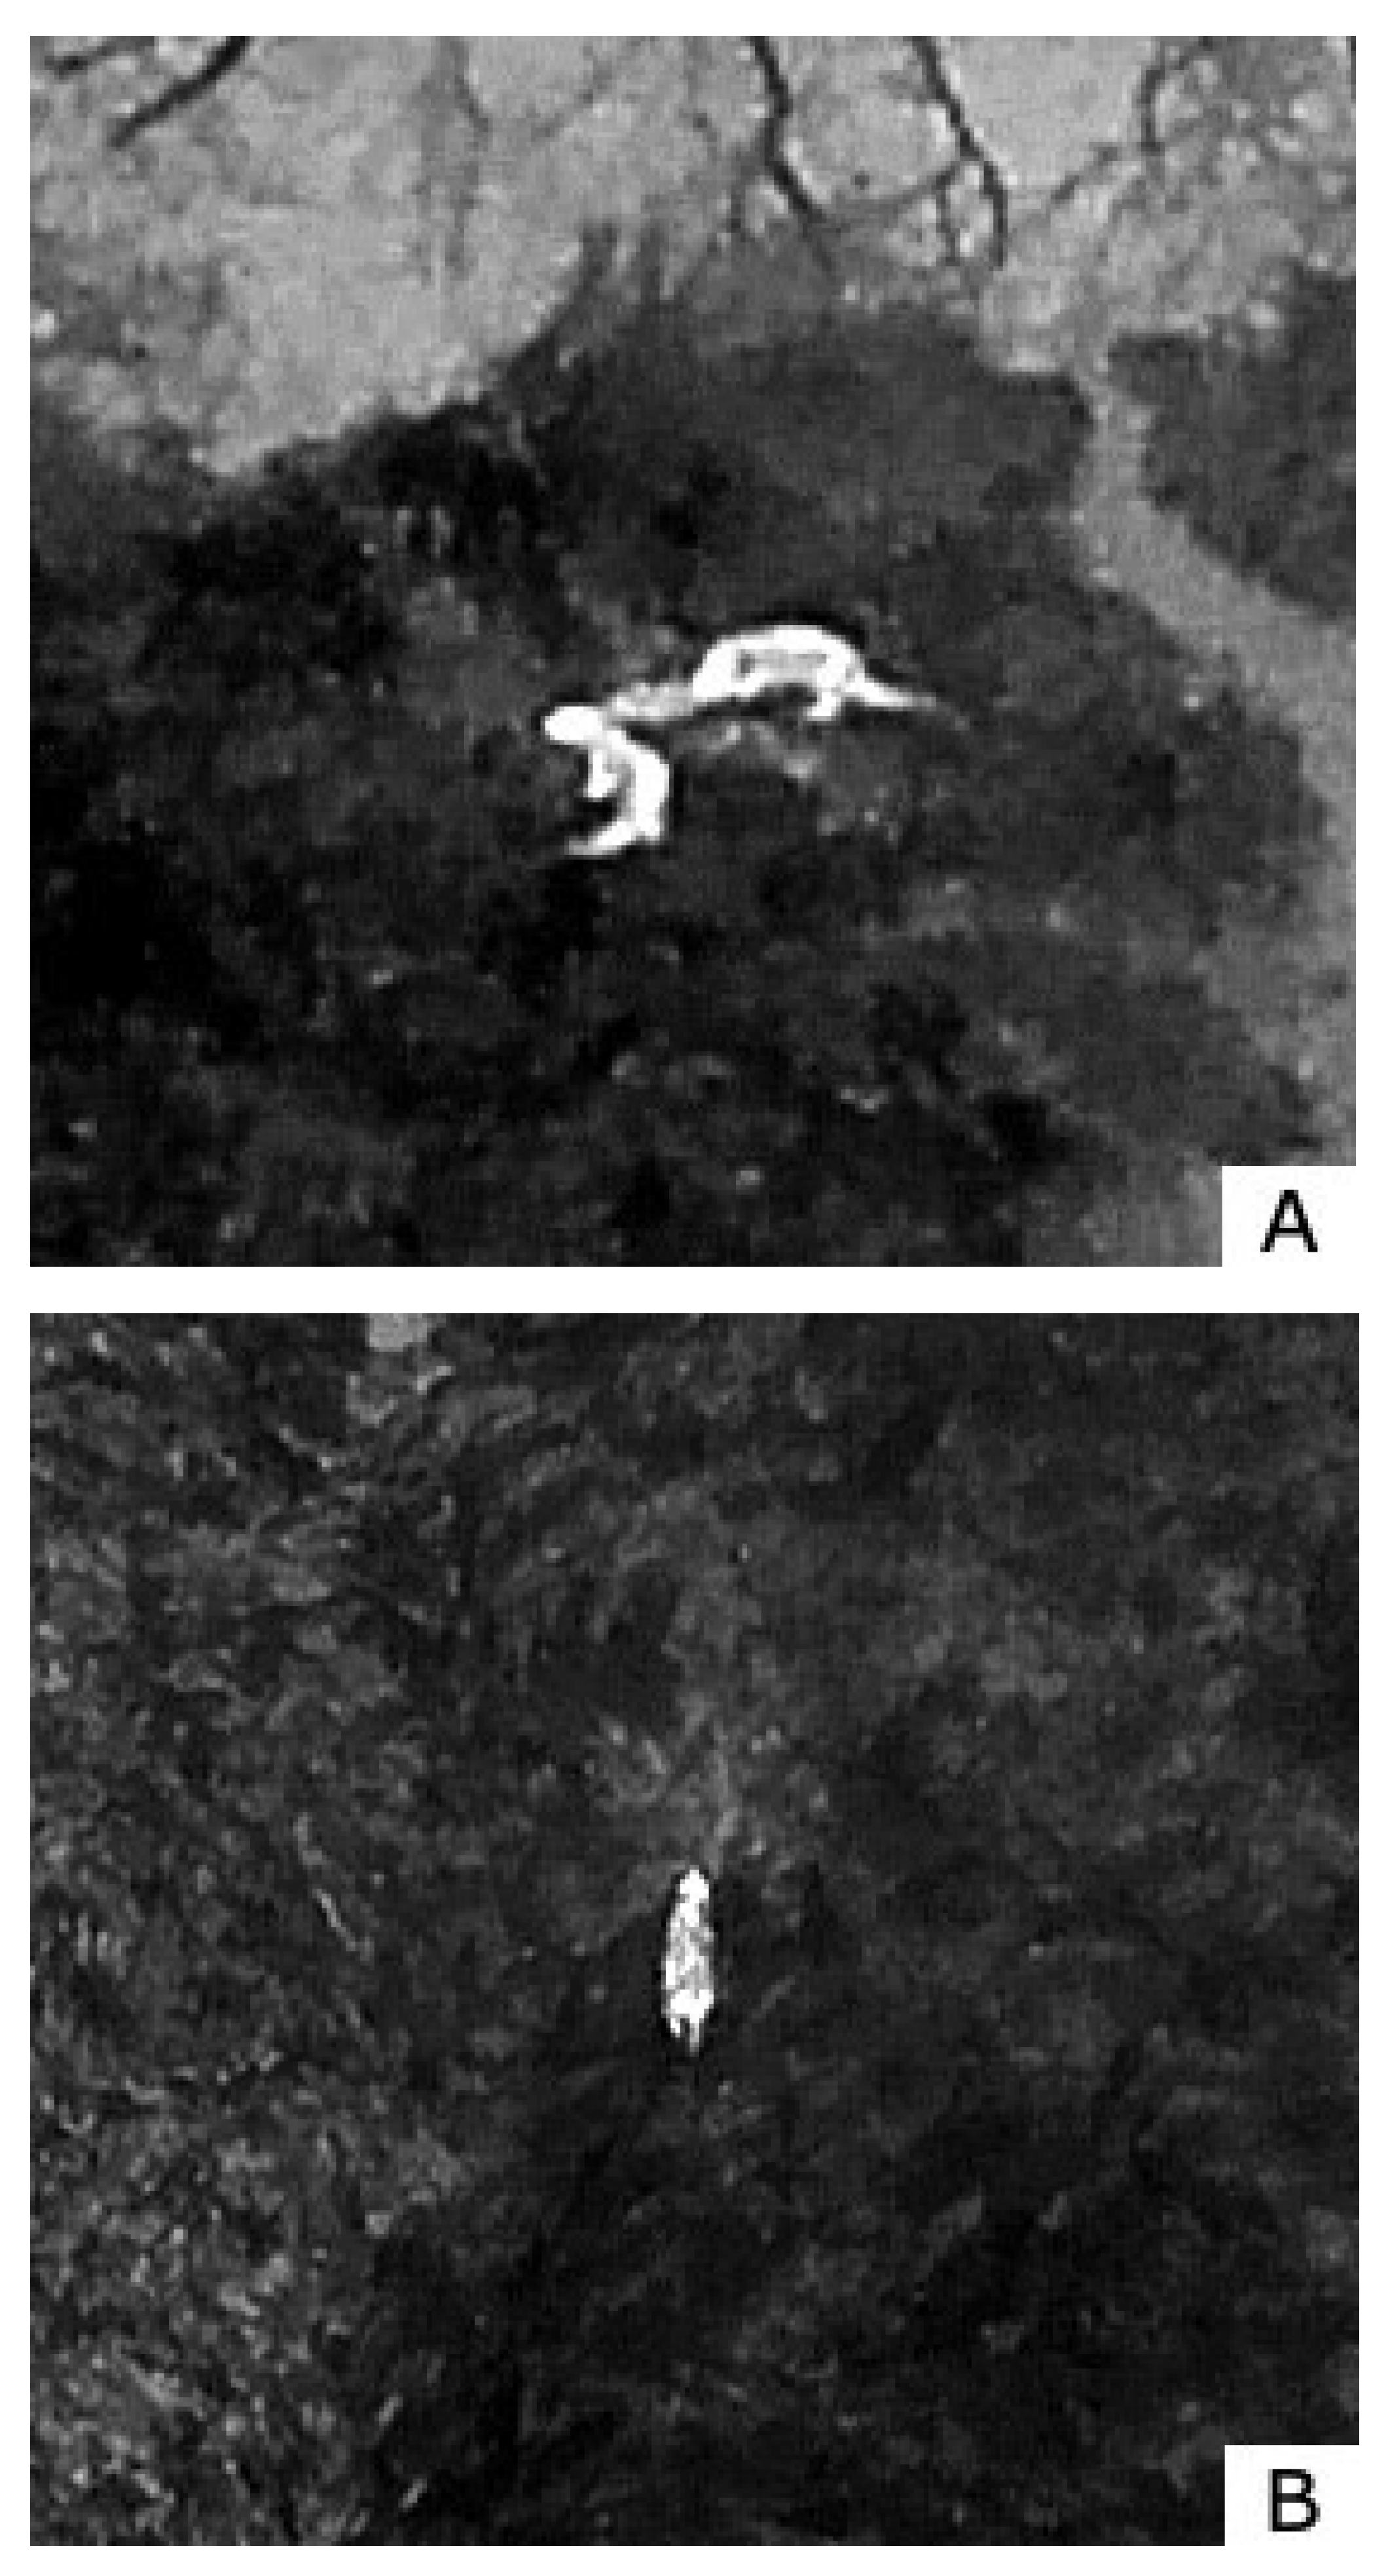
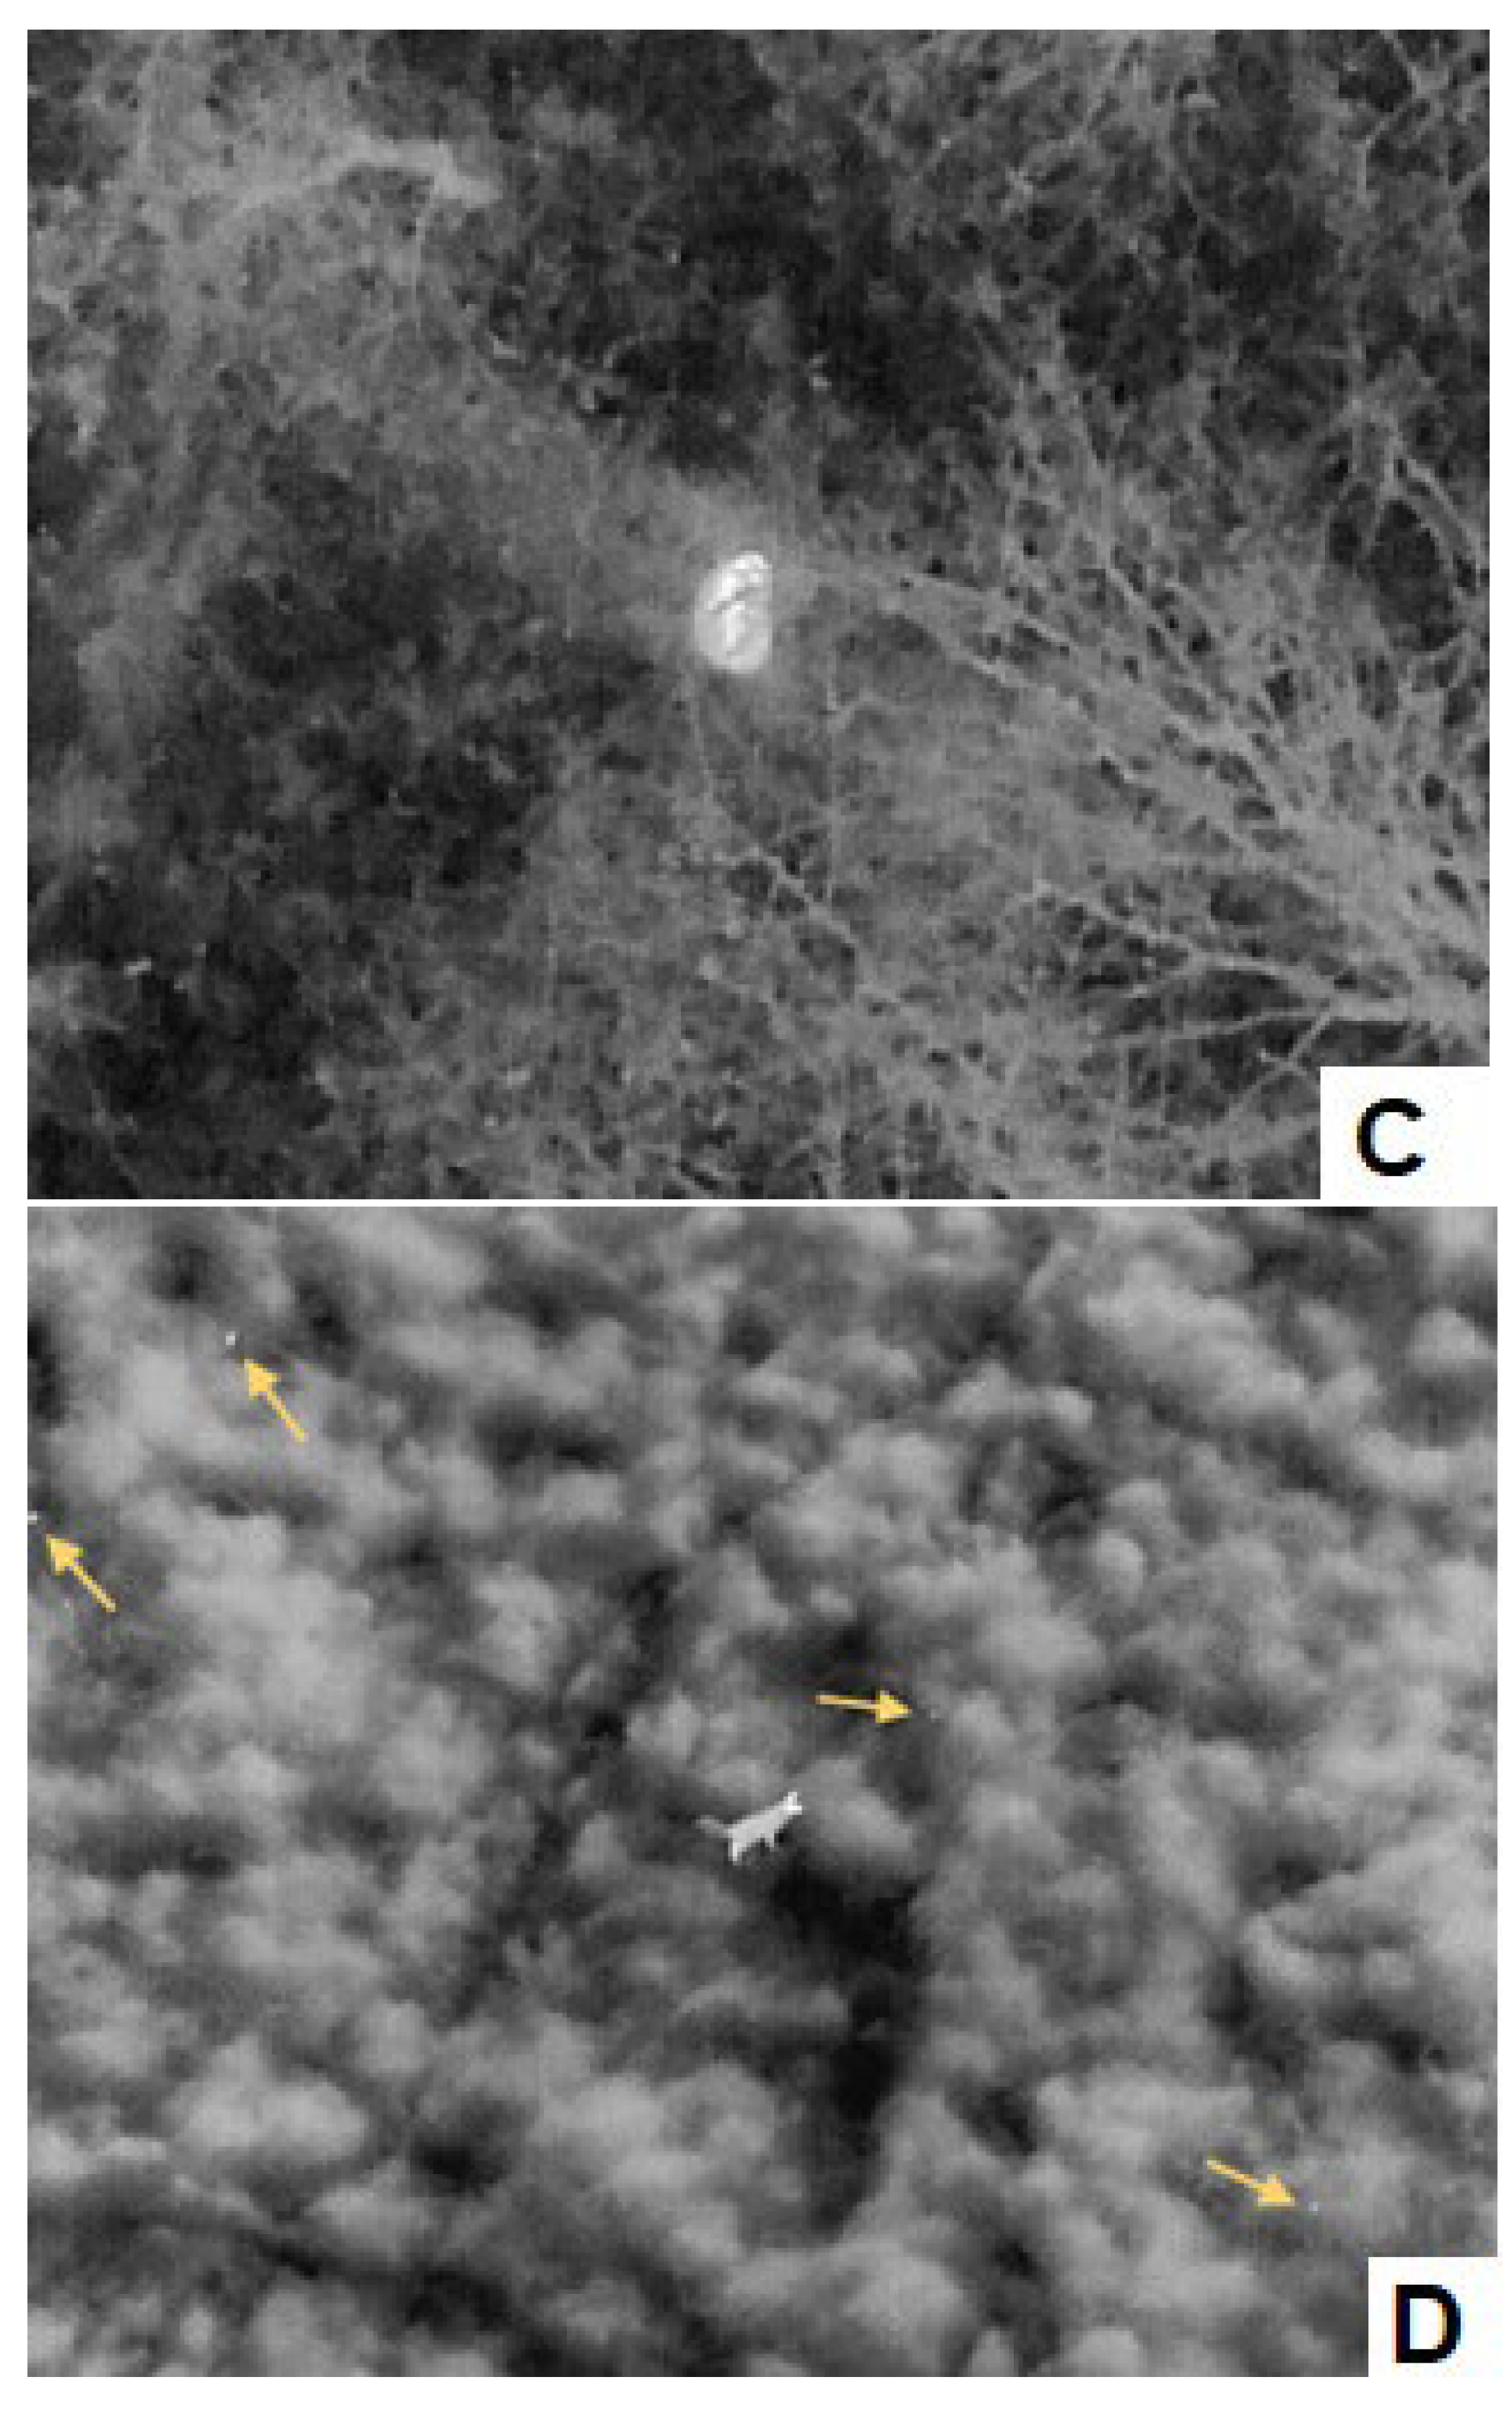
Figure 3.
Movement of foxes (orange lines), badgers (pink line) and otter (light blue line) in the three study areas A (location 1), B (location 2), C (location 3). Habitat types, vegetation types, landscape elements are illustrated with colour legends.
Figure 3.
Movement of foxes (orange lines), badgers (pink line) and otter (light blue line) in the three study areas A (location 1), B (location 2), C (location 3). Habitat types, vegetation types, landscape elements are illustrated with colour legends.
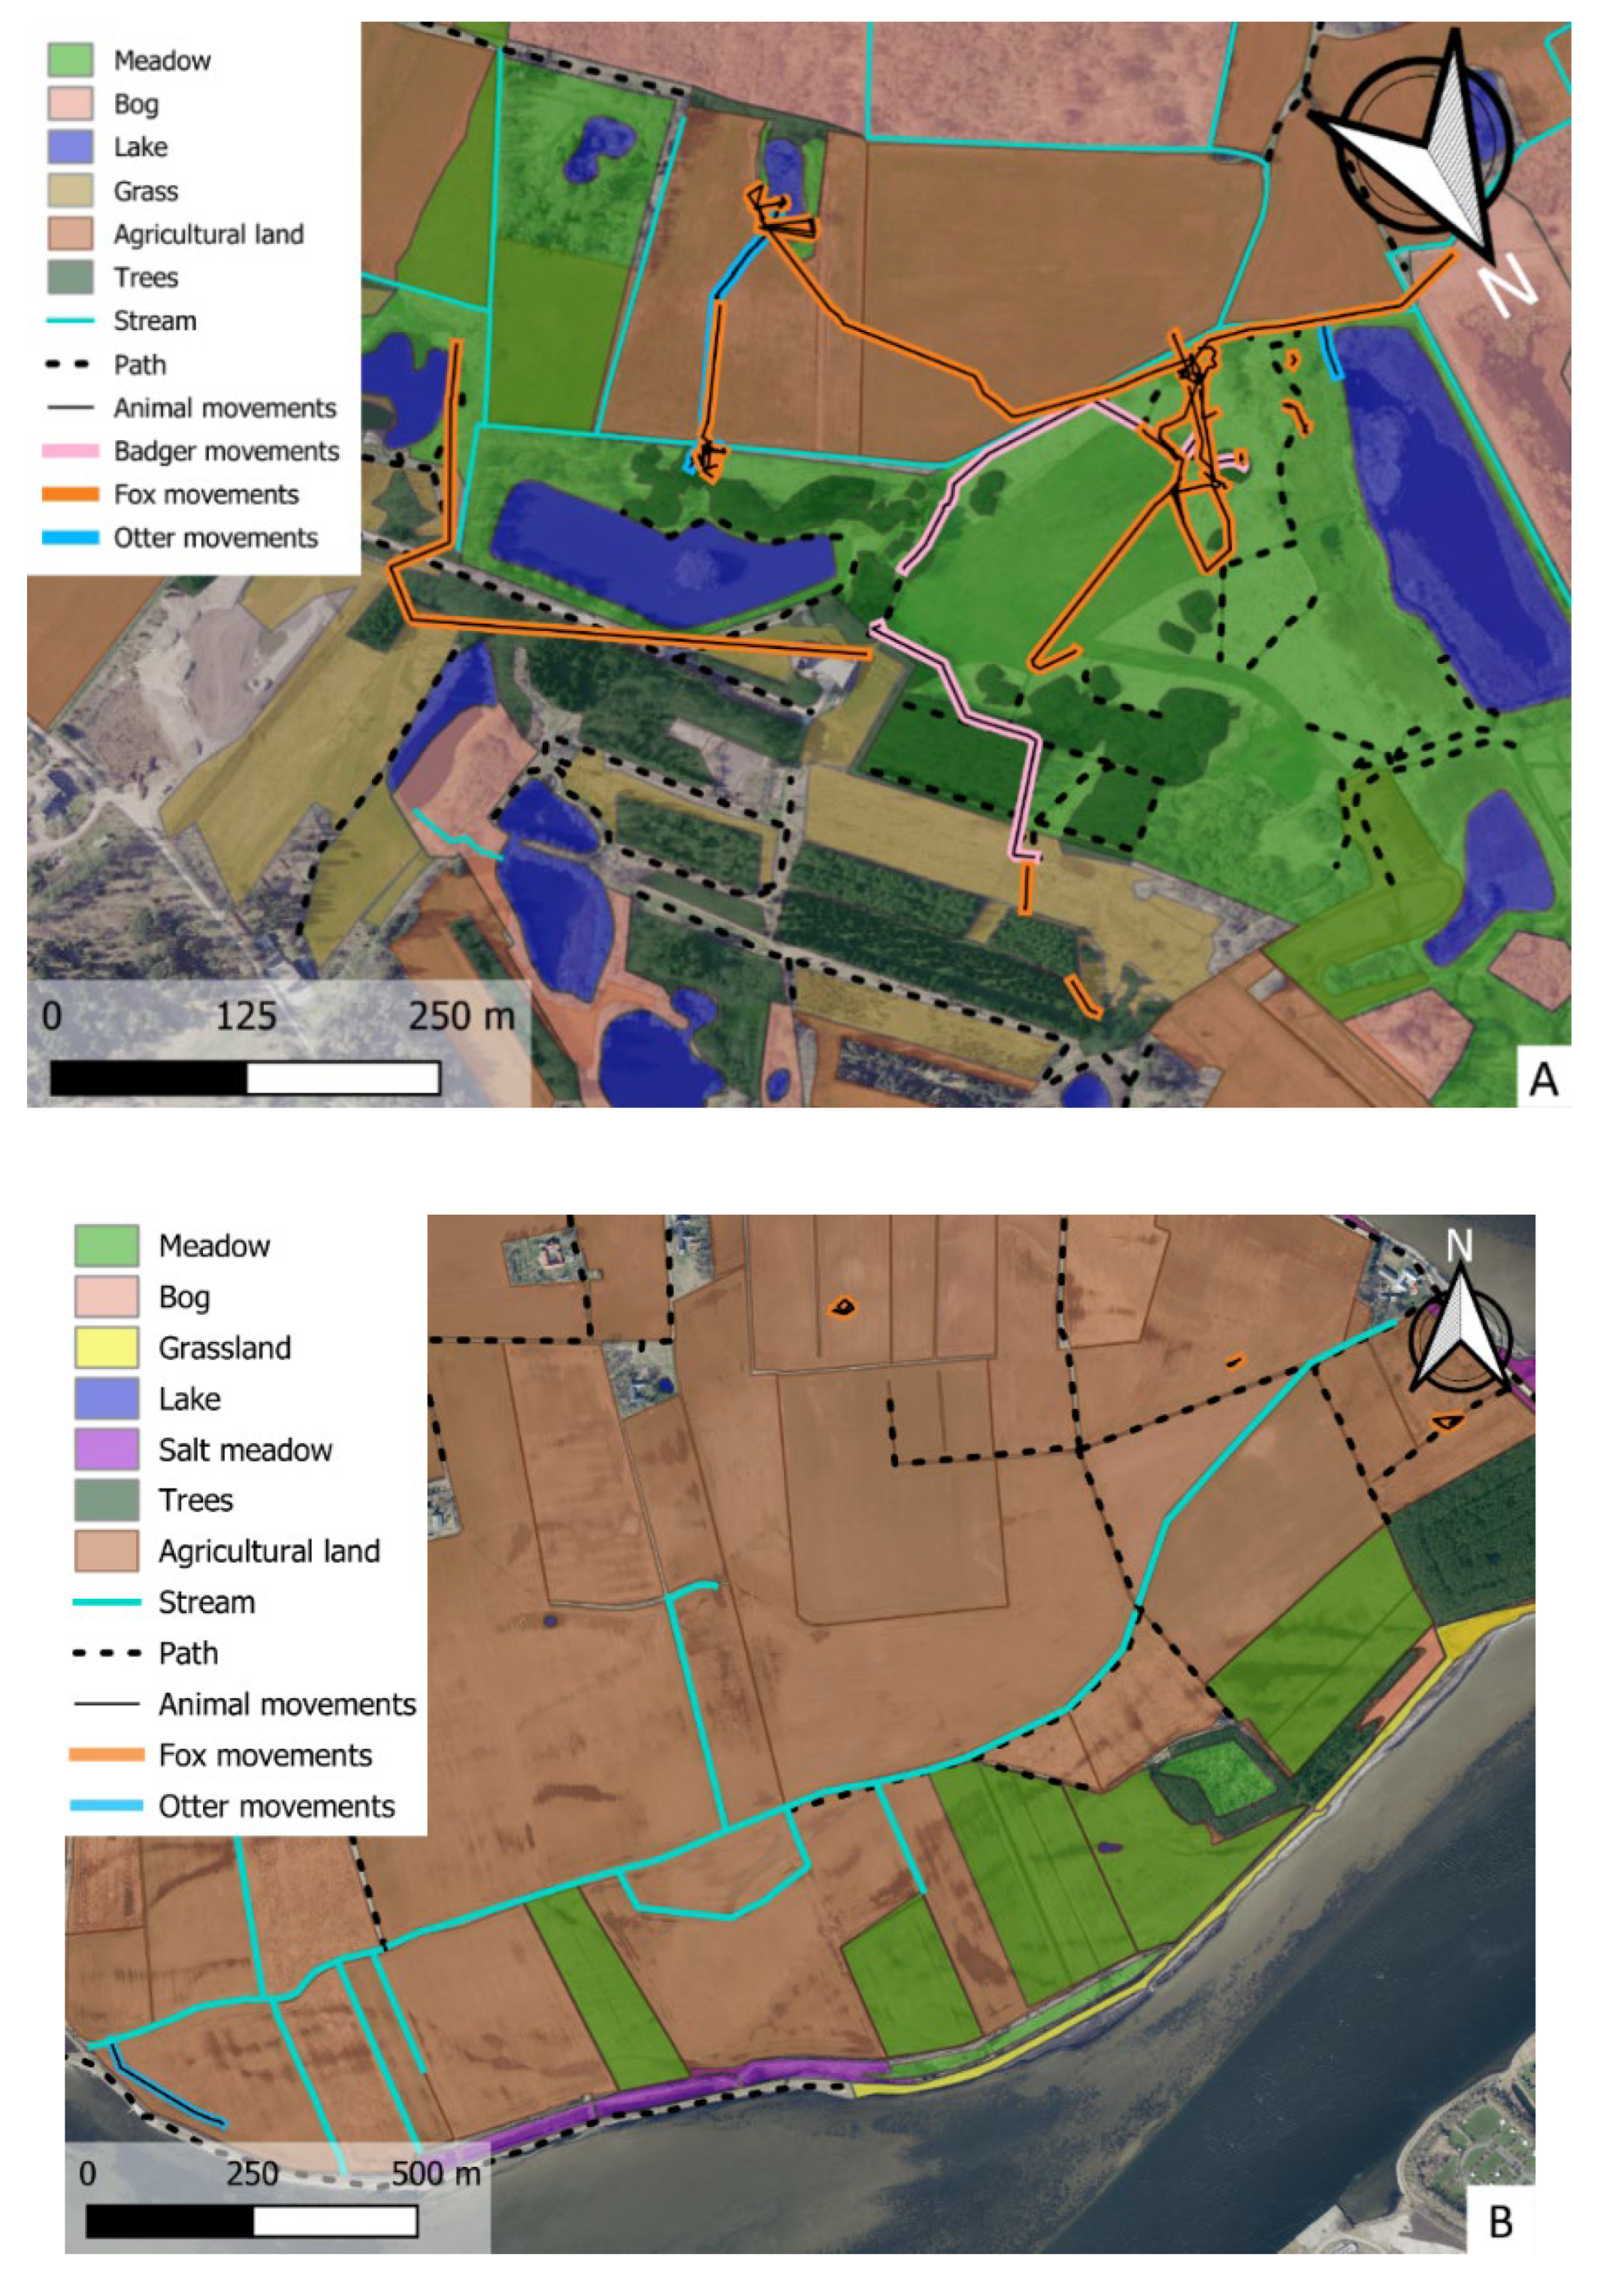
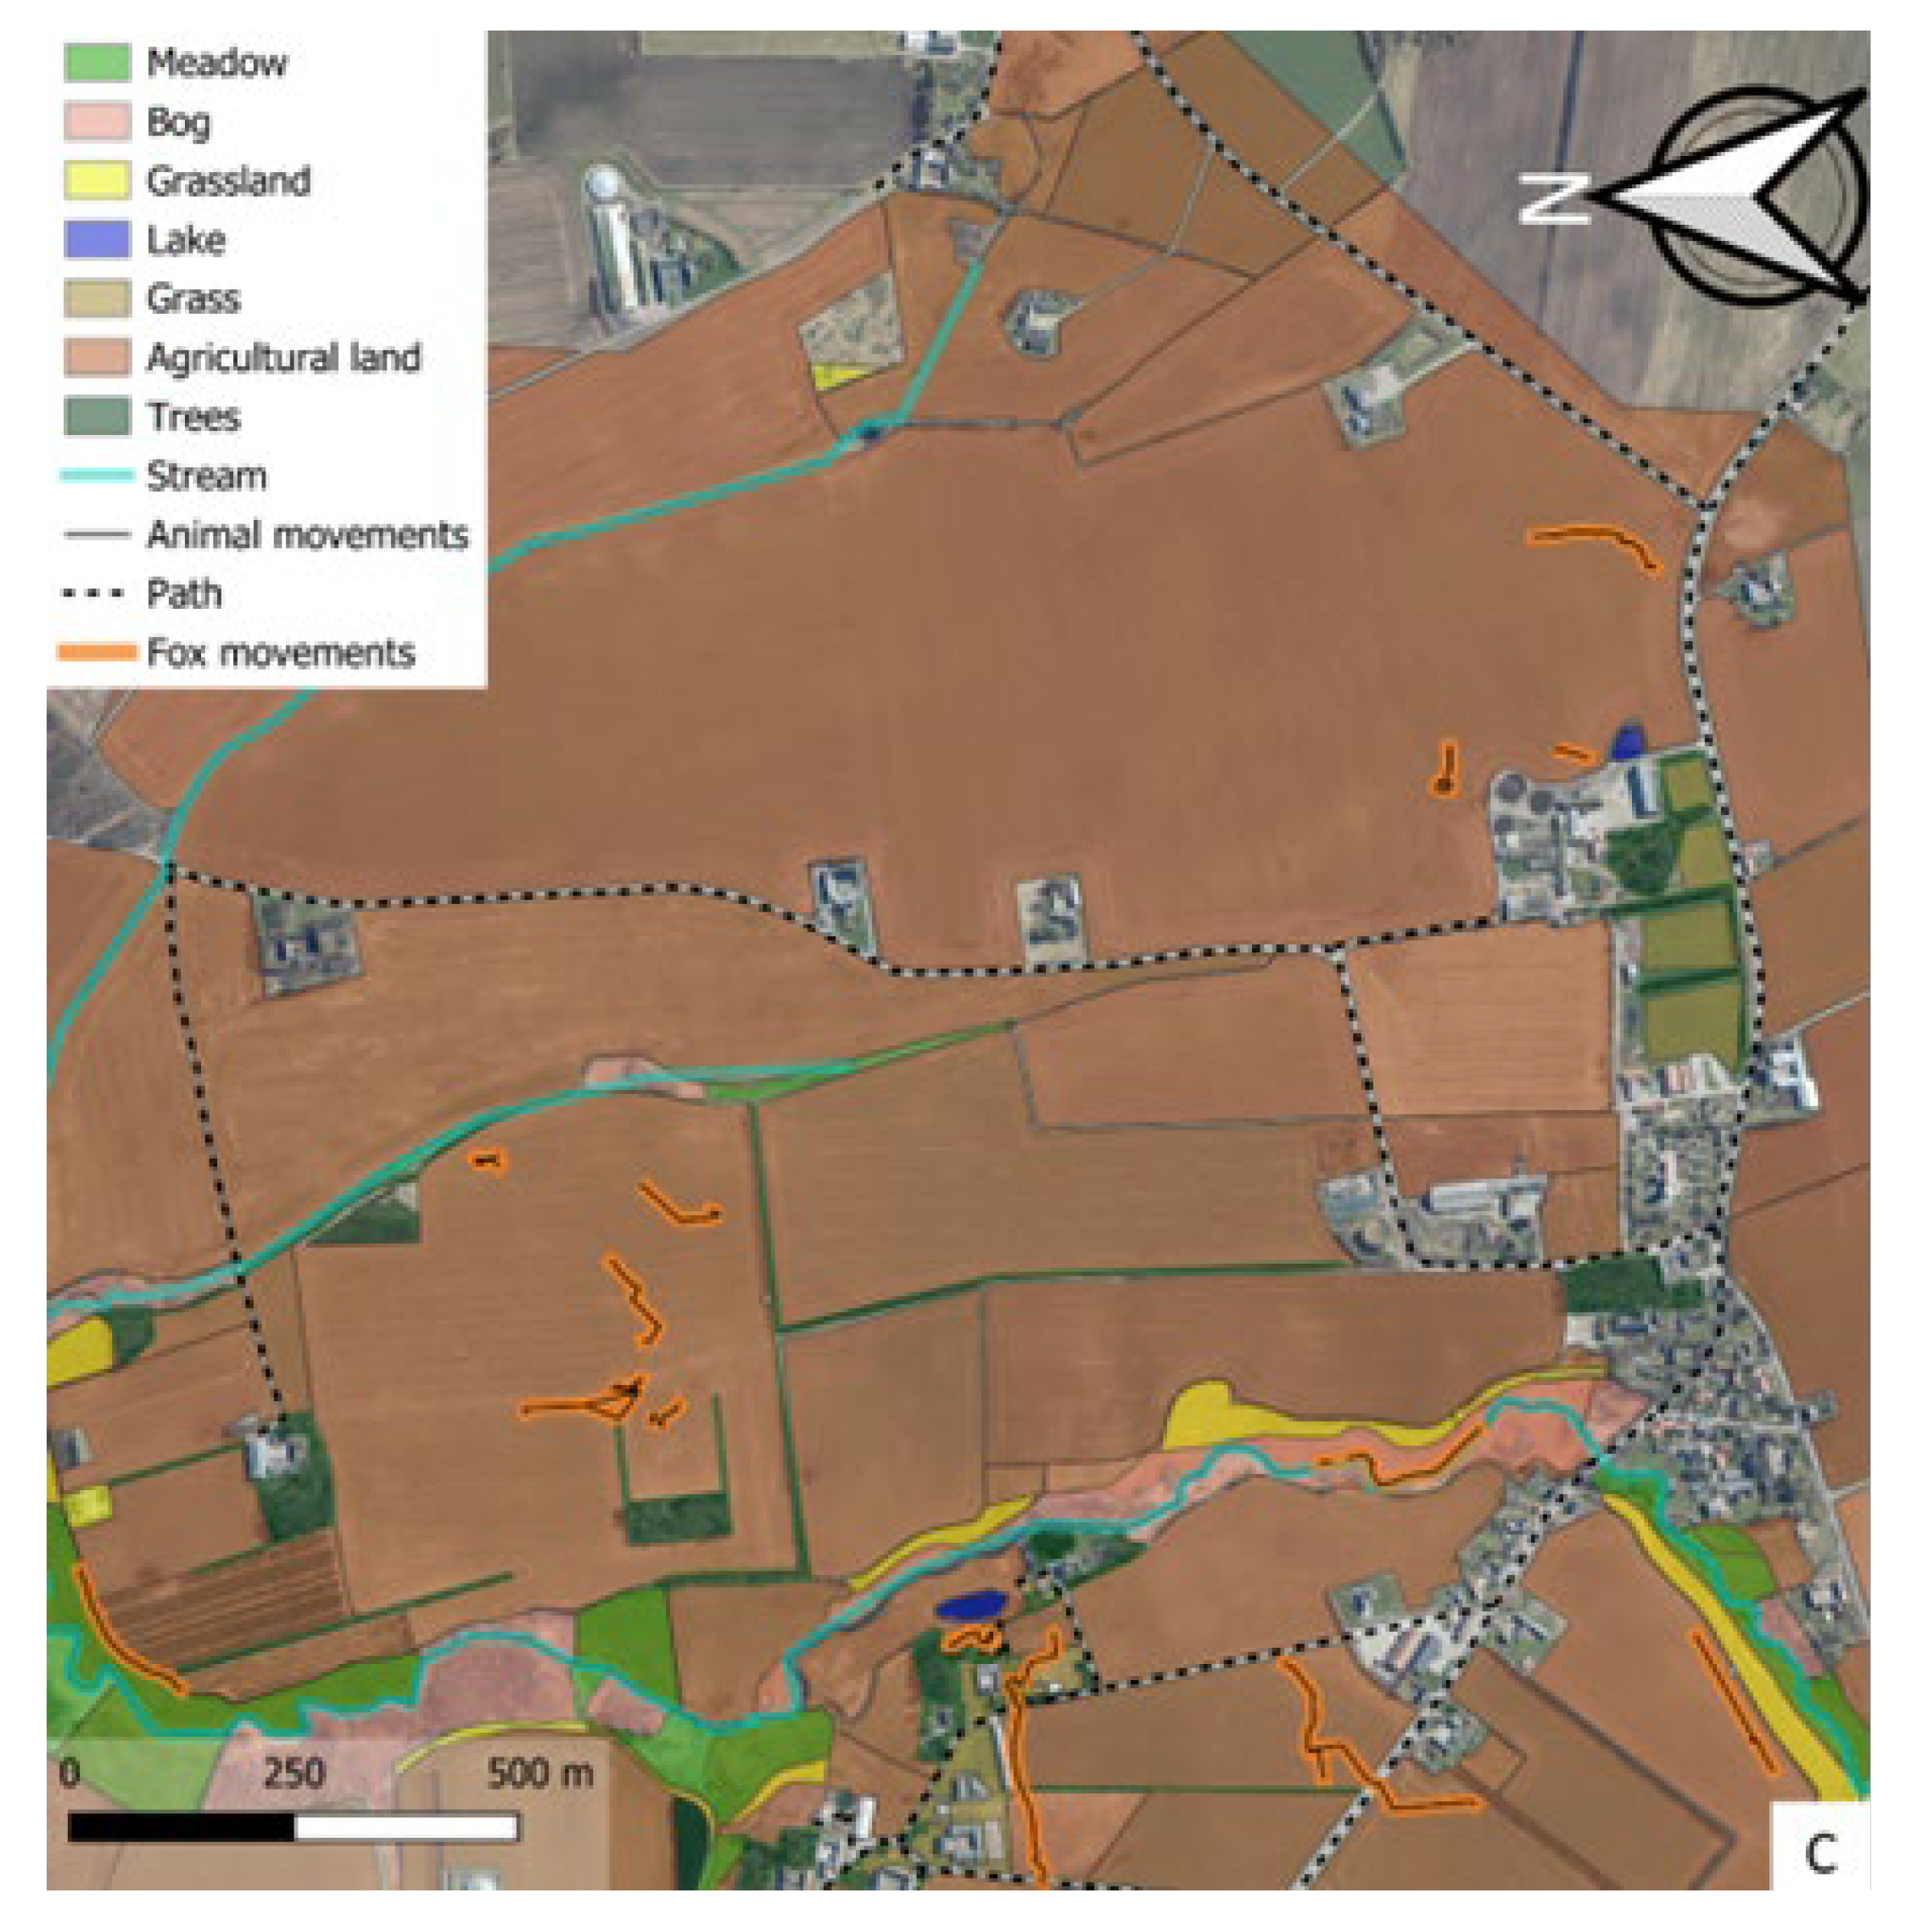
Figure 4.
Barcharts of behaviours exhibited by the three meso-carnivore; A: fox, B: otter, C: badger in different habitat types. The y-axis represents the percentage of behaviour occurrences, while the x-axis shows the different habitat types in which these behaviours were observed.
Figure 4.
Barcharts of behaviours exhibited by the three meso-carnivore; A: fox, B: otter, C: badger in different habitat types. The y-axis represents the percentage of behaviour occurrences, while the x-axis shows the different habitat types in which these behaviours were observed.
Disclaimer/Publisher’s Note: The statements, opinions and data contained in all publications are solely those of the individual author(s) and contributor(s) and not of MDPI and/or the editor(s). MDPI and/or the editor(s) disclaim responsibility for any injury to people or property resulting from any ideas, methods, instructions or products referred to in the content. |
© 2025 by the authors. Licensee MDPI, Basel, Switzerland. This article is an open access article distributed under the terms and conditions of the Creative Commons Attribution (CC BY) license (http://creativecommons.org/licenses/by/4.0/).
Copyright: This open access article is published under a Creative Commons CC BY 4.0 license, which permit the free download, distribution, and reuse, provided that the author and preprint are cited in any reuse.


